first project - project planning · create wbs ... using the simple example and to start spider...
TRANSCRIPT
SPIDER Project
First Project
Project Planning
Instructions for novice users

SPIDER Management Technologies Romania www. spiderproject.ro 2
Copyright © 2007 S.C. Spider Management Technologies Romania
Terms and conditions By simply accessing the copyrighted materials within this website you fully agree and implicitly consent the present terms and conditions of use. All materials made available to the public are copyrighted materials. It is allowed, without right holder permission, any use of the materials, as long as it does not procure to the user direct or indirect, any commercial, economic or image advantage, when the source and the author are mentioned and /or any use that enters the scope and circumstances of legal limits and exceptions and fulfils the three-step-test of the Berne Convention. All materials have educational/informational purpose and any use, in any situations or/and circumstances, that may generate any kind of loses to the user cannot engage the rights holder legal responsibility or the responsibility of the administrator or owner of the website.

SPIDER Management Technologies Romania www. spiderproject.ro 3
Content INTRODUCTION............................................................................................................................................................................................ 4
PART 1. DETERMINISTIC PLANNING ............................................................................................................................................................ 4
Step 0. Create new project ........................................................................................................................................................................ 4
Step 1. Create WBS.................................................................................................................................................................................... 5
Step 2. Create Activities ............................................................................................................................................................................ 6
Step 3. Create Network Diagram............................................................................................................................................................... 7
Step 4. Create Resources .......................................................................................................................................................................... 9
Step 5. Define Multi-resources .................................................................................................................................................................. 9
Step 6. Define Resources Skills.................................................................................................................................................................10
Step 7. Define activity properties .............................................................................................................................................................10
Step 8. Assign Resources..........................................................................................................................................................................12
Step 9. Create Calendars .........................................................................................................................................................................13
Step 10. Calculate project schedule .........................................................................................................................................................14
Step 11. Analyze project schedule ...........................................................................................................................................................16
Step 12. Define Cost and calculate Project Budget ...................................................................................................................................17
Step 13. Assign Responsibilities ...............................................................................................................................................................19
Step 14. Prepare Linear Diagram Metric ..................................................................................................................................................20
Step 15. Create Linear Diagram View ......................................................................................................................................................22
Step 16. Create Project Reference-Books.................................................................................................................................................24

SPIDER Management Technologies Romania www. spiderproject.ro 4
INTRODUCTION Spider Project is a complex professional software that helps its users to create project models that simulate any real life situations. As the result Spider Project includes so many options and menu items that some new users may be frightened by program complexity. Actually the software is not hard to learn, and many functions that are necessary for some users will not be used by the others. Rare projects need all Spider Project simulation capabilities. In this section we will try to help our novice users to understand program logic using the simple example and to start Spider Project usage ASAP. We will describe the process of creating first project computer model step-by-step. The project that will be created is included in the Spider Project installation. It is called Software Purchase and its goal is to find the software that is best fit to the organization needs. We recommend to do all actions described below – it will help to remember the necessary steps.
PART 1. DETERMINISTIC PLANNING
Step 0. Create new project In the main menu choose File/Create Project/New. In the appeared dialog box enter project name (Software Purchase) and project code. Decide if you want to see hours and minutes in the date fields. You can also define project start date (Data date) and target finish date. Target finish date may be used if you will decide to calculate project schedule backward. This way you will obtain the information about the latest dates when project activities shall be performed if you need to finish this project on the specified date. All these settings can be changed later.
Project Name
Project Code
SPIDER Management Technologies Romania www. spiderproject.ro 5
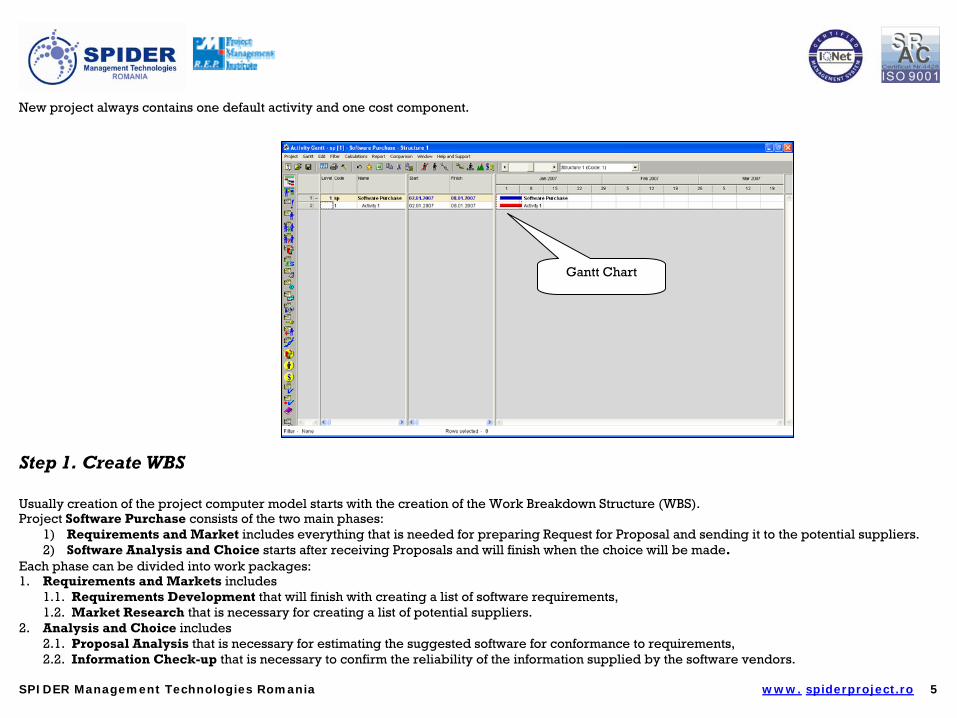
New project always contains one default activity and one cost component.
Step 1. Create WBS Usually creation of the project computer model starts with the creation of the Work Breakdown Structure (WBS). Project Software Purchase consists of the two main phases:
1) Requirements and Market includes everything that is needed for preparing Request for Proposal and sending it to the potential suppliers. 2) Software Analysis and Choice starts after receiving Proposals and will finish when the choice will be made.
Each phase can be divided into work packages: 1. Requirements and Markets includes
1.1. Requirements Development that will finish with creating a list of software requirements, 1.2. Market Research that is necessary for creating a list of potential suppliers.
2. Analysis and Choice includes 2.1. Proposal Analysis that is necessary for estimating the suggested software for conformance to requirements, 2.2. Information Check-up that is necessary to confirm the reliability of the information supplied by the software vendors.
Gantt Chart

SPIDER Management Technologies Romania www. spiderproject.ro 6
2.3. Negotiations and Choice that includes negotiations with the potential suppliers and the choice of the best solution. There are two ways for creating WBS in Spider Project: 1) In the Activity Gantt Chart move cursor to the project bar or the grey cell with the number of the line (#1 for the project) and press right mouse button. In the pop-up menu choose New Phase/One Level Lower. Now you can enter phase code and name (in our case Requirements and Market) in the corresponding cells. To create the next phase of the same level move the cursor to the line with the previous phase of the same hierarchical level, press right mouse button on the grey number cell and choose New Phase/The Same Level. Tip: If you want to do something with Spider Project object (activity, resource, assignment, etc.) use right mouse button on the corresponding line number or graphical presentation (Gantt Chart bar, Network Diagram box, etc.). You will be able to choose the necessary action in the pop-up menu. 2) To try the other way for creating WBS return to the main window (click on the Main Window Icon - looks like blue three column table) and choose WBS Chart in the Diagrams section in the middle section of the main screen. In this window you will see the hierarchy that you have already created. New phases may be added in this View. You can also switch to the Tree presentation. To do this choose Diagram/Options/Tree. Creating new phase is similar – move mouse cursor to the phase box, press right mouse button, choose New Phase/One Level Lower (or the Same Level). To enter the phase name double click on the phase box.
Step 2. Create Activities To add activities to any phase move the cursor to the phase line number, press right mouse button and choose New Activity. If you want to create an activity at any place in the Gantt Chart do the same at the line that will become previous to the new activity line. You can also use Ins key if you prefer to use keyboard.
WBS in the Gantt Chart
WBS Hierarchy

SPIDER Management Technologies Romania www. spiderproject.ro 7
Other options: you can create new activities in the Activity Table or in the Network Diagram. New activities created this way will belong to the project and not to any phase. You may move them to corresponding phases later. To move an activity from one place to another, use Cut and Paste. Try it with the default activity one: move cursor to the line number, press right mouse button, choose Cut, move cursor to the first subphase line number, right click, choose Paste/One level lower. Create other activities that are present at the project Software Purchase.
Step 3. Create Network Diagram You can link activities in the Gantt Chart or in the Network Diagram Views. Move cursor to the activity bar (box) and check if the cursor shape became like spider. Press left mouse button and move “spider cursor” to the succeeding activity bar (box). Free mouse button – the link is created. Default link type is finish to start. To change link properties repeat the process of defining the link and you will see the dialog box. In this box you can define new link (any number of links between two activities) or change the properties of the existing link. In our project all links are finish to start. All links are of No Earlier Than type except the strong link between Software Market Analysis and Vendor List. It means that Vendor List shall be created immediately after Software Market Analysis, succeeding activity can be postponed only together with preceding. You can revise project links in the Links Table in the Activity Section of the main window.
Activity List

SPIDER Management Technologies Romania www. spiderproject.ro 8
Network Diagram
Network Diagram organized based on WBS
Links Table

SPIDER Management Technologies Romania www. spiderproject.ro 9
Step 4. Create Resources It can be done in the Resource Table at the section Resources of the main window. In our project we will use Project Manager, IT Analyzer, and Business Analyzer. New resource can be created if you click right mouse button in the table, or use Ins key. You shall define the total number of resource units for every resource you define. The default number is 1. Assign Resource Types that will be used for links of resource and assignment parameters with the corporate databases (reference-books).
Step 5. Define Multi-resources Multi-resource is a predefined resource crew. In our project some activities will be performed by the whole team that includes Project Manager, Business Analyzer and IT Analyzer. There is also an activity that requires both Business Analyzer and IT Analyzer. So we shall create multi-resources Team (includes Project Manager, Business Analyzer, IT Analyzer) and BAIT (that includes both Business Analyzer and IT Analyzer). To create multi-resource open Multi-resource table (in the Resource section of the Main Window middle column). Press Ins or use right mouse button and choose New. Enter the name of multi-resource BAIT. In the multi-resource Properties window select Participants and add Business Analyzer and IT Analyzer. Do the same creating multi-resource Team. You can change resource set or quantities in the multi-resource at any time and selecting Update content you will change resources in all assignments of this multi-resource.
Create Resources
Define Multi-Resources
Multi-Resource Participants

SPIDER Management Technologies Romania www. spiderproject.ro 10
Step 6. Define Resources Skills In our project some activities may be performed by IT Analyzer or Business Analyzer – both resources have necessary skill. We will define this skill as skill BIT. In the Resource section of the Main Window middle column choose Resource Skills. In the table press Ins or use right mouse button. Enter the name of the skill BIT and add participants in the Properties window the same way as for Multi-resources. Resources are chosen from the Skill set basing on necessary quantity or necessary total productivity. In our project we will choose one resource of two – skill type is quantity.
Step 7. Define activity properties Activity Properties window appears after double click on activity line number (or bar in the Gantt chart). You shall define activity duration or volume of work to be done. For some activities the duration is an initial information, for others – it is calculated and initial information includes activity volume and assigned resource productivities. You shall define activity type – duration (duration is initial, volumes are ignored in the schedule calculation), productivity (duration is calculated basing on activity volume and assigned resources total productivity, initial duration is ignored), hammock (activity duration depends on the interval between events in the project schedule) or milestone (zero duration activity that usually defines some project event).
Define Resource Skills
Resource Skill Participants
SPIDER Management Technologies Romania www. spiderproject.ro 11
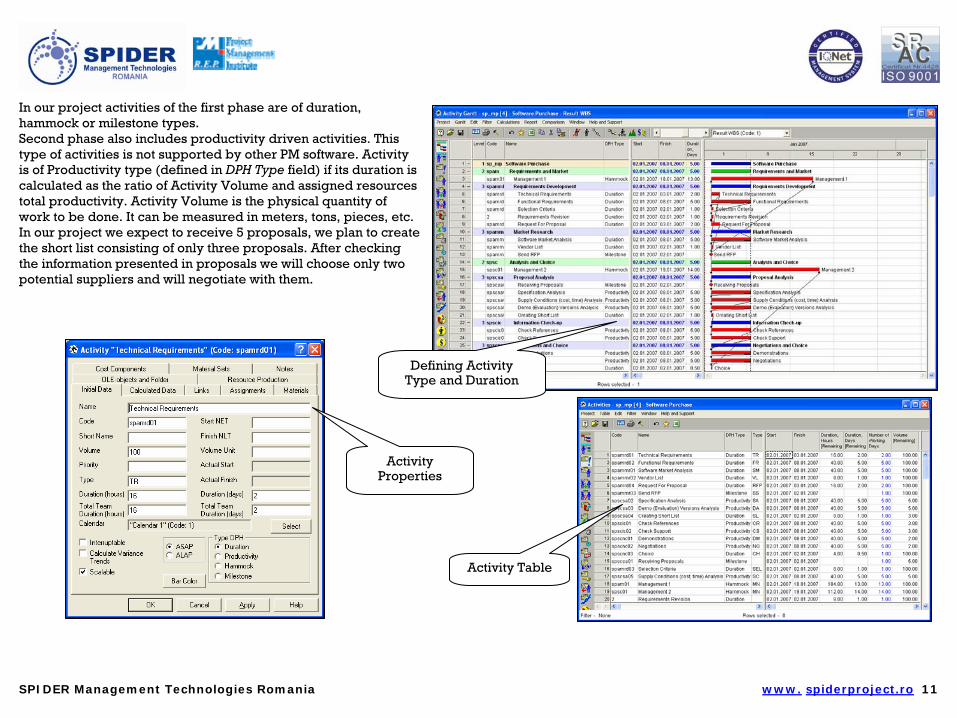
In our project activities of the first phase are of duration, hammock or milestone types. Second phase also includes productivity driven activities. This type of activities is not supported by other PM software. Activity is of Productivity type (defined in DPH Type field) if its duration is calculated as the ratio of Activity Volume and assigned resources total productivity. Activity Volume is the physical quantity of work to be done. It can be measured in meters, tons, pieces, etc. In our project we expect to receive 5 proposals, we plan to create the short list consisting of only three proposals. After checking the information presented in proposals we will choose only two potential suppliers and will negotiate with them.
Defining Activity Type and Duration
Activity Table
Activity Properties
SPIDER Management Technologies Romania www. spiderproject.ro 12
Other options: you can enter activity parameters in the columns of the Gantt Chart or Activity Table. To show necessary columns at the desired place move cursor to the column header, press right mouse button and choose what columns to show in the list. Created configuration will be saved when you will save the project.
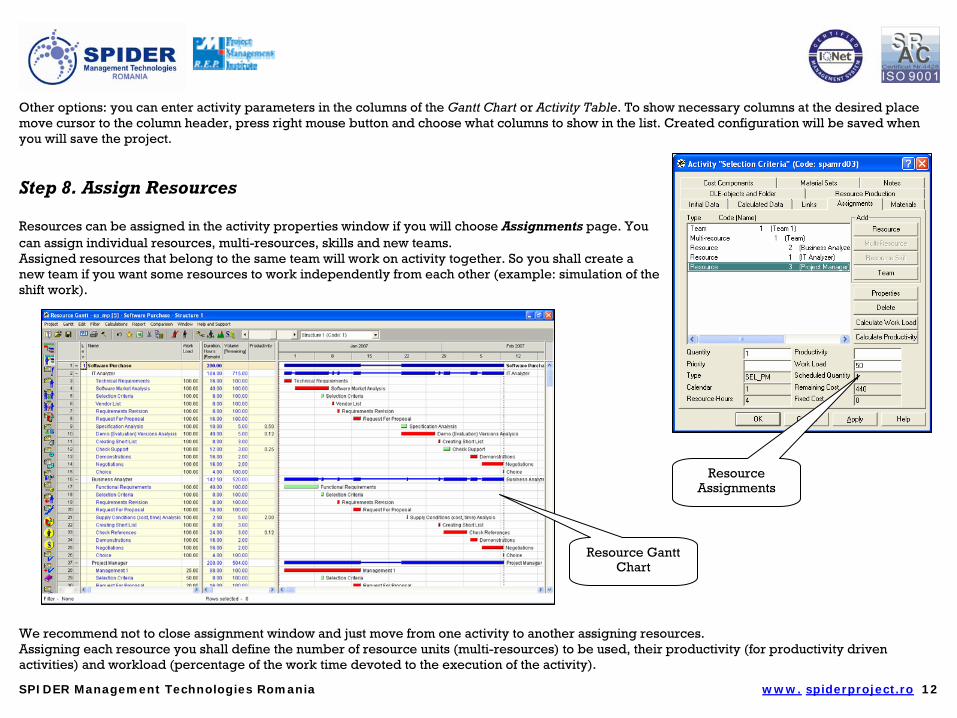
Step 8. Assign Resources Resources can be assigned in the activity properties window if you will choose Assignments page. You can assign individual resources, multi-resources, skills and new teams. Assigned resources that belong to the same team will work on activity together. So you shall create a new team if you want some resources to work independently from each other (example: simulation of the shift work).
We recommend not to close assignment window and just move from one activity to another assigning resources. Assigning each resource you shall define the number of resource units (multi-resources) to be used, their productivity (for productivity driven activities) and workload (percentage of the work time devoted to the execution of the activity).
Resource Assignments
Resource Gantt Chart

SPIDER Management Technologies Romania www. spiderproject.ro 13
Another option: in the Gantt Chart select several activities that will be performed by the same resources and assign resources (multi-resources) to all of them using the same procedure.
Step 9. Create Calendars You can specify work week, define calendar exceptions, and create as many calendars as necessary and to assign these calendars to activities, resources and dependency lags. In our project we will use the default calendar (5-days work week, 8 hours per work day) and another calendar with 1 hour work day that will be used for one milestone activity. We add one calendar exception as an example. Let’s define January 1 as non-working day. Open Calendar Exceptions table in the Calendar section of the Main Window.
Press Ins or use right mouse button to create new calendar exception. Enter its name, start, finish and the week calendar that will be used in this period. In our case it is blank week where all days are non-working. Select Receiving Proposals and allocate the calendar 2.
Define Calendar Exception
Define Calendars
Define Weeks

SPIDER Management Technologies Romania www. spiderproject.ro 14
Step 10. Calculate project schedule The schedule that does not take into considerations resource restrictions is calculated if you will click on Scheduling icon in the Tool bar, press F9 or choose Scheduling in the Calculations menu. In the scheduling dialog you can choose different scheduling options and decide if you want to receive schedule report or see the scheduling options dialog next time. The schedule calculated using Critical Path Method will show the minimal schedule duration but resource overload conflicts will not be solved. Critical activities (with zero reserves) will be shown in red.
You shall choose Resource constrained scheduling or press Ctrl F9 if you want to receive feasible schedule that allows for resource limitations .
Scheduling Options Window
Schedule without taking into account the resource
constraints
SPIDER Management Technologies Romania www. spiderproject.ro 15
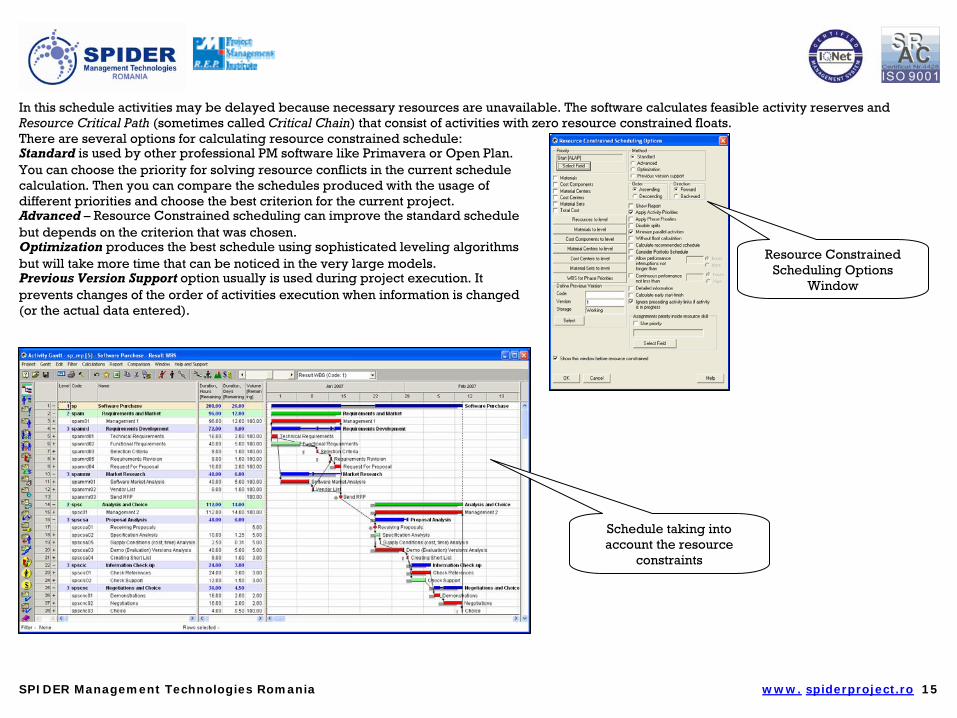
In this schedule activities may be delayed because necessary resources are unavailable. The software calculates feasible activity reserves and Resource Critical Path (sometimes called Critical Chain) that consist of activities with zero resource constrained floats. There are several options for calculating resource constrained schedule: Standard is used by other professional PM software like Primavera or Open Plan. You can choose the priority for solving resource conflicts in the current schedule calculation. Then you can compare the schedules produced with the usage of different priorities and choose the best criterion for the current project. Advanced – Resource Constrained scheduling can improve the standard schedule but depends on the criterion that was chosen. Optimization produces the best schedule using sophisticated leveling algorithms but will take more time that can be noticed in the very large models. Previous Version Support option usually is used during project execution. It prevents changes of the order of activities execution when information is changed (or the actual data entered).
Resource Constrained Scheduling Options
Window
Schedule taking into account the resource
constraints

SPIDER Management Technologies Romania www. spiderproject.ro 16
Resource workload at any moment in time including peak workloads are calculated if to press Ctrl F8 or choose Calculate resource peak workload icon or corresponding item in the Calculations menu.
Step 11. Analyze project schedule Project scheduling results can be seen in the Gantt Chart, Resource Gantt Chart, in the Linear Diagram (entering necessary information for Linear Diagram presentation will be described further in the special section), scheduled dates may be also seen in the Network diagram, different table and diagram reports will show all necessary information.
Resource Gantt Chart after Resource Leveling
Resource Histograms before
leveling
SPIDER Management Technologies Romania www. spiderproject.ro 17
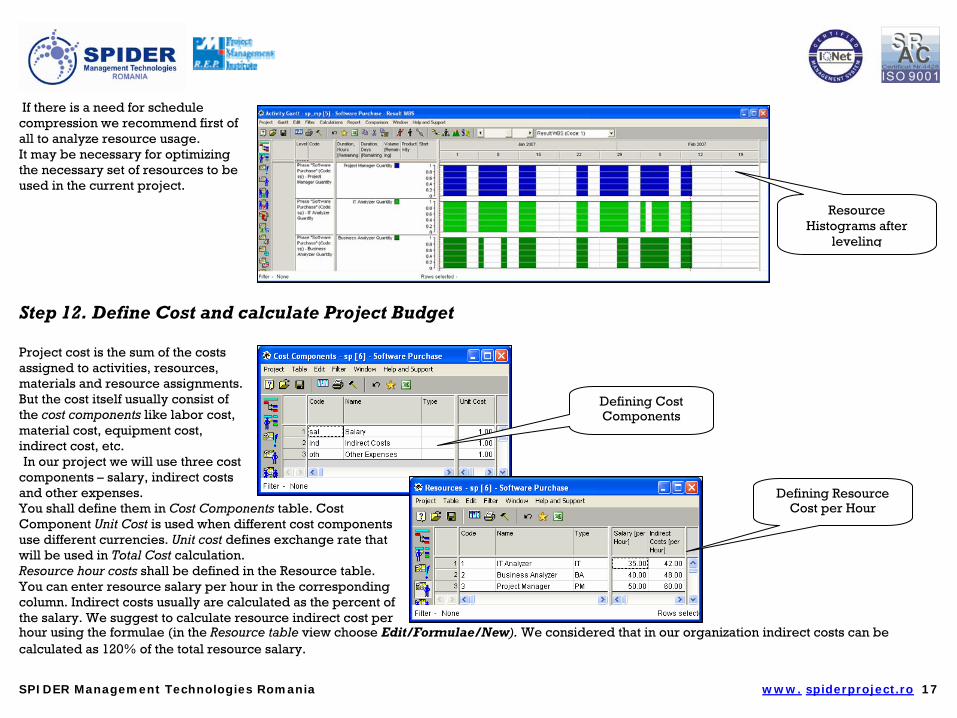
If there is a need for schedule compression we recommend first of all to analyze resource usage. It may be necessary for optimizing the necessary set of resources to be used in the current project.
Step 12. Define Cost and calculate Project Budget Project cost is the sum of the costs assigned to activities, resources, materials and resource assignments. But the cost itself usually consist of the cost components like labor cost, material cost, equipment cost, indirect cost, etc. In our project we will use three cost components – salary, indirect costs and other expenses. You shall define them in Cost Components table. Cost Component Unit Cost is used when different cost components use different currencies. Unit cost defines exchange rate that will be used in Total Cost calculation. Resource hour costs shall be defined in the Resource table. You can enter resource salary per hour in the corresponding column. Indirect costs usually are calculated as the percent of the salary. We suggest to calculate resource indirect cost per hour using the formulae (in the Resource table view choose Edit/Formulae/New). We considered that in our organization indirect costs can be calculated as 120% of the total resource salary.
Resource Histograms after
leveling
Defining Cost Components
Defining Resource Cost per Hour

SPIDER Management Technologies Romania www. spiderproject.ro 18
Other expenses will be necessary when checking references (potential travel expenses we estimated as 300 cost units per vendor) and organizing negotiations (10 cost units per hour of negotiations – cost of coffee, water, etc.). These costs shall be entered in the activity Properties window. Choose Cost Components/Add, in the list of cost components choose the required components and enter activity cost as Fixed, Hour or Volume Unit Cost. You can also define the profile of cost consumption (not in the first project).
Defining Formulae for Cost Component Calculation
Project Budget
Defining Other Expenses

SPIDER Management Technologies Romania www. spiderproject.ro 19
After entering activity, resource and assignment costs press F8 or choose Cost and Material Calculation in the Activity Gantt Chart. Spider Project will calculate project budget. S-curve may be seen in the diagram under Gantt Chart if to choose General Reports and Diagrams/Diagram and to select Total Cost, Cumulative and time periods (we selected by hours).
Step 13. Assign Responsibilities It can be done by creating Responsibility Work Breakdown Structure. In the Gantt Chart menu choose Project/WBS/New. Now you can create new WBS where activities will be organized by responsibilities. Create phases Project Manager, Business Analyzer, and IT Analyzer, select all activities for which Project Manager is responsible (press and hold Ctrl and select activities by left mouse button), then open pop-up menu by right mouse button on any selected activity, choose Cut, move mouse cursor to Project Manager phase line number, press right mouse button and select Paste/One level lower. Do the same with Business Analyzer and IT Analyzer activities. Then you can create subphases the same way.
Total Cost Cumulative Diagram
Cost and Material Options Window

SPIDER Management Technologies Romania www. spiderproject.ro 20
Another way for creating additional WBS – to create WBS by codes. The same structure can be created using codes in any user-defined fields.
Step 14. Prepare Linear Diagram Metric Linear Diagram presents project schedule as the chart that shows when activities of different types will be performed at the different positions in the project metrics. Project metric is shown on X-axis [Metric] (in horizontal direction) of Linear Diagram and time is shown on Axis Y [Time] (in vertical direction). Linear Diagram contains of two parts:
− Diagram that shows decency of activities execution dates from their location in the project metric (top part of diagram); and − Location of different activities types in the project metric (bottom part).
WBS Library
Responsibility WBS
SPIDER Management Technologies Romania www. spiderproject.ro 21
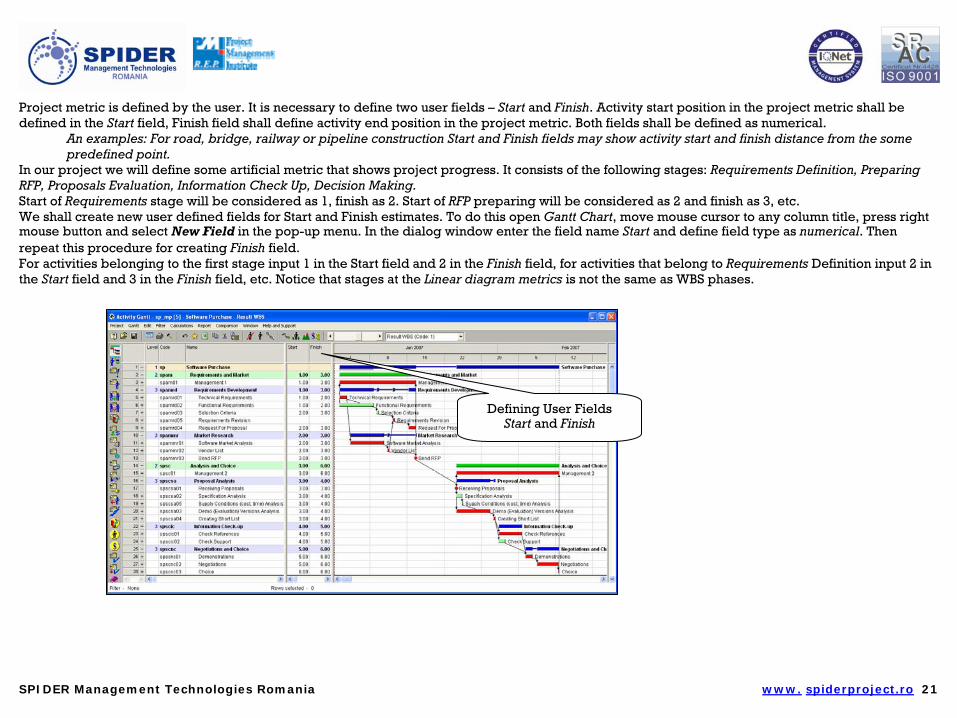
Project metric is defined by the user. It is necessary to define two user fields – Start and Finish. Activity start position in the project metric shall be defined in the Start field, Finish field shall define activity end position in the project metric. Both fields shall be defined as numerical.
An examples: For road, bridge, railway or pipeline construction Start and Finish fields may show activity start and finish distance from the some predefined point.
In our project we will define some artificial metric that shows project progress. It consists of the following stages: Requirements Definition, Preparing RFP, Proposals Evaluation, Information Check Up, Decision Making. Start of Requirements stage will be considered as 1, finish as 2. Start of RFP preparing will be considered as 2 and finish as 3, etc. We shall create new user defined fields for Start and Finish estimates. To do this open Gantt Chart, move mouse cursor to any column title, press right mouse button and select New Field in the pop-up menu. In the dialog window enter the field name Start and define field type as numerical. Then repeat this procedure for creating Finish field. For activities belonging to the first stage input 1 in the Start field and 2 in the Finish field, for activities that belong to Requirements Definition input 2 in the Start field and 3 in the Finish field, etc. Notice that stages at the Linear diagram metrics is not the same as WBS phases.
Defining User Fields Start and Finish

SPIDER Management Technologies Romania www. spiderproject.ro 22
Decide which activity and phase types will be shown in the Linear diagram. Activity properties include the standard field Type that is used for defining those parameters in the Reference-books that are common for all activities of the same type (like material requirements per volume unit, unit cost, etc.). You can decide if to show these types in Linear Diagram or to create additional special types. For special types you shall create new user field. Activities of the same types will be shown in the Linear Diagram as the lines of the same color and shape. In our sample project we will use the standard activity Type field.
Step 15. Create Linear Diagram View Open Linear Diagram View double-clicking on Linear Diagram icon. You will see Linear Diagram Options dialog window. If Linear diagram was already set then this window can be evoked by choosing Diagram/Options in the Linear Diagram menu. Select the field that will be used as activity and phase Type for the Linear Diagram (in our sample project it is standard Type field). You can enter type names manually or create special Reference-book (Spider Document) that consists of two fields with the codes Type and TypeName. The last approach is preferable. Type field will be the taken from the project, TypeName field shall contain type names that will be shown in the bottom part of the diagram. Creation of this Reference-book from the project activitiy table is described in the section Create Reference-books. Select Activity types that will be shown in the diagram from the list at the right part of the window (Not shown list) and move them to the Shown list using >> button. If you want to show phase types select Phase Types in the upper right corner of the Options dialog window. Any activity or phase field can be used as the Type field. By default, it is standard Type field. If you want to use any other field select it from a drop-down list in Field Used as Type field To import type names from the Reference-book with matching Type and TypeName fields, click Names from Reference-book and select the reference-book to be used. Select line type and line color to represent highlighted activity or phase type in Linear Diagram by selecting desired line type directly in Linear Diagram Options dialog window and desired color in the evoked Color dialog window. Select dates and metric interval for Linear Diagram. If Whole Project option is selected, dates and metric interval will be set up automatically.
Linear Diagram Options Window

SPIDER Management Technologies Romania www. spiderproject.ro 23
Now you can define what will be shown in the Linear Diagram Metric (horizontal) scale. Select Axis X (Metric) Setup. In the appeared dialog box you can choose the name for the metric and what text will be shown in the diagram instead of the numbers. To do this select New in the Axis X Setup window, enter the number and the text that will be shown instead of this number. The number and corresponding text shall be entered in the fields at the bottom of the window. Time per second field is intended for setting up diagram’s animation speed. Animation starts with click on the Animate icon on Linear Diagram toolbar. Animation draws the diagram according to the project schedule and shows project execution in time. If you press left mouse button and draw a rectangle in the diagram window, the selected area will be enlarged to the size of the window to allow viewing any project part in detail. To come back to the original diagram view, click Default Scale icon in the toolbar. You can insert text or picture in bmp format at any place in the Linear Diagram. To do this move cursor to the desired place and press right mouse button. Select Insert Text and type it if you want some text to appear in the chosen place. In our project we inserted Waiting for proposals to explain the pause in the work schedule. For inserting some picture select Insert Picture and choose the picture to insert. Remember that the picture shall be saved in bmp format. To delete text or picture move cursor to upper right corner of inserted object, press right mouse button and select Delete Object in the pop-up menu.
Axis X Setup
Linear Diagram
Activities and Phases location
SPIDER Management Technologies Romania www. spiderproject.ro 24
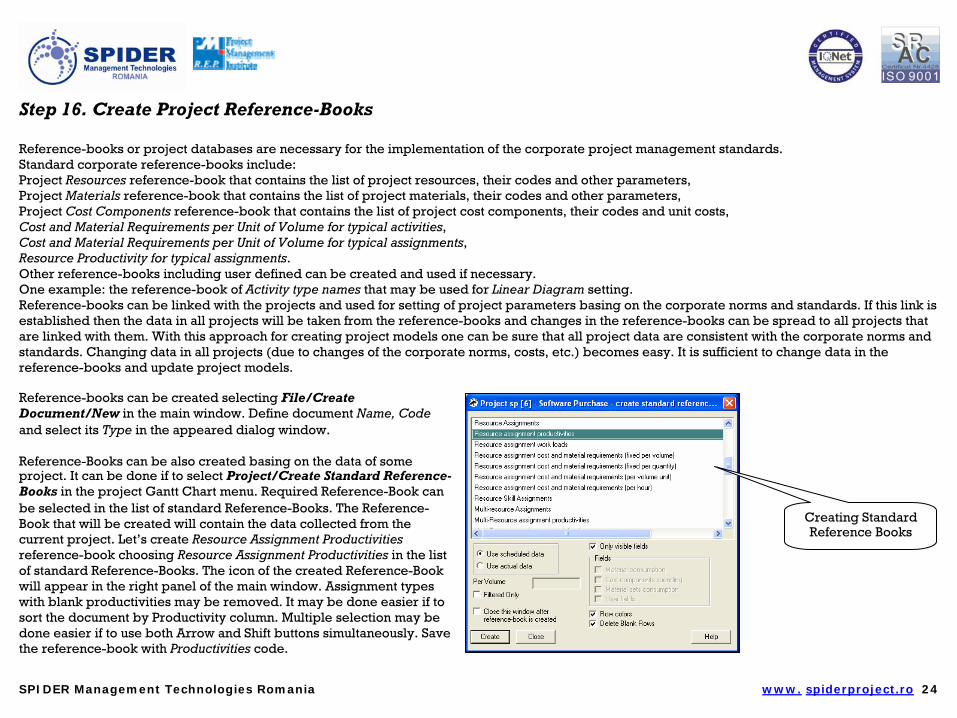
Step 16. Create Project Reference-Books Reference-books or project databases are necessary for the implementation of the corporate project management standards. Standard corporate reference-books include: Project Resources reference-book that contains the list of project resources, their codes and other parameters, Project Materials reference-book that contains the list of project materials, their codes and other parameters, Project Cost Components reference-book that contains the list of project cost components, their codes and unit costs, Cost and Material Requirements per Unit of Volume for typical activities, Cost and Material Requirements per Unit of Volume for typical assignments, Resource Productivity for typical assignments. Other reference-books including user defined can be created and used if necessary. One example: the reference-book of Activity type names that may be used for Linear Diagram setting. Reference-books can be linked with the projects and used for setting of project parameters basing on the corporate norms and standards. If this link is established then the data in all projects will be taken from the reference-books and changes in the reference-books can be spread to all projects that are linked with them. With this approach for creating project models one can be sure that all project data are consistent with the corporate norms and standards. Changing data in all projects (due to changes of the corporate norms, costs, etc.) becomes easy. It is sufficient to change data in the reference-books and update project models. Reference-books can be created selecting File/Create Document/New in the main window. Define document Name, Code and select its Type in the appeared dialog window. Reference-Books can be also created basing on the data of some project. It can be done if to select Project/Create Standard Reference-Books in the project Gantt Chart menu. Required Reference-Book can be selected in the list of standard Reference-Books. The Reference-Book that will be created will contain the data collected from the current project. Let’s create Resource Assignment Productivities reference-book choosing Resource Assignment Productivities in the list of standard Reference-Books. The icon of the created Reference-Book will appear in the right panel of the main window. Assignment types with blank productivities may be removed. It may be done easier if to sort the document by Productivity column. Multiple selection may be done easier if to use both Arrow and Shift buttons simultaneously. Save the reference-book with Productivities code.
Creating Standard Reference Books

SPIDER Management Technologies Romania www. spiderproject.ro 25
Any project table can be saved as Spider Document. Any Spider Document can be used as the Reference-Book. Let’s illustrate it creating Activity Type Names Reference-Book. Open Activities table. Select Table/Copy as a New Document. Move mouse cursor to column title and press right mouse button. Select Show Columns. Select all columns except Name and Type and press Delete. Open other Field Groups and delete all fields in these groups. Return to General group select any column and press OK. Now you have a document that includes only two fields – Name and Type. Move cursor to the Name column title and press right mouse button. In the appeared dialog windows select Properties. Change field code from Name to TypeName. If there are many rows with the same type code delete all rows except one. Type field shall be defined as the Key field in the field Properties dialog window.
Resource Assignment Productivities Reference
Book
Field Properties
Activity Type Names Reference
Book