first half 2017 financial report - air liquide · in early april, air liquide and oman oil...
TRANSCRIPT

FIRST HALF 2017
FINANCIAL REPORT

2 FIRST HALF 2017 FINANCIAL REPORT AS OF JUNE 30, 2017 | AIR LIQUIDE
Content
ACTIVITY REPORT – FIRST HALF 2017
H1 17 performance 6
Investment cycle 16
Risk Factors 16
2017 Outlook 17
Appendix 18
CONDENSED CONSOLIDATED FINANCIAL STATEMENTS
Condensed consolidated Financial Statements 27
Statutory auditors’ review report on the interim financial information 47
CERTIFICATION BY THE PERSON RESPONSIBLE FOR THE FIRST-HALF
FINANCIAL REPORT
Person responsible for the first half financial report 49
Certification by the person responsible for the first half financial report 49

FIRST HALF 2017 FINANCIAL REPORT AS OF JUNE 30, 2017 | AIR LIQUIDE 3
First Half 2017 Financial Report
World leader in gases, technologies and services for Industry and Health, Air Liquide is present in 80 countries with approximately 67,000 employees and serves more than 3 million customers and patients. Oxygen, nitrogen and hydrogen are essential small molecules for life, matter and energy. They embody Air Liquide’s scientific territory and have been at the core of the Company’s activities since its creation in 1902.
Air Liquide’s ambition is to lead its industry, deliver long-term performance and contribute to sustainability. The Company’s customer-centric transformation strategy aims at profitable growth over the long term. It relies on operational excellence, selective investments, open innovation and a network organization implemented by the Group worldwide. Through the commitment and inventiveness of its people, Air Liquide leverages energy and environment transition, changes in healthcare and digitization, and delivers greater value to all its stakeholders.
Air Liquide’s revenues amounted to 18.1 billion euros in 2016 and its solutions that protect life and the environment represented more than 40% of sales. Air Liquide is listed on the Euronext Paris stock exchange (compartment A) and belongs to the CAC 40, EURO STOXX 50 and FTSE4Good indexes.

4 FIRST HALF 2017 FINANCIAL REPORT AS OF JUNE 30, 2017 | AIR LIQUIDE

FIRST HALF 2017 FINANCIAL REPORT AS OF JUNE 30, 2017 | AIR LIQUIDE 5
ACTIVITY REPORT – FIRST HALF 2017
H1 17 PERFORMANCE 6
H1 2017 Keys figures 7
H1 2017 Highlights 8
H1 2017 Income Statement 10
Change in Net Indebtedness 15
INVESTMENT CYCLE 16
RISK FACTORS 16
2017 OUTLOOK 17
APPENDIX 18
Currency, energy and significant scope impacts
(Semester) 18
Currency, energy and significant scope impacts
(Quarter) 19
2nd
quarter 2017 revenue 20
Segment information 21
Revenue and adjusted 2016 Operating Income
Recurring 22
Return on Capital Employed – ROCE 23
1

ACTIVITY REPORT
H1 17 performance
6 FIRST HALF 2017 FINANCIAL REPORT AS OF JUNE 30, 2017 | AIR LIQUIDE
1
H1 17 PERFORMANCE
With Airgas now integrated, Air Liquide focuses on executing its mid-term strategic plan. The Group’s performance was solid in H1 17, with
further growth of sales and net profit, as well as an improvement of the margin.
Group revenue for H1 17 reached 10,293 million euros, up +28.4% as published, thanks to the consolidation of Airgas over a full semester.
Comparable growth was +1.8%, to which is being added a positive currency impact of +1.7% and a favorable energy impact of +2.2% resulting
in +5.7% growth to adjusted 2016 sales. This was driven by a steady improvement in Gas & Services sales and the dynamic momentum of
Global Markets & Technologies, but was impacted by a weak level of activity in Engineering & Construction. Gas & Services revenue amounted
to 9,978 million euros, up +31.0% as published and +2.8% on a comparable basis. H1 2017 saw confirmation of a recovery in Industrial
Merchant, an activity which now accounts for almost half of Gas & Services sales. Growth was also driven by solid Large Industries volumes,
consistent development in Healthcare and a return to growth for Electronics. In terms of geography, all zones posted growth.
Continuous efforts to reduce costs led to 148 million euros in efficiencies, in line with the annual target of more than 300 million euros. In
addition to these recurrent efficiency gains, Airgas synergies totaled 93 million US dollars since the beginning of the year and reached
cumulated 138 million US dollars since the acquisition of Airgas. The operating margin was 16.5% excluding the energy impact, a 70 basis point
improvement compared with the adjusted margin for H1 16. Net profit (Group share) rose to 928 million euros, an increase of +14.5%. Earnings
per share were up +4.3% compared with H1 16, after taking into account the dilutive impact of the October 2016 capital increase.
Cash flow from operating activities after changes in working capital requirements amounted to 1,593 million euros, up +31.2%, and exceeded
sales growth which stood at +28.4%. Net indebtedness at the end of June 2017 amounted to 15.6 billion euros.
The 12-month portfolio of investment opportunities remained stable at 2.1 billion euros at the end of June 2017. Investment decisions totaled
1.1 billion euros. Net capital expenditures represented 11.3% of sales and were in line with the mid-term strategic plan.

ACTIVITY REPORT
H1 17 performance
FIRST HALF 2017 FINANCIAL REPORT AS OF JUNE 30, 2017 | AIR LIQUIDE 7
1
Terms « published » and « comparable » used in this document refer to the definitions below :
Published growth vs 2016 data is calculated in accordance with IFRS 5. Other Activities (Aqua Lung and Air Liquide Welding) are
reported under “Net income from discontinued operations” in the 2016 and 2017 income statement. The Balance Sheet also presents
Assets and Liabilities held for sale under a dedicated line.
Adjusted 2016 revenue and operating income recurring are computed as if, on January 1st 2016, Airgas had been fully consolidated and
the divestitures requested by the U.S Federal Trade Commission completed, and Aqua Lung and Air Liquide Welding had been
deconsolidated.
Comparable growth: in 2017, Air Liquide will communicate a comparable sales growth based on 2016 adjusted sales, excluding currency
and energy (natural gas and electricity) impacts.
Reference to Airgas now corresponds to the Group’s Industrial Merchant and Healthcare activities in the United States within the new
scope, after the merger of Airgas and Air Liquide U.S. operations.
Unless otherwise stated, all variations in revenue and operating income recurring outlined below are on a comparable basis.
H1 2017 Keys figures
(in millions of euros) H1 2016 H1 2017
2017/2016 published
change
2017/2016 adjusted
comparable change (a)
Total Revenue 8,018 10,293 +28.4% +1.8%
Of which Gas & Services 7,618 9,978 +31.0% +2.8%
Operating income recurring 1,367 1,656 +21.2% +6.0%
Operating income recurring (as % of revenue) 17.0% 16.1% -90bps -
Other non-recurring operating income and expenses (84) (2)
Net profit (Group share) 811 928 +14.5%
Earnings per share (in euros) (b) 2.30 2.40 +4.3%
Net cash flows from operating activities (c) 1,215 1,593 +31.2%
Net capital expenditure (d) 13,105 1,162
Net debt 19,860 15,610
Debt-to-equity ratio (e) 151% 90%
Return On Capital Employed – ROCE after tax (f) 8.3% 7.4%
(a) Comparable growth based on 2016 adjusted sales excluding currency and energy price fluctuation impact. (b) H1 2016 Earnings per share restated for the impact of the preferential subscription rights allocated to shareholders as part of the capital increase carried out in October 2016. (c) Cash flow from operating activities after changes in working capital requirements and other elements. (d) Including transactions with minority shareholders.
(e) Adjusted to spread the dividend payment in H1 out over the full year and of change impact.
(f) Return on capital employed after tax: see definition in appendix.

ACTIVITY REPORT
H1 17 performance
8 FIRST HALF 2017 FINANCIAL REPORT AS OF JUNE 30, 2017 | AIR LIQUIDE
1
H1 2017 Highlights
INDUSTRIAL DEVELOPMENT
Large Industries
In early January 2017, Air Liquide and ArcelorMittal, signed
long-term contracts for the supply of oxygen, nitrogen and
argon to ArcelorMittal’s production sites in Benelux and
France.
In January 2017, Air Liquide announced having recently
commissioned the largest hydrogen storage facility in the
world. This underground cavern is located in Beaumont,
Texas, in the Gulf Coast region of the U.S. This unique
hydrogen storage cavern complements Air Liquide’s robust
supply capabilities along the Gulf Coast, offering greater
flexibility and reliable hydrogen supply solutions to
customers via Air Liquide’s extensive Gulf Coast Pipeline
System. This facility is 1,500 meters deep and nearly
70 meters in diameter and is capable of holding enough
hydrogen to back up a large-scale steam methane reformer
(SMR) unit for 30 days.
Air Liquide inaugurated on January 26th in France, in the
frame of the Connect project, an operation center that is
unique in the industrial gas sector. It enables the remote
management of production for 22 of the Group’s units in
France, optimizing their energy consumption and improving
their reliability. With “technological showcase” certification
from the Industry of the Future Alliance, Connect represents
an investment of €20 million. This project is based on the
implementation of new digital technologies at French
production sites and on the creation of new skills.
In early April, Air Liquide and Oman Oil Refineries and
Petroleum Industries Company (Orpic), Oman’s national
refining company, signed a long-term agreement for the
supply of nitrogen to the Liwa Plastics Industries Complex
(LPIC), a new plastics production complex including the
country’s first steam cracker Orpic is adding to its existing
production facilities, in Sohar industrial port area in Oman.
Investing around €20 million to build a state-of-the-art
nitrogen production unit with a total capacity of 500 tons of
nitrogen per day, Air Liquide will strengthen its leadership
position in a key industrial area to support the growth of its
customer Orpic.
Industrial Merchant
In June 2017, Air Liquide announced new supply contracts
covering a period of 10 to 15 years with three major Chinese
fiber optics manufacturers. In the frame of these new
contracts with Futong Group Communication Technology,
Yangtze Optical Fibre, and Zhongtian Technology Fine
Materials, Air Liquide will supply a total exceeding
6,000 Nm3 per hour of hydrogen and 4,000 Nm3 per hour of
nitrogen via on-site generator solutions, together with bulk
oxygen, helium, argon and carbon dioxide. Air Liquide will
thus support the further development of China’s fiber optics
industry.
Engineering & Construction
In May 2017, Air Liquide Engineering & Construction
announced it had recently signed a major contract
amounting around €100 million to design and build three Air
Separation Units (ASU) for Yankuang Group, one of the
largest energy and chemical companies in China. Each of
the ASUs will have a production capacity of 3,200 tonnes
per day of oxygen, plus nitrogen for the production of
methanol-based chemicals, an additive widely used in the
energy industry to increase combustion efficiency of
hydrocarbon. The new ASUs will be built by using
Air Liquide’s latest innovative technologies expertise and
best in class standards to ensure a safe, optimized and
reliable operation of the plants. All three ASUs will start
operation in the second half of 2019.
DEVELOPMENTS IN HEALTHCARE
Air Liquide pursued its external growth strategy in
Healthcare. The Group’s subsidiary Seppic, designer and
supplier of specialty ingredients for health and beauty,
recently finalized the acquisition of the Serdex division of
Bayer. This acquisition strengthens Seppic’s footprint in
natural active ingredients for cosmetics. The global specialty
active ingredients for cosmetics represent a market over
€900 million, of which natural active ingredients are a fast
growing segment.
The Group announced on January 24th the acquisition of
Oxymaster, a national home healthcare sector player in
Colombia. Present in the Colombian market for almost
20 years, Oxymaster is specialized in home treatment and
support for patients suffering from respiratory conditions
(sleep apnea, Chronic Obstructive Pulmonary Disease,
chronic respiratory failure). Oxymaster has more than
240 employees and serves over 21,000 patients. The
company generated revenues of approximately €9 million in
2016.
Air Liquide strengthens its position in home care for patients
with diabetes and participates in the French artificial
pancreas project. By signing a partnership with CERITD, the
French Center for Studies and Research for the
Intensification of Diabetes Treatment, Air Liquide continues
the approach based on cooperation between hospital teams
and homecare nurses. In addition, to increase its level of
expertise in the field of diabetes and support innovation,
Air Liquide has acquired an equity stake via ALIAD, the
Group’s venture capital investment arm, in the French start-
up Diabeloop, which is designing an electronic artificial
pancreas composed of an insulin pump in the form of a
patch and a glucose sensor both connected. The
investment made by Air Liquide in Diabeloop confirms the
Group’s commitment to digital technologies and healthcare,
in the aim of helping patients achieve a better quality of life
and care.

ACTIVITY REPORT
H1 17 performance
FIRST HALF 2017 FINANCIAL REPORT AS OF JUNE 30, 2017 | AIR LIQUIDE 9
1 PROJECTS IN INNOVATION AND TECHNOLOGY
Air Liquide and 12 leading energy, transport and industry
companies have launched on January 17th, a global initiative
to voice a united vision and long-term ambition for
hydrogen to foster the energy transition. In the first global
initiative of its kind, the ‘Hydrogen Council’ is determined to
position hydrogen among the key solutions of the energy
transition and aims to promote hydrogen to help meet
climate goals.
In March, Air Liquide completed the construction of two
hydrogen charging stations in Japan. The Fukuoka Miyata
and Kobe Shichinomiya stations are respectively the 4th and
5th hydrogen charging stations for public use in Japan. To
date, 75 hydrogen charging stations have already been
designed and installed by Air Liquide worldwide.
ALIAD, Air Liquide’s venture capital investment arm,
continues to gain strength in the industries of the future
with three new equity investments in technology start-ups,
UBleam and Dietsensor, and in the investment fund
Investisseurs & Partenaires. With these new equity
investments in addition to its further financial commitment
to six companies in which it has already invested before,
ALIAD has committed more than €10 million to start-ups
since the start of 2017. The investment strategy of ALIAD
targets sectors linked to the energy transition, health and
digital. ALIAD also supports these start-ups that are
developing the technologies of the future by rolling out R&D
and/or business partnerships with Group entities.
NEW VISUAL IDENTITY
The acquisition of Airgas and the launch of the NEOS
Company Program for the period 2016-2020 mark a new
milestone in the history of Air Liquide. The Group is
transforming and is changing its visual identity with a new
logo, the fifth since the company was founded 115 years
ago. This new visual identity introduced in January 2017,
which embodies the transformation of Air Liquide, is that of
a leading Group, expert and innovative, that is close to its
stakeholders and open to the world.
BOND ISSUE
A transaction, issued under the Group’s €12 billion Euro
Medium Term Note (EMTN) program, allowed the issuance
of a €600 million bond with a 10-year maturity at a yield of
1.116%. This recent transaction brings the total outstanding
amount of bonds issued to approximately €15.2 billion, with
an average maturity of 6.8 years. Proceeds from this bond
will allow the Group to refinance its two bonds maturing in
June and July 2017, and to continue funding sustainably its
long-term growth while benefiting from very attractive
market conditions.
PORTFOLIO MANAGEMENT
On April 27, 2017, Air Liquide announced it signed an
agreement with Lincoln Electric France SAS, subsidiary of
Lincoln Electric Holdings, Inc. (“Lincoln Electric”) (Nasdaq:
LECO), to sell Air Liquide Welding, its subsidiary specialized
in the manufacture of welding and cutting technologies.
This agreement follows the exclusive negotiations
agreement announced on March 2, 2017 with Lincoln
Electric, the world leader in design, development and
manufacture of arc welding products, robotic arc welding
systems, plasma and oxy-fuel cutting equipment. Both
parties having now obtained the necessary regulatory
approvals, the transaction will be completed on
July 31, 2017.

ACTIVITY REPORT
H1 17 performance
10 FIRST HALF 2017 FINANCIAL REPORT AS OF JUNE 30, 2017 | AIR LIQUIDE
1
H1 2017 Income Statement
INCOME STATEMENT
(in millions of euros) H1 2016 H1 2017
2017/2016 published
change
2017/2016 comparable
change
Gas & Services 7,618 9,978 +31.0% +2.8%
Engineering & Construction 254 146 -42.7% -43.3%
Global Markets & Technologies 146 169 +15.8% +16.4%
TOTAL REVENUE 8,018 10,293 +28.4% +1.8%
Group
Group revenue in the 1st half of 2017 totaled 10,293 million euros, up +28.4% as published compared to the 1st half of 2016. Comparable growth
was +1.8%, to which are being added positive currency impact of +1.7% and favorable energy impact of +2.2% resulting in +5.7% growth to
adjusted 2016 sales. The currency and energy impacts remained positive in the 2nd quarter of 2017, but eased compared with the 1st quarter of
2017. Comparable growth was driven by a steady improvement in Gas & Services sales, but was affected by a weak activity level in
Engineering & Construction.
Revenue by quarter (in millions of euros)
Q1 2017 Q2 2017
Gas & Services 5,046 4,932
Engineering & Construction 53 93
Global Markets & Technologies 77 92
TOTAL REVENUE 5,176 5,117
2017/2016 published change +38.5% +19.5%
2017/2016 comparable +1.5% +2.0%
Gas & Services
Gas & Services revenue totaled 9,978 million euros, up +31.0% as published compared with the 1st half of 2016. Comparable growth was +2.8%,
to which are being added a positive currency impact of +1.8% and a favorable energy impact of +2.3% resulting in +6.9% growth to adjusted
2016 sales. This was driven in particular by steady sales growth in Industrial Merchant, at close to +3% over the half-year.
Revenue (in millions of euros) H1 2016 H1 2017
2017/2016 published
change
2017/2016 comparable
change
Americas 2,185 4,251 +94.5% +3.3%
Europe 3,225 3,371 +4.6% +2.0%
Asia-Pacific 1,920 2,032 +5.9% +2.8%
Middle-East & Africa 288 324 +12.4% +3.5%
GAS & SERVICES 7,618 9,978 +31.0% +2.8%
Large Industries 2,388 2,694 +12.8% +2.2%
Industrial Merchant 2,964 4,757 +60.5% +2.8%
Healthcare 1,451 1,690 +16.5% +4.5%
Electronics 815 837 +2.8% +0.4%

ACTIVITY REPORT
H1 17 performance
FIRST HALF 2017 FINANCIAL REPORT AS OF JUNE 30, 2017 | AIR LIQUIDE 11
1 Americas
Gas & Services revenue in the Americas zone amounted to
4,251 million euros, up +95% as published following the integration
of Airgas and up +3.3% on a comparable basis. In Large Industries,
sales were up markedly (+5.1%) in the 1st half and in particular in the
1st quarter. The recovery was confirmed in Industrial Merchant, with
revenue growth of +3.3% over the half-year and an increase of
+4.0% during the 2nd quarter. In South America, sales continued to
improve significantly, notably in Large Industries and Healthcare.
Large Industries posted a sharp +5.1% growth in sales in H1,
with more modest growth in the 2nd quarter. In North America,
air gases volumes were up +4.7% over H1 2017 with record
levels of oxygen delivered in the United States in June 2017. In
the 2nd quarter, hydrogen volumes were impacted by
maintenance turnarounds and sales from cogeneration units
were down due to the fall in electricity prices in North
America. In Latin America, new units contributed to the
dynamic growth momentum.
The recovery in Industrial Merchant was confirmed, with sales
growth of +3.3% over the 1st half and +4.0% in the 2nd quarter.
Liquid gas and cylinder volumes were up in the United States
and Canada. Sales improved in almost all market segments.
In the United States they progressed particularly in Food,
Pharmaceuticals, Materials, Energy, Professionals and Retail.
In Canada, they increased markedly in Energy with a rebound
in oil services and related industries. Activity in South America
continued its dynamic momentum. The price impact in the
zone was +1.7% over the half-year.
Healthcare revenue was up +4.2%, driven by solid activity in
Canada and South America where Home Healthcare was
enjoying sustained growth.
Electronics revenue declined -4.3% due to weak Equipment &
Installation sales in the 2nd quarter of 2017. Gas sales
remained dynamic, in particular in Advanced Materials which
continued to post double-digit growth.
Europe
Revenue in Europe zone totaled 3,371 million euros, up +2.0%.
Despite solid volumes, Large Industries sales remained down at
-1.4%, due to customer maintenance turnarounds and the stoppage
of activity in Ukraine. The recovery in Industrial Merchant was
confirmed with growth of +2.7% over H1; during the 2nd quarter,
despite a very unfavorable working day impact, growth remained
positive at +1.2%. Healthcare continued to improve steadily (+4.2%),
with limited contribution to growth from bolt-on acquisitions.
Large Industries revenue was down -1.4% over H1, penalized
by customer maintenance turnarounds. Nevertheless, sales
improved on a sequential basis: Air gases benefited from
increased demand from steel producers (France, Germany,
Italy) and hydrogen from the good activity level at refineries.
Sales in Eastern Europe continued to grow, but were impacted
by the stoppage of activity in Ukraine.
Industrial Merchant revenue was up +2.7% over the half-year,
with the recovery in most countries confirmed, especially in
Southern Europe (Iberia, Italy) and Benelux. Liquid gas and
cylinder volumes were up over the half-year. Sales per working
day continued to increase in the 2nd quarter. The Food &
Pharmaceuticals and the Materials & Energy market
segments continued to improve. Growth was more limited for
the Professionals and Retail segment with low volumes for
gas cylinders in particular due to the negative working day
impact in the H1 17. Developing economies continued to
enjoy sustained sales growth, in particular in Russia, Poland
and Turkey. Following two years of decline, pricing returned to
slightly positive territory in the region in the 2nd quarter and
were flat over the half-year.
Healthcare continued to improve steadily posting sales
growth of +4.2%, with new acquisitions having a limited
contribution. Home Healthcare sales continued to grow with
an increase in the number of patients. Revenue from medical
gases for hospitals was affected in the 2nd quarter by an
unfavorable working day impact. Sales in the Hygiene and
Specialty Ingredients activities grew significantly, driven by
bolt-on acquisitions.
Americas Gas & Services H1 2017 Revenue
Europe Gas & Services H1 2017 Revenue

ACTIVITY REPORT
H1 17 performance
12 FIRST HALF 2017 FINANCIAL REPORT AS OF JUNE 30, 2017 | AIR LIQUIDE
1 Asia-Pacific
Revenue in the Asia-Pacific zone totaled 2,032 million euros and
climbed +2.8% in the 1st half-year and at a faster pace in the
2nd quarter, at +4.0%. Solid growth was achieved across all business
lines. In Large Industries, sales were up +3.9% in the 1st half-year,
driven by the loading of a new unit and strong volumes. Industrial
Merchant grew strongly in the 2nd quarter (+4.0%) with double-digit
growth in China and an improvement in activity in Japan.
Electronics sales saw a return to growth, up +4.5% in the 2nd quarter,
thanks to continued underlying activity momentum.
Large Industries sales were up +3.9%, driven by the ramp-up of
a new unit in Australia and by strong customer demand
notably in South Korea, Singapore and Japan. Several
customer maintenance turnarounds affected growth in China
in the 2nd quarter.
Industrial Merchant improved +1.7% over the half-year, and
enjoyed a strong 2nd quarter at +4.0%. In China, growth
exceeded +15% in the 2nd quarter, driven by increases in
volumes and liquid gas prices (in particular nitrogen, argon)
and by the very strong growth in gas cylinders volumes
(oxygen, argon). In Japan, after a negative comparison effect
for Equipment & Installation sales in the 1st quarter, revenue
climbed in the 2nd quarter thanks to an improvement in
Industrial Production. In Singapore, sales were compared to
high Equipment & Installation revenue seen in the 2nd quarter
of 2016. Business in Australia was down slightly in a
challenging environment. Pricing rose and were positive at
+0.4% in the 1st half-year.
Electronics revenue was up +1.7% over the half-year, with a
strong 2nd quarter at +4.5%, driven in particular by double-digit
sales growth in China and Taiwan. Underlying activity
momentum was strong, climbing more than +10% in the
2nd quarter, in particular thanks to Advanced Materials, carrier
gases and services. Nevertheless, the basis of comparison
was unfavorable, with Equipment & Installation sales
extremely high in the 1st half of 2016. In the 2nd half-year, the
basis of comparison with 2016 should be more favorable.
Middle East and Africa
Middle East and Africa zone revenue amounted to 324 million euros,
an increase of +3.5% on a comparable basis. In the 2nd quarter, sales
benefited from the fact that two large hydrogen production units in
Yanbu, Saudi Arabia are operating at full capacity. In Egypt, pre-
loading of production units contributed to growth in Large Industries
and Industrial Merchant. South Africa continued to enjoy sustained
growth in Healthcare.
Engineering & Construction
Engineering & Construction revenue totaled 146 million euros in the
1st half of 2017, down -43.3% compared with the 1st half of 2016,
due to the low level of order intake in 2016. Business nonetheless
improved sequentially during the 1st half-year.
Order intake reached 329 million euros in the 1st half of 2017, up
+161% compared with the 1st half of 2016. More than 80% of all
orders concerned air gas units (ASU). These mainly included Group
projects and orders on behalf of third parties in the Energy and
Chemicals sectors in China and South Korea. The number of
tenders continued to increase.
Global Markets & Technologies
Global Markets & Technologies revenue was up +16.4% at
169 million euros. Sales were particularly dynamic in the biogas and
space sectors. Helium sales increased in the 2nd quarter despite
logistical challenges relating to the geopolitical context in Qatar.
Order intake totaled 148 million euros in the 1st half of 2017.
OPERATING INCOME RECURRING
Operating income recurring before depreciation and amortization
totaled 2,556 million euros, up +22.6% as published compared to
H1 16. This reflected the integration of Airgas.
Purchases were up +33.6%, at a faster pace than published sales
growth at +28.4%: this difference was due to trading activity
(hardgoods sales) at Airgas which is greater than at Air Liquide.
Personnel costs also grew at a faster pace (+32.3%) than sales,
mainly due to the change in business mix. Indeed, Industrial
Merchant, which now accounts for close to half of Group sales,
requires more staff than other activities such as Large Industries.
However, other expenses increased at a slower pace (+21.7%), as
Airgas’ structure is leaner, for example has no Research and
Development department.
Depreciation and amortization reached 900 million euros, up
+25.4%. This also increased at a slower pace than sales as the
relative weighting of Industrial Merchant, a business with lower
capital intensity than Large Industries, is now larger within the
Group’s business lines.
Over the first six months of the year, efficiencies amounted to
148 million euros, up +3.5% and in line with the annual target of over
300 million euros. More than 40% of these efficiencies related to
industrial projects (optimization of production units particularly in
China and Benelux, logistics, and maintenance), more than one third
to purchasing gains (energy in Large Industries, molecules in
Electronics), and the balance mainly to administrative efficiencies
Asia-Pacific Gas & Services H1 2017 Revenue

ACTIVITY REPORT
H1 17 performance
FIRST HALF 2017 FINANCIAL REPORT AS OF JUNE 30, 2017 | AIR LIQUIDE 13
1 and restructuring. Large Industries and Industrial Merchant were the
Business Lines generating most of the efficiencies and accounted
for almost two thirds of total efficiencies.
Airgas synergies continued to materialize: these represented
93 million US dollars in H1 2017 and cumulated 138 million
US dollars since the acquisition of Airgas in 2016. Cost synergies
are divided into four main categories: cylinder operations where
more than 90% of site closures and restructuring have been
completed; liquid gas operations where the entire logistics of liquid
products are being optimized; the review of processes where best
practices are being implemented and procurement where contracts
are renegotiated; and, finally, the back office, where more than 90%
of duplicate positions have already been eliminated. Revenue
synergies have started to materialize with better availability of bulk
products and new offers proposed to customers.
The Group’s operating income recurring (OIR) reached 1,656 million
euros in H1 17, up +21.2% as published and up +6.0% versus H1 16
adjusted OIR. The operating margin (OIR to revenue) was up
+30 basis points on a comparable basis at 16.1% compared with H1
16 adjusted operating margin. Excluding the energy impact, H1 17
operating margin was up +70 basis points at 16.5% compared to the
adjusted H1 16 operating margin and in line with the Group’s
objective to improve profitability.
Gas & Services
Gas & Services operating income recurring amounted to
1,761 million euros, an increase of +20.7%. The OIR margin as
published was 17.6%. Excluding the energy impact, the operating
margin stood at 18.1%.
Against a backdrop of limited global inflation, average selling prices
were up +0.6% due in particular to Industrial Merchant (+1.2%).
Prices were slightly down in Electronics and pricing pressure in
Healthcare continued in certain countries.
Efficiencies totaled 136 million euros in H1 2017 for Gas & Services
activity.
Gas & Services Operating margin (a) H1
2016 H1
2017
Americas 19.7% 15.8%
Europe 19.8% 18.9%
Asia-Pacific 18.0% 19.7%
Middle-East & Africa 15.5% 16.4%
TOTAL 19.2% 17.6%
(a) Operating income recurring/revenue.
Operating income recurring in the Americas reached 670 million
euros, an increase of +55.5%. Excluding energy impact, the
operating margin was 16.1%, which represented a -360 basis point
decrease. This ratio reflected the change in business mix following
the acquisition of Airgas with reinforcement of the relative weight of
Industrial Merchant.
Operating income recurring in Europe reached 637 million euros,
almost unchanged at -0.3%. Excluding energy impact, the operating
margin stood at 19.3%, representing a -50 basis point decrease
compared with H1 16. This result was in line with the change in
business and country mix of the zone.
Operating income recurring in the Asia-Pacific region stood at
401 million euros, an increase of +16.3%. Excluding energy impact,
the operating margin was 20.0%, up +200 basis points. This increase
was due to efficiencies and adjustment plans implemented in the
zone. It also benefited from higher volumes in Industrial Merchant
and the continued very dynamic growth in Advanced Materials in
Electronics.
Operating income recurring for Middle East and Africa amounted to
53 million euros, an increase of +19.3%. Excluding the energy effect,
the operating margin stood at 18.3%, an increase by +280 basis
points, driven by higher loading of the Yanbu production units in
Saudi Arabia.
Engineering & Construction
Operating income recurring for Engineering & Construction stood at
-6 million euros, penalized by a weak level of activity in a challenging
environment. The Group’s mid-term operating margin target
remains between 5% and 10%.
Global Markets & Technologies
Operating income recurring for Global Markets & Technologies was
18 million euros and the operating margin was 10.6%, almost stable
compared with H1 16 (10.8%). Some activities are currently being
launched. The margin level for this activity is dependent on the
nature of the projects carried out during the period and may vary
markedly from one year to the next.
Research and Development and Corporate Costs
Research and Development and Corporate Costs stood at
117 million euros and were stable compared with H1 16 (119 million
euros).
Gas & Services H1 2017 Operating Income Recurring

ACTIVITY REPORT
H1 17 performance
14 FIRST HALF 2017 FINANCIAL REPORT AS OF JUNE 30, 2017 | AIR LIQUIDE
1 NET PROFIT
Other operating income and expenses showed a net balance of
-2 million euros. This was mainly related to costs for Airgas
integration and expenses relating to alignment plans currently
underway, in particular in the United States. They were much lower
than in 2016 and were mostly offset by provision reversals. In
H2 17, the balance of other operating income and expenses should
be more negative.
The net financial expense of -259 million euros was +51.6% higher
than H1 16. Net finance costs at the end of June 2017 stood at
-223 million euros and were up +40.7% excluding the currency
impact, due to the financing of the Airgas acquisition. The currency
impact was a negative -10 million euros, mainly related to the
increase of the average rate of the US dollar. At 3.1%, the average
cost of net indebtedness was down -40 basis points compared with
H1 16, due to the favorable impact of refinancing relating to Airgas.
However, it was up +20 basis points compared with the average
cost for 2016 (2.9%), due to the increase in the cost of indebtedness
in developing countries. The increase in “other financial income and
expenses” (+88.6%) was mostly related to the increase in fees on
bank card payments with the consolidation of Airgas.
Taxes totaled 389 million euros, up +47.3% due to the consolidation
of Airgas. The effective tax rate was 27.9%. This was due to the new
breakdown of the Group’s businesses with a greater share in the
United States where the tax rate is higher, but also due to the
decrease in tax rates in several countries where the Group is
present.
The share of profit of associates was 1 million euros compared with
3 million euros in H1 16. Minority interests rose by +14.9% to
49 million euros, due to an increase in earnings for subsidiaries with
minority shareholders, notably in Saudi Arabia.
Net result from discontinued operations stood at -30 million euros,
the Group having made a provision for the impact of the disposal of
Air Liquide Welding which should be completed on July 31st, 2017,
as both parties have now obtained the necessary regulatory
approvals to finalize the disposal project.
Net profit (Group share) amounted to 928 million euros in H1 17, an
increase of +14.5%.
Net earnings per share, at 2.40 euros, were up +4.3% compared with
H1 16, after taking into account the impact of the October 2016
capital increase and thus had a solid accretive impact. The average
number of outstanding shares used for the calculation of net
earnings per share as at June 30, 2017 was 386,833,119.
Change in the number of shares
H1 2016 H1 2017
Average number of outstanding shares (a) 352,569,431 386,833,119
(a) Used to calculate net earnings per share. The average number of outstanding shares in H1 2016 was restated for the impact of the preferential subscription
rights allocated to shareholders as part of the capital increase carried out in October 2016.

ACTIVITY REPORT
H1 17 performance
FIRST HALF 2017 FINANCIAL REPORT AS OF JUNE 30, 2017 | AIR LIQUIDE 15
1 Change in Net Indebtedness
Cash flow from operating activities before changes in working capital
amounted to 1,947 million euros. This amount corresponded to a
high level of sales (18.9%).
Net cash after changes in working capital requirement (and other
items) was 1,593 million euros, a marked increase of +31.2%
compared with H1 16, exceeding sales growth of +28.4%.
The increase in working capital requirement (WCR) was limited to
317 million euros, compared with 335 million euros in H1 16. The
working capital requirements ratio to sales, excluding taxes,
remained stable at 9.0% compared with 9.1% at June 30, 2016. That
ratio for Gas &Services declined, from 11.2% at June 30, 2016 to
9.1% at the end of H1 17. This decrease is mainly due to a reduction
in trade receivables notably through an improvement of payment
conditions for certain customers and factoring measures.
Engineering & Construction WCR increased due to the cycle of
projects.
Gross industrial capital expenditure reached 1,108 million euros, an
increase of only +5.0% despite the integration of Airgas. Financial
investments totaled 86 million euros, slightly higher than the
76 million euros made in H1 16 excluding the Airgas acquisition.
Gross capital expenditure in H1 17 amounted to 1,194 million euros.
Including transactions with minority shareholders and proceeds
from the sale of assets of 36 million euros, net capital expenditure
totaled 1,162 million euros and represented 11.3% of sales, in line
with the NEOS strategic plan.
Net indebtedness at June 30, 2017 reached 15,610 million euros,
slightly more (+1.6%) than at December 31, 2016. Dividends were
higher due to the October 2016 capital increase; share buy-backs
increased to offset stock options exercised and performance shares
granted. The net debt to equity ratio, adjusted for the seasonal effect
of the dividend payment and excluding the currency impact,
remained stable at 90%.
The return on capital employed after tax (ROCE) was 7.4%, an
improvement of 50 basis points compared with adjusted ROCE of
6.9% at the end of 2016.
ACTIVITY REPORT
Investment cycle
16 FIRST HALF 2017 FINANCIAL REPORT AS OF JUNE 30, 2017 | AIR LIQUIDE
1
INVESTMENT CYCLE
The Group’s steady long-term growth is largely due to its ability to invest in new projects each year. Investment projects in the industrial gas
business are spread throughout the world, highly capital intensive and supported by long-term contracts, in particular for Large Industries.
INVESTMENT OPPORTUNITIES
At the end of June 2017, the 12-month portfolio of opportunities
totaled 2.1 billion euros and remained stable compared with
March 2017. New projects entering the portfolio offset those signed
by the Group, awarded to the competition or delayed. The long-term
portfolio, which includes all projects including those which may be
signed after the next 12 months, was strong and remained at
between 4.5 and 5 billion euros.
More than half of the investment opportunities in the 12-month
portfolio are located in developing economies. Americas remain the
geography with the highest number of opportunities, closely
followed by Europe and then Asia. This breakdown of the portfolio
of opportunities is similar to the new breakdown of Group sales.
Half of the investment opportunities correspond to projects with
investments of less than 50 million euros; a few projects are greater
than 100 million euros. The more modest size of projects
contributes to a better distribution of risk.
INVESTMENT DECISIONS AND INVESTMENT
BACKLOG
Industrial and financial investment decisions totaled 1.1 billion euros
during the 1st half of 2017. Industrial decisions accounted for more
than 90% of that amount. These include in particular the takeover of
a site from a major customer in China, a new nitrogen supply
contract in Oman and a contract for a new electronics production
unit in China.
The total investment backlog amounted to 2.0 billion euros and was
stable compared with the end of March 2017. The investment
backlog should represent a future contribution to annual sales of
approximately 0.8 billion euros per year after full ramp-up.
START-UPS
Nine new production units were started up during the 1st half of
2017, including two air gas units in the Americas, two in Europe, two
hydrogen-related units and three dedicated to Electronics in Asia.
Over the half-year, the contribution to sales of unit start-ups and
ramp-ups totaled approximately 70 million euros.
A greater number of start-ups is expected during the second half of
the year. However, the Chinese project whose start-up was
scheduled for September 2017 is expected to extend its testing
period until the beginning of 2018.
Thus, for 2017 as a whole, the contribution to sales of unit start-ups
and ramp-ups should reach 170 to 190 million euros. This
contribution is expected to be higher in 2018, above 370 million
euros, as several major unit start-ups are scheduled for the end of
2017 and the 1st half of 2018.
RISK FACTORS
There was no change in risk factors during first half 2016. Risk factors are described in the 2016 Reference Document on pages 28 to 33.

ACTIVITY REPORT
2017 Outlook
FIRST HALF 2017 FINANCIAL REPORT AS OF JUNE 30, 2017 | AIR LIQUIDE 17
1 2017 OUTLOOK
The Group's performance in the first half of 2017 was solid, with
further growth in revenue and net profit, as well as an improvement
in the operating margin. Sales benefited from the end of the Airgas
consolidation effect and positive currency and energy impacts.
The Gas & Services business continued to improve during the
first half of the year, benefiting from the confirmed recovery in
Industrial Merchant, strong volumes in Large Industries, a good
underlying level of activity in Electronics, and continuous
development in Healthcare. Global Markets & Technologies sales
continued to grow by double digits. Geographically, all regions are
generating growth, with Industrial Merchant and Healthcare
activities particularly dynamic in developing economies.
The Group's operational performance also improved further in the
first half of 2017: the new efficiencies and synergies associated with
Airgas contributed to the higher operating margin and net profit.
Lastly, the Group's balance sheet remains robust, benefiting from
strong growth in cash flows and well controlled debt.
Investment decisions continued during the first half of the year, and
the Group can rely on €2.0 billion investment backlog to support its
future growth. With Airgas now fully integrated, Air Liquide is
focused on executing its mid-term strategic plan.
Assuming a comparable environment, Air Liquide is confident in its
ability to deliver net profit growth in 2017.

ACTIVITY REPORT
Appendix
18 FIRST HALF 2017 FINANCIAL REPORT AS OF JUNE 30, 2017 | AIR LIQUIDE
1
APPENDIX
Currency, energy and significant scope impacts (Semester)
Applied method
In addition to the comparison of published figures, financial information is given excluding significant scope, currency, and natural gas and electricity price fluctuation impact.
The significant scope effect corresponds to the impact on sales of all acquisitions or disposals of a significant size for the Group. These changes in scope of consolidation are determined:
- for acquisitions during the period, by deducting from the aggregates for the period the contribution of the acquisition,
- for acquisitions during the previous period, by deducting from the aggregates for the period the contribution of the acquisition between January 1 of the current period and the anniversary date of the acquisition,
- for disposals during the period, by deducting from the aggregates for the previous period the contribution of the disposed entity as of the anniversary date of the disposal,
- for disposals during the previous period, by deducting from the aggregates for the previous period the contribution of the disposed entity.
Since industrial and medical gases are rarely exported, the impact of currency fluctuations on activity levels and results is limited to euro translation impacts with respect to the financial statements of subsidiaries located outside the euro zone. The currency effect is calculated based on the aggregates for the period converted at the exchange rate for the previous period.
In addition, the Group passes on variations in the cost of energy (electricity and natural gas) to its customers via indexed invoicing integrated into their medium and long-term contracts. This indexing can lead to significant variations in sales (mainly in the Large Industries Business Line) from one period to another depending on fluctuations in prices on the energy market.
An energy impact is calculated based on the sales of each of the main subsidiaries in Large Industries. Their consolidation allows the determination of the energy impact for the Group as a whole. The foreign exchange rate used is the average annual exchange rate for the year N-1.
Thus, at the subsidiary level, the following formula provides the energy impact, calculated for natural gas and electricity respectively:
Energy impact = Share of sales index to energy year (N-1) x (Average energy price over the year (N) - Average energy price over the year (N-1))
Neutralizing the impact of variations in energy prices against sales allows analysis of evolution in revenue on a comparable basis.
(in millions of euros) Group Gas & Services
H1 2017 Revenue 10,293 9,978
2017/2016 published change (in %) +28.4% +31.0%
Currency impact 166 166
Natural gas impact 179 179
Electricity impact 42 42
2017/2016 comparable growth (in %) +1.8% +2.8%

ACTIVITY REPORT
Appendix
FIRST HALF 2017 FINANCIAL REPORT AS OF JUNE 30, 2017 | AIR LIQUIDE 19
1 Currency, energy and significant scope impacts (Quarter)
In addition to the comparison of published figures, financial information for second quarter 2016 is provided before currency, energy price
fluctuations and significant scope impacts. As of January 1, 2015, the energy impact includes impacts of natural gas and electricity. In the
future, it may also include other energy Large Industries feedstocks.
Since gases for industry and health are rarely exported, the impact of currency fluctuations on activity levels and results is limited to euro
translation impacts with respect to the financial statements of subsidiaries located outside the Euro zone. Fluctuations in natural gas and
electricity prices are passed on to customers through price indexation clauses.
Consolidated 2017 second quarter revenue includes the following impact:
(in millions of euros)
Revenue Q2 2017
Q2 2017/2016 Change Currency Natural gas Electricity
Q2 2017/2016 Comparable
change (a)
Group 5,117 +19.5% 49 75 17 +2.0%
Gas & Services 4,932 +21.2% 50 75 17 +2.7%
(a) Comparable change based on 2016 adjusted sales excluding currency and energy impacts.
For the Group,
The currency impact was +1.0%.
The impact of natural gas price fluctuations was +1.5%.
The impact of electricity price fluctuations was +0.4%.
For Gas & Services,
The currency impact was +1.1%.
The impact of natural gas price fluctuations was +1.6%.
The impact of electricity price fluctuations was +0.4%.

ACTIVITY REPORT
Appendix
20 FIRST HALF 2017 FINANCIAL REPORT AS OF JUNE 30, 2017 | AIR LIQUIDE
1
2nd quarter 2017 revenue
BY GEOGRAPHY
Revenue (in millions of euros) Q2 2016 Q2 2017
Published change
Comparable change (a)
Americas 1,361 2,109 +54.9% +2.9%
Europe 1,611 1,661 +3.2% +1.5%
Asia-Pacific 954 1,008 +5.7% +4.0%
Middle-East & Africa 144 154 +6.8% +4.3%
Gas & Services Revenue 4,070 4,932 +21.2% +2.7%
Engineering & Construction 130 93 -28.8% -29.1%
Global Markets & Technologies 81 92 +13.3% +14.1%
GROUP REVENUE 4,281 5,117 +19.5% +2.0%
BY WORLD BUSINESS LINE
Revenue (in millions of euros) Q2 2016 Q2 2017
Published change
Comparable change (a)
Large Industries 1,181 1,302 10.3 % 1.8 %
Industrial Merchant 1,726 2,373 37.5 % 3.1 %
Healthcare 756 840 11.1 % 3.5 %
Electronics 407 417 2.4 % 1.2 %
GAS & SERVICES REVENUE 4,070 4,932 21.2 % 2.7 %
(a) Comparable change based on adjusted 2016 sales excluding currency and energy impacts.

ACTIVITY REPORT
Appendix
FIRST HALF 2017 FINANCIAL REPORT AS OF JUNE 30, 2017 | AIR LIQUIDE 21
1 Segment information
H1 2016 H1 2017
(in millions of euros and %) Revenue
Operating income
recurring OIR margin Revenue
Operating income
recurring OIR margin
Americas 2,185.3 431.2 19.7% 4,250.7 670.4 15.8%
Europe 3,224.4 638.4 19.8% 3,371.2 636.5 18.9%
Asia-Pacific 1,919.7 344.8 18.0% 2,032.6 400.9 19.7%
Middle-East and Africa 288.1 44.5 15.5% 323.8 53.1 16.4%
GAS & SERVICES 7,617.5 1,458.9 19.2% 9,978.3 1,760.9 17.6%
Engineering and Construction 254.3 10.8 4.2% 145.8 (5.6) -3.9%
Global Markets and Technologies 145.7 15.8 10.8% 168.6 17.9 10.6%
Reconciliation - (118.8) - - (117.0) -
TOTAL GROUP 8,017.5 1,366.7 17.0% 10,292.7 1,656.2 16.1%
The operating margin (OIR to revenue) was up +30 basis points on a comparable basis at 16.1% compared with H1 16 adjusted operating
margin. Excluding the energy impact, H1 17 operating margin was up +70 basis points at 16.5% compared to the adjusted H1 16 operating
margin and in line with the Group’s objective to improve profitability.

ACTIVITY REPORT
Appendix
22 FIRST HALF 2017 FINANCIAL REPORT AS OF JUNE 30, 2017 | AIR LIQUIDE
1
Revenue and adjusted 2016 Operating Income Recurring
Adjusted 2016 revenue and operating income recurring are computed as if, on January 1, 2016, Airgas had been fully consolidated and the
divestitures requested by the U.S Federal Trade Commission completed, and Aqua Lung and Air Liquide Welding had been deconsolidated.
(in millions of euros) 1st Half 2016 2016
Revenue 9,734 19,812
Operating income recurring before depreciation and amortization 2,401 4,916
Operating income recurring 1,543 3,189
Operating Margin (a) 15.8% 16.1%
(a) Operating Income Recurring/Revenue
The adjusted 2016 sales figures are reposted hereunder in order to provide a 2016 comparable basis:
Adjusted 2016 Sales
(in millions of euros) Q1 2016 Q2 2016 Q3 2016 Q4 2016 2016
Group 4,857 4,877 4,922 5,156 19,812
Gas & Services 4,668 4,666 4,744 4,930 19,008
Industrial Merchant 2,261 2,271 2,270 2,293 9,095
Healthcare 792 807 813 846 3,258
Americas 1,944 1,957 2,003 2,003 7,907
IM Americas 1,381 1,370 1,381 1,369 5,501
Healthcare Americas 181 186 191 188 746
NB: the figures not shown here above correspond to the published figures and are not concerned by the adjustment from the Airgas acquisition.

ACTIVITY REPORT
Appendix
FIRST HALF 2017 FINANCIAL REPORT AS OF JUNE 30, 2017 | AIR LIQUIDE 23
1 Return on Capital Employed – ROCE
Applied method
Return on capital employed after tax is calculated based on the Group’s consolidated financial statements, by applying the fo llowing ratio for
the period in question:
For the numerator: net profit - net finance costs after taxes for the period in question.
For the denominator: the average of (total shareholders' equity + net indebtedness) at the end of the past three half-years.
The adjusted 2016 ROCE taking into account the acquisition of Airgas for the full year 2016 reached 6.9%. Hence, the ROCE at end of
June 2017 increased +50 bps to adjusted 2016 ROCE.
ROCE H1 2017
(in millions of euros)
H1 2016 (a)
2016 (b)
H1 2017 (c)
ROCE Calculation
Numerator ((b)-(a))+(c)
Net profit after tax before deduction of minority interests 853.0 1,926.7 976.5 2,050.2
Net finance costs (151.7) (389.1) (222.9) (460.3)
Group effective tax rate 23.8% 28.2% 27.9% -
Net financial costs after tax (115.7) (279.4) (160.8) (324.5)
Net profit after tax before deduction of minority interests - Net financial costs after tax 968.7 2,206.1 1,137.3 2,374.7
Denominator ((a)+(b)+(c))/3
Total equity 12,329.7 17,125.0 16,049.0 15,167.9
Net indebtedness 19,859.8 15,368.1 15,610.1 16,946.0
Average of (total equity + net indebtedness) 32,113.9
ROCE 7.4%
ROCE H1 2016
(in millions of euros)
H1 2015 (a)
2015 (b)
H1 2016 (c)
ROCE Calculation
Numerator ((b)-(a))+(c)
Net profit after tax before deduction of minority interests 888.6 1,838.7 853.0 1,803.1
Net finance costs (121.7) (227.1) (151.7) (257.1)
Group effective tax rate 29.2% 26.8% 23.8% -
Net financial costs after tax (86.2) (166.2) (115.7) (195.8)
Net profit after tax before deduction of minority interests - Net financial costs after tax 974.8 2,004.9 968.7 1,998.9
Denominator ((a)+(b)+(c))/3
Total equity 12,150.8 12,770.8 12,329.7 12,417.1
Net indebtedness 7,926.6 7,238.7 19,859.8 11,675.0
Average of (total equity + net indebtedness) 24,092.1
ROCE 8.3%

24 FIRST HALF 2017 FINANCIAL REPORT AS OF JUNE 30, 2017 | AIR LIQUIDE

FIRST HALF 2017 FINANCIAL REPORT AS OF JUNE 30, 2017 | AIR LIQUIDE 25
FINANCIAL STATEMENTS
CONDENSED CONSOLIDATED FINANCIAL
STATEMENTS 27
Consolidated income statement 27
Statement of net income and gains and losses
recognized directly in equity 28
Consolidated balance sheet 29
Consolidated cash flow statement 30
Consolidated statement of changes in equity 32
Accounting principles 34
Notes to the condensed consolidated financial
statements for the half-year ended June 30, 2017 37
STATUTORY AUDITORS’ REVIEW
REPORT ON THE INTERIM FINANCIAL
INFORMATION 47
2

FINANCIAL STATEMENTS
Condensed consolidated Financial Statements
26 FIRST HALF 2017 FINANCIAL REPORT AS OF JUNE 30, 2017 | AIR LIQUIDE
2
FINANCIAL STATEMENTS
Condensed consolidated Financial Statements
FIRST HALF 2017 FINANCIAL REPORT AS OF JUNE 30, 2017 | AIR LIQUIDE 27
2 CONDENSED CONSOLIDATED FINANCIAL STATEMENTS
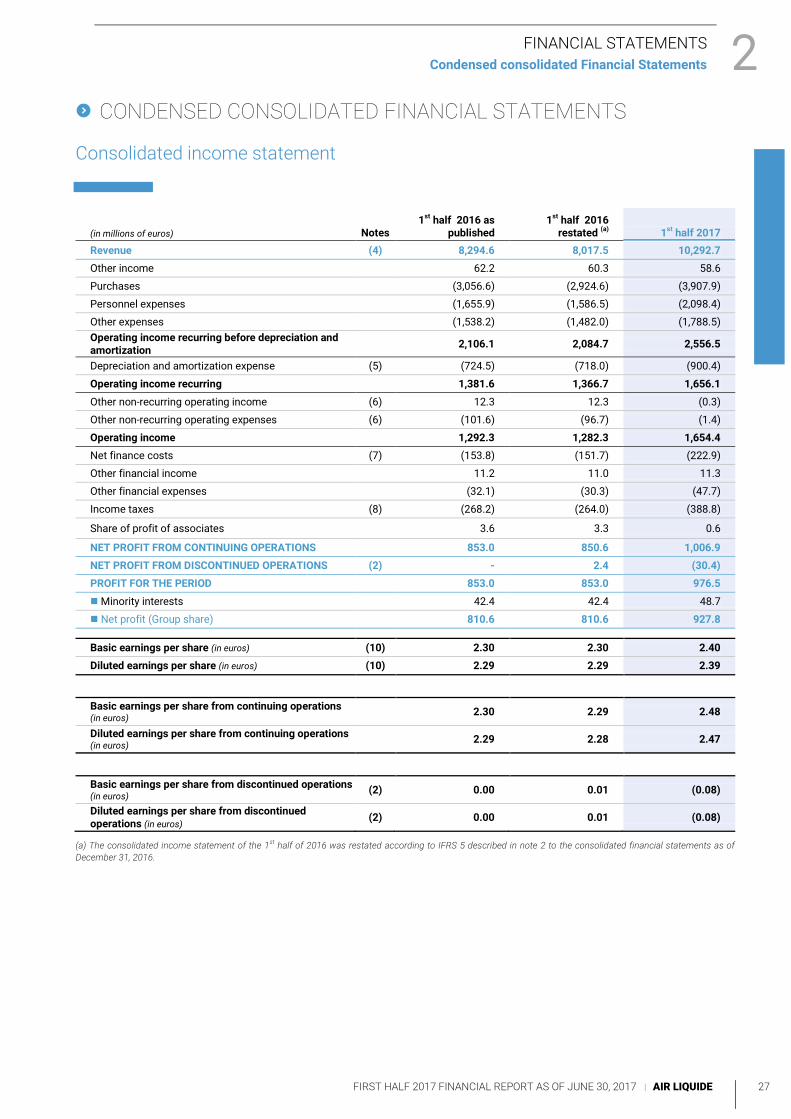
Consolidated income statement
(in millions of euros) Notes 1st half 2016 as
published 1st half 2016
restated (a) 1st half 2017 Revenue (4) 8,294.6 8,017.5 10,292.7
Other income 62.2 60.3 58.6
Purchases (3,056.6) (2,924.6) (3,907.9)
Personnel expenses (1,655.9) (1,586.5) (2,098.4)
Other expenses (1,538.2) (1,482.0) (1,788.5)
Operating income recurring before depreciation and amortization
2,106.1 2,084.7 2,556.5
Depreciation and amortization expense (5) (724.5) (718.0) (900.4)
Operating income recurring 1,381.6 1,366.7 1,656.1
Other non-recurring operating income (6) 12.3 12.3 (0.3)
Other non-recurring operating expenses (6) (101.6) (96.7) (1.4)
Operating income 1,292.3 1,282.3 1,654.4
Net finance costs (7) (153.8) (151.7) (222.9)
Other financial income 11.2 11.0 11.3
Other financial expenses (32.1) (30.3) (47.7)
Income taxes (8) (268.2) (264.0) (388.8)
Share of profit of associates 3.6 3.3 0.6
NET PROFIT FROM CONTINUING OPERATIONS 853.0 850.6 1,006.9
NET PROFIT FROM DISCONTINUED OPERATIONS (2) - 2.4 (30.4)
PROFIT FOR THE PERIOD 853.0 853.0 976.5
Minority interests 42.4 42.4 48.7
Net profit (Group share) 810.6 810.6 927.8
Basic earnings per share (in euros) (10) 2.30 2.30 2.40
Diluted earnings per share (in euros) (10) 2.29 2.29 2.39
Basic earnings per share from continuing operations (in euros)
2.30 2.29 2.48
Diluted earnings per share from continuing operations (in euros)
2.29 2.28 2.47
Basic earnings per share from discontinued operations (in euros)
(2) 0.00 0.01 (0.08)
Diluted earnings per share from discontinued operations (in euros)
(2) 0.00 0.01 (0.08)
(a) The consolidated income statement of the 1st
half of 2016 was restated according to IFRS 5 described in note 2 to the consolidated financial statements as of
December 31, 2016.
FINANCIAL STATEMENTS
Condensed consolidated Financial Statements
28 FIRST HALF 2017 FINANCIAL REPORT AS OF JUNE 30, 2017 | AIR LIQUIDE
2
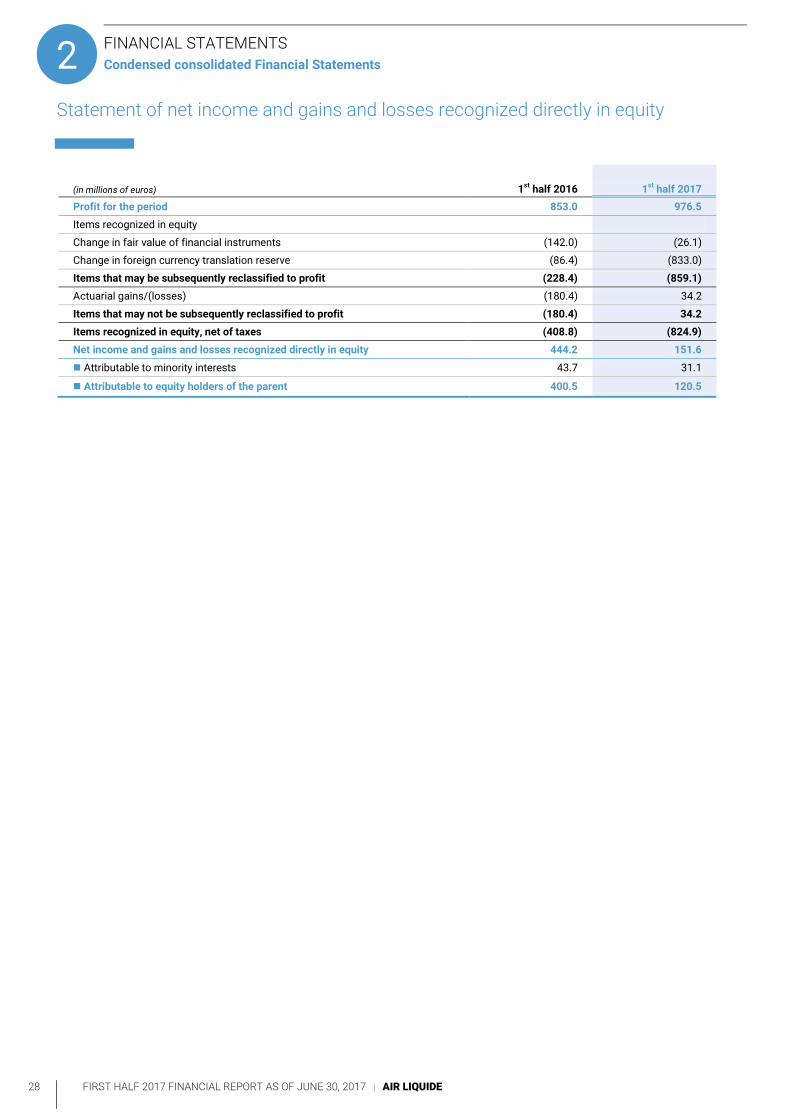
Statement of net income and gains and losses recognized directly in equity
(in millions of euros) 1st half 2016 1st half 2017
Profit for the period 853.0 976.5
Items recognized in equity
Change in fair value of financial instruments (142.0) (26.1)
Change in foreign currency translation reserve (86.4) (833.0)
Items that may be subsequently reclassified to profit (228.4) (859.1)
Actuarial gains/(losses) (180.4) 34.2
Items that may not be subsequently reclassified to profit (180.4) 34.2
Items recognized in equity, net of taxes (408.8) (824.9)
Net income and gains and losses recognized directly in equity 444.2 151.6
Attributable to minority interests 43.7 31.1
Attributable to equity holders of the parent 400.5 120.5

FINANCIAL STATEMENTS
Condensed consolidated Financial Statements
FIRST HALF 2017 FINANCIAL REPORT AS OF JUNE 30, 2017 | AIR LIQUIDE 29
2 Consolidated balance sheet
ASSETS (in millions of euros) Notes December 31, 2016 June 30, 2017
Goodwill (11) 13,889.5 13,298.7
Other intangible assets 1,887.4 1,749.4
Property, plant and equipment 20,115.7 19,156.1
Non-current assets 35,892.6 34,204.2
Non-current financial assets 584.0 619.1
Investments in associates 134.2 122.2
Deferred tax assets 181.9 238.5
Fair value of non-current derivatives 60.1 67.3
Other non-current assets 960.2 1,047.1
TOTAL NON-CURRENT ASSETS 36,852.8 35,251.3
Inventories and work-in-progress 1,323.1 1,361.9
Trade receivables 3,115.0 3,124.1
Other current assets 697.5 746.9
Current tax assets 277.4 102.0
Fair value of current derivatives 53.2 48.0
Cash and cash equivalents (14) 1,523.0 895.0
TOTAL CURRENT ASSETS 6,989.2 6,277.9
ASSETS HELD FOR SALE (2) 275.8 277.4
TOTAL ASSETS 44,117.8 41,806.6
EQUITY AND LIABILITIES (in millions of euros) Notes December 31, 2016 June 30, 2017
Share capital 2,138.8 2,135.2
Additional paid-in capital 3,103.3 3,017.2
Retained earnings 9,767.4 9,739.4
Treasury shares (111.7) (143.3)
Net profit (Group share) 1,844.0 927.8
Shareholders' equity 16,741.8 15,676.3
Minority interests 383.2 372.7
TOTAL EQUITY (a) 17,125.0 16,049.0
Provisions, pensions and other employee benefits (13) 2,592.4 2,461.8
Deferred tax liabilities 2,378.2 2,248.8
Non-current borrowings (14) 14,890.1 13,914.6
Other non-current liabilities 270.6 233.0
Fair value of non-current derivatives 233.7 48.7
TOTAL NON-CURRENT LIABILITIES 20,365.0 18,906.9
Provisions, pensions and other employee benefits (13) 279.5 251.3
Trade payables 2,485.9 2,283.8
Other current liabilities 1,473.3 1,332.8
Current tax payables 144.3 148.2
Current borrowings (14) 2,001.0 2,590.5
Fair value of current derivatives 63.0 85.3
TOTAL CURRENT LIABILITIES 6,447.0 6,691.9
LIABILITIES HELD FOR SALE (2) 180.8 158.8
TOTAL EQUITY AND LIABILITIES 44,117.8 41,806.6
(a) A breakdown of changes in shareholders’ equity and minority interests is presented on pages 32 and 33.
FINANCIAL STATEMENTS
Condensed consolidated Financial Statements
30 FIRST HALF 2017 FINANCIAL REPORT AS OF JUNE 30, 2017 | AIR LIQUIDE
2
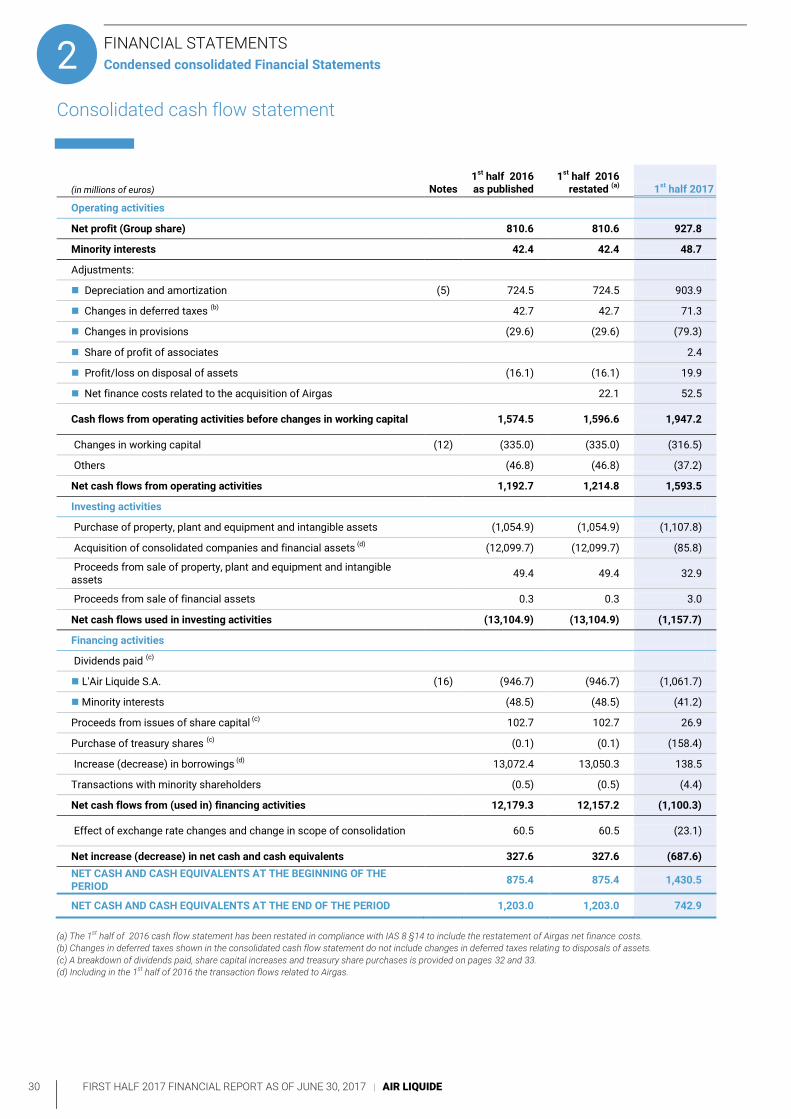
Consolidated cash flow statement
(in millions of euros) Notes 1st half 2016 as published
1st half 2016 restated (a) 1st half 2017
Operating activities
Net profit (Group share) 810.6 810.6 927.8
Minority interests 42.4 42.4 48.7
Adjustments:
Depreciation and amortization (5) 724.5 724.5 903.9
Changes in deferred taxes (b) 42.7 42.7 71.3
Changes in provisions (29.6) (29.6) (79.3)
Share of profit of associates 2.4
Profit/loss on disposal of assets (16.1) (16.1) 19.9
Net finance costs related to the acquisition of Airgas 22.1 52.5
Cash flows from operating activities before changes in working capital 1,574.5 1,596.6 1,947.2
Changes in working capital (12) (335.0) (335.0) (316.5)
Others (46.8) (46.8) (37.2)
Net cash flows from operating activities 1,192.7 1,214.8 1,593.5
Investing activities
Purchase of property, plant and equipment and intangible assets (1,054.9) (1,054.9) (1,107.8)
Acquisition of consolidated companies and financial assets (d) (12,099.7) (12,099.7) (85.8)
Proceeds from sale of property, plant and equipment and intangible assets
49.4 49.4 32.9
Proceeds from sale of financial assets 0.3 0.3 3.0
Net cash flows used in investing activities (13,104.9) (13,104.9) (1,157.7)
Financing activities
Dividends paid (c)
L'Air Liquide S.A. (16) (946.7) (946.7) (1,061.7)
Minority interests (48.5) (48.5) (41.2)
Proceeds from issues of share capital (c) 102.7 102.7 26.9
Purchase of treasury shares (c) (0.1) (0.1) (158.4)
Increase (decrease) in borrowings (d) 13,072.4 13,050.3 138.5
Transactions with minority shareholders (0.5) (0.5) (4.4)
Net cash flows from (used in) financing activities 12,179.3 12,157.2 (1,100.3)
Effect of exchange rate changes and change in scope of consolidation 60.5 60.5 (23.1)
Net increase (decrease) in net cash and cash equivalents 327.6 327.6 (687.6)
NET CASH AND CASH EQUIVALENTS AT THE BEGINNING OF THE PERIOD
875.4 875.4 1,430.5
NET CASH AND CASH EQUIVALENTS AT THE END OF THE PERIOD 1,203.0 1,203.0 742.9
(a) The 1st half of 2016 cash flow statement has been restated in compliance with IAS 8 §14 to include the restatement of Airgas net finance costs.
(b) Changes in deferred taxes shown in the consolidated cash flow statement do not include changes in deferred taxes relating to disposals of assets.
(c) A breakdown of dividends paid, share capital increases and treasury share purchases is provided on pages 32 and 33.
(d) Including in the 1st half of 2016 the transaction flows related to Airgas.

FINANCIAL STATEMENTS
Condensed consolidated Financial Statements
FIRST HALF 2017 FINANCIAL REPORT AS OF JUNE 30, 2017 | AIR LIQUIDE 31
2 The analysis of net cash and cash equivalents at the end of the period is as follows:
(in millions of euros) Notes December 31, 2016 June 30, 2016 June 30, 2017
Cash and cash equivalents (14) 1,523.0 1,315.8 895.0
Bank overdrafts (included in current borrowings) (92.5) (112.8) (152.1)
NET CASH AND CASH EQUIVALENTS 1,430.5 1,203.0 742.9
NET INDEBTEDNESS CALCULATION
(in millions of euros) Notes December 31, 2016 June 30, 2016 June 30, 2017
Non-current borrowings (14) (14,890.1) (11,101.8) (13,914.6)
Current borrowings (14) (2,001.0) (10,073.8) (2,590.5)
TOTAL GROSS INDEBTEDNESS (16,891.1) (21,175.6) (16,505.1)
Cash and cash equivalents (14) 1,523.0 1,315.8 895.0
TOTAL NET INDEBTEDNESS AT THE END OF THE PERIOD
(15,368.1) (19,859.8) (15,610.1)
STATEMENT OF CHANGES IN NET INDEBTEDNESS
(in millions of euros) Notes Year 2016 1st half 2016 as published
1st half 2016 restated (a) 1st half 2017
Net indebtedness at the beginning of the period (7,238.7) (7,238.7) (7,238.7) (15,368.1)
Net cash flows from operating activities 3,696.5 1,192.7 1,214.8 1,593.5
Net cash flows used in investing activities (13,594.3) (13,104.9) (13,104.9) (1,157.7)
Net cash flows used in financing activities excluding changes in borrowings
2,331.5 (893.1) (893.1) (1,238.8)
Total net cash flows (7,566.3) (12,805.3) (12,783.2) (803.0)
Effect of exchange rate changes, opening net indebtedness of newly acquired companies and others
(563.1) 184.2 162.1 561.0
Change in net indebtedness (8,129.4) (12,621.1) (12,621.1) (242.0)
NET INDEBTEDNESS AT THE END OF THE PERIOD
(14) (15,368.1) (19,859.8) (19,859.8) (15,610.1)
(a) The 1st half of 2016 cash flow statement has been restated in compliance with IAS 8 §14 to include the restatement of Airgas net finance costs.

FINANCIAL STATEMENTS
Condensed consolidated Financial Statements
32 FIRST HALF 2017 FINANCIAL REPORT AS OF JUNE 30, 2017 | AIR LIQUIDE
2
Consolidated statement of changes in equity
CONSOLIDATED STATEMENT OF CHANGES IN EQUITY FROM JANUARY 1, 2017 TO JUNE 30, 2017
(in millions of euros) Notes Share
capital
Additional paid-in capital
Retained earnings
(including net profit)
Fair value of financial
instruments Translation
reserves Treasury
shares Shareholders'
equity Minority
interests Total
equity
Equity and minority interests as of January 1, 2017
2,138.8 3,103.3 11,515.5 (126.4) 222.3 (111.7) 16,741.8 383.2 17,125.0
Profit for the period 927.8 927.8 48.7 976.5
Items recognized directly in equity
34.2 (26.1) (815.4) (807.3) (17.6) (824.9)
Net income and gains and losses recognized directly in equity
(a)
962.0 (26.1) (815.4) 120.5 31.1 151.6
Increase (decrease) in share capital
2.5 23.1 25.6 1.3 26.9
Distribution (16) (1,062.5) (1,062.5) (41.2) (1,103.7)
Cancelation of treasury shares (d)
(6.1) (109.2) 115.3
Purchases/Disposals of treasury shares (d)
(158.0) (158.0) (158.0)
Share-based payments 16.1 0.1 16.2 16.2
Transactions with minority shareholders recognized directly in equity
(10.7) (10.7) (1.7) (12.4)
Others (7.6) 11.0 3.4 3.4
EQUITY AND MINORITY INTERESTS AS OF JUNE 30, 2017
2,135.2 (b) 3,017.2 (c) 11,412.8 (152.5) (593.1) (143.3) (d) 15,676.3 372.7 16,049.0
(a) The statement of net income and gains and losses recognized directly in equity is presented on page 28.
(b) Share capital as of June 30, 2017 amounted to 388,222,286 shares at a par value of 5.50 euros. In the 1st half of 2017, movements affecting share capital were as
follows:
creation of 446,525 shares in cash at a par value of 5.50 euros resulting from the exercise of options;
share capital decrease by canceling 1,100,000 shares, bought under the approval of the Combined Shareholders’ Meeting of May 3rd 2017.
(c) During the 1st half of 2017, movements affecting “Additional paid-in capital” were as follows:
decrease in “share premiums” related to capital decrease for -109.2 million euros;
increase in “share premiums” related to capital increase for +23.1 million euros.
(d) The number of treasury shares as of June 30, 2017 totaled 1,531,012 (including 1,428,131 held by L’Air Liquide S.A.). In the 1st half of 2017, movements affecting
treasury shares were mainly as follows:
acquisitions, net of disposals, of 1,506,250 shares;
cancellation of 1,100,000 shares by capital decrease.

FINANCIAL STATEMENTS
Condensed consolidated Financial Statements
FIRST HALF 2017 FINANCIAL REPORT AS OF JUNE 30, 2017 | AIR LIQUIDE 33
2 CONSOLIDATED STATEMENT OF CHANGES IN EQUITY FROM JANUARY 1, 2016 TO JUNE 30, 2016
(in millions of euros) Share
capital
Additional paid-in capital
Retained earnings
(including net profit)
Fair value of financial
instruments Translation
reserves Treasury
shares Shareholders'
equity Minority
interests Total
equity
Equity and minority interests as of January 1, 2016
1,892.9 15.6 10,720.1 60.4 (162.3) (121.0) 12,405.7 365.1 12,770.8
Profit for the period 810.6 810.6 42.4 853.0
Items recognized directly in equity
(180.4) (142.0) (87.7) (410.1) 1.3 (408.8)
Net income and gains and losses recognized directly in equity (a)
630.2 (142.0) (87.7) 400.5 43.7 444.2
Increase (decrease) in share capital
7.8 94.4 102.2 102.2
Distribution (947.9) (947.9) (48.5) (996.4)
Share-based payments 18.8 18.8 18.8
Transactions with minority shareholders recognized directly in equity
(10.1) (10.1) (1.3) (11.4)
Others 0.1 0.1 1.4 1.5
EQUITY AND MINORITY INTERESTS AS OF JUNE 30, 2016
1,900.7 110.0 10,411.2 (81.6) (250.0) (121.0) 11,969.3 360.4 12,329.7
(a) The statement of net income and gains and losses recognized directly in equity is presented on page 28.

FINANCIAL STATEMENTS
Condensed consolidated Financial Statements
34 FIRST HALF 2017 FINANCIAL REPORT AS OF JUNE 30, 2017 | AIR LIQUIDE
2
Accounting principles
The condensed interim consolidated financial statements for the
half-year ended June 30, 2017 include the Company and its
subsidiaries (together referred to as the “Group”) as well as the
Group’s share of associates or joint ventures. The Group’s
consolidated financial statements for the fiscal year ended
December 31, 2016 are available upon request at the Company’s
registered office at 75, quai d’Orsay, 75007 Paris, France or on the
website www.airliquide.com.
BASIS FOR PREPARATION OF THE FINANCIAL
STATEMENTS
The condensed interim consolidated financial statements have
been prepared in accordance with IAS34 “Interim Financial
Reporting”, a standard within the IFRS (International Financial
Reporting Standards), as endorsed by the European Union. They do
not include all the information required for complete annual financial
statements and should be read in conjunction with the Group’s
financial statements for the fiscal year ended December 31, 2016.
No standard, amendment or interpretation being mandatory as of
January 1, 2017, the accounting principles used for the preparation
of the condensed interim consolidated financial statements are
identical to those used for the preparation of the consolidated
financial statements for the fiscal year ended December 31, 2016.
They have been prepared in accordance with IFRS, as endorsed by
the European Union as of June 30, 2017, and with IFRSs without use
of the carve-out option as published by the IASB (International
Accounting Standards Board).
The IFRS standards and interpretations as endorsed by the
European Union are available at the following website:
http://ec.europa.eu/finance/company-reporting/standards-
interpretations/index_en.htm
The Group has not anticipated any standards, amendments or
interpretations published by the IASB but not yet approved or not yet
mandatory in the European Union as of June 30, 2017.
The financial statements are presented in million of euros. They
were reviewed by the Board of Directors on July 27, 2017.
NEW IFRS AND INTERPRETATIONS
1. New standards, interpretations and
amendments endorsed by the European Union
whose application is optional in 2017
The Group financial statements for the half-year ended
June 30, 2017 do not include any potential impacts from the
standards, interpretations and amendments endorsed by the
European Union as of June 30, 2017 for which application is only
mandatory for fiscal years beginning after January 1, 2017. These
texts are as follows:
IFRS15 “Revenue from Contracts with Customers”, issued on
May 28, 2014, including amendments to IFRS15 “Effective
Date of IFRS15”, issued on September 11, 2015.
The impacts of this text on the financial statements are currently
being analyzed. Analysis at the Large Industries business line level
was completed in 2016 and the Group has not identified a
significant impact to be noted in relation to the business line during
the transition to IFRS15;
IFRS9 “Financial Instruments”, issued on July 24, 2014.
2. Standards, interpretations and amendments
not yet endorsed by the European Union
The impacts on the condensed interim financial statements of the
texts published by the IASB as of June 30, 2017 and not yet
endorsed by the European Union are being analyzed. These texts
are as follows:
amendments to IFRS10 and IAS28 “Sale or Contribution of
Assets between an Investor and its Associate or Joint
Venture”, issued on September 11, 2014;
IFRS16 “Leases”, issued on January 13, 2016;
amendments to IAS12 “Recognition of Deferred Tax Assets
for Unrealized Losses”, issued on January 19, 2016;
amendments to IAS7 “Disclosure Initiative”, issued on
January 29, 2016;
clarifications to IFRS15, issued on April 12, 2016;
amendments to IFRS2 “Classification and measurement of
share-based payment transactions”, issued on June 20, 2016;
annual improvements to IFRSs 2014-2016 Cycle, issued on
December 8, 2016;
IFRIC22 “Foreign Currency Transactions and Advance
Consideration”, issued on December 8, 2016;
IFRIC23 “Uncertainty over Income Tax Treatments”, issued on
June 7, 2017.
Additionally, the following texts are not applicable to the Group:
IFRS14 “Regulatory Deferral Accounts”, issued on
January 30, 2014;
amendments to IFRS4 “Applying IFRS9 Financial Instruments
with IFRS4 Insurance Contracts”, issued on
September 12, 2016;
amendments to IAS40 “Transfers of Investment Property”,
issued on December 8, 2016;
IFRS17 “Insurance Contracts”, issued on May 18, 2017.
USE OF ESTIMATES AND ASSUMPTIONS
The preparation of the financial statements requires Group or
subsidiary Management to make estimates and use certain
assumptions which have a significant impact on the carrying
amounts of assets and liabilities recorded in the consolidated
balance sheet, the notes related to these assets and liabilities, the
profit and expense items in the income statement and the
commitments relating to the period-end. Subsequent results may
differ.

FINANCIAL STATEMENTS
Condensed consolidated Financial Statements
FIRST HALF 2017 FINANCIAL REPORT AS OF JUNE 30, 2017 | AIR LIQUIDE 35
2 The significant judgments exercised by the Group or subsidiary
Management in applying the Group accounting policies used in
preparing the half-year condensed consolidated financial
statements, and the main sources of uncertainty in making the
estimates, are identical to those described in the consolidated
financial statements for the fiscal year ended December 31, 2016.
BASIS FOR PRESENTATION AND
MEASUREMENT OF FIRST HALF-YEAR
INFORMATION
The segment information corresponds to the information required
by IAS34 “Interim Financial Reporting”.
The Group’s activities may be affected by significant changes in the
economic situation. Therefore, its interim results are not necessarily
indicative of those to be expected for the fiscal year as a whole.
The income tax expense for the period is calculated by applying the
estimated effective income tax rate for the fiscal year (based on the
information available as of the interim reporting date) to the
different categories of profit.

FINANCIAL STATEMENTS
Condensed consolidated Financial Statements
36 FIRST HALF 2017 FINANCIAL REPORT AS OF JUNE 30, 2017 | AIR LIQUIDE
2
FINANCIAL STATEMENTS
Condensed consolidated Financial Statements
FIRST HALF 2017 FINANCIAL REPORT AS OF JUNE 30, 2017 | AIR LIQUIDE 37
2 Notes to the condensed consolidated financial statements for the half-year
ended June 30, 2017
Note 1 Acquisition of Airgas 38
Note 2 Discontinued operations 39
Note 3 Segment information 40
Note 4 Revenue 41
Note 5 Depreciation and amortization expense 41
Note 6 Other non-recurring operating income and expenses 42
Note 7 Net finance costs 42
Note 8 Income taxes 42
Note 9 Employee benefits 43
Note 10 Net earnings per share 43
Note 11 Goodwill 44
Note 12 Changes in working capital 44
Note 13 Provisions, pensions and other employee benefits 44
Note 14 Borrowings 45
Note 15 Commitments 46
Note 16 Dividend per share 46
Note 17 Related party disclosures 46
Note 18 Contingent liabilities 46
Note 19 Post-balance sheet events 46

FINANCIAL STATEMENTS
Condensed consolidated Financial Statements
38 FIRST HALF 2017 FINANCIAL REPORT AS OF JUNE 30, 2017 | AIR LIQUIDE
2
Note 1 Acquisition of Airgas
FINAL GOODWILL
(in million of euros) As of May 23, 2016
Intangible assets 1,038.9
Property, plant and equipment 3,466.4
Other non-current assets 27.4
Inventories and work-in-progress 375.2
Trade receivables 603.4
Prepaid expenses and other current assets 219.6
Assets held for sale 100.6
Assets measured at fair value on the acquisition date 5,831.5
Provisions and contingencies 442.0
Deferred tax liabilities 911.1
Non-current borrowings 1,757.7
Other non-current liabilities 14.6
Trade payables 226.0
Other current liabilities 175.0
Current borrowings 517.1
Liabilities held for sale 35.6
Liabilities assumed at fair value on the acquisition date 4,079.1
Net assets of Airgas measured at fair value on the acquisition date 1,752.4
Equity in net assets of Airgas acquired 100 %
Cash consideration for the 100% acquired 9,526.1
Final goodwill 7,773.7
Goodwill detailed above is final. It is mainly attributable to the valuation of the assembled workforce, the synergies and the distribution
network. The goodwill is not deductible for tax purposes.

FINANCIAL STATEMENTS
Condensed consolidated Financial Statements
FIRST HALF 2017 FINANCIAL REPORT AS OF JUNE 30, 2017 | AIR LIQUIDE 39
2 Note 2 Discontinued operations
Air Liquide is focused on its Gas & Services activities following the
Group's acquisition of Airgas, as well as on the implementation of
its company program NEOS for the 2016-2020 period. In this
context, the Group had decided at the end of 2016 to divest its
"Other activities" sector, including the Diving and Welding World
Business Lines. After having sold its full stake in Aqua Lung on
December 30, 2016, Air Liquide announced on March 2, 2017 that it
had entered into exclusive negotiations with Lincoln Electric
Holdings, Inc. for the sale of its subsidiary Air Liquide Welding,
specialized in the manufacturing of welding and cutting
technologies.
Both parties having now obtained the necessary regulatory
approvals, the transaction will be completed on July 31st, 2017.
AGGREGATED CONSOLIDATED INCOME STATEMENT
(in millions of euros) 1st half 2016 restated 1st half 2017
Revenue 277.1 171.4
Profit before tax 6.6 0.2
Income taxes (4.2) (1.3)
Gain on disposal / impairment related to fair value measurement of discontinued activities, after tax
(29.3)
NET PROFIT FROM DISCONTINUED ACTIVITIES 2.4 (30.4)
Minority interests 0.5
Net profit (Group share) 1.9 (30.4)
SIMPLIFIED BALANCE SHEET
(in millions of euros) June 30, 2017
Non-current assets 56.2
Current assets 163.9
Cash and cash equivalents 57.3
ASSETS HELD FOR SALE 277.4
(in millions of euros) June 30, 2017
Non-current liabilities (excluding borrowings) 66.1
Current liabilities (excluding current borrowings) 92.7
Current borrowings -
LIABILITIES HELD FOR SALE 158.8

FINANCIAL STATEMENTS
Condensed consolidated Financial Statements
40 FIRST HALF 2017 FINANCIAL REPORT AS OF JUNE 30, 2017 | AIR LIQUIDE
2
Note 3 Segment information
3.1 INCOME STATEMENT FOR THE HALF-YEAR ENDED JUNE 30, 2017
Gas & Services
Engineering &
Construction
Global Markets &
Technologies Reconciliation Total (in millions of euros) Europe Americas
Asia
Pacific
Middle East and Africa Sub-total
Revenue 3,371.2 4,250.7 2,032.6 323.8 9,978.3 145.8 168.6 10,292.7
Inter-segment revenue 119.6 165.8 (285.4)
Operating income recurring 636.5 670.3 400.9 53.1 1,760.8 (5.6) 17.9 (117.0) 1,656.1
incl. depreciation and amortization
(298.5) (354.6) (181.8) (27.5) (862.4) (8.9) (14.8) (14.3) (900.4)
Other non-recurring operating income
(0.3)
Other non-recurring operating expenses
(1.4)
Net finance costs (222.9)
Other financial income 11.3
Other financial expenses (47.7)
Income taxes (388.8)
Share of profit of associates
0.6
Net profit from continuing operations
1,006.9
Net profit from discontinued operations
(30.4)
Profit for the period 976.5
3.2 RESTATED INCOME STATEMENT FOR THE HALF-YEAR ENDED JUNE 30, 2016
The restated information takes into account changes in discontinued operations in accordance with IFRS5, described in note 2 to the
consolidated financial statements as of December 31, 2016.
Gas & Services
Engineering &
Construction
Global Markets &
Technologies Reconciliation Total (in millions of euros) Europe Americas
Asia
Pacific
Middle East and Africa Sub-total
Revenue 3,224.4 2,185.3 1,919.7 288.1 7,617.5 254.3 145.7 8,017.5
Inter-segment revenue 212.4 160.8 (373.2)
Operating income recurring 638.4 431.2 344.8 44.5 1,458.9 10.8 15.8 (118.8) 1,366.7
incl. depreciation and amortization
(295.2) (186.6) (175.8) (26.2) (683.8) (9.4) (13.4) (11.4) (718.0)
Other non-recurring operating income
12.3
Other non-recurring operating expenses
(96.7)
Net finance costs (151.7)
Other financial income 11.0
Other financial expenses (30.3)
Income taxes (264.0)
Share of profit of associates
3.3
Net profit from continuing operations
850.6
Net profit from discontinued operations
2.4
Net profit for the period 853.0

FINANCIAL STATEMENTS
Condensed consolidated Financial Statements
FIRST HALF 2017 FINANCIAL REPORT AS OF JUNE 30, 2017 | AIR LIQUIDE 41
2 3.3 PUBLISHED INCOME STATEMENT FOR THE HALF-YEAR ENDED JUNE 30, 2016
Gas & Services
Engineering &
Construction
Global Markets &
Technologies
Other activities Reconciliation Total (in millions of euros) Europe Americas
Asia
Pacific
Middle East and Africa Sub-total
Revenue 3,224.4 2,185.3 1,919.7 288.1 7,617.5 254.3 145.7 277.1 8,294.6
Inter-segment revenue 212.4 160.8 (373.2)
Operating income recurring 638.4 431.2 344.8 44.5 1,458.9 10.8 15.8 14.9 (118.8) 1,381.6
incl. depreciation and amortization
(295.2) (186.6) (175.8) (26.2) (683.8) (9.4) (13.4) (6.5) (11.4) (724.5)
Other non-recurring operating income
12.3
Other non-recurring operating expenses
(101.6)
Net finance costs (153.8)
Other financial income 11.2
Other financial expenses (32.1)
Income taxes (268.2)
Share of profit of associates
3.6
Net profit for the period 853.0
Note 4 Revenue
Consolidated revenue for the 1st half of 2017 amounted to 10,292.7 million euros, up +28.4% compared to the 1st half of 2016 restated
(8,017.5 million euros).
Excluding the cumulative impact of foreign exchange fluctuations, revenue is up +26.3%.
Note 5 Depreciation and amortization expense
(in millions of euros)
1st half 2016 as published
1st half 2016 restated 1st half 2017
Intangible assets (60.5) (59.4) (86.4)
Property, plant and equipment (PP&E) (a) (664.0) (658.6) (814.0)
TOTAL (724.5) (718.0) (900.4)
(a) Including the depreciation expense after deduction of investment grants released to profit.

FINANCIAL STATEMENTS
Condensed consolidated Financial Statements
42 FIRST HALF 2017 FINANCIAL REPORT AS OF JUNE 30, 2017 | AIR LIQUIDE
2
Note 6 Other non-recurring operating income and expenses
(in millions of euros)
1st half 2016 as published
1st half 2016 restated 1st half 2017
Expenses
Reorganization, restructuring and realignment programs costs (21.4) (18.1) (11.1)
Acquisition and integration costs related to the acquisition of Airgas (73.2) (73.2) (18.7)
Other acquisition costs (2.9) (2.9) (2.2)
Others (4.1) (2.5) 30.6
TOTAL OTHER NON-RECURRING OPERATING EXPENSES (101.6) (96.7) (1.4)
Income
Gain on the disposals of activities (or group of assets) 6.8 6.8 0.5
Others 5.5 5.5 (0.8)
TOTAL OTHER NON-RECURRING OPERATING INCOME 12.3 12.3 (0.3)
TOTAL (89.3) (84.4) (1.7)
In the 1st half of 2017, the Group recognized -11.1 million euros of expenses related to realignment programs, primarily in advanced
economies.
On a restated basis, in the 1st half of 2016, the Group incurred:
capital gains on disposals calculated in accordance with IFRS10 paragraph 25 amounting to 6.8 million euros;
-18.1 million euros of expenses related to realignment programs, primarily in advanced economies.
Note 7 Net finance costs
The average cost of debt stood at 3.1% in the 1st half of 2017 (3.5% for the 1st half of 2016).
Note 8 Income taxes
1st half 2016 as
published 1st half 2016
restated 1st half 2017
Average effective tax rate (%) 24.0% 23.8% 27.9%
The average effective tax rate stood at 27.9% in the 1st half 2017.
In the 1st half of 2016, the average effective tax rate stood at 24.0%, following tax savings related to a decision by the Court of Justice of the
European Union and favorable evolution of several tax audits.

FINANCIAL STATEMENTS
Condensed consolidated Financial Statements
FIRST HALF 2017 FINANCIAL REPORT AS OF JUNE 30, 2017 | AIR LIQUIDE 43
2 Note 9 Employee benefits
The expense recognized for pension and other employee benefits amounted to 68.6 million euros in the 1st half of 2017 and can be broken
down as follows:
(in millions of euros)
1st half 2016 as published
1st half 2016 restated 1st half 2017
Service cost 20.6 20.0 20.8
Interest expense on the net defined benefit liability 13.3 12.7 11.8
Others (a) (27.0) (27.0) -
Defined benefit plans 6.9 5.7 32.6
Defined contribution plans 32.1 30.7 36.0
TOTAL 39.0 36.4 68.6
(a) Impact of plan amendment in the United States in 2016.
Note 10 Net earnings per share
10.1 BASIC EARNINGS PER SHARE
1st half 2016 1st half 2017
Net profit (Group share) attributable to ordinary shareholders of the parent (in millions of euros)
810.6 927.8
Weighted average number of ordinary shares outstanding 352,569,431 386,833,119
Basic earnings per share (in euros) 2.30 2.40
The average number of outstanding shares and net earnings per share for the 1st half of 2016 include the impact of preferential subscription
rights granted to existing shareholders at the time of the capital increase raised in the market by L’Air Liquide S.A. during the 2nd half of 2016.
10.2 DILUTED EARNINGS PER SHARE
1st half 2016 1st half 2017
Net profit used to calculate diluted earnings per share (in millions of euros) 810.6 927.8
Weighted average number of ordinary shares outstanding 352,569,431 386,833,119
Adjustment for dilutive impact of share subscription options 593,202 844,069
Adjustment for dilutive impact of performance shares 489,961 402,636
Adjusted weighted average number of shares outstanding used to calculate diluted earnings per share
353,652,594 388,079,824
Diluted earnings per share (in euros) 2.29 2.39
Diluted earnings per share for the 1st half of 2016 and the average number of outstanding shares include the impact of preferential
subscription rights granted to existing shareholders at the time of the capital increase raised in the market by L’Air Liquide S.A. during the
2nd half of 2016.
All instruments that could dilute net profit – Group share, are included in the calculation of diluted earnings per share.
The Group has not issued any other financial instruments that may result in further dilution of net earnings per share.

FINANCIAL STATEMENTS
Condensed consolidated Financial Statements
44 FIRST HALF 2017 FINANCIAL REPORT AS OF JUNE 30, 2017 | AIR LIQUIDE
2
Note 11 Goodwill
(in millions of euros)
As of December 31,
2016
Goodwill recognized during the
period
Foreign exchange
differences As of June 30,
2017
Goodwill 13,889.5 171.1 (761.9) 13,298.7
During the 1st half of 2017, goodwill recognized mainly included changes related to the final valuation of goodwill related to the acquisition of
the American company Airgas as described in note 1.
The Group performed a review of goodwill as of June 30, 2017 and did not identify any indications of impairment loss.
Note 12 Changes in working capital
The increase in the working capital requirement for 316.5 million euros presented in the consolidated cash flow statement, mainly comes
from:
increase of 399.1 million euros in the working capital requirement of the Gas & Services and Global Market & Technologies activities;
decrease of 76.2 million euros in the working capital resources of the Engineering & Construction activities;
offset by movements in current tax payables and receivables contributing to the decrease of the working capital requirement for
188.4 million euros.
Note 13 Provisions, pensions and other employee benefits
(in millions of euros)
As of December 31,
2016 Increase Utilized Other
reversals Discounting
Foreign exchange
differences
Acquisitions related to business
combination Other
movements As of June
30, 2017
Pensions and other employee benefits
1,771.8 20.8 (49.5) (30.6) (b) (15.8) 2.8 (1.7) 1,697.8
Restructuring plans/ realignment programs
18.6 2.0 (4.0) 0.2 16.8
Guarantees and other provisions related to engineering contracts
58.6 24.1 (7.8) (5.5) (0.9) 68.5
Dismantling 235.0 (0.4) (3.9) 3.7 (4.5) (14.7) (0.5) 214.7
Other provisions (a) 787.9 34.1 (118.2) (18.3) (36.5) 60.6 5.7 715.3
TOTAL PROVISIONS 2,871.9 81.0 (179.9) (27.7) (26.9) (57.5) 48.7 3.5 2,713.1
(a) This heading includes provisions for industrial and tax litigations.
(b) This amount mainly includes actuarial (gains)/losses recognized during the period.
In the 1st half of 2017, no new litigation is likely to have a material
impact on the Group’s financial position or profitability.
Furthermore, the assets covering defined benefit plan
obligations were measured at fair value. The discount rates
used to determine the present value of the Group’s obligations
were also reviewed.

FINANCIAL STATEMENTS
Condensed consolidated Financial Statements
FIRST HALF 2017 FINANCIAL REPORT AS OF JUNE 30, 2017 | AIR LIQUIDE 45
2 Note 14 Borrowings
December 31, 2016 June 30, 2017
Carrying amount Carrying amount
(in millions of euros)
Non-current Current Total
Non-current Current Total
Bonds and private placements 13,750.2 845.7 14,595.9 12,826.9 1,560.0 14,386.9
Commercial paper programs - 638.0 638.0 - 371.3 371.3
Bank debt and other financial debt 1,054.0 507.4 1,561.4 993.5 652.0 1,645.5
Finance leases 10.9 7.8 18.7 9.4 7.2 16.6
Put options granted to minority shareholders 75.0 2.1 77.1 84.8 - 84.8
TOTAL BORROWINGS (A) 14,890.1 2,001.0 16,891.1 13,914.6 2,590.5 16,505.1
TOTAL CASH AND CASH EQUIVALENTS (B) - 1,523.0 1,523.0 - 895.0 895.0
NET INDEBTEDNESS (A) - (B) 14,890.1 478.0 15,368.1 13,914.6 1,695.5 15,610.1
Gross indebtedness (A) decreased by 386 million euros between
December 31, 2016 and June 30, 2017.
The decrease mainly comes from:
the repayment of bond issuance for 250 million euros,
maturing on June 26, 2017;
the lower use of commercial paper program, which amounted
to 371 million euros as of June 30, 2017, down 267 million
euros;
a significant foreign exchange impact, mainly related to the
appreciation of the euro againt the US dollar, lightening the
debt denominated in this currency.
Offset by:
a public bond issue, for 600 million euros, maturing on
March 8, 2027, at a fixed rate, coupon of 1.0%.
This bond issue, performed by Air Liquide Finance S.A. under the
EMTN program was guaranteed by L’Air Liquide S.A., to refinance
the bonds maturing in June 2017 for 250 million euros and in
July 2017, for 500 million euros.
Short-term borrowings (maturing in less than 12 months) (A)
increased by 590 million euros compared to December 31, 2016,
following:
the reclassification to current borrowings of a long-term bond
issue maturing in February 2018 and amounting to
325 million US dollars (equivalent to 285 million euros);
the reclassification to current borrowings of two long-term
bond issues maturing in June 2018 and amounting to
670 million euros;
the increase in bank overdrafts to prevent a liquidity risk.
Cash decreased by 628 million euros, following the dividend
payment in May 2017, and the net debt amounts to 15,610 million
euros, increasing by 242 million euros compared to
December 31, 2016.
The interest rate risk related to the US dollars bond to be issued in
September 2019 was partially hedged during the 1st half of 2017 for
a total amount of 100 million US dollars.
Financial covenants were associated to a long-term loan used by
Air Liquide Yenakievo (Ukraine) with an outstanding amount of
81 million euros as of December 31, 2016. In order to cope with the
consequences of the political environment in the Dombass area
(Ukraine) for Air Liquide Yenakievo, and after signing a first
amendment in 2014, Air Liquide entered into negotiations with the
lending institution and sent a Notification of Political Risk Event. In
2016, the lender recognized the occurrence of a political risk and,
therefore, the guarantor was discharged from its obligations.
The DNR – self-proclaimed Donetsk People’s Republic –exercizes
effective control over certain areas of the Dombass Region,
including the city of Yenakievo. Due to the ongoing armed conflict
and the blockade of railway connections with these areas controlled
by DNR, the main customer of Air Liquide Yenakievo, JSCEMZ, a
subsidiary of the Metinvest Group, stopped its production activities
on February 20, 2017. This event led to full stop of ALY’s production
unit that is located on the territory of JSCEMZ and produces
exclusively for this customer.
On March 2, 2017, the DNR announced having temporarily placed
JSCEMZ and ALY, amongst others, under administrative control. On
March 3, 2017, Air Liquide officially announced that the Group was
no longer able to continue its remaining activities in that region.
Consequently, Air Liquide has lost control over its subsidiary and
ALY is no longer consolidated. The Group’s residual net investment
is reported in non-current financial assets as of June 30, 2017.

FINANCIAL STATEMENTS
Condensed consolidated Financial Statements
46 FIRST HALF 2017 FINANCIAL REPORT AS OF JUNE 30, 2017 | AIR LIQUIDE
2
Note 15 Commitments
There was no significant change in commitments compared to December 31, 2016.
Note 16 Dividend per share
The 2016 dividend on ordinary shares declared and paid on
May 17, 2017 was 1,062.5 million euros (including the additional
premium and tax on dividends), and amounted to 2.60 euros per
share net of tax.
The Amended Finance Act enacted in August 2012 introduced an
additional 3% contribution on cash dividends. L’Air Liquide S.A. is
subject to this tax for dividends paid in May 2017, which amounted
to 30.9 million euros. The Group considers it as a cost associated
with the dividend distribution and has therefore decided to
recognize this contribution cost as a deduction from shareholders’
equity.
Moreover, L’Air Liquide S.A. initiated claims to obtain the
reimbursement of the additional 3% contribution on cash dividends
paid for the years 2013 to 2017 for a total amount of 133.9 million
euros.
Following the decision of the Court of Justice of the European
Union, on May 17, 2017, the Air Liquide group recognized a
receivable with the French State of 133.9 million euros in the
consolidated balance sheet as of June 30, 2017.
A provision for bad debt was recognized pending the decision of the
French Constitutional Council expected in the 2nd half of 2017.
Note 17 Related party disclosures
Due to the activities and the legal organization of the Group, only transactions with executives, associates and joint ventures are considered to
be related party transactions. Transactions performed between the above-mentioned individuals or companies and Group subsidiaries have
not materially changed during the period.
Note 18 Contingent liabilities
To the best of the Group’s knowledge, there is no exceptional event or litigation which has affected in the recent past or which is likely to
materially affect its financial situation or profitability.
Note 19 Post-balance sheet events
There were no significant post-balance sheet events.
FINANCIAL STATEMENTS
Statutory auditors’ review report on the interim financial information
FIRST HALF 2017 FINANCIAL REPORT AS OF JUNE 30, 2017 | AIR LIQUIDE 47
2 STATUTORY AUDITORS’ REVIEW REPORT ON THE INTERIM
FINANCIAL INFORMATION
This is a free translation into English of the statutory auditors’ review report on the half-yearly consolidated financial statements issued in French
and it is provided solely for the convenience of English-speaking users. This report also includes information relating to the specific verification of
information given in the Group’s interim management report. This report should be read in conjunction with and construed in accordance with
French law and professional standards applicable in France.
To the Shareholders,
In compliance with the assignment entrusted to us by your Annual General Meeting and in accordance with the requirements of article
L. 451-1-2 III of the French Monetary and Financial Code (Code monétaire et financier), we hereby report to you on:
the review of the accompanying condensed interim consolidated financial statements of L’Air Liquide S.A., for the period from January 1
to June 30, 2017;
the verification of the information contained in the Interim Management Report.
These condensed interim consolidated financial statements are the responsibility of the Board of Directors. Our role is to express a conclusion
on these financial statements based on our review.
1. Conclusion on the financial statements
We conducted our review in accordance with professional standards applicable in France. A review of interim financial information consists of
making inquiries, primarily of persons responsible for financial and accounting matters, and applying analytical and other review procedures. A
review is substantially less in scope than an audit conducted in accordance with professional standards applicable in France and
consequently does not enable us to obtain assurance that we would become aware of all significant matters that might be identified in an
audit. Accordingly, we do not express an audit opinion.
Based on our review, nothing has come to our attention that causes us to believe that the accompanying condensed interim consolidated
financial statements are not prepared, in all material respects, in accordance with standard IAS34 of the IFRSs as adopted by the European
Union applicable to interim financial information.
2. Specific verification
We have also verified the information given in the Interim Management Report on the condensed interim consolidated financial statements
subject to our review.
We have no matters to report as to its fair presentation and consistency with the condensed interim consolidated financial statements.
Neuilly-sur-Seine and Paris-La Défense, July 28, 2017
The Statutory Auditors
French original signed by
PricewaterhouseCoopers Audit ERNST & YOUNG et Autres
Olivier Lotz Séverine Scheer Jeanne Boillet Emmanuelle Mossé

48 FIRST HALF 2017 FINANCIAL REPORT AS OF JUNE 30, 2017 | AIR LIQUIDE
FIRST HALF 2017 FINANCIAL REPORT AS OF JUNE 30, 2017 | AIR LIQUIDE 49
CERTIFICATION BY THE PERSON RESPONSIBLE FOR
THE FIRST-HALF FINANCIAL REPORT
This is a free translation into English of the certification by the person responsible for the first half financial report and is provided solely for the
convenience of English speaking readers.
PERSON RESPONSIBLE FOR THE FIRST HALF FINANCIAL REPORT
Benoît POTIER, Chairman and CEO of L’Air Liquide S.A.
CERTIFICATION BY THE PERSON RESPONSIBLE FOR THE FIRST
HALF FINANCIAL REPORT
I hereby declare that, to the best of my knowledge, the condensed financial statements for the half-year ended June 30, 2017 have been
prepared in accordance with applicable accounting standards and give a true and fair view of the assets, financial position and the profit of the
Company and the entities included in the consolidation and that the first half activity report, enclosed in Chapter 1, includes a faithful
representation of the major events which occurred during the first six months of the fiscal year, their impact on the financial statements, the
main related-party transactions, and describes the major risks and uncertainties for the remaining six months of the fiscal year.
Paris, July 28, 2017
Benoît Potier
Chairman and CEO
3


Cautionary note regarding forward-looking
statements
This first half financial report contains information on the Group’s prospects, objectives and trends for growth. These forward-
looking statements can be identified by the use of the future tense, conditional or of forward-looking terms such as “consider”,
“intend”, “anticipate”, “believe”, “estimate”, “plan”, “expect”, “think”, “aim”, or, as the case may be, the negative of these words, or
any other terms with a similar meaning. This information is not based on historical data and should not be considered as a
guarantee that the prospects and objectives described will be achieved. These statements are based on data, assumptions
and estimates considered reasonable by the Group as of the date of this first half financial report. They may be affected by
known or unknown risks, uncertainties and other factors which might impact future results, performances and achievements
of the Group in a way that is substantially different from the objectives described. This information might therefore change
due to uncertainties relating notably to the economic, financial, competitive and regulatory environment or due to the
occurrence of certain risks described in Chapter 1 of this first half financial report. This information is given solely as of the
date of this first half financial report. All forward-looking statements contained in this first half financial report are qualified in
their entirety by this cautionary note.

INTERNET
See our annual publications :
Annual Report, Reference Document,
Shareholder’s Guide, Interactions and more…
www.airliquide.com
//
YOUTUBE
Air Liquid Corp Channel
//
@AirLiquideGroup
//
linkedin.com/company/airliquide
DOWNLOAD THE FREE AIR LIQUIDE SHAREHOLDER APP FROM THE APP STORE AND GOOGLE PLAY
(IN FRENCH ONLY)
SERVICES ACTIONNAIRES
L’Air Liquide – Company established for the study and application of processes developped by GeorgesClaude with issued
capital of 2 132 891 915,00 euros
SHAREHOLDER SERVICES
or +33 (0)1 57 05 02 26 From outside France
INVESTOR RELATIONS
+33 (0)1 40 62 51 50
CONTACT US
directly :
CONTACT US
Directly through the Website :
http://contact.shareholders.airliquide.com
SHAREHOLDERS LOUNGE
Open Monday-Friday
From 9:00 am to 6:00 pm (GMT+1)
75, quai d’Orsay 75321 Paris 7e
France