first dissociation constant of succinic acid from o … · first dissociation constant of succinic...
TRANSCRIPT
--------~ -~ -- -
assumptions that probabilities of removing atoms are equal to those found in methane. Unfortunately, one must base such a derivation on the values derived from CHDa that are considered least reliable experimentally.
V. Conclusions
Evans, Bauer, and Beach lead to nearly the same resul ts in CHaD, their assumptions did not seem to be generally applicable to the three spectra CHaD, CH2D2 , and CHDa, necessitating the differen t approach used in this work.
VI. References
[1) J . Delfosse and J . A. Hipple, Phys. Rev. 540, 1060 (1938). [2] M. W. Evans, N. Bauer, and J . Y. Beach, J . Ch ern. Phys.
14,701 (1946). [3) F . L. Moh ler and V. H . Dibeler , Phys. Rev. 72, 158A
(1947). [4] J . Turkevich , L. Friedman, E. Solomon , and F . M .
Wrightson, J. Am. Chern. Soc. 70, 2638 (1948). [5) G. E. MacWood and H. C. U rey, J . Chern. Phys. 4, 402
(1936). [6] W. S. Benedict, K . Morikawa, R. B. Barnes, and H . S.
Taylor, J . Chern. Ph ys. 5, 1 (1937). [7] V. H . Dibeler and F . Cordero, J . Research N BS, publi-
The sensitivities of CH. and CD4 differ by about 2 percent and are probably equal within the experimental uncertainty. The total ionization is apparently the same for CH4, CHaD , and CH2D2• The low value for CHDa is not significant in view of the uncertain ty in this spectrum. The difference in the total ionization of CH4 and CD4, however , is greater than the estimated error ; and since the number of dissociation processes remains the same, the difference is probably a result of the lower probability of dissociating C-D bonds.
Although our experimental results for CHaD are in good agreement with Turkevich et al. and with E van s, Bauer, and Beach , the differen t authors have used somewhat different assumptions in the interpretation of resul ts. Although the assump tions used by
cation pending. i [8] A. E. Finholt, A. C. Bond, Jr., and H . I. Schlesinger, ~
J . Am . Chern. Soc. 69, 1199 (1947). [9) V. H. Dibeler , J . R esearch N BS 44, 363 (1950) RP2083. I
[10) L. G. Smith, Phys. Rev. 51, 263 (1937).
W ASHINGTON, May 5, 1950
Journal of Research of the National Bureau of Standards Vol. 45, No.6, December 1950 Research Paper 2156
First Dissociation Constant of Succinic Acid from 0 0 to 500 C and Related Thermodynamic Quantities
By Gladys D. Pinching a nd Roger G . Bates
The first dissociation co nstant, ](1) of succinic acid was determined at intervals of 5 degrees from 0° to 50° C from measurements of the electromotive force between hydrogen and silver-silver-chloride electrodes in cells without liquid junction. In order to reduce t he correction for "overlapping" of the two acid groups, which are of nearly equal strengths, t he 10 solutions studied cont ained twice a much succini c acid as acid succinate ion. The residual correction of about 0.02 in Jog ](1 was made with the aid of values of the seco nd dissociation constant from an earli er determination.
The first dissociation constant between 0° and 50° can be expressed by
~Iog ]( 1 = 1206.25/ T~ 3.3266 + 1.011697T,
where T is t he absolute temperature, The changes of fr ee energy, heat content, entropy. and heat capacity for t h e first dissociat ion step of succinic acid in the standard state were calculated from the dissociation constant and its temperature coefficient.
I I I
~
I 1. Introduction
A determination of the second dissociation constan t of succinic acid from 0° to 50° was recently reported by the authors [1).1 The two acid groups of this dicarboxylic acid are of nearly equal strengths, and there is considerable overlapping, or simultaneous dissociation . H ence, it was necessary to estimate the fiTst dissociation constant, K 1, in order to compute the ionic concentrations required for an accura te determination of the second dissociation constant, K 2. Values of Kl were therefore calculated from electromotive-force measurements of solutions of sodium acid succinate with added sodium chloride
from 0° to 50° by means of a determination of the product of the two constants [2]. ~
Although adequate for correcting the determination of K 2 , these values of log K J were estimated to have an uncertain ty of ± 0.0l . Hence, it is doubtful if the earlier result for K l are of sufficien t accuracy to warrant the calculation of the heat-content and entropy changes that are of considerable theoretical interest. It seemed desirable to undertake an accurate redetermination of the first dissociation constant in order to obtain reliable information concerning the thermodynamic quantities associated with the first dissociation step.
I Figures in brackets indicate tbe literature references nt tbe end of this paper.
Ten mixtures of hydrochloric acid and sodium acid succinate were prepared , each containing t he
444

TAB LE 1. Electl'omotive force of cell I /Tom 0° to 50°
, 'l'cmpcraturc, 0 C
Tn
0 5 10 J5 20
----v v v v v
0. 09959 0.50441 0.50572 0.50693 0.50818 O. 50929 . 09062 . 50686 .50812 · 50940 .51057 . 51172 08029 . 50964 .5 1107 .51242 .51375 .51500
. 07054 .51290 .514 14 .515 4 .51697 .51831
. 05035 .5211 2 . 52272 · 5242{ . 52574 .52725
. 04983 .52118 .52288 . 52441 . 52592 .52735
. 02977 .53364 .53555 .53737 . 53913 . 54086
. 019875 . 54350 . 54558 . 54751 .5494 5 .5513 1
. 015114 .55020 .55243 . 55446 .55655 . 5584"
. 009890 .56023 .56265 · 56499 . 56728 . 56953
latter at one and one-half t imes the molali ty, m, of the former, and the electromotive force of the cell,
P t; Hz(g, 1 atm), KaH succinate (1.5 m), H OI (m) , AgCl ; Ag, (1)
was measured at intervals of 5 degrees from 0° to 50°. The first dissociation constant of succinic acid was calculated from the experim ental data. Corrections were applied for the amount of bivalent succinate ion formed in t he solut ions by dissociaLion of t he acid succinate ion . The changes of free energy, heat conten t, ent ropy, and heat capacity for the dissociation of 1 mole of succinic acid in the standard state were evaluated from the dissociation constant and its temperature coefficien t.
II. Experimental Procedures and Results
The stock solut ion of hydrochloric acid was prepared by dilution of a portion of rcdistilled acid . The mean deviation of five gravim etric analyses from the mean molality was less than 0.02 percen t.
Sodium acid succinate, prepared from reagentgrade succinic acid and a standard sorlltion of sodium hydroxide, was recrystallized from water with the addition of sufficient sodium hydroxid e to bring the salt to the proper composit ion . After samples of the salt were dried at 110°, they were found to neutralize 100.03 percen t of the theoretical amount of standard alkali . The t itration was carried to pH 8.7 with the use of phenolphthalein and a color standard .
Nitrogen was passed through each buffer solu tion for 2 hI' to remove dissolved oxygen. The cells were filled and placed in the water thermostat where they were kep t at 25° for about 6 hI' to insure initial equilibrium. The emf measurements from near 0° to 25° were mad e on the second day, and from 25° to 50° on t he third, after which the temperature of the thermostat was lowered to 25° for a final measurement . The average difference between the initial and final emf of the 10 cells was less than 0.08 mv, or 0.0013 in log K !. The electrodes were prepared in the same manner as for the determination of the second dissociation constant [1) .
Each emf value, E, given in table 1 is the mean of the poten tials between two pairs of elec t,rodes in the
25 30 35 40 45 50
v v v v v v 0.51035 0. 51145 O. 51250 0.51351 O. 51448 O. 51537 . 51290 .51399 .51503 .51620 .517 15 . 51804 .51622 .51740 .51853 .51958 .52073 .52165 . 51954 .52078 .52182 .52302 .5240 .52523 . 52861 . 52999 .5-1133 · 53262 .53392 .53500
. 52888 .53022 .53160 · 53292 .53418 .53547
.54248 .54410 . 54 569 · 54724 . 5487 .55024
.55320 .5,)<]98 .55670 .558.36 .56007 . 56171
. 56054 . 56238 .56430 .56623 .56804 . 56969
. 5717'1 .57383 . 57593 .57797 . 5799J . 58190
same cell . The molality, m, of hydrochloric aeid appears in the first column.
III. Calculation of the Dissociation Constant
'Withdrawal of electrical energy from cell I cause the following electrochemical reaction to take place:
~f H 2(g, ] atm) + AgCl (s)= Ag (s) + H++ CI-. (1)
The initial, J'C'\Tersible po ten tial of the cdl depend upon the extent to which the system is displaced from the equilibrium condition , that is, upon the difference bctween the reaction quotient, 0, an.d cq uilibl'ium constant, 0., for reaction 1. If the usual conven tions regarding the standard state with respect to which activi ty, a, is measured arc obsCl'ved, we may wl'i te
(2) and
D.F= RT ln Q/Q. = D.Fo+RT ln Q. (3)
In eq 3, D.F is the molal free-energy change in reaction 1 for any particular state of the system and D.Fo is the corresponding quantity for unit activitie of reactants and products.
Inasmuch as the solution is well buffered, the hydrogen ion form ed by react ion 1 is largely u t ilized in converting acid succinate ion (HS uc-) into molecular succinic acid (H zSuc). The equilibrium between these constituents of the solution is the first dissociation of succinic acid:
(4)
The activity of hydrogen ion is fixed by the activities of the two succinate species and by the first dissociation constant, K I , of succinic acid. H ence, Q can be written
(2a)
As only electrical work is of concern here,
D.F=-EF, (5)
and (5a)
445
-----------------~--~-
In eq 5a, EO is the standard potent~al C?f reaction 1 [3 , 4] 2, and F is the faraday. SubstltutlOn of eq 2a, 5, and 5a in eq 3 and rearranging gives
(6)
where j is an activity coefficient on the molal scale. In cell I, mCl = m.
If eq 6 is compared with the mass-law expression for the first dissociation (eq 4) in logarithmic form, it is seen that the portion of eq 6 enclosed in brackets actually represents the value of - log(jHjclmH) in the particular solution .for whic~ the eI?f, E, was me~sured. For convemence, this expenmental quantity will be called pwH.
The last term of eq 6 cannot be evaluated exactly without a knowledge of K j • · However, in agreement with the predictions of the Huckel equation [5],. similar activity-coefficient terms for a number of weak monobasic acids have been found to be small and to vary line~rly with i~nic ~tren~th: By definition this term lS zero at mfirnte dilutlOn. Hence, log 'K 1 at zero ionic strength was evaluated by extrapolation of log K; , the value of log K l calculated by eq 6 with the last term set equal to zero.
The computation of the next to the last term on the right of eq 6 may be quite di~c~t for syst~ms with two or more overlappmg eqmhbna. The dIfficulty is aggravated if one group is moderately strong and the concentration of hydrogen ion is consequently an appreciable fraction of the ion!c .stre~gtJ;1. Although the ratio of Kl to K 2 for succmlC aCld IS only 26 and overlapping is considerable, neither dissociation constant exceeds 10- 4, and the hydrogenion correction was readily evaluated.
When sodium acid succinate is dissolved in a solution of hydrochloric acid, as in the preparation of the buffer solutions used in this 'study, the reaction between hydrogen ion and acid succinate ion does not go to completion because of the small (but appreciable) dissociation of the molecular succinic acid formed (eq 4). Furthermore, the second dISSOciation constant is not small enough, nor the hydrogen-ion concentration large enough, to prevent the dissociation of a part of the acid succinate ion,
(7)
It can be shown that the molalities of succinic acid and acid succinate ion remaining at equilibrium are given by the following equations:
(8) and
mHsuc-= 0,5 m+ mH-2 msuc-. (9)
The concentrations of the constituents of the cell solutions were so chosen that the concentration of
, R eference [4jlists E O and 2.3026RT/F in absolute volts.
succinic acid was about twice that of the acid succinate ion. In tIllS way overlapping, as evidenced by the magnitude of msuc=, was reduced. It should be emphasized, however, that this device is not always advantageous, for mH, which usually cannot be measured accurately, is inevitably increased.
Values of m~, a quantity that approaches the true hydrogen-ion molality, mH, as the ionic strength decreases, were computed from pwH by
- log m~=pwH-2A.v;/ (1 + 7 B.y'jJ. (10)
The coefficient 7 in the denominator of the last term is the value found most suitable to describe the activity-coefficient term in mixtures of primary and secondary sodium succinates [1], and A and Bare constants of the Debye-Huckel theory.
An exact expression for msuc- is the following:
msUC- = K 2mHSUC- (antilog pwH) (fHsuc-jcdfsuc-)' (11)
If the activity coefficients arc again estimated by the the Debye-Huckel equation, an expression for m~uc- is obtained:
log m~uc- = log K 2 + 10g mHSUC-+
pwH+ 2A j1. / (1 + 7B.v;). (12)
Inasmuch as the dissociation constant is obtained by extrapolation to infinite dilution where uncertainties in the estimation of activity coefficients disappear, m~ and m~uc- were used for mH and msuc- in eq 8 and 9. The ionic strength is given by
(13)
The ionic concentrations required in eq 6 were accordingly calculated by eq 8, 9, 10, and 12 with the aid of the values of K 2 obtained in the earlier study [1] . The ionic strength needed to compute m~ and m~uc- was obtained by arithmetic approximations. Both acid groups of succinic acid are fairly weak, and m~ was only 1.6 percent of m for the most dilute solution studied. The extent of overlapping was greatest for the most concentrated solution, in which m~uc- amounted to about 1.5 percent of m.
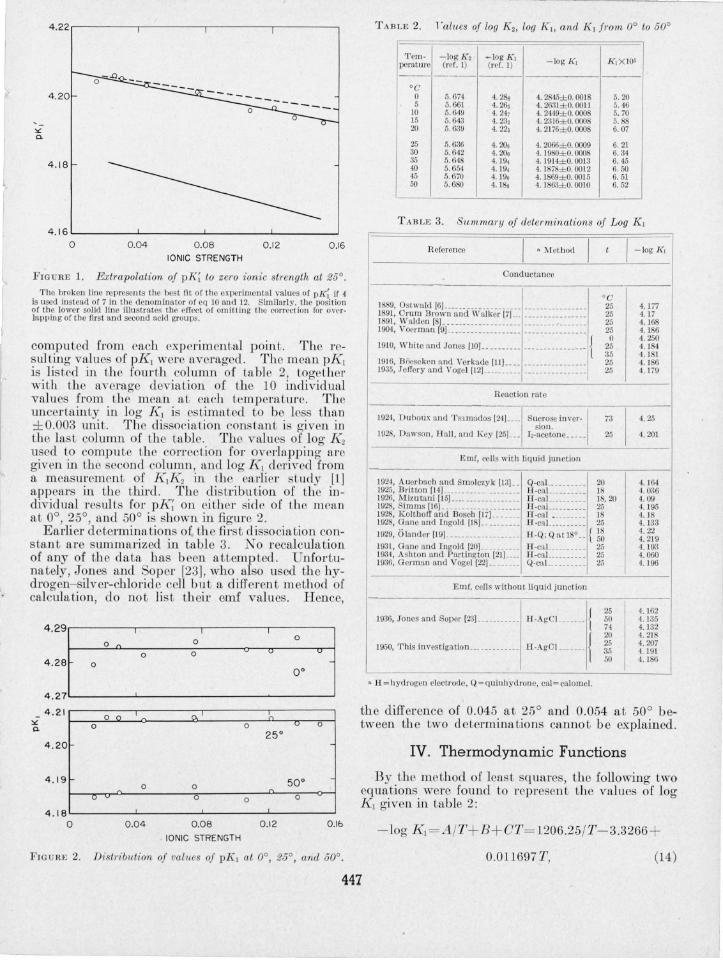
Figure 1 illustrates the effect of the K 2 correction and of the method of estimating the activity coefficients on the determination of K 1 • The circles and upper solid line (drawn by inspection) represent the final corrected values of pK~ (- log K~). If the correction for bivalent succinate ion had been omitted the lower solid line would have resulted, and the val~e of pKI found would have been about 0.02 unit too low. If 4 had been chosen instead of 7 as the coefficien t of the B.v; term in the denominator of eq 10 and 12, the extrapolation would have followed the broken line. However, the two upper lines converge satisfactorily, and the value of pKl at zero ionic strength would not have been altered.
The slopes, - (3, of the plots of pK~ versus }J. were measured for each temperature and (3}J. added to pK~
446
\
4.22.---------.---------.---------,--------.
r 4 .20
4. 18
4 . 16 ~ ________ ~ ________ ~ ________ ~ ______ ~
o 0 .0 4 0.08 0.12 0.16 IONIC STRENGTH
FIG URE 1. Extmpolation of pK; to zero ionic stl'ength at 25° . The hroken line represents Lhe best fit o f the ex perimental values of pI~ if 4
Is used instead o f 7 in the dcnom inator of cq )0 a nd 12. Similarl y. thc posit ion of the lower solid lin e illu sLra tes Lhe cffect of omitting Lhe correction for overlapping of thc first and secon d acid groups.
compu ted from each experimental point. The resulting values of pK1 were averaged. The mean pKI is li ted in the fourth column of table 2, together with the average deviation of the 10 individual values from the mean at each temperature. The uncertainty in Jog Kl is estimated to be Ie than ± 0.003 unit. The dissociation con tant is given in the last column of the table. The value of log K2 used to computc the correction for ove rlapping arc given in the second colunm, and log K, derived from a measurement of K 1K2 in the earlier study [1] appears in the third. The d istribution of the individ ual resulLs for pK~ on either side of the mean at 0°, 25°, and 50° i shown in figure 2.
Earlier determinations of the first dissociation constant are summarized in table 3. No recalculation of any of the data ha b een attemp ted. Unfortunately, Jone and Soper [23], who also used the hydrogen- silver-chlorid e cell but a different method of calculation, do not list their emf values. Hence,
:::r 0 0 0 0 ~ 0::. 0 1 4 . 27L---------L-----------------~~------~
4.21
4.20
4. 19
4 . 18 o
° ° 0
n o v
-'"
0 0
0
0.04 0 .08
IONIC STRENGTH
(-, 0 v 0
25°
50°
0 0
0.12 O.lb
FIG URE 2. Distl'ibution of values of pK, at 0°, 25°, and 50°.
TABLE 2. ralues of log K 2, log K I , and K l f l'om 0° to 50°
rrem· - log [(, - log ] (1 -log f(l J(,XIO' perature (ref. I) (ref. I ) -- ------
°C 0 5.674 4.28, 4. 2845±0. OO t 5. 20 5 5.661 4. 26, 4. 2631±0. 0011 5. 46
10 5.649 4.24, 4. 2449±0. 000 5.70 15 5.643 4.23, 4. 23IB±0. 0008 5. 88 20 5.639 4.22, 4. 217B±0. 0008 6. 07
25 5.63B 4.20. 4. 2066±O. 0009 B.21 30 5.642 4.200 4. 1980± 0. 0008 B.34 35 5.648 4. 19, 4. 1914± 0. 0013 6.45 40 5.654 4. 19, 4. 1878±0. 0012 B. 50 45 5.670 4. 19, 4. 18B9±0. 0015 B.51 50 5.6S0 4. IS, 4. IS63± O. 0010 B.52
TABLE 3. Summary of determinations of Log K I
R eferen ce • M ethod
Conductance
°C IS89, Ostwald [Bl ____ __ ______________ ________________ 25 IS91 , Crum Brown a nd Walkcr [71 __ . ________________ 25 1891, W alden [81. ______ _____________ __ ______ ~_______ 25 1904, Voerman [91 __ __ _______________ ________________ 25
19tO, Wbiteand Jones [lOJ __ ________ -------------- -- { 5~ 1916. B iieseke n a nd Verka de [111 ____ ________________ 25 1935, Jeffery a nd Vogel [121__________ ________________ 25
Reaction rate
1924, DllbollX a nd T soma.dos [241 ----i.s llcl'ose in \-er- I 8100.
1028, Dawson, lIa ll , and K ey [251 ___ I ,-acetone ___ __
Emf, cells with JiQuid jun ction
73
25
1924, Auer bach a nd molczy k [131 __ 1925, Britton [141 _________________ __ 1926, Mizu tani [15J ________________ __ 1928, Simms [lBJ __________________ __
Q-cal.. ________ 20 lI-cal.. ________ 18 IT-onL. ________ IS, 20 IT-caL.________ 25
1928, Koltboff a nd Bosch [171 _____ __ 1925, Gane a nd Ingold [181 ________ __ 1929, Olander [191 __________________ _
1931, Gane a nd Ingold [201 ________ __ 1934, Ashton a nd Partington [211 __ __ 1936, Germa n and Vogel [221 ______ __
IT-ca l __ _______ IS II -c~L________ 25
II-Q; Q at 18° -- { 1~ IT-caL ________ 25 H -caL ________ 25 Q-cal.. ________ 25
Emf, cclls wit hout liquid junction
1936, Jones a nd Soper [23J ___________ II-AgCL _____ { ~~ 74
1950, T his investigation ____ ____ _____ .EI-AgCI. ______ { ~~ 50
• H = hydrogen electrode , Q =q uinhydl'onc, cal=calomcl.
I - log f(l
4.177 4. 17 4. 168 4. IS6 4.250 4. 184 4. 1S1 4. 186 4. 179
4.25
4. 201
4.164 4.036 4.09 4.195 4. 18 4. 133 4.22 4.219 4.193 4. 060 4. 196
4. 162 4. 135 4.132 4. 218 4.207 4. 191 4. 1S6
the difference of 0.045 at 25° and 0.054 at 50° between the two determinations cannot be expla ined.
IV. Thermodynamic Functions
By the method of least square, the following two equations were found to rep resent the values of log K 1 given in table 2:
- log K 1=A/T + B + CT= 1206 .25/T-3.3266 +
0.01l697T, (l4)
447
L
and
- log KI = A*/ T + B* + C* log T
= 2462.9/ T - 47.9882 + 17.755 log T. (15)
The first has the form of the rquation proposed by Harned and Robinson [26] to exprcss dissociation constants as a function of temperature. It is based upon the observation that t;,.F0 is a quadratic function of T, whereas the second equation presupposes that t;,Ho is a linear function of T. By differentiation of eq 14 and 15 with respect to temperature, two expressions for the temperature coefficien t of log Kl are obtained:
and d log K ddT= 1206.25/T2-0.0ll697,
d log K 1/dT= 2462.9 /T 2-7.7108/T.
(14a)
(15a)
The corresponding second derivatives are:
(14b)
and
(15b)
The changes of free ener:gy, (t;,FO), heat conten t (t,.FJO ), entropy (68°), and heat capacity (t,. 0;) for the ionization process in the standard state were calculated by th e following formulas :
6FO= - 2.3026RT log K l , (16 )
6Ho= 2.3026RT2(d log K ddT), (1 7 )
68°= 2.3026R[log K l + T (d log K ddT)],
60;= 2.3026R[2TCd log K I/dT) + T 2Cd2 log K 1/dT2 )].
(18)
(19)
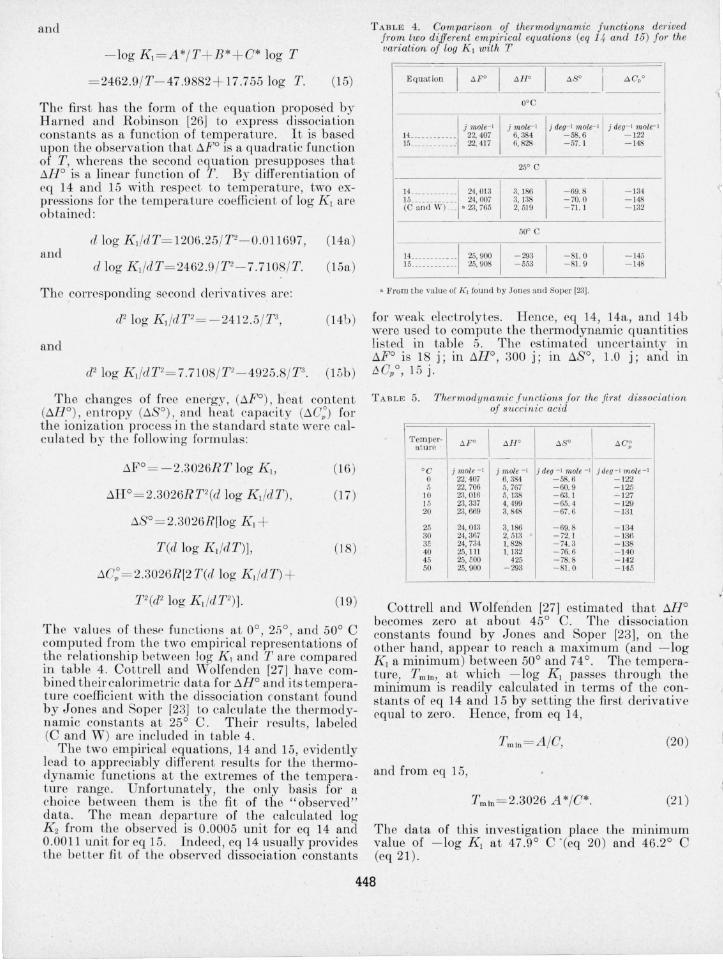
The values of thes8 func tions at 0°, 25°, and 50° C computed from the two empirical representations of th e relationship between log Kl and T are compared in table 4. Cottrell and Wolfenden [27] have combined their calorimetric data for 6Ho and its temperature coefficient with the dissociation constant found by Jones and Soper [23] to calculate the thermodynamic constants at 25° C. Their results, labeled (C and W) are included in table 4.
The two empirical equations, 14 and 15, evidently lead to appreciably differ ent results for the thermodynamic functions at the extremes of the tempera· ture range. Unfortunately, the only basis for a choice between them is the fit of the" observed" data. The mean departure of the calculated log K 2 from the observed is 0.0005 unit for eq 14 and 0.0011 unit for eq 15. Indeed, eq 14 usually provides the better fi t of the observecl dissociation constants
T ABLE 4. Comparison of theTmodynamic functions derived from two different empirical equations (eq 14 and 15) for the variation of log ](\ with T
I I I I
Equation DoFo I!.I {O tJ.so I A Cpo
----OOG
1 j mOle-II j mole- I 1 j deg-I mole- I I j deg- I mole- I
14 •... _....... 22,407 6,384 -58.6 - 122 15 ... _ ....... c 22,417 6,828 -57.1 - 148
I
25° C
-
1 1 I 14 ............ 1 24, 013 3,186 -69.8 - 134 15... . .. .. .... 24,007 3, 138 -70.0 -148 (G and \-1' ) ... . 23,765 2, 519 -71. 1 -132
50° C
14 ________ · __ ·1 25,900
1
-293
I -81.0
1
- 145 15 __ . ________ . 25,908 -553 -81.9 - 148
• From the value of J(I fou nd by Jones and Soper [23].
for weak electrolytes. Hence, eq 14, 14a, and 14b were used to compute the thermodynamic quantities listed in table 5, The estimated uncertainty in t,.Fo is 18 j; in t,.Ho, 300 j; in t,.8°, l.0 j; and in ~ C'P°, 15 j,
T ABLE 5. Thennodynamic functions for the first dissociation of succinic acid
°C j mole -\ j mole -I j lieu -I mol. -I j deg -I mole-I 0 22,407 6,384 -58.6 - 122 .1 22,706 5, 767 - 60.9 - 125
10 2,3,016 5, 138 -63. 1 - 127 15 23,337 4.499 -65.4 - 129 20 23,669 3,848 -67.6 -131
25 24,013 3, 186 -69.8 - 134 30 24,367 2,513 -72.1 - 136 35 24,734 1,828 - 74.3 - 138 40 25, III 1, 132 - 76.6 - 140 4" 25, 000 425 - 78. 8 -142 50 25,900 -293 -81. 0 - 145
Cottrell and Wolfenden [27] estimated that 6Ho becomes zero at about 45° C. The dissociation constants found by Jones and Soper [23], on the other hand, appear to reach a maximum (and - log KI a minimum) between 50° and 74°, The temperature, Tm tn , at which - log Kl passes through the minimum is readily calculated in terms of the constants of eq 14 and 15 by setting the first derivative equal to zero. Hence, from eq 14,
Tm tn = A /C, (20)
and from eq 15,
Tm1n = 2.3026 A */0*. (21 )
The data of this investigation place the minimum value of - log K I at 47.9° C ' Ceq 20) and 46.2° C Ceq 21 ),
448
~
I
1
i
r
V. References
[1] G. D . Pinching and R. G. Bates, J . Hesearch N BS <l5, 322 (1950) RP2142.
[2] R. G. Bates, J . Am. Che m. Soc. 70, 1579 (1948) . [3] H . S. H arned and R. W. Ehle rs, J . Am. Chem. Soc. 55 ,
2179 (1933) . [4] R. G . Bates and G. D. Pinching, J . Research NBS <l2,
419 (1949) HP1982. [5] E . Hi.ickel, Physik. Z. 26,93 (1925). [6] W. Ostwald , Z. physik. Chern. 3, 241 (1889). [7] A. Crum Brown and J . Wa lker, Ann. 261 , 107 (1891). [8] P . Walden , Z. physik. Chem. 8,433 (1891 ) . [9] G. L. Voerman , R ec. t rav. chim. 23, 265 (1904).
[1 0] G. F. White and H. C. Jones, Am. Chem. J . 44, 159 (1910) .
[11] J . Boeseken and P . E . Verkade, Rec. t rav. chim . 36, 167 (1916).
[12] G. H. J effer y and A. 1. Vogel, J . Chem. Soc., 21 (1935). [13] F. Auerbach and E . Smolczyk, Z. physik. Chem. 110,
65 (1924) . [14] II. T. S. Britton, J. Ch ern . Soc. 127, 1896 (1925) .
Journal of Research of the National Bureau of Standards
[15] M. Mizutani , Z. physik. Chem. 118, 318 (1926). [16] H. S. Simms, J. Phys. Che m. 32, 1121 (1928) . [17] I. M. 'I(oltholf and W. Bosch, Ree. t rav. chim. 47, 861
(1928). [1 ] R. Gane a nd C, K. Ingold, J . Chem. oc. 1594 (192 ). [1 9] A. Olander, Z. phys ik . Chem. A1H, 49 (1929 ). [20] R. Ga ne and C. Ie. I ngold , J . Chem. Soc. 2153 (1931). [21] H. W. Ash to n a nd J. R. Partingt.on , Trans. Faraday
Soc. 30, 598 (1934). [22] W. L . Ge rma n and A. I. Vogel, J . Am . Chem. Soc. 58,
1546 (1936). [23] 1. Jones and F . G. Soper, J . Chern. Soc. 133 (1936). [24] M. Duboux a nd D . Tsamados, H elv . chim. Acta 7, 855
(1924) . [25] H . M. Dawson , G. V. HaiJ , a nd A. K ey, J . Chern. Soc.
2844 (1928). . [26] H . S. H a rned and R. A. Robinson, Trans. Faraday Soc.
36, 973 (1940). [27] T. L. Cott relJ ann .J. H . Wolfe nden , J. Che m. Soc. 1019
(1948).
1,V'ASHI NGTON, ,J ULY 6, 1950.
Vol. 45, No. 6, December 1950 Research Paper 2157
Effects of Prior Static and Dynamic Stresses on the Fatigue Strength of Aluminum Alloys
By John A. Bennett and James L. Baker
T es ts made on specimens of Alclad 24S- T sheet sh owed that prior static load had a marked effect on t he fa t igue strength in unidirectional bending when t he stress amplitude wa relatively mall. F rom tests on bare 24S- T sheet, i t was found that a few cy cl es at a s tress ampli tude of 17,000 Ib/in .2 resulted in a la rge in crease in t he fat igue life at 20,000 lb/in .2 Damage tests for other co mbinations of st ress amplitu des indicated tha t the damage was nearly a linear fun ction of ra tio of the number of cyclcs at a give n s t ress to t he num ber that would cause fa ilure at that tress. A new design of specimen and a new form of st ress versus number of cycles to fractul'e (S-N ) diagram are descri bed.
1. Introduction
The phenomenon of fatigue failure in m etals remains incompletely understood, despite the extensive research that has been done on the subj ect. In particular, the mechanism by which a small volume of metal is damaged by repeated stressing until a crack forms may be considered one of the outstanding mysteries in the mechanical behavior of materials. The purpose of the work reported in this paper was to evaluate some of the factors involved in this damaging process by using aluminum alloy specimens. As there appears to be no reliable means of measuring fatigue damage except by a fatigue test, this evaluation was carried out largely by means of tests at two stress levels.
Many investigators have r eported experimental da ta showing the effect of dynamic stressing at one amplitud e on the fa tigue s trength at a second amplitude, but the data for aluminum alloys are not in good agreement. Miner [1] 1 found in testing 24S-T that the damage was proportional to the cycle ratio 2
within the experimental elTOl'. On the other hand, 1 Figures in brackets ind icate the literature references at the end of this paper. , Cycle ralio is defined as the rat io of the number of cycles at a given stress
am pJi tude to the 11um ber necessary to cause fail ure at that am plitude. Failure may be defined as either the beginning of a crack or complete fracture.
Stickley [2 , 3] repor ted tha t the fatigue strengLh of 17S-T rod could be increased by prestressing at a stress amplitude slightly below th e tes t st ress . Likewise, Work & Dolan [4] found an increase in fatigue life due to stressing at small amplitudes . However, Dolan, Richart, and Work [5] found for 17S-T that the fatigue life under gradually varying load cycles was greater when the minor stress amplitude was 18,000 lb/in.2 than when it was decreased to 16,000 lb/in.2
These resul ts do not give any consistent picture of the progress of fatigue damage in aluminum alloys, and it, was the purpose of this work to evaluate this progress in much the same way that it was done for SAE X4130 steel in th e investigation reported in [6].
One of th e most interesting phenomena associated with fatigue is the improvement due to understressing. In ferrous materials this improvem ent increases as the amplitude of th e und erstress approaches the fatigue limi t. Aluminum alloys have no fatigue limi t, and the effect of understressing is not so marked , but it is known to cause an increase in fatigue strength und er certain conditions. It seemed reasonable tha t during the course of a fatigue test at r ela tively low stress th ere must b e a reversal in the
910302- 50--2 449