firm valuation effects of the expatriation of u.s ... · firm valuation effects of the expatriation...
TRANSCRIPT

Firm Valuation Effects of the Expatriation of U.S. Corporations to Tax Haven Countries
C. Bryan Cloyd University of Illinois at Urbana-Champaign
Lillian F. Mills University of Arizona
and
Connie D. Weaver
The University of Texas at Austin
October 2002
Comments welcome. [email protected], [email protected], [email protected] We appreciate helpful insights from Dennis Chambers, Howard Engle, Chris Finnerty, Christopher Ocasal, and Chad Munz. Lillian Mills appreciates research funding from the Stevie Eller Accounting Research Fellowship. Troy Compardo and Shane Heitzman provided valuable research assistance.

1
INTRODUCTION
The past year has witnessed a handful of high profile examples of U.S. multinational
corporations undertaking “corporate inversion” or “expatriation” transactions. Inverting firms
claim to save millions of U.S. tax dollars by moving the legal domicile of their parent
corporation to a foreign country, typically a tax haven country like Bermuda. For example,
Ingersoll-Rand expects to save at least $40 million annually in U.S. income taxes; Cooper
Industries expects an annual tax savings of $54 million, and before abandoning their inversion
plans, Stanley Works expected a $30 million annual savings (Johnston 2002a). In general, these
tax savings derive from the avoidance of U.S. tax on income earned outside the U.S and from
shifting U.S. earnings offshore. These claims have elevated public and legislative concern that
the expatriation trend could continue. Politicians have responded to these transactions by
questioning the patriotism of firms that reorganize outside the U.S. and by introducing proposed
legislation designed to prevent corporate inversions.1
It is possible that recent inversion activity is symptomatic of larger problems with U.S.
tax rules governing international transactions and that, from the perspective of U.S. multinational
corporations, an inversion transaction is a “final solution” to growing frustration with these rules.
A recent study conducted by the National Foreign Trade Council (NFTC) examines U.S.
1 Examples of the recent proposed legislation are the following: Reversing Expatriation of Profits Offshore (REPO) Act (S. 2119) introduced by Senators Baucus and Grassley; the Corporate Patriot Enforcement Act of 2002 (H.R. 3884), introduced by Representative Neal; To Amend the Internal Revenue Code of 1986 to Treat Nominally Foreign Corporations Created through Inversion Transactions as Domestic Corporations, introduced by Representative McInnis as H.R. 3857 and by Senator Wellstone as S. 2050; the No Tax Breaks for Corporations Renouncing America Act of 2002 (H.R. 4993), introduced by Representative Doggett; the American Competitiveness and Corporate Accountability Act (H.R. 5095) introduced by Representative Thomas; To amend the Internal Revenue Code of 1986 to prevent corporations from avoiding the United States income tax by reincorporating in a foreign country (H.R. 3922), introduced by Representative Maloney; To amend the Internal Revenue Code of 1986 to impose a moratorium on the ability of United States corporations to avoid the United States income tax by reincorporating in a foreign country (H.R. 4756), introduced by Representative Johnson.

2
international tax policy in light of criticisms that U.S. tax rules adversely affect the international
competitiveness of U.S. corporations. In particular, the NFTC study finds that “the United States
is a relatively undesirable location for a multinational company’s legal domicile” and concludes
that “a significant modernization of the U.S. rules is necessary to restore competitive balance in
the vastly changed circumstances of the global economy of the 21st century” (NFTC 2001, p. 14).
Along these same lines, a study issued by the U.S. Treasury (2002) calls for Congress to re-
consider whether U.S. tax rules are unfavorable to U.S. business vis-à-vis European territorial
systems.2 However, others3 argue that, “…inversions are more than self-help territoriality. They
provide an offshore platform for aggressive tax avoidance that borders on evasion” (Sullivan
2002). Thus, critical issues for U.S. tax policy are whether the current system is sustainable in a
global business environment, and more immediately, what changes (if any) should be made to
stem the tide of corporate inversion transactions.
This study investigates whether the share prices of inverting firms react positively to
initial announcements of intentions to invert. Although inverting firms claim to save millions in
future U.S. corporate income taxes, the transaction itself is immediately taxable at either the
shareholder or corporate level, and may impose additional non-tax costs (e.g., political costs) or
risks on the firm and its shareholders. Economic theory suggests that the change in share price at
2 Similarly, the American Institute of CPAs argues that the Congressional response should consider “U.S. tax disadvantages facing U.S.-based multinationals as well as U.S. tax advantages to foreign-based multinationals” (Pecarich, 2002). However, Thompson (2002b) notes that in its June 11, 2002 report, the NFTC backed away from its support for a territorial system (NFTC, 2002). 3 Thompson (2002a, b) and Sheppard (2002a, b, c) call for improving and tightening U.S. rules for anti-deferral rules, particularly with respect to passive income. Sheppard (2002b) maintains that, “It is absolutely false for the newly respectable proponents of territorial taxation to argue that America’s competitors have territorial systems. If any of them do, it is due to a failure of enforcement, not a systematic plan.” Extending this argument, Sheppard states that, “European anti-deferral regimes are more similar to subpart F than the Treasury would like to admit. Indeed, some of the targeted regimes are very similar to the hated…PFIC rules” (Sheppard 2002c).

3
the time of the inversion announcement should reflect the present value of the expected net
benefit to shareholders.4 Under the assumption that managers and shareholders seek to maximize
share value, the relevance of our research question to the tax policy debate is straightforward.
Evidence of positive share price reactions to inversion announcements would suggest that the
inversion trend would continue in the absence of additional tax legislation. In contrast, if share
prices do not react positively to inversion announcements, then perhaps the non-tax costs
inherent in these transactions are sufficient to discourage future inversions without legislative
action.
Our primary sample for investigating share price reactions to inversion announcements
consists of 19 single-company inversion announcements.5 We compare inverting firms to their
industry averages on a number of dimensions relevant to an inversion decision, and we examine
historical stock returns preceding the announcement date to assess whether the potential for
shareholder capital gains is related to the legal form of the inversion transaction. This descriptive
analysis permits several useful observations. First, inverting firms are significantly larger than the
median firm in their industries. Second, inverting firms have lower leverage than their industry
average before the inversion, but similar leverage afterward, suggesting that inverting firms
increase leverage once a favorable tax structure is in place. Third, inverting firms have overall
effective tax rates higher than their industry comparisons prior to the inversion, but similar
effective tax rates afterward, consistent with motivations for and benefits from inversion.
4 However, share prices should not be affected any shareholder-level capital gains tax triggered by the transaction because such taxes could not be avoided (but, in fact, would only be accelerated) by selling the stock prior to the inversion transaction. 5 As far as we are aware, this represents the entire population of such announcements for which there is available data. We know of two additional inversion transactions for which stock price data is unavailable. We separately analyze share price reactions to merger-related expatriation transactions.

4
Finally, many firms exhibit decreased stock prices in the months preceding the inversion
announcement, consistent with smaller shareholder tax costs. Further, many ‘shareholder-taxed’
inversions have high institutional ownership compared to ‘corporation-taxed’ inversions,
consistent with the structure reflecting the more likely tax-indifference of institutional owners.
We assess the statistical significance of each firm’s abnormal returns around the inversion
announcement date using approximate randomization procedures. In concurrent work, Desai and
Hines (2002) (hereafter, D&H) compute announcement period abnormal returns for a
commingled sample of single-company inversions and merger-related expatriations, but do not
assess the statistical significance of these abnormal returns. We find that the market-adjusted
returns are quite variable, and that many of the visually large market-adjusted returns shown by
D&H are not statistically different from zero. In contrast to their overall conclusion that
expatriating firms realized positive returns on average, we find that seven of the 19 single-
company inversions have significant negative announcement period returns and only two show
significant positive returns. The remaining ten inversions show no statistically significant market
reaction. The average return in the announcement period across all 19 firms is negative, but not
significantly different than zero. Overall, we find no evidence to suggest that share prices
increase in response to inversion announcements.
We further investigate the share price response puzzle by examining abnormal returns
over long-windows of one, three, and six months following the inversion announcement.
Approximately half the sample realizes positive abnormal returns over these periods, while the
other half realize negative abnormal returns. In sum, we still find no compelling evidence of
positive share price effects arising from inversion transactions.

5
The remainder of this paper is organized as follows. The first section provides an
overview of U.S. tax rules governing foreign income and the two primary types of inversion
structures. The second section describes key characteristics of inverting firms by comparing them
to their industry averages and also examines their stock price histories. The third section
addresses our primary research question related to the valuation effects of inversion
announcements, distinguishing our research methods and results from concurrent research. The
final section offers concluding comments.
OVERVIEW OF RELEVANT U.S. TAX RULES
In this section, we explore three areas of technical tax detail. First, we review the aspects
of U.S. multinational taxation that provide incentives for inversions, indicating which types of
firms would achieve gross tax benefits from an inversion. Second, we discuss the potential tax
costs of achieving an inversion, indicating the general corporate and shareholder features that
would minimize such tax costs. Third, we present two common structures for inversions—the
shareholder-taxed ‘Flip’ and the corporation-taxed “Outbound F” reorganization. For these
particular structures, we discuss what shareholder and corporate features provide natural tax
clienteles for such structures. For more detail concerning steps in inversion transactions and the
tax effects of each structure, we refer readers to presentations and articles that provide substantial
technical review and diagrams of transactions.6
U.S. taxation of worldwide income earned by U.S. multinationals
To understand why U.S. multinational corporations would find it beneficial to move
offshore, we briefly review the U.S. worldwide taxation system. The U.S. taxes domestic

6
corporations on their worldwide income under IRC § 61(a), but only taxes foreign corporations
on their U.S. source income.7 To moderate double taxation of U.S. multinationals’ foreign
income, the U.S. grants a foreign tax credit equal to the lesser of foreign income taxes paid or a
limitation roughly equal to the product of the U.S. corporate tax rate (35%) and foreign income.
Consequently, there is generally no net U.S. tax due on foreign income if aggregate foreign
income is taxed more than 35%. 8
As noted, the U.S only taxes foreign corporations on their U.S. source income.9 Thus, it
would seem that a U.S. corporation could avoid U.S. taxation on its foreign operations by
incorporating them as separate foreign subsidiaries. However, when a foreign subsidiary pays
dividends, the dividend is grossed-up to its equivalent pretax amount and increases the taxable
income of its U.S. parent (IRC § 78). Thus, the tax on foreign subsidiaries’ income is merely
deferred until the subsidiary pays a dividend or repatriates the earnings through other means such
as interest, royalties, or service fees. Additional restrictions prevent the U.S. parent from
6 See Thompson (2002a), PricewaterhouseCoopers (2002), Sheppard (2002a, b, c), and Treasury (2002). In addition, D&H provide a detailed case analysis of the proposed Stanley Works inversion. 7 Domestic corporations are those created or organized under the laws of one of the 50 states or the District of Columbia (IRC Section 7701(a)(4) and (a)(9)). Under U.S. tax principles, the headquarters office or seat of management is irrelevant for purposes of determining whether a corporation is domestic or foreign. In contrast, “British case law considers a foreign corporate taxpayer to be a resident in the country from which it is centrally managed and controlled, regardless of its country of incorporation” (Sheppard, 2002a). 8 This brief explanation of foreign tax credits is overly simplistic. Among other complexities, foreign source income is reduced by certain allocations of expenditures by the U.S. related entities, including interest expense and research and development expense. As a result, the foreign tax credit limitation can so reduce the creditable foreign tax as to result in additional U.S. tax being paid on income taxed abroad at greater than 35%. See, for example, Newberry (1998) for an analysis of interest allocation effects on foreign tax credits and Hines (1993) regarding research and development. In addition, foreign tax credits are computed separately for various categories of income, including separate limitations for passive income. Thus, a company cannot fully cross-credit high-tax income against low-tax income if the two sources of income fall into different limitation “baskets.” 9 Trade or business income that is effectively connected with the conduct of a trade or business within the U.S. (IRC Section 871(b) and 882(a)) is taxed at graduated corporate rates. U.S.-source nonbusiness income (IRC Section 871(a) and 881(a)) is taxed at a 30% flat rate or at the applicable treaty rate.
7
avoiding the tax on this income by selling the stock of the subsidiary.10 Moreover, if the foreign
subsidiary is a “controlled foreign corporation”, then its U.S. parent is taxed immediately on any
“Subpart F” income.11 Therefore, the mere formation of foreign subsidiaries does not allow a
U.S. corporation to avoid U.S. taxation on its foreign operations.
In summary, the typical U.S. multinational has foreign subsidiaries whose income is
taxed either currently (through immediate dividends or Subpart F income) or eventually (through
future dividends, or sale of stock or assets). However, if a foreign parent owned the foreign
operations, then foreign earnings would permanently escape U.S. taxation. Thus, firms that
would benefit most from an inversion are those that (1) have foreign income being taxed
currently or “trapped” abroad and/or (2) expect continued growth in foreign operations,
especially if the future foreign income will be taxed at an average rate of less than 35%.
A further tax benefit of inversions involves the ability to strip income out of the U.S.,
typically in the form of intercompany debt or other payments between the U.S. company and the
new foreign parent. If the U.S. company issues debt to a related tax haven company, the
intercompany interest it pays is tax-deductible in the U.S. but would not be taxable in the tax
haven.12 Further, inverting firms structure the transaction so that such payments are not subject to
U.S. withholding tax. To effect this result, many of the inverting companies, while incorporated
in Bermuda, establish headquarters operations in countries like Barbados or Luxembourg, where
10 IRC § 1248 recharacterizes any gain on sale of a controlled foreign corporation’s stock as a dividend to the extent of the shareholder’s share of post-1962 earnings and profits. 11 Under Subpart F (IRC § 954), non-de minimis passive income or “paper” sales income is taxed directly to the U.S. parent if it is lightly taxed relative to U.S. rates. Further, loans to the U.S. parent are treated as dividends under rules that tax earnings invested in U.S. property (IRC § 956). 12 S. 2119 would tighten existing interest deductibility rules under IRC Section 167(j) to prevent or restrict such interest stripping (Willens 2002).

8
U.S. tax treaties provide for little or no withholding tax (Sheppard 2002a, b).13 In addition,
because the foreign operations are no longer subject to U.S. taxation, the U.S. company will no
longer bear the indirect cost of the interest allocation rules, which further limit the foreign tax
credit. We expect that firms with debt capacity could benefit from inversion, especially if they
face high foreign tax rates that create excess foreign tax credits.
Taxpayer goals and tax law frictions to structuring an inversion
The goal of an inversion is to restructure a company so that the future (and possibly
accumulated) foreign earnings escape U.S. taxation. Most simply, instead of having a U.S.
parent that owns U.S. and foreign business activities (subsidiaries, branches and other ventures),
the multinational restructures into a foreign parent that owns U.S. and foreign business activities.
Providing none of the foreign activities are owned by a U.S. entity, then only the U.S. source
income is taxed in the U.S. If the new foreign parent is located in a country that, unlike the U.S.,
only taxes residence-based earnings, then the multinational can achieve permanent tax savings
via income-shifting to low-tax foreign jurisdictions.
The main statutory weapon that prevents the accumulated foreign earnings from escaping
U.S. taxation is IRC § 367. This section provides a series of rules that create an “outbound toll
charge” when U.S. persons transfer assets to foreign corporations. Immediate tax costs arise
either at the shareholder level, the corporate level, or both levels depending on the structure of
the transaction (IRC § 367, Treas. Reg. § 1.367(a)-3).14 Poor market conditions in 2001 and
2002 likely decreased both types of potential toll charge imposed by § 367, because the
13 The U.S. income tax treaty with Barbados reduces the withholding tax on interest payments to five percent, and Barbados only imposes a one percent income tax on large companies (Gnaedinger, 2002). 14 See Staffaroni (1999) for a discussion of how these rules also apply to acquisitions of U.S. corporations by foreign corporations (transactions we refer to as merger-related expatriations).

9
corporation’s shareholders should have less (or no) gain embedded in their stock, and more
corporations have net operating losses to offset corporate-level gain (U.S. Treasury, 2002).
To distinguish the inversions that primarily affect shareholders from those that primarily
affect corporations, we briefly describe the “Flip” and the “Outbound F” transactions,
respectively (PricewaterhouseCoopers, 2002). The U.S. Treasury (2002) refers to the “Flip” as a
“Stock” transaction and refers to the “Outbound F” as an “Asset” transaction.
The “Flip” structure involves “interposing a newly-formed holding company located in
Bermuda or another low-tax jurisdiction (the ‘foreign parent’) between the current U.S. parent
corporation (the ‘U.S. parent’) and that corporation’s shareholders” (U.S. Treasury, 2002).
Shareholders exchange their shares of the U.S. parent for new shares in the foreign parent. After
the transaction, the U.S. shareholders own the foreign parent that now owns the original U.S.
parent and subsidiaries (both foreign and U.S.).
The exchange of shares by the U.S. shareholders would initially appear to be a nontaxable
merger under IRC § 368. However, IRC § 367 overrides the nontaxable merger rules (Treas. Reg.
§ 1.367(a) – 3(a), (c)). IRC § 367 effectively requires that any gain, measured by the value of the
foreign stock received over the basis of the U.S. stock exchanged, be recognized as a shareholder
capital gain. Any loss is not recognized for tax purposes but is embedded in the tax basis of the
new shares of the foreign parent.
The “Flip” structure is least costly to shareholders that have a high tax basis relative to
the current value of the corporation. As such, the natural clientele for such an inversion
transaction consists of companies whose stock price is recently depressed so that the potential
shareholder gain is likely lower, or companies whose shareholder base is dominated by tax-
exempt entities (e.g., pension funds).

10
Note that the basic “Flip” structure does not move the existing foreign affiliates or assets
of the original U.S. group from beneath the U.S. corporation (former parent) to the new foreign
parent. Thus, this transaction alone does not prevent (eventual) U.S. taxation of existing foreign
operations.15 However, the new foreign-owned company can establish new foreign operations
outside U.S. control, so that future foreign earnings escape U.S. taxation, even without moving
the existing foreign assets. In summary, the “Flip” transaction generally results in shareholder-
level taxation, but no corporate-level taxation, unless additional transactions are appended to
extract the foreign operations from beneath the old U.S. parent.
In contrast, an “Outbound F” reorganization is taxable to the corporation but not to the
shareholders. This structure involves a change in the country of incorporation of the parent
company, but no exchange of shares by the shareholders. IRC § 367 requires the U.S. parent to
recognize gain, but not loss, as if all the assets of U.S. parent transferred to a foreign corporation
had been sold for fair market value at the time of the transaction. As a result of the
reincorporation, the foreign assets or affiliates owned by the U.S. parent have effectively been
extracted from U.S. ownership to foreign ownership. This extraction generates taxable income to
the U.S. parent that owns such foreign assets or foreign stock. However, the tax effect can be
mitigated if the U.S. company has favorable tax attributes such as net operating losses to offset
the gain. Thus, the natural tax clientele for the “Outbound F” reorganization consists of U.S.
companies that have net operating losses or whose foreign assets or stock are not highly
appreciated.
15 Moving the assets out from under the U.S. parent generates a section 367 toll charge on the appreciated assets transferred, in which losses do not offset gains, under Treas. Reg. 1.367(a)-1T(f) and 1.367(a)-3(d)(3) (PWC, 2002, p. 32).

11
CHARACTERISTICS OF INVERTING FIRMS
Our primary sample consists of 19 single-company inversions identified in panel A of
Table 1. So far as we are aware, this sample represents the entire population of such transactions
for which data are available.16 In our later analysis of stock price reactions, we augment this
sample with five merger-related expatriations (identified in panel B) for sake of comparison to
concurrent research by D&H. Inverting firms were identified through searches of popular press
articles and discussions with tax professionals at two Big 4 public accounting firms.
Table 1 shows that the earliest of these 24 transactions was announced in February 1983
and the latest was announced in April 2002. We also note that a majority of the single-company
inversions were announced in 1999 or later, which likely worked to promote the concerns
expressed by policy makers discussed in the previous section. Most of the inversions or mergers
were approved within approximately six months of their announcement and involved foreign re-
incorporations in Caribbean tax havens. We report the general categorization of the transaction as
either a shareholder-taxed ‘Flip’ or a corporation-taxed reorganization. Most single-company
inversions involve mid-sized firms with only one company (Ingersoll-Rand) having a market
capitalization exceeding $5 billion.
We perform two descriptive analyses to determine whether the characteristics of the firms
that invert to tax havens are consistent with the tax and non-tax incentives discussed in the prior
section. Because firms are likely to have many other motivations for undertaking merger-related
transactions, we perform these descriptive analyses only for the single-company inversions. First,
16 We could not find stock return data for two corporations that inverted in September 1998, PlayStar Corporation and AmerInst Insurance Group, Inc. (AIIG). At that time PlayStar’s stock was traded on the OTC Bulletin Board. AIIG’s 10-K filing for 1998 stated that there was no established market for its stock and that all stock transfers had

12
we compare firms’ financial characteristics for size, leverage, effective tax rate and growth in
foreign income to the firms’ industry means and medians. Second, we examine stock effects that
are related to the potential tax clienteles for each transaction structure. By examining the pattern
of historical stock prices, we provide descriptive evidence about the likely built-in shareholder
gain. We also report the percentage of institutional ownership as a potential indicator of firms
whose shareholders are tax-insensitive.
Table 2 compares 18 single-company inverting firms17 to their industry means and
medians (based on 2-digit SIC codes) for four firm characteristics relevant to the inversion
decision—size, leverage, total effective tax rate, and growth in foreign income. We compare the
inverting firms to their industries in two separate time periods. Panel A makes these comparisons
for the year prior to the inversion announcement, which allows us to consider what
characteristics motivate the inversion. Panel B makes similar comparisons for the year following
the inversion announcement, which provides some evidence on how the inversion affected these
characteristics.
Panel A of Table 2 indicates that inverting firms are clustered by industry. Four of the 18
firms are oil and gas extraction firms (SIC 13), four are insurance carriers (SIC 63), and six are
industrial firms involved in manufacturing various commercial equipment and machinery (SICs
34-36). This industry clustering suggests that once a competitor inverts, other firms in that
industry feel pressure to invert to keep pace and preserve a level playing field, and emphasizes
the importance of controlling for industry in these comparisons. The statistical significance of
to be approved by AIIG’s Stockholder Relations Committee. Playstar reincorporated in Antigua while AIIG reincorporated in Bermuda. 17 Because we are unable to locate financial data for McDermott, the sample used in these analyses decreases from 19 to 18 inversions.

13
firm versus industry differences is assessed using Wilcoxon signed-rank tests. Significant
differences the mean but not the median, or visa versa, are a function of the skewed distribution
of the characteristic within the industry rather than sample size.
Before the inversion (Panel A), inverting firms are larger than their industry counterparts
(relative to the median, p < .01).18 This result is consistent with the idea that larger firms tend to
have substantial global operations and the sophistication for complex tax planning and, therefore,
are in a better position to implement and benefit from an inversion. However, inverting firms
tend not to be among the largest firms in their industry and, with the exception of Stanley Works,
they tend not to be “household names,” which might enable them to avoid the political costs of
being labeled “unpatriotic” when announcing the inversion.19
Inverting firms’ leverage is significantly less than the industry means (p < 0.01). This
suggests that the inverting firms may have additional debt capacity relative to the industry norms.
Our evidence is insufficient to determine whether inverting firms’ existing leverage creates a
foreign tax credit constraint.
The inverting firms’ effective tax rates exceed their industry medians (p < 0.05). Thus,
we have partial evidence that inverting firms were motivated to reduce their overall tax burdens
relative to their industry peers.
Firms with sizeable foreign operations or firms expecting increased growth in foreign
income have a greater incentive to invert in order to move their foreign profits outside the U.S.
taxing jurisdiction. However, inverting firms do not differ from their industry counterparts with
18 We measure size based on assets (COMPUSTAT item #6). Untabulated results of size measured in terms of total sales (COMPUSTAT item #12) show similar results to those of the reported total asset measure of size.

14
respect to our measure of growth in foreign pre-tax income. We attempted to develop alternative
measures of this construct using the Compustat geographic segment tapes, but this database does
not report foreign assets or foreign sales frequently enough for the inverting firms to be useful.
Panel B of Table 2 compares the same four variables for the inverting firms to their
industry means and medians for the period after the inversion announcement. The sample size
decreases to nine firms for this analysis because subsequent year data are not available for
recently announced inversions. Nonetheless, this analysis provides some interesting insights into
how these comparisons change after the inversion.
Panel B shows that size is the only characteristic on which inverting firms differ (relative
to the median, p <0.074) from their industries in post-inversion years. Inverting firms’ leverage
ratios are no longer lower than the industry means, and the inverting firms’ total effective tax
rates are no longer higher than the industry medians. Untabulated t-tests comparing firm-industry
differences before and after the inversion announcement show that inverting firms weakly
increased their leverage compared to the industry means (one-tailed p = 0.061) and weakly
decreased their effective tax rates compared to the industry medians (one-tailed p = 0.065). This
suggests that the inverting firms were somewhat successful in raising their leverage and lowering
their effective tax rates to meet those of their industry competitors. Because Compustat data
reflects only external debt, our leverage measure does not capture income stripping via
intercompany debt. However, the tax savings from such income stripping would be reflected in
the effective tax rate measure. Finally, we still do not find any differences in future growth in
foreign income between the inverting firms and their industry means and medians. Based on
19 In responding to Stanley Works decision to withdraw its inversion plans, Congressman Maloney asserted that worker-supported demonstrations he helped organize had more influence than the potential tax benefits, saying

15
Table 2 results, we conclude that inverting firms differ from other firms in their industries with
respect to some, but not all, characteristics indicative of potential benefits from inversion.
Table 3 reports the pattern of stock prices and returns for inversion firms leading up to the
announcement and the percentage of institutional ownership prior to the announcement. The
purpose of this analysis is to determine whether the potential for shareholder capital gains is
related to the tax structure of the inversion. Although the stock prices of many inverting firms
decreased in the months preceding the inversion announcement, consistent with low shareholder
tax costs from implementing a taxable inversion, we cannot conclude that this pattern describes
all inversions.
However, we observe that the firms using a shareholder-taxable structure appear to have
high institutional ownership relative to firms using corporate-taxed structures (C- and outbound F
reorganizations). If the shareholder-taxed inversions involve firms with tax-indifferent
shareholders, then the stock basis and potential built-in gain will not act as a friction on the
inversion. We are in the process of gathering more specific ownership data to assess the extent to
which institutional owners are tax-exempt entities.
Regarding the structures that involve corporation-level tax, we consider whether
corporate net operating losses (NOLs) might reduce such tax costs. Only two of the five
(untabulated) corporate-taxed inversions report NOLs on Compustat in the year prior to the
inversion, Transocean and Xoma. However, Mills et al. (2002) caution that in the case of
multinational corporations, a Compustat NOL does not necessarily indicate an U.S. NOL.
The foregoing descriptive analysis of 18 “case studies” compares firm characteristics to
industry averages to see if any patterns emerge. In concurrent work, D&H (2002) estimate
“Stanley Works has responded to the political and community pressure that we’ve brought to bear” Rojas (2002).

16
logistic regressions to investigate the determinants of inverting (maximum 19 firms) versus not
inverting using a control group of firms (varying in size from about 100 to 600 firms) that
continuously report export data from 1992-1998 on Compustat. While their multivariate
approach allows for control of multiple factors that our descriptive evidence cannot, we believe
that our descriptive approach is appropriate for such a small sample of single-company
inversions. Moreover, D&H’s analysis includes four “inverting” firms that expatriated via a
merger with a comparably sized foreign corporation. The large body of literature investigating
merger and acquisition activity demonstrates that numerous factors beyond those motivating an
inversion could confound their results.
Presumably, firms that choose to invert expect the present value of their future tax
savings, net of any immediate tax costs and any non-tax costs, to be positive. However, the future
tax benefits of inverting are less certain than the immediate tax costs because they are subject to
uncertainties about future events. Although non-tax costs such as political costs are difficult to
quantify, they undoubtedly exist. In the next section, we conduct tests of changes in firms’ stock
prices at or around the time the inversion is announced to assess whether investors view these
announcements as favorable events.
STOCK PRICE REACTION
As a result of uncertainty about the costs and benefits, whether the market reacts
favorably to an inversion announcement is an empirical question. If the capital markets uniformly
reward inverting firms with higher stock prices (i.e., significantly positive CARs), then one might
reasonably expect more firms to follow their lead. On the other hand, if the stock prices of firms

17
that previously announced inversions did not materially or uniformly increase, then less evidence
exists for the necessity of additional tax rule restrictions on corporate inversion.
We investigate whether inverting firms’ share prices react positively to initial
announcements of intentions to reorganize the firm in a tax-haven country, or whether there is
evidence of post-announcement benefits over a longer window. In concurrent work, D&H (2002)
conclude that, “share prices rise by an average of 1.7 percent in response to expatriation
announcements.” D&H base this conclusion on a sample of 19 inversion announcements, four of
which involved mergers between U.S. firms and comparably sized pre-existing foreign
corporations. Furthermore, D&H do not assess the statistical significance of the abnormal returns
at either the firm level or in the aggregate.
We separately analyze 19 single-company inversion announcements described in the
previous section and five additional merger-related expatriations (see Table 1). Because merger
announcements have value-relevant information beyond the effects of inverting, we base our
conclusions regarding share price reactions only on data from the single-company inversion sub-
sample. We examine both two-day (day 0 through day +1) and five-day (day -2 through day +2)
cumulative abnormal returns (CAR) around the inversion announcement date (day 0). We obtain
daily returns for dates prior to 2002 from the Center for Research in Security Prices (CRSP). We
obtained daily return data for dates in 2002 from finance.yahoo.com. We use two proxies for
expected returns: the daily return on the Standard & Poor’s 500 stock index (S&P500) and the
daily value-weighted market return provided by CRSP.20
20 In untabulated results, we find similar results using the Nasdaq index and the CRSP equal-weighted index.

18
To assess the statistical significance of each stock’s CAR values, we use approximate
randomization procedures. Specifically, for each stock we construct a distribution of 999 random
two- (and five-) day CAR values using daily firm and market returns from two (five) randomly
selecting trading days over the 250-trading day period preceding day –5 (relative to
announcement day 0).21 We then add the actual two- (five-) day CAR value to this distribution
and assess its statistical significance relative to the randomly generated observations. For
example, if the actual CAR value were the 50th most extreme positive value in the distribution of
1000 observations, then our assessed significance level would be 0.05 (i.e., 50/1000).
Panel A of Table 4 reports two- and five-day CAR values around initial inversion
announcement dates for each sample firm proposing a single-company inversion. These results
suggest that investors do not uniformly reward inverting firms with higher share prices—the
shares of most firms actually decreased in value around the time of the inversion announcement.
Because results are consistent across both proxies for expected returns, we discuss only the
abnormal returns based on CRSP value-weighted market returns. Seven of the 19 firms in the
single-company inversion sub-sample experienced significantly (p < 0.10) negative CAR values
over either the two- or five-day accumulation period. In contrast, only two firms (Fruit of the
Loom and White Mountain Insurance) experienced significantly positive abnormal returns. The
mean (median) two-day CAR in the single-company sub-sample is -0.0190 (-0.0055). The mean
(median) five-day CAR in the single-company sub-sample is -0.0191 (-0.0014). However, neither
21 The purpose of the randomization procedure is to construct a distribution of “normal” CAR values. Accordingly, we excluded from the pool of 250-trading days for each firm any days on which the firm made announcements about (1) earnings, (2) dividend changes, and (3) merger or acquisition activity, as such announcements could also create abnormal returns. These dates were identified using Lexis-Nexis.

19
the mean or median returns are significantly different from zero. In sum, we find no evidence to
suggest that share prices increase in response to expatriation announcements.
Panel B shows the cumulative abnormal returns for firms announcing merger-related
expatriation transactions. These transactions involve a merger between a U.S. domestic firm and
a firm already domiciled in a Caribbean tax haven nation, with the tax haven firm surviving the
transaction. Because each of these transactions could fairly be described as a “merger of equals,”
it is impossible to discern whether the share prices are responding to anticipated tax savings from
expatriating the domestic firm or to valuation implications of the merger itself.22 Consequently,
we chose to report separately the market reactions to these transactions. Not surprisingly, price
reactions to such announcements tend to be larger in absolute magnitude than those shown in
panel A. Three of the five firms announcing merger-related expatriations (Tyco, Trenwick, and
Veritas) experienced significantly negative CAR’s over at least one of the two windows (p <
0.05). Although both R&B Falcon and Global Marine have positive CAR values over both
windows, our randomization test indicates that only the five-day CAR values for R&B Falcon are
statistically significant (p < 0.10).
To reconcile our results with those of D&H, note that R&B Falcon and Global Marine
represent two of the three largest positive five-day excess returns in D&H’s study (see D&H’s
figure 4). As such, they are the likely reason that D&H report an overall rise in share prices
around inversion announcement dates. In addition, as described earlier, our sample includes four
single-company inversions not included in D&H’s figure 4 (McDermott, Applied Power,
Weatherford International, and Leucadia National), and D&H’s sample includes four of the five

20
merger-related expatriations that we segregate in Panel B (all except Veritas). Nevertheless,
when we combine Panels A and B for sake of comparison to D&H, the average two- and five-day
CAR’s are –0.0239 (t = -1.79, p < 0.10) and –0.0167 (t = –1.02), respectively.23 Thus, if we
follow D&H’s method but add five additional transactions, we obtain a very different result (i.e.,
share prices do not rise, but actually decrease, on average, in response to inversion
announcements).
Possible Explanation for Negative Returns
It is counter-intuitive that management would propose, and shareholders would approve,
a corporate inversion if they expected share prices to decline as a result. Although we are unable
to resolve this puzzle, we offer several possible explanations. First, as with any “event” study,
there is always the possibility that investors anticipated the transaction such that its positive
effects are impounded into share values before the announcement date (or before day –2 for
purposes of our five-day CAR measure). Our discussions with Big 4 tax consultants involved
with these transactions indicate that managers of some firms do “feel out” major shareholders to
assess how they are likely to vote before publicly announcing an inversion proposal. To assess
this possibility, we compute cumulative abnormal returns over the month preceding the
announcement date (days –21 to –3) for each single-company inversion transaction. In
untabulated results, we find that ten (nine) firms had positive (negative) CAR values over this
period ranging from a high of 0.5268 to a low of –0.2566.24 The average CAR of 0.0079 is not
22 We examined the acquirer and target market values based on data from Securities Data Corporation or from newswire reports where SDC data were missing. In the case of all five mergers the ratio of acquirer to target was between 50% (1:2) and 200% (2:1), consistent with a “merger of equals.” 23 The non-parametric sign and signed-rank tests are not significant. 24 These tests do not control for the effects of any other firm-specific events that may have occurred during the one-month period prior to the announcement.

21
significantly greater than zero (t = 0.21). The correlation between CAR values over this period
with those computed over the five-day announcement period is not statistically significant
(Spearman r = 0.19, p = 0.42). Thus, while we cannot rule out the possibility that shares prices of
some firms impounded a positive value of inverting prior to the announcement date, this does not
appear to explain the lack of positive returns during the announcement period on an overall basis.
Second, investors may be slow to appreciate the long-term value of the proposed
inversion, such that share prices do not begin to reflect this value until after the event window
(after day +2 for our five-day CAR measure). Similarly, there may be uncertainty as to whether
shareholders will approve the inversion, such that share do not fully reflect the value of the
inversion until this uncertainty is resolved.25 To examine this possibility, Table 5 reports long
window CAR measures over one, three, and six-month periods following the initial inversion
announcement by firms proposing single-company inversion transactions.
Table 5 must be interpreted with caution, as long-window returns are likely to reflect the
valuation implications of other events unrelated to the inversion announcement. Although some
firms (most notably Foster Wheeler) do experience large positive abnormal returns over long
windows subsequent to the announcement period, other firms continue to experience negative
abnormal returns.26 Across the three accumulation periods approximately one-half of the firms
experienced positive returns, while the other half experienced negative returns. Thus, delay in
25 Along the same lines, if the transaction is taxable to the shareholders, major investors might attempt to temporarily depress share prices until the transaction is completed in order to minimize their taxable gain. However, the fact that the transaction might trigger shareholders’ capital gains taxes should not cause negative returns because such taxes could not be avoided (but, in fact, would only be accelerated) by selling the stock prior to the inversion transaction. 26 Unfortunately, we are unable to utilize approximate randomization procedures to determine the statistical significance of these long window returns because repeated draws of a large number of trading days (e.g., 123) from a pool of 250 trading days would not result in independent observations.

22
the market’s reaction to inversion announcements does not seem to be a systematic explanation
for the lack of positive CAR values in the announcement period.
Third, for some firms, much of the future tax savings from inverting may be captured by
top management rather than shareholders. For example, Johnston (2002b) reports that the
compensation plans for Nabors Industries’ top two executives give them eight percent (in total)
of the company’s cash flow. Thus, in this particular case, eight percent of the any tax savings
would go directly to top management rather than shareholders. In addition, to the extent that
future tax savings did cause share prices to increase, there is an increased likelihood that
managers will exercise stock options they already hold already, thereby causing dilution of share
values for existing shareholders. Finally, shareholders may have fewer rights to take legal action
against corporate directors and officers under the laws of tax haven nations than they would
under U.S. law (Johnston 2002c; Plitch 2002), and these differences may have negative valuation
implications for the shares of inverting firms.
In sum, we find no compelling evidence to suggest that share prices systematically
increase in response to announcements of corporate inversions. We are puzzled by this result
because most firms justify their proposals to undertake inversion transactions with claims that
shareholders will benefit from future corporate tax savings. Rather, these results suggest that the
benefits of inversion are not obvious to market participants, or are offset by other costs. It is
possible, therefore, that the apparent trend toward corporate inversions will not continue in the
immediate future, particularly in light of the political scrutiny in 2002 and the resulting increase
in political costs.

23
CONCLUSIONS
As a direct response to the recent trend in corporate expatriations, politicians have
questioned the patriotism of firms that reorganize outside the U.S. and introduced numerous
legislative proposals designed to prevent corporate expatriations. In this study, we seek to
provide empirical evidence on whether Congressional action is needed to constrain future
expatriations of U.S. companies to tax haven countries.
In descriptive analysis, we compare single-company inverting firms to their industry
averages on a number of dimensions relevant to an inversion decision. Although some of the
descriptive evidence is consistent with incentives to invert and benefits from inversion, this
evidence is weak. We also examine historical stock returns preceding the announcement date to
assess whether the potential for shareholder capital gains is related to the legal form of the
inversion transaction. We find some evidence that inversion structures creating taxable gain at
the shareholder-level are common when share prices have recently declined and share ownership
is concentrated among institutional investor who may be tax-exempt.
Our firm valuation analysis assesses the statistical significance of each firm’s abnormal
returns around the inversion announcement date using approximate randomization procedures.
Additionally, we examine long-window returns following the inversion announcement. Overall,
we do not detect obvious shareholder benefits from inversions. Our analyses of announcement
and post-announcement stock returns fail to demonstrate that shareholders uniformly perceive
that future tax benefits substantially outweigh tax and nontax costs associated with these
transactions. We find that seven of the 19 single-company inversions have significant negative
announcement period returns and only two show significant positive returns. The remaining ten

24
inversions show no statistically significant market reaction. The average return in the
announcement period across all 19 firms is negative, but not significantly different than zero.
One policy implication of these results is that, if managers and shareholders seek to
maximize share value, then existing non-tax costs associated with inverting might be sufficient to
dissuade future inversion without additional tax rule restrictions. At the very least, the track
record of prior inversions in failing to create substantial shareholder value might buy Congress
some time to thoughtfully consider any legislative action that might be necessary. Because
alternative avenues exist for firms to avoid, or at least substantially defer, U.S. tax on foreign
income, a more comprehensive review of U.S. tax rules governing the taxation of foreign income
may be needed.27
27 For example, Cloyd et al. (2002) document an upward trend in Initial Public Offerings on U.S. stock exchanges by companies initially incorporated in Caribbean tax haven countries.

25
REFERENCES Boatsman, J. R., S. Gupta, and C. D. Weaver. 2002. Tax management, sustainable competitive
advantage, and the effects of tax reform. Working paper, Arizona State University and University of Texas at Austin.
Cloyd, C. B., L. F. Mills and C. D. Weaver. 2002. What do trends in location decisions for Initial Public Offerings imply for corporate inversions? Working paper, University of Arizona.
Desai, M. and J. Hines, Jr. 2002. Expectations and expatriations: tracing the causes and consequences of corporate inversions. Working paper, Harvard University.
Gnaedinger, Chuck. 2002. Observers note link between Thomas Bill, U.S. tax treaties. Tax Notes Today, August 30.
Gupta, S. and K. J. Newberry. 1997. Determinants of the variability in corporate effective tax rates: Evidence from longitudinal data. Journal of Accounting and Public Policy 16(1): 1-35.
Hines, J.R. 1993. On the sensitivity of R&D to delicate tax changes: The behavior of U.S. multinationals in the 1980s, in Studies in International Taxation, Alberto Giovannini, R. Glenn Hubbard and Joel Slemrod eds, (Chicago: University of Chicago Press): 149-187.
Johnston, D.C. 2002a. U.S. Companies File in Bermuda to Slash Tax Bills. New York Times, February 18.
Johnston, D.C. 2002b. Officers may gain more than investor in move to Bermuda. The New York Times (on-line), May 20.
Johnston, D.C. 2002c. Bermuda move may sound good, but investors could get burned. The New York Times (on-line), June 13.
Mills, L., K. Newberry, and G. Novack. 2002 Reducing errors in corporate tax measures. Working paper, University of Arizona (August).
National Foreign Trade Council (NFTC), 2002. Territorial Tax Study Report, June 11.
National Foreign Trade Council (NFTC), 2001. The NFTC Foreign Income Project: International Tax Policy. Conclusions and Recommendations, Fred F. Murray, editor-in-chief, December 15.
Newberry, K. 1998. Foreign tax credit limitations and capital structure decisions. Journal of Accounting Research 36: 157-166.
Pecarich, Pamela. 2002. AICPA comments on corporate inversion transactions. Tax Notes Today, July 5.

26
Plitch, P. 2002. Reincorporations face new fight over shareholder rights. The Wall Street Journal (on-line). May 17.
PricewaterhouseCoopers. 2002. Inversions: the rising storm. Presentation, The Tax Colloquium, San Antonio, TX August 12-13.
Rojas, Warren, 2002. Stanley Works abandons planned Bermuda inversion. Tax Notes Internaional, August 12, p. 762.
Sheppard, Lee. 2002a. Preventing Corporate Inversions. Tax Notes, April 1, p. 29.
Sheppard, Lee. 2002b. Preventing Corporate Inversions, Part 2. Tax Notes, May 6, p. 816.
Sheppard, Lee. 2002c. Preventing Corporate Inversions, Part 3. Tax Notes, June 24, p. 1864.
Staffaroni, R. 1999. Size Matters: Section 367(a) and Acquisitions of U.S. Corporations by Foreign Corporations, The Tax Lawyer, Spring.
Sullivan, Martin. 2002. The U.S. Congress’s inversion odyssey: Oh, the places you’ll go. Tax Notes International, July 8, p. 150.
Thompson, Samuel. 2002a. Section 367: A 'Wimp' for Inversions and a 'Bully' for Real Cross-Border Acquisitions, Tax Notes, March 18, p. 1505.
Thompson, Samuel. 2002b. Inversion hearings focus on wrong issues. Tax Notes International, July 8, p. 193.
United States Department of the Treasury, Office of Tax Policy. 2002. Corporate inversion transactions: tax policy implications, May.
Willens, R. 2002. “REPO” legislation would tighten “interest stripping” rules. Lehman Brothers Tax & Accounting, Volume 15, Issue 71, May 17.

27
TAB
LE 1
A
LPH
AB
ET
ICA
L L
IST
OF
CO
RPO
RA
TE
INV
ER
SIO
NS
AN
D M
ERG
ER
-RE
LA
TE
D E
XPA
TR
IAT
ION
S
Com
pany
(T
icke
r)
Dat
e A
nnou
nced
D
ates
A
ppro
ved
Dat
e
Com
plet
ed
D
estin
atio
n
Indu
stry
Form
of t
rans
actio
n M
arke
t Val
ue a
(in 0
00s)
Pa
nel A
: Sin
gle
Com
pany
Inve
rsio
ns
App
lied
Pow
er (A
PW)
1/26
/200
0 7/
22/2
000
7/31
/200
0 B
erm
uda
35
Tax-
free
spin
off
$ 99
8,70
1 C
oope
r Ind
ustri
es (C
BE)
6/
11/2
001
5/14
/200
2 5/
22/2
002
Ber
mud
a 36
Sh
areh
olde
r tax
3,
550,
665
Ever
est R
eins
uran
ce (R
E)
9/17
/199
9 2/
23/2
000
2/24
/200
0 B
erm
uda
63
Shar
ehol
der t
ax
1,31
0,64
4 Fo
ster
Whe
eler
(FW
C)
11/2
9/20
00
4/23
/200
1 5/
25/2
001
Ber
mud
a 16
C
orpo
ratio
n ta
x 18
3,32
1 Fr
uit o
f the
Loo
m (F
TL)
2/11
/199
8 11
/12/
1998
3/
4/19
99
Cay
man
22
Sh
areh
olde
r tax
1,
823,
229
Gol
d R
eser
ve (G
LDR
) 11
/24/
1998
2/
4/19
99
2/4/
1999
C
anad
a 10
Sh
areh
olde
r tax
26
,962
H
elen
of T
roy
(HEL
E)
12/3
0/19
93
2/9/
1994
2/
9/19
94?
Ber
mud
a 36
Ta
x-fr
ee b
104,
315
Inge
rsol
l-Ran
d (I
R)
10/1
6/20
01
12/1
4/20
01
12/3
1/20
01
Ber
mud
a 35
Sh
areh
olde
r tax
6,
821,
276
Leuc
adia
Nat
iona
l (LU
K)
4/15
/200
2 n/
a n/
a B
erm
uda
63
Shar
ehol
der t
ax
1,59
6,94
4 M
cDer
mot
t (M
DE)
10
/28/
1982
3/
15/1
983
3/15
/198
3 Pa
nam
a 35
Ta
x-fr
ee b
635,
024
Nab
ors I
ndus
tries
(NB
R)
1/2/
2002
6/
14/2
002
6/24
/200
2 B
erm
uda
13
Shar
ehol
der t
ax
483,
6136
N
oble
Dril
ling
(NE)
1/
31/2
002
4/25
/200
2 4/
30/2
002
Cay
man
13
Sh
areh
olde
r tax
4,
501,
790
PXR
E C
orpo
ratio
n (P
XT)
7/
7/19
99
10/5
/199
9 10
/6/1
999
Ber
mud
a 63
Sh
areh
olde
r tax
22
3,18
4 St
anle
y W
orks
(SW
K)
2/8/
2002
5/
9/20
02
with
draw
B
erm
uda
34
Shar
ehol
der t
ax
3,97
4,88
9 Tr
anso
cean
Offs
hore
(RIG
) 3/
15/1
999
5/13
/199
9 5/
14/1
999
Cay
man
13
B
oth
taxe
d 2,
538,
913
Trito
n En
ergy
(OIL
) 2/
8/19
96
3/25
/199
6 3/
25/1
996
Cay
man
13
Sh
areh
olde
r tax
1,
123,
482
Wea
ther
ford
Int’l
(WFT
) 4/
5/20
02
6/26
/200
2 6/
26/2
002
Ber
mud
a 35
Sh
areh
olde
r tax
4,
276,
330
Whi
te M
ount
ain
(WTM
) 9/
27/1
999
10/2
2/19
99
10/2
5/19
99
Ber
mud
a 63
C
orpo
ratio
n ta
x 76
5,03
3 X
oma
(XO
MA
) 11
/24/
1998
12
/29/
1998
1/
5/19
99
Ber
mud
a 28
C
orpo
ratio
n ta
x 15
9,86
4 Pa
nel B
: Mer
ger-
Rel
ated
Exp
atri
atio
ns
Tyco
(TY
C)
3/17
/199
7 7/
2/19
97
7/2/
1997
B
erm
uda
36
Shar
ehol
der t
ax
9,12
2,59
1 Tr
enw
ick
(TW
K)
12/1
9/19
99
9/25
/200
0 9/
27/2
000
Ber
mud
a 63
Ta
x-fr
ee
278,
790
R &
B F
alco
n (F
LC)
8/21
/200
0 12
/12/
2000
1/
31/2
001
Cay
man
13
Ta
x-fr
ee
4,88
8,06
3 G
loba
l Mar
ine
(GLM
) 9/
3/20
01
11/2
0/20
01
11/2
0/20
01
Cay
man
13
Sh
areh
olde
r tax
2,
666,
660
Ver
itas/
PGS
(VTS
) 11
/26/
2001
w
ithdr
aw
with
draw
C
aym
an
13
Cor
pora
tion
tax
495,
945
a Mar
ket v
alue
of e
quity
is m
easu
red
as o
f the
inve
rsio
n an
noun
cem
ent d
ate.
Mar
ket v
alue
for f
irms a
nnou
ncin
g in
200
2, a
re m
easu
red
as o
f Dec
embe
r 31,
200
1.
b T
hese
tran
sact
ions
occ
urre
d pr
ior t
o th
e is
suan
ce o
f Reg
ulat
ion
§ 1.
367(
a)-3
in D
ecem
ber 1
996.

28
TAB
LE 2
C
OM
PAR
ISO
N O
F FI
RM
CH
AR
AC
TE
RIS
TIC
S T
O IN
DU
STR
Y M
EAN
S A
ND
MED
IAN
S
Pane
l A: Y
ear
prio
r to
the
inve
rsio
n an
noun
cem
ent
Si
ze b
Le
vera
ge
Tota
l ETR
G
row
th in
For
eign
Inc.
Firm
a A
nn. D
ate
SIC
Fi
rm
Indu
stry
M
ean
Indu
stry
M
edia
n Fi
rm
Indu
stry
M
ean
Indu
stry
M
edia
nFi
rm
Indu
stry
M
ean
Indu
stry
M
edia
n Fi
rm c
Indu
stry
M
ean
Indu
stry
M
edia
n O
il &
Gas
Tr
iton
Ener
gy
2/8/
1996
13
824
663
660.
701
2.45
00.
491
0.33
30.
110
0-1
.076
0.19
20.
154
Tran
soce
an O
ffsho
re
3/15
/199
913
3,
251
1,12
513
90.
391
1.71
40.
537
0.17
10.
113
04.
447
0.53
40.
289
Nab
ors I
ndus
tries
1/
2/20
0213
3,
137
1,26
716
90.
424
0.56
20.
501
0.08
10.
092
0.01
10.
676
2.81
10.
495
Nob
le D
rillin
g 1/
31/2
002
13
2,59
61,
267
169
0.39
30.
562
0.50
10
0.09
20.
011
2.51
82.
811
0.49
5In
sura
nce
Car
rier
s
PXR
E C
orpo
ratio
n 7/
7/19
9963
63
318
,426
1,80
20.
472
0.74
80.
764
0.26
40.
193
0.17
4
0.12
80.
166
Ever
est R
eins
uran
ce
9/17
/199
963
5,
997
18,4
261,
802
0.75
30.
748
0.76
40.
250.
193
0.17
4
0.12
80.
166
Whi
te M
ount
ain
9/
27/1
999
63
3,28
118
,426
1,80
20.
786
0.74
80.
764
0.25
20.
193
0.17
4
0.12
70.
166
Leuc
adia
Nat
iona
l 4/
15/2
002
63
3,14
418
,981
1,90
50.
617
0.77
00.
790
0.13
40.
171
0.13
5
-0.7
620.
213
Oth
er
H
elen
of T
roy
12/3
0/19
9336
12
382
232
0.34
60.
595
0.47
40.
229
0.17
30.
131
0.28
10.
137
0.10
5Fr
uit o
f the
Loo
m
2/11
/199
822
2,
483
462
220
0.83
00.
670
0.62
90
0.14
50.
155
-10.
339
0.09
00.
416
Gol
d R
eser
ve
11/2
4/19
9810
73
886
720.
092
0.47
70.
289
00.
079
00.
308
-2.0
710.
153
Xom
a 11
/24/
1998
28
651,
184
490.
518
0.71
70.
362
00.
158
0
0.81
30.
203
App
lied
Pow
er
3/10
/200
035
1,
241
1,30
219
50.
484
0.76
60.
628
0.61
60.
198
0.19
60.
796
0.36
50.
159
Fost
er W
heel
er
11/2
9/20
0016
3,
438
749
257
0.89
10.
599
0.63
00.
678
0.20
50.
192
0.19
20.
390
0.46
5C
oope
r Ind
ustri
es
6/11
/200
136
4,
789
1,54
413
20.
602
0.62
20.
345
0.14
40.
230
0.21
00.
061
1.01
60.
335
Inge
rsol
l-Ran
d 10
/16/
2001
35
10,5
291,
145
112
0.66
80.
816
0.46
40.
222
0.18
60.
170
0.11
31.
039
0.18
0St
anle
y W
orks
2/
8/20
0234
1,
885
773
195
0.60
90.
910
0.62
80.
194
0.19
00.
196
-0.1
20-0
.836
0.15
9W
eath
erfo
rd In
t’l
4/5/
2002
35
3,46
21,
145
112
0.61
30.
816
0.46
40.
188
0.18
60.
170
0.99
41.
101
0.18
0
M
ean
of F
irm /
Indu
stry
Diff
eren
ce
-2
,063
2,31
6-0
.291
0.00
90.
060
0.09
7-0
.587
-0.3
77p-
valu
e fo
r sig
ned-
rank
test
of d
iffer
ence
s 0.
799
0.00
00.
006
0.64
00.
404
0.02
10.
635
0.83
9

29
TAB
LE 2
(CO
NTI
NU
ED)
CO
MPA
RIS
ON
OF
FIR
M C
HA
RA
CT
ER
IST
ICS
TO
IND
UST
RY
MEA
NS
AN
D M
EDIA
NS
Pa
nel B
: Yea
r af
ter
the
inve
rsio
n an
noun
cem
ent
Si
ze b
Le
vera
ge
Tota
l ETR
G
row
th in
For
eign
Inc.
Firm
a A
nn. D
ate
SIC
Fi
rm
Indu
stry
M
ean
Indu
stry
M
edia
nFi
rm
Indu
stry
M
ean
Indu
stry
M
edia
nFi
rm
Indu
stry
M
ean
Indu
stry
M
edia
n Fi
rmc
Indu
stry
M
ean
Indu
stry
M
edia
n O
il &
Gas
Tr
iton
Ener
gy
2/8/
1996
13
1,09
894
813
10.
730
0.54
60.
494
0.05
30.
094
0.00
1-2
.166
1.14
50.
332
Tran
soce
an O
ffsho
re
3/15
/199
913
6,
359
1,26
716
90.
370
0.56
20.
501
0.29
70.
092
0.01
12.
675
0.92
0In
sura
nce
Car
rier
s
PXR
E C
orpo
ratio
n 7/
7/19
9963
78
518
,981
1,90
50.
669
0.77
00.
790
00.
171
0.13
51.
471
0.71
50.
444
Ever
est R
eins
uran
ce
9/17
/199
963
7,
013
18,9
811,
905
0.77
40.
770
0.79
00.
231
0.17
10.
135
0.
715
0.44
4W
hite
Mou
ntai
n
9/27
/199
963
3,
545
18,9
811,
905
0.70
50.
770
0.79
00.
350
0.17
10.
135
0.
715
0.44
4O
ther
Hel
en o
f Tro
y 12
/30/
1993
36
133
936
390.
335
0.61
0.44
10.
215
0.20
50.
224
0.07
40.
727
0.42
5Fr
uit o
f the
Loo
m
2/11
/199
822
2,
155
620
313
1.04
00.
737
0.66
30.
350
0.12
10.
073
-0.3
23-0
.436
-0.3
23G
old
Res
erve
11
/24/
1998
10
651,
096
560.
023
0.72
40.
396
00.
068
00.
872
-0.5
53-0
.596
Xom
a 11
/24/
1998
28
281,
388
431.
595
1.02
10.
431
00.
110
0
-0.0
120.
132
Mea
n of
Firm
to In
dust
ry R
atio
-4,6
691,
635
-0.0
290.
106
0.03
30.
087
-0.3
33-0
.071
p-va
lue
for t
est o
f Rat
io=1
(tw
o-ta
iled)
0.
250
0.07
40.
820
0.99
90.
570
0.15
60.
999
0.99
9
Si
ze =
Tot
al a
sset
s (C
ompu
stat
item
#6)
. Lev
erag
e =
Tota
l lia
bilit
ies (
#181
)/Tot
al a
sset
s (#6
). To
tal e
ffect
ive
tax
rate
= c
urre
nt in
com
e ta
x ex
pens
e (d
omes
tic a
nd
fore
ign)
/pre
-tax
inco
me
befo
re in
tere
st e
xpen
se, u
nusu
al o
r non
-rec
urrin
g ite
ms,
and
min
ority
inte
rest
. ((#
16 -
#50)
/(#17
0 +
#15
- #17
- #5
5)).
How
ever
if th
e cu
rren
t inc
ome
tax
expe
nse
is n
egat
ive,
the
effe
ctiv
e ta
x ra
te is
set t
o ze
ro; a
nd, i
f pre
-tax
inco
me
is n
egat
ive
and
curr
ent t
ax e
xpen
se is
pos
itive
, the
effe
ctiv
e ta
x ra
te is
set t
o th
e to
p st
atut
ory
rate
. The
tota
l effe
ctiv
e ta
x ra
te is
mea
sure
d in
a m
anne
r con
sist
ent w
ith p
revi
ous r
esea
rch
(Gup
ta a
nd N
ewbe
rry
1997
; Boa
tsm
an e
t al
. 200
2). G
rowt
h in
fore
ign
inco
me
= A
vera
ge o
f the
yea
r ove
r yea
r per
cent
age
chan
ge in
fore
ign
pre-
tax
inco
me
(ave
rage
of:
(#27
3 t -
#273
t-1)/(
#273
t-1) f
or a
pe
riod
of u
p to
five
yea
rs b
efor
e th
e in
vers
ion
anno
unce
men
t dep
endi
ng o
n da
ta a
vaila
bilit
y).
For f
utur
e gr
owth
, we
use
a pe
riod
exte
ndin
g fr
om th
e ye
ar a
fter t
he
inve
rsio
n an
noun
cem
ent t
o 20
01 d
epen
ding
on
data
ava
ilabi
lity)
. a T
his t
able
incl
udes
obs
erva
tions
for f
irms e
xpat
riatin
g us
ing
an in
vers
ion
stru
ctur
e. W
e ex
clud
e th
e ob
serv
atio
ns fo
r whi
ch th
e ex
patri
atio
ns w
ere
acco
mpl
ishe
d vi
a a
mer
ger.
Com
paris
ons a
re m
ade
for t
he y
ear p
rior t
o th
e in
vers
ion
anno
unce
men
t. Fo
r com
pani
es th
at a
nnou
nced
thei
r inv
ersio
n in
200
2, w
e us
e da
ta fo
r 20
00 d
ata
is u
sed
for t
he c
ompa
rison
bec
ause
200
1 Co
mpu
stat d
ata
is n
ot c
urre
ntly
ava
ilabl
e.
b In
size
com
paris
ons o
f firm
tota
l sal
es to
indu
stry
tota
l sal
es m
eans
and
med
ians
, inf
eren
ces r
emai
n th
e sa
me
as th
ose
for t
otal
ass
ets.
c Inve
rting
firm
s not
repo
rting
suffi
cien
t inf
orm
atio
n fo
r the
cal
cula
tion
of a
vera
ge g
row
th in
fore
ign
inco
me
incl
ude
Ever
est R
eins
uran
ce, L
euca
dia
Nat
iona
l, PX
RE,
Whi
te M
ount
ain
(SIC
63)
, and
XO
MA
(SIC
28)
. Add
ition
ally
, ver
y fe
w fi
rms r
epor
t for
eign
pre
-tax
inco
me
for t
he in
sura
nce
indu
stry
(SIC
63)
in g
ener
al.
For e
xam
ple,
in y
ear 1
998
only
21
of 2
60 (8
%) f
irms r
epor
ted
enou
gh in
form
atio
n to
det
erm
ine
the
aver
age
grow
th in
fore
ign
inco
me.

30
TAB
LE 3
SH
AR
E P
RIC
ES
AN
D R
AW
RE
TU
RN
S O
VE
R P
ER
IOD
S PR
EC
ED
ING
INV
ER
SIO
N A
NN
OU
NC
ME
NT
S
AN
D IN
STIT
UT
ION
AL
OW
NE
RSH
IP P
ER
CE
NT
AG
E P
RIO
R T
O T
HE
INV
ER
SIO
N A
NN
OU
NC
EM
ENT
, RE
POR
TE
D B
Y T
AX
ST
RU
CT
UR
E a
Sh
are
Pric
es P
rior t
o In
vers
ion
Ann
ounc
emen
t b %
Ret
urn
over
Per
iods
Pre
cedi
ng D
ay -5
Com
pany
-2
4 M
onth
s -1
8 M
onth
s-1
2 M
onth
s -6
Mon
ths
-5 D
ays
24 M
onth
s 18
Mon
ths
12 M
onth
s 6
Mon
ths
% S
tock
Hel
d by
Inst
itutio
nal
Ow
ners
c
Pane
l A: S
ingl
e C
ompa
ny In
vers
ions
d
Taxa
ble
to S
hare
hold
ers
G
old
Res
erve
11
.44
8.38
2.
69
2.44
1.
22
-89.
3%
-85.
4%
-54.
6%
-50.
0%
n/
a PX
RE
Cor
pora
tion
30.9
4 33
.19
30.0
6 25
.25
17.9
4 -4
2.0%
-4
6.0%
-4
0.3%
-2
9.0%
89%
In
gers
oll-R
and
57.2
5 44
.13
35.5
0 41
.45
36.2
5 -3
6.7%
-1
7.8%
2.
1%
-12.
5%
91
%
Ever
est R
eins
uran
ce
37.9
4 39
.63
37.5
6 35
.25
28.0
6 -2
6.0%
-2
9.2%
-2
5.3%
-2
0.4%
82%
C
oope
r Ind
ustri
es
53.2
5 41
.56
34.8
1 40
.88
39.5
6 -2
5.7%
-4
.8%
13
.6%
-3
.2%
76%
Fr
uit o
f the
Loo
m
25.3
8 25
.75
39.6
3 27
.13
25.0
6 -1
.2%
-2
.7%
-3
6.8%
-7
.6%
57%
N
oble
Dril
ling
30.3
8 39
.56
42.1
3 30
.00
30.5
0 0.
4%
-22.
9%
-27.
6%
1.7%
88%
N
abor
s Ind
ustri
es
29.4
4 42
.00
54.2
5 42
.20
34.5
5 17
.4%
-1
7.7%
-3
6.3%
-1
8.1%
87%
W
eath
erfo
rd In
tern
at’l
38.1
1 43
.38
54.5
2 24
.43
47.6
3 25
.0%
9.
8%
-12.
6%
95.0
%
90
%
Leuc
adia
Nat
iona
l 22
.56
25.3
1 31
.70
30.4
8 36
.81
63.1
%
45.4
%
16.1
%
20.8
%
37
%
Stan
ley
Wor
ks
25.9
4 25
.94
33.0
0 42
.69
43.3
5 67
.1%
67
.1%
31
.4%
1.
5%
64
%
Trito
n En
ergy
30
.75
32.7
5 32
.38
49.6
3 56
.13
82.5
%
71.4
%
73.4
%
13.1
%
n/
a
C Re
orga
niza
tions
Fost
er W
heel
er
17.1
3 14
.31
10.5
0 7.
69
4.94
-7
1.2%
-6
5.5%
-5
3.0%
-3
5.8%
55%
Tr
anso
cean
Offs
hore
28
.75
44.8
1 45
.56
28.5
0 23
.25
-19.
1%
-48.
1%
-49.
0%
-18.
4%
72
%
Out
boun
d F
Reor
gani
zatio
ns
App
lied
Pow
er (S
pin-
off)
70
.50
35.2
5 37
.06
27.5
0 34
.81
-50.
6%
-1.2
%
-6.1
%
26.6
%
83
%
Xom
a 3.
38
5.13
7.
13
4.88
3.
56
5.6%
-3
0.5%
-5
0.0%
-2
6.9%
8%
Whi
te M
ount
ain
Ins.
107.
75
137.
06
122.
25
123.
00
134.
00
24.4
%
-2.2
%
9.6%
8.
9%
5%

31
TAB
LE 3
(CO
NTI
NU
ED)
SHA
RE
PR
ICE
S A
ND
RA
W R
ET
UR
NS
OV
ER
PE
RIO
DS
PRE
CE
DIN
G IN
VE
RSI
ON
AN
NO
UN
CM
EN
TS
A
ND
INST
ITU
TIO
NA
L O
WN
ER
SHIP
PE
RC
EN
TA
GE
PR
IOR
TO
TH
E IN
VE
RSI
ON
, RE
POR
TE
D B
Y T
AX
ST
RU
CT
UR
E a
Sh
are
Pric
es P
rior t
o In
vers
ion
Ann
ounc
emen
t b %
Ret
urn
over
Per
iods
Pre
cedi
ng D
ay -5
Com
pany
-2
4 M
onth
s -1
8 M
onth
s-1
2 M
onth
s -6
Mon
ths
-5 D
ays
24 M
onth
s 18
Mon
ths
12 M
onth
s 6
Mon
ths
% S
tock
Hel
d by
Inst
itutio
nal
Ow
ners
c
Pane
l B: M
erge
r-R
elat
ed E
xpat
riat
ions
Tren
wic
k 36
.25
36.0
6 31
.50
28.1
3 17
.38
-52.
1%
-51.
8%
-44.
8%
-38.
2%
38
%
Glo
bal M
arin
e 17
.81
25.0
0 32
.25
28.7
1 15
.74
-11.
6%
-37.
0%
-51.
2%
-45.
2%
78
%
Ver
itas/
PGS
15.5
0 27
.56
25.5
6 35
.20
14.5
0 -6
.5%
-4
7.4%
-4
3.3%
-5
8.8%
92%
Ty
co
26.1
9 30
.75
18.5
0 21
.44
30.6
9 17
.2%
-0
.2%
65
.9%
43
.1%
85%
R
&B
Fal
con
13.3
8 5.
69
12.1
3 13
.94
23.6
9 77
.1%
31
6.5%
95
.4%
70
.0%
65%
a W
ithin
eac
h ta
x st
ruct
ure,
firm
s are
rank
ed b
y th
e ra
w re
turn
s ove
r the
24-
mon
th p
erio
d pr
eced
ing
the
anno
unce
men
t (lo
wes
t to
high
est).
b
Shar
e pr
ices
are
adj
uste
d fo
r sto
ck sp
lits o
ccur
ring
with
the
time
perio
d de
pict
ed a
bove
. c
Inst
itutio
nal o
wne
rshi
p is
the
perc
enta
ge o
f sha
res h
eld
by fi
nanc
ial i
nstit
utio
ns in
clud
ing
bank
s, in
vest
men
t firm
s, in
sura
nce
firm
s, co
llege
end
owm
ents
and
13
F m
oney
man
ager
s. D
ata
wer
e ob
tain
ed fr
om M
oody
’s H
andb
ook
of C
omm
on S
tock
s, St
anda
rd &
Poo
r’s S
tock
Rep
orts
, and
Sta
ndar
d &
Poo
r’s S
ecur
ity
Ow
ner’
s Sto
ck G
uide
. d
McD
erm
ott a
nd H
elen
of T
roy
are
excl
uded
from
this
ana
lysi
s bec
ause
bot
h in
verte
d pr
ior t
o th
e is
suan
ce o
f Reg
ulat
ion
§ 1.
367(
a)-3
in D
ecem
ber 1
996.
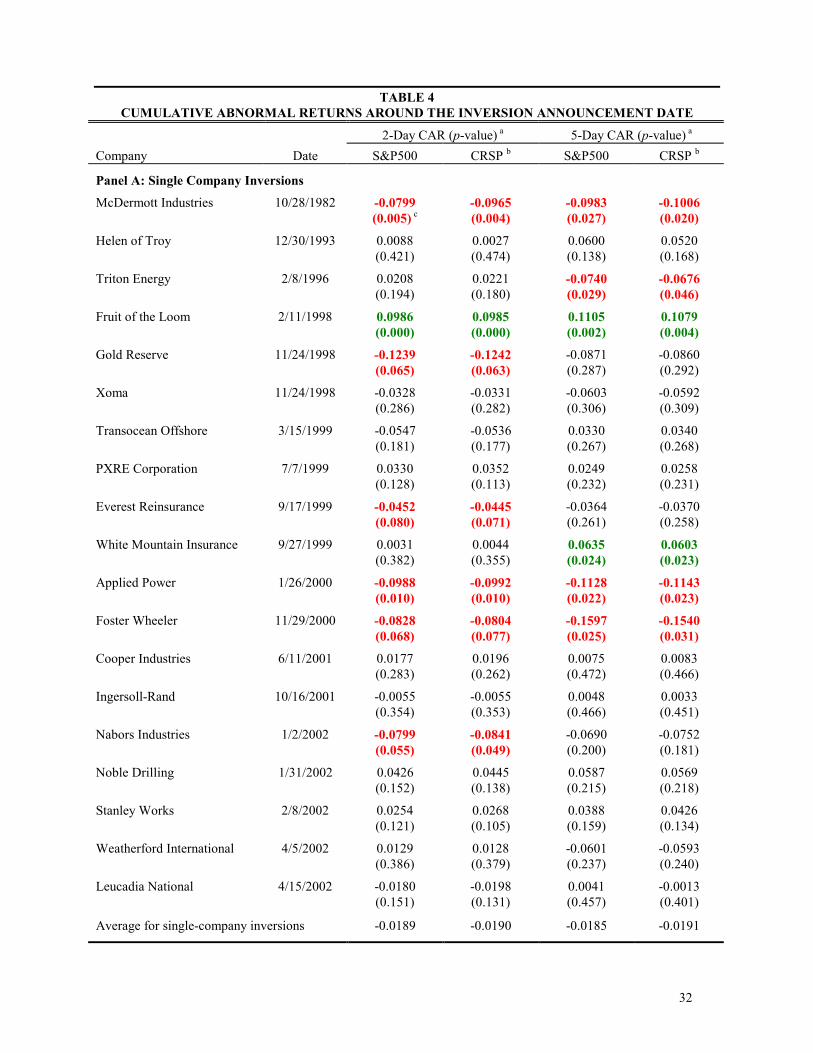
32
TABLE 4 CUMULATIVE ABNORMAL RETURNS AROUND THE INVERSION ANNOUNCEMENT DATE
2-Day CAR (p-value) a 5-Day CAR (p-value) a Company Date S&P500 CRSP b S&P500 CRSP b
Panel A: Single Company Inversions McDermott Industries 10/28/1982 -0.0799 -0.0965 -0.0983 -0.1006 (0.005) c (0.004) (0.027) (0.020)
Helen of Troy 12/30/1993 0.0088 0.0027 0.0600 0.0520 (0.421) (0.474) (0.138) (0.168)
Triton Energy 2/8/1996 0.0208 0.0221 -0.0740 -0.0676 (0.194) (0.180) (0.029) (0.046)
Fruit of the Loom 2/11/1998 0.0986 0.0985 0.1105 0.1079 (0.000) (0.000) (0.002) (0.004)
Gold Reserve 11/24/1998 -0.1239 -0.1242 -0.0871 -0.0860 (0.065) (0.063) (0.287) (0.292)
Xoma 11/24/1998 -0.0328 -0.0331 -0.0603 -0.0592 (0.286) (0.282) (0.306) (0.309)
Transocean Offshore 3/15/1999 -0.0547 -0.0536 0.0330 0.0340 (0.181) (0.177) (0.267) (0.268)
PXRE Corporation 7/7/1999 0.0330 0.0352 0.0249 0.0258 (0.128) (0.113) (0.232) (0.231)
Everest Reinsurance 9/17/1999 -0.0452 -0.0445 -0.0364 -0.0370 (0.080) (0.071) (0.261) (0.258)
White Mountain Insurance 9/27/1999 0.0031 0.0044 0.0635 0.0603 (0.382) (0.355) (0.024) (0.023)
Applied Power 1/26/2000 -0.0988 -0.0992 -0.1128 -0.1143 (0.010) (0.010) (0.022) (0.023)
Foster Wheeler 11/29/2000 -0.0828 -0.0804 -0.1597 -0.1540 (0.068) (0.077) (0.025) (0.031)
Cooper Industries 6/11/2001 0.0177 0.0196 0.0075 0.0083 (0.283) (0.262) (0.472) (0.466)
Ingersoll-Rand 10/16/2001 -0.0055 -0.0055 0.0048 0.0033 (0.354) (0.353) (0.466) (0.451)
Nabors Industries 1/2/2002 -0.0799 -0.0841 -0.0690 -0.0752 (0.055) (0.049) (0.200) (0.181)
Noble Drilling 1/31/2002 0.0426 0.0445 0.0587 0.0569 (0.152) (0.138) (0.215) (0.218)
Stanley Works 2/8/2002 0.0254 0.0268 0.0388 0.0426 (0.121) (0.105) (0.159) (0.134)
Weatherford International 4/5/2002 0.0129 0.0128 -0.0601 -0.0593 (0.386) (0.379) (0.237) (0.240)
Leucadia National 4/15/2002 -0.0180 -0.0198 0.0041 -0.0013 (0.151) (0.131) (0.457) (0.401)
Average for single-company inversions -0.0189 -0.0190 -0.0185 -0.0191

33
TABLE 4 (CONTINUED) CUMULATIVE ABNORMAL RETURNS AROUND THE INVERSION ANNOUNCEMENT DATE
2-Day CAR (p-value) a 5-Day CAR (p-value) a
Company Date S&P500 CRSP b S&P500 CRSP b
Panel B: Merger-Related Transactions
Tyco (with ADT) 3/17/1997 -0.0516 -0.0477 -0.0122 -0.0085 (0.002) c (0.006) (0.325) (0.359)
Trenwick (w/ LaSalle RE) 12/19/1999 -0.1505 -0.1564 -0.1180 -0.1294 (0.001) (0.001) (0.054) (0.035)
R&B Falcon (w/ Transocean) 8/21/2000 0.0584 0.0585 0.1465 0.1457 (0.179) (0.170) (0.061) (0.062)
Global Marine (w/ Sante Fe 9/3/2001 0.0433 0.0462 0.0705 0.0702 International) (0.193) (0.177) (0.173) (0.170)
Veritas (with Petroleum Geo- 11/26/2001 -0.1088 -0.1116 -0.1122 -0.1162 Services) (0.049) (0.048) (0.120) (0.117)
Average for merger-related transactions -0.0419 -0.0422 -0.0051 -0.0076
Average across all transactions (Panels A and B combined)
-0.0237 -0.0239 -0.0157 -0.0167
a 2-day CAR’s are computed over days 0 to +1 relative to announcement day 0, and 5-day CAR’s are computed
over days –2 to +2. b We use value-weighted daily market returns provided by the Center for Research in Security Prices (CRSP) in
computing abnormal returns. Because CRSP data is unavailable for dates in 2002, we compute predicted values of the CRSP value-weighted return based on OLS regression estimates obtained by regressing this measure on daily returns to the NASDAQ and S&P500 indices for 2000 and 2001. The R-squared for this regression is 0.98. Actual values of the CRSP value-weighted market return will be substituted for these estimates when data become available.
c We use approximate randomization to assess the statistical significance of each stock’s CAR values. Specifically, for each stock we construct a distribution of 999 random two- (and five-) day CAR values using daily firm and market returns from two (five) randomly selecting trading days over the 250-trading day period preceding day –5 (relative to announcement day 0). We then add the actual two- (five-) day CAR value to this distribution and assess its statistical significance relative to the randomly generated observations. For example, if the actual CAR value were the 50th most extreme positive value in the distribution of 1000 observations, then our assessed significance level would be 0.05 (i.e., 50/1000).

34
TABLE 5 CUMULATIVE ABNORMAL RETURNS OVER PERIODS AFTER
SINGLE-COMPANY INVERSION ANNOUNCMENTS (LISTED IN DECREASING ORDER OF ONE-MONTH CAR VALUES)
Abnormal Return Accumulation Period a
Company Trading Days of Available Data
One Month (Days +3, +21)
Three Months (Days +3, +63)
Six Months (Days +3, +125)
Foster Wheeler 123 0.2989 2.8984 2.2021 Weatherford International 89 0.1948 0.1012 0.1128 Noble Drilling 123 0.1182 0.4193 0.2143 Fruit of the Loom 123 0.0939 0.1506 -0.1080 Stanley Works 123 0.0643 0.0111 -0.0380 Ingersoll-Rand 123 0.0395 -0.0517 0.2263 Cooper Industries 123 0.0182 0.5173 0.0364 Nabors Industries 123 0.0108 0.3037 0.2363 McDermott 93 -0.0036 0.0972 -0.0893 Helen of Troy 32 -0.0213 0.0270 0.0270 Leucadia National 83 -0.0406 -0.0080 0.0930 White Mountain Insurance 123 -0.0616 -0.3082 -0.2956 Transocean Offshore 123 -0.0627 -0.0232 0.2636 Gold Reserve 123 -0.0815 0.1005 0.0598 Triton Energy 123 -0.0902 -0.0292 -0.1942 Everest Reinsurance 123 -0.1426 -0.2210 -0.0625 Xoma 23 -0.1499 -0.1367 -0.1367 PXRE Corporation 123 -0.1627 -0.1696 -0.4157 Applied Power 123 -0.1943 -0.0215 0.3939 Overall Average b -0.0091 0.1925 0.1329 Average excluding Foster Wheeler b -0.0262 0.0422 0.0180 Number with Positive CAR Values 8 10 11 Number with Negative CAR Values 11 9 8 a The accumulation period ends before the end of the indicated period if data were unavailable (McDermott, Helen
of Troy, and Xoma) or, for announcements occurring in 2002, if 125 trading days had not lapsed as of August 14, 2002 (Weatherford International and Leucadia National). CAR values are calculated by multiplicatively combining raw returns and CRSP value-weighted market returns over the indicated periods, and then subtracted the accumulated market return from the accumulated raw return.
b None of these average values are significantly different than zero based on t-tests and nonparametric sign and signed rank tests.