fire emissions (planned and unplanned): activity data ... · fire emissions (planned and...
TRANSCRIPT
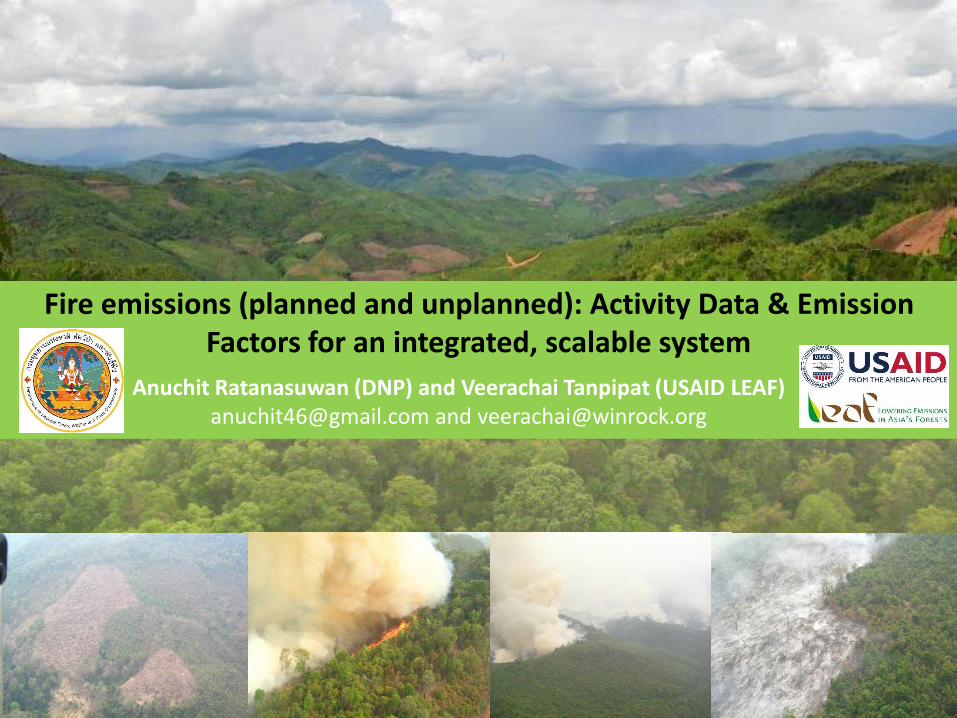
Fire emissions (planned and unplanned): Activity Data & Emission Factors for an integrated, scalable system
Anuchit Ratanasuwan (DNP) and Veerachai Tanpipat (USAID LEAF)[email protected] and [email protected]
Contents
• Overview of Thailand Forest Fire
• DNP’s Fire Experiment and Burned Areas Detection Methods and Semi-Auto Detection: SAD
• Fire Fuel Field Data Collection
• Emissions Calculation
• Problems and Challenges
• Conclusions
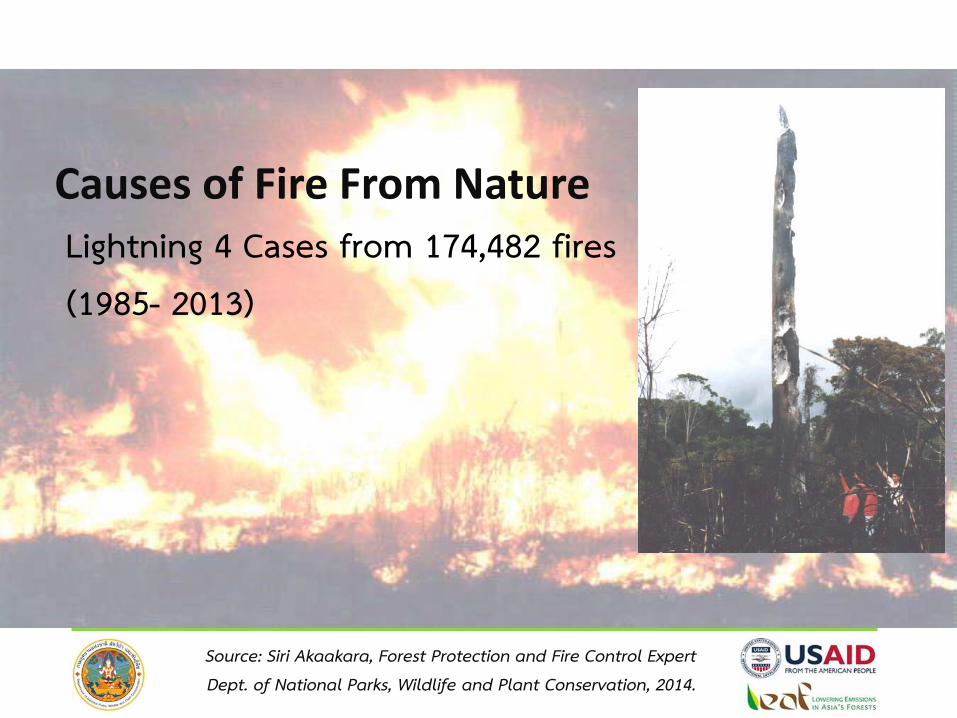
Causes of Fire From NatureLightning 4 Cases from 174,482 fires(1985- 2013)

Drivers1. Gathering non-timber products 37 %
2. Agriculture debris burning 20 %
3. Hunting 17 %
4. Incendiary fire 5 %
5. Cattle raise 4 %
6. Carelessness 4 %
7. Unidentified causes 13 %

Fire Experiment at Huay Kha Khang Wildlife Sanctuary
The burned areas can be detected by EOS (Landsat 7 ETM+ and MODIS-Terra/Aqua more than 2 months by utilizing NDVI, NBR, temperature, and conventional false color composite.
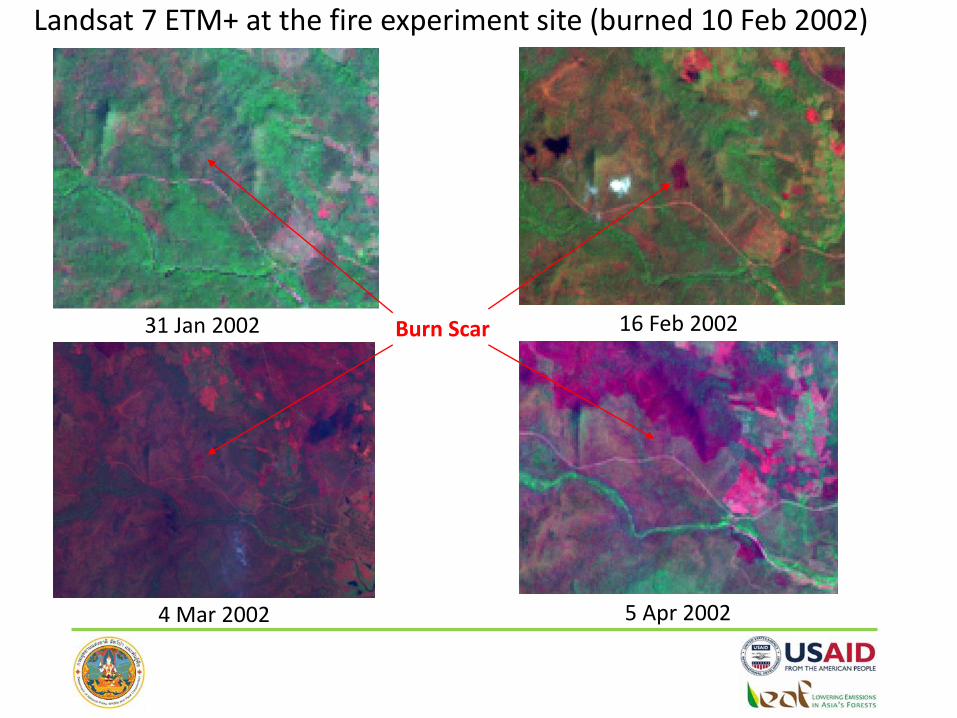
Landsat 7 ETM+ at the fire experiment site (burned 10 Feb 2002)
31 Jan 2002
4 Mar 2002 5 Apr 2002
16 Feb 2002Burn Scar
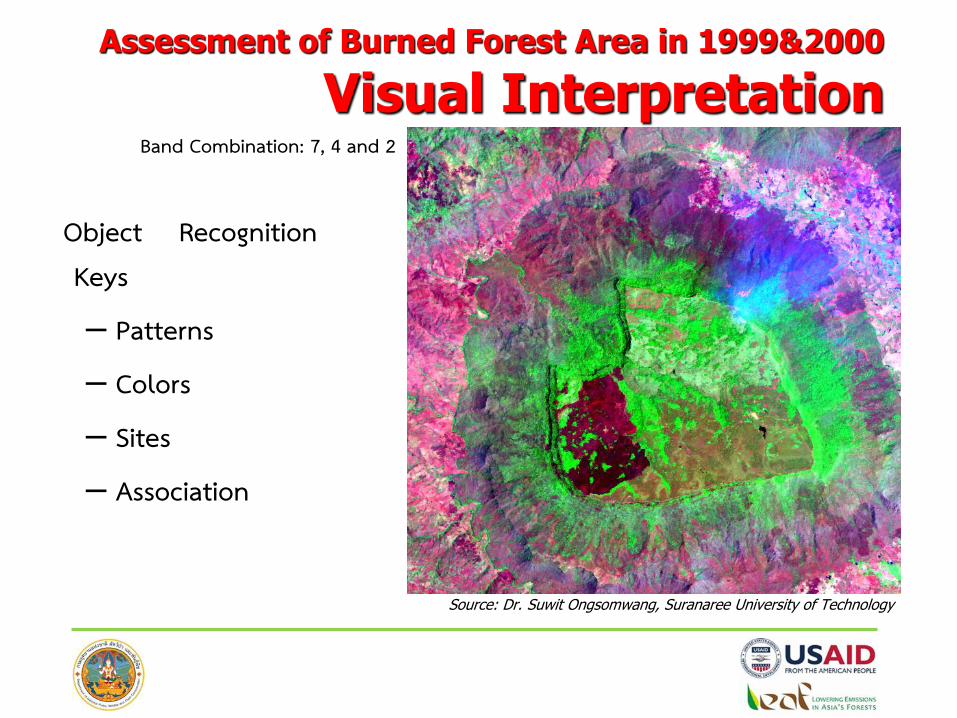
Assessment of Burned Forest Area in 1999&2000
Visual Interpretation
Object Recognition Keys
– Patterns
– Colors
– Sites
– Association
Source: Dr. Suwit Ongsomwang, Suranaree University of Technology
Band Combination: 7, 4 and 2
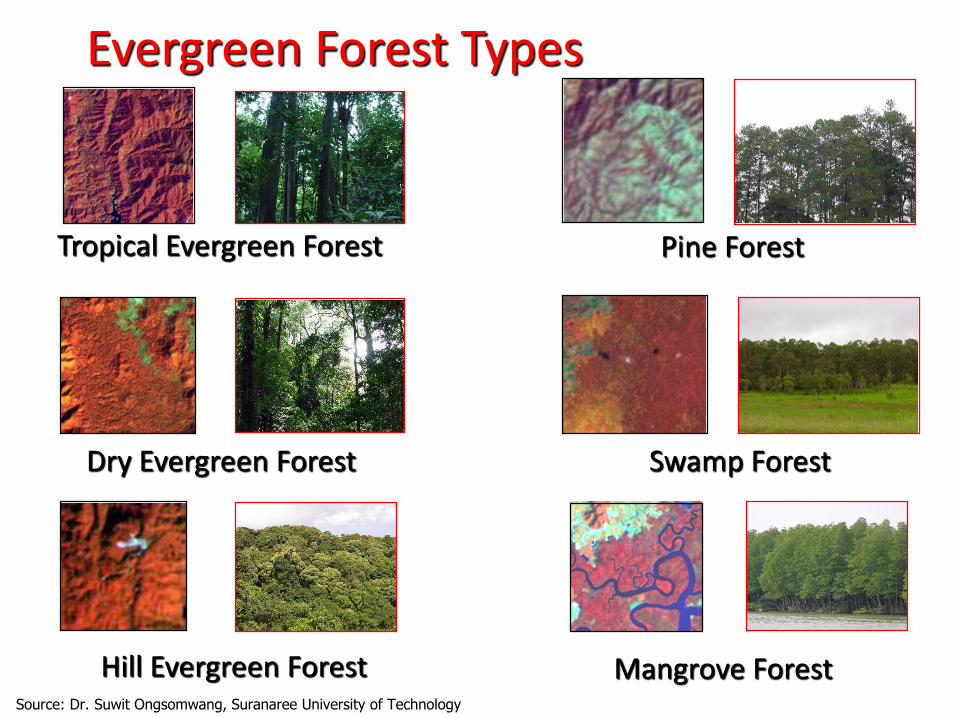
Evergreen Forest Types
Tropical Evergreen Forest
Dry Evergreen Forest
Hill Evergreen Forest Mangrove Forest
Swamp Forest
Pine Forest
Source: Dr. Suwit Ongsomwang, Suranaree University of Technology
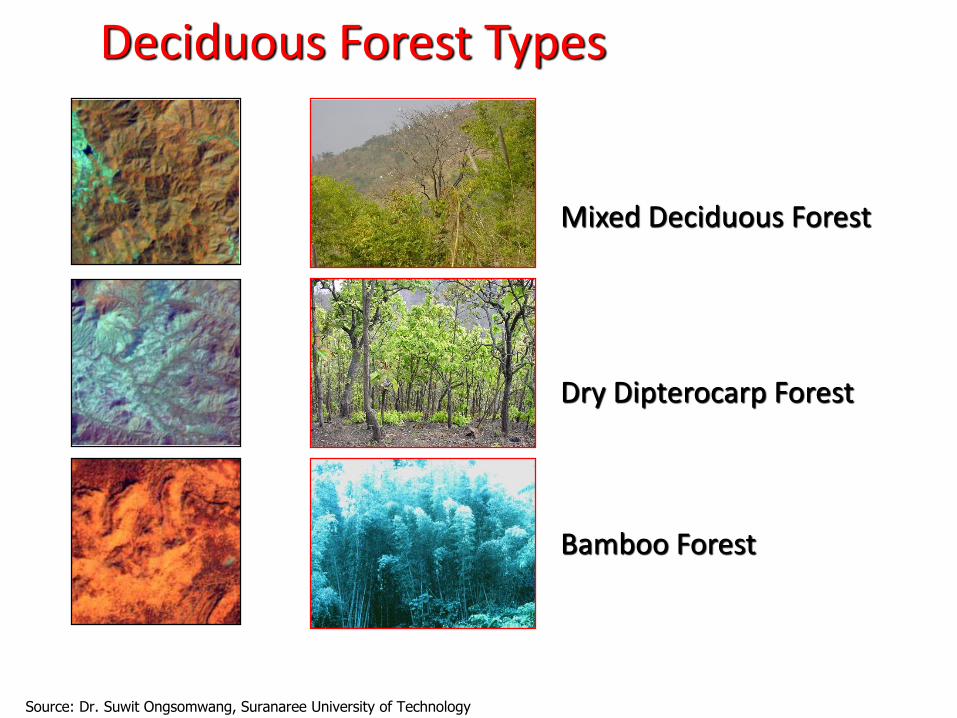
Deciduous Forest Types
Mixed Deciduous Forest
Dry Dipterocarp Forest
Bamboo Forest
Source: Dr. Suwit Ongsomwang, Suranaree University of Technology

Burned Areas Model:Model has been developed to identify burned areas using the difference of spectral reflectance values.
Semi-Auto Detection: SAD

Data Preparation: Using LS8 data downloading from USGS Archive to create GRID
LS8 :RGB::7 4 3Date 2014111
Burned Area
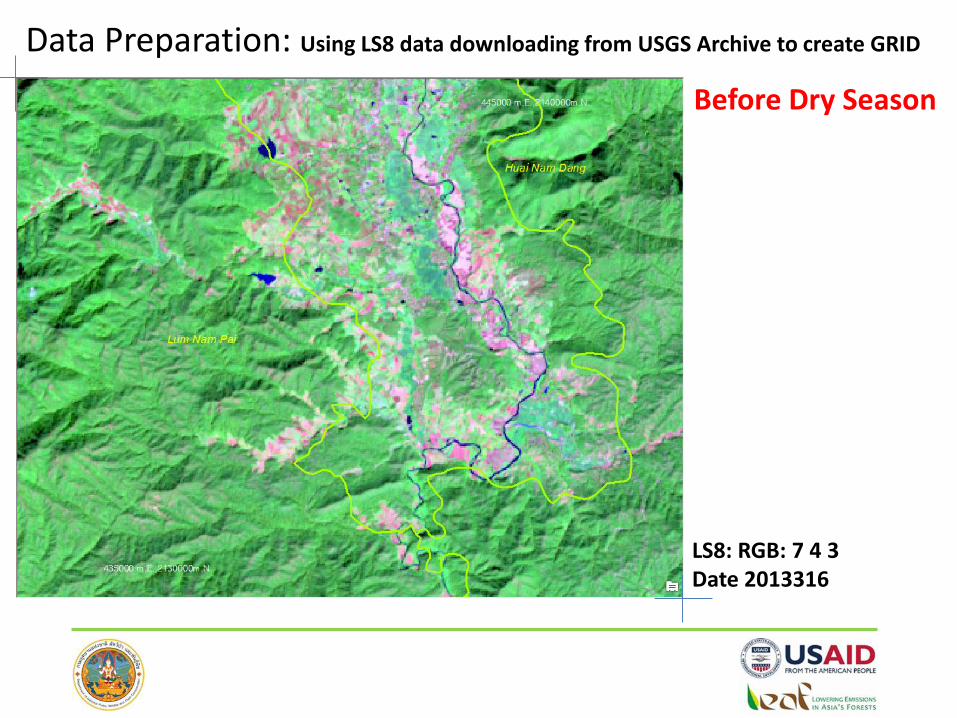
Data Preparation: Using LS8 data downloading from USGS Archive to create GRID
LS8: RGB: 7 4 3Date 2013316
Before Dry Season
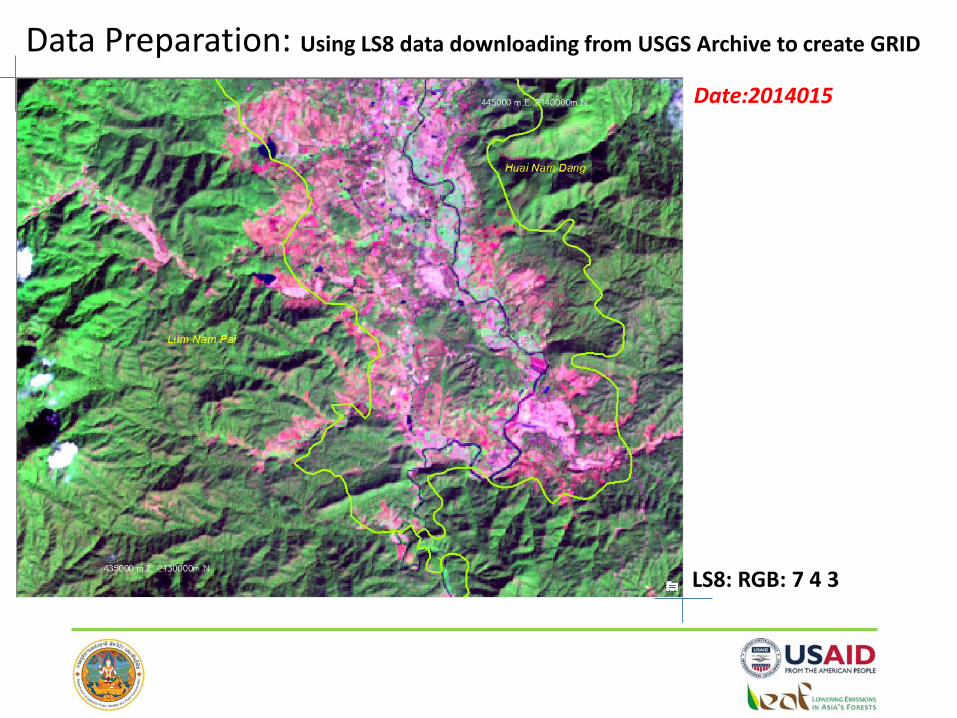
Data Preparation: Using LS8 data downloading from USGS Archive to create GRID
LS8: RGB: 7 4 3
Date:2014015

Data Preparation: Using LS8 data downloading from USGS Archive to create GRID
LS8: RGB: 7 4 3
Date:2014031
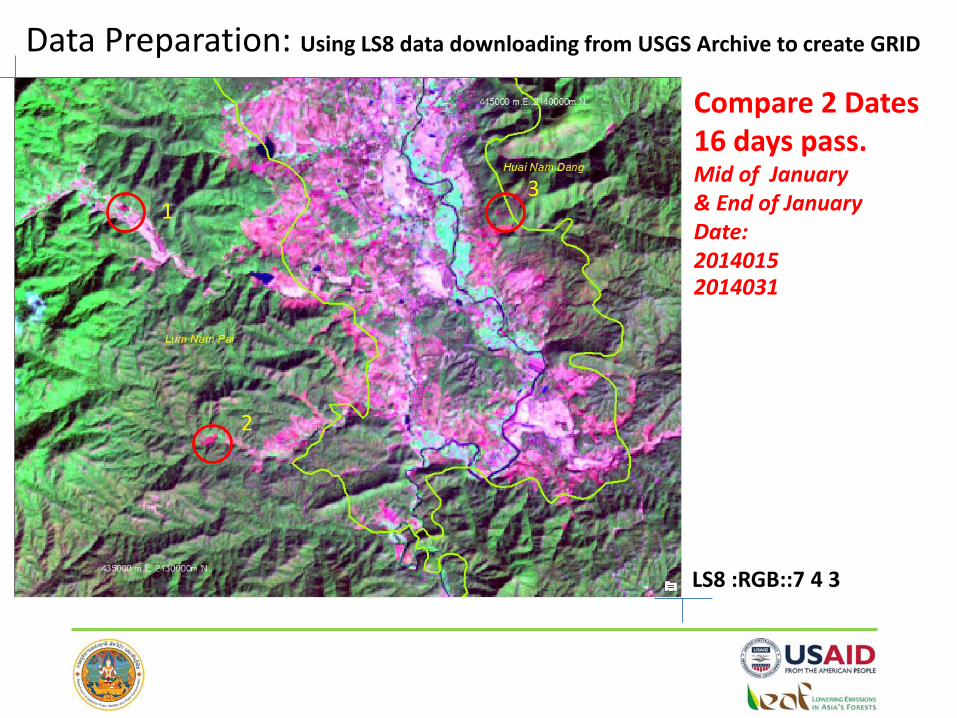
Data Preparation: Using LS8 data downloading from USGS Archive to create GRID
LS8 :RGB::7 4 3
Compare 2 Dates16 days pass.Mid of January& End of JanuaryDate:20140152014031
1
2
3

Data Preparation: Using LS8 data downloading from USGS Archive to create GRID
LS8 :RGB::7 4 3
Compare 2 Dates16 days pass.End of January& Mid of FebruaryDate:20140312014047
1
2
3
4
56
7
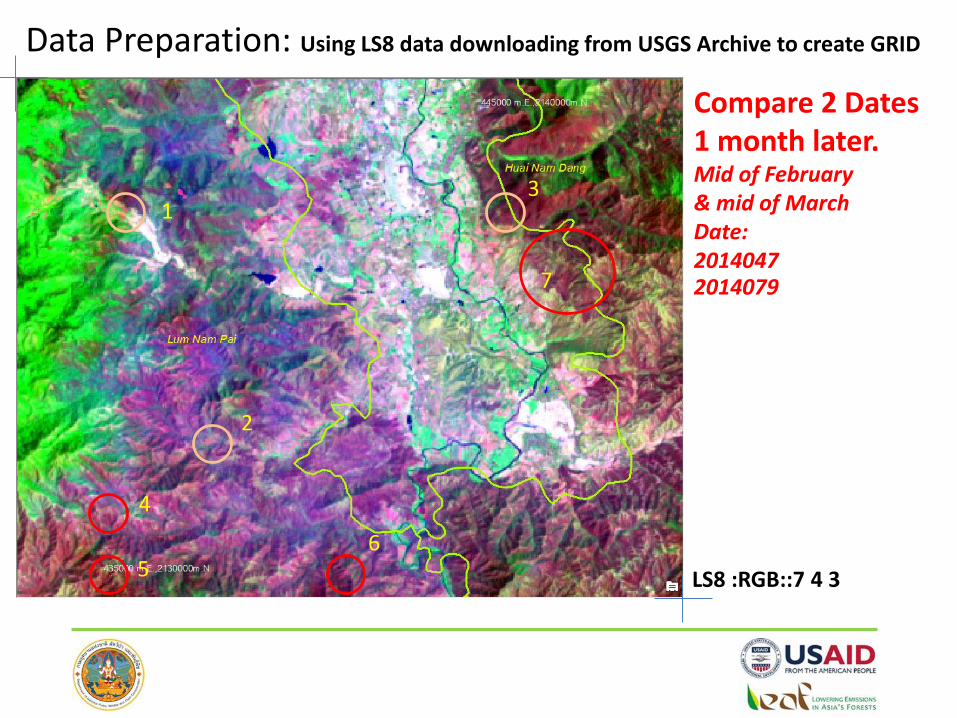
Data Preparation: Using LS8 data downloading from USGS Archive to create GRID
LS8 :RGB::7 4 3
Compare 2 Dates1 month later.Mid of February& mid of MarchDate:20140472014079
1
2
3
4
56
7

DN of forested area.
@442952 m.E.,2141846 m.N.
Band1 Band2 Band3 Band4 Band5 Band6 Band7
D2013316 9300 8552 8194 7571 16344 12910 8644
D2013364 9272 8564 8056 7513 14602 12029 8559
D2014015 9545 8802 8285 8042 14378 12584 8976
D2014031 9444 8783 8293 8510 14567 14023 9954
D2014047 9851 9265 9008 9987 16331 17456 12226
D2014079 11795 11057 10159 10503 14615 17809 13785
D2014095 12085 11245 10397 10366 15142 16595 12593
D2014111 12062 11184 10521 10234 16422 16530 11897
D2015002 8997 8420 8028 8194 14457 12754 9026
D2015018 9810 9139 8570 8578 14590 14498 10245
6000
8000
10000
12000
14000
16000
18000
20000
DN
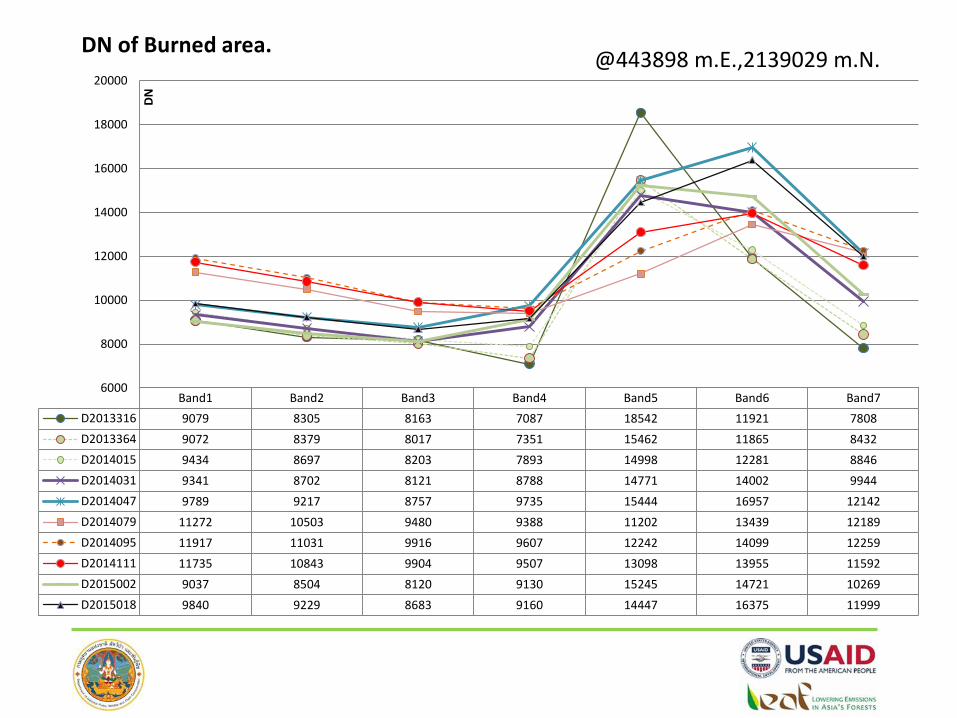
DN of Burned area.
Band1 Band2 Band3 Band4 Band5 Band6 Band7
D2013316 9079 8305 8163 7087 18542 11921 7808
D2013364 9072 8379 8017 7351 15462 11865 8432
D2014015 9434 8697 8203 7893 14998 12281 8846
D2014031 9341 8702 8121 8788 14771 14002 9944
D2014047 9789 9217 8757 9735 15444 16957 12142
D2014079 11272 10503 9480 9388 11202 13439 12189
D2014095 11917 11031 9916 9607 12242 14099 12259
D2014111 11735 10843 9904 9507 13098 13955 11592
D2015002 9037 8504 8120 9130 15245 14721 10269
D2015018 9840 9229 8683 9160 14447 16375 11999
6000
8000
10000
12000
14000
16000
18000
20000
DN
@443898 m.E.,2139029 m.N.
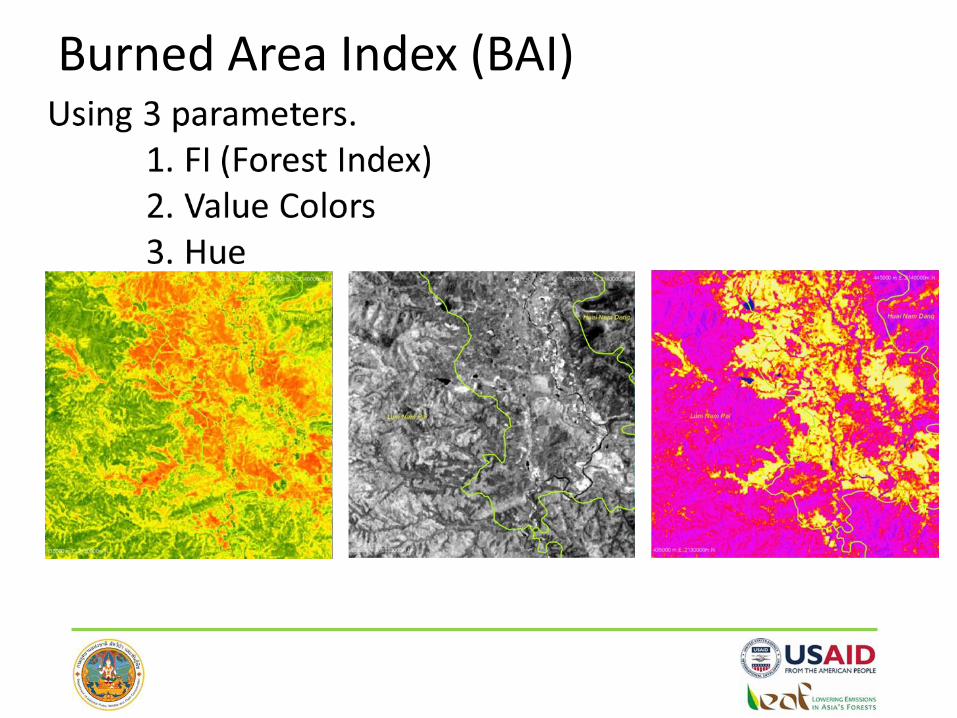
Burned Area Index (BAI)

Forest Index

Value Color Index

Hue Index
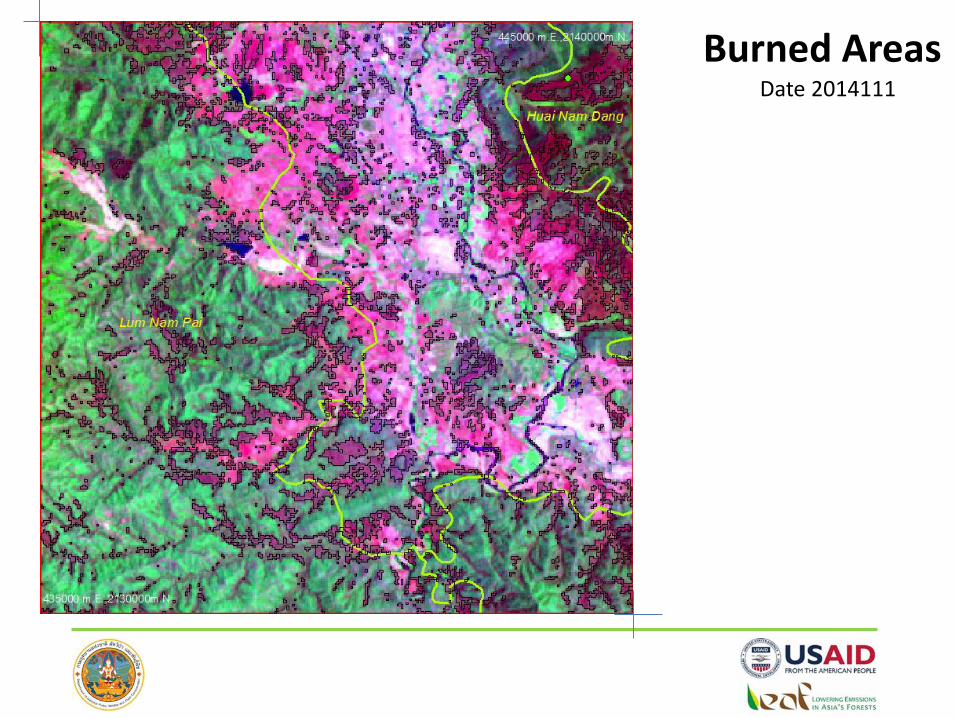
Burned AreasDate 2014111

Burned AreasDate 2014111
Burned areas’ NDVI changes.

Pictures of fire fuel field data collection in Chiang-Rai, DNP
Source: Forest Fire Division, DNP

Amount of Fire fuels in Thailand from Forest Fire Control Division, DNP
Year 2012 Dry Dipterocarp Forest
Month Leaves Twigs Grass Secondary Total (kg/ha)
Jan 2,116 1,155 1,097 1,060 5,428
Feb 2,076 829 628 816 4,064
Mar 2,095 899 591 1,015 4,482
Apr 2,304 1,012 826 940 5,136
May 2,593 958 770 727 5,050
Jun 2,690 1,252 1,111 911 5,964
Jul 1,978 1,089 1,195 867 5,130
Aug 2,280 1,302 1,231 962 5,775
Sep 1,392 696 352 720 3,159
Oct 2,248 833 1,072 1,168 5,321
Nov 1,306 840 965 911 4,093
Dec 1,346 809 876 827 3,851
Source: Forest Fire Division, DNP

Forest fire emissions calculation
Source: 2006 IPCC Guidelines for National GHG Inventories, V.4 AFOLU, pp. 2.42-2.43
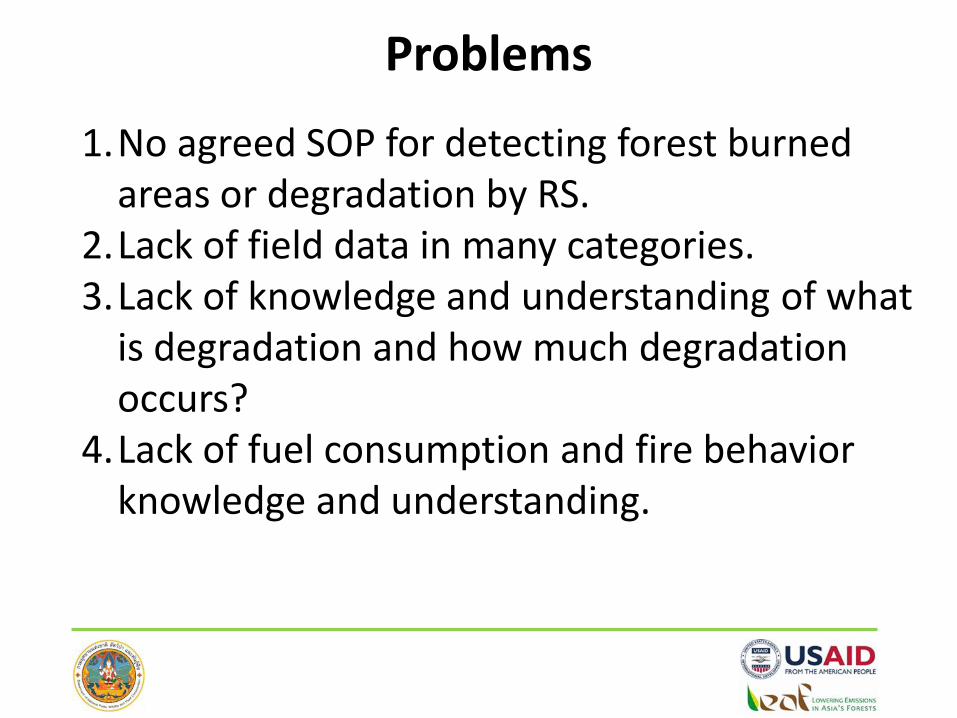
Problems
1.No agreed SOP for detecting forest burned areas or degradation by RS.
2.Lack of field data in many categories.3.Lack of knowledge and understanding of what
is degradation and how much degradation occurs?
4.Lack of fuel consumption and fire behavior knowledge and understanding.

Challenges 1.How to create a systematic national forest
burned areas and degradation detection and inventory system in place?
2.How to initial more forest fire studies and researches on the ground and keep those running?
3.How to educate the importance of degradation to forest cover change and understanding its characteristics?
4.How to validate the emissions results found?

In conclusionHao et al (2014) stated that “The spatial and temporal extent of fires and the sizes of burned areas are critical parameters in the estimation of fire emissions.” Larkin et al (2014) stated “. . . every components used to calculate Wildland fire emissions is uncertain . . . .” Ottmar (2014) stated “. . . estimates of greenhouse gas emissions will not improve unless we find ways to better connect fuels and consumption to remote sensing data.”
Unfortunately, we (Thailand) are lacking of both knowledge and understanding of the above issues.
Source: Hao, W. M., Larkin, N. K., 2014. Wild fire emissions, carbon, and climate: Wildland fire detection and burned areas in the United States. 317, 20-25. Larkin, N. K., Raffuse S. M., Strand, T. M., 2014. Wildland fire emissions, carbon, and climate: U.S. emissions inventries. Ottmar, R. D., 2014. Wildland fire emissions, carbon, and climate: Modelling fuel consumption. For. Ecol. Manage. 317, 41-50.
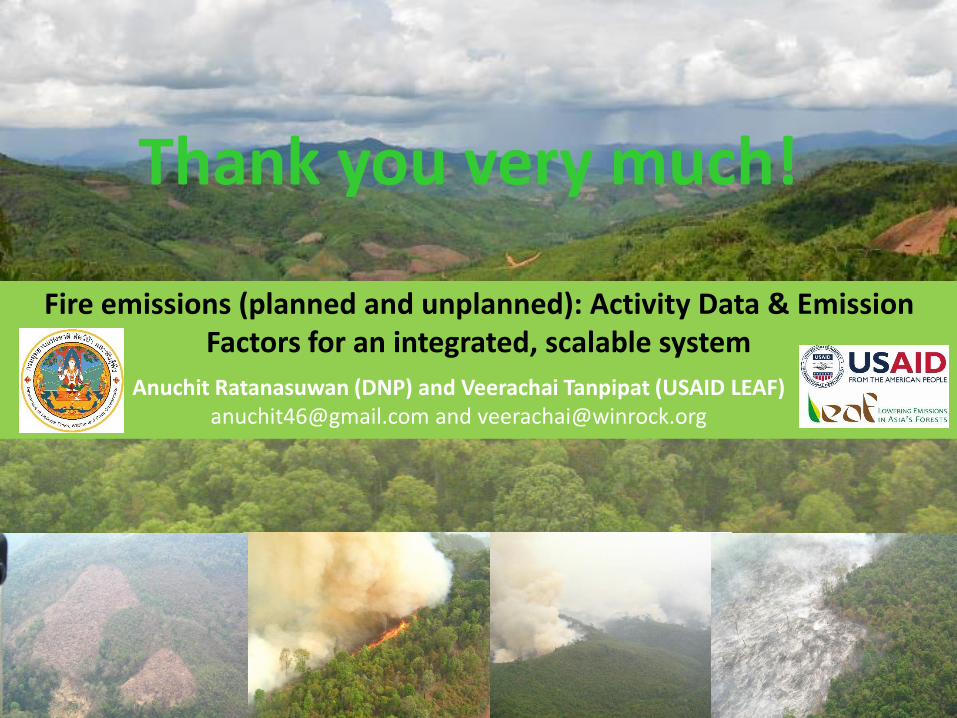
Fire emissions (planned and unplanned): Activity Data & Emission Factors for an integrated, scalable system
Anuchit Ratanasuwan (DNP) and Veerachai Tanpipat (USAID LEAF)[email protected] and [email protected]
Thank you very much!