fire & emergency services - mississauga€¦ · executive summary of fire & emergency...
TRANSCRIPT

2015–2018 Business Plan& 2015 Budget
Fire & EmergencyServices

Table of Contents Executive Summary of Fire & Emergency Services .................................................................................................................................... 3 Existing Core Services ................................................................................................................................................................................... 4
Vision, Mission, Service Delivery Model ....................................................................................................................................................... 4 Goals of Service ............................................................................................................................................................................................ 5
Looking Back ................................................................................................................................................................................................. 7
Existing Service Levels, Trends, Benchmarks & Efficiencies ....................................................................................................................... 8
Engaging Our Customers .............................................................................................................................................................................. 9
Opportunities and Challenges ..................................................................................................................................................................... 11
Implementing the Strategic Plan ................................................................................................................................................................. 14 Required Resources ................................................................................................................................................................................... 15
Facilities & Equipment ................................................................................................................................................................................. 15
Technology .................................................................................................................................................................................................. 17
Human Resources ...................................................................................................................................................................................... 18
Proposed Operating & Capital Budgets ..................................................................................................................................................... 20 Operating ..................................................................................................................................................................................................... 20
Proposed Budget by Program ................................................................................................................................................................. 20
Summary of Proposed 2015 Budget ....................................................................................................................................................... 21
Summary of Proposed 2015 Budget and 2016-2018 Forecast .............................................................................................................. 21
Changes to Maintain Current Service Levels Including Prior Year’s Budget Decisions ......................................................................... 22
Proposed New Initiatives and New Revenues ........................................................................................................................................ 23
Budget Requests ......................................................................................................................................................................................... 24
Capital ......................................................................................................................................................................................................... 34
Proposed 2015-2024 Capital Budget by Program .................................................................................................................................. 34
Proposed 2015-2024 Capital Budget by Funding Source ...................................................................................................................... 34
Proposed 2015 Capital Budget Detail ..................................................................................................................................................... 35
Performance Measures................................................................................................................................................................................. 37 Balanced Scorecard .................................................................................................................................................................................... 39

This page left blank intentionally
F-2 2015-2018 Business Plan & 2015 Budget

Executive Summary of Fire & Emergency Services Mission: To protect life, property and the environment in Mississauga from all perils through education, prevention, investigation, training, rescue, fire suppression, dangerous goods containment and life support services.
This service is provided by:
• 616 suppression staff operating 24 hours per day, 365 days per year on four shifts with 30 front line suppression vehicles, nine reserve and eight specialty vehicles;
• Communications (emergency dispatch) staff operating 24 hours per day 365 days per year;
• Fire Prevention and Life Safety staff who help to develop and implement community educational programs and support fire safety in the community;
• Fire Training staff who provide training and education to all fire personnel to ensure the safety of both the community and staff;
• Fleet/Building Maintenance staff who ensure the ongoing reliability of the front line vehicles and safe working conditions for all staff; and
• Administration staff who oversee that all functions of Mississauga Fire and Emergency Services (MFES) are delivered in an effective and efficient manner.
Interesting facts about this service:
• MFES responds to over 25,000 incidents annually of which over 19,000 are classified as emergencies;
• Suppression crews visit more than 30,000 residences in Mississauga each year to promote fire safety;
• All front line vehicles now carry epinephrine auto injector (EPI) pens and all fire crews have been trained to provide symptom assist;
• All front line fire trucks carry oxygen kits for dogs and cats and crews have been trained to provide oxygen to dogs and cats using specially fitted masks;
• MFES crews participate in over 200 station and truck visits annually; and
• In 2013, 36 people with cardiac conditions had positive outcomes as a direct result of the timely arrival of MFES staff with defibrillator equipment.
Highlights of the Business Plan include:
• Enhancing public education programs; • Reviewing inspection cycles for higher risk occupancies; • Addressing MFES response time challenges; and • Implementing the recommendations from the 2014 Future
Directions Fire Master Plan; and prioritizing state of good repair projects to extend lifecycle of facilities and equipment.
Net Investment ($000's) 2015 2016 2017 2018
Operating 96,913 100,386 104,219 106,785
Capital 4,638 5,959 9,150 5,909
2015-2018 Business Plan & 2015 Budget F-3

Existing Core Services
Vision, Mission, Service Delivery Model
Vision
We are a progressive organization dedicated to preserving life, property and the environment in Mississauga.
Mission
To protect life, property and the environment in Mississauga from all perils through education, prevention, investigation, training, rescue, fire suppression, dangerous goods containment and life support services.
Fire Safety in the Home
Fire and Emergency Services
Administration
Fire Prevention and Life Safety
Suppression
Training
Communications
Fleet/Facilities and Equipment
F-4 2015-2018 Business Plan & 2015 Budget

Goals of Service Mississauga Fire and Emergency Services primary goals for the 2015-2018 Business Plan cycle are to improve response time, to make fire prevention and public education a priority, to address new threats related to growth and development and to proactively manage existing assets and infrastructure. They will be reflected through the following priority action plan.
MFES Priorities Action Plan
Fire Prevention and Public Education • 1 FTE in Plans Examination to address backlog;
• Initiate an operational review of plans examination;
• Expand existing public education programs;
• Develop and deliver public education programs targeting higher risk occupancies such as high rise and long term care facilities; and
• Increase the frequency of mandatory inspection cycles for higher risk occupancies.
State of Good Repair • Prioritize state of good repair projects to extend lifecycle of facilities and equipment;
• Complete station rehabilitation projects; and
• Complete fleet lifecycle study.
Training • Train existing staff to respond to more complex high rise buildings and structures constructed with lightweight materials; and
• Begin to develop new training programs for structural collapse and heavy rescue to address Light Rail Transit (LRT).
Fire Stations
• Construct and staff new stations as per 2014 Future Directions Fire Master Plan.
2015-2018 Business Plan & 2015 Budget F-5

MFES Priorities Action Plan
Strategy and Innovation • Initiate a comprehensive marketing plan for the GWMC;
• Consider Centre for Public Safety Excellence Accreditation (CFAI);
• Use social media, and other technology to provide regular and consistent messaging related to public education, operational incidents and notices to the community;
• Information Technology (IT) Service Plan to improve service delivery through technology;
• Drive Lean initiatives – Plans examination and future initiatives to be identified; and
• Investigate automatic aid agreements with surrounding municipalities.
Employee Engagement and Talent Management • 2-Way Communication; and
• Develop a comprehensive succession planning program.
Garry W. Morden Centre
F-6 2015-2018 Business Plan & 2015 Budget

Looking Back Partnerships
1) The renovation of Fire Station 105 and relocation of stations 116 and 106 were completed and were established as co-locations with Peel Paramedic Services.
2) In May 2012 The Garry W. Morden Centre opened. It is a partnership between the City of Mississauga, the Region of Peel and the Federal Government. It is the City’s first LEED facility.
3) The relocation of Fire Station 119 will be a co-location opportunity with Peel Region Paramedic Services and is expected to be completed in the Fall of 2015.
Customer Service
1) MFES now visits more than 30,000 residences in Mississauga each year to promote fire safety.
2) All front line vehicles now carry EPI pens and all fire crews have been trained to provide symptom assist for anaphylactic shock.
3) All front line apparatus now carry pet oxygen therapy kits for dogs and cats.
4) Fire safety pamphlets are available online in multiple languages to address varying demographics.
Home Safe Home Visit
Pet Oxygen Therapy Kits
2015-2018 Business Plan & 2015 Budget F-7

Existing Service Levels, Trends, Benchmarks & EfficienciesExisting Service Levels
Measuring suppression capabilities are critical to understanding how well community needs are being addressed. As suppression crews in Mississauga respond to more than 25,000 incidents per year, the assessment of appropriate resourcing is important. As a municipality grows, and/or priorities change, resourcing should be adjusted accordingly.
Results for First Arriving vehicle on scene
The target based on National Fire Protection Association (NFPA) guidelines for the first arriving vehicle to arrive on scene is six minutes and 20 seconds 90 per cent of the time. As of December 2013, MFES is reporting the following based on actual call data:
In order to ensure that benchmarking against other fire departments is meaningful it is imperative that fire departments compare themselves against other departments that both operate and report in a similar way. To that end, MFES participates in a survey conducted each year by the Calgary Fire Department that compares data from comparative fire departments across Canada.
MFES cost for fire services is approximately $118 per capita. The average of the comparable municipal fire services is $157.
Given the importance attached to performance in emergency response, MFES captures a series of key statistics in order to compare the capabilities between MFES and similar Canadian departments. The following table illustrates that comparison:
Measure Target 2013 Actual
Travel Time 4 mins 90% of the time 63%
Total Response Time
6 mins 20 sec 90% of the time 72%
118.49 134.48 147.86 149.83 167.25 182.5 204.30
0
50
100
150
200
250
Cost
per
Cap
ita ($
)
CITY
Municipality PopulationNumber of Suppression Staff
Population Per Firefighter
Population per Station Area
Mississauga 752,000 616 1221 37,600
Toronto 2,791,140 2,795 999 34,038
Ottawa 938,000 892 1052 20,844
Vancouver 600,000 736 815 30,000
Calgary 1,149,552 1,315 874 29,476
Montreal 1,906,000 2,446 779 29,323
Edmonton 835,000 1,016 822 32,115
F-8 2015-2018 Business Plan & 2015 Budget
Engaging Our Customers Public education activities are performed by both dedicated public education staff and suppression crews. These programs are directed at a wide variety of groups within the community. Some targeted community groups include older adults, school aged children, and industrial groups which receive education programs specifically geared to provide a range of fire prevention, life safety, injury prevention, and fire safe learning behaviours.
Below is a brief description of the programs offered by the MFES Public Education Unit:
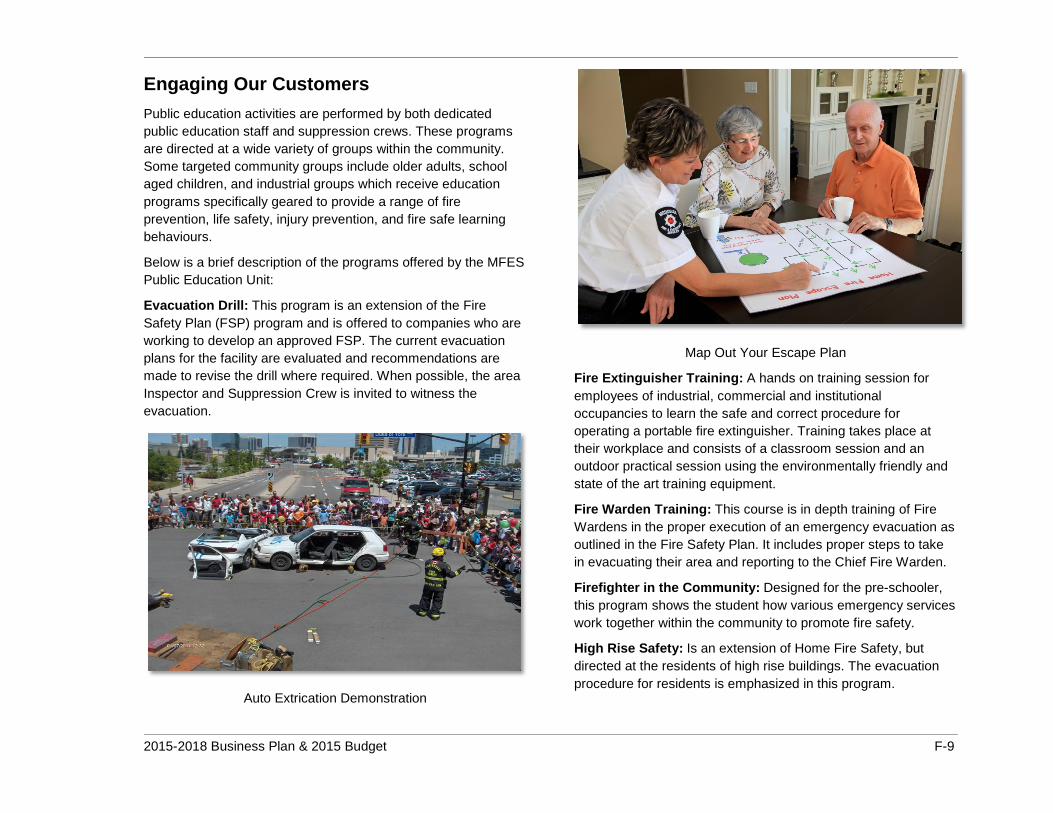
Evacuation Drill: This program is an extension of the Fire Safety Plan (FSP) program and is offered to companies who are working to develop an approved FSP. The current evacuation plans for the facility are evaluated and recommendations are made to revise the drill where required. When possible, the area Inspector and Suppression Crew is invited to witness the evacuation.
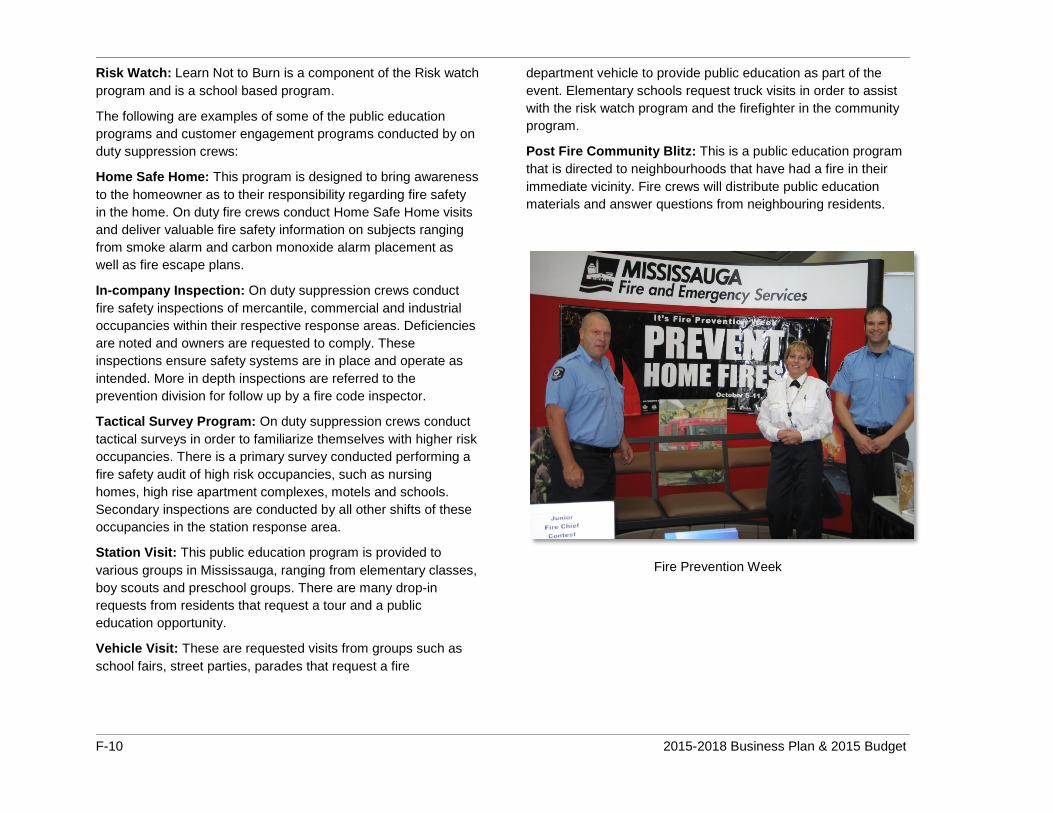
Auto Extrication Demonstration
Map Out Your Escape Plan
Fire Extinguisher Training: A hands on training session for employees of industrial, commercial and institutional occupancies to learn the safe and correct procedure for operating a portable fire extinguisher. Training takes place at their workplace and consists of a classroom session and an outdoor practical session using the environmentally friendly and state of the art training equipment.
Fire Warden Training: This course is in depth training of Fire Wardens in the proper execution of an emergency evacuation as outlined in the Fire Safety Plan. It includes proper steps to take in evacuating their area and reporting to the Chief Fire Warden.
Firefighter in the Community: Designed for the pre-schooler, this program shows the student how various emergency services work together within the community to promote fire safety.
High Rise Safety: Is an extension of Home Fire Safety, but directed at the residents of high rise buildings. The evacuation procedure for residents is emphasized in this program.
2015-2018 Business Plan & 2015 Budget F-9
Risk Watch: Learn Not to Burn is a component of the Risk watch program and is a school based program.
The following are examples of some of the public education programs and customer engagement programs conducted by on duty suppression crews:
Home Safe Home: This program is designed to bring awareness to the homeowner as to their responsibility regarding fire safety in the home. On duty fire crews conduct Home Safe Home visits and deliver valuable fire safety information on subjects ranging from smoke alarm and carbon monoxide alarm placement as well as fire escape plans.
In-company Inspection: On duty suppression crews conduct fire safety inspections of mercantile, commercial and industrial occupancies within their respective response areas. Deficiencies are noted and owners are requested to comply. These inspections ensure safety systems are in place and operate as intended. More in depth inspections are referred to the prevention division for follow up by a fire code inspector.
Tactical Survey Program: On duty suppression crews conduct tactical surveys in order to familiarize themselves with higher risk occupancies. There is a primary survey conducted performing a fire safety audit of high risk occupancies, such as nursing homes, high rise apartment complexes, motels and schools. Secondary inspections are conducted by all other shifts of these occupancies in the station response area.
Station Visit: This public education program is provided to various groups in Mississauga, ranging from elementary classes, boy scouts and preschool groups. There are many drop-in requests from residents that request a tour and a public education opportunity.
Vehicle Visit: These are requested visits from groups such as school fairs, street parties, parades that request a fire
department vehicle to provide public education as part of the event. Elementary schools request truck visits in order to assist with the risk watch program and the firefighter in the community program.
Post Fire Community Blitz: This is a public education program that is directed to neighbourhoods that have had a fire in their immediate vicinity. Fire crews will distribute public education materials and answer questions from neighbouring residents.
Fire Prevention Week
F-10 2015-2018 Business Plan & 2015 Budget

Opportunities and Challenges
Challenges Opportunities
1) Increasing Travel Time
Population growth
• Increased call volume and traffic congestion;
• Vertical response is not currently reflected in response time and can increase response time; and
• Currently response time below established target.
Traffic Congestion
• MFES has experienced an increase in travel time of one per cent per year as a result of congestion.
Targeted Public Education
• Programs in fire safety targeted to residents of high rise occupancies; and
• Programs in fire safety targeted to older adults.
Frequency of Inspection Cycles
• Mandatory routine inspections will be conducted at a frequency that corresponds with the risk of the occupancy.
New Infrastructure
• 120 - Hurontario and Eglinton; and
• 123- Winston Churchill and The Collegeway.
Service Area Agreements with Surrounding Municipalities
• Eliminates artificial service boundaries by allowing the closest fire department to respond; and
• Eliminates service gaps in border areas.
2015-2018 Business Plan & 2015 Budget F-11

Challenges Opportunities
2) Changes in Building Stock and Type
Vertical Response
• Response times are approximately three minutes longer in high rise scenarios; and
• This delay is currently not included in response measurements.
Lightweight Construction Material
• Highly combustible; and
• Burns faster and at a higher temperature.
3) Staying Current
• Significant high-rise development will effect response time - vertical response; and
• More complex building types, pedestrian focused development and the addition of LRT.
Targeted Public Education
• Develop a high rise fire safety program to be delivered by suppression crews;
• Expand the Post Fire Community Blitz program to include high rise occupancies; and
• Increase and target Home Safe Home visits to deliver fire safety messages to higher risk residential occupancies.
New Infrastructure
• Construct and staff fire stations 120 and 123; and
• This will reduce travel time, improve incident outcomes and reduce potential dollar loss.
New Training Programs
• Develop new programs to train crews to respond to more complex structures, high-rise buildings, mass transit heavy rescue and structural collapse.
Apparatus Changes
• Purchase smaller response vehicles with a narrower wheel base and tighter turning radii to replace older vehicles.
New Stations
• Build and staff station 120 and 123 to reduce travel time and address vertical response issues.
F-12 2015-2018 Business Plan & 2015 Budget

Challenges Opportunities
4) Lifecycle of Infrastructure
Existing Fire Stations
• Seven fire stations that require rehabilitation;
• Require barrier free and female washroom facilities;
• Upgrades to meet the accessibility guidelines; and
• Stations currently do not have backup generators.
Rehabilitation Program
• Schedule and implementation plan for the rehabilitation of existing fire stations based on age and accessibility issues;
• Purchase backup generators; and
• The first two stations have been identified in this four year business cycle.
2015-2018 Business Plan & 2015 Budget F-13
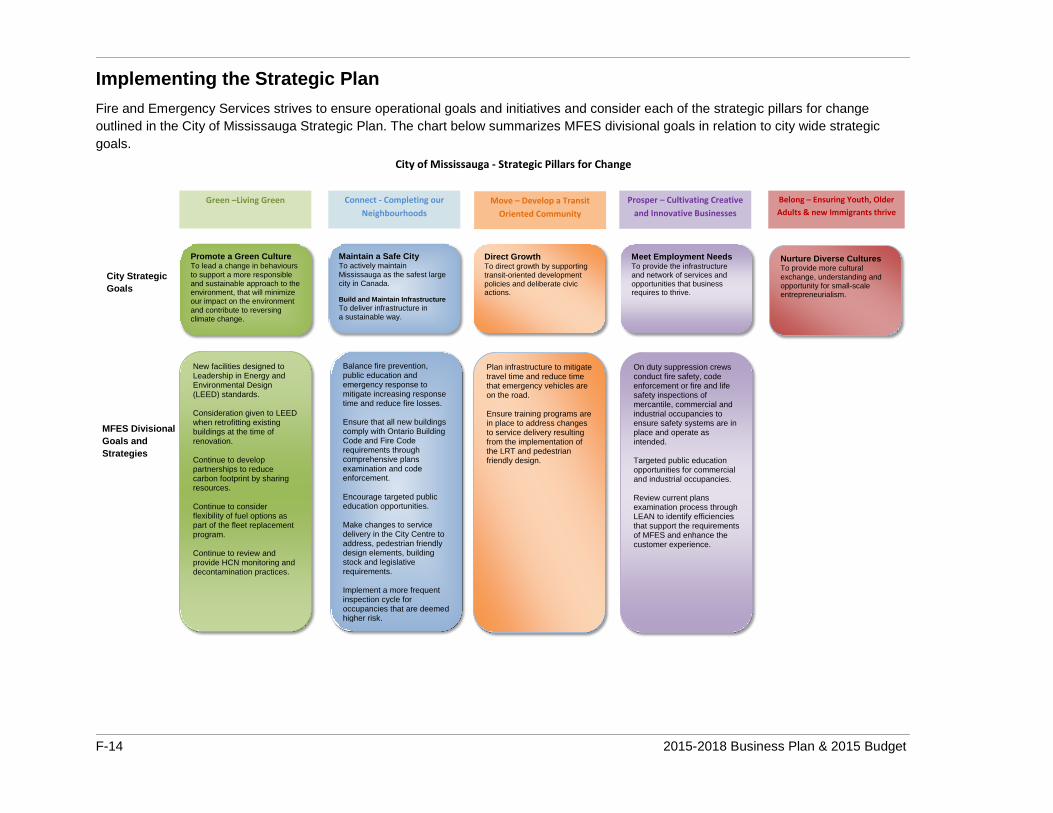
Implementing the Strategic Plan Fire and Emergency Services strives to ensure operational goals and initiatives and consider each of the strategic pillars for change outlined in the City of Mississauga Strategic Plan. The chart below summarizes MFES divisional goals in relation to city wide strategic goals. City of Mississauga - Strategic Pillars for Change
City Strategic Goals
MFES Divisional Goals and Strategies
New facilities designed to Leadership in Energy and Environmental Design (LEED) standards. Consideration given to LEED when retrofitting existing buildings at the time of renovation. Continue to develop partnerships to reduce carbon footprint by sharing resources. Continue to consider flexibility of fuel options as part of the fleet replacement program. Continue to review and provide HCN monitoring and decontamination practices.
Balance fire prevention, public education and emergency response to mitigate increasing response time and reduce fire losses. Ensure that all new buildings comply with Ontario Building Code and Fire Code requirements through comprehensive plans examination and code enforcement. Encourage targeted public education opportunities. Make changes to service delivery in the City Centre to address, pedestrian friendly design elements, building stock and legislative requirements. Implement a more frequent inspection cycle for occupancies that are deemed higher risk.
Maintain a Safe City To actively maintain Mississauga as the safest large city in Canada. Build and Maintain Infrastructure To deliver infrastructure in a sustainable way.
Meet Employment Needs To provide the infrastructure and network of services and opportunities that business requires to thrive.
Promote a Green Culture To lead a change in behaviours to support a more responsible and sustainable approach to the environment, that will minimize our impact on the environment and contribute to reversing climate change.
Direct Growth To direct growth by supporting transit-oriented development policies and deliberate civic actions.
Plan infrastructure to mitigate travel time and reduce time that emergency vehicles are on the road. Ensure training programs are in place to address changes to service delivery resulting from the implementation of the LRT and pedestrian friendly design.
Nurture Diverse Cultures To provide more cultural exchange, understanding and opportunity for small-scale entrepreneurialism.
Green –Living Green Connect - Completing our Neighbourhoods
Move – Develop a Transit Oriented Community
Prosper – Cultivating Creative and Innovative Businesses
Belong – Ensuring Youth, Older Adults & new Immigrants thrive
On duty suppression crews conduct fire safety, code enforcement or fire and life safety inspections of mercantile, commercial and industrial occupancies to ensure safety systems are in place and operate as intended. Targeted public education opportunities for commercial and industrial occupancies. Review current plans examination process through LEAN to identify efficiencies that support the requirements of MFES and enhance the customer experience.
F-14 2015-2018 Business Plan & 2015 Budget

Required Resources
Facilities & Equipment Facilities
Approved by Council in 2014, the Future Directions Master Plan for Fire and Emergency Services guides the decision making process pertaining to the ability to maintain and enhance community safety through public education, the sustainable planning and management of fire assets and the appropriate resourcing to deliver emergency services citywide.
MFES currently operates out of 20 stations located across the City. There are two new fire stations identified in this four year plan beginning in 2016. They are:
1) Station 120 – Hurontario and Eglinton (2016); and 2) Station 123 – Collegeway and Winston Churchill (2017).
Fire stations are in operation 24 hours per day, 365 days per year and for this reason they are subject to wear and tear issues more frequently than facilities that operate more traditional working hours. The maintenance of fire station infrastructure is essential to ensure that staff can operate effectively, to meet health and safety and accessibility standards. Stations also need to be completely self-sufficient during large scale emergencies. There are currently seven fire stations in operation that were constructed prior to 1980 and only one of these has had any significant renovations.
Five existing fire stations are identified for rehabilitation in this four year plan beginning in 2016. They are:
1) Fire Station 102 – 2016; 2) Fire Station 108 – 2016; 3) Fire Station 101 – 2017; 4) Fire Station 112 – 2018; and 5) Fire Station 114 – 2018.
Fleet
MFES currently has 30 front line apparatus, seven unstaffed specialty vehicles equipped for, command, technical rescue, hazardous material, water tanker, and a trench rescue response vehicle. The balance of the fleet is made up of smaller service vehicles.
The replacement value of the fleet is estimated at approximately $35 million.
MFES has a fleet replacement schedule in place that reflects a lifecycle of 15 years as front line apparatus and five years on reserve. Through appropriate care and refurbishment, this schedule ensures a high level of operational functionality. As part of the fleet replacement program, a co-ordinated approach to setting vehicle specifications ensures vehicles purchased will have consistent functions, layouts and operation. This reduces maintenance and training costs as well as provides front-line users with a familiar foundation to more effectively operate their vehicles. Based on the existing replacement program the 2015-2018 Business Plan identifies seven front line trucks that require replacement within the next four years along with one specialty vehicle.
Pumper 122
2015-2018 Business Plan & 2015 Budget F-15
The refurbishment program assists in extending the lifecycle of each vehicle, ensuring that they receive the proper care and repairs as required. In the next four years MFES expects to perform some degree of refurbishment of nine front line vehicles.
There are opportunities to improve our environmental stewardship, by continuing to ‘right size’ the emergency fleet and continue to replace the light fleet with more fuel efficient models to reduce emissions. MFES continues to monitor and implement environmentally sound practices throughout its operations.
Through an independent review MFES would also be able to consider a sustainable green fleet management strategy, an evaluation of lease versus buy, and other capital financing strategies.
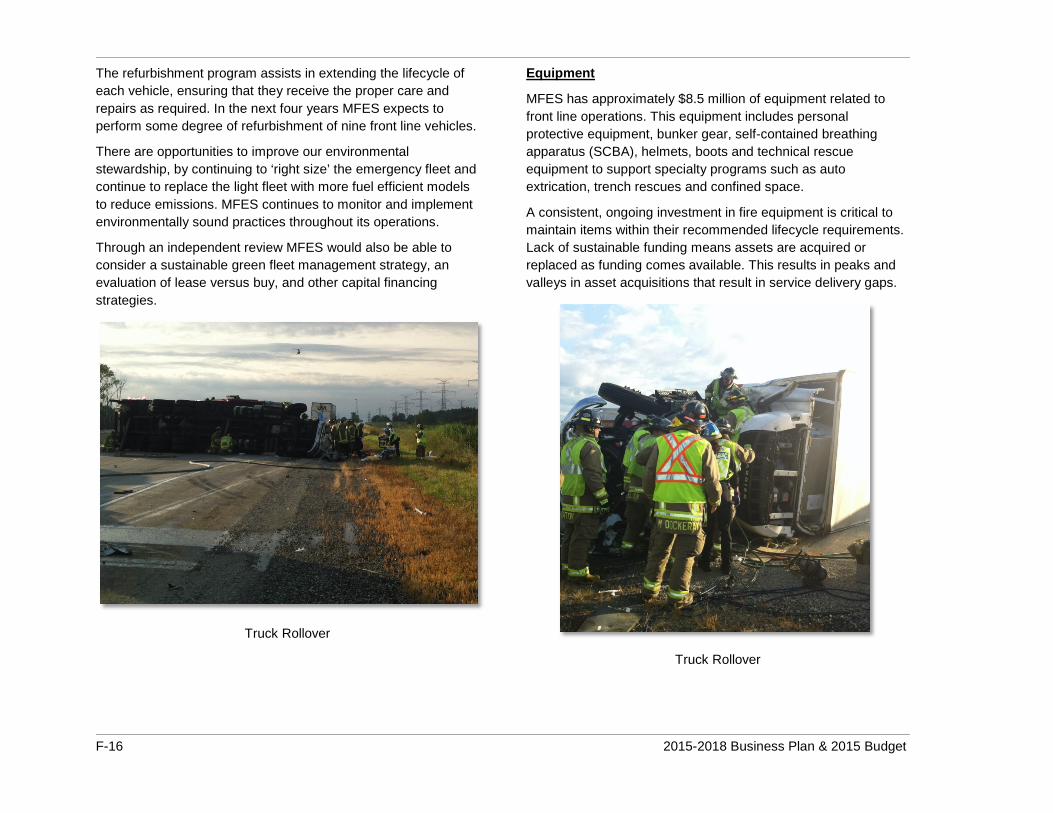
Truck Rollover
Equipment
MFES has approximately $8.5 million of equipment related to front line operations. This equipment includes personal protective equipment, bunker gear, self-contained breathing apparatus (SCBA), helmets, boots and technical rescue equipment to support specialty programs such as auto extrication, trench rescues and confined space.
A consistent, ongoing investment in fire equipment is critical to maintain items within their recommended lifecycle requirements. Lack of sustainable funding means assets are acquired or replaced as funding comes available. This results in peaks and valleys in asset acquisitions that result in service delivery gaps.
Truck Rollover
F-16 2015-2018 Business Plan & 2015 Budget

Technology Both the use of new, and the assessment of emerging technologies to reduce response time, ensure accuracy of data capture and assist with environmental protection is an ongoing trend in the emergency service industry.
MFES currently uses mobile data technology in all of the front line vehicles that provide updated routing and on scene information. This technology is reviewed regularly to accommodate emerging upgrades to expand its capabilities.
MFES continually updates its tiered response agreement with the Peel Regional Paramedic Service (PRPS) in order to ensure that MFES crews are responding to the medical emergencies where they can have the most positive outcome.
In 2013 MFES piloted and subsequently implemented Technical Interoperability Framework (TIF). This system allows for simultaneous dispatch with the Central Ambulance Communication Centre (CACC). This has improved fire response to medical emergencies by ensuring both MFES and PRPS are dispatched at the same time to ensure the best possible service to residents.
In 2015 MFES is expecting to have new fire station alerting technology in place that will assist in improving the dispatch of trucks particularly for multiple vehicle dispatches.
When augmented by appropriate resourcing and good policy, technology can be extremely effective in improving service delivery.
Joint Fire Communications Centre (Dispatch)
2015-2018 Business Plan & 2015 Budget F-17

Human Resources Fire Prevention and Public Education
The emphasis on public education and fire prevention has become clear across major urban fire departments. The ability to meet appropriate response times across the City have become a growing concern. In some cases this can only be addressed through additional suppression resourcing however comprehensive public education programs can also improve emergency response by providing citizens the tools to be the stewards of their own fire safety. The 2014 Future Directions Fire Master Plan focuses on making public education a priority and reducing the number of fire and other emergency incidents that suppression crews are called to respond.
Having a critical role in the review process, the Fire Plans Examination unit ensures that all assigned fire and life safety requirements of the Ontario Building Code, and Ontario Fire Code matters are addressed prior to the issuance of a building permit. Items under MFES jurisdiction in the plans review process include fire alarm systems, automatic fire sprinkler systems, emergency power systems, emergency lighting systems, hose and standpipe systems, hazardous processes/operations and protection, smoke control systems and high-rise fire safety measures.
To support these processes, MFES is requesting one plan examination officer in 2015, one fire prevention and life safety officer in 2016 and one in 2018.
Suppression
MFES responds to more than 25,000 incidents each year. Of these responses, over 20,000 are considered emergency incidents. Suppression crews respond to a broad range of emergency incidents including, but not limited to, structure fires, motor vehicle collisions, medical related emergencies, technical rescue incidents, aircraft emergencies and hazardous materials.
To meet those requirements a new station in the Hurontario and Eglinton area has been proposed. This area is identified as a priority based on existing response deficiencies, current population combined with future growth, traffic congestion and community risk.
Based on 2013 historical call data, there were 750 emergency incidents in this response area that did not meet the four minute travel time target. Projections to 2031 indicate a population increase of 15 per cent in this station area and factoring in the impact of traffic congestion, it is expected that by 2031 the number of emergency incidents not meeting the travel time target would increase to 1,013.
To address this challenge MFES is proposing one crew to staff new station 120 at Hurontario and Eglinton in 2016.
House Fire
Emergency Management
The flooding in July 2013 and the most recent ice storm in December 2013 illustrated the importance of having a robust disaster recovery plan. The value of good communication to both internal and external stakeholders is critical to the success of the recovery process. To that end MFES has requested one FTE to support emergency management business continuity in the 2016 budget.
F-18 2015-2018 Business Plan & 2015 Budget

Proposed Full Time Equivalent Staffing Distribution by Program
Program 2014 2015 2016 2017 2018
Fire Building Maintenance 3.0 3.0 3.0 3.0 3.0
Fire Support Services 39.5 39.5 39.5 39.5 39.5
Fire Vehicle Maintenance 10.0 10.0 11.0 11.0 11.0
Prevention 40.0 41.0 42.0 42.0 43.0
Suppression 616.0 616.0 636.0 636.0 636.0
Total Service Distribution 708.5 709.5 731.5 731.5 732.5
2015-2018 Business Plan & 2015 Budget F-19

Proposed Operating & Capital Budgets This part of the Business Plan sets out the financial resources required to deliver the proposed 2015-2018 Business Plan. Information is provided by major expenditure and revenue category as well as by program. The costs to maintain existing service levels and operationalize prior decisions are identified separately from proposed changes. The prior year operating budget for 2014 was $92,893,000 and the proposed operating budget for 2015 is $96,913,000.
Operating Proposed Budget by Program
Note: Numbers may not balance due to rounding.
Description2013
Actuals ($000's)
2015 Proposed
Budget ($000's)
2016 Forecast ($000's)
2017 Forecast ($000's)
2018 Forecast ($000's)
Expenditures to Deliver Current ServicesFire Building Maintenance 943 1,213 1,254 1,289 1,324Fire Support Services 7,005 6,078 6,246 6,401 6,523Fire Vehicle Maintenance 2,933 3,184 3,217 3,244 3,272Prevention 4,650 5,256 5,382 5,480 5,587Suppression 74,539 82,406 84,536 86,331 88,125Total Expenditures 90,070 98,138 100,634 102,745 104,830Revenues (2,007) (1,339) (1,339) (1,339) (1,339)Transfers From Reserves and Reserve Funds 0 0 0 0 0New Initiatives and New Revenues 114 1,090 2,813 3,294Proposed Net Budget Including New Initiatives & New Revenuees
88,062 96,913 100,386 104,219 106,785
Expenditures Budget - Changes by Year 4% 3% 2% 2%Proposed Net Budget - Changes by Year 4% 4% 4% 2%
3,095
2014 Budget ($000's)
1,201 5,763
92,893
5,002 79,171 94,232(1,339)
0
F-20 2015-2018 Business Plan & 2015 Budget

Summary of Proposed 2015 Budget
Note: Numbers may not balance due to rounding.
Summary of Proposed 2015 Budget and 2016-2018 Forecast
Note: Numbers may not balance due to rounding.
Description
2014 Approved
Budget ($000's)
Maintain Current Service Levels
Annualized Prior Years
Budget Decisions
Operating Impact of
New Capital Projects
Proposed New
Initiatives And
Revenues
Special Purpose Levies
2015 Proposed
Budget ($000's)
$ Change Over 2014
% Change Over 2014
Labour and Benefits 89,987 3,697 42 0 114 0 93,790 3,803 4%Operational Costs 3,561 116 0 0 0 0 3,678 116 3%Facility, IT and Support Costs 684 100 0 0 0 0 784 100 15%Total Gross Expenditures 94,232 3,914 42 0 114 0 98,251 4,019 4%Total Revenues (1,339) 0 0 0 0 0 (1,339) 0 0%Total Net Expenditure 92,893 3,914 42 0 114 0 96,913 4,019 4%
(50)
Efficiencies and Cost Savings
(50) 0 0
0(50)
Description
2015 Proposed
Budget ($000's)
2016 Forecast ($000's)
2018 Forecast ($000's)
Labour and Benefits 93,790 97,221 103,540Operational Costs 3,678 3,701 3,742Facility, IT and Support Costs 784 803 843Total Gross Expenditures 98,251 101,724 108,124Total Revenues (1,339) (1,339) (1,339)Total Net Expenditure 96,913 100,386 106,785
822 105,557
(1,339) 104,219
2017 Forecast ($000's)
101,015 3,720
2015-2018 Business Plan & 2015 Budget F-21

Changes to Maintain Current Service Levels Including Prior Year’s Budget Decisions
The following table identifies the changes in costs and revenues to maintain existing service levels, efficiencies and cost savings and the cost increases arising from prior year decisions.
2016 2017 2018
Forecast Forecast Forecast
($000's) ($000's) ($000's)
Labour and Benefits 3,697 2,443 2,070 2,035Operational Costs Increases
G.Morden Utility Cost Increase 66 15 15 16Communication Costs for additional users/data for station alerts 60 0 0 0Fire Station Material and Equipment 40 0 0 0G.Morden Propane Costs 25 0 0 0Staff Certification for Wellness/Fitness 15 0 0 0Professional Services - Legal 10 0 0 0Cleaning Contract Stn 101 10 0 0 0Utility Cost Increase/(Savings) (19) 23 19 21Other Changes 10 4 5 5
Operational Costs Increases 217 42 39 42Efficiencies and Cost Savings
Reduction in overtime budget (50) 0 0 0Efficiencies and Cost Savings (50) 0 0 0
Operating Impact of New Capital ProjectsOperating Impact of New Capital Projects 0 0 0 0
Current Revenue ChangesCurrent Revenue Changes 0 0 0 0
Annualized Prior Years Budget DecisionsAnnualized Labour 42 0 0 0
Annualized Prior Years Budget Decisions 42 0 0 0Total Changes to Maintain Current Service Levels 3,906 2,485 2,109 2,078 Note: Numbers may not balance due to rounding.
Description
2015 Proposed
Budget ($000's)
F-22 2015-2018 Business Plan & 2015 Budget

Proposed New Initiatives and New Revenues
This table presents the costs by budget request (BR#) for proposed new initiatives. Detailed descriptions of each budget request can be found on the pages following the table.
Note: Numbers may not balance due to rounding.
BR # 2015FTE
Impact
2015Proposed
Budget($000's)
2016Proposed
Budget($000's)
2017Proposed
Budget($000's)
2018Proposed
Budget($000's)
2015to
2018FTE
Impact
1330 0.0 0 732 2,426 2,749 20.0
1429 0.0 0 128 136 144 1.0
1431 1.0 114 129 135 138 1.0
1432 0.0 0 113 115 118 1.0
1433 0.0 0 101 116 262 2.0
114 1,203 2,928 3,412
114 1,203 2,928 3,412Total 3,205
Emergency Management Officer 0
Fire Prevention and Life Safety Officers 0
Total New Initiative 3,205
Fire Station 120- Hurontario and Eglinton Area 3,205
Fleet Mechanic 0
Plans Examination Officer 0
Description 2015 to2018
Capital($000's)
New Initiative
2015-2018 Business Plan & 2015 Budget F-23
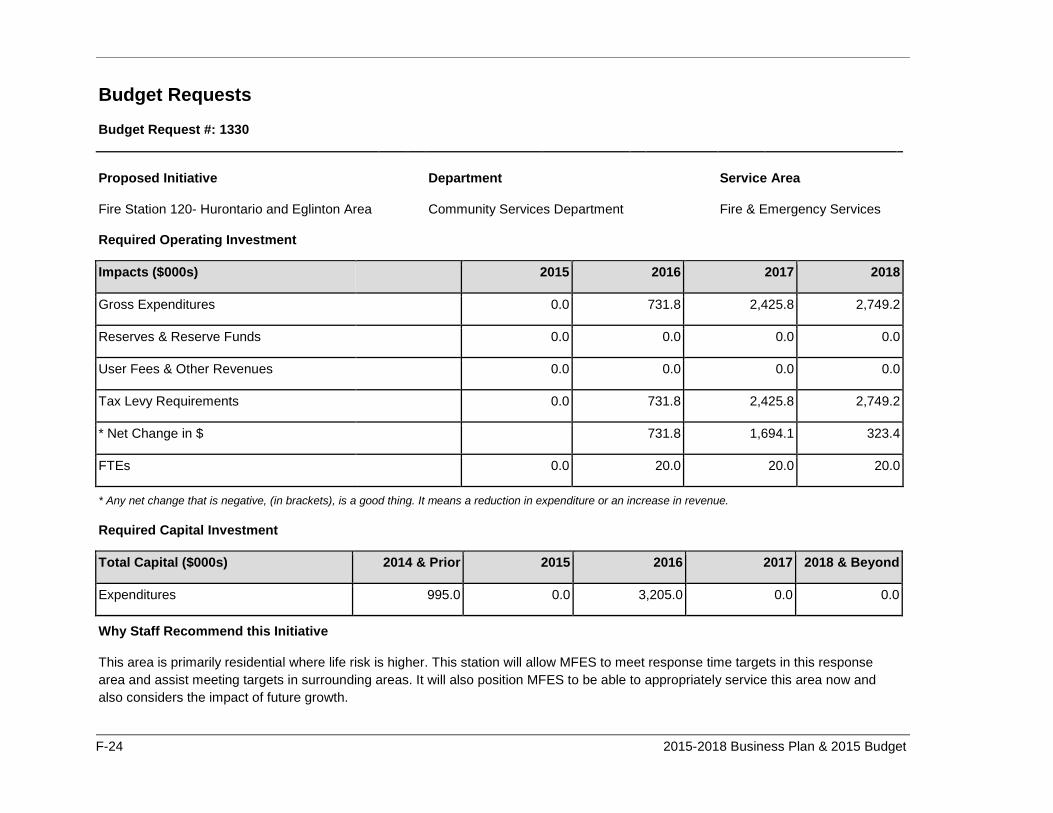
Budget Requests
Budget Request #: 1330
Proposed Initiative
Department
Service Area
Fire Station 120- Hurontario and Eglinton Area
Community Services Department
Fire & Emergency Services
Required Operating Investment
Impacts ($000s) 2015 2016 2017 2018
Gross Expenditures 0.0 731.8 2,425.8 2,749.2
Reserves & Reserve Funds 0.0 0.0 0.0 0.0
User Fees & Other Revenues 0.0 0.0 0.0 0.0
Tax Levy Requirements 0.0 731.8 2,425.8 2,749.2
* Net Change in $ 731.8 1,694.1 323.4
FTEs 0.0 20.0 20.0 20.0
* Any net change that is negative, (in brackets), is a good thing. It means a reduction in expenditure or an increase in revenue.
Required Capital Investment
Total Capital ($000s) 2014 & Prior 2015 2016 2017 2018 & Beyond
Expenditures 995.0 0.0 3,205.0 0.0 0.0
Why Staff Recommend this Initiative
This area is primarily residential where life risk is higher. This station will allow MFES to meet response time targets in this response area and assist meeting targets in surrounding areas. It will also position MFES to be able to appropriately service this area now and also considers the impact of future growth.
F-24 2015-2018 Business Plan & 2015 Budget

Budget Request #: 1330
Details of Service Change
This station was identified in the 2010 Fire Master Plan as the number one priority and based on 2012 updated response data this station remains the first priority. In 2012 there were 1,048 emergency incidents in this response area with 518 or 49 per cent being deficient. Almost 50 per cent of those deficient calls are over the total response time target by more than 40 seconds. One of the most significant concerns for emergency response is the impending growth in this area. High density construction is estimated to increase by more than 2,700 new apartment units and 650 row housing units in this area alone. With close to 50 per cent of the calls currently not meeting any recognized standard, the growth will increase the number of deficient calls by approximately 30 per cent in 10 years.
Service Impact
This station will allow MFES to have a better distribution of its resources in this highly populated residential area and address existing service deficiencies as well as addressing future growth. It will allow MFES to meet appropriate response time targets in this response area now and in the future. The addition of new staffing and station locations will allow MFES to continually improve on our in-company inspection program, tactical survey program and home safe home program and will improve our mandated public education programs.
2015-2018 Business Plan & 2015 Budget F-25

Budget Request #: 1429
Proposed Initiative
Department
Service Area
Fleet Mechanic
Community Services Department
Fire & Emergency Services
Required Operating Investment
Impacts ($000s) 2015 2016 2017 2018
Gross Expenditures 0.0 128.0 136.0 144.4
Reserves & Reserve Funds 0.0 0.0 0.0 0.0
User Fees & Other Revenues 0.0 0.0 0.0 0.0
Tax Levy Requirements 0.0 128.0 136.0 144.4
* Net Change in $ 128.0 8.0 8.3
FTEs 0.0 1.0 1.0 1.0
* Any net change that is negative, (in brackets), is a good thing. It means a reduction in expenditure or an increase in revenue.
Required Capital Investment
Total Capital ($000s) 2014 & Prior 2015 2016 2017 2018 & Beyond
Expenditures 0.0 0.0 0.0 0.0 0.0
Why Staff Recommend this Initiative
The responsibility for the operability and reliability of the MFES fleet falls on the mechanics charged with their maintenance and repair. These apparatus are all required to be maintained at the highest levels, so as to be available 24/7, 365 days a year for immediate use. The size and complexity of these vehicles require them to be maintained properly so they are able to safely carrying our crews, to operate on our roads, and to perform effectively at incidents after they arrive.
F-26 2015-2018 Business Plan & 2015 Budget

Budget Request #: 1429
Details of Service Change
All MFES front-line emergency response and heavy support vehicles require a minimum of one annual legislated MTO inspection, as well as other inspections and testing referenced in national standards. Currently, seven full time mechanics conduct and provide all required annual inspections and emergency demand repairs to keep vehicles in service. Due to the volume of legislative and demand repair work requests, preventative maintenance required to extend the life expectancy of the vehicles must be deferred. The recent addition of a new electronic daily vehicle inspection tool for station crews is anticipated to result in an increase of additional deferred repair requests. This new mechanic is required to add to the shop service hours available to meet the legislative and standards prescribed inspections and maintenance, demand emergency repairs, and to reduce the backlog of deferred repairs as well as improve shop time available for preventative maintenance work.
Service Impact
MFES fleet vehicles must be available at all times to, safely and quickly respond to all emergency incidents, and, to function effectively for their crews when they arrive. This community expectation is one that MFES applies equally to all frontline and support vehicles. Maintenance requirements for fire apparatus is complex, highly technical and must be addressed immediately when issues occur. The addition of this position will improve the department’s ability to provide both demand repairs and preventative maintenance on a timely basis to ensure the reliability of fleet vehicle operations.
2015-2018 Business Plan & 2015 Budget F-27
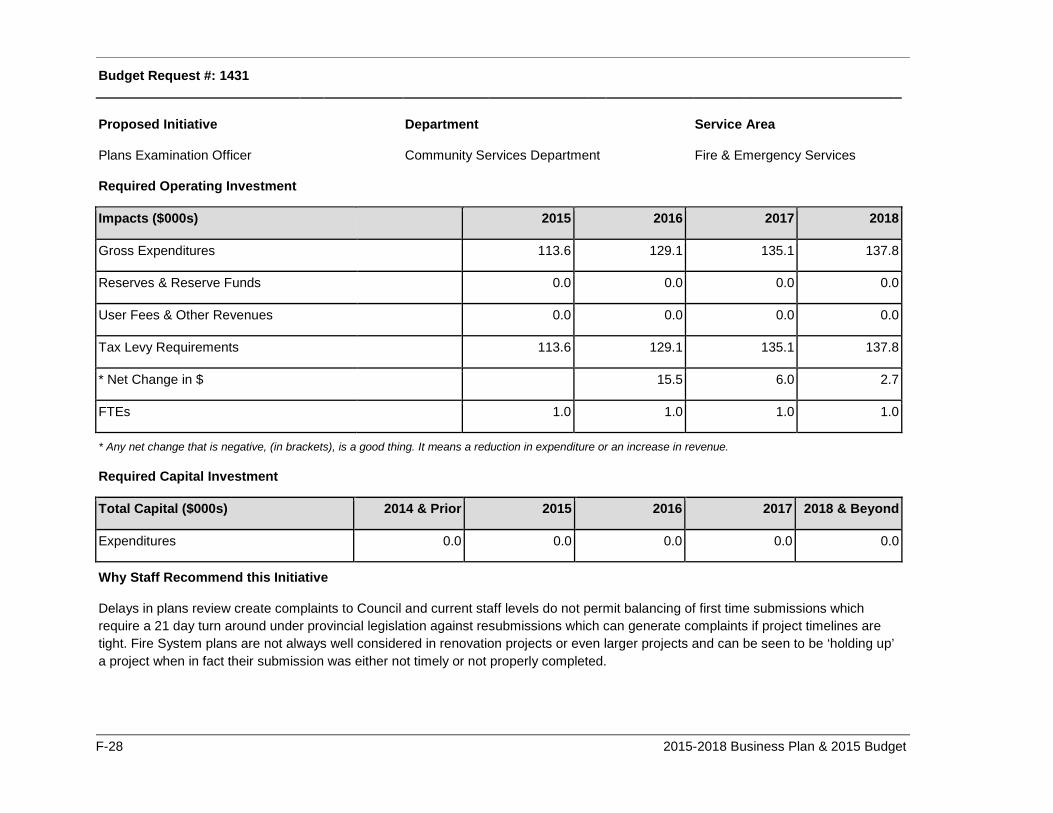
Budget Request #: 1431
Proposed Initiative
Department
Service Area
Plans Examination Officer
Community Services Department
Fire & Emergency Services
Required Operating Investment
Impacts ($000s) 2015 2016 2017 2018
Gross Expenditures 113.6 129.1 135.1 137.8
Reserves & Reserve Funds 0.0 0.0 0.0 0.0
User Fees & Other Revenues 0.0 0.0 0.0 0.0
Tax Levy Requirements 113.6 129.1 135.1 137.8
* Net Change in $ 15.5 6.0 2.7
FTEs 1.0 1.0 1.0 1.0
* Any net change that is negative, (in brackets), is a good thing. It means a reduction in expenditure or an increase in revenue.
Required Capital Investment
Total Capital ($000s) 2014 & Prior 2015 2016 2017 2018 & Beyond
Expenditures 0.0 0.0 0.0 0.0 0.0
Why Staff Recommend this Initiative
Delays in plans review create complaints to Council and current staff levels do not permit balancing of first time submissions which require a 21 day turn around under provincial legislation against resubmissions which can generate complaints if project timelines are tight. Fire System plans are not always well considered in renovation projects or even larger projects and can be seen to be ‘holding up’ a project when in fact their submission was either not timely or not properly completed.
F-28 2015-2018 Business Plan & 2015 Budget
Budget Request #: 1431
Details of Service Change
This position will be hired in 2014 and initially supported through gapping in Fire Suppression Section. The position may be required for a few years only if skills transfer and succession in the Section can be completed effectively. The Downtown core, with sprinklered high-rise construction, also presents a temporary increase in permit requirements which is expected to be reduced in future.
Service Impact
This position will provide improved capacity to meet legislated requirements for plans processing (21 days for first submissions) and reduce complaints related to resubmissions, the quality of which sometimes creates repeated delays both for the applicant and other customers. This position will also assist with transition issues and workload distribution in this small staff group when future retirement(s) occur.
2015-2018 Business Plan & 2015 Budget F-29

Budget Request #: 1432
Proposed Initiative
Department
Service Area
Emergency Management Officer - Business Continuity
Community Services Department
Fire & Emergency Services
Required Operating Investment
Impacts ($000s) 2015 2016 2017 2018
Gross Expenditures 0.0 113.2 115.5 117.8
Reserves & Reserve Funds 0.0 0.0 0.0 0.0
User Fees & Other Revenues 0.0 0.0 0.0 0.0
Tax Levy Requirements 0.0 113.2 115.5 117.8
* Net Change in $ 113.2 2.3 2.3
FTEs 0.0 1.0 1.0 1.0
* Any net change that is negative, (in brackets), is a good thing. It means a reduction in expenditure or an increase in revenue.
Required Capital Investment
Total Capital ($000s) 2014 & Prior 2015 2016 2017 2018 & Beyond
Expenditures 0.0 0.0 0.0 0.0 0.0
Why Staff Recommend this Initiative
The City of Mississauga Emergency Management Program has just added a second senior position and a support position. This still leaves the City behind comparators such as Brampton, Toronto and the Region of Peel in this program area.
F-30 2015-2018 Business Plan & 2015 Budget

Budget Request #: 1432
Details of Service Change
This will be the addition of one FTE that will be responsible for business continuity and plans maintenance.
Service Impact
The flooding in July 2013 and the most recent ice storm in December 2013 illustrated the importance of having a robust disaster recovery plan. The value of good communication to both internal and external stakeholders is critical to the success of the recovery process. This position will assist in providing the necessary complement to be able to provide the public and internal and external stakeholders the information and support necessary to ensure a positive outcome.
2015-2018 Business Plan & 2015 Budget F-31

Budget Request #: 1433
Proposed Initiative
Department
Service Area
Fire Prevention and Life Safety Officers
Community Services Department
Fire & Emergency Services
Required Operating Investment
Impacts ($000s) 2015 2016 2017 2018
Gross Expenditures 0.0 100.9 115.8 262.5
Reserves & Reserve Funds 0.0 0.0 0.0 0.0
User Fees & Other Revenues 0.0 0.0 0.0 0.0
Tax Levy Requirements 0.0 100.9 115.8 262.5
* Net Change in $ 100.9 14.9 146.7
FTEs 0.0 1.0 1.0 2.0
* Any net change that is negative, (in brackets), is a good thing. It means a reduction in expenditure or an increase in revenue.
Required Capital Investment
Total Capital ($000s) 2014 & Prior 2015 2016 2017 2018 & Beyond
Expenditures 0.0 0.0 0.0 0.0 0.0
Why Staff Recommend this Initiative
The fire master plan identifies 14 residential areas where risk can be significantly minimized using a more targeted approach to public education. MFES plans to target public education and increase inspections in areas that are deemed higher risk.
F-32 2015-2018 Business Plan & 2015 Budget

Budget Request #: 1433
Details of Service Change
Additional public education programs will have to be developed as well as existing ones enhances in order to reduce the risk in a number of areas across the city. These positions will allow MFES to more thoroughly engage residents of high rise occupancies in fire safety as well as expand the Post Fire Community Blitz to high rise occupancies. As there is a large turnover of staff in Care and Treatment facilities, MFES has identified this as an area where a more concentrated focus on public education is required. Targeted public education programs can be used successfully to reduce risk. It can also assist in addressing areas where additional suppression resourcing still cannot completely mitigate the risk.
Service Impact
By focussing a more robust inspection cycle in the areas identified as employment lands will assist in reducing the risk inherent in these occupancies. This is particularly important where an additional fire station cannot effectively impact response time. Also these resources would assist in increasing the mandatory inspection cycle for higher risk occupancies which allows MFES to convey and reinforce to property owners the importance of their properties being maintained in a code compliant condition as regulated by the Ontario Fire Code.
2015-2018 Business Plan & 2015 Budget F-33

Capital This section summarizes the forecast 10 year capital requirements for Fire and Emergency Services. The following tables represent the forecast by major program and the sources of financing for the capital forecast.
Proposed 2015-2024 Capital Budget by Program
Note: Numbers may not balance due to rounding.
Proposed 2015-2024 Capital Budget by Funding Source
2015Proposed
Budget($000's)
2016Forecast($000's)
2017Forecast($000's)
2018Forecast($000's)
2019-2024Forecast($000's)
Total2015-2024
($000's)
1,300 4,205 7,660 2,054 20,310 35,5293,338 1,754 1,490 3,855 17,491 27,9284,638 5,959 9,150 5,909 37,801 63,457
Program Expenditures
Stations & Auxiliary BuildingsVehicles & EquipmentTotal
2015Proposed
Budget($000's)
2016Forecast($000's)
2017Forecast($000's)
2018Forecast($000's)
2019-2024Forecast($000's)
Total2015-2024
($000's)
0 4,705 7,110 1,790 15,700 29,3053,338 1,254 1,290 3,669 22,101 31,6521,300 0 750 450 0 2,5004,638 5,959 9,150 5,909 37,801 63,457
Note: Numbers may not balance due to rounding.
Funding
Development ChargesTaxDebtTotal
F-34 2015-2018 Business Plan & 2015 Budget
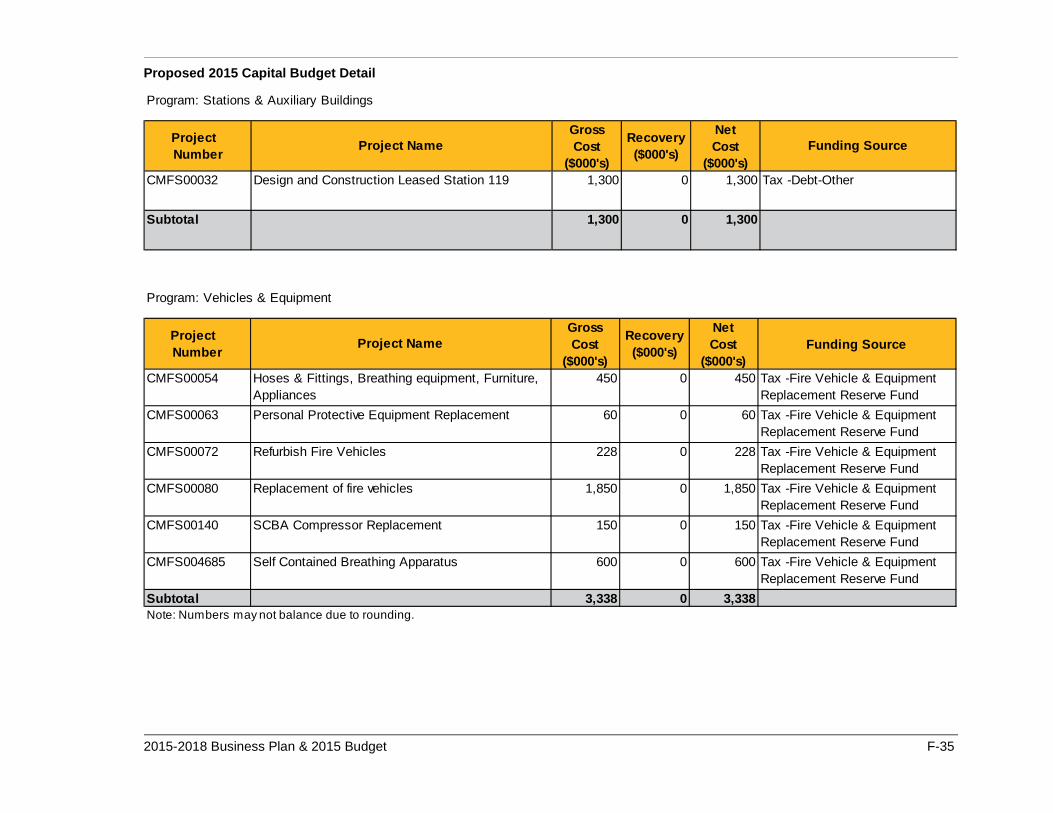
Proposed 2015 Capital Budget Detail
Project Number
GrossCost
($000's)
Recovery($000's)
NetCost
($000's)CMFS00032 1,300 0 1,300
Subtotal 1,300 0 1,300
Program: Stations & Auxiliary Buildings
Project Name Funding Source
Design and Construction Leased Station 119 Tax -Debt-Other
Project Number
GrossCost
($000's)
Recovery($000's)
NetCost
($000's)Funding Source
CMFS00054 450 0 450 Tax -Fire Vehicle & Equipment Replacement Reserve Fund
CMFS00063 60 0 60 Tax -Fire Vehicle & Equipment Replacement Reserve Fund
CMFS00072 228 0 228 Tax -Fire Vehicle & Equipment Replacement Reserve Fund
CMFS00080 1,850 0 1,850 Tax -Fire Vehicle & Equipment Replacement Reserve Fund
CMFS00140 150 0 150 Tax -Fire Vehicle & Equipment Replacement Reserve Fund
CMFS004685 600 0 600 Tax -Fire Vehicle & Equipment Replacement Reserve Fund
Subtotal 3,338 0 3,338Note: Numbers may not balance due to rounding.
Self Contained Breathing Apparatus
Replacement of fire vehicles
SCBA Compressor Replacement
Personal Protective Equipment Replacement
Refurbish Fire Vehicles
Program: Vehicles & Equipment
Project Name
Hoses & Fittings, Breathing equipment, Furniture, Appliances
2015-2018 Business Plan & 2015 Budget F-35

Proposed 2016-2018 Capital Budget Detail
Sub-Program2016
Forecast($000's)
2017Forecast($000's)
2018Forecast($000's)
Stations & Auxiliary Buildings
FIRE Stations New 4,205 6,910 1,290
FIRE Stations - Renovations 0 750 714
FIRE Studies 0 0 50
Subtotal 4,205 7,660 2,054
Sub-Program2016
Forecast($000's)
2017Forecast($000's)
2018Forecast($000's)
Vehicles & Equipment
FIRE Safety Clothing Replacement 80 80 80
FIRE Vehicles 1,220 1,130 3,050
FIRE Equipment Replacement 354 180 625
FIRE Equipment New 100 100 100
Subtotal 1,754 1,490 3,855
Total Expenditures 5,959 9,150 5,909
Note: Numbers may not balance due to rounding. Numbers are net.
F-36 2015-2018 Business Plan & 2015 Budget

Performance MeasuresA Balanced Scorecard identifies measures for four key areas for an organization’s performance: Financial; Customers; Employees; and Business Processes.
By paying attention to all four areas an organization can retain balance to its performance and know that it is moving towards the attainment of its goals.
Financial Measures Total Operating Cost Per Capita is a measure that indicates how efficiently we are using our resources and is a particularly useful measure when comparing with other similar municipalities to gauge effectiveness. In the Existing Service Levels, Trends, Benchmarks and Efficiencies section of this document, a comparison of the total cost for fire services between comparable cities is illustrated. The numbers in the balanced scorecard chart are based on total operating cost which includes labour as well as all other operating expenditures. Currently MFES cost per capita is well below most other comparable municipalities.
Customer Measures Number of Home Safe Home Inspections Annually
As part of changes made to the Home Safe Home Fire Safety program MFES now visits more than 30,000 residences in Mississauga each year to promote fire safety. Direct contact is made with over 15,000 residents providing valuable fire safety information. This program is designed to bring awareness to the homeowner as to their responsibility regarding fire safety in the home. On duty fire crews conduct Home Safe Home visits and deliver valuable fire safety information on subjects ranging from smoke alarm and carbon monoxide alarm placement as well as fire escape plans. The goal is to continue increasing the number of residents visited each year through this program.
Number of Defibrillator Saves Annually
Survival rates are proven to be higher in those communities where CPR and/or defibrillation are administered in less than six minutes from the start of a sudden cardiac arrest. The goal is to continue to improve on the successes through continued training. The goal is to reach 10 per cent of all applications. As of yearend 2013, MFES reached 9.5 per cent.
Employees/Innovation and Learning Measures Average number of training hours/firefighter annually
In order to continue to be able to provide excellent service to the community MFES continually strives to increase the number of training hours available to each member of the suppression staff. It is done through both hands on training and e-learning modules.
Percentage of Prevention Staff having Fire Prevention Officer Certification
This is a Provincial accreditation through the Ontario Fire Marshal’s Office that demonstrates expected core competencies of Fire Prevention Officers relative to the Fire Protection and Prevention Act and Ontario Fire Code. The MFES benchmark for this is 100 per cent. As of yearend 2013, 38 per cent of all prevention staff have this certification.
2015-2018 Business Plan & 2015 Budget F-37
Percentage of Prevention Staff having Fire and Life Safety Educator Certification
This is a Provincial accreditation through the Ontario Fire Marshal’s Office that demonstrates expected core competencies related to Public Fire and Life Safety education. The MFES benchmark is 100 per cent. As of yearend 2013, 41 per cent of all prevention staff have this certification.
Internal Business Measures Response Time
Current industry best practices, standards and related expectations commonly identify a minimum response time reporting level at the 90th percentile. Service benchmarks have been established with consideration being given to existing deficiencies, current population combined with future growth, traffic congestion and community risk.
First Unit Travel Time (90th Percentile) captures how long it takes from the time the truck leaves the station until it arrives on the scene. Travel time is the largest component of total response and is the most difficult to control in a growing municipality with significant urban intensification. The travel time target is four minutes 90 per cent of the time for first the arriving vehicle on scene. In 2013 MFES met that target 63 per cent of the time.
First Unit Total Response Time (90th Percentile) captures total response time which is call processing time (dispatch) + crew preparation time + plus vehicle travel time. The objective is to move towards and maintain a total response time of six minutes and 20 seconds 90 per cent of the time for the first arriving truck. In 2013, MFES total response time city wide was seven minutes and 44 seconds 90 per cent of the time.
Squad 111
F-38 2015-2018 Business Plan & 2015 Budget

Balanced Scorecard Measures for Fire and Emergency Services
2012 (Actual)
2013 (Actual)
2014 (Planned)
2015 (Planned)
2016 (Planned)
2017 (Planned)
2018 (Planned)
Financial:
Cost per Capita for Emergency Services $116.77 $118.49 $122.94 $127.80 $132.48 $137.60 $143.00
Customer:
Number of Home Safe Home Visits 29,459 32,445 32,945 33,445 33,945 34,445 34,945
Number of Defibrillator Saves 30 36 36 37 37 38 38
Employees/Innovation:
Average number of training hours per firefighter 160 165 170 175 180 185 190
% of Staff having Fire Prevention Officer Certification 41 38 58 60 70 70 80
% of Staff having Fire and Life Safety Certification 44 41 50 60 70 70 80
Internal Business Process:
First Unit Travel Time* (seconds) (at the 90th percentile) 337 340 343 347 350 340 344
First Unit Total Response Time* (seconds) (at the 90th percentile) 456 504 509 514 519 504 509
* Emergency Calls Only 2017 - Time assumes station 120 is in operation
2015-2018 Business Plan & 2015 Budget F-39