finite element forming simulation of …...prediction of forming-induced defects. here,...
TRANSCRIPT

FINITE ELEMENT FORMING SIMULATION OF COMPLEX
COMPOSITE SANDWICH PANELS
S. Chen*, O.P.L. McGregor, A. Endruweit, L.T. Harper, N.A. Warrior
Composites Research Group, Faculty of Engineering, University of Nottingham, UK, NG7 2RD
Keywords: Honeycomb, Process Modelling, Finite element analysis (FEA), Forming
ABSTRACT
The sandwich composite forming process is an affordable high-volume technology developed to
manufacture 3D composite sandwich panels with complex curvatures and varying thickness from a flat
format by forming with a set of matched tools. Finite element models were developed as numerical
tools to facilitate the process design and optimisation, and to extend the opportunity for wider industry
uptake. The core was modelled at different scales: Meso-scale model was employed to investigate
forming mechanism, while macro-scale model was used to replicate overall forming response. Results
from meso-scale simulation indicate that the formability for complex curvature is mainly derived from
the bending deformation of the sandwich panel, while the through-thickness core crushing provides
the formability for variable thickness. A macro-scale model was developed to predict the homogenised
forming behaviour of the core based on Abaqus/Explicit. Results indicate that this macro-scale model
is able to significantly reduce the computational time and effectively inform the formability, enabling
process optimisation. The numerical tool was employed to design the forming process for a generic
demonstrator component. The manufacturing solution determined by simulation shows a good
agreement with experiment, indicating the suitability of the developed model for industry applications.
1 INTRODUCTION
Sandwich panels are used to increase the specific stiffness and strength of structures by increasing
the second moment of area, as outer skins transfer bending loads whilst the core transfers shear loads.
Optimised sandwich constructions can offer cost savings in the same order as weight savings [1]
comparing to monolithic panels of the same flexural stiffness. However, lower material costs are often
offset by higher processing costs, as additional intermediate steps are required to machine or cast the
core into shape and to assemble the panel. This additional cost cannot be justified for high volume
applications, where cost is typically the primary design criterion. One solution is to press the core
material into shape simultaneously with the skins, using a single forming operation.
Sandwich panel forming process is a technique developed to form 3D curved components from 2D
format enabling affordable production of sandwich components with varying cross-section shape and
thickness [2, 3]. In this process, the core is sandwiched between two fibre skins. Prior to forming, the
material assembly including the core and the skins are of uniform thickness, keeping cost to a
minimum. Then, it was formed in a set of matched tools. The core is locally crushed during the
forming operation for required shapes [2-4]. Some manufacturers in Europe are producing semi-
structural sandwich panels in this way [2, 5], but panel complexity is currently limited, as the forming
mechanisms are poorly understood. Thus, the process design is based on trial and error, which may
result in significant risks in application. The key to unlocking the potential of the process is the
development of a simulation tool to facilitate the process design for rapid and low-cost manufacture of
composite sandwich structures with assured high quality.
Finite element (FE) simulation provides a low-cost way to determine a set of compatible process
parameters for manufacturing. It is able to approximately predict local defects and visualise the
forming behaviour of the skins and the core. The application of simulation techniques can help to
assess the feasibility of the process prior to implementation. However, there is currently no FE model
available specifically for forming of honeycomb structures. FE modelling techniques for structural
analysis are usually designed to address load-carrying capability including damage prediction [6-9],
while a model for manufacturing simulation would be required to inform the formability including the

prediction of forming-induced defects. Here, through-thickness crushing of the honeycomb core is not
considered as defect but mechanism of forming in component manufacture, while it is typically
considered a failure mode in structural engineering [10-12]. Also, existing FE models are developed
for sandwich structures where the skins are bonded to the core [13-15]. During forming, the skins are
not bonded to the core, allowing relative slippage which facilitates formability. Debonding, which is
detrimental to the performance of finished structures, is not an issue here.
For the forming process simulation, the sandwich skins can be modelled as highly deformable
fabric reinforcement [16-26], while the development of the constitutive model for the core material
requires a homogenisation to obtain effective mechanical properties. The interaction at the contact
between skins and core needs to be modelled appropriately. The model is used to investigate the
feasibility of forming a generic component with complex curvature and variable section thickness.
2 MATERIALS
As shown in Figure 1, the sandwich preform assembly is constructed from two outer fibre
reinforced skins and a cellular core. The core has a hexagonal honeycomb structure and is made from
recycled cardboard. The low density of the porous core compared to the composite skins results in a
significant weight-saving compared to a monolithic composite panel of the same bending stiffness.
The crushable core presents an opportunity to produce complex composite panels with local variations
in thickness before consolidation, without the need to pre-machine the core to the desired shape.
Figure 1: Primary constituents of a typical sandwich panel.
The two skins are made from FCIM359 biaxial carbon fibre non-crimp fabric (NCF), supplied by
Hexcel, Leicester, UK. Each ply is 0.4 mm thick and consists of 440 gsm of carbon fibre in 24K tow
format. The fibre architecture is ±45° with a pillar stitch at 0° in the roll direction. The material shows
an asymmetric shear behaviour and has previously been modelled by the authors using a homogenised
non-orthogonal constitutive model [21-24, 26]. This model has been validated with sufficient fidelity.
2.1 Characterisation of core material
The cell dimensions of the honeycomb core were measured at 5 different positions and its average
values are shown in Figure 2. The material for the cell walls was assumed to be isotropic. Uniaxial
tensile tests were performed on flat specimens using a universal testing machine at a strain rate of 0.03
s-1. The tensile force was recorded by a 5 kN load cell and an extensometer was used to measure the
axial strain. Material properties were obtained using average values from five repeats listed in Table 1.
Figure 2: Dimension of the honeycomb core.

Property Density Young’s modulus Poisson’s ratio Fracture strain
Value 0.74×10³ kg/m3 0.41 GPa 0.21 0.067
Table 1: Properties of the cell wall material (i.e. cardboard) from experimental testing.
2.1.1 Through-thickness compression testing
Properties of the honeycomb core in through-thickness compression were tested according to
ASTM C365 (see Figure 3a). A small linear region in the stress strain curve presents at low strains due
to cell wall bending, as indicated in Figure 3b. This is followed by a long plateau region where
buckling of the cell walls occurs. Densification begins from 15 mm of crushing (i.e. 0.75 in nominal
strain), when the cell structure has fully collapsed. It causes a rapid increase in stress with further
increase in strain. The 20 mm thick core material characterised here can be compressed to a final
thickness of approximately 2 mm (i.e. 0.90 nominal strain). The crushing response of the material was
tested at 3 different strain rates (1 mm/min, 10 mm/min, 50 mm/min), showing that the response is rate
insensitive (see Figure 3b).
(a) Compression testing setup (b) Compressive behaviour of the honeycomb core
0 mm 2 mm 4 mm 6 mm 8 mm
10 mm 12 mm 14 mm 16 mm 18 mm
(c) Deformation modes of the honeycomb core at different compression levels Figure 3: Through-thickness compression testing of the honeycomb core.
2.1.2 In-plane tensile testing
In-plane tensile tests were performed on the honeycomb core along the longitudinal and transverse
directions as shown in Figure 4. Results show that the core exhibits the same in-plane tensile stiffness
(0.2 MPa) in the two test directions up to ~0.32 nominal strain. The longitudinal tensile modulus (i.e.
the slope of the curve) between 0.40 and 0.45 nominal strain is ~0.39 MPa, where the cell walls are
generally aligned to the tensile loading direction. The specimen fails at ~0.46 nominal strain in
longitudinal tensile loading due to the debonding of specimen from the testing rig. In contrast, damage
starts at 0.44 nominal strain for the transverse core specimen and complete failure occurs at ~0.70.
There is no significant increase in tensile modulus in the transverse direction, as debonding occurs at
the double-thickness walls (see Figure 2), where two adjacent cardboard plies are glued together to
produce the core architecture.

0.0 0.2 0.4 0.6 0.80.00
0.02
0.04
0.06
0.08
0.10
0.12
Nominal strain
Nom
inal str
ess (
MP
a)
Longitudinal tensile test
Transverse tensile test
Longitudinal tensile Transverse tensile
(a) Tensile testing setup (b) Tensile behaviour of honeycomb core
Figure 4: In-plane tensile testing of the honeycomb core.
2.1.3 Shear testing
The shear behaviour of the honeycomb core was tested according to ASTM C273 (see Figure 5a).
As shown in Figure 5b, gradients of the stress-strain curves from three shear tests are consistent,
indicating reproducibility of shear moduli derived from the tests. The average shear modulus is 1.56
MPa. Failure occurred in the adhesive used to bond the core to the aluminium tabs, therefore the peak
stress and strain in Figure 5 are not representative of the ultimate values of the core.
0.00 0.04 0.08 0.12 0.16 0.200.0
0.1
0.2
0.3
0.4
Nominal shear strain
Nom
inal shear
str
ess (
MP
a)
Shear test - 1
Shear test - 2
Shear test - 3
(a) Shear testing setup (b) Shear curves of the honeycomb core from testing
Figure 5: Shear testing of the honeycomb core.
2.2 Friction between materials
The friction between the core and the NCF skins was tested following ASTM D1894, ISO8295. A
50 mm × 100 mm core sample was bonded to a moving sled using double-sided adhesive tape, while
the NCF used in the skins was bonded to a static aluminium table. The adhesive tape, NCF and core
specimen were replaced after every test. Friction coefficients were calculated from the ratio of the
tangential (pulling) force and the applied normal force (10 N, corresponding to a normal pressure of 2
kPa) during relative movement at a constant velocity (100 mm/min). The average value was calculated
from five repeat tests for each surface pairing [26]. The friction behaviour depends on the direction of
relative displacement or displacement tendency at the interface rather than the side of NCF contacting
to the honeycomb core due to the identical effect of the pillar stitch pattern on both surfaces of this
NCF. Multiple orientations of NCF and core were tested. As shown in Figure 6, the coefficient of
friction varies from 0.47 to 0.57 along different relative orientations of the core to the yarn direction of

the NCF. However, the friction behaviour in the simulation was assumed to be isotropic throughout,
using an average value of 0.52. While this assumption may affect the precision of the simulation
results, it greatly reduces complexity since it enables the in-built isotropic Coulomb friction model to
be used in Abaqus/Explicit. Friction coefficients were previously obtained by the authors for other
surface pairings, including 0.23 for tool-fabric contact and 0.36 for tool-core contact [22, 23, 26].
(a) Orientation convention (b) Average friction coefficients in different orientations
Figure 6: Friction testing for interfacial friction coefficient between NCF fabric and core. L and T
denote the longitudinal and the transverse directions of the core respectively; Y and S denote the yarn
and the stitch directions of the NCF on the contact surface; the pulling direction of the sled is the
reference direction (i.e. 0°); all of the numbers in these contact pairing codes are the angles in degree
with respect to the reference direction.
2.3 Material modelling for core material
The mechanical behaviour of the honeycomb core can be modelled at multiple scales, as shown in
Figure 7. At the meso-scale, the architecture of the core can be represented by a unit cell which repeats
in translation. The high geometrical fidelity of this model enables the deformation modes of the core to
be studied in detail, as the mechanical response is replicated explicitly. However, simulations at this
level of detail are computationally expensive, and consequently the size of the structure that can be
analysed is limited.
Figure 7: Multi-scale modelling of honeycomb core material.
Alternatively, the core can be modelled at the macro-scale, by homogenising the material
behaviour and considering it to be a continuum. The macro-scale response should be equivalent to the
corresponding meso-scale model in terms of representative average performance. It is important that
the influence of the different deformation modes is captured, such as bending of the cell walls which
contributes to the initial linear region on the stress strain curve in Figure 3b. Therefore, both modelling
scales, meso and macro, have been used to provide a balance between fidelity and execution time. The
meso-scale model was employed to identify mechanisms of core deformation (such as cell wall

bending, cell wall buckling and densification in Figure 3). These were then correlated with suitable
macro-scale indicators (such as nominal through-thickness strain) for formability/defect prediction.
The honeycomb core was constructed from a series of shell elements at the meso-scale (S4R in
Abaqus/Explicit) or continuum brick elements (C3D8R in Abaqus/Explicit) following homogenisation
at the macro-scale. Since the walls of the honeycomb core were perpendicular to the rigid surface in
compression, unrealistically stress concentration and contact penetration might occurred when the load
was directly applied to the meso-scale model. Consequently, the simulation might fail to converge due
to penetration. Two methods were introduced to refine the contact behaviour to improve numerical
stability, by increasing the surface area of the core material in contact with the tool and hence reduce
local stresses. For the first method, dummy flanges were added to the free edges of each cell wall.
These were assigned a much lower stiffness than the wall material, i.e. less than 1.0 % (see Table 2) to
limit their influence on the overall cell response. The second method used a dummy infill material to
occupy the cell pores. The honeycomb structure was embedded into a solid volume using the
*EMBEDDED ELEMENT command in Abaqus/Explicit. Thus, contact was initiated at one of the
solid surfaces rather than the edges of the corresponding cell walls. Similarly, the infill material had
the same overall dimensions as the representative volume and the material properties were 1.0 % of
the homogenised core material (see Table 2) and a small facture strain (0.010) was assigned for
element deletion to minimise the additional resistance on buckling. Either method facilitates numerical
convergence using a meso-scale model but without significantly compromising the simulation fidelity.
Material Density Young’s modulus Poisson’s ratio Fracture strain Dummy flange 0.74×10³ kg/m3 0.004 GPa 0.21 0.067 Dummy infill material 0.05×10³ kg/m3 0.0003 GPa 0.0 0.010
Table 2: Material properties of dummy materials used in meso-scale models.
The honeycomb core was modelled at the macro-scale using a crushable foam model available in
Abaqus/Explicit [27] which is suitable for modelling buckling of cell walls in compression of
crushable cores. The homogenised material properties were calibrated using data collected from
compression tests, as shown in Figure 8. The RMSE (Root Mean Square Error) of the simulated stress-
strain curve is less than 5 % compared to the experimental curve, indicating adequate agreement.
Meso-scale simulations provide detailed information on the deformation mode of the honeycomb core,
but these models take much longer to converge than the equivalent macro-scale model. While the
macro-scale model only replicates the equivalent behaviour of the homogenised continuum and does
not indicate the detailed deformation behaviour, the overall averaged response is representative of the
stress-strain curve determined experimentally, as shown in Figure 8.
-0.9-0.8-0.7-0.6-0.5-0.4-0.3-0.2-0.10.0
-1.5
-1.2
-0.9
-0.6
-0.3
0.0
Nominal strain
No
min
al str
ess (
MP
a)
Experiment
Simulation
Figure 8: Stress-strain curve for through-thickness compression of the honeycomb core.
3 PROCESS MODELLING
3.1 FE models for forming
An explicit FE model was established to simulate the forming process of composite sandwich
panels, consisting of a honeycomb core and two outer fabric layers. The sandwich panels were press-
formed into the desired shape using a set of matched tools, as shown in Figure 9. All parts of the
tooling were defined as rigid bodies in the model, including the punch, the die and the blank holder.
The die and the blank holder were fixed during forming, while a vertical displacement of the punch
simulated the forming stroke. A penalty contact algorithm was employed to define the interfacial
behaviour. An isotropic Coulomb friction model was used for the tool-core, tool-fabric and core-fabric
contacts, using friction coefficients of 0.36, 0.23 and 0.52, respectively. The upper and lower fabric
skins were modelled using a non-orthogonal constitutive model previously developed by the authors
for a biaxial non-crimp fabric with a pillar stitch [22].
Figure 9: Schematic of a FE model of forming a sandwich panel. The original dimensions of the core
were 300 mm × 300 mm × 20 mm.
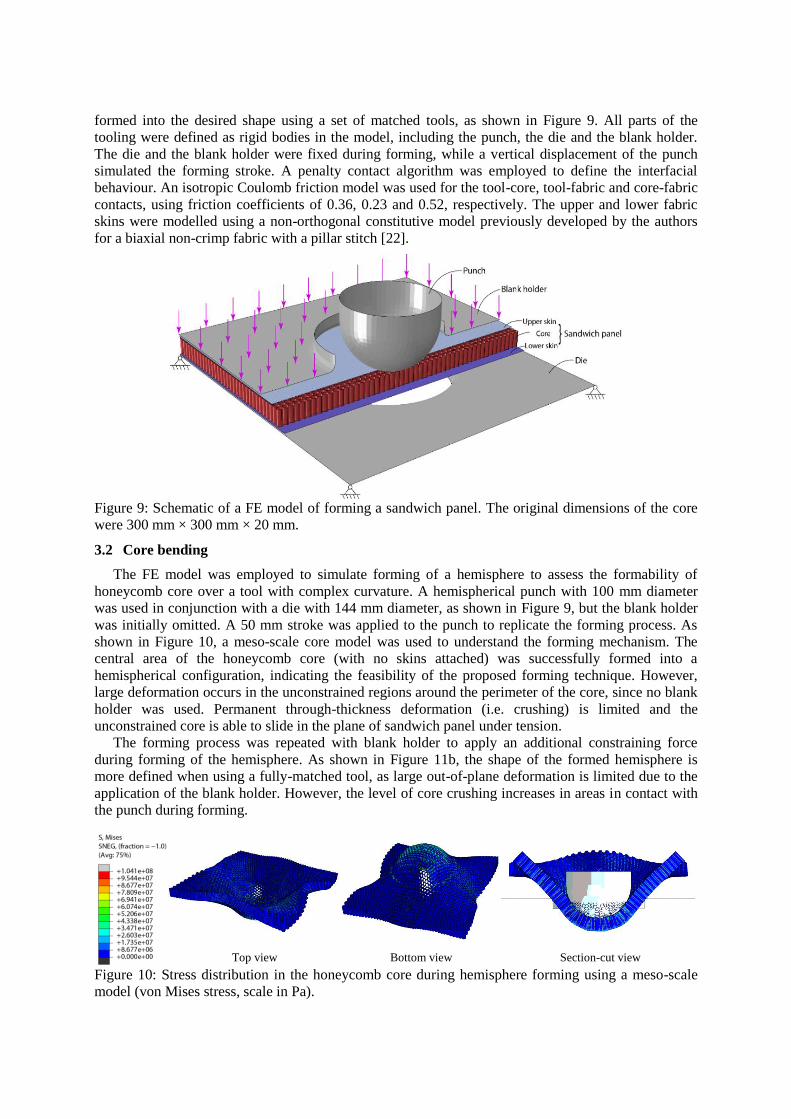
3.2 Core bending
The FE model was employed to simulate forming of a hemisphere to assess the formability of
honeycomb core over a tool with complex curvature. A hemispherical punch with 100 mm diameter
was used in conjunction with a die with 144 mm diameter, as shown in Figure 9, but the blank holder
was initially omitted. A 50 mm stroke was applied to the punch to replicate the forming process. As
shown in Figure 10, a meso-scale core model was used to understand the forming mechanism. The
central area of the honeycomb core (with no skins attached) was successfully formed into a
hemispherical configuration, indicating the feasibility of the proposed forming technique. However,
large deformation occurs in the unconstrained regions around the perimeter of the core, since no blank
holder was used. Permanent through-thickness deformation (i.e. crushing) is limited and the
unconstrained core is able to slide in the plane of sandwich panel under tension.
The forming process was repeated with blank holder to apply an additional constraining force
during forming of the hemisphere. As shown in Figure 11b, the shape of the formed hemisphere is
more defined when using a fully-matched tool, as large out-of-plane deformation is limited due to the
application of the blank holder. However, the level of core crushing increases in areas in contact with
the punch during forming.
Top view Bottom view Section-cut view
Figure 10: Stress distribution in the honeycomb core during hemisphere forming using a meso-scale
model (von Mises stress, scale in Pa).

Section-cut view Section-cut profile
(a) Forming without blank holder
Section-cut view Section-cut profile
(b) Forming with blank holder Figure 11: Comparison of different boundary conditions during hemisphere forming of the core (von
Mises stress, scale in Pa).
3.3 Core crushing
The forming of honeycomb core with variable local thickness was investigated using an 80 mm ×
80 mm cubic punch with a fillet (radius 20 mm) at the edges. A 10 mm stroke (i.e. half of the core
thickness) was applied in the thickness direction. The core was compressed against a flat plate, where
all tools were modelled as rigid bodies. A meso-scale model was used to simulate the compressive
response of the cardboard core sample, which had dimensions of 120 mm × 120 mm × 20 mm.
As shown in Figure 12, the cell walls buckle or fold around the compression surface, which has a
negligible effect on the core material outside the punch area. Crushing starts at the top of the specimen
in contact with the punch surface and propagates through the thickness towards the base of the
specimen. Less crushing can be observed at the lower surface of the specimen than the upper surface.
The simulation results are in good agreement with the deformation modes exhibited by test specimens
(Figure 12).
Section-cut view
Figure 12: Crushing a cardboard core for different local thicknesses (von Mises stress, scale in Pa).
4 FORMIING SIMULATION FOR DEMONSTRATOR PART
4.1 Numerical model
A generic composite component was chosen to demonstrate the feasibility of forming sandwich
panels into complex curved configurations. As shown in Figure 13, a set of matched tools (including
punch and die, but no blank holder) were modelled as rigid bodies, where the die was fixed and the
punch was subjected to a displacement in the z-direction. A single-layer of FCIM359 NCF (at ±45°
relative to the x-axis) was positioned on both the top surface and bottom surface of the core to form a
sandwich.

Figure 13: Schematic of a FE model of forming a generic component. The longitudinal direction of the
panel is along the x axis, while the transverse direction is along the y axis.
4.2 Shape optimisation
The FE model described above was used to optimise the blank shape for the forming process. An
initial forming simulation was run for a rectangular blank of dimensions 720 mm × 590 mm
(thickness of the core 20 mm, thickness of the skins 0.4 mm), as illustrated in Figure 14a. In total, 9
simulations were performed and excess material outside of the final trim line on the formed
component was removed iteratively. In each iteration, the fabric blank was trimmed into the same
shape of the core blank for convenience.
(a) Iteration 0 (b) Optimum – Iteration 8 Figure 14: Shape optimisation for sandwich panel forming. NE, Max, Principal (Abs) denotes the
principal nominal strain whose magnitude is the maximum out of three.
4.3 Forming-induced defects
The demonstrator component was manufactured as shown in Figure 15a. The predicted shear
angles of the sandwich skins (see Figure 15b) are in the range from -30° to 12°, which does not exceed
the wrinkling onset shear angles (42° in positive shear and -50° in negative shear, as reported in [26]).
Simulations indicate that no out-of-plane wrinkling occurs in either skin after forming, which is in
agreement with the experiment.
(a) (b)
Figure 15: Manufactured component (a) and shear angle distribution of NCF skins from simulation (b)
for a generic component.

A cross-section of the component was taken at an arbitrary position to identify other forming-
induced defects. Resin rich regions were identified along the top edges of the thickest region of the
core, i.e. the dark edges in the longitudinal direction (see Figure 15a and Figure 16a). This was also
predicted by the simulation, as shown in Figure 16b. During forming, the fabric skins become trapped
due to the high frictional forces, causing the fabric to bridge the concave regions of the tool. The high
in-plane tensile forces in the fabric plies cause the core to crush locally, creating channels along the
edges of the geometry which consequently fill with resin, resulting in resin-rich areas.
(a) Experiment (b) Simulation
Figure 16: Section view of the sandwich panel from experiment and simulation.
5 CONCLUSIONS
FE models have been developed to simulate the process of forming curved sandwich panels with
variable thickness. A series of experiments were performed to characterise the honeycomb core to
provide input data for material modelling. The core was modelled at different scales. The meso-scale
model was employed to identify the relevant forming mechanisms, while the macro-scale model was
used to replicate the overall forming response. Results from the meso-scale simulation indicate that the
formability for sandwich panels with complex curvature is primarily derived from the bending
deformation of the sandwich panel, while through-thickness crushing of the core enables variable
thicknesses. A macro-scale model was developed to efficiently predict the homogenised behaviour,
enabling process optimisation. A generic component was simulated, where a flat sandwich panel blank
was formed into a 3D configuration. The developed FE model was employed to optimise the blank
shape for net-shape forming. The manufacturing solution determined by simulation shows a good
agreement with experiment, indicating the suitability of the numerical tool for industrial applications.
ACKNOWLEDGEMENTS
This work was funded by the Engineering and Physical Sciences Research Council [Grant number:
EP/P006701/1], as part of the “EPSRC Future Composites Manufacturing Research Hub”.
REFERENCES
[1] Pflug, J. and Verpoest, I., Sandwich materials selection charts. Journal of Sandwich Structures
& Materials, 2006. 8(5): p. 407-421.
[2] Gordon Murray Design, <www.iStreamtechnology.co.uk>. Accessed June 2017.
[3] Pflug, J., EconCore, Composite Panels: Thermoplastic Solution for Demanding Applications,
<http://www.econcore.com/en/products-applications/composite-panels>. Accessed June 2017.
[4] Cai, Z.-Y., Zhang, X., and Liang, X.-B., Multi-point forming of sandwich panels with egg-box-
like cores and failure behaviors in forming process: Analytical models, numerical and
experimental investigations. Materials & Design, 2018. 160: p. 1029-1041.
[5] From ecological thinking to custom-made solutions,<http://www.borgers-
group.com/en/materials /carrier/ibocomb/>. Accessed May 2019.
[6] Chen, Z., Yan, N., Sam-Brew, S., Smith, G., and Deng, J., Investigation of mechanical
properties of sandwich panels made of paper honeycomb core and wood composite skins by
experimental testing and finite element (FE) modelling methods. European Journal of Wood and
Wood Products, 2014. 72(3): p. 311-319.

[7] Mozafari, H., Khatami, S., and Molatefi, H., Out of plane crushing and local stiffness
determination of proposed foam filled sandwich panel for Korean Tilting Train eXpress–
Numerical study. Materials & Design, 2015. 66: p. 400-411.
[8] Gibson, L.J. and Ashby, M.F., Cellular solids: structure and properties. 1999: Cambridge
university press.
[9] Foo, C., Chai, G., and Seah, L., A model to predict low-velocity impact response and damage in
sandwich composites. Composites Science and Technology, 2008. 68(6): p. 1348-1356.
[10] Petras, A. and Sutcliffe, M., Failure mode maps for honeycomb sandwich panels. Composite
structures, 1999. 44(4): p. 237-252.
[11] Aktay, L., Johnson, A.F., and Holzapfel, M., Prediction of impact damage on sandwich
composite panels. Computational Materials Science, 2005. 32(3-4): p. 252-260.
[12] Chawla, A., Mukherjee, S., Kumar, D., Nakatani, T., and Ueno, M., Prediction of crushing
behaviour of honeycomb structures. International journal of crashworthiness, 2003. 8(3): p. 229-
235.
[13] Abrate, S., Impact on Composite Structures. 1998, Cambridge: Cambridge University Press.
[14] Burton, W.S. and Noor, A., Structural analysis of the adhesive bond in a honeycomb core
sandwich panel. Finite Elements in analysis and design, 1997. 26(3): p. 213-227.
[15] Dear, J., Lee, H., and Brown, S., Impact damage processes in composite sheet and sandwich
honeycomb materials. International Journal of Impact Engineering, 2005. 32(1-4): p. 130-154.
[16] Chen, S., Endruweit, A., Harper, L., and Warrior, N. Forming simulations of multi-layered
woven preforms assembled with stitch yarns. in 16th European conference on composite
materials. 2014: Seville Spain. 2014.
[17] Chen, S., Endruweit, A., Harper, L., and Warrior, N., Inter-ply stitching optimisation of highly
drapeable multi-ply preforms. Composites Part A: Applied Science and Manufacturing, 2015.
71: p. 144-156.
[18] Chen, S., Harper, L., Endruweit, A., and Warrior, N., Formability optimisation of fabric
preforms by controlling material draw-in through in-plane constraints. Composites Part A:
Applied Science and Manufacturing, 2015. 76: p. 10-19.
[19] Chen, S., Harper, L.T., Endruweit, A., and Warrior, N.A. Optimisation of forming process for
highly drapeable fabrics. in 20th international conference on composite materials. 2015:
Copenhagen Denmark. 2015.
[20] McGregor, O., Chen, S., Haper, L., Endruweit, A., and Warrior, N. Defect characterisation and
selective stitch removal in non-crimp fabrics. in 20th International Conference SAMPE Europe.
2015.
[21] Chen, S., Fabric forming simulation and process optimisation for composites. 2016, University
of Nottingham.
[22] Chen, S., McGregor, O., Harper, L., Endruweit, A., and Warrior, N., Defect formation during
preforming of a bi-axial non-crimp fabric with a pillar stitch pattern. Composites Part A:
Applied Science and Manufacturing, 2016. 91: p. 156-167.
[23] Chen, S., McGregor, O., Endruweit, A., Elsmore, M., De Focatiis, D., Harper, L., and Warrior,
N., Double diaphragm forming simulation for complex composite structures. Composites Part
A: Applied Science and Manufacturing, 2017. 95: p. 346-358.
[24] Chen, S., McGregor, O., Harper, L., Endruweit, A., and Warrior, N., Optimisation of double
diaphragm forming process through local adjustment of in-plane constraint, in 21st
International Conference on Composite Materials. 2017.
[25] McGregor, O., Chen, S., Harper, L., Endruweit, A., and Warrior, N. Defect reduction in the
double diaphragm forming process. in 21st International Conference on Composite Materials.
2017.
[26] Chen, S., McGregor, O., Harper, L., Endruweit, A., and Warrior, N., Optimisation of local in-
plane constraining forces in double diaphragm forming. Composite Structures, 2018. 201: p.
570-581.
[27] Dassault Systèmes, Abaqus 2016 Analysis User’s Guide. 2016.