finite element analysis of the piezoelectric stacked ... · pdf filefinite element analysis of...
TRANSCRIPT

Finite element analysis of the piezoelectric stacked-HYBATS transducer
This article has been downloaded from IOPscience. Please scroll down to see the full text article.
2013 Smart Mater. Struct. 22 035015
(http://iopscience.iop.org/0964-1726/22/3/035015)
Download details:
IP Address: 152.14.119.97
The article was downloaded on 05/05/2013 at 17:09
Please note that terms and conditions apply.
View the table of contents for this issue, or go to the journal homepage for more
Home Search Collections Journals About Contact us My IOPscience
IOP PUBLISHING SMART MATERIALS AND STRUCTURES
Smart Mater. Struct. 22 (2013) 035015 (11pp) doi:10.1088/0964-1726/22/3/035015
Finite element analysis of the piezoelectricstacked-HYBATS transducer
Laura Tolliver1, Tian-Bing Xu2 and Xiaoning Jiang1
1 Department of Mechanical and Aerospace Engineering, North Carolina State University, Raleigh,NC 27695, USA2 National Institute of Aerospace, 100 Exploration Way, Hampton, VA 23666, USA
E-mail: [email protected]
Received 8 December 2012, in final form 18 January 2013Published 14 February 2013Online at stacks.iop.org/SMS/22/035015
AbstractFinite element modeling (FEM) of a piezoelectric multilayer-stacked hybridactuation/transduction system (stacked-HYBATS) is investigated in this paper using ANSYSsoftware. This transducer consists of two positive strain components operating in d33 modeand one negative strain component operating in d31 mode to generate large displacements.FEM results are compared with experimental and analytical results to provide insight into theactuation mechanisms, verify the device’s three displacement components, and estimate itsblocking force. FEM calculations found the effective piezoelectric coefficient to beexceptional, about 3.11× 10⁶ pm V−1 at resonance. Stacked-HYBATS was quantitativelycompared to commercially available flextensional actuators using finite element analysis. Itwas found that under the same electric field the yielded displacement of a stacked-HYBATS isabout 200% and 15% larger than that of a same-sized d31 and d33 flextensional actuator,respectively. These findings suggest that stacked-HYBATS is promising for precisionpositioning, vibration control, and acoustic applications.
(Some figures may appear in colour only in the online journal)
1. Introduction
Piezoelectric transduction structures have been exploited ina variety of high value applications including acoustics,sensing, energy harvesting, and actuation. For example,hydrophones are used in the military and biomedical fields fordetecting underwater sound waves and calibrating the outputof ultrasound devices for medical imaging and therapy [1].Geophones have both military and civilian applications insensing changes in rock formations and soil [2]. Otherpiezoelectric sensors are used as accelerometers [3], inreporting humidity, temperature, and viscosity [3], and innondestructive testing and structural health monitoring [4].The high power density of piezoelectrics at low voltages aswell as ease in using their harvested energy has made thesetransducers viable substitutes for external power sources [5].Finally, piezoelectric actuators are known to have large strainsat relatively low electric fields, quick response times, largeoutput displacements, and high generative forces [5].
Recent work in hydrophone technology and nondestruc-tive testing has attempted to increase sensitivity as well asproduce a stable output over a wide range of frequencies.Meanwhile, a variety of sensor configurations have been de-veloped to produce the largest possible voltage response [1–3,6, 7]. In the case of actuators, research has focused ongenerating the largest blocking forces and displacements atlow operating voltage. In general, a piezoelectric transducerconverts mechanical energy to electrical energy or vice versa;an improvement in the performance of one transducer type(e.g. an actuator) can be used to improve performance inanother (e.g. a sensor). For example, an actuator with broadfrequency bandwidth at resonance could also be used forbroadband energy harvesting and acoustic sensing. Thus, anactuator with favorable dynamic response holds promise forthe energy harvesting and sensing areas as well. To thisend, this paper focuses on a novel piezoelectric actuatorconfiguration which in turn has far-reaching implications forother piezoelectric transduction structures.
10964-1726/13/035015+11$33.00 c© 2013 IOP Publishing Ltd Printed in the UK & the USA

Smart Mater. Struct. 22 (2013) 035015 L Tolliver et al
Table 1. Comparison of piezoelectric actuators compiled from a variety of sources as labeled.
Configuration Dimensions (mm) Active material Amplification ratio Max. stroke (µm) Blocking force (N)
Cantilever [15] 34.9×12.7×2.5 PZT-5A N/A ±1260 ±0.31Multilayerstack [16]
25.1× 25.1× 20 PZT-5 N/A 15.6 20 000
THUNDER [10] r = 2540 PZT-5A N/A 375 <10 [17]t = 0.381
RAINBOW [10] r = 2540 PZT-5A N/A 300 <10 [18]t = 0.381
Moonie 11×11×3.4 [11] PZT-5 [11] 5 [19] 22 [11] 3 [19]Cymbal 12.7× 12.7×
2 [12]PZT [20] 40 [12] 40 [12] 20 [12]
Flextensional [21] 13.3× 10× 5.5 PZT 5 55 27Flextensional [14] 27.4× 13.6× 10 PMN–PT single crystal 3.89 96.5 HundredsHYBAS [22] 5.5× 3× 1 [P(VDF–TrFE)],
PZN–PT single crystal2.5 >350 N/A
Stacked-HYBATS [23]
35.5× 10× 18 TRS-HK1-HD −10 30 N/A
2. Actuation mechanism and design rationale
First, we will briefly summarize the main piezoelectricactuator configurations. This will allow us to place ourdevice in the context of the body of research literature. Theearliest example of a piezoelectric actuator is the fixed–freecantilever. This transducer is comprised of two piezoelectricplates bonded together and electrically connected in seriesor parallel. Commercial models of this type offer largedisplacements of over a millimeter but very small blockingforce (<0.5 N) [8]. The multilayer piezoelectric stack isanother actuator configuration in which many thin plates ofpiezoelectric ceramic are bonded together. The plates areconnected in parallel electrically and the poling direction ofeach plate is aligned parallel to the applied electric field,so each plate expands or contracts at the same time. Thesestack actuators produce smaller displacements (in the rangeof 10–20 µm) but very large blocking force (2600 N) [9]. Inorder to produce both large displacements and high generativeforce, amplification structures have been developed. In thecases of RAINBOW and THUNDER, the amplificationstructure is a thin sheet of metal that is bonded to thepiezoelectric material. The curved shape of the actuatorsproduces a stress in the piezoelectric layer that causeslarge deformations (∼375 µm) under an applied electricfield [10]. In other amplified actuators a piezoelectric elementis sandwiched between metal end caps or a metal frame. Inthese configurations a small horizontal displacement in thepiezoelectric element is amplified into a much larger verticaldisplacement via the end caps or frame. In the moonie eachmetal end cap is a disk with a semi-ellipsoid solid removed;in the cymbal the metal end cap is a thinner dome-shapedstructure with a flat top. These actuators have the advantageof using both the d31 and d33 piezoelectric coefficients for anenhanced amplification ratio [11, 12]. An even more popularconfiguration for commercial applications is the flextensionalactuator which is comprised of a piezoelectric element
(usually a multilayer stack or a bar) inside a metal frame.Such actuators are capable of producing large displacementsand relatively large generative force. For instance, an actuatorof this type having dimensions 57 mm × 214.3 mm ×21 mm can produce 1050 µm of displacement and 745 Nof blocking force [13]. Additionally, the performance of suchflextensional actuators can be further optimized through anappropriate choice of active material. For example, replacingthe piezoelectric multilayer stack in a flextensional actuatorwith a single-crystal PMN–PT stack results in increaseddisplacement [14]. A summary of the actuator types and theirmajor performance specifications is shown in table 1.
Recently, Xu, Su, and Jiang presented two varia-tions on the flextensional design known as HYBAS andstacked-HYBATS [22–24]. These designs contrast withthose described above in that these new configurationssynergistically use both the expansion and the contractionof smart materials. Each configuration contains one or morepositive strain components (PSCs) as well as a negativestrain component (NSC), as shown below in figure 1. Thepositive strain components in each device are comprised ofa material that expands when a voltage is applied. Thismaterial is [P(VDF–TrFE)] (a PVDF copolymer film) andd33 mode piezoelectric ceramic or single crystal in HYBASand stacked-HYBATS, respectively. Similarly, the negativestrain components are comprised of a material that contractswhen a voltage is applied; d31 mode relaxor single-crystalor piezoelectric ceramics can be used in both HYBAS andstacked-HYBATS. When the material of the negative straincomponent is activated and contracts along the x-direction,the positive strain components are stressed and displacein the z-direction. At the same time, if the positive straincomponent(s) is (are) activated, this material expands, andadditional displacement in the z-direction is obtained. Thecombined effect brings about more vertical displacementthan would be possible from using either the positive or thenegative strain component alone. For example, when both
2

Smart Mater. Struct. 22 (2013) 035015 L Tolliver et al
Figure 1. Cross-section of HYBAS and stacked-HYBATS. Upon actuation, the negative strain components (NSCs) in each device contractin the x-direction while the positive strain components (PSCs) bend and expand. This produces enhanced displacement in the z-direction.The arrows indicate the displacement directions.
components were activated, HYBAS featured over 225 µmof vertical displacement, while activating only the positive ornegative strain component resulted in 190 µm and 75 µm ofvertical displacement, respectively.
The first prototype of stacked-HYBATS featured TRS-HK1-HD in both its positive and negative strain components.This material is a high density piezoelectric ceramic withhigh dielectric constants. Both expansion and contraction areaccessible in this material because the direction of strain(either positive or negative) is determined by the structuralorientation as well as the directions of poling and electricfield application. For example, the piezoelectric solid shownin figure 2 is oriented in the 〈001〉 direction and is poledin the z-direction. Upon application of an electric field asshown, the solid expands in the z-direction (longitudinal ord33 mode) and contracts in the x-direction (transverse or d31mode). Similarly, when the solid contracts in the z-directionit expands in the x-direction. So, positive and negative strainare both possible in both modes as long as the appropriatestructural orientation as well as poling and electric fielddirections are used. It is noteworthy, however, that the straingenerated in the transverse direction is a little less than halfthat generated in the longitudinal direction. In other words,the d33 mode of actuation provides more displacement thanthe d31 mode. In spite of this, however, the stiffness ofthe TRS-HK1-HD material is almost identical in the x- andz-directions.
The novel actuation mechanism of stacked-HYBATS hasbeen proven feasible by Xu et al [23]. Experimental resultsshowed the system’s viability with its large displacements,strong resonance, and large effective piezoelectric coeffi-cient [23]. However, a discrepancy was found between thesimple analytical model and the measured displacements.In this study, finite element analysis is employed to verifythe measured displacements and to further understand theoperation mechanism of stacked-HYBATS. In addition, thispaper presents a quantitative comparison of the operat-ing characteristics of the stacked-HYBATS, commerciallyavailable d33 mode flextensional actuators, and d31 modeflextensional actuators. Finally, we will discuss the many
Figure 2. A piezoelectric brick poled in the z-direction with voltageapplied as shown expands in the z-direction (known as longitudinalor d33 mode actuation) and contracts in the x-direction (known astransverse or d31 mode actuation).
applications of the device for sensing, energy harvesting, andactuation.
3. Experimental and analytical results [23]
Firstly, stacked-HYBATS was fabricated with dimensions andpoling directions as shown below in table 2 and figure 3. Theinitial shape of the positive strain components (PSCs) is givenby
zi(x) =1c
[(L
2
)2
− x2
]2
(1)
where x is the position along the x-axis, L = 25 mm, andc = 47 000 mm3. Additionally, the initial curvature length ofthe PSCs is given by
LiPSC =
∫ L/2
−L/2
[(dzi(x)
dx
)2
+ (1)2]1/2
dx. (2)
3
Smart Mater. Struct. 22 (2013) 035015 L Tolliver et al
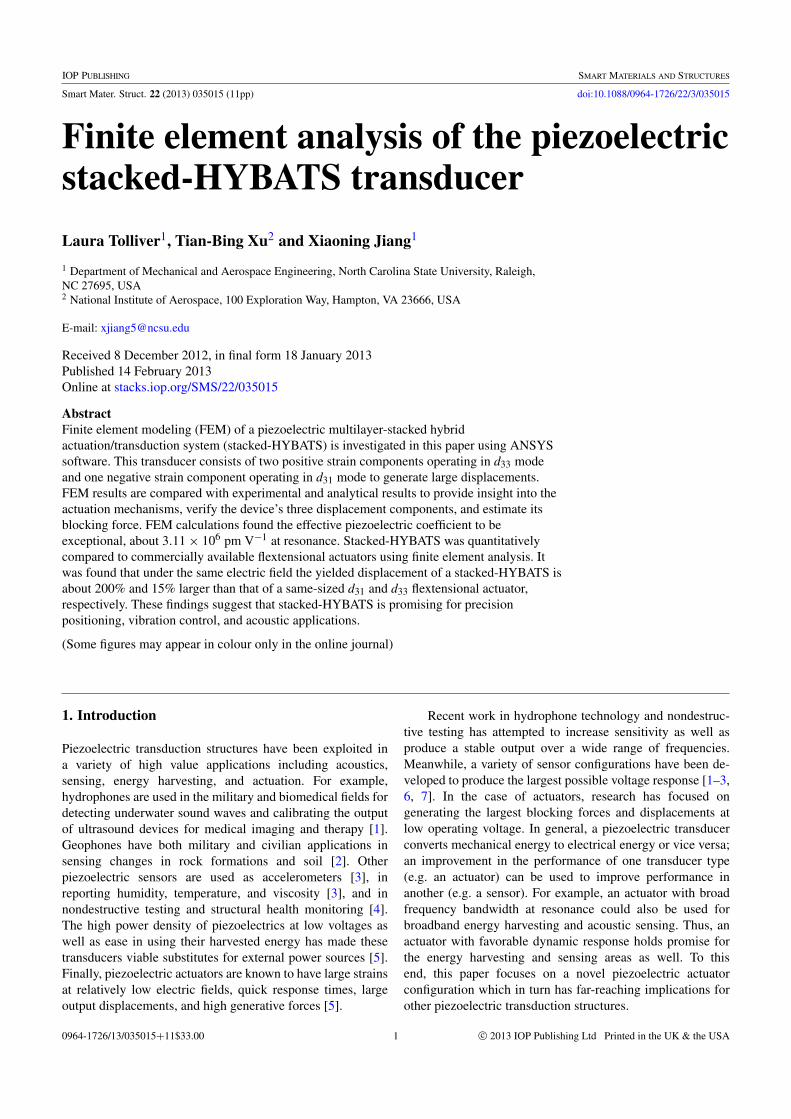
Figure 3. (a) Overall dimensions of stacked-HYBATS. All unitsare given in mm. (b) A reduced version of stacked-HYBATS isshown such that the poling directions (arrows) and voltageapplication are clearly visible. (c) Photograph of stacked-HYBATS.
Table 2. Dimensions of active materials in stacked-HYBATS.
ComponentNumber ofpiezoelectric plates
Thickness of eachplate (mm)
Positive straincomponent
43 0.6
Negative straincomponent
20 1
The piezoelectric plates in each of the componentsare connected mechanically in series and electrically inparallel to produce the expansion and contraction describedin section 2. Displacement measurements for both static anddynamic electric field application were taken using a laservibrometer (Polytec, PI, Inc., model OFV-512) with a laserbeam measuring 5 µm in diameter.
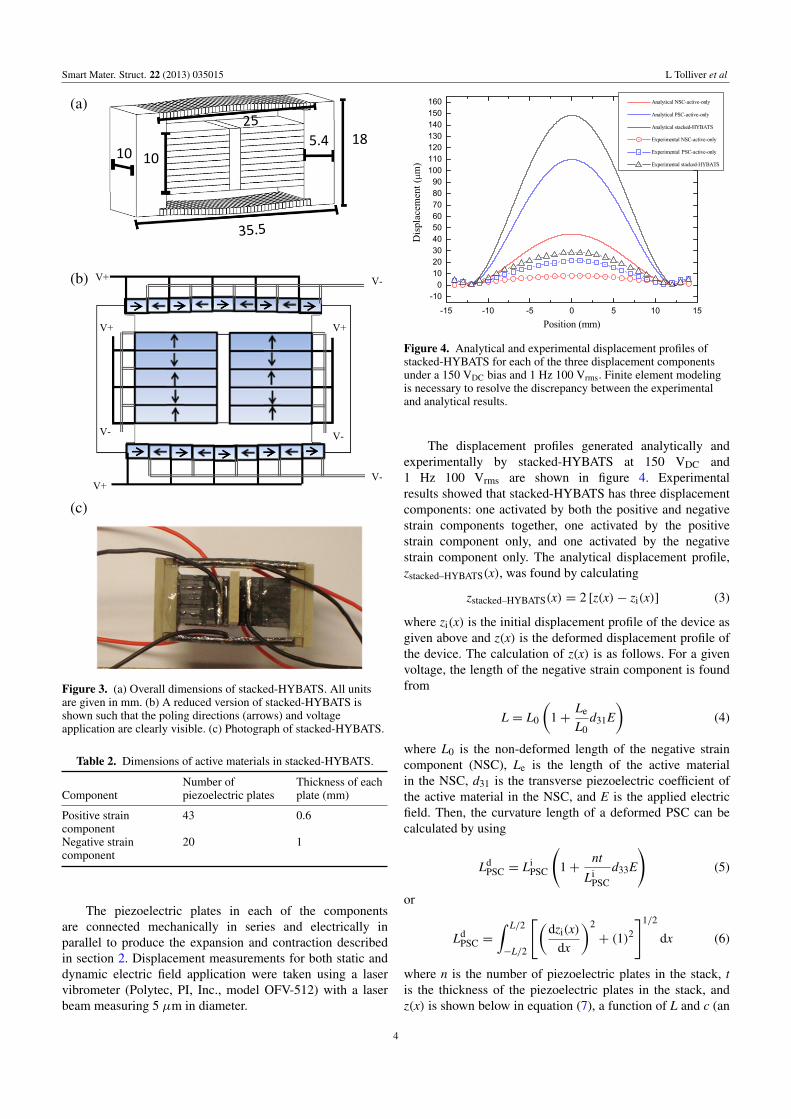
Figure 4. Analytical and experimental displacement profiles ofstacked-HYBATS for each of the three displacement componentsunder a 150 VDC bias and 1 Hz 100 Vrms. Finite element modelingis necessary to resolve the discrepancy between the experimentaland analytical results.
The displacement profiles generated analytically andexperimentally by stacked-HYBATS at 150 VDC and1 Hz 100 Vrms are shown in figure 4. Experimentalresults showed that stacked-HYBATS has three displacementcomponents: one activated by both the positive and negativestrain components together, one activated by the positivestrain component only, and one activated by the negativestrain component only. The analytical displacement profile,zstacked–HYBATS(x), was found by calculating
zstacked–HYBATS(x) = 2 [z(x)− zi(x)] (3)
where zi(x) is the initial displacement profile of the device asgiven above and z(x) is the deformed displacement profile ofthe device. The calculation of z(x) is as follows. For a givenvoltage, the length of the negative strain component is foundfrom
L = L0
(1+
Le
L0d31E
)(4)
where L0 is the non-deformed length of the negative straincomponent (NSC), Le is the length of the active materialin the NSC, d31 is the transverse piezoelectric coefficient ofthe active material in the NSC, and E is the applied electricfield. Then, the curvature length of a deformed PSC can becalculated by using
LdPSC = Li
PSC
(1+
nt
LiPSC
d33E
)(5)
or
LdPSC =
∫ L/2
−L/2
[(dzi(x)
dx
)2
+ (1)2]1/2
dx (6)
where n is the number of piezoelectric plates in the stack, tis the thickness of the piezoelectric plates in the stack, andz(x) is shown below in equation (7), a function of L and c (an
4

Smart Mater. Struct. 22 (2013) 035015 L Tolliver et al
unknown).
z(x) =1c
[(L
2
)2
− x2
]2
. (7)
Equation (8) is the result of combining equations (5)–(7).Substituting in values, we can solve for an updated c constantand obtain z(x).
LiPSC
(1+
nt
LiPSC
d33E
)
=
∫ L/2
−L/2
√1
c2(4x3 − L2x)2 + 1dx. (8)
The analytical results agree with the experimentalresults in that the analysis yields three distinct displacementcomponents. However, the analytical results are fivetimes greater than the experimental results. To this end,finite element modeling must be employed to verify theexperimental results and provide insight into the differencebetween the experimental and analytical results.
4. Finite element modeling
4.1. Methods
In order to verify experimental and analytical results andcompare stacked-HYBATS with commercial flextensionalactuators, finite element modeling was conducted usingANSYS Workbench 12.1 and ANSYS mechanical appliedparametric design language (MAPDL). The piezoelectricelements in the designs were modeled as SOLID226 elementswith the 1001 KEYOPT activated. This is the most recentlyupdated coupled-field element type available in ANSYSsoftware. SOLID226 elements are 3D 20-node coupled-fieldhexahedra with nodes at each corner and at the midpoint ofeach edge. The mathematical functions corresponding to theactive degrees of freedom at each node are quadratic; degreesof freedom for position in the x-, y-, and z-directions as wellas for the electric potential were activated. Each electrode wasmodeled as an equipotential surface. The elasticity matrix,the piezoelectric matrix, and the permittivity matrix werespecified in order to correctly model the active materials. Asample mesh used for the finite element modeling is shownbelow in figure 7.
4.2. Materials
Two different active materials were used to model thepiezoelectric multilayer stacks (such as those shown infigure 1): NEPEC-N10 and TRS-HK1-HD [23]. NEPEC-N10 is a commercial PZT-5 material. TRS-HK1-HD is anewer material available from TRS Technologies and isa piezoceramic with very large electromechanical couplingcoefficients. The properties of these materials are shown intable 3.
Table 3. Properties for piezoelectric materials used in simulations.
Property Units NEPEC-N10 TRS-HK1-HD
ρ kg m−3 8000 8000d31 m V−1
−2.87× 10⁻¹⁰−3.6× 10⁻¹⁰
d33 m V−1 6.35× 10⁻¹⁰ 8.00× 10⁻¹⁰
d15 m V−1 9.3× 10⁻¹⁰ 8.4× 10⁻¹⁰
se11 m2 N−1 1.48× 10⁻¹¹ 1.54× 10⁻¹¹
se33 m2 N−1 1.81× 10⁻¹¹ 1.75× 10⁻¹¹
se12 m2 N−1
−5.03× 10⁻¹²−4.6× 10⁻¹²
se13 m2 N−1
−8.45× 10⁻¹²−7.4× 10⁻¹²
se44 m2 N−1 4.49× 10⁻¹¹ 2.16× 10⁻¹¹
se66 m2 N−1 4.49× 10⁻¹¹ 2.16× 10⁻¹¹
KT11 — 5000 1600
KT33 — 5440 2500
Table 4. Properties of isotropic materials used in simulations.
MaterialYoung’s modulus(GPa)
Poisson’sratio
Spring steel 210 0.283Passive ceramic 27 0.34Loctite Hysol Epoxy ResinRE2039
2.24 0.34
Brass 100 0.34
Passive ceramic, spring steel, brass, and Loctite HysolEpoxy Resin are linear isotropic materials used in modelingthe frame, electrodes, and bonding epoxy. The Young’smodulus and Poisson’s ratio for these materials were takenfrom materials databases. The properties of these materialsare shown in table 4.
4.3. Boundary conditions
We investigated the static structural, modal, and harmonicresponses of stacked-HYBATS in this study. Additionally,the blocking force of the stacked-HYBATS was calculatedusing finite element analysis. The boundary conditions for thevarious investigations are described below.
A quarter model of the geometry was used todetermine the static displacement, natural frequency, resonantdisplacement, and blocking force of a given actuatorconfiguration. This reduced the number of elements andnodes and minimized computation time. For these analyses,symmetry boundary conditions were placed on the surfacescorresponding to x = 0 and y = 0 as shown in figure 5. Suchboundary conditions set out-of-plane translations and in-planerotations to zero. In the results presented in this work, thevertical displacement profiles were found by measuring thevertical displacement at the edge of each layer of piezoelectricmaterial. To report the overall vertical output displacement ofan actuator, a single measurement was taken at the highestcenter element when voltage was applied. For blocking forcemeasurements a static load was placed on the highest centerelement and increased until the output displacement of theactuator was zero. A diagram of these boundary conditionswith measurement points is shown below in figure 5.
5

Smart Mater. Struct. 22 (2013) 035015 L Tolliver et al
Figure 5. Quarter model of stacked-HYBATS. Gray areas arecomprised of passive ceramic; white areas are comprised ofpiezoelectric material.
4.4. Modeling assumptions for commercial flextensionalactuator
The active component in the commercial flextensionalactuator is a co-fired ceramic piezoelectric multilayer stackcontaining about 175 piezoelectric plates. The piezoelectricmaterial was modeled as linear so the stack could bemodeled as a piezoelectric brick instead of a design withseparate layers. For example, the maximum displacement fora commercially available TOKIN multilayer stack actuatorcomprised of NEPEC-N10 is about 17 µm at the maximumoperating voltage of 150 VDC. The thickness of each layerin the stack was calculated to be 0.109 mm since the overalllength of the stack was known. Finally, the applied DC voltagewas used along with the thickness of the layers to determinethe electric field applied to each layer of the stack. In theANSYS simulations the voltage applied to the piezoelectricbrick created the same electric field present in each of thelayers of the stack.
5. Modeling results and discussion
5.1. Stacked-HYBATS modeling results
Stacked-HYBATS was modeled with dimensions as shownin figure 4. This simulation served multiple purposes. Thefirst was to ensure the correctness of the boundary conditionsused for modeling as described in section 4.3. The secondwas to examine the discrepancy between the analytical andexperimental results published by Xu et al [23] in which theanalytically modeled displacement was five times greater thanthe experimental displacement. An additional purpose of the
Figure 6. Comparison of experimental and modeled verticaldisplacement output for prototyped stacked-HYBATS andcomparison of experimental, analytical, and modeled horizontalcontraction for negative strain component in prototypedstacked-HYBATS.
modeling was to gain insight into the actuation mechanismsof all three displacement components. All of these results willbenefit the future optimal designs of HYBATS.
Figure 6 shows a comparison between the experimentaland finite element modeling results of the prototypedstacked-HYBATS. The device was biased with 150 VDC andsubjected to an AC voltage. This figure differs from figures 4and 7 in that instead of obtaining the displacement profile foreach point on the positive strain component (PSC), the totalvertical output displacement of the device was measured atthe point shown in figure 5 for increasing values of Vrms.Additionally, the total horizontal contraction of the negativestrain component (NSC) was measured experimentally, andestimated analytically by using equation (4) and by FEM.
The experimental, analytical, and FEM measurements ofthe horizontal contraction of the negative strain componentare in perfect agreement. This suggests that the flaw inthe analytical modeling of stacked-HYBATS lies not inthe calculation involving the NSC, but in the calculationsrelated to the PSC. The FEM and experimental measurementsof the combined effect of the positive and negative straincomponents differ somewhat, especially below Vrms =
60. This can be attributed to the nonlinear behavior ofthe piezoelectric stack actuator in open-loop operation atlow voltages which was not taken into account in themodeling [25]. The nonlinear effects are rather small and donot detract from the use of finite element analysis as a tool forthe design and optimization of similar transducers.
Experimental results showed that stacked-HYBATS hasthree different displacement components. The experimentsuggested that one displacement component can be activatedby the synergetic contribution of the PSCs and NSC together,the second component by the activation of the PSCs alone,and the third component by the activation of the NSC alone.Figure 7 compares the experimental results with finite element
6

Smart Mater. Struct. 22 (2013) 035015 L Tolliver et al
Figure 7. (Top) Deformed finite element model with arrowssuperimposed to show actuation direction. Displacement valuesshown are in meters. (Bottom) Comparison of ANSYS modelingand experimental results for the stacked-HYBATS. A drivingvoltage of 150 VDC bias and 1 Hz 100 Vrms AC was used in theexperiment and the simulation.
modeling results and verifies that multiple displacementcomponents are achievable with the device. The ANSYSresults and the experimental results are in good agreementfor the PSC activation. However, the modeled displacementresults are less than the experimental results for the NSCactivation as well as the simultaneous activation of the PSCsand NSC. Since the results in figure 6 show that the modelingof the negative strain component was in good agreementwith the experimental and analytical results, we can concludethat the FEM underestimates the effect of the positive straincomponent when the negative strain component is activated.Thus, there must be some sort of interplay between thenegative strain component and positive strain componentwhen they are activated together that the modeling doesnot account for. One explanation is that the PSCs weremore flexible in the experimental prototype than in the finiteelement model. This could be caused by relative motion orsliding between the active and passive components of thiscomponent, as suggested by Xu et al [23]. This presence of
Figure 8. No-load harmonic response for the stacked-HYBATS,PSC-active-only mode, and NSC-active-only mode at 1 Vrms AC.Displacement in the vertical direction is plotted against thefrequency of the AC driving signal.
relative motion, sliding, or increased flexibility of the PSCsis supported by the experimental data. For the displacementcomponent involving the simultaneous activation of thepositive and negative strain components as well as thecomponent involving positive strain only, the experimentalresults showed that the end of the actuator has a verticaldisplacement of up to 5 µm, and this displacement drops by2–3 µm at a position about 10 mm from the actuator centerbefore increasing again. The modeling and analytical results,however, showed a steady increase in displacement from thedevice end to the device middle. This suggests that the bondsin the prototyped PSCs are imperfect.
The experimentally determined resonance frequenciesof each of the displacement components of the stacked-HYBATS [23] were compared with ANSYS modelingresults for a no-load case. The NSC-active-only componentand stacked-HYBATS each have two resonance peaksin the experimental results (4850 and 5300 Hz for theNSC-active-only mode and 4830 and 5300 Hz for the stacked-HYBATS) [23]. This is in contrast to the ANSYS modelingresults where each component has only one resonance peak asshown in figure 8 (6300 Hz for the PSC-active-only mode,6250 Hz for the NSC-active-only mode, and 5793 Hz forthe stacked-HYBATS.) The additional resonance peaks inthe experimental data could be due to asymmetry in thefabricated device [23]. The simulated device, however, wasmodeled to be symmetric about all three axes. Thus, wecan expect that the modal analysis of the simulated devicewould yield only one resonance peak for each of the threemodes. Comparison of the resonance frequencies betweenthe experimental and simulated cases is difficult becauseof the multiple resonance peaks in the experimental case.However, a few observations are possible. In the simulatedstatic analysis, any result involving the activation of the NSCunderestimated the effect of the PSC. As one would expect,
7
Smart Mater. Struct. 22 (2013) 035015 L Tolliver et al
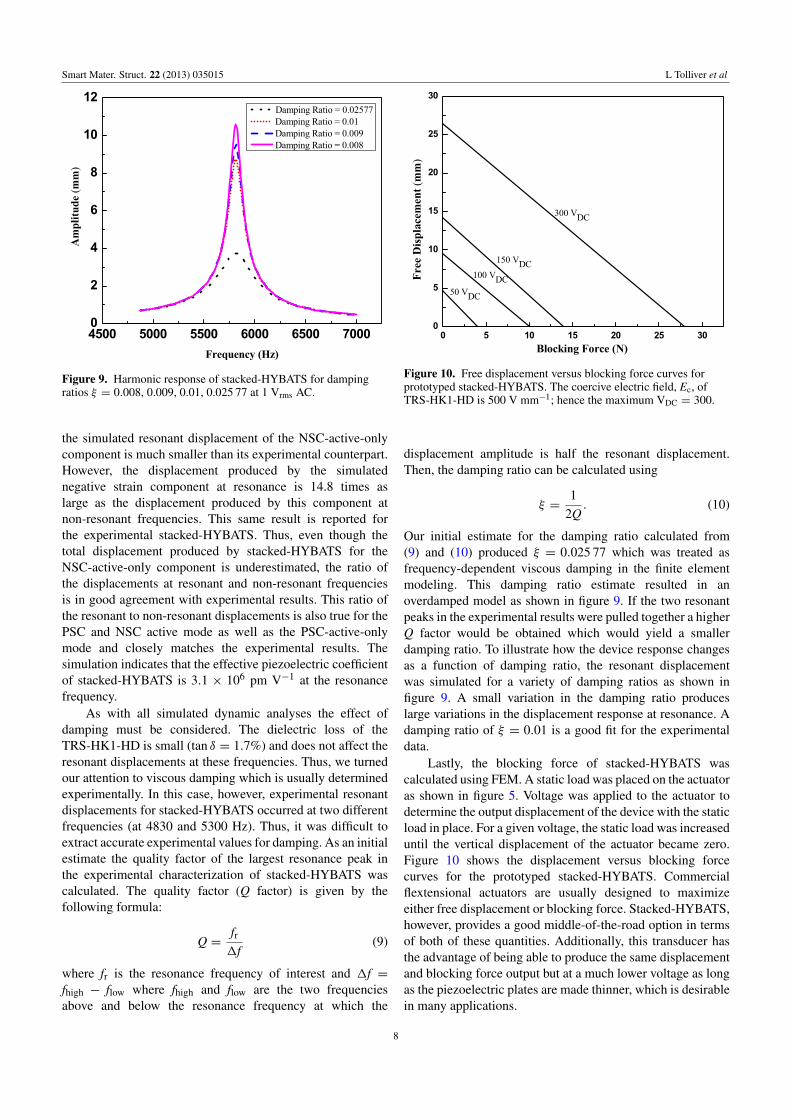
Figure 9. Harmonic response of stacked-HYBATS for dampingratios ξ = 0.008, 0.009, 0.01, 0.025 77 at 1 Vrms AC.
the simulated resonant displacement of the NSC-active-onlycomponent is much smaller than its experimental counterpart.However, the displacement produced by the simulatednegative strain component at resonance is 14.8 times aslarge as the displacement produced by this component atnon-resonant frequencies. This same result is reported forthe experimental stacked-HYBATS. Thus, even though thetotal displacement produced by stacked-HYBATS for theNSC-active-only component is underestimated, the ratio ofthe displacements at resonant and non-resonant frequenciesis in good agreement with experimental results. This ratio ofthe resonant to non-resonant displacements is also true for thePSC and NSC active mode as well as the PSC-active-onlymode and closely matches the experimental results. Thesimulation indicates that the effective piezoelectric coefficientof stacked-HYBATS is 3.1 × 10⁶ pm V−1 at the resonancefrequency.
As with all simulated dynamic analyses the effect ofdamping must be considered. The dielectric loss of theTRS-HK1-HD is small (tan δ = 1.7%) and does not affect theresonant displacements at these frequencies. Thus, we turnedour attention to viscous damping which is usually determinedexperimentally. In this case, however, experimental resonantdisplacements for stacked-HYBATS occurred at two differentfrequencies (at 4830 and 5300 Hz). Thus, it was difficult toextract accurate experimental values for damping. As an initialestimate the quality factor of the largest resonance peak inthe experimental characterization of stacked-HYBATS wascalculated. The quality factor (Q factor) is given by thefollowing formula:
Q =fr1f
(9)
where fr is the resonance frequency of interest and 1f =fhigh − flow where fhigh and flow are the two frequenciesabove and below the resonance frequency at which the
Figure 10. Free displacement versus blocking force curves forprototyped stacked-HYBATS. The coercive electric field, Ec, ofTRS-HK1-HD is 500 V mm−1; hence the maximum VDC = 300.
displacement amplitude is half the resonant displacement.Then, the damping ratio can be calculated using
ξ =1
2Q. (10)
Our initial estimate for the damping ratio calculated from(9) and (10) produced ξ = 0.025 77 which was treated asfrequency-dependent viscous damping in the finite elementmodeling. This damping ratio estimate resulted in anoverdamped model as shown in figure 9. If the two resonantpeaks in the experimental results were pulled together a higherQ factor would be obtained which would yield a smallerdamping ratio. To illustrate how the device response changesas a function of damping ratio, the resonant displacementwas simulated for a variety of damping ratios as shown infigure 9. A small variation in the damping ratio produceslarge variations in the displacement response at resonance. Adamping ratio of ξ = 0.01 is a good fit for the experimentaldata.
Lastly, the blocking force of stacked-HYBATS wascalculated using FEM. A static load was placed on the actuatoras shown in figure 5. Voltage was applied to the actuator todetermine the output displacement of the device with the staticload in place. For a given voltage, the static load was increaseduntil the vertical displacement of the actuator became zero.Figure 10 shows the displacement versus blocking forcecurves for the prototyped stacked-HYBATS. Commercialflextensional actuators are usually designed to maximizeeither free displacement or blocking force. Stacked-HYBATS,however, provides a good middle-of-the-road option in termsof both of these quantities. Additionally, this transducer hasthe advantage of being able to produce the same displacementand blocking force output but at a much lower voltage as longas the piezoelectric plates are made thinner, which is desirablein many applications.
8
Smart Mater. Struct. 22 (2013) 035015 L Tolliver et al
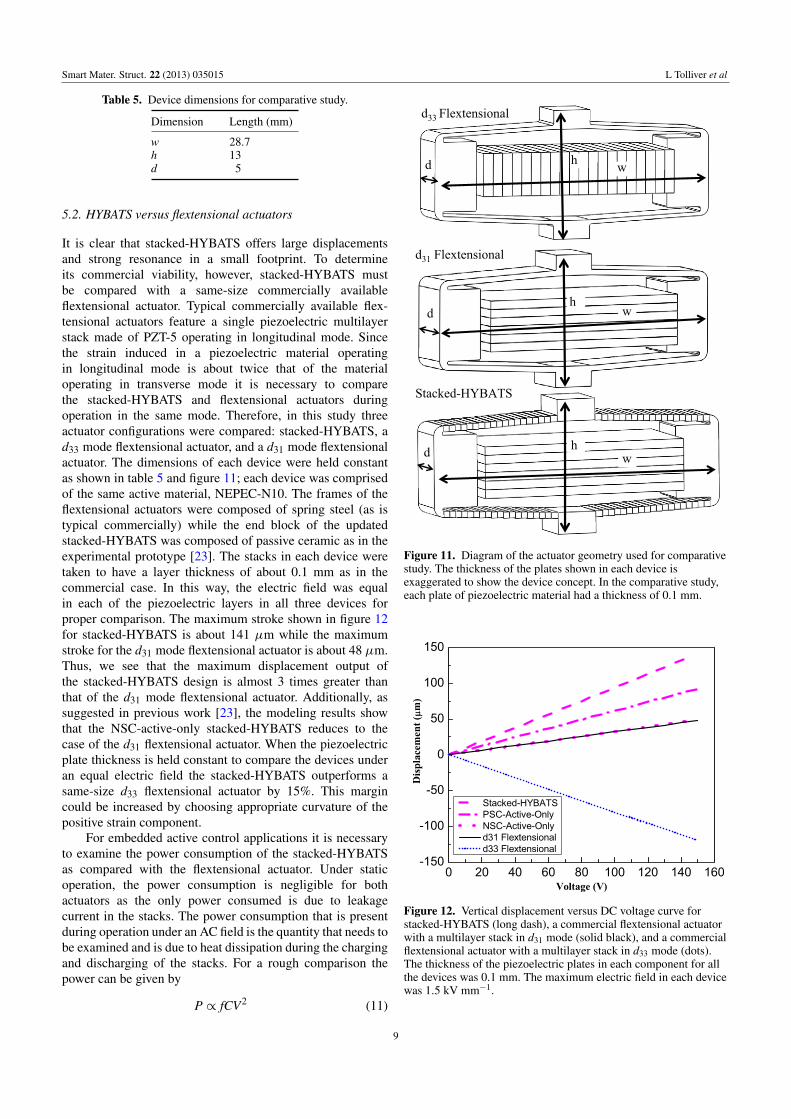
Table 5. Device dimensions for comparative study.
Dimension Length (mm)
w 28.7h 13d 5
5.2. HYBATS versus flextensional actuators
It is clear that stacked-HYBATS offers large displacementsand strong resonance in a small footprint. To determineits commercial viability, however, stacked-HYBATS mustbe compared with a same-size commercially availableflextensional actuator. Typical commercially available flex-tensional actuators feature a single piezoelectric multilayerstack made of PZT-5 operating in longitudinal mode. Sincethe strain induced in a piezoelectric material operatingin longitudinal mode is about twice that of the materialoperating in transverse mode it is necessary to comparethe stacked-HYBATS and flextensional actuators duringoperation in the same mode. Therefore, in this study threeactuator configurations were compared: stacked-HYBATS, ad33 mode flextensional actuator, and a d31 mode flextensionalactuator. The dimensions of each device were held constantas shown in table 5 and figure 11; each device was comprisedof the same active material, NEPEC-N10. The frames of theflextensional actuators were composed of spring steel (as istypical commercially) while the end block of the updatedstacked-HYBATS was composed of passive ceramic as in theexperimental prototype [23]. The stacks in each device weretaken to have a layer thickness of about 0.1 mm as in thecommercial case. In this way, the electric field was equalin each of the piezoelectric layers in all three devices forproper comparison. The maximum stroke shown in figure 12for stacked-HYBATS is about 141 µm while the maximumstroke for the d31 mode flextensional actuator is about 48 µm.Thus, we see that the maximum displacement output ofthe stacked-HYBATS design is almost 3 times greater thanthat of the d31 mode flextensional actuator. Additionally, assuggested in previous work [23], the modeling results showthat the NSC-active-only stacked-HYBATS reduces to thecase of the d31 flextensional actuator. When the piezoelectricplate thickness is held constant to compare the devices underan equal electric field the stacked-HYBATS outperforms asame-size d33 flextensional actuator by 15%. This margincould be increased by choosing appropriate curvature of thepositive strain component.
For embedded active control applications it is necessaryto examine the power consumption of the stacked-HYBATSas compared with the flextensional actuator. Under staticoperation, the power consumption is negligible for bothactuators as the only power consumed is due to leakagecurrent in the stacks. The power consumption that is presentduring operation under an AC field is the quantity that needs tobe examined and is due to heat dissipation during the chargingand discharging of the stacks. For a rough comparison thepower can be given by
P ∝ fCV2 (11)
Figure 11. Diagram of the actuator geometry used for comparativestudy. The thickness of the plates shown in each device isexaggerated to show the device concept. In the comparative study,each plate of piezoelectric material had a thickness of 0.1 mm.
Figure 12. Vertical displacement versus DC voltage curve forstacked-HYBATS (long dash), a commercial flextensional actuatorwith a multilayer stack in d31 mode (solid black), and a commercialflextensional actuator with a multilayer stack in d33 mode (dots).The thickness of the piezoelectric plates in each component for allthe devices was 0.1 mm. The maximum electric field in each devicewas 1.5 kV mm−1.
9

Smart Mater. Struct. 22 (2013) 035015 L Tolliver et al
Table 6. Comparison of power consumption per unit volume activematerial.
Stacked-HYBATS Flextensional
Volume of active material (mm3) 1136.8 1000Capacitance (µF) 4.97 3.87Power consumption per unitvolume of active material(µW mm−3)
43.7 38.7
where f is the frequency of the AC field, C is thecapacitance of the stack, and V is the applied voltage [26].In the comparison of the flextensional actuator and stacked-HYBATS the thicknesses of the piezoelectric plates andthe materials were held constant. This allows for a faircomparison of the transducers under the same voltage.Assuming that the frequency of the AC field applied toeach transducer is equal, the power consumption becomes afunction of the capacitance which can be calculated by using
C = nKT
33ε0A
t(12)
where n is the number of layers in the piezoelectric stack,ε33 is the dielectric constant of the material, A is thearea of a single piezoelectric plate, and t is the distancebetween the electrodes. Table 6 shows the volume of theactive material for each of the transducers, their calculatedcapacitances, and the power consumption per unit volumeof active material calculated at 1 kHz and 100 VDC.Stacked-HYBATS consumes 13% more power than theflextensional actuator but offers benefits in applications withits significant displacements, large blocking forces, and strongresonance.
6. Conclusion
Finite element modeling of a novel transduction structure,stacked-HYBATS, is presented in this paper. The FEMresults are in good agreement with the experimental resultsreported in [23], in contrast to previously reported analyticalresults that were 5 times too large [23]. Modeling resultsshow that stacked-HYBATS offers multiple displacementcomponents, large output force, and strong resonance. Thesequalities benefit actuator applications which require largeoutput displacement, accuracy on the micron scale, andrelatively large output force in a very small package [27].In terms of sensing and energy harvesting, stacked-HYBATSis superior to its flextensional counterpart because passivematerial is replaced with active material which allowsfor better transduction in a smaller footprint. Additionally,stacked-HYBATS surpasses transverse mode flextensionalactuators in terms of displacement by a factor of 3 andlongitudinal mode flextensional actuators by a factor of 1.15.Finite element analysis has proven to be a valuable tool forthe evaluation of our novel device. Future generations ofstacked-HYBATS will benefit from design and optimizationby FEM.
References
[1] Li D, Wu M, Oyang P and Xu X 2006 Cymbal piezoelectriccomposite underwater acoustic transducer Ultrasonics44 685–7
[2] Michlmayr G, Cohen D and Or D 2012 Sources andcharacteristics of acoustic emissions from mechanicallystressed geological data—a review Earth-Sci. Rev.112 97–114
[3] Sharapov V 2011 Piezoceramic Sensors (New York: Springer)[4] Langenberg K, Marklein R and Mayer K 2012 Ultrasonic
Nondestructive Testing of Materials: TheoreticalFoundations (Boca Raton, FL: Taylor & Francis)
[5] Uchino K 1997 Piezoelectric Actuators and Ultrasonic Motors(Boston, MA: Kluwer Academic)
[6] Gaudenzi P 2009 Smart Structures: Physical Behaviour,Mathematical Modelling and Applications (Chichester:Wiley)
[7] Tressler J, Alkoy S and Newnham R 1998 Piezoelectricsensors and sensor materials J. Electroceram. 2 257–72
[8] Wang Q, Zhang Q, Xu B, Liu R and Cross L 1999 Nonlinearpiezoelectric behavior of ceramic bending mode actuatorsunder strong electric fields J. Appl. Phys. 86 3352–60
[9] Wolff A, Cramer D, Hellebrand H, Probst I and Lubitz K 1994Optical two channel elongation measurement of PZTpiezoelectric multilayer stack actuators Proc. 9th IEEE Int.Symp. on Applications of Ferroelectrics (University Park,PA) pp 755–7
[10] Wise S A 1998 Displacement properties of RAINBOW andTHUNDER piezoelectric actuators Sensors Actuators A69 33–8
[11] Onitsuka K, Dogan A, Tressler J, Xu Q, Yoshikawa S andNewnham R 1995 Metal–ceramic composite transducer, the‘Moonie’ J. Intell. Mater. Syst. Struct. 6 447–55
[12] Dogan A, Uchino K and Newnham R 1997 Compositepiezoelectric transducer with truncated conical endcapsCymbal IEEE Trans. Ultrason. Ferroelectr. Freq. Control44 597–605
[13] Micromechatronics, Inc. 2012 http://www.mmech.com/cedrat-actuators/apa-overview/apasspecifications#APA1000XL1 (accessed on: December 2012)
[14] Xu T-B, Tolliver L, Jiang X and Su J 2013 A single crystallead magnesium niobate–lead titanate multilayer-stackedcryogenic flextensional actuator Appl. Phys. Lett.102 042906
[15] Piezo Systems, Inc. 2012 http://www.piezo.com/prodbm7qm.html (accessed on: 6 December 2012)
[16] Micromechatronics, Inc. 2012 http://www.mmech.com/tokin-actuators/ned-tokin-resin-coated (accessed on: 6December 2012)
[17] Marouze J P and Cheng L 2002 A feasibility study of activevibration isolation using THUNDER actuators SmartMater. Struct. 11 854–62
[18] Garcia-Bonito J, Brennan M J, Elliott S J, David A andPinnington R J 1998 A novel high-displacementpiezoelectric actuator for active vibration control SmartMater. Struct. 7 31–42
[19] Onitsuka K, Dogan A, Xu Q, Yoshikawa S andNewnham R 1994 Design optimization for metal–ceramicactuator, ‘Moonie’ Ferroelectrics 156 37–42
[20] Fernandez J F, Dogan A, Fielding J T, Uchino K andNewnham R E 1998 Tailoring the performance ofceramic–metal piezocomposite actuators, ‘cymbals’Sensors Actuators A 65 228–37
[21] Micromechatronics, Inc. 2012 http://www.mmech.com/cedrat-actuators/apa-overview/apas-specifications#APA35XS (accessed on: 6 December 2012)
[22] Xu T-B and Su J 2005 Theoretical modeling of electroactivepolymer–ceramic hybrid actuation systems J. Appl. Phys.97 0349081
10

Smart Mater. Struct. 22 (2013) 035015 L Tolliver et al
[23] Xu T-B, Jiang X and Su J 2011 A piezoelectric multilayer-stacked hybrid actuation/transduction system Appl. Phys.Lett. 98 2435031
[24] Su J, Xu T-B, Zhang S, Shrout T and Zhang Q 2004 Anelectroactive polymer–ceramic hybrid actuation system forenhanced electromechanical performance Appl. Phys. Lett.85 1045–7
[25] Goldfarb M and Celanovic N 1996 Behavioral implications ofpiezoelectric stack actuators for control of
micromanipulation Proc. IEEE Int. Conf. on Robotics andAutomation (Minneapolis, Minnesota) vol 1, pp 226–31
[26] Kawakita S, Isogai T, Ohya N and Kawahara N 1997Multi-layered piezoelectric bimorph actuator Proc. Int.Symposium on Micromechatronics and Human Sciencepp 73–8
[27] Liu Y T and Higuchi T 2001 Precision positioning deviceutilizing impact force of combined piezo-pneumaticactuator IEEE/ASME Trans. Mechatron. 6 467–73
11