finite element analysis of cft columns subjected to an ...€¦ · finite element analysis of cft...
TRANSCRIPT

Journal of Constructional Steel Research 61 (2005) 1692–1712
www.elsevier.com/locate/jcsr
Finite element analysis of CFT columns subjected toan axial compressive force and bending
moment in combination
Hsuan-Teh Hua,∗, Chiung-Shiann Huangb, Zhi-Liang Chena
aDepartment of Civil Engineering, National Cheng Kung University, Tainan, Taiwan, ROCbDepartment of Civil Engineering, National Chiao Tung University, Hsinchu, Taiwan, ROC
Received 12 March 2004; accepted 3 May 2005
Abstract
Proper material constitutive models for concrete-filled tube (CFT) columns subjected to an axialcompressive force and bending moment in combination are proposed and verified in this paper byusing the nonlinear finite element program ABAQUS compared against experimental data. In thenumerical analysis, the cross sections of the CFT columns are categorized into three groups, i.e.,ones with circular sections, ones with square sections, and ones with square sections stiffened withreinforcing ties.
It is shown that the steel tubes can provide a good confining effect on the concrete core when theaxial compressive force is large. The confining effect of a square CFT stiffened by reinforcing ties isstronger than that of the same square CFT without stiffening ties but weaker than that of a circularCFT. Nevertheless, when the spacing of reinforcing ties is small, a CFT with a square section mightpossibly achieve the same confining effect as one with a circular section.
© 2005 Elsevier Ltd. All rights reserved.
Keywords: Concrete-filled tube columns; Width-to-thickness ratio; Lateral confining pressure
∗ Corresponding author. Tel.: +886 6 2757575x63168; fax: +886 6 2358542.E-mail address: [email protected] (H.-T. Hu).
0143-974X/$ - see front matter © 2005 Elsevier Ltd. All rights reserved.doi:10.1016/j.jcsr.2005.05.002

H.-T. Hu et al. / Journal of Constructional Steel Research 61 (2005) 1692–1712 1693
1. Introduction
A concrete-filled tube (CFT) column consists of a steel tube filled with concrete. Theconcrete core adds stiffness and compressive strength to the tubular column and reduces thepotential for inward local buckling. On the other hand, the steel tube acts as longitudinaland lateral reinforcement forthe concrete core helping it to resist tension, bending moment,and shear and helping to prevent the concrete from spalling. Due to the benefit of compositeaction of the two materials, the CFT columns provide excellent seismic event resistantstructural properties such as high strength, high ductility and large energy absorptioncapacity. In addition, the steel tube acts asboth erection steel and forming for thecomposite column during construction; thus a considerable amount of labor, materialsand construction cost can be avoided. As a result, CFT columns have gained popularityin supporting heavy loads in high rise buildings, bridges and offshore structures. Variousexperimental and analytical studies have been performed on CFT columns [1–19].
It is known that the ultimate strengths of CFT columns are influenced by theirconstituent material properties such as the compressive strength of the concrete, the yieldstrength of the steel, and the nonlinear behaviors of these two materials. In addition, theultimate strengths of CFT columns are also influenced by the concrete confining pressureand the geometric properties of the tubes, such as the shape of the cross section, the width-to-thickness ratio, and the spacing and the diameter of the reinforcing ties. With all of thesefactors having effects, how one predicts the ultimate strengths of CFT columns accuratelyrequires more thorough study.
In this paper, appropriate nonlinear constitutive material models for steel reinforcingties, steel tubes and confined concrete are proposed. Then, the nonlinear finite elementprogram ABAQUS [20] is employed to perform numerical simulations of CFT columnssubjected to combined axial compressive forces and bending moments. The proposedmaterial constitutive models as well as the predicted ultimate strengths of CFT columns areverified againstexperimental data of Liu et al. [21]. Finally, the influence of the concreteconfining pressure and the geometric properties of the columns on the behavior of CFTcolumns are studied and discussed.
2. Material properties and constitutive models
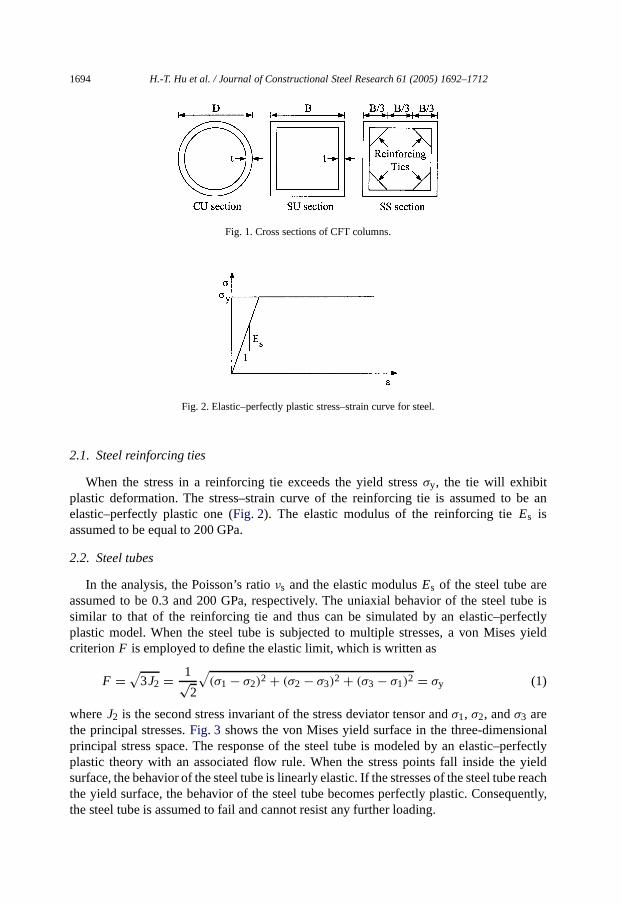
The cross sections of the CFT columns in this investigation are categorized into threegroups (Fig. 1), i.e., ones with circular sections (denoted by CU), ones with square sections(denoted by SU), and ones with square sections stiffened with steel reinforcing tiesforming an octagonal shape (denoted by SS). The square tubes with the SU sectionswere constructed by seam welding two U-shaped cold-formed steel plates. If stiffeningwas specified for SS sections, the tie bars with circular cross section were fillet weldedto the U-shaped cold-formed steel plates before making the seam complete-penetrationgroove welds [21]. The materials used in the numericalanalysis involve steel reinforcingties (for SS sections only), steel tubes and concrete. Constitutive models of these materialsare proposed and discussed as follows.
1694 H.-T. Hu et al. / Journal of Constructional Steel Research 61 (2005) 1692–1712
Fig. 1. Cross sections of CFT columns.
Fig. 2. Elastic–perfectly plastic stress–strain curve for steel.
2.1. Steel reinforcing ties
When the stress in a reinforcing tie exceeds the yield stressσy, the tie will exhibitplastic deformation. The stress–strain curve of the reinforcing tie is assumed to be anelastic–perfectly plastic one (Fig. 2). The elastic modulus of the reinforcing tieEs isassumed to be equal to 200 GPa.
2.2. Steel tubes
In the analysis, the Poisson’s ratioνs and the elastic modulusEs of the steel tube areassumed to be 0.3 and 200 GPa, respectively. The uniaxial behavior of the steel tube issimilar to that of the reinforcing tie and thus can be simulated by an elastic–perfectlyplastic model. When the steel tube is subjected to multiple stresses, a von Mises yieldcriterion F is employed to define the elastic limit, which is written as
F =√
3J2 = 1√2
√(σ1 − σ2)2 + (σ2 − σ3)2 + (σ3 − σ1)2 = σy (1)
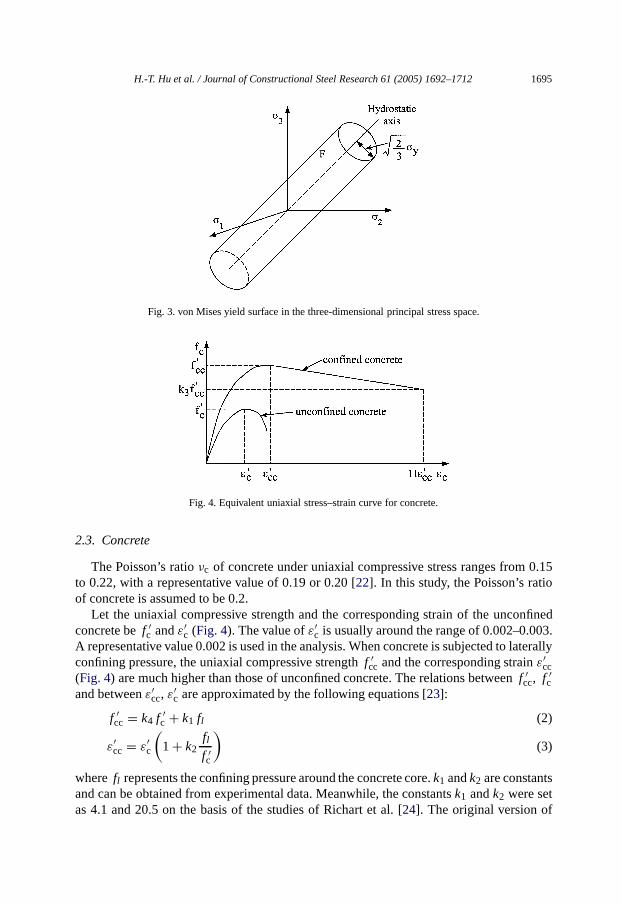
whereJ2 is the second stress invariant of the stress deviator tensor andσ1, σ2, andσ3 arethe principal stresses.Fig. 3 shows thevon Mises yield surface in the three-dimensionalprincipal stress space. The response of the steel tube is modeled by an elastic–perfectlyplastic theory with an associated flow rule. When the stress points fall inside the yieldsurface, the behavior of the steel tube is linearly elastic. If the stresses of the steel tube reachthe yield surface, the behavior of the steel tubebecomes perfectly plastic. Consequently,the steel tube is assumed to fail and cannot resist any further loading.
H.-T. Hu et al. / Journal of Constructional Steel Research 61 (2005) 1692–1712 1695
Fig. 3. von Mises yield surface in the three-dimensional principal stress space.
Fig. 4. Equivalent uniaxial stress–strain curve for concrete.
2.3. Concrete
The Poisson’s ratioνc of concrete under uniaxial compressive stress ranges from 0.15to 0.22, with a representative value of 0.19 or 0.20 [22]. In this study, the Poisson’s ratioof concrete is assumed to be 0.2.
Let the uniaxial compressive strength andthe corresponding strain of the unconfinedconcrete bef ′
c andε′c (Fig. 4). The value ofε′
c is usually around the range of 0.002–0.003.A representative value 0.002 is used in the analysis. When concrete is subjected to laterallyconfining pressure, the uniaxial compressive strengthf ′
cc and the corresponding strainε′cc
(Fig. 4) are much higher than those of unconfined concrete. The relations betweenf ′cc, f ′
cand betweenε′
cc, ε′c are approximated by the following equations [23]:
f ′cc = k4 f ′
c + k1 fl (2)
ε′cc = ε′
c
(1 + k2
fl
f ′c
)(3)
where fl represents the confining pressure around the concrete core.k1 andk2 are constantsand can be obtained from experimental data. Meanwhile, the constantsk1 andk2 were setas 4.1 and 20.5 on the basis of the studies of Richart et al. [24]. The original version of
1696 H.-T. Hu et al. / Journal of Constructional Steel Research 61 (2005) 1692–1712
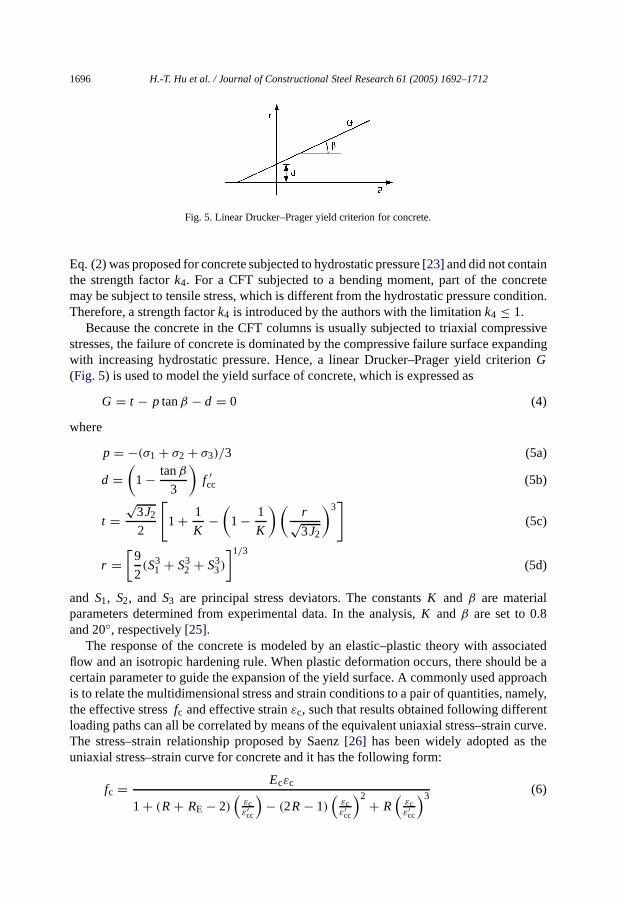
Fig. 5. Linear Drucker–Prageryield criterion for concrete.
Eq. (2) was proposed for concrete subjected to hydrostatic pressure [23] anddid not containthe strength factork4. For a CFT subjected to a bending moment, part of the concretemay be subject to tensile stress, which is different from the hydrostatic pressure condition.Therefore, a strength factork4 is introduced by the authors with the limitationk4 ≤ 1.
Because the concrete in the CFTcolumns is usually subjected to triaxial compressivestresses, the failure of concrete is dominatedby the compressive failure surface expandingwith increasing hydrostatic pressure. Hence, a linear Drucker–Prager yield criterionG(Fig. 5) is used to model the yield surface of concrete, which is expressed as
G = t − p tanβ − d = 0 (4)
where
p = −(σ1 + σ2 + σ3)/3 (5a)
d =(
1 − tanβ
3
)f ′cc (5b)
t =√
3J2
2
[1 + 1
K−
(1 − 1
K
) (r√3J2
)3]
(5c)
r =[
9
2(S3
1 + S32 + S3
3)
]1/3
(5d)
and S1, S2, and S3 are principal stress deviators. The constantsK and β are materialparameters determined from experimental data. In the analysis,K andβ are set to 0.8and 20◦, respectively [25].
The response of the concrete is modeled by an elastic–plastic theory with associatedflow and an isotropic hardening rule. When plastic deformation occurs, there should be acertain parameter to guide the expansion of the yield surface. A commonly used approachis to relate the multidimensional stress and strain conditions to a pair of quantities, namely,the effective stressfc and effective strainεc, such that results obtained following differentloading paths can all be correlated by means of the equivalent uniaxial stress–strain curve.The stress–strain relationship proposed by Saenz [26] has been widely adopted as theuniaxial stress–strain curve for concrete and it has the following form:
fc = Ecεc
1 + (R + RE − 2)(
εcε′
cc
)− (2R − 1)
(εcε′
cc
)2 + R(
εcε′
cc
)3(6)
H.-T. Hu et al. / Journal of Constructional Steel Research 61 (2005) 1692–1712 1697
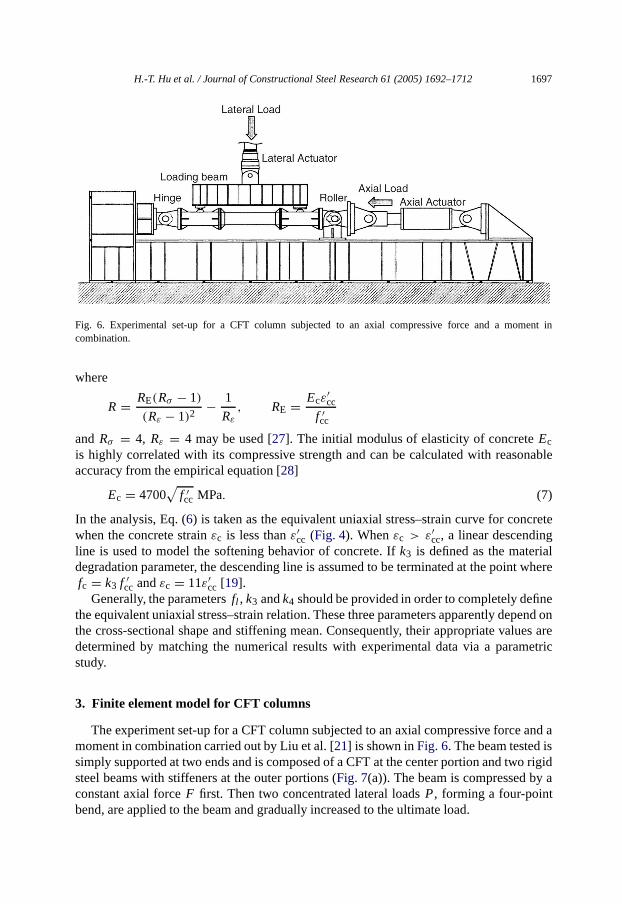
Fig. 6. Experimental set-up for a CFT column subjected to an axial compressive force and a moment incombination.
where
R = RE(Rσ − 1)
(Rε − 1)2− 1
Rε
, RE = Ecε′cc
f ′cc
and Rσ = 4, Rε = 4 may beused [27]. The initial modulus of elasticity of concreteEcis highly correlated with its compressive strength and can be calculated with reasonableaccuracy from the empirical equation [28]
Ec = 4700√
f ′cc MPa. (7)
In the analysis, Eq. (6) is taken as the equivalent uniaxial stress–strain curve for concretewhen the concrete strainεc is less thanε′
cc (Fig. 4). Whenεc > ε′cc, a linear descending
line is used to model the softening behavior of concrete. Ifk3 is defined as the materialdegradation parameter, the descending line is assumed to be terminated at the point wherefc = k3 f ′
cc andεc = 11ε′cc [19].
Generally, theparametersfl , k3 andk4 should be provided in order to completely definethe equivalent uniaxial stress–strain relation.These three parameters apparently depend onthe cross-sectional shape and stiffening mean. Consequently, their appropriate values aredetermined by matching the numerical results with experimental data via a parametricstudy.
3. Finite element model for CFT columns
The experiment set-up for a CFT column subjected to an axial compressive force and amoment in combination carried out by Liu et al. [21] is shown inFig. 6. Thebeam tested issimply supported at two ends and is composed of a CFT at the center portion and two rigidsteel beams with stiffeners at the outer portions (Fig. 7(a)). The beam is compressed by aconstant axial forceF first. Then two concentrated lateral loadsP, forming a four-pointbend,are applied to the beam and gradually increased to the ultimate load.

1698 H.-T. Hu et al. / Journal of Constructional Steel Research 61 (2005) 1692–1712
(a) Conceptual sketch for the specimen.
(b) Finite element modelling.
Fig. 7. Conceptual sketch and finite element modeling of a CFT column.
Due to symmetry,only a quarter of the CFT column is analyzed (Fig. 7(b)). Symmetricboundary conditions are imposed on the symmetric planes:u3 = 0 on the left surface ofthe element mesh andu1 = 0 on the front surface of the element mesh surface. To simulatethe roller support, the displacementsu2 for the nodes at the mid-depth of the right edge ofthe element mesh are all set to zero.
In the finite element mesh, both the concrete core and the steel tube are modeled by27-node solid elements (three degrees of freedom per node) with a reduced integrationrule. For the SS section, the steel reinforcing tie is modeled by 3-node truss elements. Therigid portion of the beam is also modeled by 27-node solid elements. However, its materialbehavior is assumed to be linear elastic with the elastic modulusEr equal to 1× 10⁷ GPaand Poisson’s ratioνr equal to 0.01. The interface between the concrete core and steel tubeis modeled by a pair of contact surfaces. Thenodes of the concrete core and the steel tubeare connected through contact surfaces that require matching meshes of the two bodies.The contact surfaces can model infinitesimal sliding and friction [20] between the concretecore and steel tube. The friction coefficient used in all the analyses is 0.25. Through thecontact surfaces, the concrete core and steeltube are allowed to either contact or separatebut not to penetrate each other.
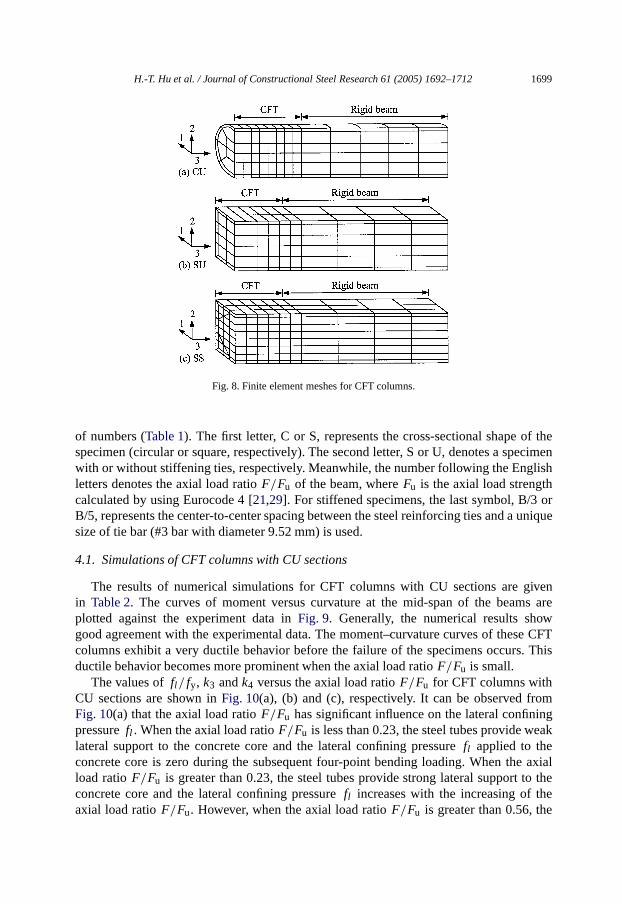
Convergent studies of the finite element meshes have been done by the author usingvarious element sizes for CFT columns with CU and SU sections [25]. It is shown thatthe numerical results are not sensitive to the element sizes and mesh refinements. As aresult, the meshes shown inFig. 8are used for CFT columns with CU, SU and SS sectionsthroughout the analyses.
4. Numerical analysis
In this section, the experimental data from Liu et al. [21] are used toverify and calibratethe proposed material model for CFT columns. For systemization, each specimen in theanalysis has an individual designation, involving two English letters followed by a series
H.-T. Hu et al. / Journal of Constructional Steel Research 61 (2005) 1692–1712 1699
Fig. 8. Finite element meshes for CFT columns.
of numbers (Table 1). The first letter, C or S, represents the cross-sectional shape of thespecimen (circular or square, respectively). The second letter, S or U, denotes a specimenwith or without stiffening ties, respectively. Meanwhile, the number following the Englishletters denotes the axial load ratioF/Fu of the beam, whereFu is the axial load strengthcalculated by using Eurocode 4 [21,29]. For stiffened specimens, the last symbol, B/3 orB/5, represents the center-to-center spacing between the steel reinforcing ties and a uniquesize of tiebar (#3 bar with diameter 9.52 mm) is used.
4.1. Simulations of CFT columns with CU sections
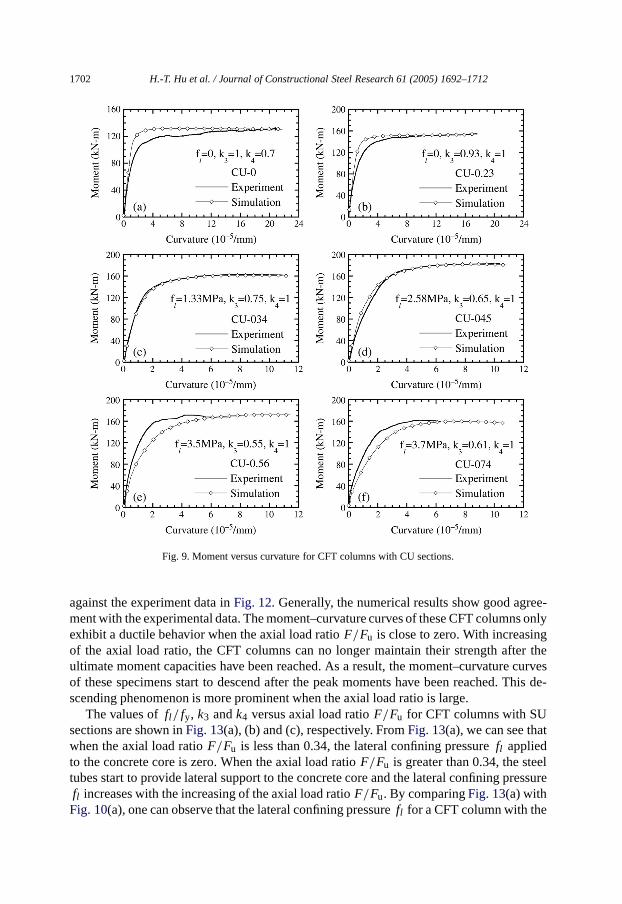
The results of numerical simulations for CFT columns with CU sections are givenin Table 2. The curves of moment versus curvature at the mid-span of the beams areplotted against the experiment data inFig. 9. Generally, the numerical results showgood agreement with the experimental data. The moment–curvature curves of these CFTcolumns exhibit a very ductile behavior before the failure of the specimens occurs. Thisductile behavior becomes more prominent when the axial load ratioF/Fu is small.
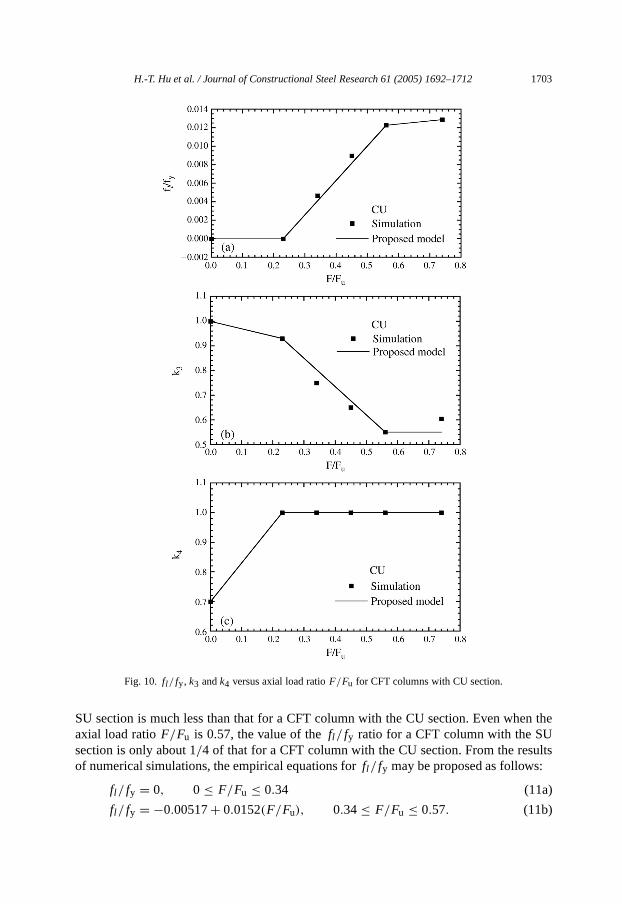
The values offl/ fy, k3 andk4 versus the axial load ratioF/Fu for CFT columns withCU sections are shown inFig. 10(a), (b) and (c), respectively. It can be observed fromFig. 10(a) that the axial load ratioF/Fu has significant influence on the lateral confiningpressurefl . When the axial load ratio F/Fu is less than 0.23, the steel tubes provide weaklateral support to the concrete core and the lateral confining pressurefl applied to theconcrete core is zero during the subsequent four-point bending loading. When the axialload ratioF/Fu is greater than 0.23, the steel tubes provide strong lateral support to theconcrete core and the lateral confining pressurefl increases with the increasing of theaxial load ratioF/Fu. However, when the axial load ratioF/Fu is greater than 0.56, the
1700 H.-T. Hu et al. / Journal of Constructional Steel Research 61 (2005) 1692–1712
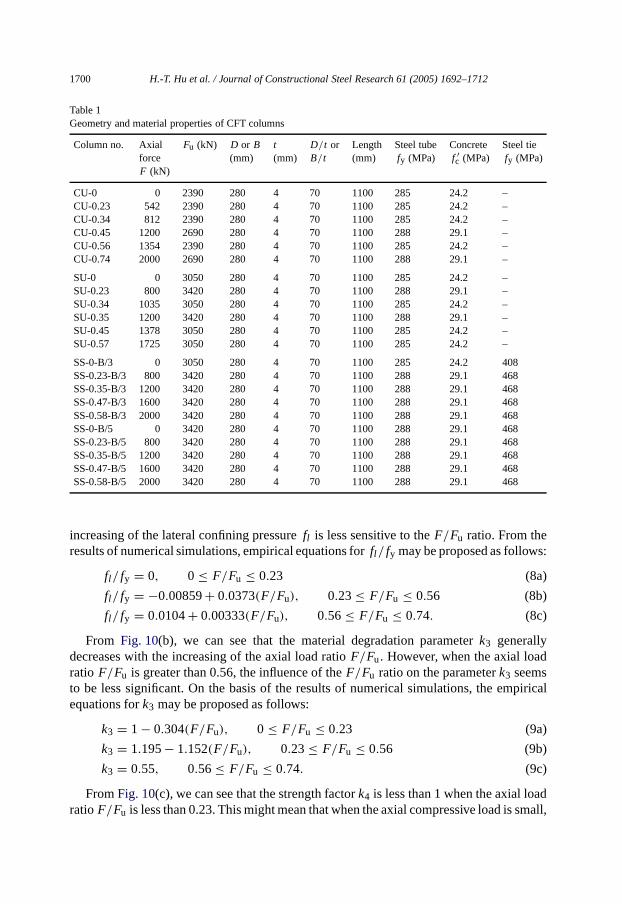
Table 1Geometryand material properties of CFT columns
Column no. Axial Fu (kN) D or B t D/t or Length Steel tube Concrete Steel tieforce (mm) (mm) B/t (mm) fy (MPa) f ′
c (MPa) fy (MPa)F (kN)
CU-0 0 2390 280 4 70 1100 285 24.2 –CU-0.23 542 2390 280 4 70 1100 285 24.2 –CU-0.34 812 2390 280 4 70 1100 285 24.2 –CU-0.45 1200 2690 280 4 70 1100 288 29.1 –CU-0.56 1354 2390 280 4 70 1100 285 24.2 –CU-0.74 2000 2690 280 4 70 1100 288 29.1 –
SU-0 0 3050 280 4 70 1100 285 24.2 –SU-0.23 800 3420 280 4 70 1100 288 29.1 –SU-0.34 1035 3050 280 4 70 1100 285 24.2 –SU-0.35 1200 3420 280 4 70 1100 288 29.1 –SU-0.45 1378 3050 280 4 70 1100 285 24.2 –SU-0.57 1725 3050 280 4 70 1100 285 24.2 –
SS-0-B/3 0 3050 280 4 70 1100 285 24.2 408SS-0.23-B/3 800 3420 280 4 70 1100 288 29.1 468SS-0.35-B/3 1200 3420 280 4 70 1100 288 29.1 468SS-0.47-B/3 1600 3420 280 4 70 1100 288 29.1 468SS-0.58-B/3 2000 3420 280 4 70 1100 288 29.1 468SS-0-B/5 0 3420 280 4 70 1100 288 29.1 468SS-0.23-B/5 800 3420 280 4 70 1100 288 29.1 468SS-0.35-B/5 1200 3420 280 4 70 1100 288 29.1 468SS-0.47-B/5 1600 3420 280 4 70 1100 288 29.1 468SS-0.58-B/5 2000 3420 280 4 70 1100 288 29.1 468
increasing of the lateral confining pressurefl is less sensitive to theF/Fu ratio. From theresults of numerical simulations, empirical equations forfl/ fy may be proposed as follows:
fl/ fy = 0, 0 ≤ F/Fu ≤ 0.23 (8a)
fl/ fy = −0.00859+ 0.0373(F/Fu), 0.23≤ F/Fu ≤ 0.56 (8b)
fl/ fy = 0.0104+ 0.00333(F/Fu), 0.56 ≤ F/Fu ≤ 0.74. (8c)
From Fig. 10(b), we can see that the material degradation parameterk3 generallydecreases with the increasing of the axial load ratioF/Fu. However, when the axial loadratio F/Fu is greater than 0.56,the influence of theF/Fu ratio on the parameterk3 seemsto be less significant. On the basis of the results of numerical simulations, the empiricalequations fork3 may be proposed as follows:
k3 = 1 − 0.304(F/Fu), 0 ≤ F/Fu ≤ 0.23 (9a)
k3 = 1.195− 1.152(F/Fu), 0.23≤ F/Fu ≤ 0.56 (9b)
k3 = 0.55, 0.56≤ F/Fu ≤ 0.74. (9c)
FromFig. 10(c), we can see that the strength factork4 is less than 1 when the axial loadratio F/Fu is less than 0.23. This might mean that when the axial compressive load is small,
H.-T. Hu et al. / Journal of Constructional Steel Research 61 (2005) 1692–1712 1701
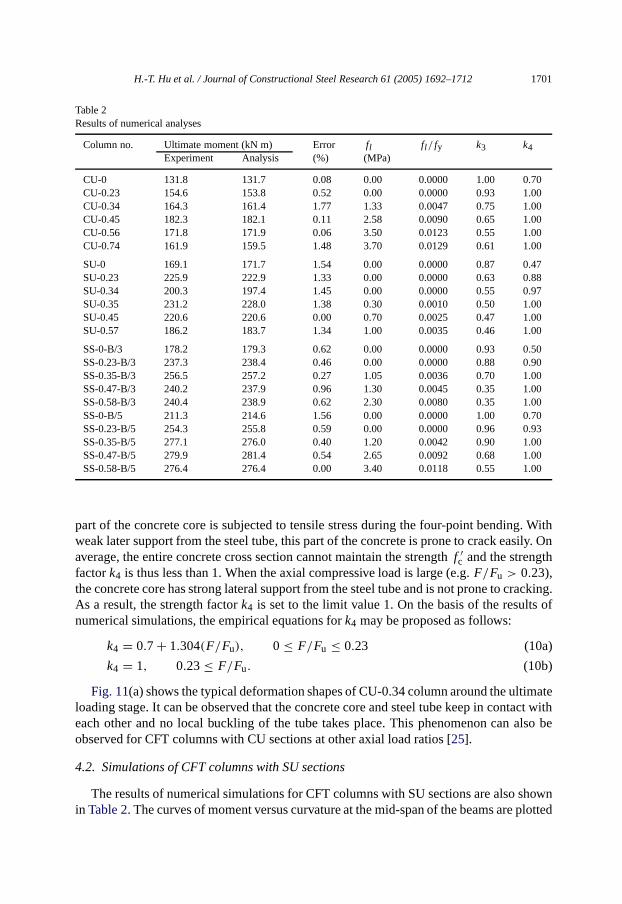
Table 2Results of numerical analyses
Column no. Ultimate moment (kN m) Error fl fl/ fy k3 k4Experiment Analysis (%) (MPa)
CU-0 131.8 131.7 0.08 0.00 0.0000 1.00 0.70CU-0.23 154.6 153.8 0.52 0.00 0.0000 0.93 1.00CU-0.34 164.3 161.4 1.77 1.33 0.0047 0.75 1.00CU-0.45 182.3 182.1 0.11 2.58 0.0090 0.65 1.00CU-0.56 171.8 171.9 0.06 3.50 0.0123 0.55 1.00CU-0.74 161.9 159.5 1.48 3.70 0.0129 0.61 1.00
SU-0 169.1 171.7 1.54 0.00 0.0000 0.87 0.47SU-0.23 225.9 222.9 1.33 0.00 0.0000 0.63 0.88SU-0.34 200.3 197.4 1.45 0.00 0.0000 0.55 0.97SU-0.35 231.2 228.0 1.38 0.30 0.0010 0.50 1.00SU-0.45 220.6 220.6 0.00 0.70 0.0025 0.47 1.00SU-0.57 186.2 183.7 1.34 1.00 0.0035 0.46 1.00
SS-0-B/3 178.2 179.3 0.62 0.00 0.0000 0.93 0.50SS-0.23-B/3 237.3 238.4 0.46 0.00 0.0000 0.88 0.90SS-0.35-B/3 256.5 257.2 0.27 1.05 0.0036 0.70 1.00SS-0.47-B/3 240.2 237.9 0.96 1.30 0.0045 0.35 1.00SS-0.58-B/3 240.4 238.9 0.62 2.30 0.0080 0.35 1.00SS-0-B/5 211.3 214.6 1.56 0.00 0.0000 1.00 0.70SS-0.23-B/5 254.3 255.8 0.59 0.00 0.0000 0.96 0.93SS-0.35-B/5 277.1 276.0 0.40 1.20 0.0042 0.90 1.00SS-0.47-B/5 279.9 281.4 0.54 2.65 0.0092 0.68 1.00SS-0.58-B/5 276.4 276.4 0.00 3.40 0.0118 0.55 1.00
part of the concrete core is subjected to tensile stress during the four-point bending. Withweak later support from the steel tube, this part of the concrete is prone to crack easily. Onaverage, the entire concrete cross section cannot maintain the strengthf ′
c and the strengthfactork4 is thus less than 1. When the axial compressive load is large (e.g.F/Fu > 0.23),the concrete core has strong lateral support from the steel tube and is not prone to cracking.As a result, the strength factork4 is set to the limit value 1. On the basis of the results ofnumerical simulations, the empirical equations fork4 may be proposed as follows:
k4 = 0.7 + 1.304(F/Fu), 0 ≤ F/Fu ≤ 0.23 (10a)
k4 = 1, 0.23 ≤ F/Fu. (10b)
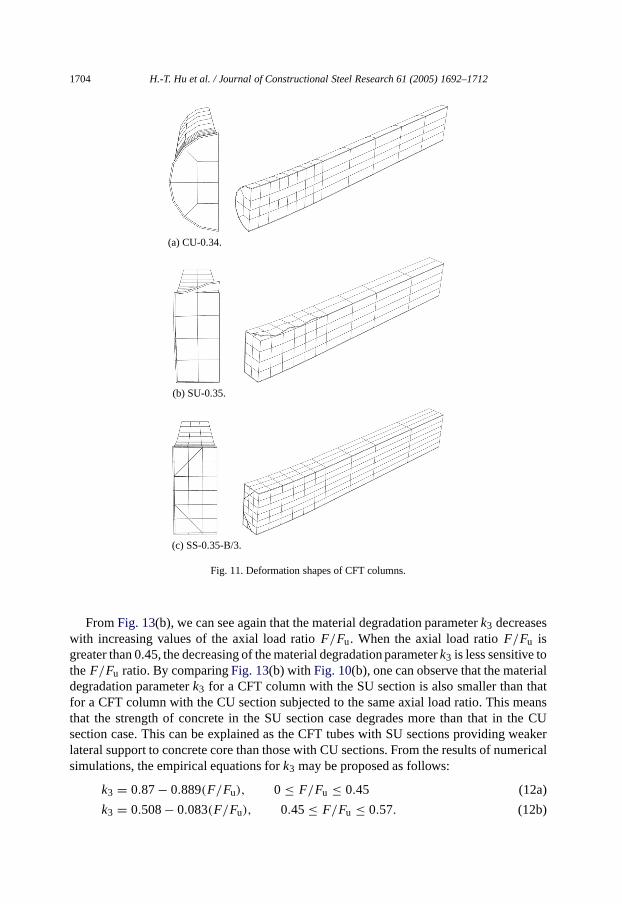
Fig. 11(a) shows the typical deformation shapes of CU-0.34 column around the ultimateloading stage. It can beobserved that the concrete core and steel tube keep in contact witheach other and no local buckling of the tubetakes place. This phenomenon can also beobserved for CFT columns with CU sections at other axial load ratios [25].
4.2. Simulations of CFT columns with SU sections
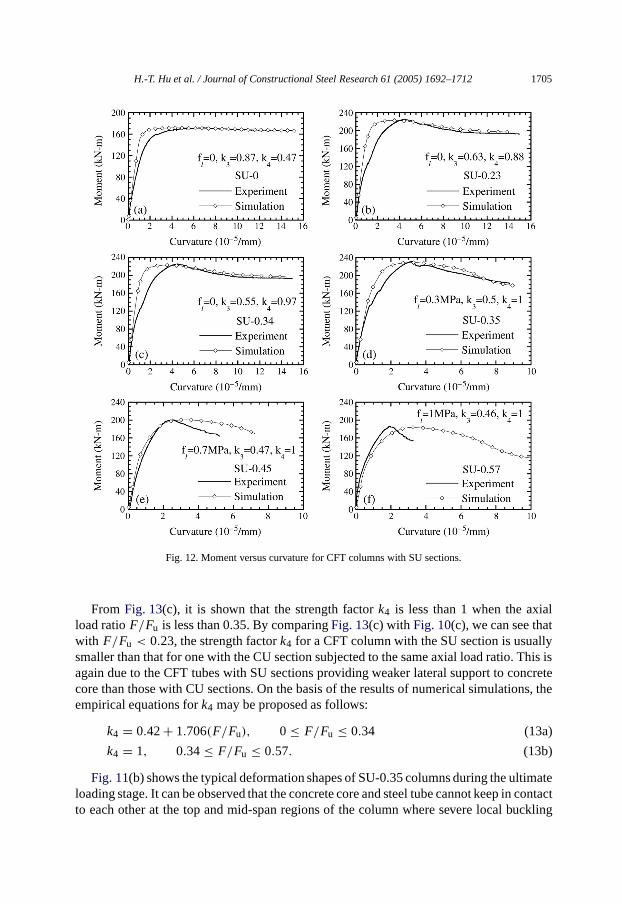
The results of numerical simulations for CFT columns with SU sections are also shownin Table 2. The curves of moment versus curvature at the mid-span of the beams are plotted
1702 H.-T. Hu et al. / Journal of Constructional Steel Research 61 (2005) 1692–1712
Fig. 9. Moment versus curvature for CFT columns with CU sections.
against the experiment data inFig. 12. Generally, the numerical results show good agree-ment with the experimental data. The moment–curvature curves of these CFT columns onlyexhibit a ductile behavior when the axial load ratioF/Fu is close to zero. With increasingof the axial load ratio, the CFT columns can no longer maintain their strength after theultimate moment capacities have been reached. As a result, the moment–curvature curvesof these specimens start to descend afterthe peak moments have been reached. This de-scending phenomenon is more prominent when the axial load ratio is large.
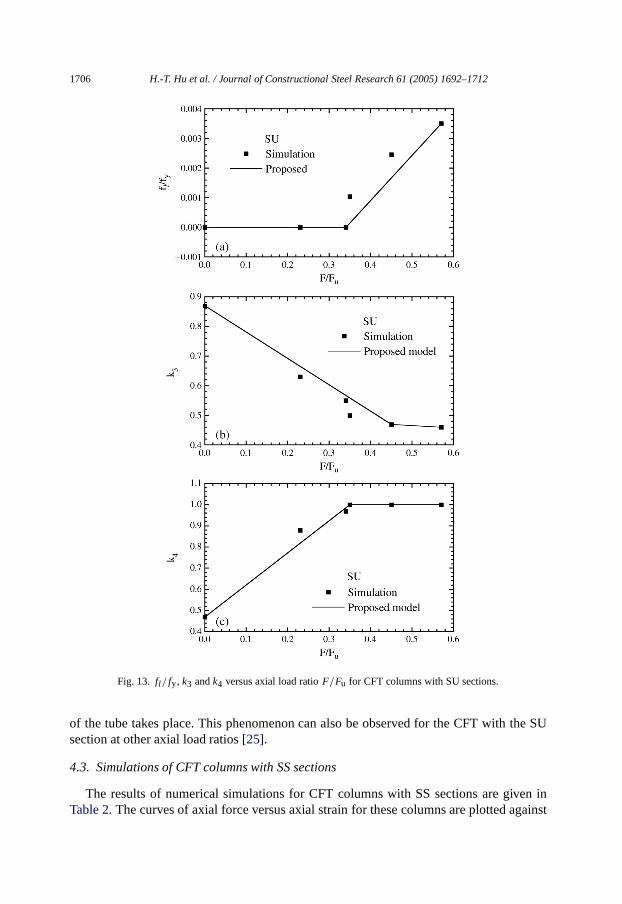
The values offl/ fy, k3 andk4 versus axial load ratio F/Fu for CFT columns with SUsections are shown inFig. 13(a), (b) and (c), respectively. FromFig. 13(a), we can see thatwhen the axial load ratioF/Fu is less than 0.34, the lateral confining pressurefl appliedto the concrete core is zero. When the axial load ratioF/Fu is greater than 0.34, the steeltubes start to provide lateral support to the concrete core and the lateral confining pressurefl increases with the increasing of the axial load ratioF/Fu. By comparingFig. 13(a) withFig. 10(a), one can observe that the lateral confining pressurefl for a CFT column with the
H.-T. Hu et al. / Journal of Constructional Steel Research 61 (2005) 1692–1712 1703
Fig. 10. fl/ fy, k3 andk4 versus axial load ratio F/Fu for CFT columns with CU section.
SU section is much less than that for a CFT column with the CU section. Even when theaxial load ratioF/Fu is 0.57, the value of thefl/ fy ratio for a CFT column with the SUsection is only about 1/4 of that for a CFT column with the CU section. From the resultsof numerical simulations, the empirical equations forfl/ fy may be proposed as follows:
fl/ fy = 0, 0 ≤ F/Fu ≤ 0.34 (11a)
fl/ fy = −0.00517+ 0.0152(F/Fu), 0.34 ≤ F/Fu ≤ 0.57. (11b)
1704 H.-T. Hu et al. / Journal of Constructional Steel Research 61 (2005) 1692–1712
(a) CU-0.34.
(b) SU-0.35.
(c) SS-0.35-B/3.
Fig. 11. Deformation shapes of CFT columns.
FromFig. 13(b), we can see again that the material degradation parameterk3 decreaseswith increasing values of the axial load ratioF/Fu. When the axial load ratio F/Fu isgreater than 0.45, the decreasing of thematerial degradation parameterk3 is less sensitive tothe F/Fu ratio. By comparingFig. 13(b) with Fig. 10(b), one can observe that the materialdegradation parameterk3 for a CFT column withthe SU section is also smaller than thatfor a CFT column with the CU section subjected to the same axial load ratio. This meansthat the strength of concrete in the SU section case degrades more than that in the CUsectioncase. This can be explained as the CFT tubes with SU sections providing weakerlateral support to concrete core than those with CU sections. From the results of numericalsimulations, the empirical equations fork3 may be proposed as follows:
k3 = 0.87− 0.889(F/Fu), 0 ≤ F/Fu ≤ 0.45 (12a)
k3 = 0.508− 0.083(F/Fu), 0.45≤ F/Fu ≤ 0.57. (12b)
H.-T. Hu et al. / Journal of Constructional Steel Research 61 (2005) 1692–1712 1705
Fig. 12. Moment versus curvature for CFT columns with SU sections.
From Fig. 13(c), it is shown that the strength factork4 is less than 1 when the axialload ratioF/Fu is less than 0.35. By comparingFig. 13(c) with Fig. 10(c), we can see thatwith F/Fu < 0.23, the strength factork4 for a CFT column with the SU section is usuallysmaller than that for one with the CU section subjected to the same axial load ratio. This isagain due to the CFT tubes with SU sections providing weaker lateral support to concretecore than those with CU sections. On the basis of the results of numerical simulations, theempirical equations fork4 may be proposed as follows:
k4 = 0.42+ 1.706(F/Fu), 0 ≤ F/Fu ≤ 0.34 (13a)
k4 = 1, 0.34 ≤ F/Fu ≤ 0.57. (13b)
Fig. 11(b) shows the typical deformation shapes of SU-0.35 columns during the ultimateloading stage. It can be observed that the concrete core and steel tube cannot keep in contactto each other at the top and mid-span regionsof the column where severe local buckling
1706 H.-T. Hu et al. / Journal of Constructional Steel Research 61 (2005) 1692–1712
Fig. 13. fl/ fy, k3 andk4 versus axial load ratio F/Fu for CFT columns with SU sections.
of the tube takes place. This phenomenon can also be observed for the CFT with the SUsection at other axial load ratios [25].
4.3. Simulations of CFT columns with SS sections
The results of numerical simulations for CFT columns with SS sections are given inTable 2. The curves of axial force versus axial strain for these columns are plotted against

H.-T. Hu et al. / Journal of Constructional Steel Research 61 (2005) 1692–1712 1707
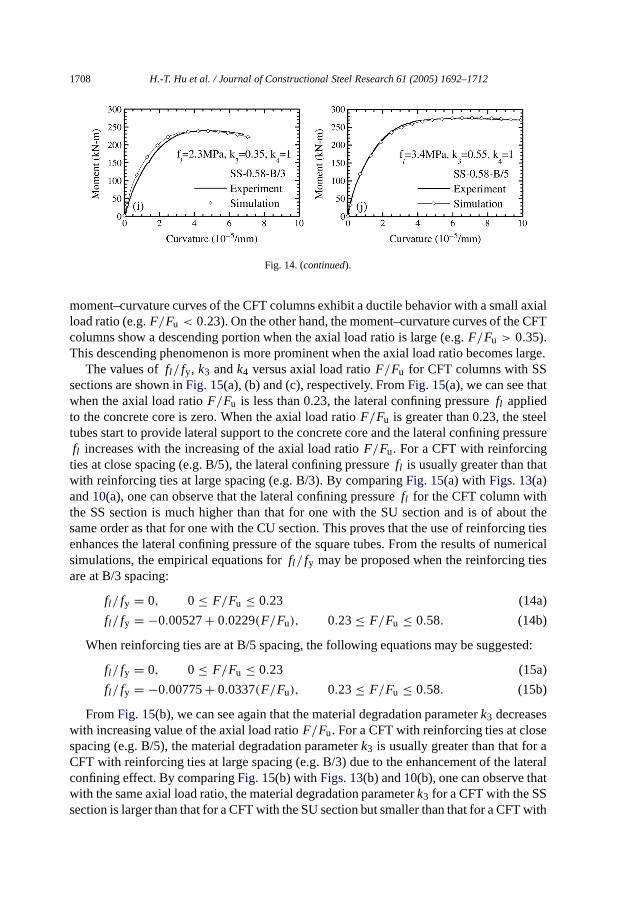
Fig. 14. Moment versus curvature for CFT columns with SS sections.
the experiment data inFig. 14. Generally, the numerical results again show good agreementwith the experimental data. When the spacing of reinforcing ties is small (e.g. B/5), themoment–curvature curves of these CFT columns exhibit a ductile behavior before thefailure of the specimens occurs. This ductile behavior becomes more prominent when theaxial load ratioF/Fu is small. When the spacing of reinforcing ties is large (e.g. B/3), the
1708 H.-T. Hu et al. / Journal of Constructional Steel Research 61 (2005) 1692–1712
Fig. 14. (continued).
moment–curvature curves of the CFT columns exhibit a ductile behavior with a small axialload ratio (e.g.F/Fu < 0.23). On the other hand, the moment–curvature curves of the CFTcolumns show a descending portion when the axial load ratio is large (e.g.F/Fu > 0.35).This descending phenomenon is more prominent when the axial load ratio becomes large.
The values offl/ fy, k3 andk4 versus axial load ratio F/Fu for CFT columns with SSsections are shown inFig. 15(a), (b) and (c), respectively. FromFig. 15(a), we can see thatwhen the axial load ratioF/Fu is less than 0.23, the lateral confining pressurefl appliedto the concrete core is zero. When the axial load ratioF/Fu is greater than 0.23, the steeltubes start to provide lateral support to the concrete core and the lateral confining pressurefl increases with the increasing of the axial load ratioF/Fu. For a CFTwith reinforcingties at close spacing (e.g. B/5),the lateral confining pressurefl is usually greater than thatwith reinforcing ties at large spacing (e.g. B/3). By comparingFig. 15(a) with Figs. 13(a)and10(a), one can observe that the lateral confining pressurefl for the CFT column withthe SS section is much higher than that for one with the SU section and is of about thesame order as that for one with the CU section. This proves that the use of reinforcing tiesenhances the lateral confining pressure of the square tubes. From the results of numericalsimulations, the empirical equations forfl/ fy may be proposed when the reinforcing tiesare at B/3 spacing:
fl/ fy = 0, 0 ≤ F/Fu ≤ 0.23 (14a)
fl/ fy = −0.00527+ 0.0229(F/Fu), 0.23≤ F/Fu ≤ 0.58. (14b)
When reinforcing ties are at B/5 spacing, the following equations may be suggested:
fl/ fy = 0, 0 ≤ F/Fu ≤ 0.23 (15a)
fl/ fy = −0.00775+ 0.0337(F/Fu), 0.23≤ F/Fu ≤ 0.58. (15b)
FromFig. 15(b), we can see again that the material degradation parameterk3 decreaseswith increasing value of the axial load ratioF/Fu. For a CFT with reinforcing ties at closespacing (e.g. B/5), the material degradation parameterk3 is usually greater than that for aCFT with reinforcing ties at large spacing (e.g. B/3) due to the enhancement of the lateralconfining effect. By comparingFig. 15(b) with Figs. 13(b) and10(b), one can observe thatwith the same axial load ratio, thematerial degradation parameterk3 for a CFT with the SSsection is larger than that for a CFT with the SU section but smaller than that for a CFT with

H.-T. Hu et al. / Journal of Constructional Steel Research 61 (2005) 1692–1712 1709
Fig. 15. fl/ fy, k3 andk4 versus axial load ratio F/Fu for CFT columns with SS sections.
the CU section. However, when the spacing of the reinforcing ties is small (e.g. smallerthan B/5), the CFT with the SS section may possibly keep up the samek3 value as a CFTwith the CU section. From the results of numerical simulations, the following empiricalequations fork3 may be proposed when the reinforcing ties are at B/3 spacing:
k3 = 0.93− 0.217(F/Fu), 0 ≤ F/Fu ≤ 0.23 (16a)
k3 = 1.228− 1.514(F/Fu), 0.23 ≤ F/Fu ≤ 0.58. (16b)
1710 H.-T. Hu et al. / Journal of Constructional Steel Research 61 (2005) 1692–1712
When the reinforcing ties are at B/5 spacing, the following equations may be suggested:
k3 = 1 − 0.174(F/Fu), 0 ≤ F/Fu ≤ 0.23 (17a)
k3 = 1.229− 1.171(F/Fu), 0.23≤ F/Fu ≤ 0.58. (17b)
FromFig. 15(c), we can see that the strength factork4 is less than 1 when the axial loadratio F/Fu is less than 0.35. For the CFT with reinforcing ties at close spacing (e.g. B/5),the strength factork4 is usually greater than that for a CFT with reinforcing ties at largespacing (e.g. B/3). By comparingFig. 15(c) with Figs. 13(c) and10(c), one can see thatwith the same axial load ratio, the strength factork4 for a CFT with the SS section is largerthan that for a CFT with the SU section but smaller than that for a CFT with the CU section.However, when the spacing of the reinforcing ties is small (e.g. smaller than B/5), the CFTwith the SS section might possibly maintain the samek4 value as that with the CU section.On the basis of the results of numerical simulations, the following empirical equations fork4 may be proposed the when reinforcing ties are at B/3 spacing:
k4 = 0.5 + 1.429(F/Fu), 0 ≤ F/Fu ≤ 0.35 (18a)
k4 = 1, 0.35≤ F/Fu ≤ 0.58. (18b)
When the reinforcing ties are at B/5 spacing, the following equations may be suggested:
k4 = 0.7 + 0.857(F/Fu), 0 ≤ F/Fu ≤ 0.35 (19a)
k4 = 1, 0.35≤ F/Fu ≤ 0.58. (19b)
Fig. 11(c) shows the typical deformation shapes of the SS-0.35-B/3 column aroundthe ultimate loading stage. It can be observed that the concrete core and steel tube keepin contact with each other like in the case of the CFT with the CU section. Due to thereinforcing ties, no local buckling of thetube takes place. This phenomenon can also beobserved for the CFT with the SS section at other axial load ratios and tie spacings [25].
5. Conclusions
In this paper, nonlinear finite element analyses of CFT columns with CU, SU and SSsections are analyzed. On the basis of the numerical results, the following conclusions maybe drawn:
(1) The lateral confining pressurefl generally increaseswith the increasing of the axialload ratio F/Fu. When this axial loadratio is low, the steel tubes provide weaklateral support to the concrete core and the lateral confining pressurefl applied to theconcrete core may be zero during the subsequent four-point bending loading. Whenthe ratio is high, the steel tubes provide strong lateral support to the concrete core.
(2) The lateral confining pressurefl for a CFT with the SS section is much higher thanthat for a CFT with the SU section and is of about the same order as that for a CFTwith the CU section. The use of reinforcingties enhances the lateral confining pressureof the tubes. For a CFT with the SS section, the lateral confining pressurefl generallyincreases with the decreasing of the tie spacing.
(3) For a CFT with the SU section, the concrete core and steel tube cannot keep in contactwith each other during the ultimate loading stage due to the weak confining effect;
H.-T. Hu et al. / Journal of Constructional Steel Research 61 (2005) 1692–1712 1711
severe local buckling of the tube takes place at the top and mid-span regions of thecolumn. For CFT columns with CU and SS sections, local buckling is not likely tooccur due to the strong confining effect.
(4) The material degradation parameterk3 generally decreases with the increasing of theaxial load ratioF/Fu. The materialdegradation parameterk3 for a CFT with the SSsection is larger than that for a CFT with the SU section but smaller than that for aCFT with the CU section. However, when the spacing of the reinforcing ties is small,the CFT with the SS section may possibly maintain the samek3 value as aCFT withthe CU section.
(5) When the axial load ratioF/Fu is low, the concrete cross section cannot maintainthe strengthf ′
c on average and the strength factork4 is smaller than 1. When the axialcompressive load is large, the strength factork4 is equal to 1 due to the strong confiningeffect. The strength factork4 for a CFT with the SS section is larger than that for aCFT with the SU section but smaller than that for a CFT with the CU section. Whenthe spacing of the reinforcing ties is small, the CFT with the SS section might possiblymaintain the samek4 value as the CFT with the CU section.
Acknowledgment
This research work was financially supported by the National Science Council, Republicof China, under Grant NSC 90-2625-Z-006-007.
References
[1] Furlong RW. Strength of steel-encased concrete beam–columns. Journal of the Structural Division, ASCE1967;93(ST5):113–24.
[2] Knowles RB, Park R. Strength of concrete filled steel tubular columns. Journal of the Structural Division,ASCE 1969;95(ST12):2565–87.
[3] Ge HB, Usami T. Strength of concrete-filled thin-walled steel box columns: experiment. Journal ofStructural Engineering, ASCE 1992;118(1):3036–54.
[4] Ge HB, Usami T. Strength analysis of concrete-filled thin-walled steel box columns. Journal ofConstructional Steel Research 1994;30(3):259–81.
[5] Boyd FP, Cofer WF, McLean D. Seismic performance of steel-encased concrete column under flexuralloading. ACI Structural Journal 1995;92(3):355–65.
[6] Bradford MA. Design strength of slender concrete-filled rectangular steel tubes. ACI Structural Journal1996;93(2):229–35.
[7] Shams M, Saadeghvaziri MA. State of the art of concrete-filled steel tubular columns. ACI Structural Journal1997;94(5):558–71.
[8] Hajjar JF, Molodan A, Schiller PH. A distributed plasticity model for cyclic analysis of concrete-filled steeltube beam–columns and composite frames. Engineering Structures 1998;20(4–6):398–412.
[9] Schneider SP. Axial loaded concrete-filled steel tubes. Journal of Structural Engineering, ASCE 1998;124(10):1125–38.
[10] Kitada T. Ultimate strength and ductility of state-of-the-art concrete-filled steel bridge piers in Japan.Engineering Structures 1998;20(4–6):347–54.
[11] Roeder CW, Cameron B, Brown CB. Composite action in concrete filled tubes. Journal of StructuralEngineering, ASCE 1999;125(5):477–84.
[12] Zhang W, Shahrooz BM. Comparison between ACI andAISC for concrete-filled tubular columns. Journalof Structural Engineering, ASCE 1999;125(11):1213–23.
1712 H.-T. Hu et al. / Journal of Constructional Steel Research 61 (2005) 1692–1712
[13] Uy B. Strength of concrete filled steel box columns incorporating local buckling. Journal of StructuralEngineering, ASCE 2000;126(3):341–52.
[14] O’Shea MD, Bridge RQ. Design of circular thin-walled concrete filled steel tubes. Journal of StructuralEngineering, ASCE 2000;126(11):1295–303.
[15] Elchalakani M, Zhao XL, Grzebieta RH. Concrete-filled circular steel tube subjected to pure bending.Journal of Constructional Steel Research 2001;57(11):1141–68.
[16] Bradford MA, Loh HY, Uy B. Slenderness limits for filled circular steel tubes. Journal of ConstructionalSteel Research 2002;58(2):243–52.
[17] Elremaily A, Azizinamini A. Behavior and strength of circular concrete-filled tube columns. Journal ofConstructional Steel Research 2002;58(12):1567–91.
[18] Huang CS, Yeh Y-K, Liu G-Y, Hu H-T, Tsai KC, Weng YT, Wang SH, Wu M-H. Axial load behavior ofstiffened concrete-filled steel columns. Journal of Structural Engineering, ASCE 2002;128(9):1222–30.
[19] Hu H-T, Huang CS, Wu M-H, Wu Y-M. Nonlinearanalysis of axially loaded CFT columns withconfinement effect. Journal of Structural Engineering, ASCE 2003;129(10):1322–9.
[20] Hibbitt, Karlsson & Sorensen, Inc. ABAQUS/standard user manuals, version 6.2. Providence, RI; 2002.[21] Liu G-Y, Yeh Y-K, Tsai KC, Su S-C, Sun W-L. A Studyon the behaviors of concrete-filled steel tubular
beam–columns subjected to axial load and bending moment, technical report NCREE-03-009, Taipei(Taiwan, ROC); National Center for Researchon Earthquake Engineering: 2003 [in Chinese].
[22] ASCE Task Committee on Concrete and Masonry Structure. State of the art report on finite element analysisof reinforced concrete. New York: ASCE; 1982.
[23] Mander JB, Priestley MJN, Park R. Theoretical stress–strain model for confined concrete. Journal ofStructural Engineering, ASCE 1988;114(8):1804–23.
[24] Richart FE, Brandtzaeg A, Brown RL. A study of the failure of concrete under combined compressivestresses. Bulletin 185. Champaign (IL): University ofIllinois Engineering Experimental Station; 1928.
[25] Chen Z-L. Numerical analysis of concrete filled tubes subjected to combined axial force and moment, M.S.thesis, Tainan (Taiwan, ROC); Department of Civil Engineering, National Cheng Kung University: 2001.
[26] Saenz LP. Discussion of equation for the stress–strain curve of concrete byDesayi P., Krishnan S. ACIJournal 1964;61:1229–35.
[27] Hu H-T, Schnobrich WC. Constitutive modelling of concrete by using nonassociated plasticity. Journal ofMaterials in Civil Engineering, ASCE 1989;1(4):199–216.
[28] ACI Committee 318. Building code requirements forstructural concrete and commentary (ACI 318-99).Detroit (MI): American Concrete Institute; 1999.
[29] British Standards Institute. Design of Composite Steel and Concrete Structure, Eurocode 4. London; 1994.