findlay park funds p...findlay park funds p.l.c. (the “company”) was incorporated in ireland on...
TRANSCRIPT

Findlay Park Funds p.l.c.
(An investment company with variable capital incorporated in Ireland with registered number 276115 established as an umbrella fund)
Semi-Annual Report and Unaudited Condensed Financial Statements
For the half year ended 30th June, 2019
TABLE OF CONTENTS
INTRODUCTION 1
MANAGEMENT AND ADMINISTRATION 2
CONDENSED STATEMENT OF FINANCIAL POSITION 3
CONDENSED INCOME STATEMENT 4
CONDENSED STATEMENT OF CHANGES IN NET ASSETS ATTRIBUTABLE TO HOLDERS OF REDEEMABLE PARTICIPATING SHARES 5
STATEMENT OF INVESTMENTS 6
FINDLAY PARK AMERICAN FUND 6
NOTES TO THE CONDENSED FINANCIAL STATEMENTS 9
STATEMENT OF CHANGES IN THE PORTFOLIO 16
FINDLAY PARK AMERICAN FUND 16
APPENDIX 1 – TOTAL EXPENSE RATIOS 18
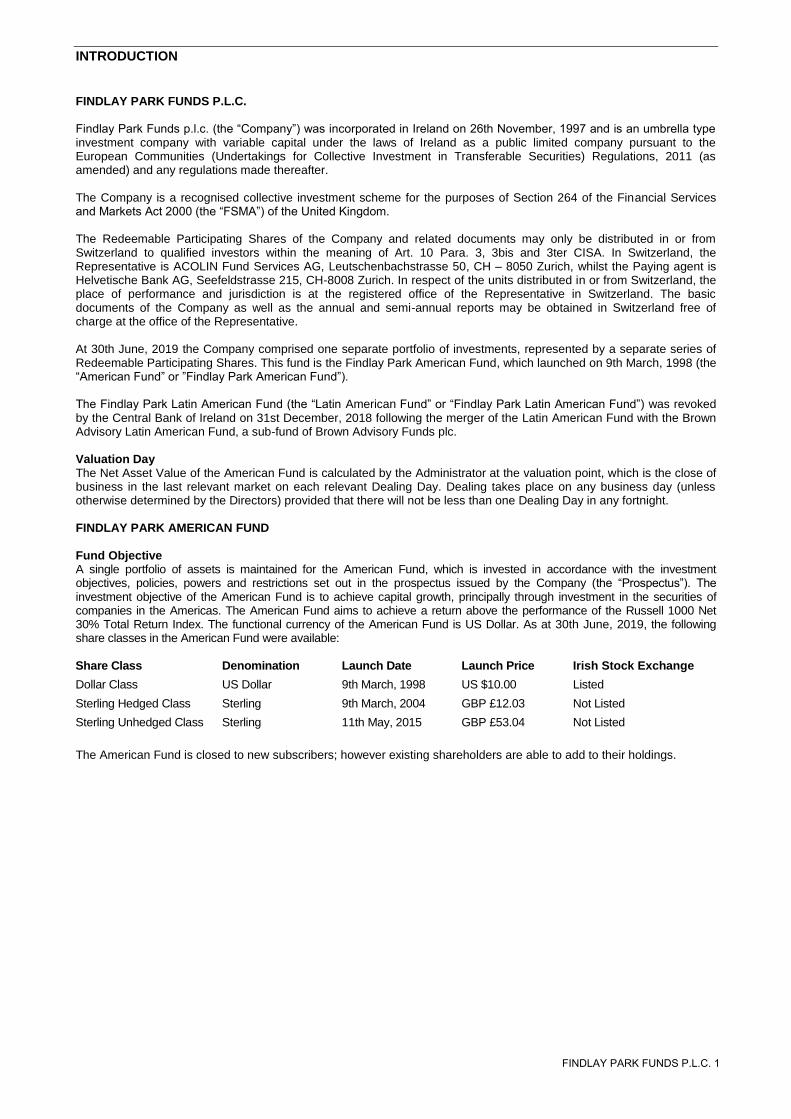
INTRODUCTION
FINDLAY PARK FUNDS P.L.C.
Findlay Park Funds p.l.c. (the “Company”) was incorporated in Ireland on 26th November, 1997 and is an umbrella type investment company with variable capital under the laws of Ireland as a public limited company pursuant to the European Communities (Undertakings for Collective Investment in Transferable Securities) Regulations, 2011 (as amended) and any regulations made thereafter.
The Company is a recognised collective investment scheme for the purposes of Section 264 of the Financial Services and Markets Act 2000 (the “FSMA”) of the United Kingdom.
The Redeemable Participating Shares of the Company and related documents may only be distributed in or from Switzerland to qualified investors within the meaning of Art. 10 Para. 3, 3bis and 3ter CISA. In Switzerland, the Representative is ACOLIN Fund Services AG, Leutschenbachstrasse 50, CH – 8050 Zurich, whilst the Paying agent is Helvetische Bank AG, Seefeldstrasse 215, CH-8008 Zurich. In respect of the units distributed in or from Switzerland, theplace of performance and jurisdiction is at the registered office of the Representative in Switzerland. The basic documents of the Company as well as the annual and semi-annual reports may be obtained in Switzerland free of charge at the office of the Representative.
At 30th June, 2019 the Company comprised one separate portfolio of investments, represented by a separate series of Redeemable Participating Shares. This fund is the Findlay Park American Fund, which launched on 9th March, 1998 (the “American Fund” or ”Findlay Park American Fund”).
The Findlay Park Latin American Fund (the “Latin American Fund” or “Findlay Park Latin American Fund”) was revoked by the Central Bank of Ireland on 31st December, 2018 following the merger of the Latin American Fund with the Brown Advisory Latin American Fund, a sub-fund of Brown Advisory Funds plc.
Valuation Day The Net Asset Value of the American Fund is calculated by the Administrator at the valuation point, which is the close of business in the last relevant market on each relevant Dealing Day. Dealing takes place on any business day (unless otherwise determined by the Directors) provided that there will not be less than one Dealing Day in any fortnight.
FINDLAY PARK AMERICAN FUND
Fund Objective A single portfolio of assets is maintained for the American Fund, which is invested in accordance with the investment objectives, policies, powers and restrictions set out in the prospectus issued by the Company (the “Prospectus”). The investment objective of the American Fund is to achieve capital growth, principally through investment in the securities of companies in the Americas. The American Fund aims to achieve a return above the performance of the Russell 1000 Net 30% Total Return Index. The functional currency of the American Fund is US Dollar. As at 30th June, 2019, the following share classes in the American Fund were available:
Share Class Denomination Launch Date Launch Price Irish Stock Exchange
Dollar Class US Dollar 9th March, 1998 US $10.00 Listed
Sterling Hedged Class Sterling 9th March, 2004 GBP £12.03 Not Listed
Sterling Unhedged Class Sterling 11th May, 2015 GBP £53.04 Not Listed
The American Fund is closed to new subscribers; however existing shareholders are able to add to their holdings.
FINDLAY PARK FUNDS P.L.C. 1
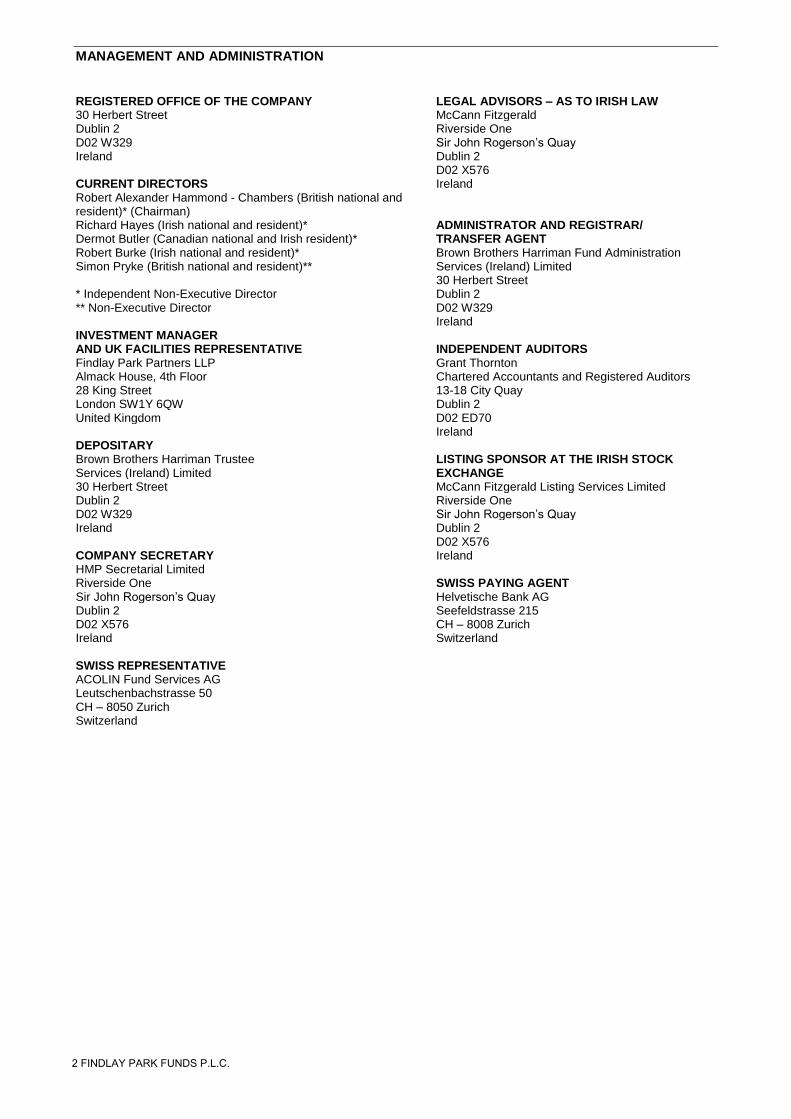
MANAGEMENT AND ADMINISTRATION
REGISTERED OFFICE OF THE COMPANY LEGAL ADVISORS – AS TO IRISH LAW 30 Herbert Street McCann Fitzgerald Dublin 2 Riverside One D02 W329 Sir John Rogerson’s Quay Ireland Dublin 2
D02 X576 CURRENT DIRECTORS Ireland Robert Alexander Hammond - Chambers (British national and resident)* (Chairman) Richard Hayes (Irish national and resident)* ADMINISTRATOR AND REGISTRAR/ Dermot Butler (Canadian national and Irish resident)* TRANSFER AGENT Robert Burke (Irish national and resident)* Brown Brothers Harriman Fund Administration Simon Pryke (British national and resident)** Services (Ireland) Limited
30 Herbert Street * Independent Non-Executive Director Dublin 2 ** Non-Executive Director D02 W329
Ireland INVESTMENT MANAGER AND UK FACILITIES REPRESENTATIVE INDEPENDENT AUDITORS Findlay Park Partners LLP Grant Thornton Almack House, 4th Floor Chartered Accountants and Registered Auditors 28 King Street 13-18 City QuayLondon SW1Y 6QW Dublin 2United Kingdom D02 ED70
IrelandDEPOSITARY Brown Brothers Harriman Trustee LISTING SPONSOR AT THE IRISH STOCK Services (Ireland) Limited EXCHANGE 30 Herbert Street McCann Fitzgerald Listing Services Limited Dublin 2 Riverside One D02 W329 Sir John Rogerson’s Quay Ireland Dublin 2
D02 X576 COMPANY SECRETARY Ireland HMP Secretarial Limited Riverside One SWISS PAYING AGENT Sir John Rogerson’s Quay Helvetische Bank AG Dublin 2 Seefeldstrasse 215 D02 X576 CH – 8008 Zurich Ireland Switzerland
SWISS REPRESENTATIVE ACOLIN Fund Services AG Leutschenbachstrasse 50 CH – 8050 Zurich Switzerland
2 FINDLAY PARK FUNDS P.L.C.

CONDENSED STATEMENT OF FINANCIAL POSITION
The accompanying notes form an integral part of the financial statements.
Findlay Park American Fund
US$ As at
30th June, 2019
Findlay Park American Fund
US$ As at
31st December, 2018
Current Assets
Financial Assets at Fair Value through Profit or Loss 13,441,163,887 11,860,491,785
Cash and Cash Equivalents 423,221,764 268,562,674
Debtors 70,726,504 17,248,517
Fee Reimbursement Receivable 410,247 231,145
13,935,522,402 12,146,534,121
Current Liabilities
Creditors - Amounts falling due within one year (52,094,399) (19,449,426)
(52,094,399) (19,449,426)
Net Assets Attributable to Holders of Redeemable Participating Shares 13,883,428,003 12,127,084,695
FINDLAY PARK FUNDS P.L.C. 3
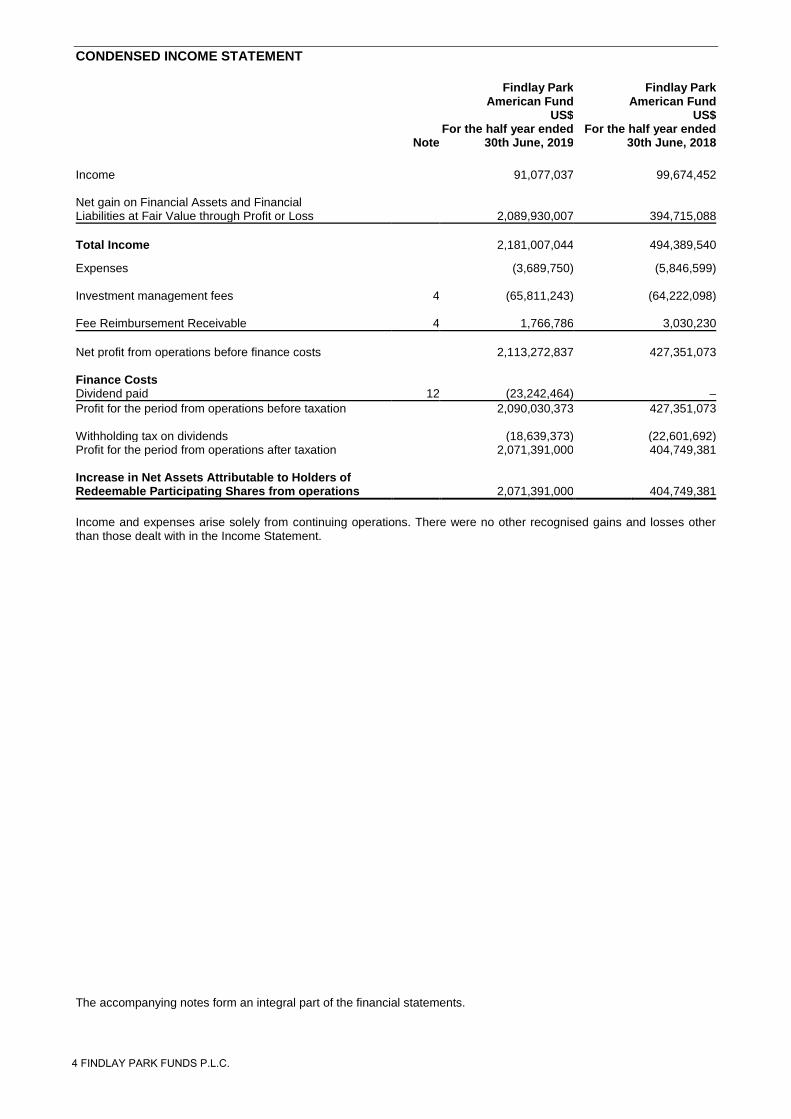
CONDENSED INCOME STATEMENT
The accompanying notes form an integral part of the financial statements.
Note
Findlay Park American Fund
US$ For the half year ended
30th June, 2019
Findlay Park American Fund
US$ For the half year ended
30th June, 2018
Income 91,077,037 99,674,452
Net gain on Financial Assets and Financial Liabilities at Fair Value through Profit or Loss 2,089,930,007 394,715,088
Total Income 2,181,007,044 494,389,540
Expenses (3,689,750) (5,846,599)
Investment management fees 4 (65,811,243) (64,222,098)
Fee Reimbursement Receivable 4 1,766,786 3,030,230
Net profit from operations before finance costs 2,113,272,837 427,351,073
Finance Costs Dividend paid 12 (23,242,464) –
Profit for the period from operations before taxation 2,090,030,373 427,351,073
Withholding tax on dividends (18,639,373) (22,601,692) Profit for the period from operations after taxation 2,071,391,000 404,749,381
Increase in Net Assets Attributable to Holders of Redeemable Participating Shares from operations 2,071,391,000 404,749,381
Income and expenses arise solely from continuing operations. There were no other recognised gains and losses other than those dealt with in the Income Statement.
4 FINDLAY PARK FUNDS P.L.C.

CONDENSED STATEMENT OF CHANGES IN NET ASSETS ATTRIBUTABLE TO HOLDERS OF REDEEMABLE PARTICIPATING SHARES
The accompanying notes form an integral part of the financial statements.
Findlay Park American Fund
US$ For the half year ended
30th June, 2019
Findlay Park American Fund
US$ For the half year ended
30th June, 2018
Net Assets Attributable to Holders of Redeemable Participating Shares at the beginning of the period 12,127,084,695 12,822,046,324
Increase in Net Assets Attributable to Holders of Redeemable Participating Shares from operations 2,071,391,000 404,749,381
Capital Transactions Proceeds from Redeemable Participating Shares issued 1,109,993,334 948,367,930
Cost of Redeemable Participating Shares redeemed (1,425,041,026) (1,345,174,322)
Net proceeds from capital transactions (315,047,692) (396,806,392)
Net Assets Attributable to Holders of Redeemable Participating Shares at the end of the period 13,883,428,003 12,829,989,313
FINDLAY PARK FUNDS P.L.C. 5

t
STATEMENT OF INVESTMENTS FINDLAY PARK AMERICAN FUND As at 30th June, 2019
Industry Holding Security Description Fair Value US$
% of Total Net Assets
EQUITIES
Business Services 15.14% (31st December, 2018: 12.52%) 4,250,000 Fidelity National Information Services Inc 521,390,000 3.76% 4,520,000 Fiserv Inc 412,043,200 2.97% 2,138,738 Accenture PLC 395,174,621 2.85% 2,035,287 Marsh & McLennan Cos Inc 203,019,878 1.46% 1,875,000 NASDAQ Inc 180,318,750 1.30% 1,700,200 Intercontinental Exchange Inc 146,115,188 1.05%
539,244 Aon PLC 104,063,307 0.75% 1,305,013 SS&C Technologies Holdings Inc 75,181,799 0.54%
875,000 TransUnion 64,321,250 0.46%
2,101,627,993 15.14%
Consumer Discretionary 11.01% (31st December, 2018: 13.19%) 11,200,457 Comcast Corp 473,555,322 3.41% 5,462,000 Live Nation Entertainment Inc 361,857,500 2.61%
661,188 Sherwin-Williams Co 303,015,849 2.18% 2,825,000 Hilton Worldwide Holdings Inc 276,115,500 1.99%
497,529 Martin Marietta Materials Inc 114,486,398 0.82%
1,529,030,569 11.01%
Consumer Staples 1.15% (31st December, 2018: 3.17%) 3,139,670 Coca-Cola Co 159,871,996 1.15%
159,871,996 1.15%
Energy 2.35% (31st December, 2018: 2.42%) 3,495,785 EOG Resources Inc 325,667,331 2.35%
325,667,331 2.35%
Financials 12.98% (31st December, 2018: 16.43%)
Banks 6,042,330 Wells Fargo & Co 285,923,056 2.06% 2,110,553 Prosperity Bancshares Inc 139,402,026 1.00% 1,057,978 Commerce Bancshares Inc 63,118,967 0.46%
488,444,049 3.52%
Insurance 2,162,892 Berkshire Hathaway Inc Class B 461,063,688 3.32%
499,861 Fairfax Financial Holdings Ltd 245,344,321 1.77% 251,456 Alleghany Corp 171,269,196 1.23%
877,677,205 6.32%
Other Financials 2,525,737 American Express Co 311,776,975 2.25% 3,073,899 Charles Schwab Corp 123,540,001 0.89%
435,316,976 3.14%
Total Financials 1,801,438,230 12.98%
Healthcare 14.61% (31st December, 2018: 12.91%) 4,147,671 Danaher Corp 592,785,139 4.27% 2,220,000 Becton Dickinson & Co 559,462,200 4.03% 4,500,000 Agilent Technologies Inc 336,015,000 2.42%
756,273 Thermo Fisher Scientific Inc 222,102,255 1.60% 612,748 Cooper Cos Inc 206,428,674 1.49% 300,000 ICU Medical Inc 75,573,000 0.54% 575,000 Alcon Inc 35,678,750 0.26%
2,028,045,018 14.61%
6 FINDLAY PARK FUNDS P.L.C.

STATEMENT OF INVESTMENTS (continued) FINDLAY PARK AMERICAN FUND (continued) As at 30th June, 2019
Industry Holding Security Description Fair Value US$
% of Total Net Assets
Industrials 9.90% (31st December, 2018: 13.54%) 2,315,000 Air Products & Chemicals Inc 524,046,550 3.77% 3,394,847 Waste Connections Inc 324,479,476 2.34% 1,834,572 Deere & Co 304,006,926 2.19% 2,938,400 Agnico-Eagle Mines Ltd 150,563,616 1.08%
412,668 3M Co 71,531,871 0.52%
1,374,628,439 9.90%
Real Estate & Related 0.10% (31st December, 2018: 0.22%) 68,471 American Tower Corp* 13,998,896 0.10%
13,998,896 0.10%
Technology 14.34% (31st December, 2018: 13.34%) 5,082,744 Microsoft Corp 680,884,386 4.91%
349,334 Alphabet Inc Class C 377,598,614 2.72% 1,986,803 Autodesk Inc 323,650,209 2.33% 1,635,494 TE Connectivity Ltd 156,647,615 1.13%
529,484 Adobe Systems Inc 156,012,461 1.12% 1,373,245 Analog Devices Inc 154,998,163 1.12%
320,000 Intuit Inc 83,625,600 0.60% 497,313 Texas Instruments Inc 57,071,640 0.41%
1,990,488,688 14.34%
Telecommunications 0.86% (31st December, 2018: 0.68%) 1,620,554 T-Mobile US Inc 120,147,873 0.86%
120,147,873 0.86%
Total Equities 11,444,945,033 82.44%
Financial Equity Assets at Fair Value through Profit or Loss 11,444,945,033 82.44% Financial Equity Liabilities at Fair Value through Profit or Loss – –
Industry Holding Security Description Coupon Maturity Fair Value US$
% of Total Net Assets
BONDS
Government Securities 14.34% (31st December, 2018: 8.62%) 500,000,000 United States Treasury Bill 0.00% 25/07/2019 499,350,000 3.60% 500,000,000 United States Treasury Bill 0.00% 29/08/2019 498,279,165 3.59% 500,000,000 United States Treasury Bill 0.00% 26/09/2019 497,492,710 3.58% 500,000,000 United States Treasury Bill 0.00% 31/10/2019 496,572,985 3.57%
1,991,694,860 14.34%
Total Bonds 1,991,694,860 14.34%
Financial Bond Assets at Fair Value through Profit or Loss 1,991,694,860 14.34% Financial Bond Liabilities at Fair Value through Profit or Loss – –
Investments** 13,436,639,893 96.78%
FINDLAY PARK FUNDS P.L.C. 7
STATEMENT OF INVESTMENTS (continued) FINDLAY PARK AMERICAN FUND (continued) As at 30th June, 2019
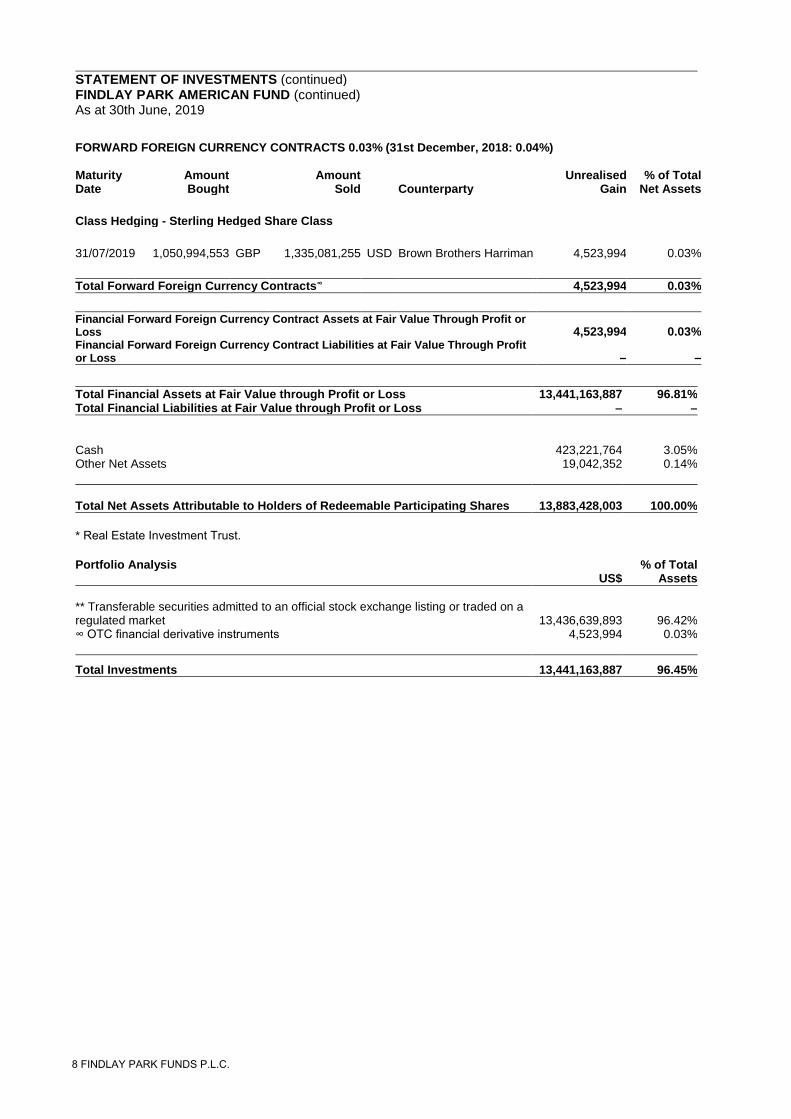
FORWARD FOREIGN CURRENCY CONTRACTS 0.03% (31st December, 2018: 0.04%)
Maturity Date
Amount Bought
Amount Sold Counterparty
Unrealised Gain
% of Total Net Assets
Class Hedging - Sterling Hedged Share Class
31/07/2019 1,050,994,553 GBP 1,335,081,255 USD Brown Brothers Harriman 4,523,994 0.03%
Total Forward Foreign Currency Contracts∞ 4,523,994 0.03%
Financial Forward Foreign Currency Contract Assets at Fair Value Through Profit or Loss 4,523,994 0.03% Financial Forward Foreign Currency Contract Liabilities at Fair Value Through Profit or Loss – –
Total Financial Assets at Fair Value through Profit or Loss 13,441,163,887 96.81% Total Financial Liabilities at Fair Value through Profit or Loss – –
Cash 423,221,764 3.05% Other Net Assets 19,042,352 0.14%
Total Net Assets Attributable to Holders of Redeemable Participating Shares 13,883,428,003 100.00%
* Real Estate Investment Trust.
Portfolio Analysis % of Total US$ Assets
** Transferable securities admitted to an official stock exchange listing or traded on a regulated market 13,436,639,893 96.42% ∞ OTC financial derivative instruments 4,523,994 0.03%
Total Investments 13,441,163,887 96.45%
8 FINDLAY PARK FUNDS P.L.C.

NOTES TO THE CONDENSED FINANCIAL STATEMENTS
For the half year ended 30th June, 2019
1 Statement of Accounting Policies
The significant accounting policies and estimation techniques adopted by the Company are as follows:
Basis of Presentation of Financial Statements The financial statements have been prepared in accordance with accounting standards generally accepted in Ireland and comply with Irish statute comprising the Companies Act, 2014, the European Communities (Undertakings for Collective Investment in Transferable Securities) Regulations 2011 (as amended) (the “UCITS Regulations”), the Central Bank (Supervision and Enforcement) Act 2013 (Section 48(1)) (Undertakings for Collective Investment in Transferable Securities) Regulations 2019 (the “Central Bank UCITS Regulations”) and the Listing Rules of the Irish Stock Exchange. The financial statements have been prepared in accordance with Financial Reporting Standards FRS 102: “The financial reporting standard applicable in the UK and Republic of Ireland”. Accounting standards generally accepted in Ireland in preparing financial statements giving a fair view are those published by the Institute of Chartered Accountants in Ireland and issued by the Financial Reporting Council.
The financial statements are prepared under the historical cost convention, as modified by the revaluation of financial assets and financial liabilities at fair value through profit or loss.
The Company meets the criteria to avail of the exemption available to certain investment funds under FRS 102 not to prepare a statement of cash flow.
The preparation of financial statements requires the use of certain critical accounting estimates. It also requires the Board of Directors to exercise its judgement in the process of applying the Company’s accounting policies. The resulting accounting estimates will, by definition, seldom equal the related actual results and the differences could be material. The estimates and assumptions that have a significant risk of causing a material adjustment to the carrying amounts of assets and liabilities are outlined below.
Valuation of Financial Assets and Financial Liabilities at Fair Value through Profit or Loss The Company has chosen to apply the recognition and measurement provisions of International Accounting Standard (“IAS”) 39: ‘Financial Instruments: Recognition and Measurement’, (as adopted for use in the European Union) and the disclosure and presentation requirement of FRS 102 to account for all the financial instruments. The Company has designated all of its investments into financial assets or financial liabilities at fair value through the profit or loss.
Listed Securities In accordance with IAS 39, the fair value of investments quoted, listed or normally dealt in, or under the rules of a recognised market is calculated by reference to the last traded price on such recognised market as at the valuation point. If an investment is quoted in more than one stock exchange or market, the Administrator or their delegate adopt the price or, as the case may be, last traded price on the recognised market, which, in their opinion, provides the principal market for such investments. Listed securities as at 30th June, 2019 include equities and certain government bonds.
Unlisted Securities
Unlisted securities as at 30th June, 2019 include forward foreign currency contracts only.
Valuation technique Valuation techniques include using recent arm’s length market transactions for identical asset between knowledgeable, willing parties, if available, reference to the current fair value of another asset that is substantially the same as the asset being measured, discounted cash flow analysis and option pricing models. If there is a valuation technique commonly used by market participants to price the asset and that technique has been demonstrated to provide reliable estimates of prices obtained in actual market transactions, the Company uses that technique. There were no such investments as at 30th June, 2019.
Recent transactions When quoted prices are unavailable, the price of a recent transaction for an identical asset provides evidence of fair value as long as there has not been a significant change in economic circumstances or a significant lapse of time since the transaction took place. Where the Company can demonstrate that the last transaction price is not a good estimate of fair value, that price is adjusted.
Cash and Cash Equivalents Cash and other liquid assets are valued at their face value together with accrued interest, where applicable, to the valuation point on the relevant dealing day unless, in the opinion of the Directors (in consultation with the Findlay Park Partners LLP (the “Investment Manager”)) and the Administrator, any adjustment should be made to reflect the true value thereof.
Dividend Policy The Articles of Association empower the Directors to declare dividends out of the profits of the American Fund being: net income (including interest and dividend income) and/or realised and unrealised capital gains on the disposal valuation of investments and other funds less realised and unrealised accumulated capital losses of the American Fund.
FINDLAY PARK FUNDS P.L.C. 9
NOTES TO THE CONDENSED FINANCIAL STATEMENTS (continued) For the half year ended 30th June, 2019
1 Statement of Accounting Policies (continued)
Dividend Policy (continued) If sufficient net income after expenses is available in the American Fund, the Directors' current intention is to make a single distribution in each year of substantially the whole of the net income (including interest and dividends) of the American Fund. The net amount of all realised and unrealised gains (less realised and unrealised losses) arising on the disposal of investments shall not be distributed but shall form part of the assets of the American Fund. The amounts of
distributions paid for the financial half year ended are disclosed in the Income Statement.
Under Regulation 51 of The Offshore Funds (Tax) Regulations 2009, American Fund Dollar Shares and Sterling Hedged Shares were accepted into the UK's reporting regime with effect from 1st January, 2010. The American Fund Sterling Unhedged Shares were accepted into the UK's reporting regime with effect from 11th May, 2015.
2 Share Capital
3BAuthorised The initial authorised share capital of the Company is EUR 38,092 divided into 30,000 Management Shares with a par value of EUR 1.27 each (issued at IR£1 converted to EUR 1.269738) and 500,000,000 Redeemable Participating Shares of nil par value initially designated as unclassified shares and which may be issued as shares of the Company. All Redeemable Participating Shares have equal voting rights.
The Redeemable Participating Shares are classified as financial liabilities. Redeemable Participating Shares have priority over other claims to the assets of the entity on liquidation. The Redeemable Participating Shares can be put back to the American Fund on any dealing day for cash equal to a proportionate share of the American Fund’s Net Asset Value. The American Fund provides its shareholders with the right to redeem their interest in the fund at any dealing date for cash equal to their proportionate share of the Net Asset Value of the American Fund. Under FRS 102, this right represents in substance a liability of the American Fund to shareholders.
The Company’s Management Shares do not participate in the profits of the Company.
Management Shares There are seven Management Shares in issue, which are held by nominees for the Investment Manager. Management Shares do not entitle the holders thereof to any dividend and on a winding-up entitle the holder to receive the amount paid up thereon but not otherwise to participate in the assets of the Company. The Management Shares do not form part of the shareholders’ funds and are not included in the Net Asset Value of the American Fund.
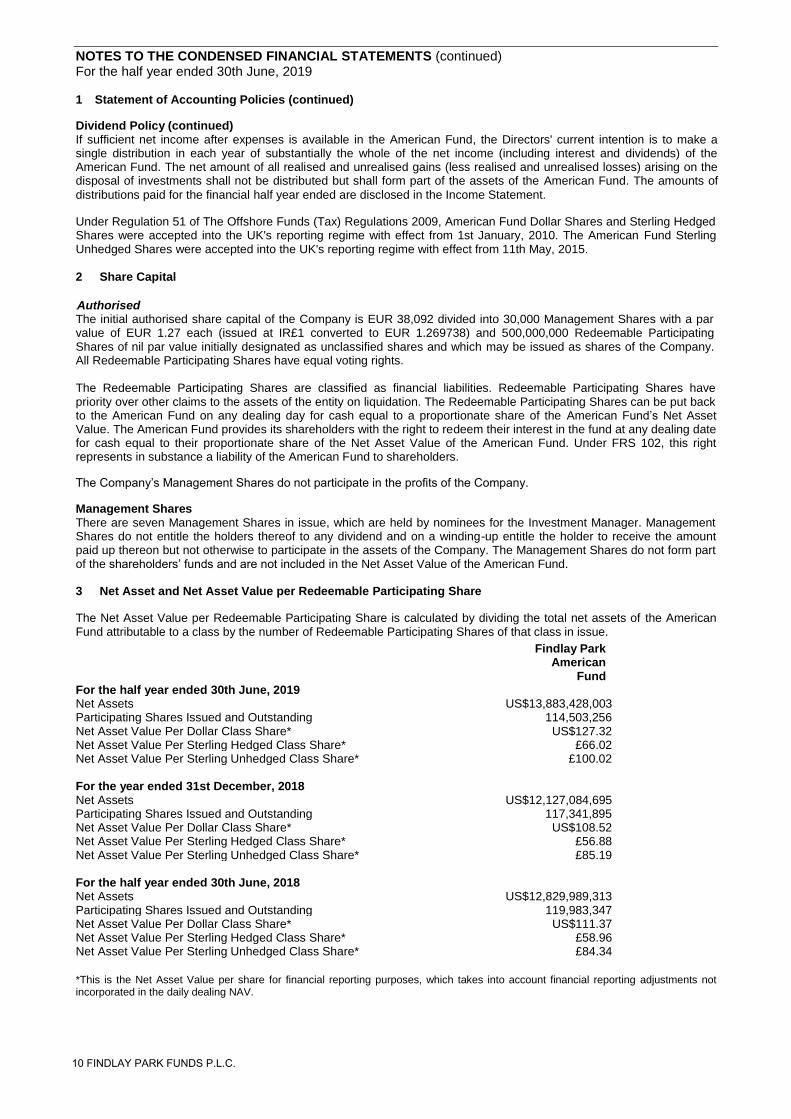
3 Net Asset and Net Asset Value per Redeemable Participating Share
The Net Asset Value per Redeemable Participating Share is calculated by dividing the total net assets of the American Fund attributable to a class by the number of Redeemable Participating Shares of that class in issue.
Findlay Park American
Fund For the half year ended 30th June, 2019 Net Assets US$13,883,428,003 Participating Shares Issued and Outstanding 114,503,256 Net Asset Value Per Dollar Class Share* US$127.32 Net Asset Value Per Sterling Hedged Class Share* £66.02 Net Asset Value Per Sterling Unhedged Class Share* £100.02
For the year ended 31st December, 2018 Net Assets US$12,127,084,695 Participating Shares Issued and Outstanding 117,341,895 Net Asset Value Per Dollar Class Share* US$108.52 Net Asset Value Per Sterling Hedged Class Share* £56.88 Net Asset Value Per Sterling Unhedged Class Share* £85.19
For the half year ended 30th June, 2018 Net Assets US$12,829,989,313 Participating Shares Issued and Outstanding 119,983,347 Net Asset Value Per Dollar Class Share* US$111.37 Net Asset Value Per Sterling Hedged Class Share* £58.96 Net Asset Value Per Sterling Unhedged Class Share* £84.34
*This is the Net Asset Value per share for financial reporting purposes, which takes into account financial reporting adjustments notincorporated in the daily dealing NAV.
10 FINDLAY PARK FUNDS P.L.C.

NOTES TO THE CONDENSED FINANCIAL STATEMENTS (continued) For the half year ended 30th June, 2019
4 Investment Management Fee and Performance Fee
The Company has appointed Findlay Park Partners LLP as Investment Manager.
Findlay Park American Fund The Investment Manager is entitled to an annual fee of 1 percent of the Net Asset Value of the American Fund which is accrued daily and payable monthly in arrears.
The Investment Management fee is exclusive of value added tax (if any).
Effective 26th April, 2018, the Investment Manager agreed to apply a cap on the ongoing operating expenses (”Ongoing Charges Cap”) borne by each share class of the American Fund as outlined in the table below.
Share Class Ongoing Charges Cap Dollar Class Share 1% Sterling Hedged Class Share 1% Sterling Unhedged Class Share 1%
Each Ongoing Charges Cap percentage listed above shall be calculated as a percentage of the average daily Net Asset Value of the relevant class of Shares. The Ongoing Charges Cap limits the operating expenses paid by the Company, such as the Investment Manager's fee, fees and expenses charged in the ordinary course of business by the Fund’s service providers, including, without limitation, its auditors, legal advisors and other professional service providers, Fund insurance expenses, Directors’ fees and expenses, listing fees, printing expenses and regulatory filing fees. The Investment Manager is entitled, upon 30 days’ written notice to the Directors and the Shareholders in the American Fund, to cease making Ongoing Charges Cap payments to the American Fund in which case such payments will be met by the American Fund.
Each class of shares continue to be responsible for payment of any other cost.
5 Administration and Transfer Agent Fees
The Company has appointed Brown Brothers Harriman Fund Administration Services (Ireland) Limited to serve as the Administrator and Transfer Agent.
The Transfer Agent is entitled to an annual minimum fee of US$10,000 per Fund for acting as Transfer Agent to the American Fund. This fee is accrued and calculated at each valuation point and is payable monthly in arrears.
The Administrator is paid by the American Fund an Administration Charge and fees in respect of its duties as Administrator. The Administration Charge accrues and is calculated daily and is paid monthly in arrears at a rate of: 0.007 percent per annum on the first US$5 billion, 0.006 percent per annum between US$5 billion and US$10 billion, 0.005 percent per annum between US$10 billion and US$15 billion and 0.004 percent per annum on all assets exceeding US$15 billion, plus value added tax (if any). A minimum Administration Charge equivalent of US$50,000 per annum is payable.
The Administrator is also entitled to be repaid all of its properly vouched out-of-pocket expenses out of the assets of the Fund (plus VAT thereon, if any).
In addition, the Administrator is entitled to a further fee of US$10,000 in respect of the costs of maintaining the currency hedge on the American Fund Sterling Hedged Share Class.
6 Depositary Fees
The Company has appointed Brown Brothers Harriman Trustee Services (Ireland) Limited (the “Depositary”) to carry out depositary functions. The Depositary is entitled to an annual minimum fee of US$20,000 for acting as Depositary to the Fund.
Findlay Park American Fund The Depositary is paid by the American Fund, fees accruing and calculated daily and paid monthly in arrears at a maximum rate of 0.1 percent per annum of the Net Asset Value of the American Fund. In addition, the Depositary levies charges at its normal commercial rates in respect of the settlement of investment transactions, as agreed with the Investment Manager from time to time, along with other sub-depositary fees, expenses and charges. The fees are exclusive of value added tax (if any).
FINDLAY PARK FUNDS P.L.C. 11

NOTES TO THE CONDENSED FINANCIAL STATEMENTS (continued) For the half year ended 30th June, 2019
7 Directors' Fees and Expenses
Each Director is entitled to such remuneration for his services as the Directors may determine provided that the aggregate emoluments of all Directors in respect of any twelve month accounting period shall not exceed US$300,000 plus expenses, or such higher amount as may be approved by Directors or the Company in a general meeting. Mr Simon Pryke, a Partner in Findlay Park Partners LLP, agreed to waive his remuneration for acting as Director of the Company, since his appointment on 14th May, 2018. The Directors’ remuneration is payable by the Company.
8 Other Fees
The Company also pays out of the assets of the Fund, fees in respect of the publication and circulation of details of the Net Asset Value per Redeemable Participating Share, stamp duties, taxes, brokerage, tax, legal and other professional advisers (including the auditors).
9 Financial Risk Management
Fair Value Estimation
FRS 102 Section 11.27 on “Fair Value: Disclosure” requires disclosure relating to the fair value hierarchy in which fair value measurements are categorised for assets and liabilities. The disclosures are based on a three level fair value hierarchy for the inputs used in valuation techniques to measure fair value.
The Company has classified fair value measurements using a fair value hierarchy that reflects the significance of the inputs used in making the measurements. The fair value hierarchy has the following levels:
(i) Level 1: Investments, whose values are based on quoted market prices in active markets, and thereforeclassified within level 1, include active listed equities and US government treasury notes. Quoted prices forthese instruments are not adjusted.
(ii) Level 2: Financial instruments that trade in markets that are not considered to be active but are valued basedon quoted market prices, dealer quotations or alternative pricing sources supported by observable inputs areclassified within level 2. These include over-the-counter traded derivatives. As level 2 investments includepositions that are not traded in active markets and/or are subject to transfer restrictions, valuations may beadjusted to reflect illiquidity and/or non-transferability, which are generally based on available marketinformation.
(iii) Level 3: Investments classified within level 3 have significant unobservable inputs, as they trade infrequently.Pricing inputs are unobservable for the investment and includes situations where there is little, if any, marketactivity for the instrument. The inputs into the determination of fair value require significant managementjudgement or estimation. As observable prices are not available for these securities, the Fund would usevaluation techniques to derive the fair value if applicable.
The level in the fair value hierarchy within which the fair value measurement is categorised in its entirety is determined on the basis of the lowest level input that is significant to the fair value measurement in its entirety. For this purpose, the significance of an input is assessed against the fair value measurement in its entirety. If a fair value measurement uses observable inputs that require significant adjustment based on unobservable inputs, that measurement is a level 3 measurement. Assessing the significance of a particular input to the fair value measurement in its entirety requires judgement, considering factors specific to the financial asset or liability.
The determination of what constitutes ‘observable’ requires significant judgement by the Directors in consultation with the Investment Manager. The Directors consider observable data to be that market data that is readily available, regularly distributed or updated, reliable and verifiable, not proprietary, and provided by independent sources that are actively involved in the relevant market.
The tables overleaf provide an analysis within the fair value hierarchy of the Fund’s financial assets and liabilities measured at fair value as at 30th June, 2019 and as at 31st December, 2018:
12 FINDLAY PARK FUNDS P.L.C.
NOTES TO THE CONDENSED FINANCIAL STATEMENTS (continued) For the half year ended 30th June, 2019
9 Financial Risk Management (continued)
Fair Value Estimation (continued)
As at 30th June, 2019
Findlay Park American Fund
Financial Assets at Fair Value Through Profit or Loss Level 1 Level 2 Level 3 Total
US$ US$ US$ US$
Equities 11,444,945,033 – – 11,444,945,033 Bonds 1,991,694,860 – – 1,991,694,860 Forward Foreign Currency Contracts – 4,523,994 – 4,523,994
Total Financial Assets at Fair Value Through Profit or Loss 13,436,639,893 4,523,994 – 13,441,163,887
As at 31st December, 2018
Findlay Park American Fund
Financial Assets at Fair Value Through Profit or Loss Level 1 Level 2 Level 3 Total
US$ US$ US$ US$
Equities 10,809,877,657 – – 10,809,877,657 Bonds 1,045,415,778 – – 1,045,415,778 Forward Foreign Currency Contracts – 5,198,350 – 5,198,350
Total Financial Assets at Fair Value Through Profit or Loss 11,855,293,435 5,198,350 – 11,860,491,785
10 Related Party Transactions
Parties are related if any one party has the ability to control the other party or exercise significant influence over the other
party in making financial or operational decisions.
Mr Simon Pryke, a Director of the Company, is a Partner in Findlay Park Partners LLP, the Investment Manager. The Investment Manager earned a net fee of US$64,044,457 for the half year ended 30th June, 2019 (30th June, 2018: US$63,201,874).
In accordance with the Central Bank (Supervision and Enforcement) Act 2013 (Section 48(1)) (Undertakings for Collective Investment in Transferable Securities) Regulations 2019, any transaction carried out with the Company by the Promoter, the Investment Manager, the Depositary, the Investment Adviser and/or associated or group companies of these entities (“connected persons”) must be carried out as if negotiated at arm’s length. Such transactions must be in the best interest of the shareholders of the Company.
The Board of Directors of the Company is satisfied that (i) there are arrangements (evidenced by written procedures) in place to ensure that the obligations set out above are applied to all transactions with connected persons; and (ii) transactions with connected persons entered into during the period complied with these obligations.
The Directors are not aware of any transactions with connected persons during the half year ended 30th June, 2019, other than those disclosed in these financial statements (31st December, 2018: none).
FINDLAY PARK FUNDS P.L.C. 13
NOTES TO THE CONDENSED FINANCIAL STATEMENTS (continued) For the half year ended 30th June, 2019
11 Efficient Portfolio Management
The Company may employ techniques and instruments relating to transferable securities and/or other financial instruments under the conditions and within the limits laid down by the Central Bank of Ireland provided that such instruments are used for efficient portfolio management.
Techniques and instruments utilised for the purpose of efficient portfolio management may only be used in accordance with the investment objective of the American Fund. Any technique or instrument must be one which is reasonably believed by the Investment Manager to be economically appropriate to the efficient portfolio management of the American Fund.
In order to safeguard the performance of the American Fund to the Russell 1000 Net 30% Total Return Index, the Investment Manager has the option to use exchange traded index futures as an efficient portfolio management
technique.
The Company currently has three classes of shares available for subscription for existing shareholders in the American Fund. Firstly, Dollar Class Shares, which are denominated in US Dollar. The Net Asset Value per Share for Dollar Class Shares is calculated in US Dollar and subscriptions and redemptions are effected in that currency. Secondly, Sterling Hedged Class Shares which are denominated in Sterling. The Net Asset Value per Share for Sterling Hedged Class Shares is calculated in Sterling and subscriptions and redemptions are effected in that currency. Thirdly, Sterling Unhedged Class Shares which are denominated in Sterling. The Net Asset Value per Share for Sterling Unhedged Class Shares is calculated in Sterling and subscriptions and redemptions are effected in that currency.
The Investment Manager may hedge the currency exposure of the Sterling Hedged Class Shares to the functional currency. As foreign exchange hedging may be utilised for the benefit of a particular class of shares within the American Fund its costs and related liabilities and/or benefits shall be for the account of that class of shares only. Accordingly, such costs and related liabilities and/or benefits will be reflected only in the Net Asset Value per share of the Sterling Hedged Class Shares.
These currency hedging transactions will not be combined with or offset against any other currency transactions undertaken by the American Fund and in no case will these transactions exceed 105 percent of the Net Asset Value of the Sterling Hedged Class Shares. Save for class specific gains or losses associated with currency hedging activities, the Net Asset Value per share of the Sterling Hedged Class Shares will be calculated in the manner as set out in the Prospectus.
Investors should be aware that this strategy may substantially limit holders of the Sterling Hedged Class Shares from benefiting if such currency falls against the functional currency and/or against the currency in which the investments of the American Fund are denominated.
The currency hedging described will be used for the purpose of efficient portfolio management only. The periodic reports in relation to the American Fund will give an indication of how the currency hedging transactions have been utilised during the period to which the reports relate.
During the half year ended 30th June, 2019 the Company did not engage in any other efficient portfolio management techniques (31st December, 2018: same).
14 FINDLAY PARK FUNDS P.L.C.

NOTES TO THE CONDENSED FINANCIAL STATEMENTS (continued) For the half year ended 30th June, 2019
12 Dividends
The following dividends were declared by Findlay Park American Fund during the half year ended 30th June, 2019 and year ended 31st December, 2018.
Findlay Park American Fund
30th June, 2019
Ex-Date Pay-Date Description
Dollar Share Class
2nd January, 2019 8th January, 2019 Distribution of US$0.2074 per share
Sterling Hedged Share Class
2nd January, 2019 8th January, 2019 Distribution of US$0.1439 per share (£0.1140)
Sterling Unhedged Share Class
2nd January, 2019 8th January, 2019 Distribution of US$0.2046 per share (£0.1621)
31st December, 2018
There were no dividends declared.
13 Transaction Costs
During the half year ended 30th June, 2019 the transaction costs which have been defined as brokerage transaction costs and depositary transaction costs have been charged to the Fund in relation to purchases and sales of transferable securities, futures or any other eligible assets (brokerage transaction costs on fixed income or forward foreign currency contracts are excluded). The table below outlines the transaction costs for the half years ended 30th June, 2019 and 30th June, 2018.
Fund 30th June, 2019 30th June, 2018
US$ US$
Findlay Park American Fund 1,933,910 2,815,923
14 Exchange Rates
The following exchange rates to US Dollar were used to convert the investments and other assets and liabilities denominated in currencies other than US Dollar as at 30th June, 2019 and 31st December, 2018.
15 Significant Events During the Reporting Period
There were no significant events affecting the Company during the reporting period.
16 Significant Events Since the End of the Reporting Period
There were no significant events affecting the Company since the end of the reporting period.
17 Approval of Financial Statements
The Board of Directors approved the semi-annual report and unaudited condensed financial statements on 8th August, 2019.
Currency 30th June, 2019 31st December, 2018
British Pound US$1=0.7874 US$1=0.7846
Canadian Dollar US$1=1.3096 US$1=1.3652
FINDLAY PARK FUNDS P.L.C. 15
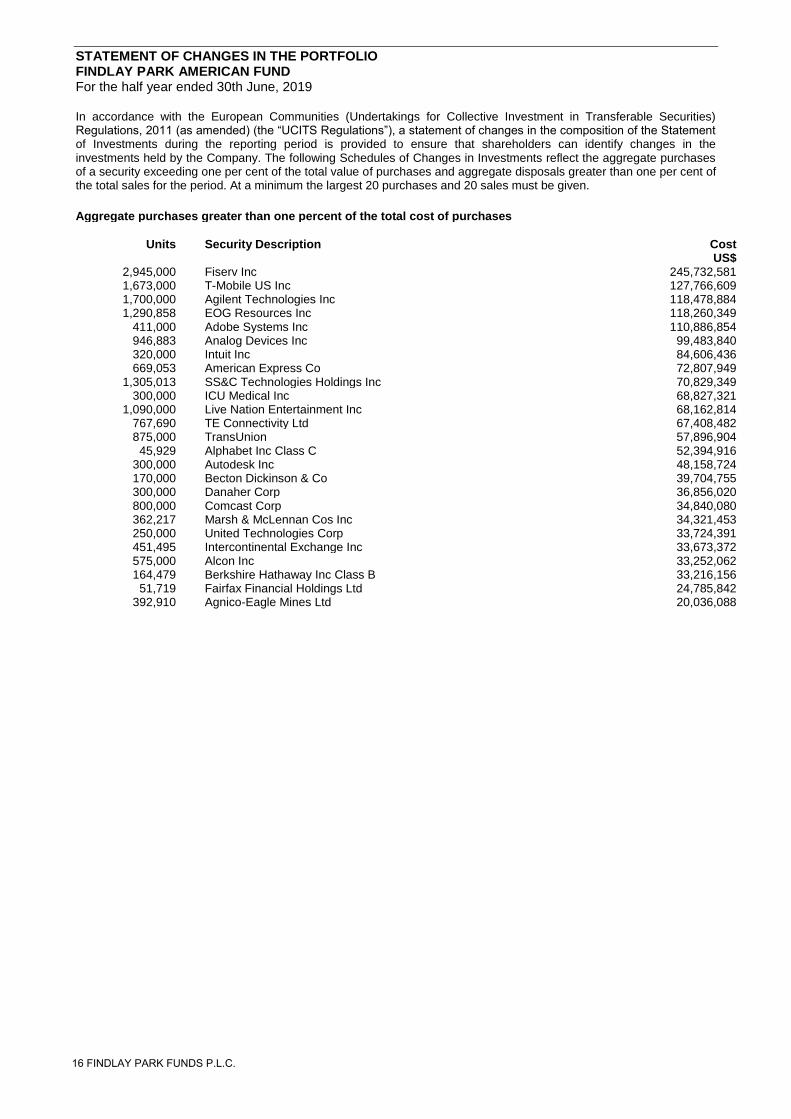
STATEMENT OF CHANGES IN THE PORTFOLIO FINDLAY PARK AMERICAN FUND For the half year ended 30th June, 2019
In accordance with the European Communities (Undertakings for Collective Investment in Transferable Securities) Regulations, 2011 (as amended) (the “UCITS Regulations”), a statement of changes in the composition of the Statement of Investments during the reporting period is provided to ensure that shareholders can identify changes in the investments held by the Company. The following Schedules of Changes in Investments reflect the aggregate purchases of a security exceeding one per cent of the total value of purchases and aggregate disposals greater than one per cent of the total sales for the period. At a minimum the largest 20 purchases and 20 sales must be given.
Aggregate purchases greater than one percent of the total cost of purchases
Units Security Description Cost US$
2,945,000 Fiserv Inc 245,732,581 1,673,000 T-Mobile US Inc 127,766,609 1,700,000 Agilent Technologies Inc 118,478,884 1,290,858 EOG Resources Inc 118,260,349
411,000 Adobe Systems Inc 110,886,854 946,883 Analog Devices Inc 99,483,840 320,000 Intuit Inc 84,606,436 669,053 American Express Co 72,807,949
1,305,013 SS&C Technologies Holdings Inc 70,829,349 300,000 ICU Medical Inc 68,827,321
1,090,000 Live Nation Entertainment Inc 68,162,814 767,690 TE Connectivity Ltd 67,408,482 875,000 TransUnion 57,896,904
45,929 Alphabet Inc Class C 52,394,916 300,000 Autodesk Inc 48,158,724 170,000 Becton Dickinson & Co 39,704,755 300,000 Danaher Corp 36,856,020 800,000 Comcast Corp 34,840,080 362,217 Marsh & McLennan Cos Inc 34,321,453 250,000 United Technologies Corp 33,724,391 451,495 Intercontinental Exchange Inc 33,673,372 575,000 Alcon Inc 33,252,062 164,479 Berkshire Hathaway Inc Class B 33,216,156
51,719 Fairfax Financial Holdings Ltd 24,785,842 392,910 Agnico-Eagle Mines Ltd 20,036,088
16 FINDLAY PARK FUNDS P.L.C.
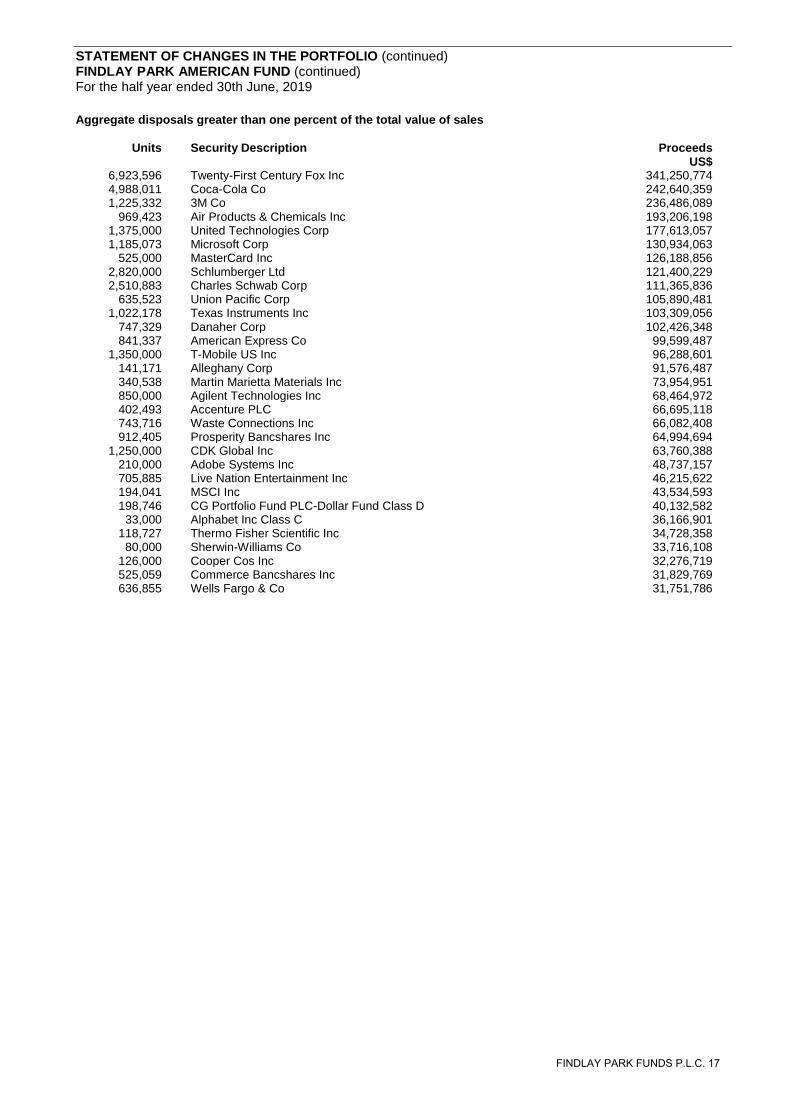
STATEMENT OF CHANGES IN THE PORTFOLIO (continued) FINDLAY PARK AMERICAN FUND (continued) For the half year ended 30th June, 2019
Aggregate disposals greater than one percent of the total value of sales
Units Security Description Proceeds US$
6,923,596 Twenty-First Century Fox Inc 341,250,774 4,988,011 Coca-Cola Co 242,640,359 1,225,332 3M Co 236,486,089
969,423 Air Products & Chemicals Inc 193,206,198 1,375,000 United Technologies Corp 177,613,057 1,185,073 Microsoft Corp 130,934,063
525,000 MasterCard Inc 126,188,856 2,820,000 Schlumberger Ltd 121,400,229 2,510,883 Charles Schwab Corp 111,365,836
635,523 Union Pacific Corp 105,890,481 1,022,178 Texas Instruments Inc 103,309,056
747,329 Danaher Corp 102,426,348 841,337 American Express Co 99,599,487
1,350,000 T-Mobile US Inc 96,288,601 141,171 Alleghany Corp 91,576,487 340,538 Martin Marietta Materials Inc 73,954,951 850,000 Agilent Technologies Inc 68,464,972 402,493 Accenture PLC 66,695,118 743,716 Waste Connections Inc 66,082,408 912,405 Prosperity Bancshares Inc 64,994,694
1,250,000 CDK Global Inc 63,760,388 210,000 Adobe Systems Inc 48,737,157 705,885 Live Nation Entertainment Inc 46,215,622 194,041 MSCI Inc 43,534,593 198,746 CG Portfolio Fund PLC-Dollar Fund Class D 40,132,582
33,000 Alphabet Inc Class C 36,166,901 118,727 Thermo Fisher Scientific Inc 34,728,358
80,000 Sherwin-Williams Co 33,716,108 126,000 Cooper Cos Inc 32,276,719 525,059 Commerce Bancshares Inc 31,829,769 636,855 Wells Fargo & Co 31,751,786
FINDLAY PARK FUNDS P.L.C. 17

APPENDIX 1 – TOTAL EXPENSE RATIOS
The total expense ratios (TERs) for the period are set out in the table below.
The annualised TER calculation includes all annual operating costs including performance fees (where applicable) and excludes bank interest, FX and dealing costs, and withdrawn taxes on dividends and interest in compliance with the guidelines set out by the Swiss Funds and Asset Management Association (SFAMA). The TERs are not required to be included in this Report by the Central Bank of Ireland or the Irish Stock Exchange. They are provided for information purpose only and are unaudited. Only Swiss registered Funds are presented in the table below.
For the rolling 12 months ended 30th June, 2019:
30th June, 2019 Findlay Park American Fund Dollar Class Share 1.00% Sterling Hedged Class Share 1.00% Sterling Unhedged Class Share 1.00%
18 FINDLAY PARK FUNDS P.L.C.