finding the pawns that will become queens - vaneck
TRANSCRIPT

Finding the pawns that will become QueensA guide to international small companies investing
April 2021

VanEck 2
Finding the pawns that will become QueensMost Australian portfolios have an allocation to international equities, often via locally managed listed and unlisted funds. The benefits of including international equities in a portfolio have been well documented. International equities provide:
1. Better geographic diversification – the Australian stock market represents only 2% of global stock markets;
2. Better sector diversification – Australia is dominated by resources and financials with limited opportunities intechnology and health care; and
3. Exposure to different economic cycles.1
Often Australian investors’ exposures to international equities are dominated by large- and mid-cap companies. This is because the benchmark index used by Australian managers is the MSCI World ex Australia Index, which aims to capture the performance of these large- and mid-cap companies. This benchmark captures approximately 85% of the free float-adjusted market capitalisation of each developed country in the index, so it includes the largest companies in each country, until this threshold is reached.
As a result investors are missing out on opportunities in the remaining 15% of the international equities market not included in the benchmark. These companies are considered small-cap companies.
The rationale for considering international small-cap companies is compelling, potentially more so than Australian small-caps. Yet while Australian investors recognise the small-cap opportunity and are invested via the local small-cap market, because of limited opportunities and difficulty of access, it is likely an Australian investor’s international small-cap exposure does not echo their domestic exposure.
As with Australian small companies, stock selection is important in international equities. There are over 4,000 companies in the MSCI World ex Australia Small Cap Index and not all of these are attractive from an investment point of view.
This paper will therefore not only outline why an allocation to international small companies is important, but also how an approach focused on quality can add value over the long term.
International small company investing: an approach focused on quality can add value over the long term.
Finding the pawns that will become Queens 3
Benefits of international small companiesAustralian investors are familiar with investing in small-size companies because most have either direct or indirect exposure to Australian small-caps. Australians have been attracted to small companies because of the potential growth they provide above large companies.
This ‘size effect’ was first documented by several academic papers in the early 1980s.2 Despite size’s legacy and its subsequent prominence in investing, there remains much debate about the size effect.3 There are different definitions of small companies because ‘small’ is a relative term. On ASX, the generally accepted definition is those companies outside the S&P/ASX 100 Index. The S&P/ASX 100 Index includes the largest 100 Australian listed stocks, capturing the largest 50 companies and the S&P/ASX Mid-Cap 50 (Stocks 51 to 100 by size). The S&P/ASX Small Ordinaries Index (S&P/ASX Small Ords) includes stocks 101 to 300 by size.
In Australia, the S&P/ASX 100 Index captures 75% of the market capitalisation of all stocks listed on ASX. The S&P/ASX Small Ords captures 16% of the market capitalisation of all stocks on ASX (Source: S&P, ASX, as at 3 March 2021). There is a long tail of nearly 2,000 micro-caps that make up the rest of the companies on ASX.
Australian investors’ affinity with local small companies and the size effect is illustrated by the popularity of unlisted Australian small company funds. According to Morningstar data 17% of all money invested in Australian Equity Funds (ex ETFs) are invested in small companies funds.4 This compares with just 2% of all International Equity Funds (ex ETFs) being invested in small companies5.
This is surprising when you consider the different opportunity sets and the better relative performance of the ‘size effect’ in overseas markets.
The ASX represents under 2% of the developed global share market6, hence the appeal of adding international equities to a portfolio. It’s important too that Australian investors consider the full set of international opportunities, like they do for Australian equities, which includes international small companies. Australian investors are under-invested in international small companies.
In regards to relative performance and the ‘size effect’, Figure 1 on the page over shows the rolling five-year performance of Australian small companies versus large companies. Data points above the blue horizontal line indicate when the S&P/ASX Small Ords outperformed the S&P/ASX 100 Index over the previous five years, conversely, data points below the line indicate when small companies underperformed their larger counterparts. Small companies outperformed across many time periods, hence their appeal. However, it’s important to note that of the 188 observable data points below, 97, or over half indicate periods of underperformance relative to large companies.
It’s important too that Australian investors consider the full set of international opportunities. Australian investors are under invested in international small companies.

VanEck 4
Source: Morningstar Direct; respective index inception dates to 31 March 2021. S&P/ASX Index series launched on 1 September 2000. Results assume immediate reinvestment of all dividends and exclude costs associated with investing in an ETF and taxes. You cannot invest directly in an index. Past performance is not a reliable indicator of future performance.
Compare this to the relative performance of international small companies compared to international large companies in Figure 2. The benchmark small companies’ index is the MSCI World ex Australia Small Cap Index (International Small Cap Index). This benchmark measures the performance of small companies across 22 countries covering approximately 14% of the market capitalisation of each country.
You can see in Figure 2 over the page that small international companies have had long periods of outperformance relative to larger international companies. However, what you immediately notice in Figure 2 is that international small companies have had more periods of outperformance (relative to their larger counterparts) than Australian small companies in Figure 1. Of the 184 observable data points below, 156, or over 85% indicate periods when international small companies outperformed international large companies over the preceding five years. The ‘size effect’ is more successful in international equities.
Figure 1: Australian small companies versus Australian mid- and large- companies Five-year rolling relative performance 2000 to 2021
%
-10
-8
-6
-4
-2
0
2
4
6
8
10
Aug
200
5
Feb
200
6
Aug
200
6
Feb
200
7
Aug
200
7
Feb
200
8
Aug
200
8
Feb
200
9
Aug
200
9
Feb
201
0
Aug
201
0
Feb
201
1
Aug
201
1
Feb
201
2
Aug
201
2
Feb
201
3
Aug
201
3
Feb
201
4
Aug
201
4
Feb
201
5
Aug
201
5
Feb
201
6
Aug
201
6
Feb
201
7
Aug
201
7
Feb
201
8
Aug
201
8
Feb
201
9
Aug
201
9
Feb
202
0
Aug
202
0
Feb
202
1
S&P/ASX 100 Index S&P/ASX Small Ordinaries Index

Finding the pawns that will become Queens 5
Source: Morningstar Direct; Common Index inception date to 31 March 2021. MSCI World ex Australia Small Caps Index base date is 31 December 2000. Results assume immediate reinvestment of all dividends and exclude costs associated with investing in an ETF and taxes. You cannot invest directly in an index. Past performance is not a reliable indicator of future performance.
Despite the performance of international small companies, Australian investors do not invest in them with the same pluck they invest in Australian small companies.
Adding international small companies to a portfolio can benefit investors in a number of ways beyond performance, they can also provide important diversification.
International small companies as an equity diversifierAustralian small companies are dominated by companies in the materials sector. In the International Small Cap Index materials makes up just 6.6%, whereas in the S&P/ASX Small Ords it makes up 21.2%. Other notable differences are information technology (12.9% in International Small Cap Index versus 7.41% in S&P/ASX Small Ords) and healthcare (11.8% in International Small Cap Index versus 6.7% in S&P/ASX Small Ords).
Figure 2: International small companies versus international mid- and large- companies Five-year rolling relative performance 2000 to 2021
%
MSCI World ex Australia Index MSCI World ex Australia Small Cap Index
-6
-4
-2
0
2
4
6
8
10
12
Dec
200
5
Jun
2006
Dec
200
6
Jun
2007
Dec
200
7
Jun
2008
Dec
200
8
Jun
2009
Dec
200
9
Jun
2010
Dec
201
0
Jun
2011
Dec
201
1
Jun
2012
Dec
201
2
Jun
2013
Dec
201
3
Jun
2014
Dec
201
4
Jun
2015
Dec
201
5
Jun
2016
Dec
201
6
Jun
2017
Dec
201
7
Jun
2018
Dec
201
8
Jun
2019
Dec
201
9
Jun
2020
Dec
202
0
Adding international small companies to a portfolio can benefit investors in a number of ways beyond performance.

VanEck 6
As a diversifier, you can see that international small companies, as represented by International Small Cap Index, provides exposure to different opportunities than Australian small companies, represented by S&P/ASX Small Ords.
International small companies’ performance characteristicsWhile diversifying is useful as a risk management tool, investors are also interested in the returns and potential pitfalls of an asset class. Since 31 December 2000, international small companies have outperformed international large companies.
Figure 5: International small companies versus international large- and mid-cap companies Cumulative performance (%)
Source: Morningstar Direct, as at 31 March 2021. Base date of MSCI World ex Australia Small Cap Index is 31 December 2000. Results are calculated to the last business day of the month and assume immediate reinvestment of all dividends and exclude fees and costs associated with investing. You cannot invest in an Index. Past performance is not a reliable indicator of future performance of the indices or QSML.
%
MSCI World ex Australia Small Cap Index MSCI World ex Australia Index
-100
-50
0
50
100
150
200
250
300
350
400
Dec
200
0
Jul
200
1
Mar
200
2
No
v 20
02
Jul
200
3
Mar
200
4
No
v 20
04
Jul
200
5
Mar
200
6
No
v 20
06
Jul
200
7
Mar
200
8
No
v 20
08
Jul
200
9
Mar
201
0
No
v 20
10
Jul
201
1
Mar
201
2
No
v 20
12
Jul
201
3
Mar
201
4
No
v 20
14
Jul
201
5
Mar
201
6
No
v 20
16
Jul
201
7
3/31
/201
8
No
v 20
18
Jul
201
9
Mar
202
0
No
v 20
20
Figure 4: Sector breakdown MSCI World ex Australia Small Cap Index
Source: S&P, 31 March 2021. You cannot invest directly in an index. Source: MSCI, 31 March 2021. You cannot invest directly in an index.
Figure 3: Sector breakdown S&P/ASX Small Ordinaries Index
21.2% Materials
17.3% Consumer discretionary
2.3% Energy
13.3% Financials
7.%1 Consumer staples
12.6% Real Estate
6.7% Health care
6.4% Industrials
7.4% Information technology
5.7% Communication services
6.6% Materials
14.2% Consumer discretionary
2.9% Energy
13.6% Financials
4.4% Consumer staples
9.4 % Real Estate
11.8% Health care
18.8% Industrials
12.9% Information technology
3% Communication services

Finding the pawns that will become Queens 7
As figure 6 below demonstrates, international small companies have been less volatile and generated better returns than Australian small companies:
Figure 6: Small companies versus large- and mid-cap companies Risk/Reward - December 2000 to March 2021
Source: Morningstar Direct; All data: to common Index inception date to 31 March 2021. MSCI World ex Australia Small Cap Index base date is 31 December 2000. Results are calculated monthly and assume immediate reinvestment of all dividends. You cannot invest in an index. Past performance is not a reliable indicator of future performance of the indices or QSML.
Indices used: Australian large- and mid-caps – S&P/ASX 100 Index, Australian small caps – S&P/ASX Small Ordinaries Index, International large- and mid-caps – MSCI World ex Australia Index, International small caps – MSCI World ex Australia Small Caps Index.
If we consider risk-adjusted performance, the International Small Cap Index also has favourable outcomes. Using the Sharpe ratio as a measure, which takes into account returns and volatility as well as the risk-free rate, Figure 7 shows that International Small Cap Index has delivered competitive risk-adjusted returns. The greater the value of the Sharpe ratio, the better the risk adjusted return. Out of the four indices cited so far, International Small Cap Index does not have the lowest result over, one, three, five, ten, fifteen and twenty years.
Figure 7: Small-companies versus mid- and large- companies Sharpe ratio
1 Year 3 Years 5 Years 10 Years 15 Years 20 Years
International small-caps 3.71 0.70 0.89 0.89 0.36 0.34
International large- and mid-caps 2.24 1.01 1.12 1.04 0.35 0.14
Australian small caps 2.31 0.44 0.60 0.20 0.13 0.27
Australian large- and mid-caps 2.55 0.58 0.68 0.50 0.30 0.42
Source: Morningstar Direct; All data to 31 March 2021. Indices used: International small caps – MSCI World ex Australia Small Caps Index; International mid- and large caps – MSCI World ex Australia Index; Australian small caps – S&P/ASX Small Ordinaries Index; Australian mid- and large caps – S&P/ASX 100 Index. Results are calculated monthly and assume immediate reinvestment of dividends. You cannot invest in an index. Past performance is not a reliable indicator of future performance of the indices or QSML.
Retu
rn (%
p.a
)
Volatility (Standard deviation %)
Australian large-and mid-caps
00 2 64 8 10 12 14 16 18 20
1
2
3
4
5
6
7
8
9
Australian small caps
International large- and mid-caps
International Small Companies

VanEck 8
In terms of correlation of returns between the equity asset classes, Figures 8, 9 and 10 below show the divergence of returns between international small companies and other asset classes is more observable over 10 and 20 years, highlighting the diversification benefits of employing an international small companies strategy in a long-term diversified portfolio.
Figure 8, 9 & 10: Small-companies versus mid- and large- companies Correlation 5 years
IndexInternational small-caps
Australian large- and mid-caps
Australian small-caps
International large- and mid-caps
International small-caps 1.00
Australian large- and mid-caps 0.81 1.00
Australian small-caps 0.81 0.89 1.00
International large- and mid-caps 0.91 0.74 0.71 1.00
Correlation 10 years
IndexInternational small-caps
Australian large- and mid-caps
Australian small-caps
International large- and mid-caps
International small-caps 1.00
Australian large- and mid-caps 0.62 1.00
Australian small-caps 0.62 0.83 1.00
International large- and mid-caps 0.91 0.55 0.51 1.00
Correlation 20 years
IndexInternational
small-capsAustralian
large- and mid-capsAustralian small-caps
International large- and mid-caps
International small-caps 1.00
Australian large- and mid-caps 0.63 1.00
Australian small-caps 0.58 0.85 1.00
International large- and mid-caps 0.88 0.55 0.45 1.00
Source: Morningstar Direct; to 31 March 2021. International small caps – MSCI World ex Australia Small Caps Index; International mid- and large caps – MSCI World ex Australia Index; Australian small caps – S&P/ASX Small Ordinaries Index; Australian mid- and large caps – S&P/ASX 100 Index. Results are calculated monthly and assume immediate reinvestment of all dividends. You cannot invest in an index. Past performance is not a reliable indicator of future performance of the indices or QSML.
It is also important to understand that size is a relative term. Some of the ‘small’ companies in International Small Cap Index are bigger than the large caps in the S&P/ASX 100 Index, however in the country of their principal listing they are outside the 85% target coverage of the large- and mid-cap benchmark that is the MSCI World ex Australia Index.
Finding the pawns that will become Queens 9
Accessing international small companiesHaving now established the investment rationale for including international small companies as part of a long-term diversified equity portfolio, investors must consider the different investment options available. To date choice has been limited to market capitalisation index-tracking passive funds and expensive active managers.
Active managers have been able to achieve outperformance investing in international small companies, for the same reason active managers focussing on Australian small companies have been more successful7 than their large capitalisation peers: small companies are generally under researched, so the equity market is inefficient. This leads to mispricing which creates outperformance opportunities.
An international small market capitalisation passive approach involves tracking the performance of over 4,000 companies that make up the International Small Cap Index, or a representative or optimised sample. The benchmark, as evidenced by active manager outperformance, includes companies that are not attractive from an investment point of view. However, the same is true when you consider the international large- and mid-cap universe; not all of the 1,500 plus in the MSCI World ex Australia Universe are attractive from an investable point of view.
One factor approach that has shown historical outperformance in the large- and mid-cap universe is quality.8
Research shows the same is true in small companies.
In his paper Quality Investing, Robert Novy-Marx set out to identify quality by assessing the best known quality strategies. He did this by assessing quality metrics across the market capitalisation spectrum.9 Novy-Marx created ‘quality’ strategies constructed from the US-focussed Russell 1000 and the Russell 2000 indices. He then compared these ‘quality’ strategies against their respective parent benchmarks and analysed the performance using regression analysis. Regression analysis is a statistical method used to explain why something happened in relation to something else, in this instance quality fundamentals in relation to the broader US equity market.
The Russell 1000 represents approximately 92% of the total market capitalisation of all stocks listed in the US equity market. These are the largest 1,000 companies of the Russell 3000. The Russell 2000 Index represents stocks 1,001 to 3,000. It is the benchmark index for small companies in the US equity market.
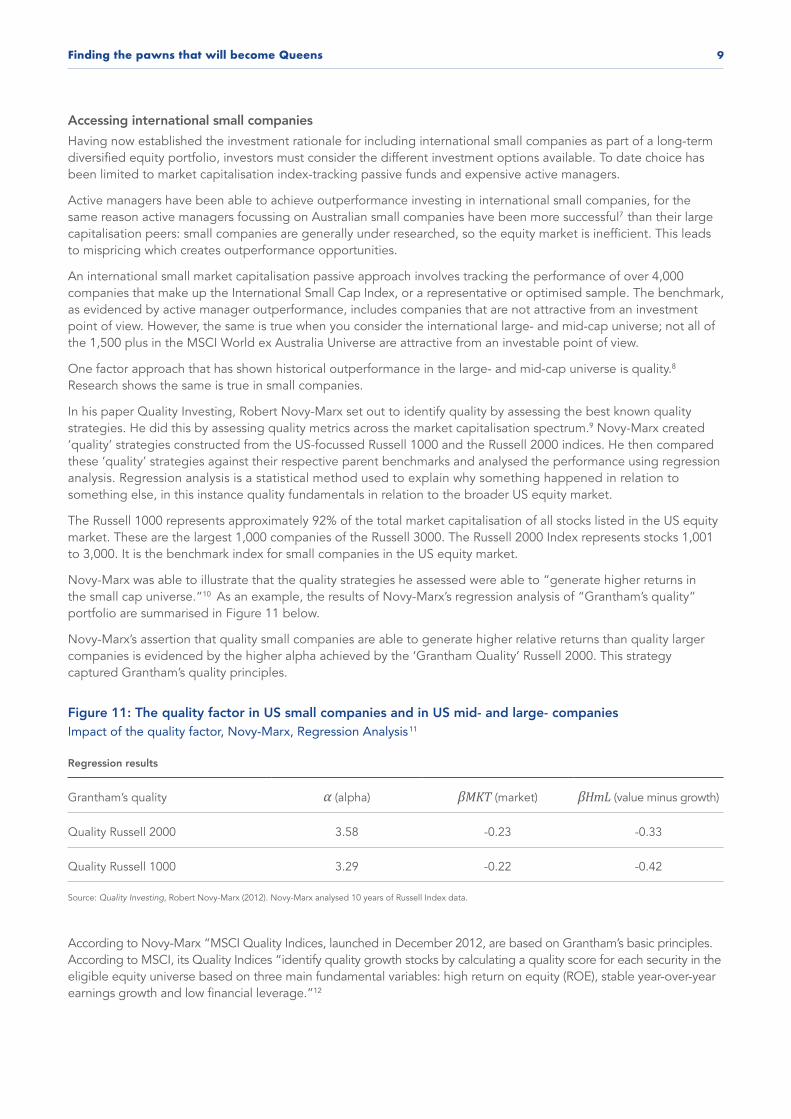
Novy-Marx was able to illustrate that the quality strategies he assessed were able to “generate higher returns in the small cap universe.”10 As an example, the results of Novy-Marx’s regression analysis of “Grantham’s quality” portfolio are summarised in Figure 11 below.
Novy-Marx’s assertion that quality small companies are able to generate higher relative returns than quality larger companies is evidenced by the higher alpha achieved by the ‘Grantham Quality’ Russell 2000. This strategy captured Grantham’s quality principles.
Figure 11: The quality factor in US small companies and in US mid- and large- companies Impact of the quality factor, Novy-Marx, Regression Analysis11
Regression results
Grantham’s quality α (alpha) βMKT (market) βHmL (value minus growth)
Quality Russell 2000 3.58 -0.23 -0.33
Quality Russell 1000 3.29 -0.22 -0.42
Source: Quality Investing, Robert Novy-Marx (2012). Novy-Marx analysed 10 years of Russell Index data.
According to Novy-Marx “MSCI Quality Indices, launched in December 2012, are based on Grantham’s basic principles. According to MSCI, its Quality Indices “identify quality growth stocks by calculating a quality score for each security in the eligible equity universe based on three main fundamental variables: high return on equity (ROE), stable year-over-year earnings growth and low financial leverage.”12

VanEck 10
For small companies MSCI, in partnership with VanEck, has created the MSCI World ex Australia Small Cap Quality 150 Index (QSML Index) which includes 150 of the world’s highest quality small companies based on the same key fundamentals used for its Quality indices.
To determine the efficacy of the quality approach to international small companies beyond the US Russell 3000, we conducted similar regression analysis to Novy-Marx on the international equity universe by comparing the QSML Index and the MSCI World ex Australia Quality Index to their respective parent benchmarks.
Figure 12 below illustrates the respective alpha generated after stripping out performance attributed to market and value/growth tilts using MSCI indices. Over ten years to 31 March 2021, QSML Index generated 3.22% alpha per annum, higher than MSCI World ex Australia Quality Index alpha. Negative β_HmL coefficient highlights that both quality strategies' performance is derived from growth.
Figure 12: The quality factor in international small companies and in international mid- and large- companies Impact of the quality factor, VanEck Regression Analysis
Coefficient
Index α (alpha) βMKT (market) βHmL (value minus growth)
MSCI World ex Australia Small Cap Quality 150 Index (QSML Index)
3.22% 1.01 -0.32
MSCI World ex Australia Quality Index (QUAL Index)
3.11% 0.95 -0.24
Source: VanEck Research, 10 years ending March 2021. VanEck replicated Novy-Marx’s methodology to capture international small companies beyond US. Past performance is not a reliable indicator of future performance. You cannot invest directly in an index.
This is consistent with Novy-Marx’s findings. The alpha of quality international small companies is higher than the alpha of quality large international companies.

Finding the pawns that will become Queens 11
Figure 13: International quality small companies’ performance Cumulative hypothetical performance comparison (%)
Source: Morningstar Direct, as at 31 March 2021. The above graph is a hypothetical comparison of performance of the MSCI World ex Australia Small Cap Quality 150 Index (“QSML Index”) and the MSCI World ex Australia Small Cap Index (“Parent Index”), from the Parent Index base date 29 December 2000. QSML Index performance prior to its launch in December 2020 is simulated based on the current index methodology. Results are calculated to the last business day of the month and assume immediate reinvestment of all dividends and exclude fees and costs associated with investing in QSML. You cannot invest in an Index. Past performance is not a reliable indicator of future performance of the indices or QSML. The Parent Index is shown for comparison purposes as it is the widely recognised benchmark used to measure the performance of developed market small companies, weighted by market cap. QSML Index measures the performance of 150 companies selected from the Parent Index based on MSCI quality scores. Consequently the QSML Index has fewer companies and different country and industry allocations than the Parent Index.
%
QSML Index MSCI World ex Australia Small Cap Index
-200
0
200
400
600
800
1,000
Dec
200
0
Sep
t 200
1
Jul 2
002
May
200
3
Mar
200
4
Jan
2005
No
v 20
05
Sep
t 200
6
Jul 2
007
May
200
8
Mar
200
9
Jan
2010
No
v 20
10
Sep
201
1
Jul 2
012
May
201
3
Mar
201
4
Jan
2015
No
v 20
15
Sep
201
6
Jul 2
017
May
201
8
Mar
201
9
Jan
2020
No
v 20
20
VanEck Vectors MSCI International Small Companies Quality ETF (ASX: QSML)You can now invest in 150 quality small companies identified by MSCI via the VanEck Vectors MSCI International Small Companies Quality ETF (ASX: QSML), which tracks the QSML Index.
VanEck 12
SummaryInvesting in international small companies can provide Australian investors with important diversification benefits and growth potential. To date, Australian investors have preferred local small companies over international small companies despite the better risk/return characteristics of international small companies.
One of the reasons investing in international small companies has been prohibitive for Australian investors is that until now the choice on ASX has been limited to market capitalisation based index trackers, which include the good stocks with the bad.
QSML addresses this by only including 150 of the highest quality small-cap companies based on MSCI’s quality characteristics:
i. High Return on Equity (ROE);
ii. Stable year-on-year earnings growth; and
iii. Low financial leverage.
The quality factor has been shown to generate higher alpha in international small companies than international large companies.
It’s important to remember too, that every large-cap ‘Queen’ was once a pawn who reached the eighth rank. At the start of any chess game any pawn has the potential to become a queen.
It’s important to remember too, that every large-cap ‘Queen’ was once a pawn who reached the eighth rank. At the start of any chess game any pawn has the potential to become a queen.
1. VanEck WhitePaper (2020) The long term case for Quality2. See: Rolf Banz (1981) The relationship between return and market value of common stocks, Journal of Financial Economics, Vol 9 Issue 1; Donald Keim (1983)
Size-related anomalies and stock return seasonality: Further empirical evidence, Journal of Financial Economics, Vol 12 Issue 1; and Richard Roll (1983) Vas ist das? The turn of the year effect and the return premia of small firms, Journal of Portfolio Management, Vol 9, issue 2.
3. Ron Alquist, Ronen Israel, and Tobias Moskowitz (2018) Fact, Fiction, and the Size Effect, Journal of Portfolio Management, Vol 45, issue 14. Morningstar Direct, Asset Flows, Australia Funds ex ETFs, Global Broad Category Group: Australian Equity minus real estate.5. Morningstar Direct, Asset Flows, International Funds ex ETFs, Global Broad Category Group: International Equity minus real estate.6. Statistica, Distribution of countries with largest stock markets worldwide as of January 2021, by share of total world equity market value7. S&P Dow Jones Indices (2021) SPIVA® Australia Year-End 2020 Scorecard8. Abhishek Gupta, Altaf Kassam, Raghu Surtanarayanan, Katalin Varga (2014) Index Performance in Changing Economic Environments, MSCI Research Insight9. Novy-Marx, Robert. 2012 (revised 2014). “Quality Investing.” Working Paper10. ibid11. ibid12. ibid

Finding the pawns that will become Queens 13
Important notice:VanEck Investments Limited ACN 146 596 116 AFSL 416755 (‘VanEck’) is the responsible entity and issuer of units in the VanEck Vectors MSCI International Small Companies Quality ETF (QSML). This is general advice only, not personal financial advice. Read the PDS and speak with a financial adviser to determine if a fund is appropriate for your circumstances. The PDS is available at www.vaneck.com.au.
An investment in QSML has risks, including possible loss of capital invested. QSML carry risks associated with: financial markets generally, individual company management, industry sectors, ASX trading time differences, foreign currency, country or sector concentration, political, regulatory and tax risks, fund operations and tracking an index. See the PDS for details. No member of the VanEck group guarantees the repayment of capital, the payment of income, performance, or any particular rate of return from either fund.
QSML and QUAL are indexed to a MSCI index. The funds are not sponsored, endorsed or promoted by MSCI, and MSCI bears no liability with respect to QSML or the MSCI World ex Australia Small Cap Quality 150 Index, or QUAL or the MSCI World ex Australia Quality Index. The PDS contains a more detailed description of the limited relationship MSCI has with VanEck, QSML and QUAL.
© 2021 VanEck Australia Pty Ltd. All rights reserved.
Contact usvaneck.com.au
+61 2 8038 3300
VanEck-Australia
VanEck_Au
VanEckAus
VanEckAustralia