finding jobs for people, and people for jobs: building a...
TRANSCRIPT
Finding Jobs for People, and People for Jobs:
Building a Labour Market Information System to
Facilitate Job Matching
by
Balraj Singh Kahlon
B.A. (Economics), Simon Fraser University, 2012
Capstone Submitted in Partial Fulfillment of the
Requirements for the Degree of
Master of Public Policy
in the
School of Public Policy
Faculty of Arts and Social Sciences
Balraj Singh Kahlon 2014
SIMON FRASER UNIVERSITY
Spring 2014

ii
Approval
Name: Balraj Singh Kahlon
Degree: Master of Public Policy
Title: Finding Jobs for People, and People for Jobs: Building a Labour Market Information System to Facilitate Job Matching
Examining Committee: Chair: Nancy Olewiler Director, School of Public Policy, SFU
Dominique M. Gross Senior Supervisor Professor
J. Rhys Kesselman Supervisor Professor
John Richards Internal Examiner Professor
Date Defended:
March 13, 2014

iii
Partial Copyright Licence

iv
Abstract
This study explores ways to support job matching in Canada. Many individuals
experience difficulty in finding work related to their skills and training; likewise many
Canadian employers are experiencing difficulty finding skilled workers. This mismatch is
attributed to an inadequate labour market information system. An examination of three
jurisdictions is used to identify the specific inadequacies that hinder job matching in
Canada. To address these inadequacies, three policy options are assessed on their
ability to meet four criteria. Results indicate that a comprehensive survey on job
vacancies and career information seminars in secondary schools can help mitigate the
mismatch in the labour market. I recommend immediately implementing a new job
vacancy survey and career information seminars in secondary schools. The government
should also give future consideration for establishing an independent agency
responsible for labour market information.
Keywords: labour market; mismatch; information; job matching

v
Dedication
To everyone who has helped me along the way.

vi
Acknowledgements
I want to first thank my supervisor Dr. Dominique Gross who challenged me to
reach my potential and taught me a great deal. The time and effort you dedicated in
helping make this capstone a success is very much appreciated. I would also like to
thank Dr. John Richards whose critical questions and comments during my defence
helped strengthen this capstone.
Finally, I want to acknowledge the MPP faculty. For two years you have shared
your expertise and knowledge to support my development. For this I am grateful and
hope to use the skills and knowledge I gained towards making a positive contribution.

vii
Table of Contents
Approval .......................................................................................................................... ii Partial Copyright Licence................................................................................................ iii Abstract .......................................................................................................................... iv
Dedication ....................................................................................................................... v
Acknowledgements ........................................................................................................ vi Table of Contents ...........................................................................................................vii List of Tables .................................................................................................................. ix
Executive Summary ........................................................................................................ x
1. Introduction............................................................................................................ 1
2. Labour Market Information ................................................................................... 3
2.1. The Role of Labour Market Information .................................................................. 3
2.2. The Need for a Labour Market Information System ................................................ 4
3. Labour Market Information Sources..................................................................... 6
3.1. Shared Responsibility ............................................................................................. 6
3.2. Labour Demand Information Sources ..................................................................... 8
3.3. Labour Supply Information Sources ...................................................................... 13
4. Labour Concerns in Canada ............................................................................... 15
4.1. Demand Side Perspective .................................................................................... 15
4.2. Supply Side Perspective ....................................................................................... 16
4.3. Policy Problem ..................................................................................................... 19
5. Features of an Optimal Labour Market Information System ............................. 21
5.1. Data Elements ...................................................................................................... 21
5.1.1. Standard Labour Market Data ................................................................... 22
5.1.2. Demand Data ............................................................................................ 22
5.1.3. Occupational Characteristics ..................................................................... 22
5.1.4. Occupational Supply ................................................................................. 23
5.1.5. Education and Training ............................................................................. 23
5.1.6. Crosswalks and Linkages Across Data Sets ............................................. 23
5.2. Structural Features ............................................................................................... 23
5.2.1. Governance .............................................................................................. 24
5.2.2. Data Quality .............................................................................................. 24
5.2.3. Analysis and Interpretation ........................................................................ 24
5.2.4. Data Dissemination ................................................................................... 25

viii
6. Methodology ........................................................................................................ 26
6.1. Case Study Selection ........................................................................................... 26
6.2. Evaluation Framework .......................................................................................... 27
7. Analysis ................................................................................................................ 31
7.1. Case Study 1: Australia ........................................................................................ 31
7.1.1. Data Elements .......................................................................................... 31
7.1.2. Key Components ...................................................................................... 34
7.2. Case Study 2: Germany ....................................................................................... 37
7.2.1. Data Elements .......................................................................................... 37
7.2.2. Key Components ...................................................................................... 39
7.3. Case Study 3: Switzerland .................................................................................... 42
7.3.1. Data Elements .......................................................................................... 42
7.3.2. Key Components ...................................................................................... 44
8. Summary of Analysis .......................................................................................... 50
8.1. Comparison of Cases ........................................................................................... 50
8.2. What is Missing in Canada ................................................................................... 51
9. Policy Objectives, Criteria, and Measures ......................................................... 54
9.1. Criteria and Measures .......................................................................................... 54
10. Policy Options and Analysis ............................................................................... 59
10.1. Policy Option 1: Job Vacancy Survey ................................................................... 59
10.2. Policy Option 2: Career Information Seminars in Secondary Schools ................... 61
10.3. Policy Option 3: Independent Agency for Labour Market Information.................... 63
10.4. Policy Recommendation ....................................................................................... 67
11. Conclusion ........................................................................................................... 69
References ................................................................................................................. 71
Appendix A: Witness testimony to the House of Commons Standing Committee .......... 76
Appendix B: Canadian National Occupation System ..................................................... 77
Appendix C: Findings from W.E. Upjohn Institute and NSDC India ................................ 78
Appendix D: Optimal labour market information system ................................................ 79
Appendix E: NEET rates among the OECD, aged 15/16- 24,all persons (%)................. 81

ix
List of Tables
Table 1: Labour market information provided by federal government agencies ............... 9
Table 2: Unemployment-to-job vacancy ratio and job vacancy rate by industry (June 2013) ...................................................................................................... 11
Table 3: 2013 youth (age 15 to 24) unemployment rate by educational attainment ....... 17
Table 4: Case study selection criteria ............................................................................ 26
Table 5: Data elements of an optional LMI system ........................................................ 29
Table 6: Key components of an optimal LMI System ..................................................... 30
Table 7: Summary of case study analysis: data elements ............................................. 47
Table 8: Summary of case study analysis: key components .......................................... 49
Table 9: Criteria and measures for policy analysis ........................................................ 55
Table 10: Summary of policy analysis ........................................................................... 66

x
Executive Summary
Canada has one of the highest educational attainment rates among OECD
countries. However, many educated individuals experience difficulty finding work.
Unfortunately, for these individuals there is low demand for their skill set. Likewise, many
employers and industries are experiencing a worker shortage. This shortage is expected
to persist in many occupational fields. As a result, there is a mismatch in the Canadian
labour market. This mismatch exists despite multiple sources that collect data to
understand labour market conditions.
Despite numerous information sources, the information system in Canada is
inadequate to match labour supply with labour demand. This study investigates how
Canada can better facilitate job matching and avoid labour market mismatches. To find
solutions, three cases are examined to identify practices that best support job matching:
Australia, Germany, and Switzerland. My analysis first examines the labour data
collected in each country, and then the key features of the respective labour market
information systems. The analysis revealed that all three cases obtain detailed
information about job vacancies. Additionally, to support job matching, the case
countries devote considerable resources towards counselling students. Germany and
Switzerland also have organizations that are responsible for providing reliable
information about the labour market.
The findings from the case study analysis motivated the following policy options:
1. Job Vacancy Survey
Current information on job vacancies is limited and unreliable. Canada
must develop a job vacancy survey to collect comprehensive data about labour
demand. A new job vacancy survey will complement the labour force survey to
help identify causes of structural unemployment and other labour market issues.
More importantly, reliable information about job vacancies will support job
matching.

xi
2. Career Information Seminars and Sessions in Secondary Schools
Canada needs to devote more resources towards counselling students.
This policy option proposes that secondary schools offer students career
information seminars and one-on-one sessions. The seminars can provide
students with information about the economy and labour market; projected
growth of major occupations and industries; careers and employment prospects
associated with different fields of study; and wage expectations. In the one-on-
one sessions, students can inquire about specific career and education paths
and get support for career exploration.
3. Independent Agency Responsible for Labour Market Information
The labour market information system in Canada is inefficient with
multiple providers. This option proposes to establish an independent agency
responsible for collecting, analyzing, and disseminating information about the
labour market. This can create a more efficient system that provides quality
information. Above all, this agency can be a source of comprehensive and
reliable information for schools and provincial employment service offices.
An analysis of these three policy options helped determine recommendations to
address the problem. The options are assessed on the following criteria: development,
equity, administrative complexity, and budgetary impact. Given my policy analysis, I
recommend to implement a new job vacancy survey and career information seminars
and sessions in secondary schools. These policies are simple and inexpensive to
implement. I also suggest future consideration for developing an independent agency
responsible for labour market information. My analysis indicates that a new agency
would be effective, but also costly and complex. Overall, these recommendations will
improve Canada’s ability to support job matching. Moreover, they provide a foundation to
build a system to better align supply and demand in the labour market.

1
1. Introduction
The economy, especially job creation, is a constant priority for Canadian
governments. Creating a robust economy that provides stable well-paying jobs, and
decreases unemployment levels seems challenging in an increasingly competitive global
economy. Despite the difficulty of creating jobs many industries in Canada are currently
having trouble filling vacant positions. Federal Government projections indicate that skill
shortages will persist, if not increase, in many occupational fields. In addition to unfilled
jobs, many Canadians – especially youth – find it difficult finding employment because
they received training and skills that have low employment prospects. Unfortunately,
many people only learn about their employment prospects once entering the labour
market. This suggests governments should not only be concerned with creating jobs, but
also address the mismatch in the labour market.
Every market requires information to operate efficiently. However, the labour
market mismatch suggests the Canadian labour market information system does not
support job matching. This is despite multiple providers of information in Canada. This is
likely a consequence of not assigning any formal responsibility for labour market
information. As a result, the Canadian system is fragmented and uncoordinated between
provincial and federal government departments. Canada must invest in building a
stronger information system to create a more efficient labour market.
This study identifies the specific inadequacies of the Canadian labour market
information system that prevent job matching. The research is based on the analysis of
case studies. The case studies examine the information system in three jurisdictions:
Australia, Germany, and Switzerland. The analysis reveals best practices that are not
used in Canada.

2
This study is organized as follows: Section 2 discusses the importance of labour
market information, and why countries need a quality labour market information system.
Section 3 describes the divided responsibilities and multiple sources of information in
Canada. From there section 4 discusses the concerns in the labour market, and defines
the policy problem that must be address. The features of an optimal system are
explained in section 5. Section 6 explains the methodology employed in this study.
Section 7 analyses the cases, while section 8 summarizes the analysis results. Next,
section 9 establishes policy objectives, and criteria used to assess policy options. The
policy options are presented and analyzed in section 10. Section 11 provides concluding
remarks.

3
2. Labour Market Information
Information is vital for any market to operate efficiently. A common problem in
many markets is the lack of information, which in turn generates inefficient behaviours.
This section first discusses the important role labour information plays in creating a well-
functioning labour market and economy. From there I discuss why countries need a
quality labour market information system. There is no formal definition of labour market
information. Given that, this study considers Labour Market Information to be the
knowledge, facts, data, and relevant institutional information on the labour supply and
labour demand (Advisory Panel on Labour Market Information, 2009).
2.1. The Role of Labour Market Information
For job seekers information lowers the possibility of unemployment, and thus lost
earnings. Employers can experience fewer skill shortages and lower turnover rates. Job
mismatches can also result in underutilized skills if a person winds up working in a field
unrelated to his or her studies. The mismatches may vary across industries and
occupations, but nonetheless they are a hindrance to economic development because
firms cannot grow, and job seekers experience lost income. Producing and sharing
labour information with all participants in the labour market can reduce skills mismatches
(OECD, 2012a).
Job matching theory (Heijke, 1996) argues that the productivity of workers
depends on the skills and abilities required for their occupation. This means the
productive value of a person’s education depends on the occupation. Workers can utilize
their comparative advantage by applying their skills and knowledge where they are most
applicable. According to the job matching theory this match is difficult to achieve due to
inadequate information about skills required by employers, and those possessed by
workers. Moreover, timely and quality labour market information can facilitate labour

4
market adjustments (Sharpe and Qiao 2006). Facilitating an efficient allocation can
enhance a country’s productivity, competitiveness, and economic growth (Sharpe and
Qiao, 2006). High quality information made available can also help people navigate
more efficiently through the education system. Given the diversity of education options,
good information helps students make the optimal choice. This means students can
base their choices on future labour market situations, opposed to current labour market
conditions.
In summary, labour market information can generate more efficient allocation of
workers in the economy because inadequate information can create higher costs for job
seekers and employers. The potential for a more efficient labour market highlights the
importance of quality information on the demand for labour, and employment prospects
as well as knowledge and skills of the workforce.
2.2. The Need for a Labour Market Information System
An effective labour market information system can bring widespread benefits.
Good information helps young people effectively career plan, which can save them time
and money. An effective labour market information system can also give a competitive
advantage (Miner, 2012) by helping employers anticipate future recruitment problems,
adjust human resource policies, and adjust expansion and investment plans (Brisbois et.
al., 2008). Not to mention good information can help governments be responsive to
employers labour concerns. All these benefits for employers’ means an effective labour
market information system is conducive to economic growth.
As the economy changes, new jobs will be created and many current jobs will
have new skill requirements. The emerging knowledge based economy places a
premium on advanced education and skills (Miner 2012). Miner (2012) assumes that
approximately 80% of the Canadian workforce needs to be skilled (have some form of
post-secondary education) by 2031. This means Canada must further increase
education levels despite its already high education attainment rates. In 2011, 51% of the
Canadian adult population possessed a college or university education, highest among
OECD countries (OECD, 2013). However, simply increasing educational attainment

5
rates is insufficient; Canada must also better match the skills of job seekers with the
needs of employers. According to Miner (2012) Canada does not have a labour market
information system necessary to help align labour supply and demand. To effectively
match supply and demand in the labour market will require significant reforms to
education system. For schools to provide students the skills that match economic needs
requires good labour market tracking.
Income inequality and the situation of disadvantaged populations is a growing
concern in many countries. Given the rising demand for higher skilled labour, financial
security will become increasingly difficult for people without a post-secondary education.
This is supported by federal government projections that suggest employment prospects
for individuals with only high-school diploma will decrease (HRSDC, 2011). Miner (2012)
argues Canada must increase the participation and skill level of groups under-
represented in the labour market; otherwise Canada will have a large number of
unskilled workers with bleak employment prospects. Unfortunately, many people still do
not understand that higher education will be a necessity (Miner, 2012). Providing
individuals with labour market information may help them appreciate the importance of
education to find employment.
Overall a quality labour market information system can help young people move
quickly through the education system and save time and money. Furthermore, it will
reduce their likelihood of experiencing lost wages due to unemployment and
underemployment. Most importantly, a quality system informs everyone on the skills
required to compete in an increasingly competitive economy. Firms can also make more
informed decisions for business development, and governments can gain an accurate
picture of labour problems.
In Canada, inadequate information makes it difficult for governments to
effectively address the skills problem facing many industries. For example, in 2013 the
federal government proposed The Canada Job Grant Program to address the current
skills shortage. However, there is no evidence of a skills shortage that requires the type
of training the program supports (Mendelson and Zon, 2013). The lack of quality labour
information has resulted in a program that The Mowat Centre for Public Policy describes
as “deeply flawed public policy” (Mendelson and Zon, 2013).

6
3. Labour Market Information Sources
This section provides an overview of the current labour market information
system in Canada. I first discuss the different contributors of labour information the
federal government, provincial governments, and private sector entities. Then, I derive
what labour information is available for the employers and workers in Canada.
3.1. Shared Responsibility
In Canada, no level of government is responsible for providing labour market
information.1 As a result, three entities, the federal government, provincial governments,
and private sector firms and associations, provide various forms of information. The
federal government has a significant role in the production and dissemination of labour
market information and is responsible for national labour market development. This
includes interprovincial labour mobility, industry councils, and labour exchange systems
to match job seekers and vacancies. Four federal government departments provide
labour market information: Statistics Canada, Employment and Social Development
Canada (ESDC; formerly Human Resources and Skills Development Canada, HRSDC),
Citizenship and Immigration Canada, and Industry Canada.
In 1996, the federal government signed labour market development agreements
with the provinces, which gave them responsibility for active labour programs. However,
these agreement and subsequent ones do not address the jurisdictional responsibility for
labour market information. Provincial governments mainly use labour market information
to develop their labour policies and programs. Canadian provinces and territories agree
on specific aspects of labour market information that need improvement:
1 Information for this section is from Advisory Panel on Labour Market Information (2009)-unless
otherwise indicated.

7
* First, labour market information to support labour supply and demand analysis
to identify shortage and surplus. This includes data on postsecondary students and
graduates by program, data on interprovincial migration by education and occupation,
and inter-occupational mobility.
* Second, reliable information on what employers need from current and potential
employees to identify skills gaps.
* Third, employer information on job vacancies, current and emerging education
and skills requirements, turnovers, and retirement trends.
* Fourth, information on transitions (school-to-work, work-to-school, full-time to
partial retirement, re-skilling) to identify supports needed and transition effects on the
labour market.
Some provinces coordinate with the federal government for labour market
information, but the level of coordination varies significantly. Atlantic Canadian provinces
(New Brunswick, Prince Edward Island, Nova Scotia, and Newfoundland and Labrador)
have the strongest partnership with the federal government. These provinces lack the
capacity to collect and analyze labour shortages or conduct labour imbalance
estimations for every occupation. Given Atlantic provinces also experience significant
outward migration, they need information on inter-provincial migration to western
Canada. The remaining Canadian provinces rely less on the federal government for
labour market information. This leads to significant heterogeneity of the type of
information collected across the provinces. For instance, information on occupational
employment forecasts vary with respect to timeliness, number of occupations, time
horizon, sub-provincial breakdowns, quantity and quality of background information, and
descriptor of occupational prospects. The most detailed forecasts are provided by
Alberta, Quebec, and New Brunswick. In contrast Atlantic Provinces lack the data and
capacity to conduct labour supply-demand imbalance estimates for all occupations.
A number of private sector entities also provide labour market information.
Business and trade associations compile industry-specific data for their member to
inform policy advocacy efforts. Associations primarily survey employers for qualitative
forecasts but certain large associations also provide quantitative forecasts. Organized
8
labour unions provide labour market information from a worker-based perspective, used
primarily for collective bargaining purposes and job matching assistance for laid-off
workers. Private employment websites that provide job openings also provide labour
market information. A few online employment websites have sufficient scales of job
postings to give a rough estimate of market demand. However, private-sector entities
cannot produce information at a scale that gives a complete picture of labour demand.
Furthermore, the inability to profit from providing labour market information creates no
incentive for the private sector to produce comprehensive labour information.
The Canadian labour market information system has multiple contributors with
little coordination. The current labour market information system in Canada can lead to
inefficiencies and limited effectiveness. Inefficiencies stem from different sources
obtaining the same necessary information; this creates potential overlap and duplication
of information. Job seekers and employers have to search for labour market information
from numerous sources. Also, if multiple contributors are using different standards and
methodologies, that can create inconsistencies and unequal levels of quality. This can
result in inaccurate information for certain regions or industries. Furthermore, having
numerous providers can also create contradictory information. For instance, ESDC
labour projections suggest a shortage of dentists that will persist into the next decade.
However The Canadian Dental Association contends there is no shortage of dentists in
Canada (House of Commons Committee, 2012).
3.2. Labour Demand Information Sources
As indicated earlier, the federal government has a number of different sources to
evaluate labour demand in Canada. Statistics Canada conducts a number of monthly
surveys: Labour Force Survey (LFS), Business Payroll Survey (BPS), Survey of
Employment, Payrolls and Hours (SEPH). The Labour Force Survey is a monthly
nationwide survey of people aged 15 and over and excludes persons living on aboriginal
reserves, full-time members of Canadian Forces, and institutionalized people
(approximately 2% of population). The purpose of the survey is to provide standard
labour data including unemployment rate, employment rate, and participation rate. In
terms of labour demand information, the labour force survey provides information on

9
employment trends across industries and firm size information is collected from
employees.
The Business Payroll Survey collects information on job vacancies, payroll
employment, paid hours and earnings. The Survey of Employment, Payrolls and Hours
(SEPH) provides information on the amount of earnings and occupied positions, vacant
positions, and hours worked by industry. SEPH is based on the Business Payroll Survey
and a census of payroll deductions. The census of payroll deductions is provided by the
Canada Revenue Agency. The federal government also eliminated other labour data
sources such as the long form census and the Workplace and Employer Survey. The
Conservative government discontinued the mandatory long form census citing privacy
concerns (IRPP, 2010); it was replaced with a voluntary National Household Survey. The
long form census collected data on education and detailed labour market characteristics.
Information from The Workplace and Employer Survey included employer investment in
training, labour mobility within firms, and employee turnover and vacancy rates.
Table 1: Labour market information provided by federal government agencies
Federal Agency Name(s) Description
Statistics Canada
- Labour Force Survey (LFS)
- Business Payroll Survey (BPS)
- Survey of Employment, Payrolls and Hours (SEPH)
- Employment Insurance Statistics (EIS)
- Job Vacancy Statistics
- National Household Survey
Nation-wide surveys produced monthly.
ESDC Canadian Occupation Projections System
Labour supply and demand projections over a 10-year span by skill level and occupation.
Citizenship & Immigration Canada
Working in Canada (website)
- Canadian employers post job vacancies.
- Produced jointly with ESDC Canada
Industry Canada Canadian Industry Statistics (CIS) Measures labour productivity by Industry

10
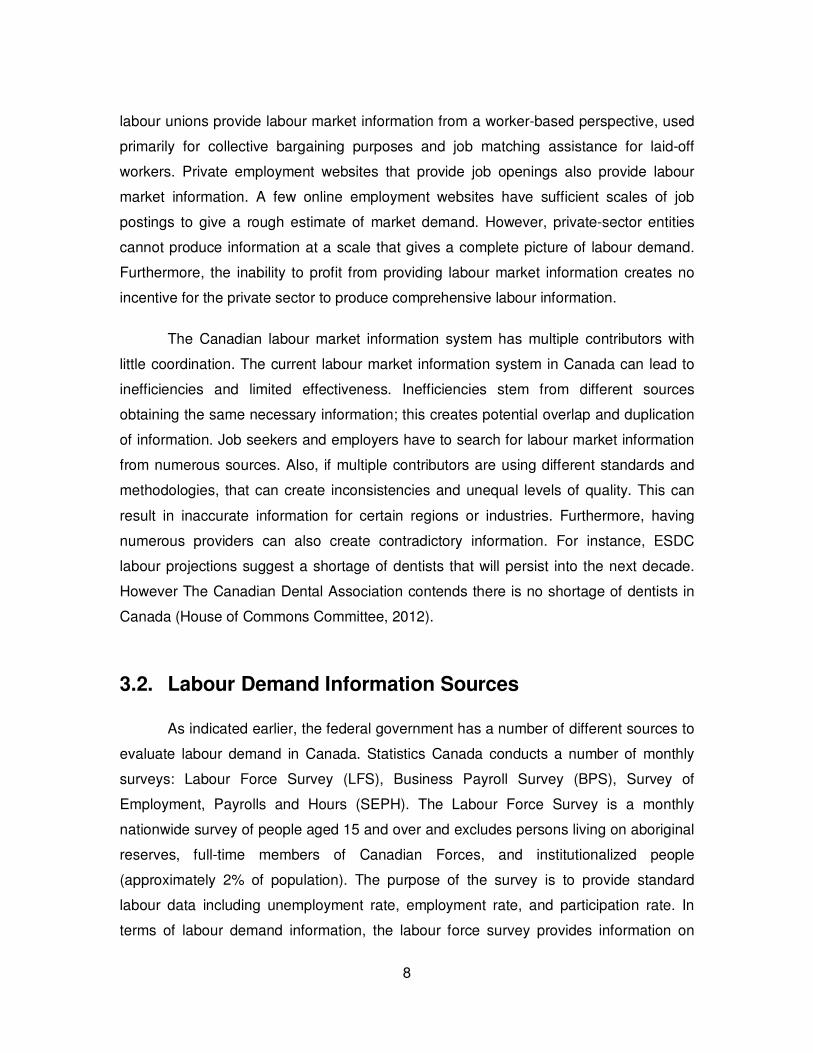
Statistics Canada uses the BPS and SEPH to produce job vacancy statistics that
provide trends in job demand. Job vacancy statistics comprise of two measures: the
unemployment-to-job vacancy ratio and job vacancy rate. The unemployment-to-job
vacancy ratio measures the number of unemployed people available for each job
vacancy, and is therefore a measure of shortage of labour. This means the higher the
unemployment-to-job vacancy ratio, the more competitive the job market is in that
industry. The job vacancy rate is the number of job vacancies as a percentage of labour
demand (occupied positions and vacant positions). In other words the job vacancy rate
measures the percent of the labour demand that is unmet. Table 2 shows the
unemployment-to-job vacancy ratio and job vacancy rate for Canada in June 2013. For
illustrative purposes only figures for Canada are discussed, and figures for provinces
and territories are not. An industry with a high unemployment-to-job vacancy ratio and
low job vacancy rate should be experiencing a surplus of workers. This suggests,
according to table 2, there is an oversupply of workers in educational services (row 15),
construction (row 4) and manufacturing (row 5) sectors. Likewise an industry with a low
unemployment-to-job vacancy ratio and high job vacancy rate is likely experiencing a
shortage of workers. For example, the professional, scientific and technical services
sector (row 12) seems to have the greatest demand for – and shortage of workers.
11
Table 2: Unemployment-to-job vacancy ratio and job vacancy rate by industry
(June 2013)
Industry unemployment-to-job
vacancy ratio job vacancy
rate
1. Forestry, logging and support F F
2. Mining, quarrying, and oil and gas extraction F F
3. Utilities F F
4. Construction 8.2D 1.4D
5. Manufacturing 5.7C 1.1C
6. Wholesale trade 4.4D 1D
7. Retail trade 3.9C 1.4C
8. Transportation and warehousing 3.4D 1.4D
9. Information and cultural industries 3.1E 2.1E
10. Finance and insurance 2.4E 0.9D
11. Real estate and rental and leasing 3E 1.4E
12. Professional, scientific and technical services 2.7D 2.4D
13. Management of companies and enterprises F F
14. Administrative and support, waste management and remediation services 5.1D 1.7D
15. Educational services 5.5E 0.5D
16. Health care and social assistance 1.3C 1.9C
17. Arts, entertainment and recreation 7.3E 1.9E
18. Accommodation and food services 2.8C 2.3C
19. Other services 3.3D 1.9D
20. Public administration 1.5D 1.1C
Source: Statistics Canada (2013), CANSIM Tables 284-0001 and 284-0003 Note: Letter are data quality indicators: A - Excellent; B Very good; C - Good; D – Acceptable; E - Use with caution; F - Too unreliable to publish
ESDC makes labour projections with their model The Canadian Occupational
Projection System (COPS) (ESDC, 2011). The purpose of the COPS model is to identify
occupations that may face a shortage or surplus of workers. The model measures trends
in labour supply and demand over a 10-year span by skill level and occupation. Skill
levels are defined in terms of education level: Skill level A (university education), skill

12
level B (college education or apprenticeship training), skill level C (high school
education), and skill level D (on the job training). Occupations in skill levels A and B that
require post-secondary education are classified as high-skill occupations and skill levels
C and D, low-skill occupations (ESDC, 2014). According to the COPS 2011 projections,
in the next decade, two-third of job openings will require skill level A or B (post-
secondary education) or be management occupations; the remaining one-third will only
require skill level C or D (HRSDC, 2011).
Occupations in the Canadian economy are classified according to the National
Occupational Code (NOC; HRSDC, 2013). The NOC code is a four-digit code, and each
digit specifies the occupation. At the three digit level, occupations are divided into 140
minor groups (for detailed explanation see appendix B). The COPS model found among
the minor groups, occupations expecting a labour surplus represent 25% of 2010
employment and are predominantly low-skill (skill C and D). Occupations with an
expected shortage represent 15% of 2010 employment and are predominantly high-skill
(skill A and B) occupations. For example, managers in health care and human resource
professionals are expected to experience a shortage, whereas there is an expected
surplus of carpenters and sawmill machine operators (HRSDC, 2011).
In 2013, Citizenship and Immigration Canada and ESDC developed Working in
Canada that serves as an online job bank for individuals and employers (Rai, 2013).
Employers can advertise job vacancies and individuals can search for jobs by region and
occupation. Working in Canada also provides job match services where they match
respective job ads and job profiles. Employers can receive a list of qualified candidates
and job-seekers received a list of matching job vacancies. The website also provides job
market trends at the provincial and sub-provincial levels. In addition, Aboriginal Affairs
Northern Development Canada provides career and labour market information to First
Nation and Inuit students. This information is provided under their initiatives to promote
the benefits of education and increase First Nation and Inuit representation in the
workforce.
In short, a number of sources provide information about labour demand in
Canada. Statistics Canada conducts a few surveys to obtain standard labour data.
ESDC provides 10-year labour market projections at the national level. The Working In

13
Canada website does provide information on job vacancies at sub-provincial levels and
tries to support job matching. There is no information on the skill sets and knowledge
that are in greatest demand in the economy. Despite all the information available better
information is required to support individuals, especially young people, in career
planning.
3.3. Labour Supply Information Sources
Compared to labour demand in Canada, information on labour supply is limited.
The major source of information on the workforce is Statistics Canada’s Labour Force
Survey (LFS). The survey collects information on the characteristics of the working-age
population including age, sex, marital status, educational attainment, and family
characteristics. For employed individuals the survey provides information on
demographic characteristics, industry and occupation, job tenure, and hours worked.
ESDC uses Labour Force Survey data to determine eligibility, level, and duration of
insurance benefits for individuals in a particular region (Statistics Canada, 2013b). Other
levels of government use Labour Force Survey data to evaluate and develop
employment programs (Statistics Canada, 2013b). Statistics Canada also conducts
Employment Insurance Statistics (EIS), and Employment Insurance Coverage Survey
(EICS). Employment Insurance Statistics reports on the operation of the employment
insurance programs. The Employment Insurance Coverage Survey (EICS) provides
information on who is receiving employment insurance and individuals experiencing
underemployment.
To estimate future labour supply in Canada, the ESDC Canadian Occupational
Projection System (COPS) provides medium-term labour supply projections. COPS does
not provide any projections at provincial level, only national projections. The projections
are for occupations and the broad skill (education) level in the workforce. The two
components of labour supply projections are anticipated school leavers (graduates) and
new immigrants (ESDC, 2011).
Employers can receive information on skilled immigrants from non-profit
organizations. Service Provider Organizations (SPOs) are non-profit organizations that

14
provide a number of services to help immigrants integrate into the labour market. Certain
SPOs also maintain a database of qualified immigrants for Canadian employers. An
example of an SPO facilitating job matching is Skills International, an online database of
screened and internationally qualified immigrants living in Ontario. The database
includes candidate resumes seeking employment in specific professions and
occupations. The resumes are collected and screened by SPOs and industry
associations across Ontario. Skills International also allows employers to post job
openings.
Compared to information collected on labour demand, information on labour
supply in Canada is very limited. The information is collected to support the development
of employment programs and employment insurance benefits, but it is insufficient to
support job matching. Some non-profit organizations have taken effective measures to
provide information to employers on the education and training of skilled immigrants.
However, employers do not have the same level of information for the general labour
force. The next section will discuss the concerns from both sides of the labour market
due to inadequate information.

15
4. Labour Concerns in Canada
Given the limited available labour information in Canada many employers
experience difficulty in finding workers, and many job seekers in finding employment.
This section discusses the concerns from the demand side of the labour market
(employers) and the supply side (job seekers).
4.1. Demand Side Perspective
The labour information currently available does not help address many of the
employer concerns. First, it is important to distinguish between a labour shortage and
skills shortage. Labour shortage refers to an insufficient number of people available to
satisfy employer demand in a given occupation. A skill shortage refers to the skill or work
experience of job seekers that do not match employers’ demand (Certified General
Accountants Association of Canada, 2012). Industries that are not facing a labour
shortage may be facing a skills shortage, and vice versa. For instance, the ICT sector
anticipates a severe shortage of workers who possess business skills accompanied with
their specialized training (O’Grady, 2011). On June 2012, The Canadian Chamber of
Commerce held consultations with their members concerning the labour skills shortage
(Canadian Chamber of Commerce, (2012). Four key issues emerged. First, the
relationship between educational institutions and the private sector must be stronger to
balance supply and demand for particular skilled trades and high skill occupations.
Second, Canada must upgrade the skills of the labour force and underutilized groups.
Third, the federal government should align immigration policy with local labour market
needs. Fourth, there should be an emphasis on education and workforce development
for aboriginal people (Canadian Chamber of Commerce, 2012).
A House of Commons Committee report discussed the worker shortage in four
major occupational groups: science, technology, engineering, and mathematics (STEM);

16
Information and Communication technologies (ICT), healthcare, and skilled trades
(House of Commons Committee, 2012). The report based its findings on industry
reports, testimony from industry representatives (see Appendix A for detailed
explanation), and the ESDC Canadian Occupational Projection System (COPS)
projections. According to the report, a majority of the occupational groups expect a skills
and worker shortage due to skilled workers retiring and new entrants lacking experience.
Although Canada provides information on demand in the labour market, many
employers’ needs are not met. The information gives an overall sense of the demand for
particular labour but is inadequate for job seekers. More important than the occupational
demands in the economy are the skills in demand. Certain skills are required among
several industries and occupations. However, the information available assesses the
level of education in demand, but not the specific skills.
4.2. Supply Side Perspective
Canada has a very well educated workforce. Among OECD countries, Canada
ranks first in the proportion of adults with a college education, and eighth in proportion of
adults with a university education. It also ranks third in both proportion of public
expenditure on higher education and spending per post-secondary student (OECD,
2012a). Although higher education is associated with higher paying jobs, it does not
necessarily increase the probability of obtaining employment. In Canada, with a very well
educated youth population, the 2012 youth unemployment rate was almost 15%, more
than double the national average of about 7% (Statistics Canada, 2014a). Table 3 shows
youth unemployment rates by level of education. The figures highlight the importance of
post-secondary school since the highest unemployment rates are among individuals with
no post-secondary education. Notably, youth unemployment rate is slightly higher for
people with a university degree compared to those with a post-secondary certificate or
diploma. This underlines the need to understand employment prospects associated with
different types of education. It is also important to recognize that many employed youth
are working part-time. In 2013, approximately 48% of all employed youth worked part-
time, and for those with a university degree it was approximately 29% (Statistics

17
Canada, 2014a; 2014b). Furthermore, the unemployment rate does not account for
people with jobs that do not match their education and training.
Table 3: 2013 youth (age 15 to 24) unemployment rate by educational attainment
Source: Statistics Canada (2014b), CANSIM Tables 284-0004
This mismatch can result in overqualified employees. In fact, a 2001 Statistics
Canada study found one out of every five employees with a university education worked
in a job that only required a high school education (Duval et. al., 2001). This
phenomenon means dissatisfaction for the employee, and underutilized human capital
for the country (Duval et. al., 2001).
A Statistics Canada study analyzed the number of non- student young adults
(aged 16 to 29) experiencing employment instability between 2007 and 2009
(Larochelle-Côté, 2013). Employment instability is defined as an individual employed in
2007, but with part-time, temporary employment, or no job in 2009. The study found
approximately 23% of 451,000 youth in this age interval working in 2007 experienced
employment instability in 2009. Individuals with only high school education experienced
an employment instability rate of 32%, and university graduates, 20%.2 Educational
attainment is not significantly associated with employment instability. The strongest
factors for employment stability are work experience and occupation type. Occupations
in management, business, finance, and administrative and natural science had a
significantly negative relationship with employment instability. Of note, 2007-09 is the
2 The difference is not statistical significant
Educational attainment Unemployment rate
Some high school 22.5%
High school graduate 12.6%
Postsecondary certificate or diploma 7.8%
University degree 9.1%

18
onset of the post-2008 recession which also contributed to high employment instability
among young adults.
A major factor for the difficulty of new entrants integrating into the labour market
is the lack of demand for their skill set. How employment prospects vary by education
type is important information for job seekers. In fact, a deliberative dialogue held by
Canadian Policy Research Networks found many young people are concerned about the
transition from school to the labour market (de Broucker, 2006). Youth participants also
expressed the need for more and better information on education and career options,
including vocational, trades, and entrepreneurial paths (de Broucker, 2006). Many post-
secondary institutions do provide work experience opportunities. However, many
students are unaware of their employment prospects for a given field of study after
graduation. In addition, young people are not provided information on education and
career options beyond a university degree.
The 2008 economic downturn also weakened the demand for youth labour.
During the recession young people accounted for half of all job losses, but comprised
only 16% of the labour market (O’Rourke, 2012). The economic downturn makes it
increasingly difficult for graduates to obtain employment that matches their education.
This means many young people settle for part-time, temporary, or low skill occupations
unrelated to their education. In fact, one out of three 25 to 29 year olds with a post-
secondary diploma has taken low-skilled occupations after graduation (O’Rourke, 2012).
According to COPS projections among all school leavers with a post-secondary
education only approximately 59% are expected to work in occupations that require
post-secondary education (HRSDC, 2011).
Connecting Canadians with Available Jobs is a 2013 federal government
initiative to help the skilled unemployed find work. The program specifically assists
unemployed Canadians receiving Employment Insurance (EI) connect with jobs that
match their skills in their local area. The program will also provide additional support
necessary to return to work. Employment Insurance recipients’ receive job postings and
the federal government determines what is suitable employment and a reasonable job
search effort.

19
As a conclusion, Canada has an educated and skilled labour force, but needs to
better utilize this skilled labour force. Canadians have high educational attainment but
too many experience unemployment. In fact, many young graduates find it increasingly
difficult to obtain jobs where they can utilize their education and training. In addition to
keep a job, the most important factors seem to be the occupation type and the level of
experience, not necessarily education.
4.3. Policy Problem
This research addresses the following policy problem: An inadequate labour market
information system contributes to the mismatch between labour supply and demand in
the Canadian labour market.
Inadequate labour information is creating adverse effects on job seekers,
employers, and the economy as a whole. Job seekers experience difficulty integrating
into the labour market because they are unaware of the occupations and skills in
demand. Many employers are spending resources to find skilled workers, resources that
could be spent on business development. All this is a hindrance to economic growth and
suggests Canada’s unemployment rate could be lower than currently experience..
Canada has multiple sources of labour market information that include the
federal government, provincial governments, and the private–sector. However, this
information has been ineffective in improving the matching of labour supply and demand.
Much of the information is used to develop employment programs, evaluate insurance
benefits, and research, but not job matching. This study aims to determine what labour
information should be collected, and how it can create a more efficient labour market.
The key interest groups with a stake in a labour market information system can
be divided into providers (federal and provincial governments) and end users (job
seekers and employers). Currently, both governments provide some form of labour
market information, which means reforms will impact federal and provincial
governments.

20
Post-secondary educational institutions are an important intermediary because
they are responsible for providing individuals with skills and knowledge. These
institutions need labour information to design their programs and help meet the labour
demand in Canadian economy. The next section presents literature on optimal labour
market information systems.

21
5. Features of an Optimal Labour Market Information System
This section outlines important features for an optimal labour market information
system to create an efficient labour market which are going to be used as an analytical
framework. The features are based on the findings of two organizations: W.E. Upjohn
Institute for Employment Research and The National Skill Development Corporation
(NSDC) India. The W.E. Upjohn Institute for Employment Research provides a
framework for an optimal labour market information system for ESDC to improve existing
labour market information practices (O’Leary and Woods, J., 2006). India is also looking
to develop an effective labour market information system to effectively utilize their
growing population and workforce. Recognizing this challenge, the NSDC India did a
study to conceptualize a Labour Market Information system (NSDC India, 2011). Their
study identifies leading practices around the globe for labour market information
collection. The findings from these two organizations are used to define an optimal
labour market information system. This section first discusses the data set of a labour
market information system, followed by a discussion of the optimal structural features.
5.1. Data Elements
Obtaining labour market data is a fundamental requirement in achieving an
efficient labour market (O’Leary and Woods, 2006). This sub-section discusses the
different categories of labour information necessary as developed by the W.E. Upjohn
Institute for Employment Research.
22
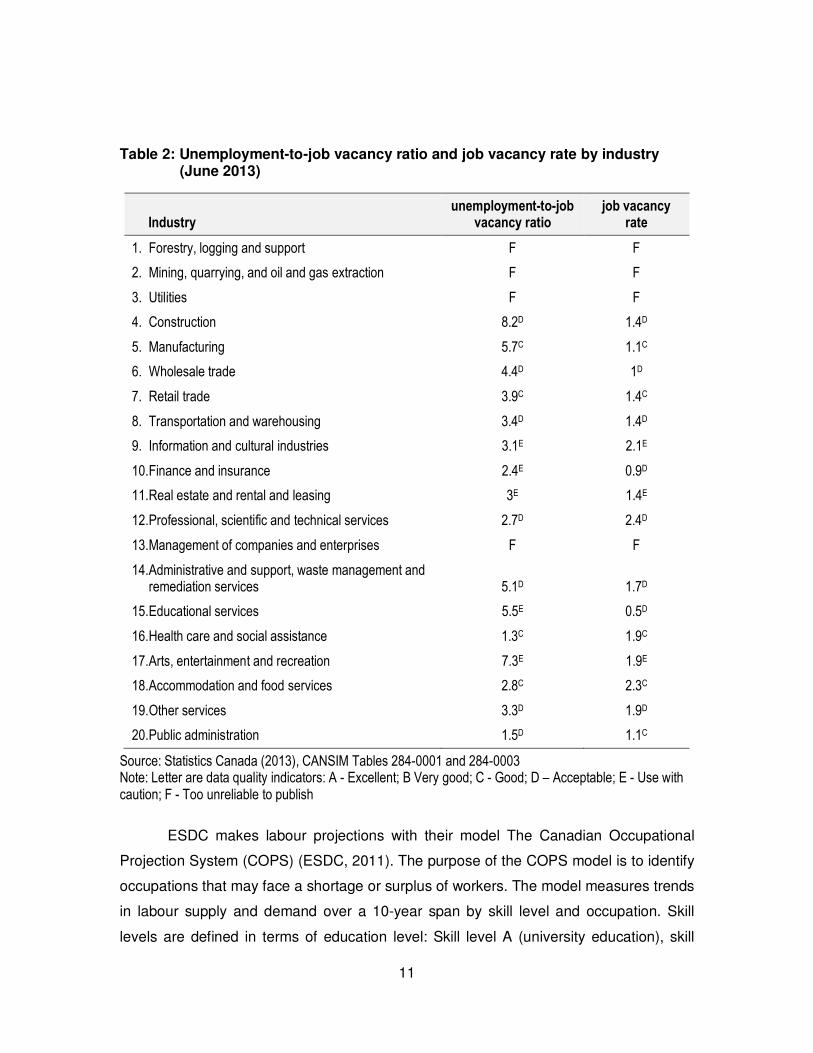
5.1.1. Standard Labour Market Data
Labour market data track labour market trends and overall labour supply and
demand. The data in this category overlap with information in certain categories
discussed below. Typically, this is aggregate data used for national and provincial
analysis.
5.1.2. Demand Data
Labour demand data should provide information on the current and expected
demand, occupational distribution across industries, and expected earnings. Data
concerning labour demand identify job vacancies and industries experiencing significant
layoffs. This information helps government uncover the causes of worker dislocation.
Occupational projections can help anticipate structural problems in the labour market.
How occupations are distributed across industries and occupational employed within
industries is also important information for career planning and workforce development.
Occupational wages and industry earnings are important information for job seekers on
the expected standard of living. This information can be used directly by career
practitioners to assist people in finding works.
5.1.3. Occupational Characteristics
Occupational characteristics provide job seekers with information that describes
the work environment. This includes information on skills, abilities, knowledge,
responsibilities, and work activities. This information is important because many
occupations evolve with new technologies and practices. This means the skill set
required for occupations will change. In addition, this helps job seekers determine if they
are well suited for a specific occupation or industry.

23
5.1.4. Occupational Supply
Occupational supply data can help identify structural problems in the labour
market. Tracking unemployment by occupation helps determine changes in the labour
supply, and which industries are experiencing an oversupply of workers. Additional
information to understand the labour supply mix includes data on labour force entrants,
people of out the labour force, number of enrollees in education and training, completers
of education and training, and outcome of graduates.
5.1.5. Education and Training
Information on education and training required for an occupation is important for
career planning. Key information on the length of time and cost to be qualified helps
individuals determine whether they should pursue the job. Information on financial
assistance available for education and employment training programs is also important
because it can positively impact job matching.
5.1.6. Crosswalks and Linkages Across Data Sets
A labour market information system should allow information to be compared and
not be a standalone data item. Classification systems that group’s similar information
together helps ensure comparability. Moreover, crosswalks can connect data on
industry, occupations, education, and skills.
5.2. Structural Features
W.E. Upjohn Institute for Employment Research (2007) provides seven key
features of an optimal labour market information system. NSDC India (2011) also
identifies leading practices in the dissemination of labour market information. The
findings of both organizations are in Appendix C. For this study I amalgamate their
findings into four key categories: governance, data quality, analysis and interpretation,
and data dissemination. This sub-section details the importance of each category.

24
5.2.1. Governance
Given the number of providers and users of labour information, a good
governance model is necessary to facilitate effective job matching. Given the complexity
of the labour market, a shared and systematic approach is required. Therefore
coordination and collaboration between different providers of labour information for
comprehensive system must exist. Good governance means efficient data management.
A lack of partnership among providers is likely to create duplication of development,
analysis, and ineffective dissemination. Due to the importance of collaboration,
governments must have an active role in developing and disseminating labour market
information (NSDC India, 2011). In examining any labour market information system it is
important to consider how it is coordinated among agencies and different levels of
government.
5.2.2. Data Quality
The data set is the most important aspect of a labour market information system.
Data quality alone does not ensure job matching, but it is a necessary component.
Critical issues to consider in collecting labour market data include time period coverage;
geographical coverage; and data classification. There must also be a standardization
classification of data for occupations, industries to facilitate data development,
presentation, comparison, and interrelationships (NSDC India, 2011).
5.2.3. Analysis and Interpretation
An effective labour market information system must provide reliable analysis.
Labour information can be analyzed at different levels including national, regional, local,
and by industry. Analysis should be conducted at different levels to serve the diverse
labour information users. The different needs include support for job matching, labour
policies, learning and educational policies. Another important consideration is the role of
labour market intermediaries, such as institutions and individuals involved in the
employer-worker relationship. The services of intermediaries can include informing and
facilitating matching between job-seekers and employers, how work is accomplished,
and possibly resolve conflicts. This study focuses on the role of labour market

25
intermediaries to facilitate job matching. Labour market intermediaries are vital in helping
job seekers understand labour market conditions, and employers understand the
workforce availability.
5.2.4. Data Dissemination
A labour market information system should assist job seekers, firms, youth,
education institutions, and any user to make labour market-related decisions. For this
reason the information must be easily accessible and effectively disseminated. The
internet is the primary method to share labour market information. Career practitioners
are also a fundamental channel to share information to facilitate career planning, job
search, and career transition.
To summarize, an optimal labour market information system must provide
comprehensive data covering both the demand and supply side of the labour market.
For a labour market information system to support job matching governance must be
well co-ordinate, have data quality, be able to support analysis and interpretation, and be
effectively disseminated.

26
6. Methodology
This section explains the primary and secondary methodology being used to
develop policy options. The primary methodology is a case study analysis of jurisdictions
to identify best practices based on the components described in section 6. The case
study assesses how each jurisdiction aligns their labour supply and demand. First, the
analysis identifies the type of data collected within the categories. Second, the analysis
identifies the structural features of each country’s system. The cases examined are
Australia, Germany, and Switzerland. The secondary methodology examines academic
literature to determine whether the identified practices are effective in aligning labour
supply and demand. A potential drawback of this methodology is that certain best
practices may not be captured by the model. Overlooking a key practice means an
important feature that supports job matching could be neglected.
6.1. Case Study Selection
To select case studies the following criteria are applied: OECD members; total
and youth unemployment rate below Canada’s; and higher public expenditure on active
labour market programs. Table 4 provides a comparison of these characteristics.
Table 4: Case study selection criteria
Unemployment rate (2012)
Youth Unemployment rate 15 to 24 (2012)
Public Expenditure on active labour market programs as % of
GDP (2011)
Switzerland 4.3 8.4 0.59
Germany 5.5 8.1 0.79
Australia 5.4 11.7 0.29
Canada 7.3 14.3 0.26
Sources: OECD (2013)

27
Switzerland has the lowest unemployment rate at 4.3% and ranks second among
OECD countries3, Australia and Germany have similar rates. There is a great difference
in youth unemployment rates between Canada and the case study countries.
Switzerland and Germany have the lowest youth unemployment rate that is almost half
of Canada’s. In fact, Germany and Switzerland are just behind Japan for lowest youth
unemployment rate. Australia’s youth unemployment rate is higher but still well below
Canada’s. For public expenditure, active labour market programs refer to government
programs that support unemployed individuals to integrate them into the labour market.4
Compared to Canada, the two European countries spend a much greater proportion of
their GDP in supporting unemployed individuals to find work. Australian statistics are
closer to Canadian respective to Germany and Switzerland. However, Australia is an
important country to investigate because of its similar size and population to Canada.
Altogether, the statistics in Table 3 suggest that the case countries have a labour market
information system that is more effective in job matching.
My case study focuses on the type of labour market data collected and highlights
key features of the respective labour market information systems. This study does not
conduct an in-depth analysis of the distinguishing features of each case.
6.2. Evaluation Framework
The case study analysis has two parts. The first part considers labour data
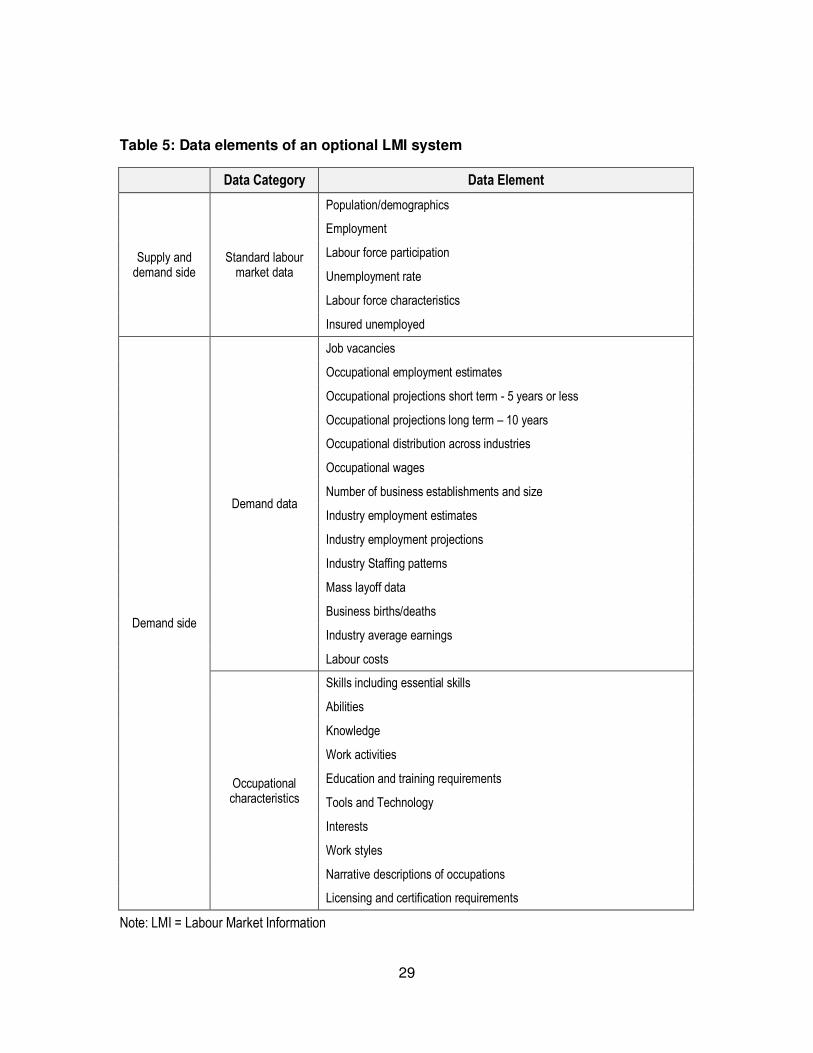
collected by each country based on the categories discussed in section 6.1. Table 5
presents the measures for each category. The standard labour market data category
includes employment rate, unemployment rate, labour force participation and
characteristics, and individuals receiving employment insurance.
Demand data covers a range of information with the most crucial being job
vacancies; occupational estimates and projections; number of business establishments
and size; occupational wages; and occupational distribution across industries. This data
is indispensible because it provides direct information about occupations with high
3 Norway and Korea have the lowest unemployment rate at 3.3%
4 This number may not include expenses on gathering and distributing labour market information

28
employment prospects. Other helpful demand data includes business labour costs;
employment within industries; business births and deaths; industry staffing patterns; and
layoff data. Occupational Characteristics includes vital information about the skills,
abilities, knowledge, work activities, and education and training requirements for jobs.
Tracking this information can help identify the changing needs of the labour market.
Additional useful data is tools and technology required, interests, work styles,
descriptions of occupations, and licensing and certification requirements.
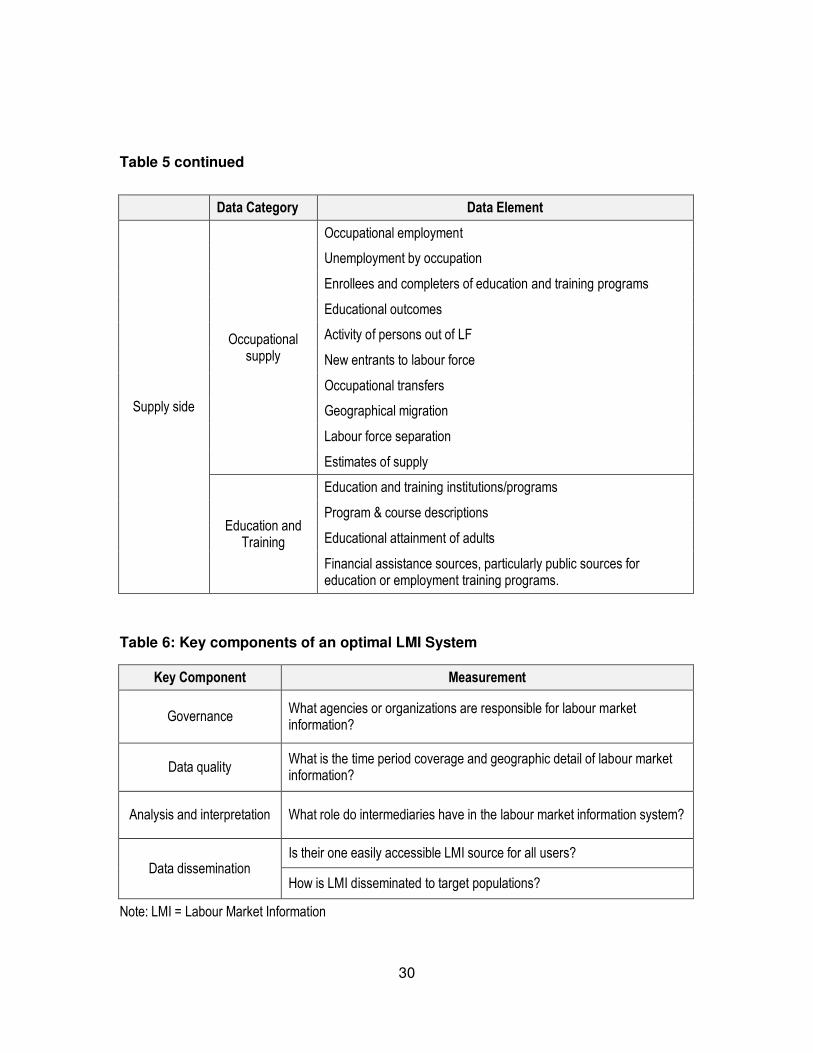
Vital Occupational supply information includes employment and unemployment
by occupation; number of enrollees and completers of education programs; activity of
people out of labour force; and educational outcomes of graduates. This data provides a
breakdown of the workforce and complements demand data to help identify potential
causes of structural unemployment. Additional helpful data is new entrants to the labour
force; people transferring occupations; geographical migration; and labour force
separations. Finally, education and training programs covers information about post-
secondary institutions. This includes schools, programs and courses, and financial
assistance.
The measures for this assessment are modified from the original model by W.E.
Upjohn Institute for Employment Research (original model in appendix D). First, my
modified version eliminates similar data elements. Second, the crosswalk category is
eliminated. Crosswalks are important to compare information across data sets. However,
they are unnecessary for job matching since I consider the importance of analyzing and
sharing data with end users.
The second part considers the features of respective information systems related
to governance, data quality, analysis and interpretation, and data dissemination. The
governance category describes what public agencies are responsible for labour market
information. The data quality category is concerned with what is the time-period and
geographic detail for information collection. For the analysis and interpretation category I
consider the role of labour market intermediaries. Finally, the data dissemination
category considers whether there is an easily accessible source for information, and how
the information is disseminated to target population groups. Examining cases on these
key features will identify how each country supports job matching.
29
Table 5: Data elements of an optional LMI system
Data Category Data Element
Supply and demand side
Standard labour market data
Population/demographics
Employment
Labour force participation
Unemployment rate
Labour force characteristics
Insured unemployed
Demand side
Demand data
Job vacancies
Occupational employment estimates
Occupational projections short term - 5 years or less
Occupational projections long term – 10 years
Occupational distribution across industries
Occupational wages
Number of business establishments and size
Industry employment estimates
Industry employment projections
Industry Staffing patterns
Mass layoff data
Business births/deaths
Industry average earnings
Labour costs
Occupational characteristics
Skills including essential skills
Abilities
Knowledge
Work activities
Education and training requirements
Tools and Technology
Interests
Work styles
Narrative descriptions of occupations
Licensing and certification requirements
Note: LMI = Labour Market Information
30
Table 5 continued
Data Category Data Element
Supply side
Occupational supply
Occupational employment
Unemployment by occupation
Enrollees and completers of education and training programs
Educational outcomes
Activity of persons out of LF
New entrants to labour force
Occupational transfers
Geographical migration
Labour force separation
Estimates of supply
Education and Training
Education and training institutions/programs
Program & course descriptions
Educational attainment of adults
Financial assistance sources, particularly public sources for education or employment training programs.
Table 6: Key components of an optimal LMI System
Key Component Measurement
Governance What agencies or organizations are responsible for labour market information?
Data quality What is the time period coverage and geographic detail of labour market information?
Analysis and interpretation What role do intermediaries have in the labour market information system?
Data dissemination Is their one easily accessible LMI source for all users?
How is LMI disseminated to target populations?
Note: LMI = Labour Market Information
31
7. Analysis
This section determines what data elements and features present in the three
cases do not exist in Canada. . Each case study includes first a description of the labour
data collected by the country. Then, the case study analysis describes the features and
structure of respective labour market information systems. The results of the analysis
are summarized in Tables 7 and 8 at the end of section.
7.1. Case Study 1: Australia
Australia’s population is approximately 24 million in 2014, with a per capita GDP
of US $67, 556 (World Bank, 2014). Information for this case study analysis is obtained
from the Australian government website and reports.
7.1.1. Data Elements
Standard Labour Market Data.
In Australia, information concerning the population is obtained from a Monthly
Population Survey. One of its components, the labour force survey, provides detailed
information on employment, unemployment, and unemployment benefits. As a result, all
data elements listed under the core labour market data category are provided by
Australia.
Demand Data.
Australia uses a number of sources to gain an accurate picture of the labour
demand. Among them, there is a survey to obtain job vacancy estimates. The Australian
Department of Employment also releases monthly vacancy reports which provide the
Internet Vacancy Index (IVI). This Index tallies job vacancies from four websites: SEEK,
My Career, CareerOne, and Australian Job Search. The IVI provides detailed data for

32
approximately 350 occupations at all skill levels and all states, territories, and the 38
regions (Australian Department of Employment, 2014).
In addition to vacancy data, Australia has a Business Indicators Survey to gauge
private sector health. This survey collects information pertaining to the sales, profit, size,
and labor costs of firms. Australia’s Survey of Employers who Have Recently Advertised
(SERA) collects data not covered by my model. It includes information concerning major
occupations and employers’ recruitment experiences. This is used to conduct research
on skill shortages and understand employers’ recruitment experiences.
To support career planning The Department of Employment provides information
on weekly earnings for many careers and five-year employment projections. The five
year projections are broken down by industry, occupation, and region. There are no
long-term 10 year occupational projections. Short-term projections are likely more useful
for career planning, given it is more likely to be accurate, and people are more inclined
to make career decisions late in their school-age. In addition, the Department provides
data on occupations employed within an industry and how occupations are distributed
across major industries. This level of detail helps individuals to learn about occupations
with the greatest employment prospects. Furthermore, the government can anticipate
potential occupational shortages and determine workforce development strategies.
Unfortunately, I could not verify whether Australia provides any information concerning
business births and closures, mass layoff data, or industry employment estimates.
Occupational Characteristics.
The Australian governments’ Job Outlook website provides very detailed
information on the characteristics of different occupations. These characteristics include
skills, knowledge, activities, abilities, interests, job environment, work values, and work
tasks. The website provides almost all the data elements – except for tools and
technology – in this category. This information is very useful in informing young people’s
expectations and identifying careers that fit their interests. This also informs people of
the changing requirements for occupations.

33
Occupational Supply.
The labour force survey provides general information about the workforce. In
addition to the information covered in the core labour market data category there are
characteristics of persons unemployed or not in the labour force; such as duration of
unemployment, methods for job search, and reason for not being in the labour force.
Collecting data about people who are unemployed or not in the labour force can identify
structural unemployment issues such as workers lacking required skills; unwilling to
move to new location; or unwilling to work at existing wages. In addition to the labour
force survey, Australia conducts a Labour Mobility Survey to collect information about
modifications in employment situation. This includes individuals changing employers, a
change in work with current employer, and employed people who were previously
unemployed or out of the labour force. Tracking the movement of labour identifies which
industries or major occupations experience the greatest turnover or are the most
dynamic.
Australia also places importance on understanding the labour force make-up and
impact of education. For instance, Australia tracks the enrollment and completion of
education programs by age, sex, institutions, level of education, and type of education.
The Australian Graduate Survey (AGS) surveys new graduates from all universities,
colleges, and other higher education institutes. The AGS consists of a few
questionnaires that ask about graduates’ employment and salary outcomes, and
educational experience. The survey allows students to understand employment
prospects associated with different fields of study. It also helps educational institutions
identify issues with people transitioning from academics to professional careers.
Australia does not provide any estimate of the total labour supply. This analysis also
cannot verify whether Australia collects information on labour force separations.

34
Education and Training.
Universities Australia represents the university sector in the country and provides
prospective students with information about university programs and courses. The
Federal Department of Education also provides information to students about
government assistance for financing tertiary education. Students can go online and learn
about their eligibility for government assistance programs.
7.1.2. Key Components
Governance.
Australia divides responsibilities for labour market information between the
federal government and the six states plus two territories (Qiao and Sharpe, 2006). The
private sector also has a greater role in providing information than most countries. At the
federal level, The Australian Bureau of Statistics (ABS) is responsible for the labour
force survey. The Department of Employment and the Department of Education are the
main agencies that provide labour market information. Labour market information
produced by the federal government is regionalized at the state level, and state
governments provide labour market information at regional or sub-state levels. State
education and training authorities and sub-ministries provide local information. State
Training authorities are specifically responsible for labour market information regarding
vocational education and training. The Ministerial Council on Education, Employment,
Training and Youth Affairs (MCEETYA), identifies national standards and priorities in the
labour market and in the education system (Qiao and Sharpe, 2006).
Australia also relies on the private sector to provide labour market information.
Private companies provide information that is funded on a competitive basis (NSDC
India, 2011). For instance, The Department of Education contracts out labour market
information research and production to publishing companies or research organizations
(Qiao and Sharpe, 2006). Professional associations receive funding to provide
information about their sector. Further, some universities partner with professional
associations and industry to produce labour market information.

35
Data Quality.
Australia takes significant measures to ensure labour data has good
geographical coverage and is timely. Given its large size, Australia is quite advanced in
collecting local area data through their small area estimation techniques (Advisory Panel
for Labour Market Information, 2009). Labour market information is collected at three
geographic regions: Employment Service Area (ESA), Labour Force Region (LFR), and
Small Area Labour Market (SALM). Employment Service Area data concerns recipients
of Centrelink benefits and individuals engaged with Job Services Australia. Labour Force
Region data provides labour information on the basis of boundaries used by the Labour
Force Survey. Small area data includes unemployment rates and labour force figures for
approximately 1,300 statistical local area regions (Advisory Panel on Labour Market
Information, 2009).
Despite this level of detail for their major surveys, Australia has a problem with
uneven production and provision of information at the state level (Qiao and Sharpe,
2006). For instance, some states invest more in providing localized occupational profiles
and labour market information, while other states provide considerable resource material
for their aboriginal population. Australia also needs an improvement in information from
the private sector (NSDC, 2011).
To ensure timely information Australia conducts surveys on a frequent basis. The
Labour Force Survey and online job vacancy report is produced monthly, while the
Business Indicators Survey is published quarterly using data for three consecutive
months. This survey is based on a random sample of approximately 16,000 firms
stratified by industry, state/territory, and number of employees. Both the Australian
Graduate Survey and SERA is conducted annually. The Australian Graduate Survey
response rate ranges from 60 to 65 percent (Graduate Careers Australia, 2014). SERA
is conducted at the national and regional level and covers approximately 80 occupations.

36
Analysis and Interpretation.
In Australia, online sources are a very important intermediary in supporting
career decision making. Websites provide labour market information analyze and
interpret the data to make it understandable for end users. For instance, the Job Outlook
website explains employment prospects for each occupation. In addition, the website
also explains earnings and hours of work for each occupation compared to the national
average.
The country is placing increasing importance in career guidance counsellors. The
Career Industry Council of Australia (CICA) is the national body for the career
development industry, and many CICA members focus on delivery of career
development within schools. The Council receives government funding to deliver
national activities to advance and build a career development culture in Australia. CICA
is working towards regulation of career development profession and establishing
professional standards.
Data Dissemination.
Australia’s Labour Market Information Portal (LMIP) is an online resource that
provides updated labour market information. The LMIP serves as one online source to
obtain a breadth of information that includes unemployment rates, employment by
industry, and employment projections. Job search sites within the labour market
information portal are accessible to all users, easy to navigate, do not require login or
password, and have many features free of charge.
Australia also provides labour market information through the education system.
The provision of information is supposed to begin in year 7 of education; but policies
concerning the provision of information vary across states (Qiao and Sharpe, 2006). In
school, students learn how to use the different online sources and participate in events
for career planning. Notably, Australia is using their labour market information system to
increase participation in vocational education and training, and reduce school drop outs
(Qiao and Sharpe, 2006).

37
In summary, Australia’s labour market information system is a collaborative effort
between the federal government, state governments, education institutes, and the
private sector. To understand labour market conditions, Australia employs multiple
surveys of employers and the workforce. The most noteworthy feature is the use of
online sources to disseminate information. Australia does a good job of ensuring their
online information is easily accessible and comprehensible for end users. One minor
issue in Australia is unequal information being provided across the states.
7.2. Case Study 2: Germany
As noted in Section 7, Germany’s has the second lowest youth unemployment
rate among OECD countries. Compared to Canada, Germany is a more populous
country (approximately 80 million in 2013), and a per capita GDP of US $41,863 (World
Bank, 2014). Information for the German case study is obtained from the Federal
Employment Agency and reports.
7.2.1. Data Elements
Standard Labour Market Data.
Germany provides all the standard labour market information in this category.
This information is obtained from the labour force survey, an integral component of the
national Microcensus. The Microcensus has a high response rate of approximately 90%
since most questions require compulsory response (Federal Statistical Office of
Germany, 2014).
Demand Data.
Germany conducts two surveys to understand labour market conditions: The Job
Vacancy Survey and the Establishment History Panel. Their Job Vacancy Survey
measures unmet labour demand and identifies how sectors have been affected by
changing economic situations. This survey also asks businesses if they experience
difficulty recruiting workers and to identify those difficulties. The Establishment History
Panel (BHP) tracks business births, closures, and sizes. The Job Vacancy survey

38
provides information about job market conditions, while the BHP informs government
about private sector conditions. Germany also provides both short-term (5 years) and
long-term (10 year) occupational projections.
Germany also provides information on the employed occupations within an
industry and average gross wages for different occupations. This study cannot verify
whether Germany collects information on how occupations are distributed across
industries, occupational transfers, or industry employment estimates.
Occupational Characteristics.
The Federal Employment Agency provides information about occupations
through their Berufet website. The website provides a short description of the job, work
activities, interests, and required skills. Occupational information covers 16 professional
fields and 123 sub-professional fields.
Occupational Supply.
The labour force survey collects the standard information on the workforce
concerning employment, unemployment, and people out of the labour force. Germany
also constructs ratios of new entrants and graduates of higher education. The ratio of
new entrants describes the proportion of an age cohort that is new entrants to higher
education. The ratio of graduates describes how many people of one age cohort are
graduates. These ratios help determine the educational attainment level of the labour
force. This may be important to track given the increasing importance in ensuring an
educated and skilled workforce.
The German Student Survey covers 25 universities and universities of applied
sciences and covers a range of topics. With respect to employment, the survey is
concerned with graduates job prospects and transition into the labour market. Germany
does not provide information on new labour force entrants, occupational transfers, and
estimates of the labour force supply. Given Germany’s already low unemployment rate
suggests this information is not vital for job matching.

39
Education and Training.
The Higher Education Compass is a website that gives a comprehensive
overview of the university landscape. From this website individuals can obtain
information on and links to all German higher education institutes. Prospective students
are also provided information on student finance including semester and tuition fees,
scholarships, student loans, and federal financial aid. Higher Education Compass is
hosted by the Association of Higher Education Institutes.
7.2.2. Key Components
Governance.
Germany has a centralized system where the Federal Employment Agency is
responsible for collecting, analyzing, and disseminating labour market information. The
Federal Employment Agency is comprised of 10 regional directorates and 156
employment agencies. The 156 employment agencies collaborate with local authorities
to operate 304 job centres. The Federal Employment Agency also includes The Institute
for Employment Research (IAB) which is an independent research institute of the
Federal Employment Agency.
In Germany, educational institutes and private firms play an important role in the
labour market information system. German schools have strong partnerships with the
Federal Employment Agency and local businesses to provide labour market information
in secondary schools. Obtaining reliable information for secondary schools is important
to support curriculums because students learn about vocational career opportunities and
can begin apprenticeship training in senior secondary. The Agency also partners with
higher education (post-secondary) institutions to inform applicants and students about
labour market opportunities and conditions. Private firms have a limited role in delivering
information that is concentrated on placement opportunities and counselling services.
These companies typically charge fees to employers but not individuals seeking job
placement assistance (Qiao and Sharpe, 2006).

40
Data Quality.
Given Germany’s relatively small land size, geographic coverage is not a major
challenge. To ensure geographic coverage local employment offices are responsible for
collecting and publishing regional labour market information. Germany does make efforts
towards ensuring labour market information is timely. Their Microcensus is a continuous
survey distributed over all calendar weeks of the year. The results are provided annually
and quarterly. Firms receive the job vacancy survey in the beginning of the fourth quarter
of the year. In the first, second, and third quarter telephone interviews are conducted
with firms to update developments in the demand for labour.
Analysis and Interpretation.
In Germany, the most important labour market intermediaries are career
guidance counsellors in schools and local employment agencies. Career guidance
counsellors must receive training from the Federal Employment Agency to ensure they
can help individuals understand labour market conditions. In addition, the German
Association for Career Counselling established a Career Counsellor Register system,
where all counsellors or institutions can voluntarily register into the system. The
Association also developed prerequisites to ensure counsellors are qualified to serve job
placement clients. Local employment agencies provide adults with access to the
services of placement officers and work counsellors. Placement officers develop profiles
of unemployed adults to estimate their chances of obtaining employment and to
determine the type of assistance they require. Work Counsellors assist the unemployed
with job search. Private companies providing placement and counselling must obtain a
permit from the Federal Employment Agency and submit data on job and training
placements.
The Federal Employment Agency is responsible for supporting job matching
(Qiao and Sharpe, 2006). Therefore, The Agency provides analysis of their labour
market information available online. Through their website the public can learn about
occupation and regions experiencing professional bottlenecks, and the workers in
greatest demand.

41
Data Dissemination.
The Federal Employment Agency, being the largest service provider for the
labour market, is the primary source of information. The Federal Employment Agency
website provides brochures, online publications, annual reports, and publications by the
Institute for Employment Research (IAB). However, schools are the most important
channel to provide labour information to young people. German schools are responsible
for incorporating labour market information in curriculums. The Agency also provides the
services of career counsellors and career information sessions in schools. For high
school drop outs, schools in partnership with sector chambers provide information and
vocational education.
Most higher education institutes are also responsible for providing labour market
information. Students can obtain information such as labour market trends and
occupational requirements from academic staff. However, the quality of these services
depends on the efforts and capacity of academic staff (Qiao and Sharpe, 2006). These
institutes are also responsible for informing applicants and students about labour market
opportunities and conditions. The Agency also has higher education teams that focus on
obtaining labour market information for higher education students and graduates.
To summarize, Germany has a centralized system with the Federal Employment
Agency responsible for labour market information. The Agency is also responsible for
ensuring career guidance counsellors, working in schools and employment offices are
well-informed and qualified to provide services. These counsellors are vital for helping
individuals understand labour market conditions and find work. Germany also makes it a
priority to provide career information in secondary and post-secondary schools. They
also use multiple sources to gain a reliable understanding of labour market conditions.
42
7.3. Case Study 3: Switzerland
As discussed in section 7, Switzerland has the third lowest youth unemployment
rate among OECD countries.5 Switzerland is a relatively small country with a population
of approximately 8 million in 2013, but it has a high GDP per capita of US $78,925
(World Bank, 2014). Information for this case study analysis is obtained from
Switzerland’s Federal Statistical Office and reports.
7.3.1. Data Elements
Standard Labour Market Data.
The Swiss labour force survey provides all the standard labour data in this
category. This includes demographic and labour-related characteristics concerning
employment, unemployment, and receipt of unemployment benefits.
Demand Data.
Switzerland uses multiple questionnaires to understand the demand side of the
labour market. The Statistic on Enterprise Structure collects business data concerning
firm size, sector, region, number of workplaces, and employed persons. JOBSTAT
surveys secondary and tertiary sector businesses about job vacancies. This survey also
asks questions concerning labour recruitment challenges firms are experiencing. Canton
governments (e.g., state or province governments) are responsible for surveys to
measure supply and demand in the local apprenticeship market. The Federal Statistical
Office also makes available labour costs of employees and the rate of business births
and closures. Obtaining comprehensive information about employers is important in
Switzerland because the government takes responsibility for job matching.
5 Case study for Switzerland discusses information provided in English. As a result certain
components may be missing because not all the publicly available data descriptions on the website are available in other languages than the national languages, e.g., French, German and Italian.

43
In addition, salarium is an interactive application that provides salary information
for specific jobs. With respect to projections, Switzerland provides projections on the
labour force size, but not occupational projections. This may be because Switzerland
doesn’t feel it is necessary to have projections to support job matching.
Occupational Characteristics.
Switzerland does not provide any information describing occupational
characteristics. This information is not available online but may be provided to job-
seekers in person by career guidance counsellors.
Occupational Supply.
The Swiss Labour Force Survey provides all the standard information concerning
the workforce. This includes employment and unemployment by occupation, migration,
and activities of persons out of the labour force. Switzerland also collects occupational
mobility data that tracks occupational transfers in the labour market. This helps identify
occupations and sectors that provide the greatest stability, and likewise have the
greatest turnover. This is useful for job seekers in career planning and the government in
understanding labour market and unemployment issues. In addition, The Swiss
Graduate Survey obtains information on the employment and educational situation of
higher education graduates, one and five years after graduation. Graduate survey
results are used to inform higher education institutes, guidelines for education and
employment authorities, and career counselling services (FSO, 2014).
Data elements not provided include entrants to the labour force, enrollees and
completers of education and training programs, and estimates of the labour supply.
Switzerland does provide estimates of economically active persons (employed and
unemployed) broken down by age and education levels, but not at the occupational
level. Moreover, no case examined tracks estimates of potential labour supply. This is
likely because it is difficult to provide an estimate that includes adding employment
estimates, unemployment estimates, completers of education, and people outside the
labour force. However, given the low unemployment rates in Germany and Switzerland,
this measure seems unnecessary to support job matching.

44
Education and Training.
The Swiss university website is a promotional internet portal for the 12 Swiss
public universities and federal institutes of technology. The website provides information
and promotes study and research opportunities offered by these higher education
institutes. Individuals can search by university or discipline to find all university programs
offered in that discipline. In fact, all cases examined have an online source for
prospective students to learn about post-secondary schools and programs. Students in
Switzerland requiring financial aid can apply for financial support from cantonal
governments or universities. Information on financial assistance is not provided from a
central source; instead information must be obtained from each university or cantonal
government.
7.3.2. Key Components
Governance.
In Switzerland, labour policy decision making is fairly decentralized. The federal
government through the Secretariat for Economic Affairs (SECO) sets the parameters
for labour policy. Cantons are the level of government mainly responsible for public
employment services and administration of active labour market policies. Cantonal
labour offices establish and supervise logistical centres for labour market measures and
local employment offices. These local employment service offices conduct job
placements, refer clients to active labour market programs, and monitor job-search
requirements. The federal government benchmarks the performance of local public
employment services.
In Switzerland, the education system has a vital role for creating an efficient
labour market. Vocational and professional education and training (VET) is integrated
into the Swiss education system. VET programs (offered in upper secondary level) are
provided in dual track learning, which combines vocational studies and part-time
apprenticeships. Cantons are responsible for identifying mismatches in the local
apprenticeship market. In case of mismatches, the federal office for Professional
Education and Technology (OPET) intervenes to alleviate labour market mismatches
(Field et. al., 2009).

45
Data Quality.
Given the Swiss education system is designed to meet labour needs, it is crucial
to have reliable labour market information. Data collection at cantonal levels helps
ensure data are reliable. Cantons conduct monthly surveys to determine supply and
demand in the apprenticeship market for their VET programs (Field et. al., 2009). At the
Cantonal level, regional placement offices collect information about the unemployed on a
monthly basis. These data at the cantonal level are pooled together at the national level.
This Swiss Graduate Survey is also conducted every two years and has a response rate
between 60 and 65 percent (FSO, 2014). Unlike monthly labour force and business
surveys in Australia and Germany, the Swiss labour force survey and JOBSTAT survey
are conducted quarterly. Being a relatively smaller country, Switzerland may require this
information less frequently.
Analysis and Interpretation.
Switzerland places relatively little importance on online sources to help job
seekers, but places significant importance on their career guidance system. The Swiss
have a system of career guidance and counselling that helps students at various points
in their education and professional career. An important institution is The Centre for
Occupational Information, which provides advice about career opportunities. The Centre
offers generalist counsellors or specialists with knowledge of specific institutions and
labour markets. These counsellors receive training to ensure they are informed about
vocational education and training courses and the associated labour markets.
Secondary school teachers also receive training to make them knowledgeable about
general labour market conditions.
Data Dissemination.
The primary providers of labour market information are career counsellors.
Career counsellors are made accessible to every population group to help align labour
supply and demand. Career guidance counsellors work closely with schools to provide
services to students. In fact, career guidance and information sessions are mandatory
for students in secondary education. Students also have access to the Centres for
Occupational Information to learn about career opportunities. Working age adults

46
seeking assistance have access to the counselling services from their local placement
offices.
In summary, Switzerland has a decentralized system where cantonal
governments have significant authority in collecting data and providing employment
services. Switzerland also ensures career guidance counsellors are well-informed to
provide their services in schools and employment offices. Moreover, Centres for
Occupational Information are responsible for providing general and specific labour
market information in schools. In addition, Switzerland uses multiple surveys to
understand labour market conditions.

47
Table 7: Summary of case study analysis: data elements
Data Category Data Element Australia Germany Switzerland
Demand &
Supply
Standard Labour Market
Data
Population/demographics � � �
Employment � � �
Labour force participation � � �
Unemployment estimates & rates �
� �
labour force characteristics � � �
Insured unemployed � � �
Demand Side
Labour Demand
Job vacancies � � �
Occupational employment est. � � �
Occupational projections: Short term-- 5 years or less � �
Occupation projections Long-term – 10 years �
Occupational wages � � �
Occupational distribution across industries �
Number of business establishments & size � � �
Industry employment estimates � � �
Industry employment projections � �
Industry staffing patterns � �
Mass layoff data �
Business births and deaths � �
Industry average earnings
Labour costs � �
Occupational Characteristics
Skills � �
Abilities �
Knowledge �
Work activities � �
Education & training requirements �

48
Table 7 continued
Data Category Data Element Australia Germany Switzerland
Tools and Technology
Demand Side
Occupational Characteristics
interests � �
Work styles �
Descriptions of occupations � �
Licensing & certification requirements � �
Supply Side
Occupational Supply
Employment by occupation � � �
Unemployment by occupation � � �
Enrollees and completers of education and training � �
Educational outcomes � � �
Activity of persons out of LF � � �
New entrants to labour force �
Occupational transfers � �
Geographic migration � �
Labour force separations
Estimates of supply
Education and Training
Education & training institutes/programs � � �
Program description � � �
Educational attainment of adults � � �
Financial assistance sources � �

49
Table 8: Summary of case study analysis: key components
Criteria Australia Germany Switzerland
Governance
LMI responsibilities divided between federal and regional governments. Private sector also has significant role in LMI provision.
Federal Employment Agency is responsible for labour market information.
Federal government sets parameters for labour policy. Cantonal (regional) governments responsible for labour market measures employment services.
Data Quality
Employ small area estimation techniques for local area coverage. Information is unequal across States.
Local area data collected by employment offices. Also employ multiple surveys
Cantons conduct monthly surveys. Also employ multiple surveys.
Analysis & Interpretation
The Career Industry Council of Australia (CICA) responsible for regulating and establishing standards for career counsellors.
The Federal Employment Agency provides training and information to career guidance counsellors.
Career guidance counsellors receive training and information to learn about labour market conditions. Counsellors are either generalists or specialize in certain labour markets.
Data Dissemination
Labour Market Information Portal serves as online resource for LMI. Also provide information through the education system.
Federal Employment Agency provides information to schools. Regional employment offices provide information to unemployed individuals.
Centres for Occupational Information provide labour market information through the education system. Employment service offices provide information to unemployed individuals.

50
8. Summary of Analysis
This section provides a summary of the case study analysis. First, I compare the
jurisdictions examined to identify commonalities and key differences. From there I
discuss best practices observed in cases but missing in Canada.
8.1. Comparison of Cases
To summarize, among three cases Australia collects the most labour data in the
model. Australia also does the best job of internet delivery of information. Yet, Australia
has the highest unemployment rates among all the cases examined. There are likely
multiple factors that contribute towards the lower unemployment rates in Germany and
Switzerland. This study finds one contributing factor is their respective agencies that are
responsible for providing labour market information to support job matching. In Germany
there is the Federal Employment Agency that is responsible for labour market
information and supporting job matching. In Switzerland, there is The Centre for
Occupational Information which is an office that provides career information and
counselling services. These organizations are also responsible for ensuring career
guidance counsellors are well informed so they can support individuals in finding work.
Furthermore, educational institutes are an important channel for providing
information in the cases examined. All three countries provide career information to
students in higher education and secondary school. They particularly focus on providing
information about vocational and trades career opportunities to secondary students,
particularly school drop-outs. The strongest partnerships between the education and
labour market information systems are in Switzerland and Germany. Both countries have
a dual track education system where students can begin vocational training in secondary
school. In fact, Switzerland and Germany do not seem to have difficulty integrating
school graduates into the labour market. The European Expert Network on Economics of
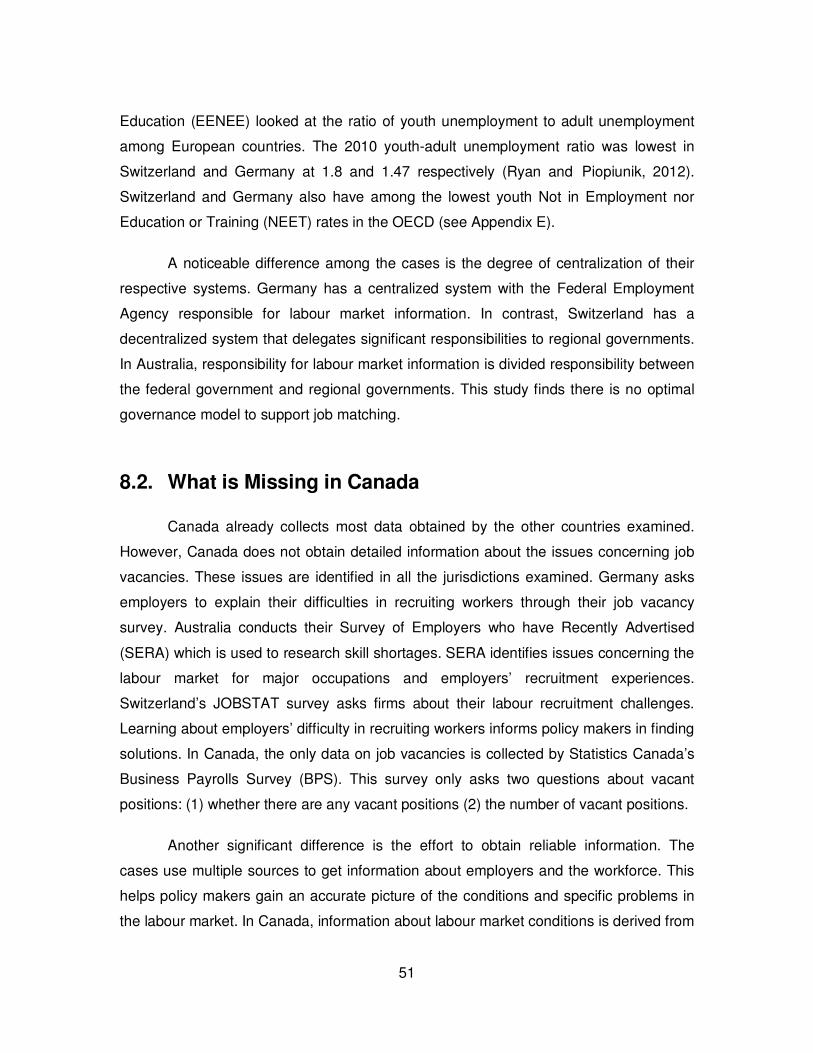
51
Education (EENEE) looked at the ratio of youth unemployment to adult unemployment
among European countries. The 2010 youth-adult unemployment ratio was lowest in
Switzerland and Germany at 1.8 and 1.47 respectively (Ryan and Piopiunik, 2012).
Switzerland and Germany also have among the lowest youth Not in Employment nor
Education or Training (NEET) rates in the OECD (see Appendix E).
A noticeable difference among the cases is the degree of centralization of their
respective systems. Germany has a centralized system with the Federal Employment
Agency responsible for labour market information. In contrast, Switzerland has a
decentralized system that delegates significant responsibilities to regional governments.
In Australia, responsibility for labour market information is divided responsibility between
the federal government and regional governments. This study finds there is no optimal
governance model to support job matching.
8.2. What is Missing in Canada
Canada already collects most data obtained by the other countries examined.
However, Canada does not obtain detailed information about the issues concerning job
vacancies. These issues are identified in all the jurisdictions examined. Germany asks
employers to explain their difficulties in recruiting workers through their job vacancy
survey. Australia conducts their Survey of Employers who have Recently Advertised
(SERA) which is used to research skill shortages. SERA identifies issues concerning the
labour market for major occupations and employers’ recruitment experiences.
Switzerland’s JOBSTAT survey asks firms about their labour recruitment challenges.
Learning about employers’ difficulty in recruiting workers informs policy makers in finding
solutions. In Canada, the only data on job vacancies is collected by Statistics Canada’s
Business Payrolls Survey (BPS). This survey only asks two questions about vacant
positions: (1) whether there are any vacant positions (2) the number of vacant positions.
Another significant difference is the effort to obtain reliable information. The
cases use multiple sources to get information about employers and the workforce. This
helps policy makers gain an accurate picture of the conditions and specific problems in
the labour market. In Canada, information about labour market conditions is derived from

52
only two sources: the Labour Force Survey and Business Payrolls Survey. Another key
difference is that the jurisdictions examined include a bottom up approach to data
collection. In Australia, state training authorities are responsible for local information
concerning vocational occupations. In Germany and Switzerland, local employment
offices are responsible for collecting information on the unemployed and job vacancies.
This helps them identify local mismatches to support their job matching services. In
contrast, Canada only uses a top down approach where all information is collected by
the federal government, mainly Statistics Canada. This makes it difficult to obtain quality
information on local regions.
Compared to the other case countries, Canada devotes fewer resources to
counselling students, particularly upper secondary school students. Canadian career
counsellors do not receive the same degree of information as their counterparts in the
other cases, particularly Germany and Switzerland. Career counsellors can play a vital
role in helping job seekers enter the labour market and employers find suitable workers.
A review by Arseneau et.al. (2005) finds that labour market information has more impact
if provided with counselling. The ESDC also found that their labour market information is
more effective when job seekers receive counselling (HRSDC, 2005). In terms of
assisting disadvantage workers, intermediaries also help low-wage workers access
regional employment opportunities (Benner et. al., 2001).
All the jurisdictions examined also prioritize the provision of information in
secondary schools. However, Canadian secondary schools are not required to provide
students with information about career opportunities. Even more, Germany and
Switzerland design their education system to match labour market needs. In particular,
both countries provide apprenticeship education at the secondary level, and large
apprenticeship systems are associated with lower youth unemployment (Ryan and Piopiunik, 2012). Germany and Swiss students receive vocational education under a
dual system. In this dual system theory is taught in school and practical skills acquired
from workplace. Designing education programs to match employer needs requires good
tracking of labour market conditions. This requires a level of investment that ensures
data of sufficient quality. The fact that the other case countries invest more on collecting
and sharing labour market information reflects the responsibility the governments
assume to support job matching.

53
So, there are three major shortcomings in Canada: (1) lack of detailed
information on job vacancies, (2) little importance placed on career advisors and
counselling, (3) not providing students with information about career opportunities.
These issues motivate my policy options.

54
9. Policy Objectives, Criteria, and Measures
This section explains the policy objectives, criteria and measures to assess
policy options. First, I define the long and short term objectives to achieve. Then, I
describe the criteria and measures that will assess the options.
More efficient job matching should reduce Canada’s unemployment rate. Fortin
(2000) finds Canada’s natural rate of unemployment to be as low as 6%. Canada
reached a 6% unemployment rate – the lowest ever – in 2007 (Statistics Canada,
2014a). Given this, the long-term objective (10 years) is to have an unemployment rate
below 6%. To ensure Canada is on track to accomplishing this goal, a short-term
objective must be met. The short-term (5 years) objective is to match the lowest
unemployment and youth unemployment rate in Canadian history. This is an
unemployment rate of 6% and a youth unemployment rate of 11.2% in 2007 (Statistics
Canada, 2014a).
9.1. Criteria and Measures
The policy options are assessed on four criteria: development, equity,
administrative complexity, and budgetary impact. For each criterion there is a specific
measure. Each measure has an index which is used to rank each option. The ranking
system consists of high, medium, and low with numerical values 3, 2, 1 for three criteria.
The development criterion receives a higher numerical value (explanation below). The
scores for all measures are summed and the policy option with the highest score is
considered the most favourable. Table 8 summarizes the criteria and measures used to
assess the policy options.

55
Table 9: Criteria and measures for policy analysis
Criteria Definition Measure Value
Development
Ability to improve the capacity of individuals to make the optimal career decision.
Information is:
- Personalized
- Accompanied with guidance
- General
- Specific
High > 3-4
Medium = 2
Low < 1
High = 6
Medium = 4
Low = 2
Equity The ability to provide information to the entire population.
Proportion of population that have access to LMI.
population > 50%
25% <population < 50%
population < 25%
High = 3
Medium = 2
Low=1
Administrative Complexity
Levels of government involved
High = 1 level
Medium = 2 levels
Low > 3 levels
High = 3
Medium = 2
Low=1
Number of public/private agencies involved
High = 1 agency
Medium = 2-3 agencies
Low > 3 agencies
High = 3
Medium = 2
Low=1
Budgetary Impact
The increase in responsible organizations budget
How much will the budget increase (BI)?
BI ≤ 5%
5% < BI < 10%
BI ≥10%
High = 3
Medium = 2
Low=1

56
Development: This criterion is concerned with the ability to realize full human
potential by transforming personal capacities. It assesses whether an option improves
the ability of individuals to make an optimal career decision. According to behavioural
economics, individuals make flawed (sub-optimal) career decisions (Babcock et al,
2012) because they are limited in their capacity to deal with complex problems (Lyensew
and Lepper, 2000). The discipline does provide insights on how to address these
barriers to support career decision making and job matching. First, simply providing
labour market information is insufficient given individuals’ biases and misperceptions. It
is also important to consider how information will be understood by recipients (Babcock
et al., 2012). This means information is more effective when accompanied with guidance
(Diamond et al., 2012). Therefore, simply describing economic and labour market
conditions is insufficient. Individuals also need to understand their potential experience
given their skills and abilities. This means information and career advice is more
effective if it is simplified and personalized (Babcock et al, 2012).
Given these considerations the criterion involves four measures: measures 1.
and 2. concern personalized information, and provision of guidance; measures 3. and 4.
concern the level of information detail: general and specific. If the policy option can
provide information at the major occupational group level (two digit NOC level), then it is
general. Likewise, if the option can provide information at the minor occupational group
level (three or four digit NOC level), then it is specific. In all, the four characteristics
specify whether the information is personalized, accompanied with guidance, general, or
specific. As such, an alternative that meets three or more of the characteristics receives
a ranking of high; if it only meets two characteristics it receives a ranking of medium; and
if it provides only one or none of the characteristics it receives a ranking of low. Also, the
numerical weight for this criterion is double (H=6, M=4, L=2) given the importance of
helping individuals make well informed decisions.
Equity: This criterion concerns the ability of an alternative to provide labour
market information to the entire working-age population (ages 15 to 65). Ideally, every
working-age adult should be well informed about the labour market. The greatest need
for information is in young adult life because the likelihood of career change decreases
with age. To account for this I place a fairly low threshold to receive a high ranking. An
alternative that provides information to more than 50% of the working-age public is

57
ranked high; if it can only inform 25% to 50% of the public, it is ranked as medium; and if
it only informs less than 25% of the working-age population, it receives a low ranking.
Administrative Complexity: Since both the federal and provincial governments
are responsible for the labour market there can be significant administrative challenges
to implementing policies. To not understate this barrier, and ensure a feasible
recommendation, I include two measures for the administrative complexity criterion.
First, this criterion considers how many levels of government are involved. In Canada,
provinces are given substantial responsibilities and there are few examples of
coordinated federal-provincial policy making. Moreover, the level of coordination
required will vary across provinces. This is because some provinces and territories
produce considerable information while smaller provinces produce little or none. Even
regions within provinces and territories have different labour market concerns. Thus, a
policy becomes more complicated the more levels of government involved. As such, an
option that can be implemented by one level of government is ranked as high; an option
that requires coordination between the federal government and provincial governments
is ranked as medium; and an option that requires coordination among the federal,
provincial, and a sub-provincial authority is ranked as low.
Second, this criterion assesses the level of difficulty to implement an alternative.
The assessment is based on the amount of coordination required between public and
private agencies. An option that requires coordination among numerous organizations is
more difficult to implement because of the time required to determine the responsibilities
of various organizations. Therefore, an option that involves one agency is ranked as
high; an option that requires coordination among two or three agencies is ranked
medium; and an option that requires coordination among more than three agencies is
ranked as low.
Budgetary Impact: This criterion assesses the budgetary impact of implementing
a policy option. Since policy options are to be permanent, the interest is in ongoing
expenses incurred, not the startup (one-time) cost. Hence, budgetary impact considers
how an option impacts the responsible organizations’ operating expenses. Also, in 2011
the federal government announced a deficit reduction plan to reduce ongoing
government expenditures by at least $4 billion by 2014/15 (OIC, 2014). The plan

58
requires government departments to identify savings of 5% and 10% in their operating
budget (OIC, 2014). Therefore, an option that increases the budget by only five percent
or less is ranked as high; an option that increases cost by six to ten percent is ranked as
medium; and an option that increases the budget by greater than ten percent is ranked
as low.
Of note, there are financial benefits derived from options that can enhance job
matching and reduce unemployment and underemployment. For instance, increase
income and consumptions tax revenue due to higher employment; increase in business
tax revenue because more efficient job matching supports business development;
decrease in number of people that rely on government income assistance. However,
these future benefits are difficult to measure because I cannot ascertain by how much an
option will reduce unemployment.

59
10. Policy Options and Analysis
The proposed policy options are intended to improve the current labour market
information system to better facilitate job matching. These options are analyzed
independently to determine which ones are optimal. Although policies are analyzed
independently, they are not mutually exclusive.
10.1. Policy Option 1: Job Vacancy Survey
Current information on job vacancies is inadequate. Statistics Canada’s Business
Payrolls Survey (BPS) only asks two questions about vacant positions. The Working in
Canada website lists current job vacancies but no detailed information about vacancy
problems. This option proposes to develop a new comprehensive survey to obtain
reliable and detailed information about job vacancies. This survey should be a random
sample of businesses by industry, size, and region. The 2009 Advisory Panel for
Labour Market Information also recommended a quarterly national job vacancy survey
to provide policy makers with reliable data on labour market tightness (Advisory Panel
for Labour Market Information, 2009). A job vacancy survey will also complement the
labour force survey by providing insight on whether the labour supply matches by
region and sector the labour demand (Advisory Panel for Labour Market Information,
2009). A new job vacancy survey should obtain the following information about
vacancies:
• The specific occupational vacancy
• The number of job vacancies
• The type of job (e.g. full-time or part-time)
• The duration of the job vacancy
• The skills, training, and experience requirements for the vacant position
• An explanation from employers’ on their labour recruitment issues.
• Expectations about future job demand

60
Development: This new survey asks questions to obtain more detailed
information on job vacancies than is currently available. Obtaining such data means it
will provide general and specific occupational information. However, this information will
not necessarily be accompanied with guidance or be personalized for job seekers. In all,
this alternative provides two measures and receives a rank of medium (4 points).
Equity: Statistics Canada publishes all their results online but it is not meant for
the general public. It is typically used by government agencies and researchers
(Statistics Canada, 2013b). For this reason I expect the same users to utilize information
from this survey. To determine what proportion of the working-age population will access
this information I consider the number of individuals employed in the federal general
government, provincial and territorial general governments, and universities/colleges/
vocational and trade institutions. This gives an estimate of the proportion of the working-
age public that will likely access the information. These institutes employ approximately
1.2 million people (Statistics Canada, 2012b), which is approximately 5% of the working-
age population. Given this alternative will reach less than 25% of the working-age
population it receives a ranking of low (1 point).
Administrative Complexity: This alternative will be the responsibility of Statistics
Canada so it only involves one level of government, the federal government. It receives
a ranking of high (3 points). Moreover, this survey only needs to be conducted by one
government agency, Statistics Canada. Since this alternative only requires one
organization it again receives a ranking of high (3 points).
Budgetary Impact: The 2009 Advisory Panel estimated the cost of a national job
vacancy survey to be $8 million (Advisory Panel for Labour Market Information, 2009). In
fiscal year 2011/12 Statistics Canada expenditures were approximately $740 million
(TBS, 2011). According to the Bank of Canada Inflation Calculator, $ 8 million in 2009
dollars is approximately $8.5 million in 2012 dollars (Bank of Canada, 2014). This means
policy option one will increase Statistics Canada’s budget by approximately 1%.
Therefore it receives a ranking of high (3 points).

61
10.2. Policy Option 2: Career Information Seminars in Secondary Schools
Secondary students have access to career services but they are not provided
information on career opportunities. This option proposes to offer secondary school
students career information seminars and one-on-one sessions. There should be two
types of seminars, one for students who plan to attend university; and another for
students not planning to attend university. The first seminar should provide students with
information on the economy and major industries; description of major occupations;
careers and outcomes associated with respective degrees; description and projections
of major occupational groups; projected growth of major industries; and wage
expectations. The second seminar should provide information on careers that do not
require an undergraduate degree; description of careers; outcomes of schools drop outs;
wage expectations.
These seminars should be followed with one-on-one sessions between students
and career counsellors. In these sessions, students can inquire about potential career
and education paths of interest. Counsellors can also assist students on career
exploration activities. These sessions allow advisers to be more specific in the
information they provide according a students’ preferences and performance. Most
importantly, career counsellors can emphasize the importance of education to potential
school drop-outs.
Attendance at least one of the seminars and a one-on-one session should be
mandatory to fulfill graduation requirements. Career information seminars will help
students understand the economy, major industries, and occupational groups. The one-
on-one sessions can encourage students to seriously consider education paths and
explore possible career options.
Development: Given the quality of labour market information currently available
these seminars should only provide information at the major occupational group level
(two digit NOC). This can help students identify promising fields of academic study and
career paths. Seminars are not suitable to provide information on specific occupations (3
or 4 digit NOC level) considering the lack of reliability at that detail. As noted earlier,

62
different sources sometimes provide contradictory results about projections for specific
occupations. These seminars do provide students with guidance to understand the
information and labour market conditions. Furthermore, the one-on-one sessions can
provide students with personalized information. Overall, this alternative provides three
out of the four measures: general information and guidance with information; therefore
this alternative receives a rank of high (6 points).
Equity: This alternative is very specific since it targets secondary school
students. In 2011/12 there were approximately 1.9 million secondary school (grade 8 to
12) students in Canada (Statistics Canada, 2013c). Since this represents approximately
8% of the working-age population this policy option receives a ranking of low (1 point).
Administrative Complexity: This policy requires co-ordination between the
provincial government and school districts. School districts being a sub-provincial
authority are treated as a level of government. Since this option involves two levels of
government, it receives a ranking of medium (2 points).
This alternative also requires co-ordination between the provincial agency
responsible for the labour market, post-secondary schools, and local schools boards.
Agencies are required to develop information packages; post-secondary institutes would
provide information about programs and outcome of graduates, and school boards are
responsible for ensuring seminars are delivered in schools. Co-ordination is required to
ensure information is comprehensible and consist across the province. Given this option
requires co-ordination among three organizations; it receives a ranking of medium (2
points).
Budgetary Impact: Since provinces are responsible for education, I estimate the
cost for BC as an example. Given BC already provides labour market information
(mainly internet delivery) they are only required to use the same information to create
seminar packages for schools. The cost for delivering seminars is incurred by school
districts. These seminars can be delivered in a classroom setting with resources
available in schools; therefore, the only cost is for labour and no additional administrative
costs.

63
At least one employee is required in each school to learn and deliver information
to students. Schools with large student populations can be accommodated by having
multiple seminars. In BC the average weekly earnings of an employee in the education
sector is $966 (BC Statistics, 2014), which is an annual salary of approximately $46,000.
There are 446 BC public secondary schools (BCTF, 2012). This policy generates a cost
of approximately $21 million. For fiscal year 2013/14 the operating expenditures for BC
school districts totalled about $5 billion. Career programs, at $36 million, only account for
0.7% of total expenditures (BCMEd, 2014). Although this option will increase spending
on career programs by approximately 60%, it will increase operating expenditures by
only 0.4%. Therefore, this alternative receives a ranking of high (3 points).
10.3. Policy Option 3: Independent Agency for Labour Market Information
This option proposes to create an independent agency responsible for labour
market information. This agency should receive all labour market information that is
collected from the various public and private entities to be synthesized, analyzed, and
disseminated to target population groups. Having a single organization responsible for
labour market information can create a more efficient system because it can identify
collection tools that should be enhanced or information collection that is unnecessary.
This will address the problem of duplicated information gathering and contradictory
information. The Forum for Labour Market Ministers is likely the appropriate body to
oversee this agency. The Forum is an organization that includes all ministers in Canada
responsible for labour market issues including information.
This policy option also creates a single source of quality and reliable information
for career practitioners. For this reason, policy option three can complement and
enhance policy option two. More valuable information will increase the quality of the
career information seminars and the ability of counsellors to advise students in the one-
on-one sessions. Even more, this option can be an information source for advisors in
post-secondary institutions and counsellors that help the unemployed. Overall, a new
agency can build partnerships with schools and employment service offices to ensure
job seekers have quality labour market information.

64
In fact, The 2009 Advisory Panel discussed the possibility of an independent
agency, modeled after the Canadian Institute for Health Information (CIHI), to improve
the labour market information system. CIHI was established by the federal and
provincial, and territorial governments to serve as an independent, non-profit
organization to provide data and analysis on the Canadian healthcare system and the
populations’ health. CIHI collects information from governments, medical practitioners,
regional health authorities, and hospitals. The institute also provides guidance and
advice to Statistics Canada’s Health Statistics Division, Conference of Deputy Ministers
of Health, and the Chief Statistician of Canada (Advisory Panel for Labour Market
Information, 2009).
Development: This organization is responsible for analyzing labour market
information from various sources to help end users understand of labour market
conditions. Also, an equivalent organization in Switzerland is able to provide general and
specific labour market information. For this reason, a similar agency in Canada should
also be able to provide general and specific information. In terms of providing guidance,
the office is expected to interpret data and make it understandable to end users. More
importantly, this office is meant to be the source for labour market information for career
counsellors in schools, universities, and employment services. For this reason the
information will be accompanied with guidance. Since three measures are met this
alternative receives a ranking of high (6 points).
Equity: This alternative will provide information to people likely to use the
services of career and academic advisors: students, unemployed individuals, and
underemployed individuals. For the student population I consider secondary students
and post-secondary students; and for the unemployed and underemployed population I
consider people unemployed, not in labour force, and part-time employed. Given many
students work part-time I consider part-time employment at age 25 and over to avoid
double counting. In 2012 these five groups accounted for approximately 12.5 million
(Statistics Canada 2013d; 2014), which is approximately 53% of the working-age
population. Therefore, this alternative receives a ranking of high (3 points).

65
Administrative Complexity: The purpose of this agency is to provide reliable and
comprehensive information that supports job matching. The federal government, being
the largest provider of information, will take the lead responsibility. The provinces also
collect information and are responsible for employment services. This means the federal
government will have to partner with provinces to provide job seekers with reliable
information. Further, providing students with information require partnership with school
boards and universities, which are sub-provincial authorities. Therefore, in terms of
levels of government involved, this policy receives a ranking of low (1 point).
This agency will also have to co-ordinate with every public and private agency
that collects information related to the labour market. At the federal level this includes
Statistics Canada and ESDC; provincial agencies responsible for labour and education;
and industry associations. Given this alternative requires co-ordinate with at least five
agencies; it receives a ranking of low (1 point).
Budgetary Impact: Since ESDC is the department responsible for labour market
issues, I assign funding for this alternative to their budget. In fiscal year 2012/13 ESDC
net operating expenses totalled approximately $1 billion (HRSDC, 2013b). The 2009
Advisory Panel noted Canadian Institute for Health Information (CIHI) as a possible
model for this option (Advisory Panel for Labour Market Information, 2009). For fiscal
year 2012/13 CIHI’s budget was approximately $114 million (CIHI, 2012). Using CIHI as
a reference means this alternative increases the operating expenses by about 11%.
Since it increases the budget by more than 10%, it receives a ranking of low (1 point).

66
Table 10: Summary of policy analysis
Option 1 Option 2 Option 3
Job Vacancy Survey
Career Information Seminars and Sessions
Independent Agency
Development
Medium
(4)
High
(6)
High
(6)
Equity
Low
(1)
Low
(1)
High
(3)
Administrative complexity
Levels of government
High
(3)
Medium
(2)
Low
(1)
Number of agencies
High
(3)
Medium
(2)
Low
(1)
Budgetary impact
High
(3)
High
(3)
Low
(1)
Total 14 14 12

67
10.4. Policy Recommendation
My analysis shows option 1 and option 2 tied for the highest ranking, but all three
options are fairly close in their scores. Among the three policy options only option 3
receives a high ranking for the equity criterion, reaching more than 50% of the working-
age population. Whereas, both option 1 and 2 reach a relatively small proportion of the
working-age population.
The rankings vary for administrative complexity. Since option 1 is only the
responsibility of Statistics Canada, it is the least complex and receives the only high
ranking. Both option 2 and 3 require coordination, with option 3 being the most complex
to coordinate, and thus receiving the lowest ranking. Even though the costs of the
options vary considerably, both options 1 and 2 have a budgetary impact of less than
five percent. The most expensive policy is option 3 at an estimated $114 million and the
only option with a budgetary impact greater than 10%. Overall, policy options 1 and 2
are relatively less effective but inexpensive and simple to implement. Likewise option 3
can be considered the most effective but also very difficult and expensive to implement.
Although the total score for the policy options are fairly close together, the scores vary
significantly among the criteria.
Given my results, policy option 1 and option 2 should be implemented
immediately. This option is easy to adopt given it received the highest ranking for
administrative complexity and budgetary impact. However, the option 1 survey only
collects vital information; it does not disseminate information to support job matching.
So, policy option 2 is also important to implement. Career information seminars and
sessions support job matching by providing students with valuable information and
assisting them with career planning. Since this option requires planning it should be
adopted within 2-3 years. These two options can help reach the short-term goal of
reaching the unemployment and youth unemployment rate experienced before the 2008
economic downturn.

68
Policy option 3, an independent agency responsible for labour market information
should have future consideration. The drawbacks of creating such an agency are long
start up time (Advisory Panel for Labour Market Information, 2009), the operating cost,
and number of stakeholders that must coordinate. However, my analysis indicates that
this option is the most effective in supporting job matching. In fact, the case countries
with the lowest unemployment rates have independent organizations responsible for
analyzing and providing information to target population groups. These organizations
partner with education institutes and employment service offices to support career
counsellors in providing job matching services. Further, the Canadian Institute for Health
Information already shows precedent for such an agency. Although this policy is
expensive it should be considered when the fiscal situation is favourable and
stakeholders are consulted.
These recommendations address the major gaps in Canada’s system that
contributes towards a labour market mismatch. More importantly, these policy
recommendations provide a foundation to build a more sophisticated system to
effectively facilitate job matching. For instance, Germany and Switzerland tailor their
education system to meet labour market needs and ease the transition for students from
school to work. Also, their respective organizations responsible for labour market
information support the ability of career counsellors in finding work opportunities for the
unemployed.

69
11. Conclusion
Currently young people are not provided quality labour market information to
make career decisions. As a result, many young people select fields of study associated
with low employment prospects. In addition, employers are experiencing difficulty in
finding workers. Government training programs meant to address this problem (e.g.
Canada Job Grant) are being developed with inadequate information. These issues exist
despite the multiple sources of labour market information available in Canada. So, the
policy problem to address is the inadequate labour market information system that is
contributing towards inefficiency in the labour market.
This study conducts a case study analysis to determine how to construct a
system that can align labour supply and demand. My examination of case studies
identified gaps in Canada that are resulting in a labour market mismatch. The countries
examined invest more in obtaining information about labour market conditions; they
place considerable importance on the role of career practitioners; and their education
system is an important channel to provide information to support career planning.
Three policy options are derived from my case study findings: a new job vacancy
survey; career information seminars and one-on-one sessions in secondary schools; and
a new independent agency solely responsible for analyzing and sharing labour market
information. These options are assessed using four criteria to determine which options to
adopt in Canada. A new job vacancy survey and career information seminars and
sessions ranked the highest. These two options ranked high due to being the most
simple and inexpensive to implement. A new information agency is found to be the most
effective but also the most difficult administratively and costly.
My policy recommendations are to first implement a new job vacancy survey and
career information seminars and sessions in secondary schools. These policies are
simple and inexpensive to implement. Then in long term the federal government should

70
consider establishing a new agency responsible for labour market information. Important
consideration for a new agency is the cost and collaboration required to be successful.
Much attention is given to the skills mismatch in the labour market. Despite the
challenge in addressing this problem, solutions exist. The 2009 Advisory Panel
conducted a comprehensive assessment on how to enhance Canada’s labour market
information. The Panel provided 14 recommendations with as estimated cost of $49.4
million (Advisory Panel for Labour Market Information, 2009). This study provides insight
into how to develop a system that facilitates job matching. Ultimately, if governments are
willing to make the investment and effort they can help find jobs for people, and people
for jobs.
71
References
Advisory Panel on Labour Market Information. (2009). Working Together to Build a Better Labour Market Information System for Canada.
Arseneau, S., Bilodeau, C., Michaud, G., & Savard, R. (2005). The Impact of LMI on the Career Decision-Making Process: Literature Review.
Australian Bureau of Statistics. (2014).Australian Bureau of Statistics. Retrieved January 25, 2014, from http://www.abs.gov.au/
Australian Department of Employment. (2012). Job Outlook - Make Your Career a Reality. Retrieved January 26, 2014, from http://joboutlook.gov.au/
Australian Department of Employment (2013). Skill Shortage Research Methodology.
Australian Department of Employment. (2014). Vacancy Report. Labour Market Information Portal. Retrieved January 26, 2014, from http://lmip.gov.au/
Babcock, L., Congdon, W. J., Katz, L. F., & Mullainathan, S. (2012). Notes on behavioral economics and labor market policy. IZA Journal of Labor Policy, 1(1).
Bank of Canada. (2014). Inflation Calculator. Retrieved from http://www.bankofcanada.ca/rates/related/inflation-calculator/
BC Statistics. (2014). Earnings. Retrieved February 10, 2014, from http://www.bcstats.gov.bc.ca/StatisticsBySubject/LabourIncome/Earnings.aspx
British Columbia Ministry of Education (BCMEd). (2014). BC School District Revenue and Expenditure Tables 2013/14, Provincial Summary of Budgeted Operating Expenditures by Function, Program and Object, table 6.
British Columbia Teachers’ Federation (BCTF). (2012). 2012 BC Education Facts
Benner, C., Brownstein, B., Dresser, L., & Leete, L. (2001). Staircases and Treadmills : The Role of Labor Market Intermediaries in Placing Workers and Fostering Upward Mobility.
Brisbois, R., Ortin, L., & Saunders, R. (2008). Connecting Supply and Demand in Canada’s Youth Labour Market. Canadian Policy Research Networks.
Canadian Chamber of Commerce, (2012). Canada’s Skills Crisis : What We Heard generous support of our sponsors.

72
Canadian Institute for Health Information (CIHI). (2012). 2012/2013 Operating Plan and Budget
Connecting Canadians with Available Jobs. (2013). Service Canada.
de Broucker, Patrice. (2006). Post-secondary Education in Canada: A Vision from Canadian Youth. Ottawa: Canadian Policy Research Networks.
Diamond, A., Vorley, T., Roberts, J., & Jones, S. (2012). Behavioural Approaches to Understanding Student Choice. The Higher Education Academy.
Duval, A., Gervais, G., and Li, C. (2001). The Dynamics of Overqualification : Canada’s Underemployed University Graduates. Statistics Canada.
Employment and Social Development Canada (ESDC), Canadian Occupational Projection System (COPS) About the Pojections. (2011). Retrieved from http://www23.hrsdc.gc.ca/[email protected]?cid=3
Employment and Social Development Canada (ESDC). (2011) Canadian Occupational Projection System. Retrieved from http://www23.hrsdc.gc.ca/[email protected]
Employment and Social Development Canada. (2014). Canadian Occupational Projection System Glossary. Retrieved from http://www23.hrsdc.gc.ca/[email protected]
Field, S., Grubb, W. N. & Hoeckel, K., S. (2009). Learning for Jobs OECD Reviews of Vocational Education and Training Switzerland.
Fortin, P. (2000). Macroeconomic Unemployment and Structural Unemployment. Canadian Public Policy, 26, 125 – 130.
Germany Trade and Investment. (2013). Labor-Related Incentives.
German Rectors' Conference (2014). Higher-Education Compass. Retrieved January 26, 2014, from http://www.hochschulkompass.de/en/
Mendelson, M., & Zon, N. (2013). The Training Wheels Are Off : A Closer Look at the Canada Job Grant. Caledon Institute of Social Policy. Caledon Institute of Social Policy.
Heijke, H. (1996). Labour Market Information for Educational Investments. Research Centre for Education and the Labour Market.
House of Commons Committee. (2012). Labour and Skills Shortages in Canada : Addressing Current and Future Challenges.
Human Resources and Skills Development Canada. (2011). Imbalances Between Labour Demand and Supply 2011-2020, 1–22.

73
Human Resources and Skills Development Canada. (2013). About the NOC 2011. Retrieved from http://www5.hrsdc.gc.ca/NOC/English/NOC/2011/AboutNOC.aspx
Human Resources and Skills Development Canada. (2013b). 2013-14 Report on Plans and Priorities.
Human Resources and Skills Development Canada. (2005). Summative Evaluation of HRSDC Labour Market Information Products and Services.
Institute for Research on Public Policy (IRRP). (2010. From Compulsory to Voluntary long form census: What We Stand to Lose. Policy Options. Retrieved from http://www.irpp.org/en/po/afghanistan/from-compulsory-to-voluntary-longform-census-what-we-stand-to-lose/
Lyengar S, Lepper M (2000) When Choice is Demotivating: Can One Desire Too Much of a Good Thing? Journal of Personality and Social Psychology.79:995–1006
Larochelle-Côté, S. (2013). Employment instability among younger workers. Statistics Canada.
Lefebvre, B. R., Simonova, E., & Wang, L. (2012). Labour Shortage in Skilled Trades. Certified General Accountants of Canada.
Mendelson, M., & Zon,, N. (2013). The Training Wheels Are Off: A Closer Look at the Canada Job Grant. The Caledon Institute of Social Policy.
Miner, R. (2012). Jobs of the Future: Options and Opportunities. Miner Management Consultants.
Navigation and service. (2014). Federal Statistical Office (Destatis). Retrieved January 26, 2014, from https://www.destatis.de/EN/Homepage.html
National Skill Development Corporation (NSDC) India (2011). Concept Paper on Labour Market Information System: An Indian Perspective.
Office of the Information Commissioner (OIC). (2014). Deficit Reduction Plan Office of the Information Commissioner Canada. Retrieved from http://www.oic-ci.gc.ca/eng/abu-ans_cor-inf-inf-cor_drap-pard.aspx
O’Grady, J. (2011). Outlook for Human Resources in the ICT Labour Market, 2011–2016. Information and Communications Technology Council. Information and Communications Technology Council.
O’Leary, C., & Woods, J. (2006). Conceptual Framework for an Optimal Labour Market Information System : Final Report. W.E. Upjohn Institute for Employment Research.
O’Rourke, D. (2012). GenerationFlux : Understanding the Seismic shifts that are shaking Canada’s Youth. Community Foundations of Canada.

74
Organisation for Economic Co-operation and Development (OECD) (2002). OECD Review of Career Guidance Policies Germany Country Note.
Organisation for Economic Co-operation and Development (OECD). (2012a). Country Note: Canada, Education at a Glance: OECD Indicators 2012
Organisation for Economic Co-operation and Development (OECD). (2012). Better Skills Better Jobs Better Lives: A Strategic Approach to Skills Policies.
Organisation for Economic Co-operation and Development (OECD). (2013). Employment and Labour Markets: Key Tables from OECD. OECD iLibrary. Retrieved, from http://www.oecd-ilibrary.org/employment/employment-and-labour-markets-key-tables-from-oecd_20752342
Organisation for Economic Co-operation and Development (OECD). (2014). Youth neither in employment, education nor training (NEETs). Society at a Glance 2014: Social Indicators
Piopiunik, M., & Ryan, P. (2012). Improving the transition between education/training and the labour market: What can we learn from various national approaches? European Expert Network on Economics and Education (EENEE).
Rai, V. (2013). Labour Market Information for Employers and Economic Immigrants in Canada : A Country Study. Ottawa: Centre for the Study of Living Standards.
Federal Employment Agency. (2013). Service Navigation. Retrieved from http://www.arbeitsagentur.de/web/content/DE/index.htm
Federal Statistical Office of Germany (2014). Microcensus. Retrieved from https://www.destatis.de/EN/Meta/abisz/Mikrozensus_e.html
Sharpe, A., & Qiao, S. (2006). The Role of Labour Market Information for Adjustment : International Comparisons. Centre for the Study of Living Standards. Ottawa
Statistics Canada (2012a). Business Payrolls Survey Questionnaire.
Statistics Canada (2012b). CANSIM, table 183-0002.Public sector employment, wages, and salaries, by province and territory. Retrieved February 35, 2014, from http://www.statcan.gc.ca/tables-tableaux/sum-som/l01/cst01/govt62a-eng.htm
Statistics Canada (2013). CANSIM, table 284-0001. Job vacancy statistics (JVS), job vacancy rate by North American. Retrieved September 27, 2013, from http://www5.statcan.gc.ca/cansim/a26?lang=eng&retrLang=eng&id=2840001&pattern=284-0001..284-0004&tabMode=dataTable&srchLan=-1&p1=-1&p2=31
Statistics Canada (2013). CANSIM, table 284-0003 - Job vacancy statistics (JVS), unemployment-to-job vacancies ratio. Retrieved September 27, 2013, from http://www5.statcan.gc.ca/cansim/a26?lang=eng&retrLang=eng&id=2840003&pattern=284-0001..284-0004&tabMode=dataTable&srchLan=-1&p1=-1&p2=31

75
Statistics Canada (2013b). Labour Force Survey. Retrieved from http://www23.statcan.gc.ca/imdb/p2SV.pl?Function=getSurvey&SDDS=3701&Item_Id
Statistics Canada. (2013c). CANSIM, table 477-0025. Enrolments in regular programs for youth in public elementary and secondary schools, by grade and sex, Canada, provinces and territories. Retrieved February 25, 2014, from. http://www5.statcan.gc.ca/cansim/a26?lang=eng&retrLang=eng&id=4770025&pattern=477-0025..477-0028&tabMode=dataTable&srchLan=-1&p1=-1&p2=31
Statistics Canada. (2013d). CANSIM, table 477-0029. Postsecondary enrolments, by program type, credential type, Classification of Instructional Programs, Primary Grouping (CIP_PG), registration status and sex. Retrieved from February 24, 2014 from
http://www5.statcan.gc.ca/cansim/a26?lang=eng&retrLang=eng&id=4770029&tabMode=dataTable&srchLan=-1&p1=-1&p2=9
Statistics Canada (2014a). CANISM, table 282-0002. Labour force estimates by sex and detailed age group. Retrieved February, 22, 2014 from http://www5.statcan.gc.ca/cansim/a26?lang=eng&retrLang=eng&id=2820002&tabMode=dataTable&srchLan=-1&p1=-1&p2=9
Statistics Canada (2014b). CANISM, table 282-0004. Labour force survey estimates (LFS) by educational attainment sex and age group. Retrieved February, 22, 2014 from http://www5.statcan.gc.ca/cansim/a26?lang=eng&retrLang=eng&id=2820004&tabMode=dataTable&srchLan=-1&p1=-1&p2=9
University of Konstanz (2013). Student Survey in Germany 1983 to 2013. Retrieved from http://cms.uni-konstanz.de/en/ag-hochschulforschung/student-survey-in-germany/
Swiss Federal Statistical Office (FSO). (2014). Graduate Survey Overview. Retrieved fromhttp://www.bfs.admin.ch/bfs/portal/en/index/infothek/erhebungen__quellen/blank/blank/bha/01.html
The World Bank (2014). GDP per capita (current US$).Data. Retrieved February 24, 2014, from http://data.worldbank.org/indicator/NY.GD
Treasury Board of Canada Secretariat (TBS). (2011). 2011-12 Estimates Parts I and II The Government Expenditure Plan and The Main Estimates.
Universities Australia. (2010). Universities Australia. Retrieved January 26, 2014, from http://www.universitiesaustralia.edu.au/

76
Appendix A: Witness testimony to the House of Commons Standing Committee
Major occupational
group Industry association Labour concerns
STEM
Mining industry Human Resources Council
Need an additional 3990 STEM professionals by 2021
The Canadian Association of Petroleum Producers
Need an additional 9500 employees by 2015 and 50,000 to 130,000 by 2020.
Engineers Canada Between 2012 and 2018 civil ranked 4 out of 5, indicating a shortage
ICT ICT Council
Shortage of computer and information systems managers, Telecommunications, information systems Analysis, and broadcast technicians.
Surplus of Computer Programmers, computer network technicians, and use support technicians.
Healthcare
Canadian Federation of Medical Students Oversupply of family doctors in Ontario
Canadian Dental Association No shortage
Dieticians of Canada experiencing shortages especially in rural, remote, and northern communities
Canadian Association of Occupational Therapists
Flawed measure of need for occupational therapists
Canadian Nurses Association
Currently shortage of 11,000 FTEs, and expected to reach 60,000 FTEs by 2022.
Canadian Society of Medical Laboratory Science
Insufficient number of candidates to replace retiring workers
Skilled Trades
Canadian Automotive Repair and Service Council
29% of employers have one or more unfilled positions
Canadian Electricity Association
Need to recruit 45,000 new employees between 2011 and 2016.
Mining Industry Human Resources Council
Ernst and Young ranked labour shortage as the industry's highest risk.
Source: House of Commons Committee (2012)

77
Appendix B: Canadian National Occupation System
The National Occupational Classification (NOC) is a system for classifying the Canadian occupations by skill level and type. The NOC code is a four-digit code, and each digit helps specify an occupation and reflects its traits. The first digit designates an occupation into one of the 10 skill types. The second digit represents the four skill levels from A to D. Where A is university education, B is college or apprenticeship training, C is high school, and D is on the job training. The first two digits give the major occupational groups the third digit divides the major occupational groups in 140 minor groups. The minor group level pinpoints the domain of an occupation. The fourth digit gives the unit group and identifies the actual occupational group. At the four-digit level the system is expanded into 500 occupational groups or unit groups.

78
Appendix C: Findings from W.E. Upjohn Institute and NSDC India
Features of an optimal labour market information system according to W.E. Upjohn Institute for Employment Research (O’Leary and Woods, 2006):
1. Governance and cost effectiveness. 2. Timely, accurate, and relevant data. 3. Analysis and interpretation add value to data. 4. Labour market analysts are integral to an optimal LMI system. 5. Information must be easily accessible. 6. Intermediaries should be regarded as part of an LMI system. 7. Job seekers, businesses, and institutions public and private are likely to make many labour market related choices and decisions over their lifetime—an optimal LMI system should educate users to increase the impact of labour market intelligence.
Leading practices for labour market information systems according to The National Skill Development Corporation India (NSDC) India (NSDC India, 2011):
1. Government ownership 2. One-stop shop for all users
3. User friendly features 4. Efficient data management
5. Easy accessibility

79
Appendix D: Optimal labour market information system
Data Category Data Element
Supply and demand
side
Labour force and
market data
population/demographics
Population estimates
Employment
Labour Force Participation
Unemployment rate
labour force characteristics
Detailed labour force characteristics
Insured unemployed
Demand side
Demand data
job openings
Job vacancies
Labour costs
Occupational employment estimates
Occupational projections short term - 10 years
Occupational projections long term - 5 years or less
Industry employment estimates
Industry employment projections
Industry Staffing patterns
Occupational distribution across industries
Mass layoff data
Business births/deaths
Number of business establishments and size
Industry average earnings
Occupational wages
Occupational characteristics
Tasks
Tools and Technology
Knowledge
skills including essential skills
abilities
work activities
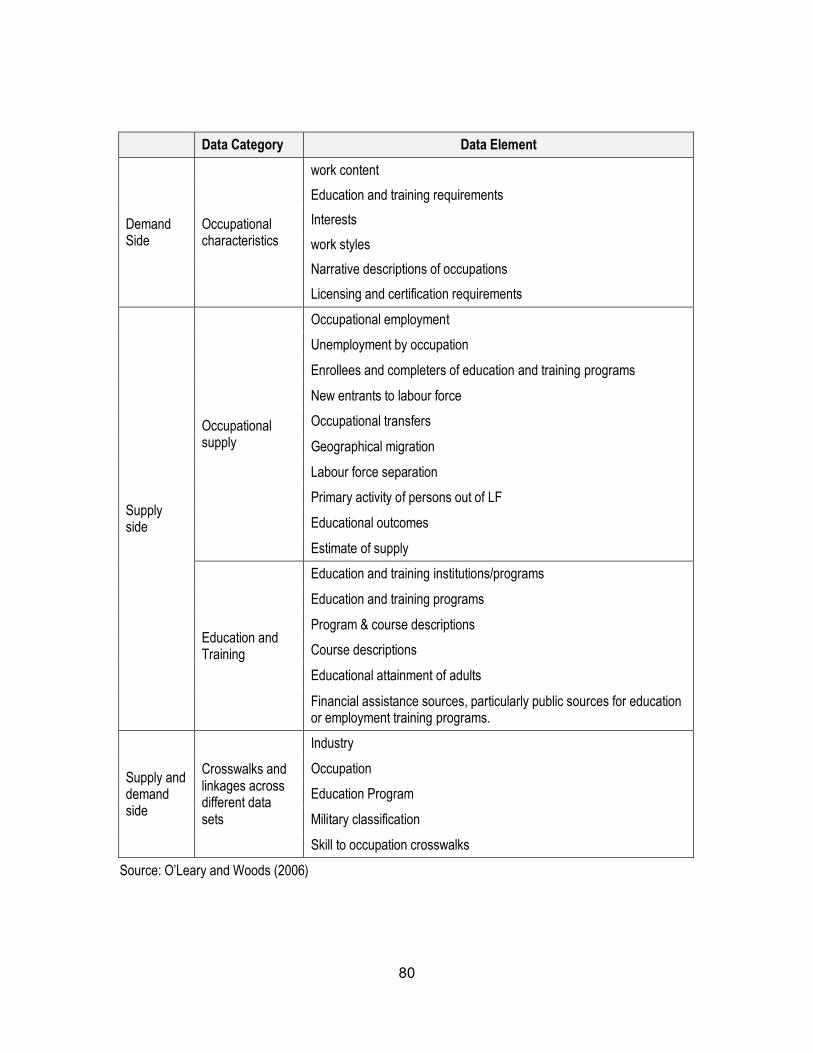
80
Data Category Data Element
Demand Side
Occupational characteristics
work content
Education and training requirements
Interests
work styles
Narrative descriptions of occupations
Licensing and certification requirements
Supply side
Occupational supply
Occupational employment
Unemployment by occupation
Enrollees and completers of education and training programs
New entrants to labour force
Occupational transfers
Geographical migration
Labour force separation
Primary activity of persons out of LF
Educational outcomes
Estimate of supply
Education and Training
Education and training institutions/programs
Education and training programs
Program & course descriptions
Course descriptions
Educational attainment of adults
Financial assistance sources, particularly public sources for education or employment training programs.
Supply and demand side
Crosswalks and linkages across different data sets
Industry
Occupation
Education Program
Military classification
Skill to occupation crosswalks
Source: O’Leary and Woods (2006)

81
Appendix E: NEET rates among the OECD, aged 15/16- 24,all persons (%)
Country Total Unemployed Inactive
Greece 27.4 14.7 12.6
Turkey 26.7 4.5 22.2
Italy 21.4 9.8 11.5
Mexico 21.1 3.6 17.5
Spain 19.6 13.2 6.4
Slovak Republic 18.5 10.8 7.7
Ireland 16.7 9.2 7.5
Portugal 15.3 10.4 4.9
Hungary 15.1 7.3 7.8
United States 15.0 5.7 9.3
Belgium 13.9 6.4 7.5
New Zealand 13.7 5.7 8.0
United Kingdom 13.5 7.1 6.4
France 13.2 8.9 4.4
OECD average 12.6 5.9 6.7
Poland 12.2 6.9 5.4
Australia 12.2 5.0 7.1
Estonia 11.2 4.2 7.0
Luxembourg 10.5 4.5 5.9
Slovenia 10.0 6.3 3.7
Canada 9.6 4.5 5.1
Czech Republic 9.1 5.7 3.4
Finland 8.4 3.5 4.9
Germany 7.6 3.0 4.6
Sweden 7.2 3.7 3.5
Japan 6.9 2.7 4.2
Norway 6.7 2.2 4.5
Austria 6.2 3.1 3.1
Switzerland 6.0 2.5 3.5
Iceland 5.9 3.6 2.3
Denmark 5.9 1.9 3.9
Netherlands 4.6 1.7 2.8
Source: OECD (2014)