finding a statistical edge with mean reversion trading · managing rtm strategies • psychological...
TRANSCRIPT

Finding a Statistical Edge with Mean Reversion Trading

Evidence Based Technical Analysis
• Technicians attempt to use past market data to predict future market patterns.
• Many common technical systems come as the result of ‘data mining’

The Scientific Method for Technicians
• Observe phenomena through Data Mining or other methods
• Hypothesize a method (trading strategy) that will capture a given advantage and optimize.
• Test the hypothesis by analyzing the strategy on ‘Blind’ data.
• Further analysis on stability of the solution.

Data Mining
• (n) Data Mining -data processing using sophisticated data search capabilities and statistical algorithms to discover patterns and correlations in large preexisting databases; a way to discover new meaning in data. (via WordNet)
• Proper use of data mining can significantly increase strategy performance.
Mining for Patterns
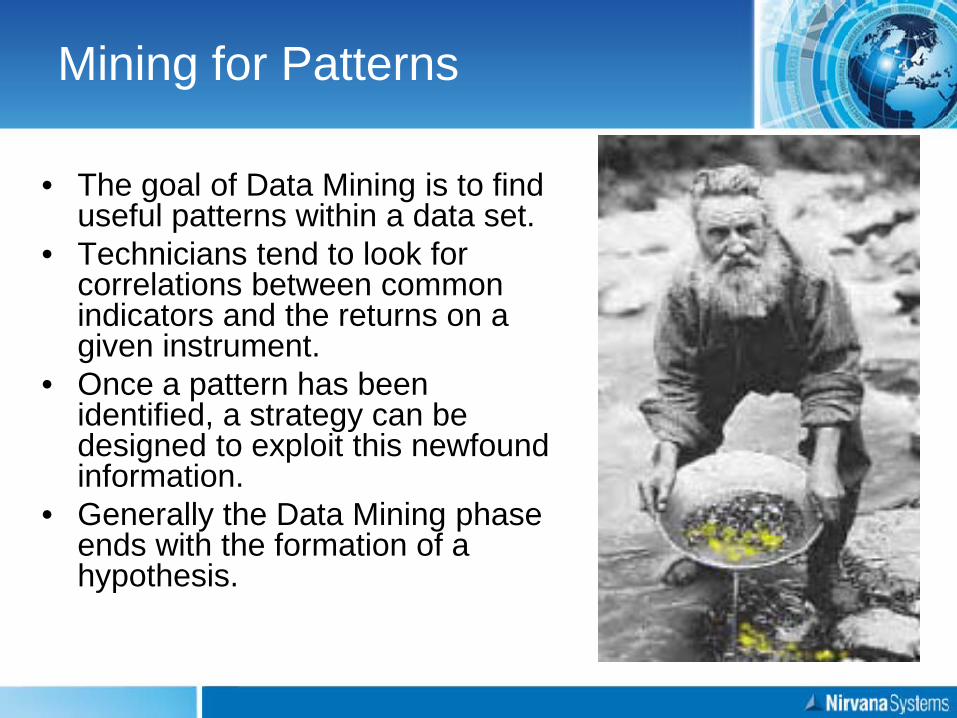
• The goal of Data Mining is to find useful patterns within a data set.
• Technicians tend to look for correlations between common indicators and the returns on a given instrument.
• Once a pattern has been identified, a strategy can be designed to exploit this newfound information.
• Generally the Data Mining phase ends with the formation of a hypothesis.

A Quick Example: CCI
• The above chart shows binned data from a six period CCI with the associated price change in the chart over the next three bars.
• The data shows that price changes in the dataset tended to be higher when the value of the CCI fell into the lower bins.

Limitations of Data Mining
• Data Mining is extremely useful for generating trading ideas and forming hypothesizes.
• But Mining is only the beginning of the story.
• Any methods identified by Data Mining will require further testing on separate “blind” data for validation.

Stability of Parameter Values
• To increase the likelihood of a success, parameter stability tests should be performed.
• Optimization of key parameters should always be accompanied by a stability test to prevent sampling errors.
• We generally use the same data set used for Data Mining when tuning parameter values.

Single Parameter Stability
Parameter Stability Example
-0.50%
0.00%
0.50%
1.00%
5 10 15 20 25 30 35
Periods
Prof
it Pe
r Tra
de
Stable Maximum
Unstable Maximum
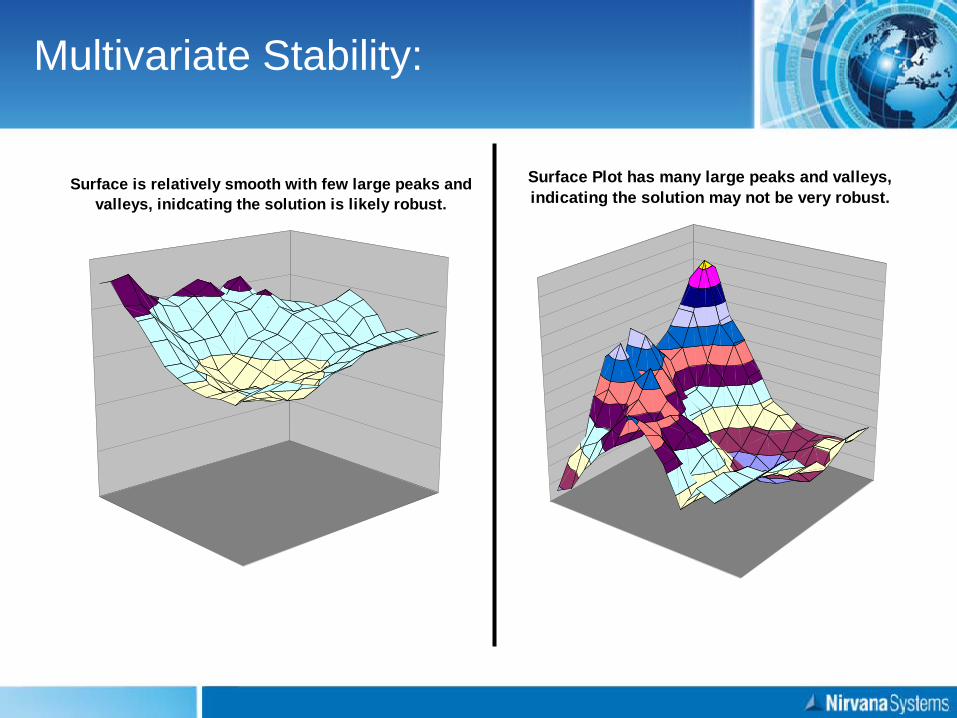
Multivariate Stability:
Surface is relatively smooth with few large peaks and valleys, inidcating the solution is likely robust.
Surface Plot has many large peaks and valleys, indicating the solution may not be very robust.

Backtesting
• Once a strategy is developed that effectively exploits the advantage identified in the mined data, the strategy is then tested on a new dataset.
• The results from this test will be used to validate the entire process.
• For rigorous strategy development, this step is considered ‘do or die’, to prevent a double optimization.

Backtesting Results
• Since the strategy was explicitly tuned to the data mining dataset, it is acceptable to see a decline in the profitability of the strategy when compared to the results generated in the prior step.
• Provided the prior steps have been followed rigorously, the blind data results should be fairly indicative of real world strategy performance.

Data Set Issues
• For statistics to be considered ‘valid’ in the academic sense, the data set would need to be entirely unseen before the tests, sufficiently large, and have entirely independent data points.
• In reality we don’t have this. With the exception of tests based on paper trading, historical data is all we have.
• There are some inherent limitations to most available historical data sets used in back testing:
– Sample Size – Collinearity – Survivorship Bias – Not truly blind

Sample Size
• In order to have a statistically significant result, a large number of samples are generally needed.
• We have an extremely limited data set resource which is replenished at the slow rate of one day per diem.
• As we go further back in historical data, the usefulness of that data tends to diminish.
Too few samples can reduce resolution of tests, which frequently results in ambiguous results.
Smoothed results can be achieved provide the sample size is large enough.

Collinearity
• A second factor which complicates getting enough independent samples, is the collinearity of stocks at any given point in time.
• Instinctively we would like to expand our sample size by choosing a large number of stocks in our data set, but the money flow into the general market is a significant factor in the price movement of every stock.

Survivorship Bias
• As we look further back into most historical sources, the currently available data does not accurately reflect the data at the time, due to a large number of companies that no longer exist.
• Bankruptcies, mergers, and buyouts frequently remove companies from most data feeds.
• Ever tried to find a stock chart of Enron?

Handling Dataset Issues
• We generally use a preponderance of evidence, rather than rigorous hypothesis testing, to determine whether a hypothesis is true or false.
• ‘Reality check’ tests to help with collinearity and survivorship bias can be performed on an index, such as the S&P 500, which will not suffer from these phenomena.

Performance Results Examples
Performance Results Trading the Stocks in the S&P 100
Performance Results Trading the S&P 500 Index

Some Backtesting Results
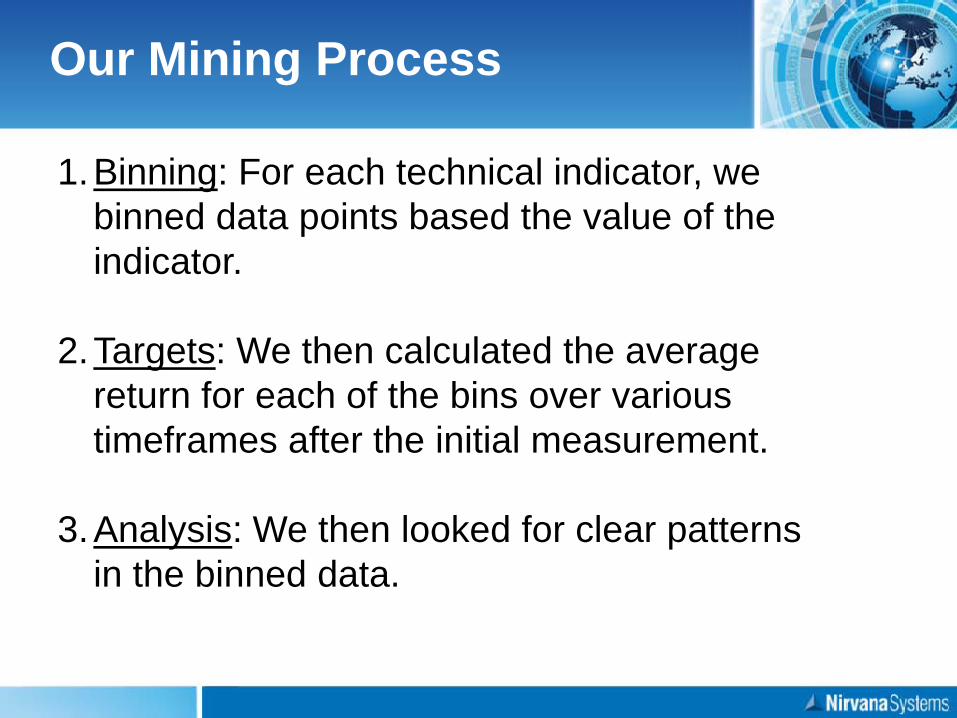
Our Mining Process
1.Binning: For each technical indicator, we binned data points based the value of the indicator.
2.Targets: We then calculated the average return for each of the bins over various timeframes after the initial measurement.
3.Analysis: We then looked for clear patterns in the binned data.

Short Term Indicators Predicting Return Over the Next Five Bars
1 Day ROC 5 Day ROC
6 Period RSI Stochastics (5,3,3)
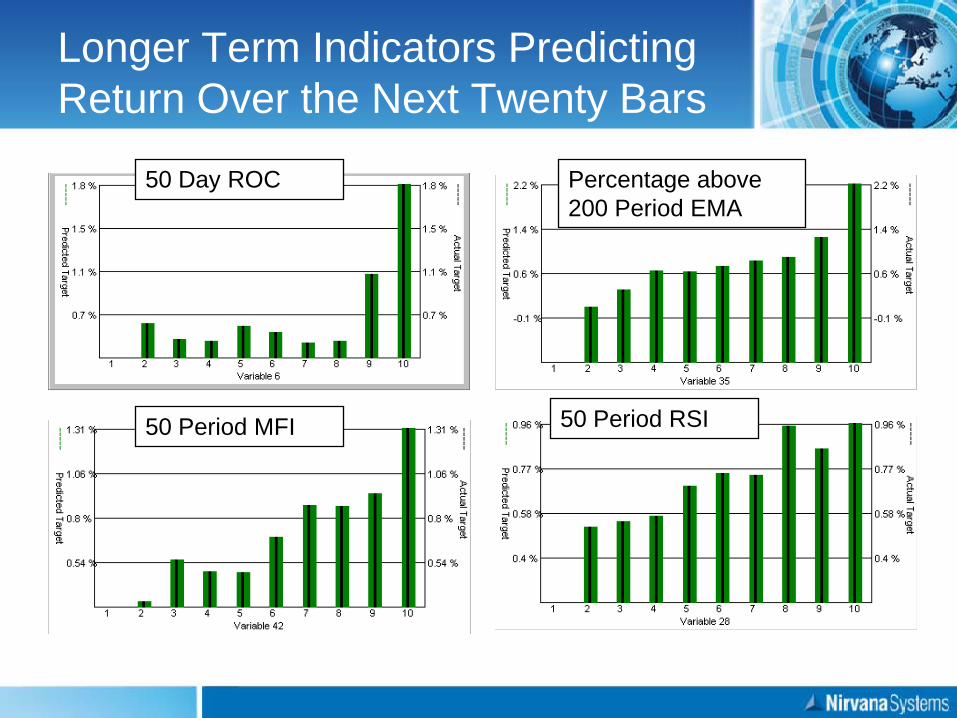
Longer Term Indicators Predicting Return Over the Next Twenty Bars
50 Day ROC
50 Period RSI 50 Period MFI
Percentage above 200 Period EMA

What the data suggests.
• Approaches which look for entries on short term weakness into a long term trend appear to be the most profitable.
• Since then, we have used this approach to develop multiple mechanical trading systems.

Reversion to Mean Trades
Some Examples of Mean Reversion Trades

Mean Reversion Trading Strategies

NSP-41
• Released in the Summer of 2010, NSP-41 has annual returns approaching 20%
• Currently making new equity highs.
Average Annual Return:
18.0% Max Drawdown:
17.4%

T3 Strategy Suite
• Three individual Long Only Reversion to Mean Strategies make up the T3 Strategy Suite.
• It was an early experiment in how to develop a portfolio of strategies to improve returns.
T3-S1 Return: 17.7% Drawdown: 18.1%
T3-S2 Return: 8.2% Drawdown: 8.4%
T3-S1 Return: 15.4% Drawdown: 18.2%

T3 Combined
Average Annual Return: 22.1% Max Drawdown: 21.7%
RTM 7
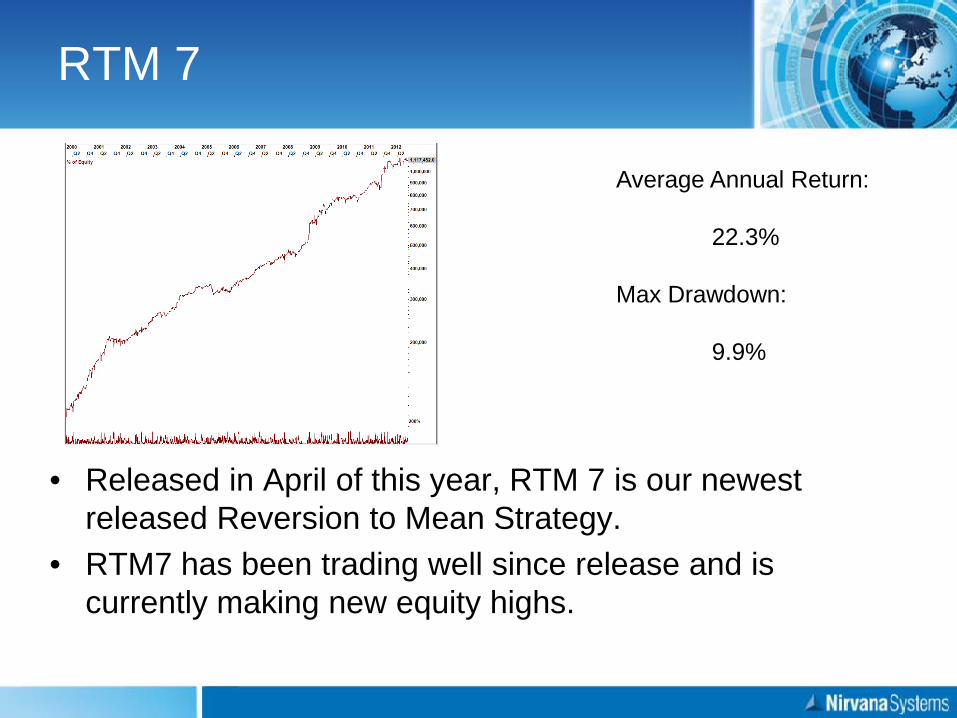
• Released in April of this year, RTM 7 is our newest released Reversion to Mean Strategy.
• RTM7 has been trading well since release and is currently making new equity highs.
Average Annual Return: 22.3% Max Drawdown: 9.9%

Managing RTM Strategies
• Psychological factors can make Reversion to Mean Strategies hard to trade. You are consistently trading against a powerful emotional short term market.
Counter: Make smaller trades than you normally would.
• Risk Management can be harder with RTM Strategies as many signals tend to occur all at once during market downturns.
Counter: Take fewer positions or smaller positions, and always keep a close eye on how directionally biased your portfolio is.

Portfolios of Strategies
Premise
• By combining a large number of loosely correlated strategies, Risk and Return characteristics of a portfolio can be improved.
• This works in a similar manner to diversifying by holding multiple loosely correlated stocks in a long term investment portfolio.
• The degree of improvement depends on the quality of strategies and the degree of correlation between them.

Combined Strategies
• Combination of NSP-41, T3, and RTM7.
Average Annual Return: 33.7% Max Drawdown: 21.1%

Finding a Statistical Edge with Mean Reversion Trading