financing the next wave of medical breakthroughs - …...financing the next wave of medical...
TRANSCRIPT

Financing the next wave of medical breakthroughs -
What works and what needs fixing?
Access-to-finance conditions for Life Sciences R&D
March 2018
years


Financing the next wave of medical breakthroughs -
What works and what needs fixing?
Study on Access-to-finance conditions for Life Sciences R&D
Prepared for: DG Research and Innovation
European Commission
By: Innovation Finance Advisory
European Investment Bank Advisory Services
Authors: Alessandro de Concini, Paulina Brzezicka
Contributor: Greater London Authority
Supervisor: Shiva Dustdar
Contact: [email protected] Consultancy support: PwC-Strategy&
Luxembourg, March 2018

2
Foreword
The life sciences are a vital economic sector with innovation at their very core. Continued development of the industry is crucial to ensure the health and well-being of European Union citizens, whilst stimulating research and development and contributing to the EU’s global competitiveness.
Most of the innovation in the life sciences industry today is generated by small and medium-sized companies. Innovative SMEs are developing new medicines for life-threatening diseases and health management devices and solutions that significantly improve life quality and expectation. But innovation, particularly in the life sciences, is a lengthy and complex process and requires adequate funding. The transformation of promising research into commercial products takes up significant time and resources, which can deter investors from pursuing life sciences innovations in favour of lower-risk ventures with faster pay-back periods. This calls for a more “patient” investment model to support life sciences innovation throughout its long development cycle.
This report argues that innovative life science companies face a critical funding challenge, particularly at specific stages of their development cycle and for specific therapeutic areas. This limits their ability to grow and hinders innovation for the European life sciences industry as a whole.
The European Investment Bank Group makes financing for SMEs and innovation its core policy priorities. Its commitment to the European life sciences sector is witnessed by the sheer volumes of investments into new drugs, vaccines and medical devices supported by EIB and EIF financing. Innovative financing models and higher risk taking instruments like the InnovFin Infectious Diseases Financing Facility have been put in place or are being tested, together with the European Commission (EC), to cater for the needs of this crucial sector for the European economy.
Despite major commitment at EU level, funding in the European biotechnology industry remains significantly lower than in the US. As evidenced by data in this report, the average US company receives around five times more funding than its European peer. In order to maintain the European Union’s leading R&D position in the life sciences, an even deeper commitment is needed by policymakers and the whole investors’ community.
Today, I am proud to confirm that the EIB Group’s commitment to innovation has never been higher. The findings and recommendations of this study provide insights and direction for the EC, the EIB and the investors’ community on the current gaps and needs in innovative life sciences. I very much look forward to seeing some of these recommendations implemented in the near future.
I wish to thank the Innovation Finance Advisory team of the EIB for this work and the EC services, particularly DG RTD, for the excellent collaboration throughout the process.
Dario Scannapieco
Vice-President, European Investment Bank
President, European Investment Fund

3
Disclaimer:
This report should not be referred to as representing the views of the European Investment Bank (EIB), the European Commission (EC) or other European Union (EU) institutions and bodies. Any views expressed herein, including interpretation(s) of regulations, reflect the current views of the author(s), which do not necessarily correspond to the views of the EIB, the EC or other EU institutions and bodies. Views expressed herein may differ from views set out in other documents, including similar research papers, published by the EIB, the EC or other EU institutions and bodies. Contents of this report, including views expressed, are current at the date of publication set out above, and may change without notice. No representation or warranty, express or implied, is or will be made and no liability or responsibility is or will be accepted by EIB, the EC or other EU institutions and bodies in respect of the accuracy or completeness of the information contained herein and any such liability is expressly disclaimed. Nothing in this report constitutes investment, legal or tax advice, nor shall be relied upon as such advice. Specific professional advice should always be sought separately before taking any action based on this report. Reproduction, publication and reprint are subject to prior written authorisation from the authors.
European Investment Bank

4
4.54.3
5.0
0.6
30
20
0.6
Forecast Funding Demand (EUR BN)
Forecast Funding Demand, Base Case (EUR BN)Forecast Funding Supply, Best Case (EUR BN)
INNOVATIVE FUNDING FOR LIFE SCIENCES R&D: CHALLENGES AND RECOMMENDATIONS
1
NATURE OF THE FUNDING CHALLENGE PER REGION2
SIZE OF ESTIMATED FUNDING GAP PER REGION (2017 – 2021)
Bavaria Catalonia Poland South East of England
Funding Gap 2017 - 2021(EUR BN)
Note: Analysis is based on interviews, survey, data analysis and literature review conducted as part of this study. For further details, see main body of report.
Note: Analysis is based on a series of assumptions to estimate future demand for financing (based on the current development pipeline, typicaldevelopment costs, duration and success rates) and a series of assumptions to estimate future supply for financing (based on historic investment sizesand their associated growth rates). For more details, see main body of report (methodology, section 2 and associated appendices).
Bio-region
SE EnglandUK
BavariaDE
Catalonia ES
Poland
Maturity of SMEs in greatest need of additional funding
Instruments with greatest gap between supply & demand
Investment terms needed
Pre-Clinical Mid Stage Late Stage Grants Venture Capital
Capital Markets
The undeveloped nature of the bio-region means that financing is not the limiting factor to growth. Efforts should be directed to supporting initiatives that strengthen the underlying market for life sciences R&D.
Larger Ticket Sizes
Longer Investment
PeriodsEarly Clinical
Investment terms desired by SMEs
Mid Clinical Late Clinical Grants Venture Capital
Capital Markets
Larger Ticket Sizes
Longer Investment
Periods
Strengthen the capabilities of European late-stage life sciences investors (including venture debt investors)
Establish a new life sciences financing mechanism addressing both financing and therapeutic gaps
3
Provide catalytic grants for company- led R&D projects1Increase the quantum of risk capital for the sector, targeting in particular “patient” capital investments2
Provide input to the EC's Capital Markets Union initiative and support the creation of a unified and better capitalised public market for life science R&D 5Strengthen underlying market for life sciences R&D through a series of initiatives developed in collaboration with national governments6
Key: Financial recommendations Non-financial recommendations
Short term
actions
Long term
actions
4
3 RECOMMENDATIONS
5
Executive summary Objective and scope
The objective of this study is to investigate the funding challenges faced by innovative life science organisations, and to assess the need for, and potential structure of, novel financing interventions to better support them.
The scope of this study focuses primarily on small and medium-sized enterprises (SMEs) developing innovative medicines in four bio-regions within Europe: Bavaria in Germany, Catalonia in Spain, the entirety of Poland, and the South East of England in the UK. Because of the different levels of maturity and sophistication between the more established clusters and the emerging ones, the four bio-regions were chosen as a representative sample of the EU-wide life sciences sector. As a result, the authors acknowledge that, although the findings and conclusions from the analysis can be generally extrapolated to apply to the whole European industry, the study cannot provide an in-depth understanding of the specificities of every European bio-region.
Key findings
A lack of funding is limiting the growth of European life sciences R&D
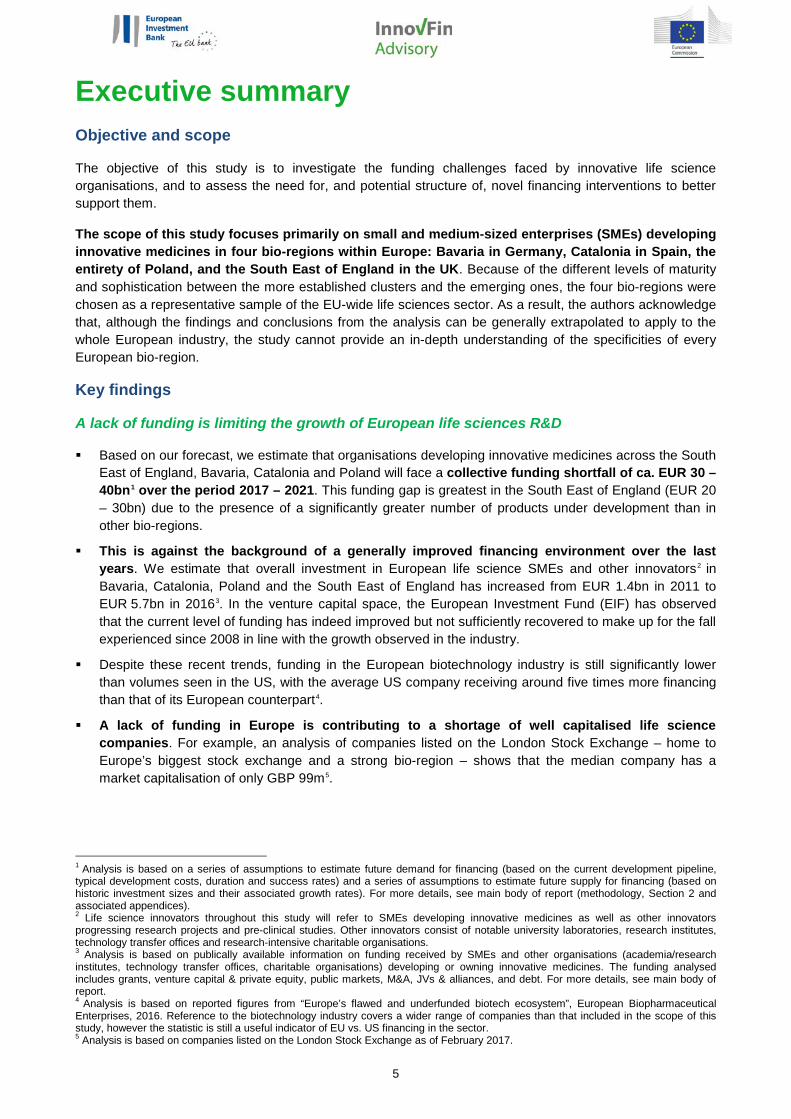
Based on our forecast, we estimate that organisations developing innovative medicines across the South East of England, Bavaria, Catalonia and Poland will face a collective funding shortfall of ca. EUR 30 –40bn1 over the period 2017 – 2021. This funding gap is greatest in the South East of England (EUR 20 – 30bn) due to the presence of a significantly greater number of products under development than in other bio-regions.
This is against the background of a generally improved financing environment over the last years. We estimate that overall investment in European life science SMEs and other innovators2 in Bavaria, Catalonia, Poland and the South East of England has increased from EUR 1.4bn in 2011 to EUR 5.7bn in 20163. In the venture capital space, the European Investment Fund (EIF) has observed that the current level of funding has indeed improved but not sufficiently recovered to make up for the fall experienced since 2008 in line with the growth observed in the industry.
Despite these recent trends, funding in the European biotechnology industry is still significantly lower than volumes seen in the US, with the average US company receiving around five times more financing than that of its European counterpart4.
A lack of funding in Europe is contributing to a shortage of well capitalised life science companies. For example, an analysis of companies listed on the London Stock Exchange – home to Europe’s biggest stock exchange and a strong bio-region – shows that the median company has a market capitalisation of only GBP 99m5.
1 Analysis is based on a series of assumptions to estimate future demand for financing (based on the current development pipeline, typical development costs, duration and success rates) and a series of assumptions to estimate future supply for financing (based on historic investment sizes and their associated growth rates). For more details, see main body of report (methodology, Section 2 and associated appendices). 2 Life science innovators throughout this study will refer to SMEs developing innovative medicines as well as other innovators progressing research projects and pre-clinical studies. Other innovators consist of notable university laboratories, research institutes, technology transfer offices and research-intensive charitable organisations. 3 Analysis is based on publically available information on funding received by SMEs and other organisations (academia/research institutes, technology transfer offices, charitable organisations) developing or owning innovative medicines. The funding analysed includes grants, venture capital & private equity, public markets, M&A, JVs & alliances, and debt. For more details, see main body of report. 4 Analysis is based on reported figures from “Europe’s flawed and underfunded biotech ecosystem”, European Biopharmaceutical Enterprises, 2016. Reference to the biotechnology industry covers a wider range of companies than that included in the scope of this study, however the statistic is still a useful indicator of EU vs. US financing in the sector. 5 Analysis is based on companies listed on the London Stock Exchange as of February 2017.

6
Current funding instruments do not meet all the needs of life science innovators
Private equity remains critical and the VC investment model is adapting to the needs of the industry. However, VC alone cannot address the entire investment and therapeutic spectrum; at the same time, the European life sciences IPO markets are currently not liquid enough. This leaves few financing options for European life science companies, particularly in a number of therapeutic areas and at critical stages of their product development cycle.
Private equity plays a major role in the current funding landscape for innovative life science organisations, with an estimated 15% of the total value of investments between 2011 and 2016 coming via this route. Angel investors, venture capital firms and corporate venture capital organisations all play a critical role in offering private equity, particularly for pre-clinical and early-stage clinical development. The specialised VC segment has also been performing well. Data from the European Investment Fund (EIF) shows that life sciences outperform other sectors as a VC asset class6. While these results are encouraging, the market analysis confirms that the traditional venture capital investment model cannot alone accompany the long development cycle of life sciences R&D. The typical investment horizon remains traditionally short, investment volumes low and therapeutic coverage skewed towards certain areas (a natural consequence of the mostly return-driven investment model). New private equity models addressing these gaps are emerging, e.g. funds with shorter investment periods and longer holding phases (thus allowing more time for development and exit) and crossover funds holding both private and public equity, but generally the quantum of venture capital and private equity in the European life sciences investment space still falls short of what the sector requires to realise its potential. Furthermore, there are limits to how much the VC investment model can be stretched (e.g. by extending the fund life too much) as this risks reducing the interest of limited partners and of an investor base which is already severely constrained in life sciences as compared to other sectors.
Public market financing also plays an important role, accounting for ca. 10% of total investment over the 2011–2016 period. Public listings in Europe are, however, not perceived to be a desirable route for growth in the eyes of many life science companies and both investors and drug developers cite the capital deficiency in European stock exchanges as a key limitation in the EU’s funding landscape.
These two instruments – private equity and public market financing (equity) – are deemed to be the funding sources where the gap between supply and demand is greatest, and thus serve as priority areas of focus in the identification and development of novel financing mechanisms.
Other dominant ways in which life science companies raise financing is via partnerships and M&A with Large Pharma (accounting respectively for 60% and 9% of total financing over the 6-year period - the high financing volumes associated with joint ventures and alliances being due to the way these deals are reported with often only the entire deal value, rather than simply the upfront payment detailed7).
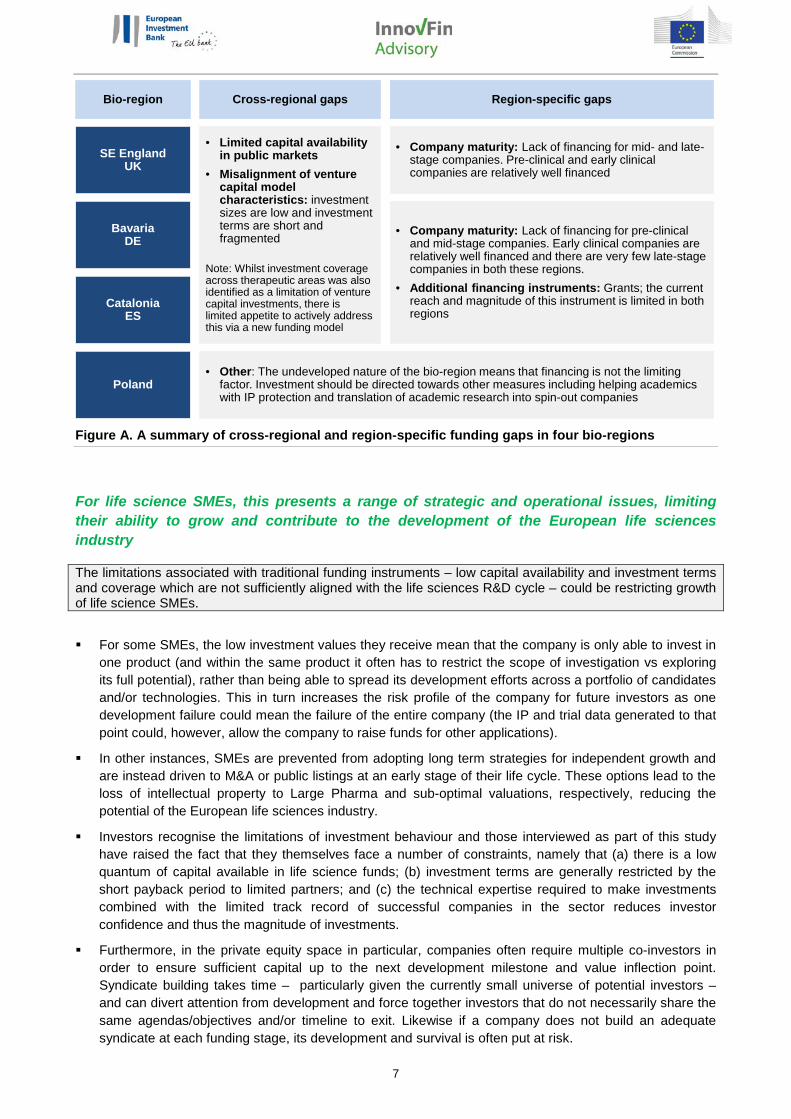
The gaps in private equity and public market financing are relevant in all four bio-regions, as verified by interviews and surveys conducted as part of this study. There are, however, also nuances among the bio-regions as summarised in Figure A below.
6 For more information please contact the EIF (www.eif.org). 7 Indeed, this artificially inflates the proportion of JV and alliance investments as it includes payments that will be received in years to come (if at all). For this reason, the qualitative assessment has focused on the other (mostly equity-based) instruments, where market consultation indicated the gaps to be most critical.
7
Figure A. A summary of cross-regional and region-specific funding gaps in four bio-regions
For life science SMEs, this presents a range of strategic and operational issues, limiting their ability to grow and contribute to the development of the European life sciences industry
The limitations associated with traditional funding instruments – low capital availability and investment terms and coverage which are not sufficiently aligned with the life sciences R&D cycle – could be restricting growth of life science SMEs.
For some SMEs, the low investment values they receive mean that the company is only able to invest in one product (and within the same product it often has to restrict the scope of investigation vs exploring its full potential), rather than being able to spread its development efforts across a portfolio of candidates and/or technologies. This in turn increases the risk profile of the company for future investors as one development failure could mean the failure of the entire company (the IP and trial data generated to that point could, however, allow the company to raise funds for other applications).
In other instances, SMEs are prevented from adopting long term strategies for independent growth and are instead driven to M&A or public listings at an early stage of their life cycle. These options lead to the loss of intellectual property to Large Pharma and sub-optimal valuations, respectively, reducing the potential of the European life sciences industry.
Investors recognise the limitations of investment behaviour and those interviewed as part of this study have raised the fact that they themselves face a number of constraints, namely that (a) there is a low quantum of capital available in life science funds; (b) investment terms are generally restricted by the short payback period to limited partners; and (c) the technical expertise required to make investments combined with the limited track record of successful companies in the sector reduces investor confidence and thus the magnitude of investments.
Furthermore, in the private equity space in particular, companies often require multiple co-investors in order to ensure sufficient capital up to the next development milestone and value inflection point. Syndicate building takes time – particularly given the currently small universe of potential investors – and can divert attention from development and force together investors that do not necessarily share the same agendas/objectives and/or timeline to exit. Likewise if a company does not build an adequate syndicate at each funding stage, its development and survival is often put at risk.
Bio-region Cross-regional gaps
SE EnglandUK
• Limited capital availability in public markets
• Misalignment of venture capital model characteristics: investment sizes are low and investment terms are short and fragmented
Note: Whilst investment coverage across therapeutic areas was also identified as a limitation of venture capital investments, there is limited appetite to actively address this via a new funding model
BavariaDE
CataloniaES
Poland
Region-specific gaps
• Company maturity: Lack of financing for mid- and late-stage companies. Pre-clinical and early clinical companies are relatively well financed
• Company maturity: Lack of financing for pre-clinical and mid-stage companies. Early clinical companies are relatively well financed and there are very few late-stage companies in both these regions.
• Additional financing instruments: Grants; the current reach and magnitude of this instrument is limited in both regions
• Other: The undeveloped nature of the bio-region means that financing is not the limiting factor. Investment should be directed towards other measures including helping academics with IP protection and translation of academic research into spin-out companies
8
Novel financing providers and mechanisms are emerging, however, they alone are unlikely to be sufficient in driving a step change
The increased adoption of “patient” venture capital (including i.a. some existing technology transfer funds and accounting for extended terms and increased flexibility of traditional equity investors) and catalytic grants in some European bio-regions indicate that funding models are gradually becoming more tailored to the needs of life sciences R&D.
There is also an increase in the diversity of funding instruments on offer. For example, debt-based instruments have become generally more accessible, with providers showing greater willingness to offer this to life science SMEs in combination with funding from equity providers.
Further, involvement by some national governments, Pharma companies and charities in early-stage funding models shows that there is appetite to transform the current life sciences funding model in areas of high unmet medical need, e.g. in developing novel treatments against infectious diseases and dementia. The abovementioned initiatives, however, do not always or necessarily pursue financial objectives and returns and would typically fall outside the investment spectrum of private investors. Nevertheless, this report will argue that risk-sharing models can be put in place to improve the risk-return profile of such ventures and allow private sector participation.
However, these positive market developments have either been limited in scope (e.g. restricted to specific therapeutic areas) or geographical area to date, and there is unlikely to be pan-European change without the support of public sector institutions.
European institutions could play a valuable role in driving catalytic change for the life sciences market
Both investors and investees indicated that they would like European institutions to contribute towards market development through targeted interventions. This study identified a number of areas where existing market participants believe European institutions could add value and achieve their policy objectives. This includes the scaling-up or fine-tuning of existing financing models as well as more ambitious, farther reaching and more disruptive interventions.
Considering the scale of the financing gap and the strong policy rationale, a combination of incremental improvements and more ambitious and innovative interventions should be pursued, so as to address the challenges of the sector from multiple angles.

9
Recommendations
Our market consultation and analysis identified a number of potential areas of intervention. These were then weighted on the basis of their ease of implementation and expected impact. As a result, a set of recommendations is proposed, four of a financial nature and two of a non-financial nature, to address the challenges identified in the four bio-regions (see Figure B for an overview).
Figure B. Overview of recommendations
Short-term recommendations build on existing programmes, products or initiatives
Recommendation 1. Provide catalytic grants for company-led R&D projects in addition to the grants on offer via Horizon 2020. This intervention is an effective means to deploy grants by attracting matching private investment with public sector funding, and has already been used in Germany with a selection of the Federal Ministry of Education and Research’s grant programmes and in the UK with the Biomedical Catalyst. Furthermore, access to grants could be paired with (or made conditional upon) access to incubators or support organisations which provide recipients with commercialisation advice such as IP protection and resource planning (to some extent and with different allocation criteria, this is being provided in the context of H2020’s SME Instrument Programme). In the context of the European Innovation Council (EIC), the Commission is indeed thinking of testing and piloting such “blended finance” models.
− Such an intervention would be most suitable in supporting pre-clinical and early-stage clinical development programmes/early-stage companies and therefore relevant for all European bio-regions.
• Recommendation 2. Increase the quantum of risk capital for the sector, targeting in particular “patient” capital investments. Venture capital funds in Europe are typically small in size and, for a number of reasons, generally not in a position to provide sufficient and longer-term support to the extended development cycle of life science SMEs, despite the recent positive trends mentioned earlier. Furthermore, given the high barriers to entry in form of required sector expertise, few specialised VC investors exist in Europe. These issues are observed across all bio-regions within the scope of this study. The objective should therefore be to i) increase the quantum of risk capital available in the market, while attracting new investors to the life sciences space, based on its recent positive track record; and ii) identify models for longer-term and more “patient” investments.
The European Investment Bank (EIB) Group is in a strong position to bring about change. As the largest fund-of-funds investor in Europe, the EIF continuously supports the European private equity value chain (from technology transfer to business angels to late-stage funds) by backing established and emerging
Strengthen the capabilities of European late-stage life sciences investors (including venture debt investors)
Establish a new life sciences financing mechanism addressing both financing and therapeutic gaps
3
Provide catalytic grants for company- led R&D projects1Increase the quantum of risk capital for the sector, targeting in particular “patient” capital investments2
Provide input to the EC's Capital Markets Union initiative and support the creation of a unified and better capitalised public market for life science R&D 5Strengthen underlying market for life sciences R&D through a series of initiatives developed in collaboration with national governments6
Key: Financial recommendations Non-financial recommendations
Short term
actions
Long term
actions
4
10
fund managers. It should continue to do so and, to the extent possible, increase its support for the life sciences sector, building on its recent strong performance. The EIF’s recent initiative to establish a new Fund of Funds with a life sciences-dedicated compartment for. i.a., institutional investors is a welcome development addressing both needs of increasing the quantum of risk capital for the sector and of catalysing new investors to this space.
As mentioned above, however, the traditional VC model cannot provide all the answers. More “patient” capital, not only driven by short-term returns, should be part of the solution but few such investors exist, including a number of technology transfer and VC funds, evergreen investment facilities and publicly listed investment companies. One way to do this would be to concentrate financing efforts towards and develop systematic collaboration models with “patient” capital investors. Once again, the EIB Group is in a strong position to drive change: it could play an important stimulation and aggregation role for like-minded investors and it could support the deployment of more “patient” capital by, i.a., i) taking cornerstone positions in already established funds (with a signalling effect to other investors) or, where possible leveraging such investors with debt instruments; and/or ii) co-investing at the level of the investee via co-investment facilities.
− Such an intervention would be desirable in all European bio-regions and particularly for emerging ones.
Recommendation 3. Strengthen the capabilities of European late-stage life sciences investors (including venture debt investors).
Market analysis shows a severe deficiency in capital availability for mid- to late-stage clinical trials (i.e. Phase II to commercialisation). European companies advancing their products to this stage require large volumes of investment and while the risk of trial failure decreases towards commercialisation, the opportunity cost of capital increases with larger ticket sizes. Few investors in Europe have the capacity to follow on to such a late stage therefore the options left to the companies are limited – typically an alliance or a trade sale to a Pharma company or a premature IPO.
A few instruments and a number of investors are nevertheless active in this space: venture debt, for example, provides for a credible alternative source of capital which is typically less costly and/or dilutive compared to equity-based investments and could support the last phase of product development allowing the company to remain independent for longer. So called “crossover investors” are also active in this space and provide for financing and support prior to, during and after an IPO.
The EIB Group already provides financing to late-stage clinical trials, also thanks to its risk-sharing programmes with the European Commission. However, it could contribute further to addressing this capital deficiency by: i) enhancing its venture debt capacity towards late-stage clinical trials companies; ii) further supporting late-stage funds and investors as a cornerstone limited partner; iii) providing specific financing to companies listing on European markets through direct co-investments as well as via crossover funds.
− Such an intervention would be desirable in all European bio-regions and particularly for established and emerging ones8.
Longer-term recommendations which are more ambitious and visionary and, as a result, will typically require more effort to implement
Recommendation 4. Establish a new life sciences financing mechanism addressing both financing and therapeutic gaps. While Recommendations 1 to 3 represent incremental solutions to existing models, with Recommendation 4 we present a break-through opportunity to address a clear market need and to draw in new investors to the sector. The analysis shows that traditional European VCs operate within a limited investment spectrum, both in terms of drug development phase and in terms of therapeutic focus (this is driven by both return expectations and by a certain degree of “pack
8 The UK already has a number of “patient” investors. The “Patient capital review” launched by the UK Treasury in 2017 can provide insights as to how such models can apply to other, developing clusters.
11
mentality” as we will see in the following sections). As mentioned above, more VC-type funding is part of the answer, but cannot alone address all the financing and therapeutic gaps of the sector.
A new life sciences portfolio aggregator (such as a Fund of Funds) could enable diversification of risk and act as an attractive vehicle to draw new investors into what is seen by them as a specialist and generally poorly understood sector at the moment. Such an instrument should be aimed at pursuing both financial returns over a longer period of time than the traditional VC as well as policy/mission-oriented investments to address clear therapeutic gaps and medical needs. As a result, it would have the potential to invest in many opportunities across a range of therapeutic areas and company sizes using a variety of different mechanisms. It would take advantage of the portfolio effect to de-risk investments and draw in new investors. In addition to a sufficiently diversified portfolio of promising assets, new (institutional) investors could be drawn in through specific interventions to further mitigate their exposure like structural subordination, guarantee schemes, asymmetric risk-return profiles, etc. European institutions could have a critical catalytic and coordination role in establishing such a dedicated investment structure, potentially in the context of the InnovFin and European Fund for Strategic Investments (EFSI) programmes.
In order to facilitate the fundraising and establishment of such a vehicle, one could map the regulatory frameworks and investment strategies of classes of institutional investors. A new financing mechanism seeking to contribute to the financing gap in the industry should aim at attracting a new investor base. This includes institutional investors that have generally been little exposed to the sector for a number of reasons. In order to approach such a new investor base, a solid understanding of the various regulatory regimes is paramount. A mapping of the main (national and international) European regulatory and statutory constraints applicable to institutional investors should be carried out to propose, as a result, a handful of (risk-mitigating) measures compatible with their investment policies. Having carried out such an assessment, individual institutional investors could then be approached with a well-defined investment proposition.
− Such an intervention would be desirable in all European bio-regions. Impact expected to be highest in regions with largest gap between supply and demand for life sciences R&D funding.
Recommendation 5. Provide input to the European Commission’s Capital Markets Union (CMU) initiative and work towards the establishment of a more unified and better capitalised public market for life sciences R&D. A number of actions identified by the European Commission as part of the CMU have a direct impact on the life sciences industry and its current and potential investor base, as well as on addressing the identified funding gap. A summary of the market challenges identified as part of this work should be brought to the attention of the EC services in charge of the CMU initiative to ensure that the proposed actions and related measures are compatible with the needs of the innovative life sciences R&D industry. More generally, the goal of the CMU should be to address the fragmentation of European public markets and establish a single capital market for innovative companies (similar to the NASDAQ). − Such an intervention would be desirable across all European bio-regions and particularly for
established and emerging ones.
12
Recommendation 6. Strengthen the underlying market for life sciences R&D through a series of initiatives developed in collaboration with the national governments. In weaker markets where the underdeveloped nature of the life sciences R&D market is limited by factors other than financing, a range of other solutions could be considered. To begin with, a thorough market assessment should be conducted in each target country/region to understand the current capabilities of key scientific and financial institutions, and to assess the appetite of regional and national level stakeholders in making life sciences R&D a priority area for investment. Building on such preparatory work, one or two areas of focus should be identified, based on a distinctive value proposition of the region/bio-cluster (be it a specific therapeutic focus, a particular strength identified, etc.) and on the risk-return profile of the underlying technology (e.g. a weaker bio-cluster could choose to initially establish its focal point and build its expertise around less risky technologies like medical devices, which typically have a shorter development cycle and an easier approval process). A roadmap of accompanying measures should also be developed (e.g. one route could be via national programmes for structural funds) to nurture the enabling ecosystem (from incentives to retaining scientists, to strengthening technology transfer capabilities, etc.). European institutions could play an important role in accelerating the growth of these emerging bio-regions, though this should be considered on a market-by-market basis in collaboration with the national governments.
− Such an intervention would be most applicable in under-developed bio-regions, e.g. Poland.

13
Table of contents
I. Study Context 14
II. Study Methodology 16
1. AN INTRODUCTION TO FOUR EUROPEAN BIO-REGIONS: SOUTH EAST OF ENGLAND, BAVARIA, CATALONIA AND POLAND 22
2. AN ESTIMATE OF THE FUNDING GAP FOR INNOVATIVE LIFE SCIENCES R&D 27
3. CURRENT FINANCIAL INSTRUMENTS USED TO SUPPORT LIFE SCIENCES INNOVATION IN EUROPE 32
4. IMPACT OF THE CURRENT FINANCING LANDSCAPE FOR LIFE SCIENCE COMPANIES 45
5. THE EMERGENCE OF NOVEL FINANCING MECHANISMS AND THEIR ABILITY TO ADDRESS THE FINANCING CHALLENGE 56
6. THE OPPORTUNITY AND NEED FOR A PUBLIC INTERVENTION 64
7. RECOMMENDATIONS 70
Glossary of terms 83
List of abbreviations 87
Appendices 89
Survey Outcomes 99

14
I. Study Context Background
Academic institutions and private companies currently face funding challenges when taking early-stage life sciences research into clinical development and beyond. Transforming promising research into commercial products can take up significant time and costs can be extremely high, particularly when the cost of pipeline failures is taken into account. As such, investors are often deterred from pursuing life sciences innovations in favour of lower-risk investments with faster payback periods.
Innovative funding models for drug discovery and development are needed, with a view to tackling the structural problems in life sciences investment and creating a large pool of “patient” capital to support long-term drug development and company growth, including bringing together and finding incentives for investors which, at least in Europe, may not normally invest in the sector (e.g. institutional investors).
The European Investment Bank Group9 (EIB) and the European Commission (EC) are considering the need for, and potential structure of, innovative financing mechanisms to develop and sustain investments in the life sciences sector. Proposals for novel financing mechanisms would seek to better support small and medium-sized companies (SMEs) conducting research and development (R&D) by addressing critical funding challenges in the market.
This study builds on a prior roundtable discussion, held by the Greater London Authority (GLA) and attended by representatives from the EIB in June 2015, which explored mechanisms to draw in larger pools of longer-term, “patient” capital into drug discovery and development. The GLA has since actively contributed to this work.
Objective of the study
The objective of this study is to gather information and evaluate the need and potential for dedicated financing instrument(s) at EU and Member State level to sustain investments in life sciences R&D.
This study will contribute to the delivery of the EU Research and Innovation (R&I) Policy objectives in the field of industrial leadership and access to finance.
The study encompasses the following aspects:
Description of the key issues/risks related to the financing of investments in life science research, development and innovation
Identification and analysis of market conditions and potential need and justification for further public intervention at EU level
Formulation and assessment of the policy options to remove the identified financing bottlenecks
9 The European Investment Bank Group (EIB) comprises both the European Investment Fund and the European Investment Bank. References to the EIB in this study relate to both entities unless the EIF is explicitly stated.

15
Scope of the study
See Exhibit 1 below for an overview of the study scope.
Exhibit 1. Scope of study
Geographically, this study covers Bavaria in Germany, Catalonia in Spain, the entirety of Poland, and the South East of England in the UK. These regions provide wide geographical coverage across Europe and represent both emerging and established bio-regions: Bavaria, Catalonia and the South East of England are three of the most advanced bio-regions in Europe whilst Poland has an underdeveloped market for life sciences R&D.
By product type, all innovative medicines under development are considered. Over-the-counter, generic and repurposed or reformulated products are excluded because it is believed that the cost of development and commercial risk associated with these products is typically lower. Companion diagnostics are only considered if they are co-developed with a medicine. Class III medical devices are considered due to the high level of R&D risk and associated cost of development, though analysis of such products focused primarily on their appeal from an investor perspective.
By source of innovation, SME pharmaceutical and biotech companies are considered; they represent a critical source of innovation and often face access-to-finance issues, as this report will explain. Research projects from academic institutions and research institutes are also reviewed, though this analysis is limited to only the top ranked institutions in each bio-region10. Major European listed/headquartered pharmaceutical companies have been excluded because they do not face a financing challenge. Contract Research Organisations (CROs) and other service providers were also not considered.
By source of financing, all major funding types are considered, including government and charitable grants, venture capital & private equity, public financing, joint ventures (JVs) and alliances, mergers and acquisitions, and debt11. All individual transactions equal to or above GBP 150,000 or EUR 175,000 were considered as part of the analysis; transactions below this threshold were excluded because of the erratic and inconsistent way in which they are reported.
10 Institutions considered are: Fraunhofer-Gesellschaft zur Förderung der angewandten Forschung, IDIBAPS, Imperial College London, ITM Isotopen Technologien München, King's College London, Ludwig-Maximilian University, Pompeu Fabra University, Queen Mary University of London, Technische Universität München, Universitat de Barcelona, University College London, University of Cambridge, University of Oxford and University of Würzburg. 11 Commercial debt instruments have not been reviewed because they are not a source of funding for innovative life science SMEs; the high risk profile of these pre-revenue generating life science SMEs mean that this funding instrument is unsuitable.
Geography Bavaria, Germany
Sources of products
Sources of innovation
Sources of funding
Catalonia, Spain Poland South East of England, UK
Innovative medicinesInnovative
diagnostics and devices
Small & medium sized enterprises (SMEs)
Research intensive universities and
institutes
Other: including Large Pharma, Contract Research Organisations (CROs) and other service providers
Grants (charitable and government)
Venture Capital & Private Equity
(angel / seed, series A –F, growth capital, PIPE)
Debt (venture debt and public
institution debts)
JV/ Alliance (upfront and milestone payments)
M&A (acquisitions and asset
purchases)
Public Equity (IPO and Rights Issue)
In-scope Limited assessment Out of scope
Other: including digital, over-the-counter, generic, repurposed and reformulated products
16
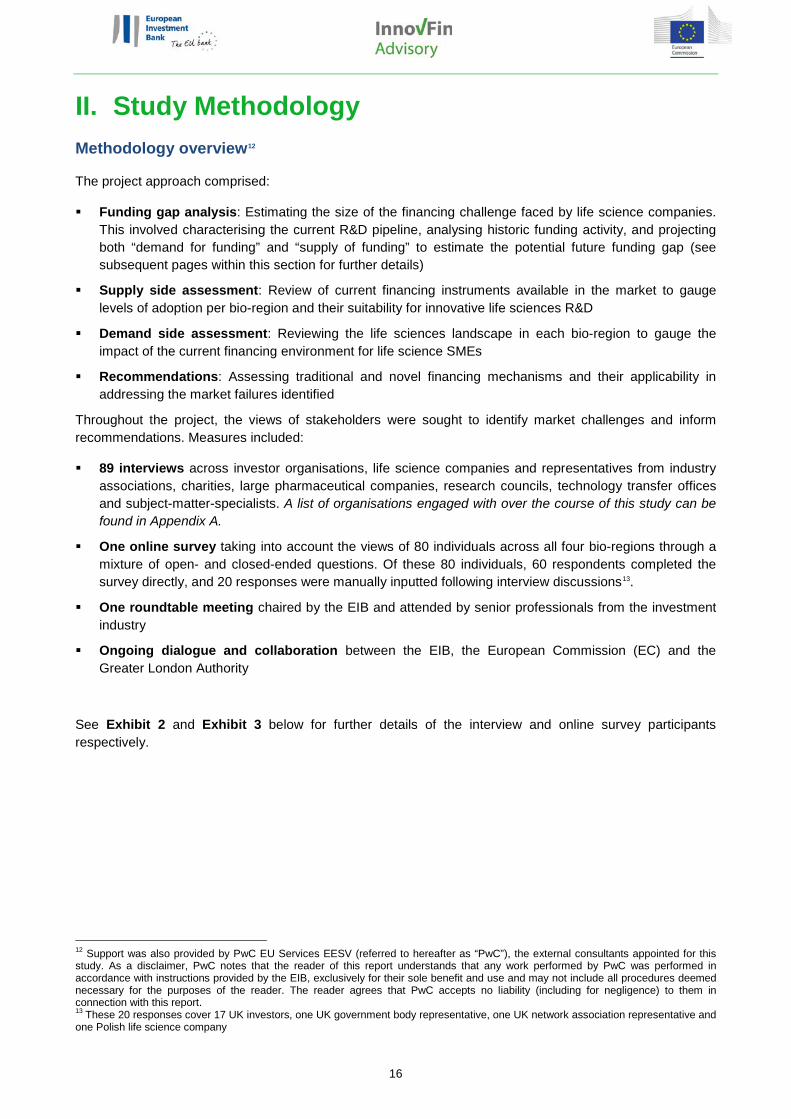
II. Study Methodology Methodology overview12
The project approach comprised:
Funding gap analysis: Estimating the size of the financing challenge faced by life science companies. This involved characterising the current R&D pipeline, analysing historic funding activity, and projecting both “demand for funding” and “supply of funding” to estimate the potential future funding gap (see subsequent pages within this section for further details)
Supply side assessment: Review of current financing instruments available in the market to gauge levels of adoption per bio-region and their suitability for innovative life sciences R&D
Demand side assessment: Reviewing the life sciences landscape in each bio-region to gauge the impact of the current financing environment for life science SMEs
Recommendations: Assessing traditional and novel financing mechanisms and their applicability in addressing the market failures identified
Throughout the project, the views of stakeholders were sought to identify market challenges and inform recommendations. Measures included:
89 interviews across investor organisations, life science companies and representatives from industry associations, charities, large pharmaceutical companies, research councils, technology transfer offices and subject-matter-specialists. A list of organisations engaged with over the course of this study can be found in Appendix A.
One online survey taking into account the views of 80 individuals across all four bio-regions through a mixture of open- and closed-ended questions. Of these 80 individuals, 60 respondents completed the survey directly, and 20 responses were manually inputted following interview discussions13.
One roundtable meeting chaired by the EIB and attended by senior professionals from the investment industry
Ongoing dialogue and collaboration between the EIB, the European Commission (EC) and the Greater London Authority
See Exhibit 2 and Exhibit 3 below for further details of the interview and online survey participants respectively.
12 Support was also provided by PwC EU Services EESV (referred to hereafter as “PwC”), the external consultants appointed for this study. As a disclaimer, PwC notes that the reader of this report understands that any work performed by PwC was performed in accordance with instructions provided by the EIB, exclusively for their sole benefit and use and may not include all procedures deemed necessary for the purposes of the reader. The reader agrees that PwC accepts no liability (including for negligence) to them in connection with this report. 13 These 20 responses cover 17 UK investors, one UK government body representative, one UK network association representative and one Polish life science company

17
Exhibit 2. Overview of interview participants in this study
20%6%
74%
EquityGrants Debt
31 SMEs, 23 Others incl. 12 Trade Associations
WERE INTERVIEWED AS PART OF THIS STUDY
GEOGRAPHIC DEMOGRAPHIC OF INTERVIEWEES
25 SMEs ARE EARLY STAGE
6 SMEs ARE LATE STAGE
35 Investors and Investment InstitutionsWERE INTERVIEWED AS PART OF THIS STUDY
FINANCIAL PRODUCT PROVIDED
INVESTOR INTERVIEES INCLUDED
Poland (all regions)
• 5 Life science companies• 1 Large Pharma• 3 Others incl. trade
association, consultancy firm, arm’s length body
Germany (Bavaria)
• 4 Life science companies• 1 Academia / research
institute • 1 Trade association
UK (SE England)
• 16 Life science companies
• 2 Large Pharma• 6 Trade associations• 5 Others incl.
commercialisation offices
Spain (Catalonia)
• 6 Life science companies• 1 Research institute • 1 Trade association
Pan-European
• 2 Trade associations
96
29
8

18
Exhibit 3. Overview of online survey participants in this study
14%
28% 59%
Late clinical (phase IIb / III)
Early clinical (phase I / IIa)
Research / pre-clinical
1
VC or PE Fund
18
Angel, seed, TTO
3
Other
4
Corporate
3
Bank (commercial)
32%
21%
4%
11%
32%
EUR 1m - EUR 10m
EUR 10m - EUR 100m > EUR 500m
EUR 100m - EUR 250m
EUR 250m - EUR 500m
29 SMEs, 6 Trade Associations, 5 Research Institutes and 11 Others
WERE SURVEYED AS PART OF THIS STUDY
GEOGRAPHIC DEMOGRAPHIC OF SURVEY RESPONDENTS
39%59% OF SMEs SURVEYED HAVE MAJORITY OF PIPELINE AT RESEARCH OR PRE-CLINICAL PHASE
OF SMEs SURVEYED CURRENTLY HAVE 3 -4 PRODUCTS UNDER DEVELOPMENT
MATURITY OF THE MAJORITY OF SMEs’ PIPELINE
29 Investors and Investment InstitutionsWERE SURVEYED AS PART OF THIS STUDY
DEMOGRAPHIC OF SURVEYED INVESTORS BY TYPE
SURVEY RESPONDENTS INCLUDED
SIZE OF ASSETS / FUNDS AVAILABLE FOR LIFE SCIENCE INVESTMENTS
Poland (all regions)• 5 Life science companies• 1 Academia • 5 Others incl. trade
association, life science consultancy firm
Germany (Bavaria)• 7 Life science companies• 2 Academia / research institute • 4 Others incl. trade association, • bank, government body
UK (SE England)• 10 Life science companies• 1 Academia / research institute • 5 Others incl. trade association,
government body, TTO
Spain (Catalonia)• 7 Life science companies• 1 Academia / research institute • 2 Others incl. trade association,
government body
1113
16
10
Pan-European
• 1 Trade association

19
Primary research has been supplemented by a review of relevant databases, academic publications and industry position papers to provide further context and evidence for this study. Significant sources of input include:
Databases including CB Insights, Crunchbase, EvaluatePharma, Market IQ, Medtrack and Preqin to inform the view on financing and R&D activity occurring within the four bio-regions of investigation
Literature from the European Investment Bank, Greater London Authority, European Biopharmaceutical Enterprises, UK Bio-Industry Association and other publicly available sources which capture existing knowledge of the challenges, opportunities and potential solutions for innovative financing in the life sciences industry
Approach to characterising the current life sciences R&D pipeline
A dataset of innovative medicines currently in development by SMEs and select research institutes in the four bio-regions was defined as part of this study. This dataset was populated with data from the following sources:
EvaluatePharma, a proprietary database which compiles a list of development assets based on analyst coverage of products announced in the public domain. Coverage is biased towards larger and publically listed companies; the database is not exhaustive and has been supplemented with other sources
Databases from European grant providers, which provide a view on additional research projects, and pre-clinical and early-clinical studies not covered in EvaluatePharma. The grant providers covered are: Catalonia Trade and Investment (ACCIO), German Ministry of Education and Research (BMBF), Innovate UK, UK Medical Research Council, Polish National Centre for Research and Development (NCBR) and the Wellcome Trust
Review of company websites
Interviews were used to enrichen and provide further context to trends identified from this data analysis. A series of filtering criteria was used for each data source to select for only the relevant products. Details of the filtering criteria can be found in Appendix B.
Approach to characterising historic funding activity
A dataset of investment activity with respect to SMEs and select research institutes developing innovative medicines during the period 2011 to 2016 in the four bio-regions was also defined as part of this study. This dataset was populated with data from the following sources:
Venture capital & private equity, public financing, M&A and JVs/alliance data from Preqin, Market IQ, Medtrack, Crunchbase and CB Insights
Grant data from Cancer Research UK, Catalonia Trade and Investment (ACCIO), Innovate UK, Spanish Ministry of Economy, Industry and Competitiveness (MINECO), UK Medical Research Council, Polish National Centre for Research and Development (NCBR) and Wellcome Trust
Review of company websites
A series of filtering criteria was used for each data source to select for investments made to the relevant organisations and research projects. Details of the filtering criteria can be found in Appendix C.
Approach to forecasting an estimate of the funding gap
The demand and supply side assessment detailed above was used as the basis for determining the potential future R&D funding gap in each of the four bio-regions. The forecast R&D funding gap was calculated as follows:
𝐹𝐹𝐹𝐹𝐹𝐹𝐹 𝐺𝐺𝐺 (𝛥)2017−2021 = 𝐹𝐹𝐹𝐹𝐹𝐺𝐹𝐹 𝑅&𝐷 𝐷𝐹𝐷𝐺𝐹𝐹2017−2021 − 𝐹𝐹𝐹𝐹𝐹𝐺𝐹𝐹 𝐹𝐹𝐹𝐹𝐹𝐹𝐹 𝑆𝐹𝐺𝐺𝑆𝑆 2017−2021

20
Whereby:
Funding Gap (Δ) (2017-2021) is defined as the additional financing required to support the product pipeline within the scope of this study over the next five years.
Several assumptions have been made to facilitate quantification of the funding gap; please see the definition of subsequent terms below for further details. It should also be noted that:
1. The Funding Gap (Δ) is the estimated financing required to continue the development of pipeline products for five additional years. It is not the financing required to “complete”14 the pipeline through to the point of commercialisation
2. The Funding Gap (Δ) calculated does not quantify the non-R&D costs required by companies as they grow. Non-R&D costs include sales, general and administrative expenses and manufacturing costs which also form a critical part of their funding demand
Forecast R&D Demand (2017-2021) is defined as the cost required to fund the R&D of the current pipeline of innovative medicines under development by SMEs and select research institutions over the next five years.
It has been calculated on a product-by-product basis and takes into consideration the typical cost, time and success rate a candidate product will face based on its current maturity. Product maturity has been defined as one of six categories in this study: Research Project, Pre-clinical, Phase I, Phase II, Phase III and Filed15.
Forecast Funding Supply (2017-2021) is defined as the likely supply that SMEs developing innovative medicines will receive over the next five years.
The estimate was calculated on the basis of historic funding activity by funding type in each bio-region. The following funding types were defined for analysis: grants (charities and government), debt, venture capital & private equity, public financing, M&A and JVs and alliances.
The forecasting scenario was tailored to each bio-region, based on the trends over the 2011–2016 period per funding type. See Exhibit 4 below for details on the main assumptions used to forecast funding supply per bio-region.
14 Completing the pipeline refers to developing the current pipeline products to the stage where they either fail or become marketable. 15 Product maturity is defined from “Research Project” through to “Filed”. Key assumptions supporting this analysis were sourced from Parexel Biopharmaceutical R&D Statistical Sourcebook 2015/16 and subsequently validated with life science companies via interviews.

21
Market Funding supply forecasting assumption Bavaria • In Bavaria, a base case and a best case was developed on the basis of
two differing projections on the growth of private equity funding • Base case: Private equity funding to increase year-on-year at a CAGR
of 7.7%. All other funding categories forecast to be the average of the historic supply during the period 2011–2016
• Best case: Private equity funding to increase year-on-year at a CAGR of 15.4%. All other funding categories forecast to be the average of the historic supply during the period 2011–2016
Catalonia • Funding supply forecast to be the average of the historic funding supply during the period 2011–2016
Poland • Funding supply forecast to be the average of the historic funding supply during the period 2011–2016
South East of England • In the South East of England, a base case and a best case was developed on the basis of two differing projections on the growth of private equity and public market funding
• Base case: Private equity funding to increase year-on-year at a CAGR of 15.5%. Public market funding to increase year-on-year at a CAGR of 23.8%. All other funding categories forecast to be the average of the historic supply during the period 2011–2016
• Best case: Private equity funding to increase year-on-year at a CAGR of 31.0%. Public funding to increase year-on-year at a CAGR of 47.6%. All other funding categories forecast to be the average of the historic supply during the period 2011–2016
Note: 1. Forecast Compound Annual Growth Rates (CAGRs) per market and per funding type have been determined on the basis of historic CAGR trends 2. Base case forecast CAGRs are set at 50% of the best case forecast CAGRs in all instances
Exhibit 4. Summary of assumptions for input into funding supply forecasting
More detailed assumptions used as part of this forecasting are detailed in Appendix D.
Approach to recommendation development
A set of recommendations have been developed to address the financing challenge associated with commercialising life sciences R&D in Europe.
As a precursor to recommendation development, the financing challenge was first characterised, taking into account both the investor and life science SME’s perspective. The financing gap was considered along multiple dimensions, including:
• Financial parameters – Which financial instruments, investments sizes and other investment terms are most lacking in the market?
• R&D related parameters – What type of companies and/or products face the greatest financing challenge?
• Geographic parameters – How does the financing challenge differ from one bio-region to another?
After the nature of the financing challenge was defined, a three-step approach was taken to identify the most relevant financial interventions for addressing these issues. The following steps taken were:
1. Identification of all potential financial solutions – A longlist of potential solutions was generated following a review of traditional, emerging and novel financial interventions
2. Consideration of mode of investment by the EIB and EC – The role of European institutions was considered in the context of the financing solutions listed in Step One. The most relevant modes of investment were assigned to each financial solution to facilitate subsequent prioritisation
3. Assessment of each financing solution against its impact and ease of implementation – Combining Steps 1 and 2, potential financial solutions were mapped onto an ease and effect matrix to identify the most impactful solutions. These solutions formed the basis of the recommendations

22
1. AN INTRODUCTION TO FOUR EUROPEAN BIO-REGIONS: SOUTH EAST OF ENGLAND, BAVARIA, CATALONIA AND POLAND
Introduction to the life sciences R&D landscape in four European bio-regions
Prior to an in-depth analysis on the European funding landscape for life sciences R&D, a review of the bio-regions was conducted to understand the overall health of the life sciences ecosystem. Bio-regions were assessed against five parameters which together provide a holistic view the region’s performance. These parameters are scientific expertise, industrial presence, financial infrastructure, entrepreneurial culture and supporting factors. See one-page profiles – Exhibit 6, Exhibit 7, Exhibit 8 and Exhibit 9 - for details.
The South East of England scores higher across all five parameters in comparison to Bavaria, Catalonia and Poland. The region is particularly strong in its scientific expertise and the availability of favourable tax and investment policies. On relative terms, the availability of financing is a challenge, with the region receiving significantly lower investments than companies in leading US bio-clusters.
Bavaria and Catalonia emerge as “developing” bio-regions from our assessment. These bio-regions score well on scientific expertise and industrial presence and, much like the South East of England region, are also faced with a limited availability of financing. However, the lack of supporting factors such as favourable tax policies and angel investment incentives mean that the underlying environment is less favourable than that of the UK.
Finally, in contrast to the South East of England, Bavaria and Catalonia, the life sciences R&D industry in Poland is very underdeveloped.
The relative performance of each bio-region can also be observed in the size and maturity of their product pipelines and the number of active innovators16 in the area. The South East of England has the greatest number of products under development, the greatest portion of late-stage development products and the greatest number of organisations17 developing these products. See Exhibit 5 below for a breakdown of the number of products at each stage of development per bio-region.
Note: 1. Organisations covered include SMEs, technology transfer offices, universities/research institutes and charitable institutions. Source: Analysis based on review of research projects and development compounds from EvaluatePharma, EU and national grant programmes and company websites.
Exhibit 5. Products under development by maturity in each bio-region18
16 Life science innovators throughout this study will refer to SMEs developing innovative medicines as well as other innovators progressing research projects and pre-clinical studies. Other innovators consist of notable university laboratories, research institutes, technology transfer offices and research-intensive charitable organisations. 17 Life science organisations throughout this study will be used synonymously with “life science innovators” and will refer to both SMEs and other innovators developing innovative medicines. 18 More detail on organisations and products considered as part of this study can be found in Appendix G and H.
Bavaria
TotalPhase I Phase IIResearch Pre-Clinical Phase III Filed
17813 2072 71 2
Phase of Development # of organisations with current pipeline
products
SE England 94189 131425 267 25 4 142
28-
Catalonia 12914 1349 52 1 28-
Poland 2614 12 3- - - -
Total 1274116 164560 402 28 4 142

23
Note: 1. References to academic institution rankings are based on ARWU 2016 results; 2. Number of innovative SMEs in each region is based on analysis of companies with pipeline products as of January 2017 and recent investment history; 3. Number of specialist investors in each region is based on analysis of investors which have made three or more investments in life science SMEs over the 2011–2016 period; 4. Score per lever is derived from findings from desktop and primary research.
Source: Academic Ranking of World Universities, bio-cluster websites, interviews held Feb – Mar 2017, pipeline and investment activity 2011 – 2016.
Exhibit 6. The five-lever assessment of the Bavaria bio-region
Bavaria, Germany
The Munich Biocluster and surrounding Bavaria region is a leading cluster in Germany, characterised by a strong focus on red biotechnology. It is well-known for its strong scientific expertise and industrial presence, but has been experiencing a widening of funding gap, particularly after seed financing rounds.
Scientific Expertise
• Region is home to 2 elite universities: Technische Universität München and Ludwig-Maximilians-Universität (ranked and 47th and 51st globally, respectively) and 3 medicinal-biological Max PlanckInstitutes: Biochemistry, Neurobiology and Psychiatry (Academic Ranking of World Universities, 2016)
• Scientific expertise also extends to clinical experience from 2 University hospitals and 60 other hospitals
Industrial Presence• There is one prominent Pharma headquartered in Bavaria, Morphosys, which has a market
capitalisation of EUR 1.6BN (as of April 2017), as well as several international Large Pharma incl.Roche and Amgen who have R&D and/or production facilities in the region
• In total, there are ca. 250 life science companies in the biocluster, many of which focus on serviceprovision and diagnostics development. There are only 23 SMEs currently developing innovativemedicines in the region with notable examples including 4SC, Medigene and Vasopharm
Entrepreneurial Culture• Culture of collaboration amongst academia, SMEs and network organisations
• Established TTOs affiliated with research-intensive universities, e.g. Ascenion and Max-Planck-Innovation
Financial infrastructure
• Supportive pre-seed funding environment with a relatively high availability of local, national and European grants to support life science R&D; however, grants are typically small in ticket size (<EUR 1M)
• Seed and private equity investments come from both dedicated family funds from High Net Worth Individuals and specialised venture capital investors. There are currently only 6 specialist investors in the sector (Wellington Partners, MIG Fonds, Hightech-Gründerfonds, Bayern Kapital, BI Ventures and NRW Bank).
• Public market financing is seen to be under-developed and loan-based offerings are considered to be unsuitable for life sciences R&D
Supporting factors• The IZB incubator in Martinsreid specialises in medical drugs and services, and offers laboratory
facilities and office space for young biotechnology companies as well as access to other contacts
• Research commercialisation and support for spin-out companies is backed by networks includingBioM and BayStartUp
• Federal tax law has shown to be unsupportive i.e. lack of tax credits for SMEs’ R&D expenditures
Score
Key: = poor = world class

24
Note: 1. References to academic institution rankings are based on ARWU 2016 results; 2. Number of innovative SMEs in each region is based on analysis of companies with pipeline products as of January 2017 and recent investment history; 3. Number of specialist investors in each region is based on analysis of investors which have made three or more investments in life science SMEs over the 2011–2016 period; 4. Score per lever is derived from findings from desktop and primary research.
Source: Academic Ranking of World Universities, bio-cluster websites, interviews held Feb – Mar 2017, pipeline and investment activity 2011 – 2016.
Exhibit 7. The five-lever assessment of the Catalonia bio-region
Catalonia, Spain
Catalonia is the largest and most prominent bioregion in Spain and is home to over 200 biotechnology companies. Whilst grants and government loans are available to support life sciences R&D, there is a lack of venture capital investors to support the region.
Scientific Expertise
• Catalonia is home to the University of Barcelona (ranked in the Top 200 globally) as well as two otherrenowned institutions: Autonomous University of Barcelona and Pompeu Fabra University. Togetherthese offer strong research programmes and links with local research institutes (BIST, EURECAT andISGlobal)
• The region is also known for having a very strong hospital network with 15 university hospitals that arewell equipped to support clinical trials
Industrial Presence• There are two Large Pharma headquartered in Catalonia (Almirall, with a market cap EUR 2.8BN as of
April 2017, and Ferrer (privately owned)), one major plasma product provider (Grifols) and multipleMNCs with regional offices in Barcelona (Amgen, AstraZeneca, Novartis, Roche and Sanofi).
• Of the 25 innovative biotech SMEs, the vast majority of companies have products in early stagedevelopment and very few have products in later stage clinical trials. Notable companies includeMinoryx Therapeutics that focuses on CNS disorders and Oryzon Genomics that develops oncologyand neurodegenerative treatments
Entrepreneurial Culture• University & research institute, technology transfer offices currently exist, but are underdeveloped and
play a small role in the commercialisation of research and development
• Strong desire to commercialise research amongst SMEs and academics in the region
Financial infrastructure• The Catalan government, via the Trade & Investment Department (ACCIO), and the national Ministry
of Economy, Industry & Competitiveness (MINECO) provide grants for life sciences research; howeverthis is typically less than EUR 1M and is targeted towards early stage research
• Small value loans are also available via ENISA (a public company funded by the Ministry of Industry,Energy & Tourism)
• Limited number of active private equity investors: there are only 5 specialist investors in the sector(YSIOS, Caixa Capital Risc, Inverready, HealthEquity and Knowledge Capital Fund) and very fewinternational investors financing the sector. Ticket sizes are low.
• Public markets are weak and unsupportive of SMEs
Supporting factors• Strong support from the regional network association Biocat through training, conference and
accelerator programmes (Caixa Impulse, d-Health Barcelona, Spire Bioventures)
Score
Key: = poor = world class
25
Note: 1. References to academic institution rankings are based on ARWU 2016 results; 2. Number of innovative SMEs in each region is based on analysis of companies with pipeline products as of January 2017 and recent investment history; 3. Number of specialist investors in each region is based on analysis of investors which have made three or more investments in life science SMEs over the 2011–2016 period; 4. Score per lever is derived from findings from desktop and primary research.
Source: Academic Ranking of World Universities, bio-cluster websites, interviews held Feb – Mar 2017, pipeline and investment activity 2011 – 2016.
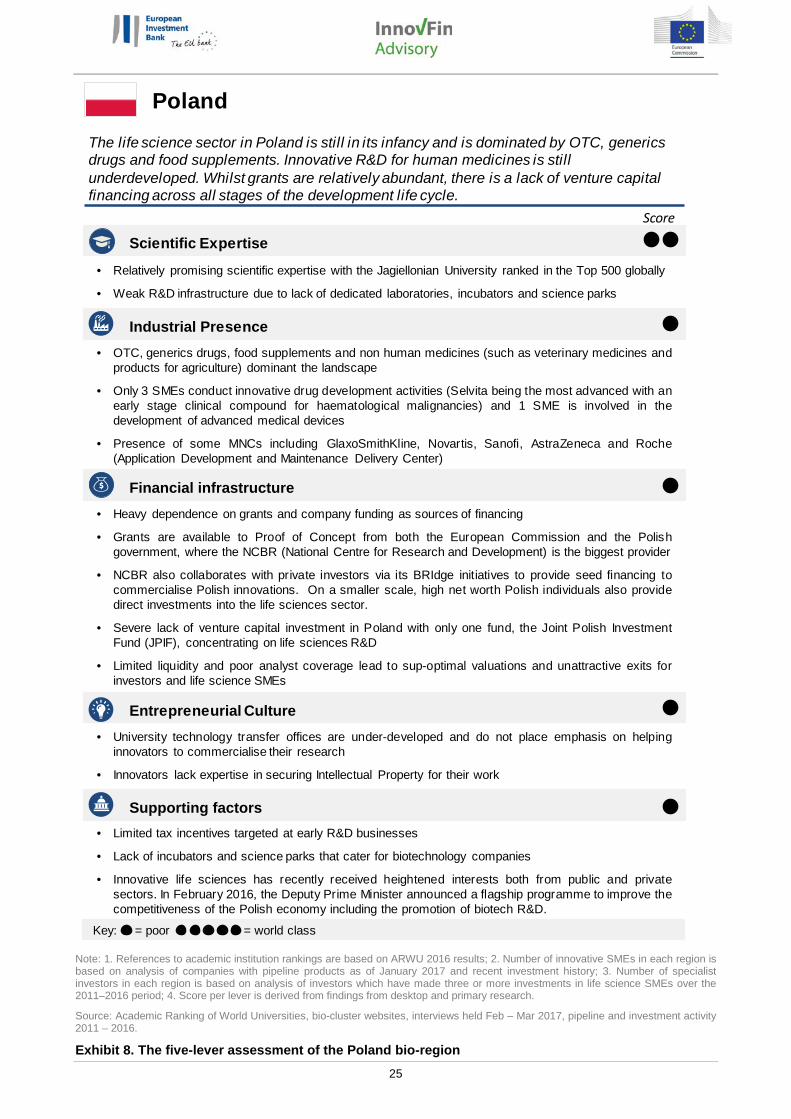
Exhibit 8. The five-lever assessment of the Poland bio-region
Poland
The life science sector in Poland is still in its infancy and is dominated by OTC, generics drugs and food supplements. Innovative R&D for human medicines is still underdeveloped. Whilst grants are relatively abundant, there is a lack of venture capital financing across all stages of the development life cycle.
Scientific Expertise
• Relatively promising scientific expertise with the Jagiellonian University ranked in the Top 500 globally
• Weak R&D infrastructure due to lack of dedicated laboratories, incubators and science parks
Industrial Presence• OTC, generics drugs, food supplements and non human medicines (such as veterinary medicines and
products for agriculture) dominant the landscape
• Only 3 SMEs conduct innovative drug development activities (Selvita being the most advanced with anearly stage clinical compound for haematological malignancies) and 1 SME is involved in thedevelopment of advanced medical devices
• Presence of some MNCs including GlaxoSmithKline, Novartis, Sanofi, AstraZeneca and Roche(Application Development and Maintenance Delivery Center)
Entrepreneurial Culture• University technology transfer offices are under-developed and do not place emphasis on helping
innovators to commercialise their research
• Innovators lack expertise in securing Intellectual Property for their work
Financial infrastructure• Heavy dependence on grants and company funding as sources of financing
• Grants are available to Proof of Concept from both the European Commission and the Polishgovernment, where the NCBR (National Centre for Research and Development) is the biggest provider
• NCBR also collaborates with private investors via its BRIdge initiatives to provide seed financing tocommercialise Polish innovations. On a smaller scale, high net worth Polish individuals also providedirect investments into the life sciences sector.
• Severe lack of venture capital investment in Poland with only one fund, the Joint Polish InvestmentFund (JPIF), concentrating on life sciences R&D
• Limited liquidity and poor analyst coverage lead to sup-optimal valuations and unattractive exits forinvestors and life science SMEs
Supporting factors• Limited tax incentives targeted at early R&D businesses
• Lack of incubators and science parks that cater for biotechnology companies
• Innovative life sciences has recently received heightened interests both from public and privatesectors. In February 2016, the Deputy Prime Minister announced a flagship programme to improve thecompetitiveness of the Polish economy including the promotion of biotech R&D.
Score
Key: = poor = world class
26
Note: 1. References to academic institution rankings are based on ARWU 2016 results; 2. Number of innovative SMEs in each region is based on analysis of companies with pipeline products as of January 2017 and recent investment history; 3. Number of specialist investors in each region is based on analysis of investors which have made three or more investments in life science SMEs over the 2011–2016 period; 4. Score per lever is derived from findings from desktop and primary research.
Source: Academic Ranking of World Universities, bio-cluster websites, interviews held Feb – Mar 2017, pipeline and investment activity 2011–2016.
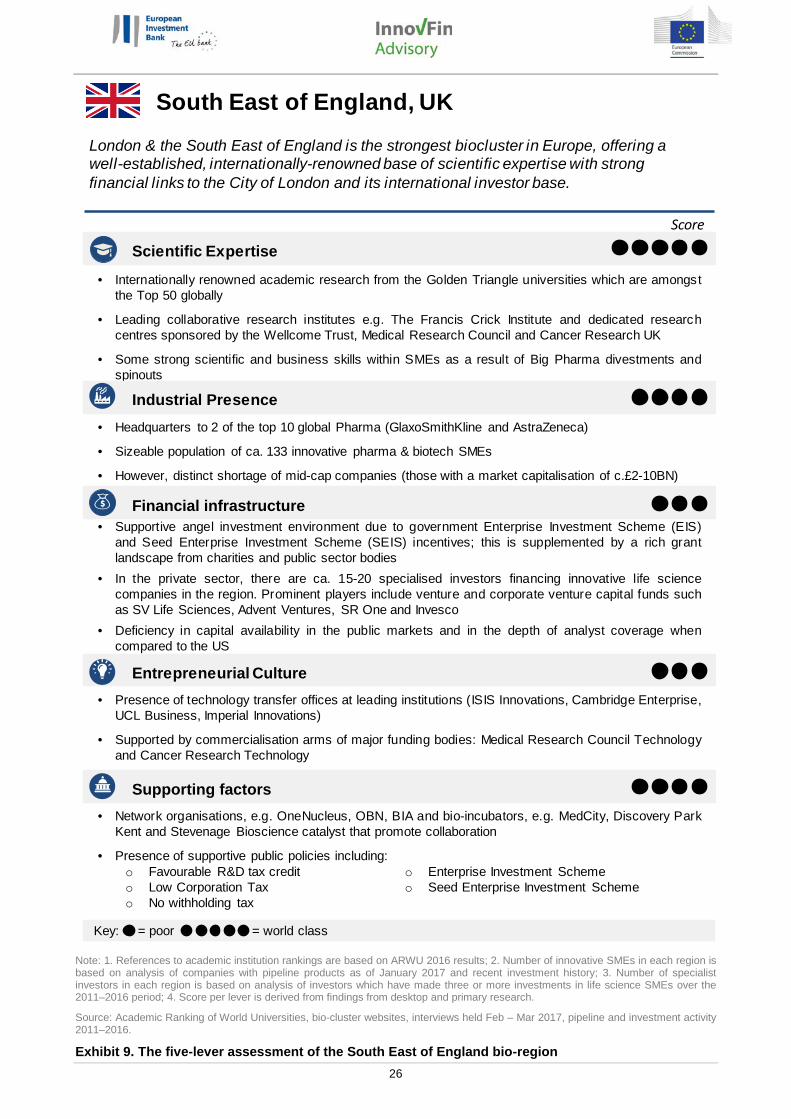
Exhibit 9. The five-lever assessment of the South East of England bio-region
South East of England, UK
London & the South East of England is the strongest biocluster in Europe, offering a well-established, internationally-renowned base of scientific expertise with strong financial links to the City of London and its international investor base.
Scientific Expertise
• Internationally renowned academic research from the Golden Triangle universities which are amongstthe Top 50 globally
• Leading collaborative research institutes e.g. The Francis Crick Institute and dedicated researchcentres sponsored by the Wellcome Trust, Medical Research Council and Cancer Research UK
• Some strong scientific and business skills within SMEs as a result of Big Pharma divestments andspinouts
Industrial Presence• Headquarters to 2 of the top 10 global Pharma (GlaxoSmithKline and AstraZeneca)
• Sizeable population of ca. 133 innovative pharma & biotech SMEs
• However, distinct shortage of mid-cap companies (those with a market capitalisation of c.£2-10BN)
Entrepreneurial Culture• Presence of technology transfer offices at leading institutions (ISIS Innovations, Cambridge Enterprise,
UCL Business, Imperial Innovations)
• Supported by commercialisation arms of major funding bodies: Medical Research Council Technologyand Cancer Research Technology
Financial infrastructure• Supportive angel investment environment due to government Enterprise Investment Scheme (EIS)
and Seed Enterprise Investment Scheme (SEIS) incentives; this is supplemented by a rich grantlandscape from charities and public sector bodies
• In the private sector, there are ca. 15-20 specialised investors financing innovative life sciencecompanies in the region. Prominent players include venture and corporate venture capital funds suchas SV Life Sciences, Advent Ventures, SR One and Invesco
• Deficiency in capital availability in the public markets and in the depth of analyst coverage whencompared to the US
Supporting factors
o Favourable R&D tax credito Low Corporation Taxo No withholding tax
o Enterprise Investment Schemeo Seed Enterprise Investment Scheme
• Network organisations, e.g. OneNucleus, OBN, BIA and bio-incubators, e.g. MedCity, Discovery ParkKent and Stevenage Bioscience catalyst that promote collaboration
• Presence of supportive public policies including:
Score
Key: = poor = world class

27
2. AN ESTIMATE OF THE FUNDING GAP FOR INNOVATIVE LIFE SCIENCES R&D
Introduction to the funding landscape in four European bio-regions
An analysis of the funding landscape for life science SMEs and other innovators in Bavaria, Catalonia, Poland and the South East of England has shown that investment has steadily grown from its low base of EUR 1.4bn during the recession era in 2011 to EUR 5.7bn in 2016.
In total, we estimate that almost EUR 19bn of funding was committed to innovative life science SMEs and other innovators in the period 2011–2016. The majority of this total, ca. 79%, went to organisations based in the South East of England. In 2016, the region received over EUR 4bn of funding, four times that of Bavaria and two orders of magnitude greater than both Catalonia and Poland. See Exhibit 10 below for a summary of total investment activity, in aggregate and per bio-region, between 2011 and 2016.
Note: 1. Analysis is based on publically available information on funding received by SMEs and other organisations (academia/research institutes, technology transfer offices, charitable organisations) developing or owning innovative medicines. 2. Funding covered includes grants, venture capital & private equity, public markets, M&A, JVs & alliances, and debt. 3. M&A include acquisitions, asset purchases and reverse takeovers. 4. JVs & alliances include both upfront payments and future milestone and royalty payments which may not yet be realised by the company. This is because, for the overwhelming majority of deals, a breakdown of the structure of the JV or alliance agreement is not publically disclosed.
Source: Analysis of investment activity from Preqin; MarketIQ; Crunchbase; CBInsights; Medtrack; government, charity and company websites.
Exhibit 10. Investment received by all organisations in aggregate and per bio-region (2011–2016)
A more detailed breakdown of funding activity by type and bio-region can be found in Appendix E.
4,3863,831
2,5251,473
2,301
475
201620152014201320122011
1,186
637
117137111
915
3865
516
203632
77
33391125
Poland (EUR M)
Catalonia (EUR M)
Bavaria (EUR M)
South East England (EUR M)
167
708
3,102
14,992
EUR 18,969M
Total investment received for all bio-regions, 2011 – 2016 (EUR M)
Total investment received per bio-region, 2011 – 2016 (EUR M)
28
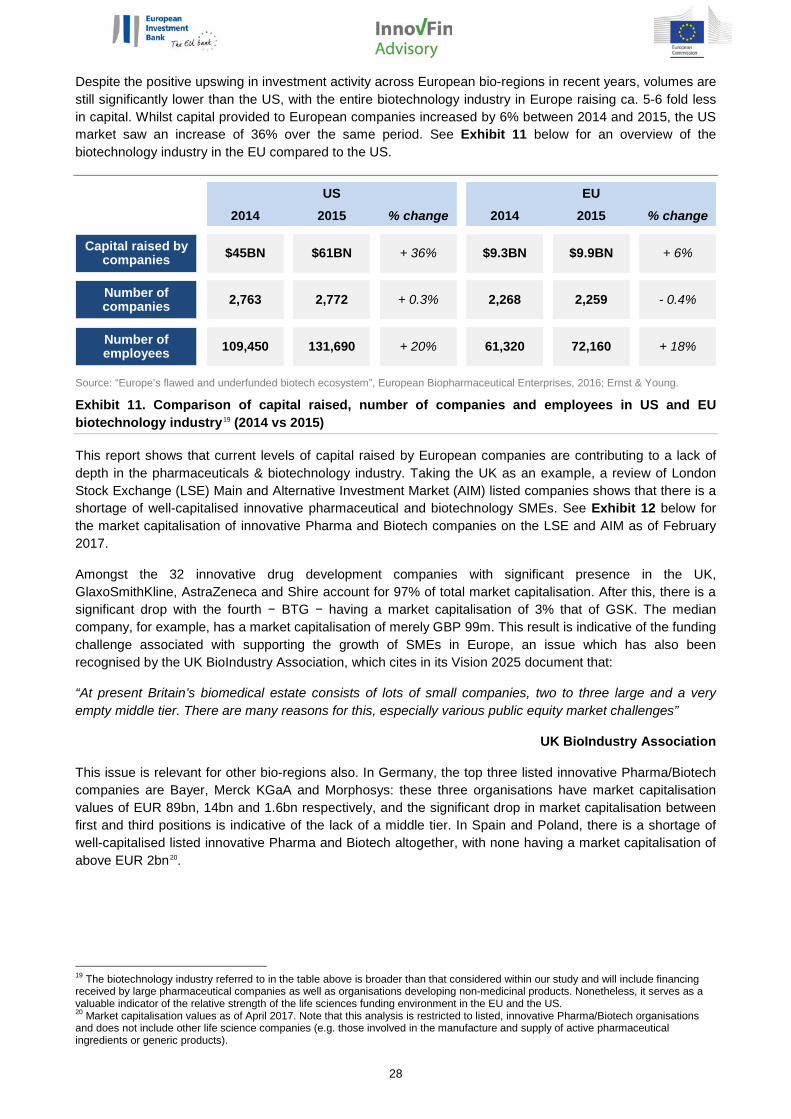
Despite the positive upswing in investment activity across European bio-regions in recent years, volumes are still significantly lower than the US, with the entire biotechnology industry in Europe raising ca. 5-6 fold less in capital. Whilst capital provided to European companies increased by 6% between 2014 and 2015, the US market saw an increase of 36% over the same period. See Exhibit 11 below for an overview of the biotechnology industry in the EU compared to the US.
Source: “Europe’s flawed and underfunded biotech ecosystem”, European Biopharmaceutical Enterprises, 2016; Ernst & Young.
Exhibit 11. Comparison of capital raised, number of companies and employees in US and EU biotechnology industry19 (2014 vs 2015)
This report shows that current levels of capital raised by European companies are contributing to a lack of depth in the pharmaceuticals & biotechnology industry. Taking the UK as an example, a review of London Stock Exchange (LSE) Main and Alternative Investment Market (AIM) listed companies shows that there is a shortage of well-capitalised innovative pharmaceutical and biotechnology SMEs. See Exhibit 12 below for the market capitalisation of innovative Pharma and Biotech companies on the LSE and AIM as of February 2017.
Amongst the 32 innovative drug development companies with significant presence in the UK, GlaxoSmithKline, AstraZeneca and Shire account for 97% of total market capitalisation. After this, there is a significant drop with the fourth − BTG − having a market capitalisation of 3% that of GSK. The median company, for example, has a market capitalisation of merely GBP 99m. This result is indicative of the funding challenge associated with supporting the growth of SMEs in Europe, an issue which has also been recognised by the UK BioIndustry Association, which cites in its Vision 2025 document that:
“At present Britain’s biomedical estate consists of lots of small companies, two to three large and a very empty middle tier. There are many reasons for this, especially various public equity market challenges”
UK BioIndustry Association
This issue is relevant for other bio-regions also. In Germany, the top three listed innovative Pharma/Biotech companies are Bayer, Merck KGaA and Morphosys: these three organisations have market capitalisation values of EUR 89bn, 14bn and 1.6bn respectively, and the significant drop in market capitalisation between first and third positions is indicative of the lack of a middle tier. In Spain and Poland, there is a shortage of well-capitalised listed innovative Pharma and Biotech altogether, with none having a market capitalisation of above EUR 2bn20.
19 The biotechnology industry referred to in the table above is broader than that considered within our study and will include financing received by large pharmaceutical companies as well as organisations developing non-medicinal products. Nonetheless, it serves as a valuable indicator of the relative strength of the life sciences funding environment in the EU and the US. 20 Market capitalisation values as of April 2017. Note that this analysis is restricted to listed, innovative Pharma/Biotech organisations and does not include other life science companies (e.g. those involved in the manufacture and supply of active pharmaceutical ingredients or generic products).
US EU
Capital raised by companies
Number of companies
Number of employees
2014
$45BN
2015
$61BN
% change
+ 36%
2014
$9.3BN
2,763 2,772 + 0.3% 2,268
109,450 131,690 + 20% 61,320
2015
$9.9BN
% change
+ 6%
2,259 - 0.4%
72,160 + 18%

29
Note: Two LSE listed companies with headquarters outside of the UK have also been included as part of this analysis. They are: Shire (Ireland HQ) and PureTech Health (US HQ).
Source: London Stock Exchange data as of 28 February 2017.
Exhibit 12. Market capitalisation of innovative Pharma and Biotech companies with a strong presence in the UK (at 28 February 2017, £M)
More detail about the 32 companies reviewed as part of this analysis can be found in Appendix F.
Analysis of the funding gap for life sciences R&D in four European bio-regions
Taking both financing supply and R&D demand into consideration, we have estimated the potential shortfall that in-scope life science organisations in Bavaria, Catalonia, Poland and the South East of England may face in funding their pipeline products over the next five years.
To estimate this gap, we have projected financing supply for each region from 2017 to 2021 with the growth scenarios previously discussed in Exhibit 4. This has been compared against the R&D cost required to support the product pipeline for the next five years, taking success rates and typical development costs and times into account as outlined in Exhibit 13 below. The R&D costs have been obtained using the methodology set out in Section II and assumptions in Appendix D.
41217222425343838476062677475761221241341541651821852372644289822,220
0
85,000
75,000
70,000
65,000
60,000
40,000
35,000
30,000
25,000
20,000
15,000
10,000
5,000
80,000
11 3231
80,923
109 16 2415 2221 26258 2827 30201413 1965 1817127 234
2,521
3
43,909
2
58,760
1 29
Mar
ket c
ap (£
M)
Company rank
-97%
Market capitalisation of Top 10 companies (£ M)
1 GlaxoSmithKline 80,923
2 AstraZeneca 58,760
3 Shire 43,909
4 Indivior 2,521
5 BTG 2,220
6 Vectura 982
7 4D Pharma 428
8 PureTech Health 264
9 Circassia 237
10 Mereo Biopharma 185
91% of companies (29 of 32) hold 4% of market capitalisation valueMedian market cap = £99M

30
Exhibit 13. High level methodology for estimating the R&D funding gap per bio-region
In the South East of England, we estimate that the R&D funding gap over the next five years will be in the region of EUR 20 – 30bn or 1.3 – 2.0X the value of the historic six-year supply21. In the other regions, the size of the gap is smaller. In Bavaria, the gap is calculated to be in the region of EUR 4.3 – 4.5bn or 1.4 – 1.5X the value of the historic six-year supply and in Catalonia and Poland the gap is EUR 5.0 & 0.6bn respectively. Unlike Bavaria and the South East of England, we have not provided a range for Catalonia and Poland as funding from all funding types is forecast to remain flat in the period 2017 – 2021 at the average of the last six years. For a comparison of the funding gap between all the bio-regions, see Exhibit 14 below.
Note: Forecasting has been conducted on the basis of a set of assumptions detailed in Section II. Please refer to “Approach to forecasting an estimate of the funding gap” sub-section and associated appendices for further details.
Exhibit 14. The total funding gap between forecast supply vs. R&D cost in each bio-region (2017-2021)
21 The gap does not take into account potential Brexit-related impacts.
Historic funding supply (2011-2016)
Forecast funding supply (2017 -2021)
Grants
Forecast R&D funding demand (2017 – 2021)
Private Equity
Debt
M&A
JV/Alliances
Public Financing
Combined investments sourced from:
Current R&D pipeline
Tech transfer offices
University & research institutes
Charitable organisations
SMEsProjected cost per product based on consideration of:
• Cost of R&D
• Duration of development
• Development success rate
Projected funding supply based on consideration of:
• Historic funding supply
• Forecast funding supply growth rate
Funding gap
Combined assets owned by:
Poland
EUR 43.8BN
EUR 5.0BN
EUR 0.6BN
EUR 0.6BN
EUR 5.6BN
Bavaria
EUR 0.1BN
South East of England EUR 24.0BN
EUR 13.7BN
EUR 3.1BN
EUR 3.4BN
EUR 7.7BN
EUR 4.5BN
EUR 19.8BN
EUR 30.1BN
EUR 4.3BN
EUR 0.8BN
Catalonia
Forecast Funding DemandForecast Supply (Best Case)Forecast Supply (Base Case)
Funding Gap
gap = EUR 30 – 40 BN

31
The analysis above details the additional financing required to meet the future cost of R&D. However, a more realistic picture of the financing challenge would also capture the non-R&D costs required to sustain a company. For small, early-stage companies with a limited number of research projects and pre-clinical and early-stage compounds, non-R&D costs are typically low at ca. 20% of total expenditure22. However, in the case of late-stage companies with Phase II and Phase III products in development, the cost base for both R&D and non-R&D expenditure increases significantly. This is driven by the higher cost of development associated with later-stage clinical development, as well the requirement to scale up sales & marketing functions and manufacturing capabilities as the company prepares for commercialisation.
As such, whilst our estimate of the future R&D funding gap already points to a sizeable shortage between the supply of and demand for financing, the overall funding gap may be greater still when non-R&D costs are taken into consideration.
In summary, our analysis provides an indication of the financing challenge facing organisations seeking to develop innovative medicines in Europe, and supports the argument for a better capitalised landscape for life sciences R&D.
22 Figure is an estimate based on interviews with SME drug discovery & development companies in the South East of England.
32
3. CURRENT FINANCIAL INSTRUMENTS USED TO SUPPORT LIFE SCIENCES INNOVATION IN EUROPE
State of play
As life science companies mature and their lead products move through successive stages of pre-clinical and clinical development, the demand for financing increases. For example, the cost of a Phase I clinical trial is estimated to be ca. EUR 17m whilst that of a Phase III clinical trial is estimated to be ca. EUR 169m23.
This increase in financing needs corresponds to a change in the financial instruments used by SMEs. Whilst the funding record of life science SMEs differs from one to another, there is a “typical” development path adopted by many emerging drug developers. For companies with lead molecules in early-stage research and pre-clinical development, low value instruments such as grants and angel and seed financing dominate. However, as companies move into clinical studies, the risk associated with drug development decreases (see Appendix D for success rates by phase of drug development) and private equity financing plays a much greater role. Following private equity investment, many SMEs will have a range of options available to them as they seek to grow. These include public listings, M&A activity, and JVs and alliances with other pharmaceutical companies. See Exhibit 15 below for a summary of common financing instruments and their usage per development stage, and Exhibit 16 below for a summary of historic financing across all four bio-regions between 2011 and 2016 split by investment type.
More recently there has been an emergence of new financing instruments beyond the traditional financing options discussed in this chapter. These new instruments range from catalytic/contingent grants to royalty financing, however they are currently few and far between, and not widely used. A more detailed analysis of these instruments can be found in Section 5.
In this section, we will explore the major financing instruments currently available in the market and the extent to which they are adopted in each bio-region (see Exhibit 17 below for a summary view). We will also consider the advantages and limitations of each of these mechanisms in supporting life sciences R&D.
23 Inflation-adjusted and USD to EUR-adjusted costs adapted from “How to improve R&D productivity: the pharmaceutical industry’s grand challenge”, S.M. Paul, 2010.

33
Note: 1. Cost of drug development is a direct cost and does not account for the cost of pipeline failures; 2. Analysis based on stakeholder interviews and review of historic funding activity 2011−2016.
Source: Drug development costs, duration and transition rate adapted from “How to improve R&D productivity: the pharmaceutical industry’s grand challenge”, S.M. Paul, 2010 and "Success Rates by Phase of Drug Development: Small Molecule Drugs vs. Biologics", Bernstein Analysis.
Exhibit 15: Common financing instruments and their usage per development stage
Note: 1. Analysis is based on publically available information on funding received by early/late-stage SMEs, commercialisation offices, universities and institutions over the period 2011–2016; 2. Series A, B, C and D-F refer to individual rounds of venture capital / private equity financing.
Source: Analysis of investment activity from Preqin; MarketIQ; Crunchbase; CBInsights; Medtrack; government, charity and company websites.
Exhibit 16. Total investment by type in across the four bio-regions (2011–2016), EUR M (an analysis by bio-region is provided in Appendices I, J, K and L)
1 year3 years2 years1 year4 years
Translational & pre-clinical research Clinical developmentDiscovery Pre-clin P I P II P III Filing
Cost of development per product (total, ca EUR 290M)
1 year
Grants
Angel & seed
Private equity
Public financing
JV & Alliances
M&A
High Medium Low Limited / none
Key: Typical usage (relative to other instruments at the same stage of development)
91%70%34%69%27% 54%Duration
Success rate
20
320
10
330
340
70
60
50
40
30
0550500450400350300250200150100500
Num
ber o
f Tra
nsac
tions
Average Investment Size (EUR M)
Oth
er P
rivat
e
M&A
JV & AlliancePubl
ic F
inan
cing
Debt
Series D-FSeries C
Serie
s BSe
ries
AAn
gel &
See
d
Grants
= EUR 18.9BN

34
Note: Analysis based on stakeholder interviews and analysis of investment activity 2011−2016
Exhibit 17. Current usage of traditional financing instruments per bio-region
Grants
For academic researchers and recently established drug development companies, grants are a means to validate and advance pre-clinical studies in a safe environment with no obligation for re-payment. For the grant provider, typically a public sector body or charitable organisation, the instrument serves as a means to promote high priority research and to deliver better health and economic benefits for the region.
Grants play an important role in supporting early-stage life sciences R&D in all bio-regions. A number of organisations – at the European, national and regional levels – offer grant programmes and notable examples include the Medical Research Council in the UK and the European Commission’s Horizon 2020 programmes.
Of the four bio-regions, the South East of England received the greatest proportion of financing from grant-based instruments, largely due to the presence of both government programmes and large-scale charitable organisations (see Exhibit 18 below for further details on prominent grant providers per bio-region). The other bio-region in which grants are dominant is Poland. Polish life science companies are heavily reliant on this instrument, with government grants accounting for ca. 42% of all financing in the 2011–2016 period. This dependency comes from the lack of other financing options: the very limited number of angel and venture capital investors in the country means that SMEs have few options available other than the grants generally provided by the Polish National Centre for Research and Development (NCBR). By comparison, the value of grant financing in Bavaria and Catalonia over the same period was smaller than in Poland, and companies in these two bio-regions have access to other instruments to support their growth.
From the perspective of life science companies, there is a strong appetite for grants which are better tailored to support their early-stage R&D programmes. Currently, the majority of grant programmes have strict entry criteria, are typically low in value and short-term, and are conditional upon certain requirements being satisfied as to their use. For an SME, these characteristics mean that accessing grants involves a high administrative burden in return for a limited amount of financing. An example of a grant initiative which could be adapted to better suit the demands of life science companies are the European Commission’s Horizon 2020 programmes. Companies interviewed in this study have indicated that Horizon 2020, and its predecessor the FP7 programme, provide invaluable support to their research initiatives. However, it has also been pointed out that the application process can be very cumbersome, the evaluation period is lengthy, success rates are low and the programme focuses more on the broad remit of academic research across multiple disciplines than on the commercialisation of life sciences R&D.
SE EnglandUK
BavariaDE
CataloniaES
GrantsPrivate equity incl. angel &
seedPublic market
financing JV & Alliances M&A
Poland
Key: 0 = rare / no usage, 1 = limited usage, 2 = some usage, 3 = common place 4 = extensive usage

35
“H2020 is helpful if you are able to get it. However, as a team of less than ten, we are not able to even think about applying for the grants. Compliance costs are too high and there are too many strings attached e.g. we will have to partner with other European companies which may not necessarily be the best strategy for us.”
CEO, early-stage Bavarian Biotech
“Biotech industry in Poland is heavily reliant on grants and own funds. The biggest grant provider is the National Centre for Research and Development (NCBR). Without grants, it would be near impossible for us to raise sufficient financing to conduct pre-clinical research.”
CEO, early-stage Polish Biotech
“There is a relatively high availability of grants in Germany from three main avenues: European (FP7/ H2020), national (EXIST-Forschungstransfer, GO-Bio and Personalised Medicine) and regional (m⁴ Award, FLÜGGE) grants. We rely mostly on government grants when conducting research/pre-clinical testing.”
CEO, early-stage Bavarian Biotech
Region Prominent grant providers South East of England • Pan-European: European Commission (EC), i.e. FP7/H2020, Eureka
Eurostars • National: Innovate UK, Medical Research Council (MRC), National Institute
for Health Research (NIHR) • Charities: Cancer Research UK (CRUK), Wellcome Trust
Bavaria • Pan-European: European Commission (EC), i.e. FP7/H2020 • National: Federal Ministry of Education and Research (BMBF), e.g. Go-
BIO, Federal Ministry for Economic Affairs and Energy (BMWi), e.g. EXIST-Forschungstransfer
• Regional: Bavarian Ministry of Economic Affairs and Media, Energy and Technology via FLÜGGE, m⁴ Award, BayTOU, BayTP
Catalonia • Pan-European: European Commission (EC), i.e. FP7/H2020 • National: Ministry of Economy, Industry and Competitiveness (MINECO) • Regional: Catalonia Trade & Investment (ACCIÓ)
Poland • Pan- European: European Commission (EC) i.e. FP7/H2020 • National: National Centre for Research and Development (NCBR)
Note: Prominent investors were derived on the basis of interviews held Mar – Jun 2016 and Feb – Mar 2017, and analysis of investors making active investments in life science SMEs over the 2011−2016 period
Exhibit 18. Prominent grant providers in each of the bio-regions
Private equity/venture capital
Private equity/venture capital has been a critical success factor for many European biotech companies, playing a significant role in progressing drug discovery advancements and products. Data from the EIF also shows that the specialised VC segment has been performing well, with life sciences investments outperforming other sectors as a VC asset class.
Providers of private equity cover technology transfer and venture capital funds as well as corporate venture capital arms, angel investors and high net worth individuals.

36
The venture capital landscape varies across the four bio-regions, with the South East of England having both the highest number of active specialised investors (ca. 15-20) and the greatest amount of financing (over EUR 2.3bn) over the 2011−2016 period. Some way behind is Bavaria (around seven to ten investors and EUR 343m of investments), followed by Catalonia (around five investors and EUR 170m) and Poland (around two investors and EUR 27m). See Exhibit 19 below for further details on prominent venture capital and private equity providers per bio-region.
Recipients of venture capital can benefit from financial support and commercial expertise from their investment partners. However, this is offset by the limitations of this investment model. SMEs participating in the study acknowledge the valuable role played by venture capital companies but they also believe that there is insufficient capital on offer, and that the typical venture capital investment model does not always provide the best support for life science companies. Akin to the issues raised about grant-based programmes, it is believed that private equity investments are often too short-term and small-scale in relation to the timescale and cost of drug development.
Furthermore, as Exhibit 14 indicates, there is a significant lack of follow-on funding – Series C, D and beyond. Whilst Series A and B investments are relatively common (47 transactions and 24 transactions respectively across the bio-regions over the 2011−2016 period), only three Series C investments and five Series D−F investments were made over the same period. This statistic in part reflects the limited venture capital options available to SMEs as they seek to grow independently, and is indicative of the tendency for life science companies to rely on public market listings, JVs & alliances, and M&A to sustain growth. This presents an issue for all SMEs though is most applicable in the South East of England where there is the greatest number of more mature SMEs.
The limitations of venture capital have also been echoed by investors. For example, a prominent investor in Germany pointed out that the approach and ticket size of its investments are limited by the number of fellow investors (in particular specialised investors) in the market, as well as the amount of financing it is able to raise from Limited Partners. A more detailed examination of investment constraints from the perspective of the investor can be found overleaf.
“Venture capital is the main source of financing in Bavaria, with multiple key investors such as Wellington Partners, MIG Funds and Bayern Capital. Family offices such as Strüngmann Brothers (Athos Service and Santo Holding) and Hopp Family (Dievini) also play a significant role in the private equity landscape. However, the lack of late-stage VC funds means that many innovative life science SMEs dare not dream of growing independently, the majority of them seeking rather to partner with or license out to Large Pharma.”
BioM representative
Region Prominent venture capital and private equity investors South East of England
• Venture capital: Imperial Innovations, SV Life Sciences, Invesco Perpetual, Woodford Investment Management, Atlas Venture, Index Ventures, Lundbeckfond Ventures, Sofinnova Partners
• Corporate venture capital: SR One, Pfizer Venture Investments, Syncona Partners, Advent Venture Partners, Astellas Venture Management, Johnson & Johnson Innovation
• Other: Novo A/S
Bavaria • Venture capital: Wellington Partners, Bayern Kapital, MIG Fonds • Corporate venture capital: Boehringer Ingelheim Venture • Public-private venture capital: Hightech-Gründerfonds • Other: NRW Bank via its Venture Fund, Hopp Family, Strüngmann Brothers
Catalonia • Venture capital: YSIOS, Caixa Capital Risc, Inverready, HealthEquity, Knowledge Capital Fund
Poland • Venture capital: Joint Polish Investment Fund (JPIF)

37
• Angel investor: Michał Sołowow • Other: National Centre for Research and Development (NCBR) via its VC-based BRIDGE
initiative
Note: Prominent investors were derived on the basis of interviews held Mar – Jun 2016 and Feb – Mar 2017, and analysis of investors making active investments in life science SMEs over the 2011−2016 period.
Exhibit 19: Prominent venture capital and private equity providers in each of the bio-regions
The investor perspective to funding life sciences R&D Interviews have revealed that investors face a number of constraints when making investments in life science SMEs. Mitigating such constraints is fundamental to addressing the funding challenge and therefore enabling the growth of more sustainable innovative life science companies in Europe.
Development of innovative medicines is capital-intensive and the quantum of capital required is not in line with the size of the average venture capital fund.
The European Private Equity and Venture Capital Association has noted: “EU venture capital funds remain relatively small. At around EUR 60m, the average European venture capital fund is only half the size of that in the US, and around 90% of EU venture capital investment is concentrated in only eight Member States.”24 By comparison, the cost of developing one drug, without taking account of pipeline failures, is estimated to be ca. EUR 290m.
The European VC life sciences ecosystem is in itself characterised by significant fundraising challenges which stem from a severely constrained investor base. This directly impacts the number of active teams/funds in the market and the generally reduced size of funds as compared to the US.
“There is a strong need for larger volumes of capital. Investors need to give more money – investing in [late-stage] research is a “big boys’” game and requires hundreds of millions of dollars.”
International equity investor
“Despite our aspirations, we find it extremely difficult to increase the size of our funds due to the limited availability of life sciences investors in Europe. If there were more life sciences investors, we would be keen to form a bigger syndicate and increase our fund size to support more companies.”
CEO, Polish venture capital investor
“If it was possible to raise more capital, we would like to have a more ambitious seed fund to invest in many more opportunities – we know they exist -– and look to provide larger and longer ticket sizes where appropriate.”
UK university technology transfer office
The lifetime of a traditional fund is approximately ten years, driven primarily by the payback period that limited partners are willing to accept before they seek a return on their investment.
After the time taken to make the investment and to wind down the fund is taken into account, the typical investor is only able to sustain their financing in a particular life science SME for five to seven years, shorter 24 European Private Equity & Venture Capital Association, cited in European Commission, “Action Plan on Building a Capital Markets Union”, 30 September 2015.
Constraint 1: Low quantum of capital available in life science funds
Constraint 2: Short payback period to limited partners

38
than the time needed to commercialise a medicine. Whilst the typical VC investment horizon remains traditionally short, new private equity models addressing such gaps are, however, being tested (e.g. funds with shorted investment periods – thus allowing more time for development and exit – and crossover funds holding both private and public equity.
“The venture capital model for Pharma and Biotech is broken. A biotech fund may have a typical term of ten years, with the money invested by year 3 and cash collected by year 9. As such, the biotech often only has three to six years to grow; this is much shorter than the time taken to develop a product through to commercialisation and places some pressure on us to either IPO or find a Pharma partner by the end of the investment window.”
CEO, early-stage UK Biotech
Innovative life sciences R&D is a specialised field that requires scientific and commercial expertise, and investments in this sector come with a high-level risk. In addition to the risk of failure during product development, the uncertainty as to whether a new product will be reimbursed presents an additional risk.
Many investors feel that they lack the expertise to make a full evaluation of the risk-reward profile of medicines, and thus make small individual investments, typically in a syndicate with other investors, as a means to reduce exposure. Furthermore, other technology sectors, such as IT and communication technologies, could be perceived as requiring less technical expertise and potentially be of lower risk, and may therefore be seen as more attractive.
“Unlike the US, in Europe there are no ‘market makers’ or specialist investors which pick up life sciences stock and signal to generalists that these particular companies are a quality investment to have. So we were looking at putting money alongside UK-based specialists. The sector is too difficult to assess companies properly but if the specialists do the due diligence and buy, then it gives confidence.”
UK-only debt provider
“Till five to ten years ago you had large sell-side equity teams with dedicated biotech personnel […]. However, there has been a drop in coverage and resources. The biotech crash and the fall in R&D productivity in Big Pharma have meant that [..] investor education has declined. There is a circular link between the critical mass of life science companies and infrastructure.”
Experienced international equity investor
A lack of successful home-grown biotech companies and the reminder of high-profile and costly late-stage failures can lead to a dampening of market confidence.
For example, the UK biotech Circassia’s Phase III clinical trial failure in 2016 led to a 76% drop in share price25. This reduced market confidence in turn drives more risk-averse and lower-value investments to new companies, propagating the current issues in the market.
“Many years ago, there were a lot of venture capital investors investing in life sciences in Germany; however, the economy wasn’t doing too well and the bubbles eventually burst; a lot of them went bankrupt. Current investors are still haunted by such event and are afraid to invest in life science companies…there has not been enough success stories to convince them otherwise.”
General Partners, German venture capital investor
25 “Circassia shares drop after cat allergy drug fails in trial”, 20 June 2016, Financial Times
Constraint 3: High technical expertise required for investments
Constraint 4: Limited track record of successful companies
39
The aforementioned constraints underpin the behaviour of investors and contribute to the challenge associated with financing life sciences R&D, namely that investment size is low and short-term, and investment behaviour is risk-averse and not suited to the drug development process.
In seeking solutions to overcome these constraints, the US market acts as a good example of a more successful market from which lessons can be learned. The US life sciences market is several times greater than that of the EU and this is arguably directly attributable to a significantly deeper and more specialist investor base as well as a more sophisticated market infrastructure which has drawn more generalist institutional investors to life sciences and resulted in sustained growth over time.
Case study: insurance companies and VC investments 2016 saw for the first time a German public insurance company investing as a limited partner in a VC biotech fund. This represents an interesting case study not only for its novelty but also for the way the investment was structured, to allow the insurance company to invest outside its typical investment spectrum. A few elements worth noting:
The investment was of a purely strategic nature (i.e. gaining insight into the latest development in the sector and providing advice from a statutory body to the fund manager about the approval process and reimbursements) and was not part of a more general investment strategy into alternative asset classes;
The insurance industry is heavily regulated at both international and national level and statutory obligations foresee the majority of the investment portfolio of a typical health insurer to be short-term and very liquid to meet liabilities towards policy holders;
In this instance the investment was made deliberately into a med-tech fund, i.e. a fund focused on the medical devices segment. During the interview it was highlighted that the investment was not made into a fund with a focus on innovative medicines because the technology area was viewed as being too costly, too high-risk and too capital-intensive. Instead, it was decided to invest in an adjacent sector, the medical devices industry, where the investor was able to seek a return within a shorter time frame (ca. five years) and with a lower investment value (ca. EUR 50m). These issues are akin to those raised by many venture capital investors themselves;
The investment was made possible by a risk mitigating arrangement whereby the insurance company accepts a capped but guaranteed return on its investment (partly guaranteed by the Federal Ministry, partly by other Limited Partners – which share the additional risk as well as the potential upside).
Whilst the institutional investor in this instance did not choose to invest in drug development, the investment hypothesis and approach taken nonetheless highlight some key lessons for future opportunities:
1. Insurers and other institutional investors are willing to invest in the broader life sciences industry if there is a strategic as well as commercial rationale.
2. Institutional investors are willing to invest in the broader life sciences industry if the appropriate support is available from public sector institutions. In particular, this case shows that the risk-return profile of a typical VC investment can be adjusted to meet the requirements (and potentially regulatory/statutory constraints) of institutional investors, via i.a. asymmetric returns, guarantees, etc.
“Our company’s investment into [specific venture capital fund] was a conscious choice to invest in medical devices development rather than drugs development. The drug development process is complicated and difficult for us to exert control. The medical devices industry is easier to understand and to influence for us.”
German institutional investor
Impact of constraints on investment behaviour
40
Public markets
Public market listings are considered by life science companies which have typically received several rounds of private equity investment. To “go public”, companies will hold initial public offerings (IPO) and trade their shares on a stock exchange.
Within the bio-regions under review, life science companies do not see their local public markets as a particularly desirable means to raise financing. European life sciences public markets remain fragmented, lack liquidity and depth. Public listings are more common for companies in the South East of England (53 IPOs and right issues between 2011 and 2016) than in other bio-regions (16 IPOs and rights issues in Bavaria, two IPOs and rights issues in Poland, one IPO in Spain over the same period), but SMEs across all markets believe that there is a severe deficiency in capital availability in European public markets. The lack of life science analyst coverage leads to a lack of understanding of the sector, which in turns leads to insufficient investor appetite as well as sub-optimal valuations. As a result, IPOs are not the preferred exit route for most biotech SMEs in Europe.
This is most evident when comparing SMEs with a similar therapeutic focus, at comparable stages of drug development, listed on different public markets. The trade association European Biopharmaceutical Enterprises illustrated this in a recent position paper26. ArGEN-X (Netherlands) and Five Prime Therapeutics (US) are both early-stage antibody companies with a focus on oncology. ArGEN-X is listed on Euronext, whilst Five Prime is listed on the NASDAQ. Both companies listed within a one-year timeframe between September 2013 and September 2014, and the current market capitalisation of ArGEN-X is USD 347m whilst that of Five Prime Therapeutics is much greater at USD 1.1bn (figures as of March 2017).
“Public market is not working well here in Europe…there is a lack of trading volume […]. Particularly in Germany, our current pension funds system is not helpful at all. It seems impossible for us to rely on IPO as the main exit strategy unlike in the US.”
CEO, early-stage Bavarian Biotech
Joint ventures & alliances
JVs and alliance deals are usually formed between SMEs and large multinational pharmaceutical companies. These deals are usually of very high value, incorporating upfront payments, development-based milestone payments and eventual royalty fees if the product reaches commercialisation.
JVs and alliances are seen to be a lucrative route to market for later-stage SMEs. Life science companies are attracted to these deals because of the immediate injection of undiluted capital through upfront and subsequent milestone payments. In addition if the product is successful in the clinic, royalty payments can also provide significant revenues that can be re-invested into R&D or used to expand operations. This method of financing also has upsides for large pharmaceutical companies, allowing them to in-source R&D activities and gain access to potential high-value products without taking on the entirety of the risk associated with drug development.
Despite these benefits there is a significant drawback from a venture capital investor’s perspective. Venture funds are often subject to stringent return on investment (RoI) criteria and the short time horizons of the Limited Partners which have invested in their funds. Unfortunately, these alliance deals rarely provide investors with the ability to realise their investment within the time horizon of the venture fund and thus investor’s exit options are often limited to M&A transactions or occasionally public flotations.
The prevalence of these deals varies significantly across the bio-regions and, in the period 2011 to 2016, they were most prevalent in the South East of England (14 companies signed 29 agreements) and Bavaria (six companies signed 21 agreements). By comparison, only one joint venture/alliance deal was signed in Catalonia and one in Poland.
26 “Europe’s flawed and underfunded biotech ecosystem”, European Biopharmaceutical Enterprises, 2016.
41
“Licensing deals with Large Pharma isn’t an attractive option for venture funds as the royalties/milestone payments slowly trickle back to the portfolio company and it is hard to get the invested capital back to the Limited Partners – M&A is a faster route”
General Partner, Spanish venture fund
Mergers & acquisitions
Large biotechnology and pharmaceutical companies can also directly acquire assets or buy out innovative SMEs through M&A transactions.
SMEs often favour these deals, as large pharmaceutical companies can provide them with the resources needed to conduct later-stage clinical trials and the expertise to register, manufacture and distribute their products globally. Despite this, companies interviewed in this study also indicated that they would like an alternative option allowing them to remain independent if they desire.
From an investor’s perspective, an exit via an acquisition is seen to be a highly desirable investment strategy. This is because venture funds prefer to invest at Pre-Clinical/Phase I whilst the valuation of the SME is low and then immediately exit after Phase II, once positive clinical efficacy data has been generated, attracting interest from large pharmaceutical buyers. In addition, a four-year development period (from Pre-clinical to Phase II) fits within the lifetime of a venture capital fund and allows investors to exit before Phase III trials, which typically require additional rounds of financing.
On the whole, M&A tend to be few and far between, with only 14 transactions involving innovative biotech SMEs recorded in the period 2011–2016. Despite the low volume they tend to typically be of high value and examples include Heptares Therapeutics’s acquisition by Sosei (EUR 377m, 2015) and Convergence Pharmaceuticals’ acquisition by Biogen Idec (EUR 637m, 2015). The majority of these deals (11 of the 14 deals) were companies in the South East of England, with only one in Bavaria, one in Poland and one in Catalonia.
Large Pharma and Biotech deal-making activity is seen to be substantially greater in the US than Europe. A recent EY report shows that despite there being a comparable number of public and private biotech companies (2,772 in US vs. 2,259 in Europe), there were 64 deals totalling USD 90bn in the US in 2015, whereas in Europe there were only 41 deals totalling USD 15bn during the same period27.
“We would love to bring our product to the market independently, but the hurdles are just too great in Europe and at some point you need a corporate to help bring the product to market, be it through a partnership or acquisition.”
CEO, early-stage Bavarian Biotech
“Many investors like to invest around Pre-Clinical/Phase I and divest around Phase II. In general, the main driver has to do with the value creation for the asset. Clinical trials in Phase II are designed to observe efficacy, and so, once an asset has shown good efficacy, it is generally most valuable to a potential buyer (large pharmaceutical company).”
General Partner, venture capital fund
27 Company statistics and M&A deal activity has been sourced from the 2016 edition of the EY Beyond Borders Biotechnology Report. Reference to the biotechnology industry will cover a wider range of companies than the scope of this study, however the statistic is still a useful indicator of EU vs. US financing in the sector
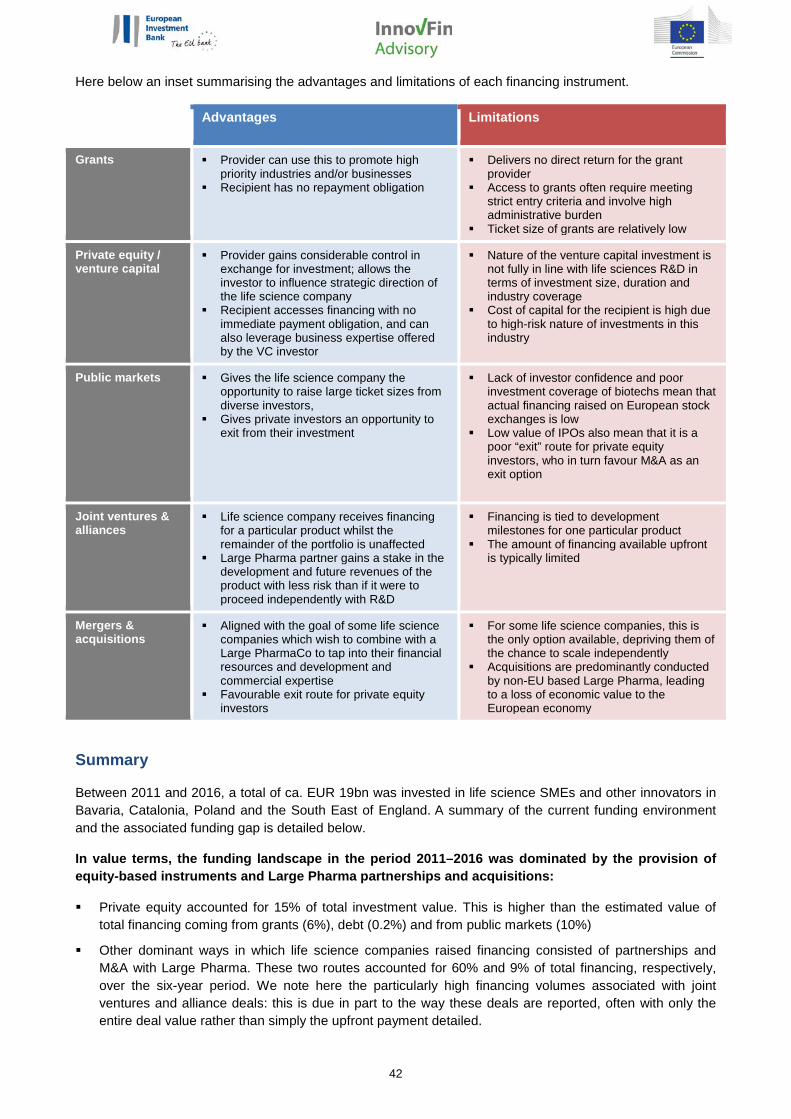
42
Here below an inset summarising the advantages and limitations of each financing instrument.
Advantages Limitations
Grants Provider can use this to promote high priority industries and/or businesses
Recipient has no repayment obligation
Delivers no direct return for the grant provider
Access to grants often require meeting strict entry criteria and involve high administrative burden
Ticket size of grants are relatively low
Private equity / venture capital
Provider gains considerable control in exchange for investment; allows the investor to influence strategic direction of the life science company
Recipient accesses financing with no immediate payment obligation, and can also leverage business expertise offered by the VC investor
Nature of the venture capital investment is not fully in line with life sciences R&D in terms of investment size, duration and industry coverage
Cost of capital for the recipient is high due to high-risk nature of investments in this industry
Public markets Gives the life science company the opportunity to raise large ticket sizes from diverse investors,
Gives private investors an opportunity to exit from their investment
Lack of investor confidence and poor investment coverage of biotechs mean that actual financing raised on European stock exchanges is low
Low value of IPOs also mean that it is a poor “exit” route for private equity investors, who in turn favour M&A as an exit option
Joint ventures & alliances
Life science company receives financing for a particular product whilst the remainder of the portfolio is unaffected
Large Pharma partner gains a stake in the development and future revenues of the product with less risk than if it were to proceed independently with R&D
Financing is tied to development milestones for one particular product
The amount of financing available upfront is typically limited
Mergers & acquisitions
Aligned with the goal of some life science companies which wish to combine with a Large PharmaCo to tap into their financial resources and development and commercial expertise
Favourable exit route for private equity investors
For some life science companies, this is the only option available, depriving them of the chance to scale independently
Acquisitions are predominantly conducted by non-EU based Large Pharma, leading to a loss of economic value to the European economy
Summary
Between 2011 and 2016, a total of ca. EUR 19bn was invested in life science SMEs and other innovators in Bavaria, Catalonia, Poland and the South East of England. A summary of the current funding environment and the associated funding gap is detailed below.
In value terms, the funding landscape in the period 2011–2016 was dominated by the provision of equity-based instruments and Large Pharma partnerships and acquisitions:
Private equity accounted for 15% of total investment value. This is higher than the estimated value of total financing coming from grants (6%), debt (0.2%) and from public markets (10%)
Other dominant ways in which life science companies raised financing consisted of partnerships and M&A with Large Pharma. These two routes accounted for 60% and 9% of total financing, respectively, over the six-year period. We note here the particularly high financing volumes associated with joint ventures and alliance deals: this is due in part to the way these deals are reported, often with only the entire deal value rather than simply the upfront payment detailed.
43
The four bio-regions attracted EUR 18.9bn of funding over the period 2011–2016:
The South East of England received funding amounting to EUR 15.0bn over the 2011–2016 period, equivalent to ca. 79% of all investment across the four bio-regions. Across each of the financing instruments – grants, private equity, public markets, JVs & alliances and M&A – the South East of England remains the region that attracted the bulk of investments during this period
In comparison, Bavaria is in second place with a total financing amount of EUR 3.1bn over the same period. Catalonia and Poland are ranked third and fourth, with financing values of EUR 708m and 167m respectively
The review of current financing instruments and their impact on life science companies has also led to the identification of a series of challenges which apply to all four bio-regions. These factors relate to ticket size, investment duration and public market depth:
Across all bio-regions, investment ticket sizes are typically too low and investment duration is too short, as will be further elaborated in Section 4, which creates a misalignment with the dynamics of the drug development process. These characteristics are especially relevant for but not exclusive to venture capital investments, despite some recent positive developments to address such challenges and the generally good performance of VC life sciences investments as an asset class
Desktop research and interviews also indicate that there is limited capital availability in European public markets. Capital markets in these bio-regions are not sufficiently liquid to provide the large financing volumes needed to support continued growth of innovative biotechnology companies
In addition to these cross-regional funding challenges, a number of region-specific gaps were also identified:
In the South East of England, there is a number of active investors which provide grants, angel investments and Series A and B venture capital investments. However, there is a lack of follow-on investment (Series C and beyond) to fund mid and late-stage companies with Phase II and Phase III clinical development compounds. This issue, combined with the aforementioned public market challenge, is contributing to a shortage of mid-cap companies
In Catalonia and Bavaria, the innovative life sciences market is less established than that of the South East of England, with fewer investors and fewer SMEs. The financing need for these bio-regions is most acute for pre-clinical and mid-stage clinical companies; early-stage clinical companies are relatively well financed and there are very few late-stage companies in both these bio-regions
In Poland, the life sciences R&D landscape is very different to that of the other three bio-regions. The Polish innovative life science sector is still in its infancy, with a severe lack of companies developing innovative drugs across all maturity levels. This is caused by not only the shortage of private financing but also underdeveloped infrastructure such as limited capabilities in technology transfer and business support for spin-outs
Altogether, market participants across all four bio-regions generally see a need for more equity instruments and a stronger public capital market:
A survey asking investors and representatives from trade associations and research institutes “What are the sources of funding where you perceive the biggest mismatch between demand and supply?” found that across all four bio-regions, private equity and capital markets are seen as the main instruments where there is a mismatch between supply and demand
Angel, seed and technology transfer services are also among the top three selected in all regions. When corroborated with interviews, it is believed that this provision should be prioritised in Bavaria and Catalonia in particular where there is the greatest unmet demand for these products (i.e. presence of early-stage companies with a shortage of private equity investments)
At the other end of the spectrum, survey respondents do not see a “gap” in funding from royalty players or from corporate partnerships i.e. JVs and alliances. See Exhibit 20 below for an overview of survey responses on perceptions of financial instruments with the biggest mismatch between demand and supply, per bio-region

44
Note: Total number of respondents is 54 of which 30 are investors and 24 are other stakeholders from trade associations and research institutes. As we allowed respondents to select more than one choice for this question, the total number of responses does not equate to number of respondents who completed the survey.
Exhibit 20. Survey respondents’ answers in response to “What are the sources of funding where you perceive the biggest mismatch between demand and supply? Please select all that apply”
SE England (UK)N = 64
Bavaria (DE)N = 43
Catalonia (ES)N = 31
PolandN = 25
Private equityPrivate equity Capital markets
Capital marketsCapital markets Private equity
Angel, seed or TTO
Angel, seed or TTO
Angel, seed or TTO
Debt (public source)
Debt (public source) Grants
Private equity
Capital markets
Angel, seed or TTO
Debt (public source)
Debt (commercial)
Debt (commercial)
Debt (public source)
GrantsGrants Debt (commercial)
Debt (commercial)
Corporate partnerships
Royalty financing
Corporate partnerships Other Other
Corporate partnershipsOther Corporate
partnerships
OtherRoyalty financing
Royalty financing
Grants
Royalty financing
31%
23%
14%
9%
9%
5%
3%
3%
2%
35%
23%
19%
9%
7%
2%
2%
2%
0%
26%
23%
13%
13%
10%
6%
6%
3%
0%
36%
20%
12%
12%
12%
4%
4%
0%
0%
Top 3 choices across all bio-regions Bottom 3 choices across all bio-regionsKey:

45
4. IMPACT OF THE CURRENT FINANCING LANDSCAPE FOR LIFE SCIENCE COMPANIES
Introduction
The financing challenges presented in the previous section are seen to pose several problems for R&D intensive life science companies. These problems are the result of three variables: average investment size, investment duration and continuity, and sector coverage (see Exhibit 21).
Exhibit 21. The three-dimensional funding challenge for life science SMEs
This study has demonstrated that these factors are apparent across European bio-regions, resulting in similar problems for SMEs. Evidence from each of the four bio-regions indicates that ticket sizes are too low to support innovative drug development and that companies have to look for financing from multiple sources. In addition, there is a clear preference to invest in select therapeutic areas. See Exhibit 22 below for a summary of supporting evidence on the three-dimensional funding challenge per bio-region.
At least one of these dimensions pervades across each of the popular financing instruments available to SMEs in the life science sector (e.g. grants, venture capital, public markets etc.). As a result, limitations to financing across each of the three dimensions present a series of operational as well as longer-term strategic challenges for SMEs. In this section, we examine these challenges from the SME perspective.

46
Note: 1. Analysis is based on publically available information on funding received by early/late-stage SMEs over the period 2011–2016; 2. Analysis is limited to companies and excludes funding received by commercialisation offices, universities and institutions; 3. The estimated cost of drug development does not include the cost of pipeline failures; 4. Median ticket size is the median transaction recorded within a given region; 5. Median company funding is the median funding value recorded at the company level in a given region; 6. Funding examples provided under “investment duration and fragmentation” are considered to be among the most mature in the given region; 7. Therapeutic coverage refers to an analysis of funding provided per company and the associated company’s primary therapeutic area of focus.
Source: Analysis of investment activity from Preqin; MarketIQ; Crunchbase; CBInsights; Medtrack; government, charity and company websites.
Exhibit 22. Applicability of the three-dimensional challenge per bio-region
32
6 4 1
62
3
25
6
Median Ticket Size (EUR M)Median Company Funding (EUR M)
Oncology
79%
Other
12%CNS
9%
Other
Oncology
54%46%
Other
11%Endocrine
6%
Oncology
83%
Other
48%
Oncology
52%
TICKET SIZE IS TOO LOW1
INVESTMENT IS SHORT & FRAGMENTED2
LOW THERAPEUTIC COVERAGE3
EUR 3.1BN
EUR 0.7BN
EUR 0.2BN
EUR 14BN
Bavaria Catalonia Poland South East of England
Number of financing rounds and instruments used by the most prominent SME in each bio-region
13 financing rounds using
4 differentinstruments
9 financing rounds using
5 differentinstruments
7 financing rounds using
5 differentinstruments
9 financing rounds using
4 differentinstruments
The median financing per company in all four regions is significantly lower than the cost of developing a drug from Research to Phase III (can be in excess of ca. EUR 290M)
Median funding received per company and per transaction in each bio-region (2011-2016)
Share of total financing by therapeutic area of focus (company-level analysis)
over 10 years over 8 years over 6 years over 8 years
Bavaria Catalonia Poland South East of England
Bavaria Catalonia Poland South East of England
The most mature company in each region has raised multiple rounds of short-lived financing via various instruments over the last 6-10 years
The product pipeline covers 13 therapeutic areas, yet over 50% of financing is seen to go to a single therapeutic area in each region (immuno-oncology in all regions)

47
Dimension 1 of 3: Average investment size is too low
The first life sciences financing challenge observed is that the size of an average investment is too low to fully support research and development programmes. Analysis of funding supply shows that the mean investment value provided to a company over the 2011 to 2016 period is EUR 145m. The median investment value for a company, however, was significantly lower, at EUR 21m. See Exhibit 23 for details of the total funding received per company between 2011 and 2016, and the mean and median funding received per company in each of the bio-regions over the same time period.
Companies in certain bio-regions receive higher volumes of funding than those in others. The mean financing per company in the South East of England (EUR 163m) and Bavaria (EUR 181m) is relatively high because of several “outlying” companies with very high investment values. For example, three Bavarian companies28 and 11 South East of England companies29 received financing totalling over EUR 500m over this period; this is primarily driven by high-value M&A transactions and JVs/alliance deals.
In Poland, the mean funding size of EUR 53m, and median funding size of EUR 62m, are the result of the fact that the three SMEs developing innovative medicines30 in the region have either recently listed or have received significant grants from the Government. By comparison, the mean and median investment values in Catalonia are low, driven by the presence of early-stage development companies and the presence of only one JV and alliance deal.
Note: Analysis is based on publically available information on funding received by early/late-stage SMEs over the period 2011–2016 via all funding types, excluding funding received by commercialisation offices, universities and institutions.
Source: Analysis of investment activity from Preqin; MarketIQ; Crunchbase; CBInsights; Medtrack; government, charity and company websites.
Exhibit 23. Total investment received by life science organisations in Bavaria, Catalonia, London & SEE and Poland (2011–2016), EUR m
28 4SC, Medigene and Peris 29 Adaptimmune , Bicycle Therapeutics , Circassia , Convergence Pharmaceuticals , Crescendo Biologics , Heptares Therapeutics, Immunocore, Oxford Biotherapeutics, Proximagen, PsiOxus Therapeutics and Summit Therapeutics 30 Celon Pharma, Oncoarendi Therapeutics, Selvita
1,500
1,600
400500
600
300
200100
0
1,400
1,300
1,2001,100
700800
1,000
900
Company rank
Tota
l fun
ding
rec
eive
d 20
11 –
2016
(EU
R M
)
Median = EUR 21M
Mean investment value of EUR 145M
= EUR 18.1BNBio-region
Mean funding per company
(EUR M)
Median funding per company
(EUR M)No. companies
Bavaria 181 32 17
Catalonia 39 4 18
Poland 53 62 3
South East of England 163 25 87
All bio-regions 145 21 125
48
Impact of low volumes of financing on life science SMEs:
Low investment values present several problems for European life science SMEs:
1. Management teams are not necessarily able to attract the right skills and capabilities into the organisation because their financial situation prevents them from being able to offer longer-term job roles.
“It’s absurd. The value raised by a [life science] company in a typical round of financing means you can only plan a year ahead. How can you recruit good people to join your business when you can’t guarantee them a job for more than a year? This makes it very difficult for me to run a good business day-to-day.”
CEO, early-stage UK Biotech
2. Companies can afford to finance only one or two products, forcing them to rely on the success of their lead programmes. Consequently, this increases the risk profile of the company for potential future investors.
“We had difficulties raising capital right from the beginning, having to use several different sources that provided very small amounts of funding. This forced us to focus on a single candidate that we could try and get into the clinic.”
CEO, early-stage Catalonian Biotech
3. Long term strategies cannot be developed as life science companies with small investments are forced to focus on immediate and nearer-term milestones
“I would like to plan into the future, but it is really difficult, near impossible, to do so due to the available financing we can get (amount, duration, type)."
CEO, early-stage Bavarian Biotech

49
Dimension 2 of 3: Investment duration is too short
The second challenge associated with life sciences financing is that investment durations are too short. Life science innovators have to seek multiple financing rounds from various sources to take their research projects through to clinical development, a problem which is particularly notable at early- to mid-stage clinical drug development.
At the stages of pre-clinical research and early clinical research, innovators typically adopt a series of short-term charitable and government grants as well as funding from seed and angel investors to advance their products.
Subsequently, private equity investors begin to play a dominant role in the provision of expansion, growth and innovation capital to biotech SMEs. Whilst the typical life cycle of a venture investment fund is approximately ten years, during that time there may be significant periods of little to no investment, both in the early years (as potential investment opportunities are screened) and at end of the fund (as investments are divested and cash is collected). As a result, funds often only have a limited investment window of three to six years to support companies; a period which is further limited by multiple financing rounds driven by development milestones.
An overview of the financing history of three prominent life science SMEs in Bavaria, Catalonia, Poland and the South East of England can be found overleaf (see Exhibit 24 below). It can be seen that each company sourced multiple funding rounds from a variety of instruments over the ten-year period, with grants, equity instruments, public financing, acquisitions and debt all coming into play.
The contrast between a well-financed SME in the South East of England and in Catalonia is stark. Over the past ten years, Circassia has received four large rounds of financing spread over five years from the same investors (Touchstone Innovations & Invesco) before eventually listing on the London Stock Exchange, raising an additional EUR 334m. In comparison, Oryzon Genomics in Spain has relied on small grants from the local government and two comparatively small venture capital rounds from different investors (Corsabe Capital then ICF Capital), before signing a large alliance deal to study Oryzon’s LSD1 inhibitors with Roche.
“Venture Capital plays a prominent role in the growth of small biotechnology companies in Europe. This is a model that is proven to work for other sectors such as ICT, but it isn’t as successful in biotech as the development times are much longer-”
CEO, European network association
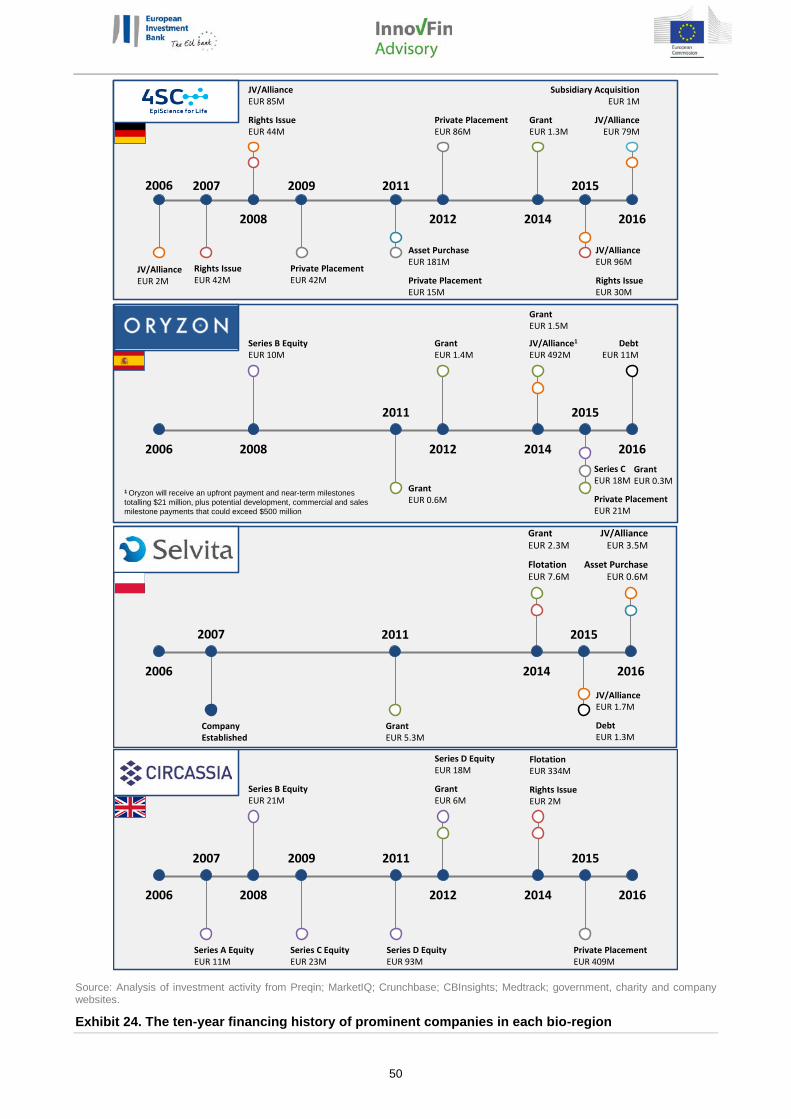
50
Source: Analysis of investment activity from Preqin; MarketIQ; Crunchbase; CBInsights; Medtrack; government, charity and company websites.
Exhibit 24. The ten-year financing history of prominent companies in each bio-region
2016
2015
20142012
20112009
2008
20072006
JV/AllianceEUR 2M
Rights IssueEUR 42M
JV/AllianceEUR 85M
Rights IssueEUR 44M
Private PlacementEUR 42M
Asset PurchaseEUR 181M
Private PlacementEUR 15M
Private PlacementEUR 86M
GrantEUR 1.3M
JV/AllianceEUR 96M
Rights IssueEUR 30M
Subsidiary AcquisitionEUR 1M
JV/AllianceEUR 79M
2016
2015
20142012
2011
20082006
Series B EquityEUR 10M
GrantEUR 0.6M
GrantEUR 1.4M
GrantEUR 1.5M
JV/Alliance1
EUR 492M
Series CEUR 18M
Private PlacementEUR 21M
DebtEUR 11M
GrantEUR 0.3M
1 Oryzon will receive an upfront payment and near-term milestones totalling $21 million, plus potential development, commercial and sales milestone payments that could exceed $500 million
2016
2015
2014
2011
2006
GrantEUR 5.3M
GrantEUR 2.3M
FlotationEUR 7.6M
JV/AllianceEUR 1.7M
DebtEUR 1.3M
JV/AllianceEUR 3.5M
Asset PurchaseEUR 0.6M
2007
CompanyEstablished
2016
2015
20142012
20112009
2008
2007
2006
Series A EquityEUR 11M
Series B EquityEUR 21M
Series C EquityEUR 23M
Series D EquityEUR 93M
Series D EquityEUR 18M
Grant EUR 6M
FlotationEUR 334M
Rights IssueEUR 2M
Private PlacementEUR 409M
51
Impact of short and fragmented investments on life science SMEs:
This investment model is not well aligned with the drug development timeframe of 10-15 years and, as a result, places pressure on companies to meet short-term targets at the cost of longer-term strategic planning.
Interviews revealed that companies with mid-stage development compounds can face internal and external pressures to pursue early exits via (a) partnerships or buyouts or (b) public market listings in order to sustain growth. Interview findings have also shown that neither of these exit routes is perceived to deliver optimal value for the life science company when executed at an early stage. In the case of partnerships or buyouts, the value of the company’s products and technologies is often transferred to Large Pharma before it has been fully explored by the SME, whilst in the case of public markets, the relative immaturity of companies when they IPO means that they are often undervalued and struggle to seek sufficient volumes of capital to complete high-cost late-stage clinical trials. These factors are not conducive to the development of a strong tier of successful, independent mid-sized companies.
More recently there have been some positive developments with the emergence of “patient” capital players, including some early-stage tech transfer funds (with horizons of over 16 years), a few specialised VC funds with extended life, evergreen funds and a few public investment companies and trusts. Players like Woodford Investment Management, Syncona and Touchstone Innovations aim to provide long-term sustainable funding to help companies grow. This type of funding is currently present in the South East of England, but is rare in other European bio-regions. However, the recent arrival of the US-based “patient” capital fund Alta Life Sciences in Catalonia indicates that other European bio-regions are exploring such financing mechanisms. More details of “patient” capital funds can be found in the subsequent section of the report.
“If you look at the most successful small Pharma and Biotech companies currently operating in the UK, they’ve all received long-term backing from a group of core investors. This has given them the flexibility to explore their options and understand their technology platform before proceeding with clinical studies.”
CEO, early-stage UK Biotech
“There are very few funds that are evergreen and looking to invest large sums of capital in European biotechnology, especially outside of the UK. We believe that there is a gap in the market. We would like to change this and grow the pipeline in Spain”
CEO, patient capital investor
52
Dimension 3 of 3: Investment is focused on select therapeutic areas
A further challenge that life science companies in Bavaria, Catalonia, Poland and the South East of England face is that investment tends to be focused on a select pool of therapeutic areas. Three areas of drug development – immuno-oncology, respiratory and central nervous system (CNS) – receive significantly more financing than others31. Across each of these regions, companies with a core focus on oncology and immunomodulators received the most financing, accounting for 60% of the total value provided to companies between 2011 and 2016. See Exhibit 25 overleaf for a summary of the number of companies with a core focus in a particular therapeutic area, the average investment received by the company, and the total six-year deal size.
There are two inter-related factors which contribute to this investment focus:
Firstly, therapeutic areas perceived to have better “exit potential” attract more investment. Factors that drive exit potential include: the likelihood of the product to receive reimbursement in critical markets, the amount of investment and time required to reach commercialisation and/or an inflection point for exit, and alignment to Large Pharma’s focus areas for buyout.
For example, cell and gene therapies for oncology-related indications are perceived to be an attractive area for investment due to:
Their ability to be truly transformative relative to existing treatments (and with an improvement in health benefits over existing therapies, market access and reimbursement are more likely)
The relatively small number of patients required for clinical trials (reducing the cost and time of research and development)
Their suitability for novel regulatory routes of licensing such as the European Medicine Agency’s adaptive licensing pilot (increasing the profile of the company and thus its product at an early stage of development)
Secondly, investors within the sector are seen, to a certain extent, to exhibit a “pack mentality”, where a select group of investors invest in a number of similar technologies and platforms. The collective interest of several investors in certain therapeutic areas can lead to an increase in confidence towards that particular area and divert attention from other areas which may also be worth exploring.
“Orphan diseases, in particular those for oncology-related conditions, receive a lot of attention and investment. The low patient numbers and short duration of clinical development pathways mean that cost and timescales are relatively short.”
UK industry organisation
“There are certain therapeutic areas in the Spanish biotechnology sector that receive a lot more financing from investors. This is partly due to the fact that the small number of VCs which invest in Spanish biotech tend to syndicate and invest together.”
General Partner, Spanish venture fund
“There is absolutely a herd mentality in the market…the same small group of investors are co-investing in a number of select technologies. It’s a little bit ridiculous as there are lots of smart people doing smart science in other areas which are worth exploring”
CEO, late-stage UK Biotech
31 This refers to investments made into a company with a particular area of therapeutic focus, rather than investments into a particular product.

53
Note: 1. Analysis is based on publically available information on funding received by early/late-stage SMEs over the period 2011–2016 via all funding types, excluding funding received by commercialisation offices, universities and institutions; 2. Therapeutic coverage refers to an analysis of funding provided per company and its primary therapeutic area of focus; 3. Immun. = Immunomodulators.
Source: Analysis of investment activity from Preqin; MarketIQ; Crunchbase; CBInsights; Medtrack; government, charity and company websites.
Exhibit 25. Total investment received by companies segmented by company’s main therapeutic area, number of companies and average deal size (2011–2016). Note, size of bubble represents total six-year deal size
Company main therapeutic area
Total investment(EUR M)
No.companies
Oncology & Immun. 10803 57 Various 2524 9 Respiratory 1572 12 Musculoskeletal 1319 6 Central Nervous System 1132 7
Systemic Anti-infectives 234 15
Cardiovascular 216 5 Gastro-Intestinal 98 3 Sensory Organs 90 3 Blood 43 3 Endocrine 43 1 Dermatology 23 3 Genito-Urinary 5 1 Total 18102 1250
5
10
15
20
25
30
35
40
45
50
55
60
65
70
0 50 100 150 200 250 300
Various
Systemic Anti-infectives
Sensory Organs
Respiratory
Oncology & Immunomodulators
Tota
l Num
ber o
f Com
pani
es (E
UR
M)
MusculoskeletalGenito-Urinary
Gastro-IntestinalEndocrineDermatology
Central Nervous SystemCardiovascular
Blood
Average Deal Size (EUR M)
Area of bubble = total six year deal size (EUR M)

54
Impact of investment focus on select therapeutic areas on life science SMEs:
Life science companies working on innovative R&D in certain therapeutic areas may face a bigger financing challenge than those working in others. In instances where under-served areas coincide with areas of high unmet medical need, additional incentives may be necessary to foster innovation.
For example, the World Health Organisation (WHO) has recognised that there are a number of therapeutic areas where financing is insufficient or more effective treatments are required. These areas include anti-infectives to combat antimicrobial resistance, sensory organs (hearing loss) and cardiovascular (ischaemic heart disease) treatments.
In addition, dementia is another good example of incentives being deployed to drive innovative R&D. With an undefined commercial model that does not incentivise R&D, investment into companies developing products for dementia is currently limited due to a poor track record and a lack of financial rewards. However, new financing models such as the Dementia Discovery Fund have emerged, demonstrating that innovative financing can play a key role in tackling such market failures, not least by mitigating investor risk, see Exhibit 26 below for further details.
Source: Dementia Discovery Fund Press Releases.
Exhibit 26. Dementia discovery fund case study (example of an innovative financing model that has been used to tackle a market failure)
Dementia Discovery Fund (DDF)United Kingdom based with global reach
Context:• Dementia is one of the biggest healthcare challenges in the world, affecting 850,000 people in the UK and 47 million
people worldwide. No drugs are currently available to arrest its course despite the increasing incidence in aging western societies.
Public sector intervention: • Led by the UK Government, the Dementia Discovery Fund (DDF) was launched in October 2015 to accelerated the
R&D of new treatments for dementia• The DDF is a global partnership with Alzheimer’s Research UK and 6 pharmaceutical companies (Biogen, GSK,
Johnson & Johnson, Lilly, Pfizer and Takeda)• The DDF received an initial investment of $100M to invest in promising therapies• SV Life Sciences was appointed as the Fund Manager for the DDF
Impact:• DDF has invested in two companies to date:
− Alector LLC, California, US (January 2016)− Gen2 Neuroscience Ltd, Cambridge, UK (June 2016)
• The DDF also acquired a >500K compound CNS-based small molecule library in Febuary 2017. This small molecule library will be used to kick-start additional dementia drug discovery programmes
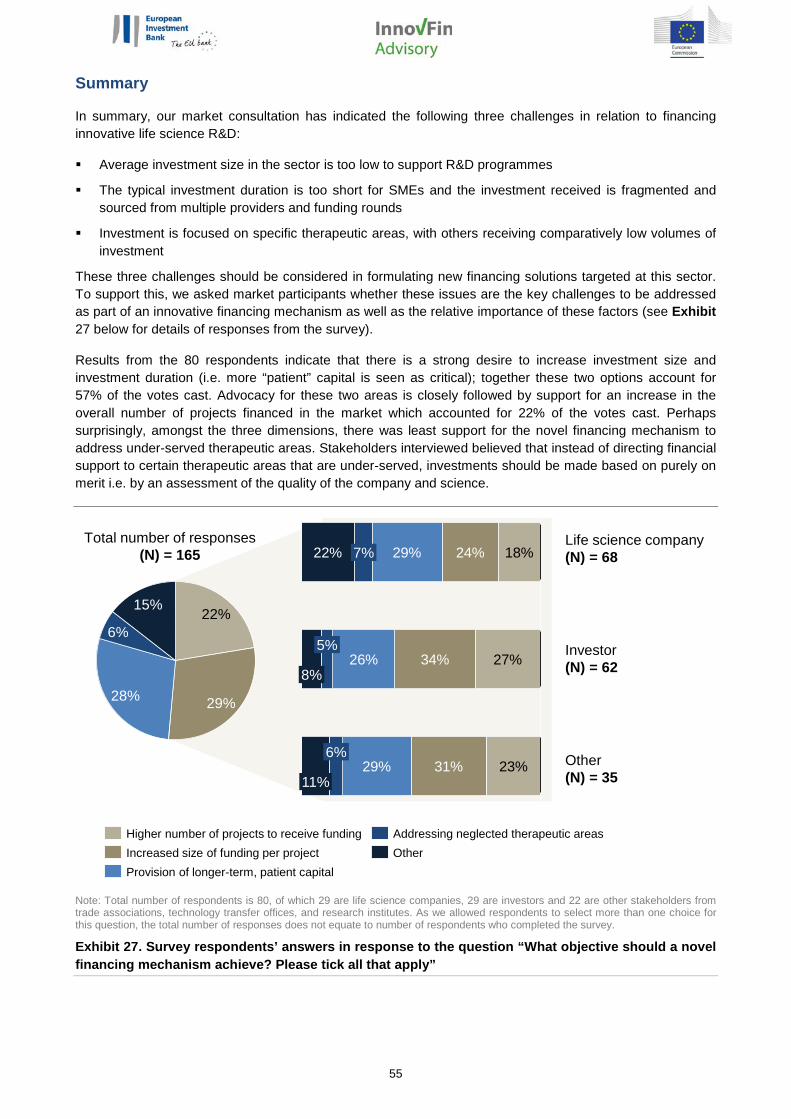
55
Summary
In summary, our market consultation has indicated the following three challenges in relation to financing innovative life science R&D:
Average investment size in the sector is too low to support R&D programmes
The typical investment duration is too short for SMEs and the investment received is fragmented and sourced from multiple providers and funding rounds
Investment is focused on specific therapeutic areas, with others receiving comparatively low volumes of investment
These three challenges should be considered in formulating new financing solutions targeted at this sector. To support this, we asked market participants whether these issues are the key challenges to be addressed as part of an innovative financing mechanism as well as the relative importance of these factors (see Exhibit 27 below for details of responses from the survey).
Results from the 80 respondents indicate that there is a strong desire to increase investment size and investment duration (i.e. more “patient” capital is seen as critical); together these two options account for 57% of the votes cast. Advocacy for these two areas is closely followed by support for an increase in the overall number of projects financed in the market which accounted for 22% of the votes cast. Perhaps surprisingly, amongst the three dimensions, there was least support for the novel financing mechanism to address under-served therapeutic areas. Stakeholders interviewed believed that instead of directing financial support to certain therapeutic areas that are under-served, investments should be made based on purely on merit i.e. by an assessment of the quality of the company and science.
Note: Total number of respondents is 80, of which 29 are life science companies, 29 are investors and 22 are other stakeholders from trade associations, technology transfer offices, and research institutes. As we allowed respondents to select more than one choice for this question, the total number of responses does not equate to number of respondents who completed the survey.
Exhibit 27. Survey respondents’ answers in response to the question “What objective should a novel financing mechanism achieve? Please tick all that apply”
18%
27%
23%
24%
34%
31%
29%
26%
29%
22% 7%
8%
11%
6%
5%6%
29%
22%
28%
15%
OtherProvision of longer-term, patient capital
Higher number of projects to receive fundingIncreased size of funding per project
Addressing neglected therapeutic areas
Total number of responses (N) = 165
Life science company (N) = 68
Investor (N) = 62
Other (N) = 35

56
5. THE EMERGENCE OF NOVEL FINANCING MECHANISMS AND THEIR ABILITY TO ADDRESS THE FINANCING CHALLENGE
Introduction
In addition to the major funding sources and instruments detailed in Section 3, there has also been a development in alternative and more innovative financing solutions. In this section we analyse and provide examples of new/emerging models which try to address the shortfalls of the existing financing instruments and therefore some of the challenges of the drug development cycle.
Some of these mechanisms – such as catalytic grants and evergreen equity – are adaptions of existing financing instruments with new conditions or terms tailored to better support life sciences R&D. Other developments – such as Funds of Funds models – are significantly different to the current financing options available in the market.
In terms of level of adoption, many of these models are currently not widely used to support European life sciences R&D whilst others are seeing some usage (see Exhibit 28 below for further details on the extent to which these novel financing instruments are currently used per bio-region). In all cases, however, there is evidence of greater willingness by investors to deploy these models.
Together, these new models show that investors have an appetite for innovation and are committed to being part of a collaborative solution to address the financing challenges in the current market.
Note: Analysis based on stakeholder interviews and analysis of investment activity 2011–2016
Exhibit 28. Current usage of novel financing instruments per bio-region
Catalytic/contingent grants
Catalytic grants are provided by public bodies on the condition that their funding is matched by private investment. In this respect, catalytic grants differ from many other grants offered by public sector and charitable institutions which award grants directly and independently to the recipient.
A prominent example of this type of grant is the UK’s Biomedical Catalyst which supports both companies and academic institutions with early-stage life sciences R&D and is generally regarded as very successful. Between 2012 and 2015, the Biomedical Catalyst awarded ca. GBP 130m of grants to support over 180 business-led projects in life sciences R&D; this was matched by a further ca. GBP 120m in private capital (see Exhibit 29 below for further details).
SE EnglandUK
BavariaDE
CataloniaES
Poland
Catalytic grants
Patient equity
Venture debt
Forgivable loans
Royalty financing
Fund of Funds
Key: 0 = rare / no usage, 1 = limited usage, 2 = some usage, 3 = common place 4 = extensive usage
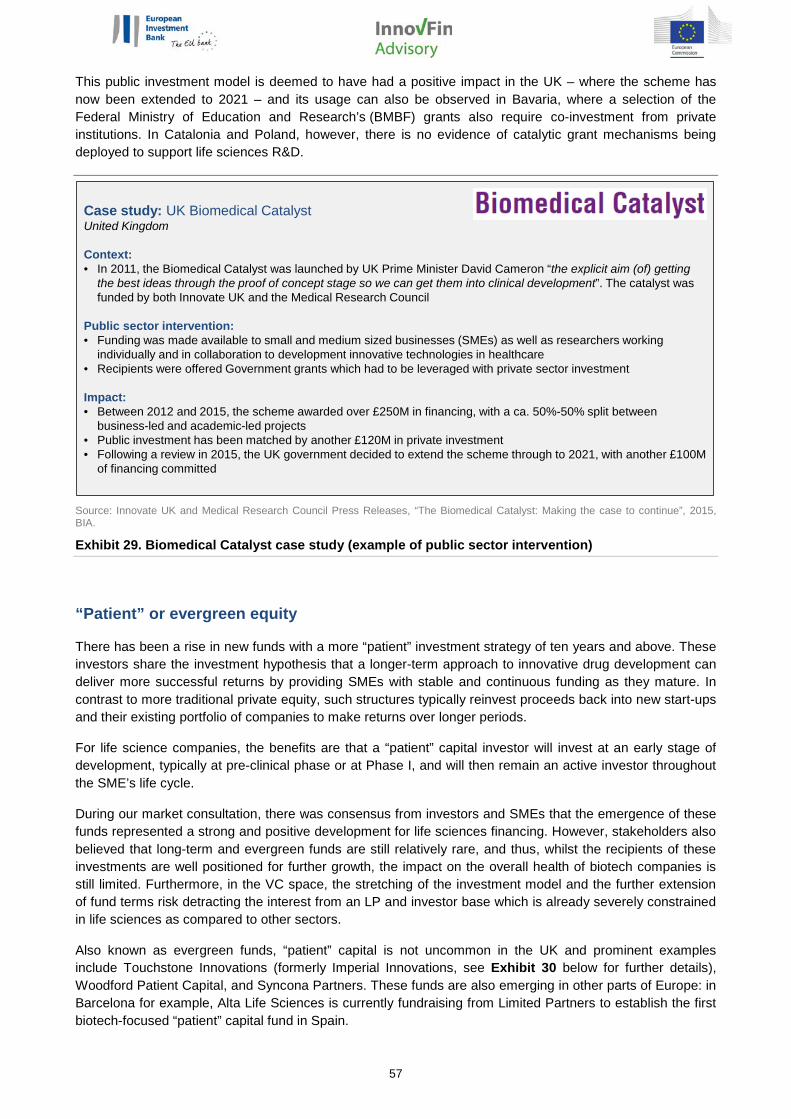
57
This public investment model is deemed to have had a positive impact in the UK – where the scheme has now been extended to 2021 – and its usage can also be observed in Bavaria, where a selection of the Federal Ministry of Education and Research’s (BMBF) grants also require co-investment from private institutions. In Catalonia and Poland, however, there is no evidence of catalytic grant mechanisms being deployed to support life sciences R&D.
Source: Innovate UK and Medical Research Council Press Releases, “The Biomedical Catalyst: Making the case to continue”, 2015, BIA.
Exhibit 29. Biomedical Catalyst case study (example of public sector intervention)
“Patient” or evergreen equity
There has been a rise in new funds with a more “patient” investment strategy of ten years and above. These investors share the investment hypothesis that a longer-term approach to innovative drug development can deliver more successful returns by providing SMEs with stable and continuous funding as they mature. In contrast to more traditional private equity, such structures typically reinvest proceeds back into new start-ups and their existing portfolio of companies to make returns over longer periods.
For life science companies, the benefits are that a “patient” capital investor will invest at an early stage of development, typically at pre-clinical phase or at Phase I, and will then remain an active investor throughout the SME’s life cycle.
During our market consultation, there was consensus from investors and SMEs that the emergence of these funds represented a strong and positive development for life sciences financing. However, stakeholders also believed that long-term and evergreen funds are still relatively rare, and thus, whilst the recipients of these investments are well positioned for further growth, the impact on the overall health of biotech companies is still limited. Furthermore, in the VC space, the stretching of the investment model and the further extension of fund terms risk detracting the interest from an LP and investor base which is already severely constrained in life sciences as compared to other sectors.
Also known as evergreen funds, “patient” capital is not uncommon in the UK and prominent examples include Touchstone Innovations (formerly Imperial Innovations, see Exhibit 30 below for further details), Woodford Patient Capital, and Syncona Partners. These funds are also emerging in other parts of Europe: in Barcelona for example, Alta Life Sciences is currently fundraising from Limited Partners to establish the first biotech-focused “patient” capital fund in Spain.
Case study: UK Biomedical CatalystUnited Kingdom
Context:• In 2011, the Biomedical Catalyst was launched by UK Prime Minister David Cameron “the explicit aim (of) getting
the best ideas through the proof of concept stage so we can get them into clinical development”. The catalyst was funded by both Innovate UK and the Medical Research Council
Public sector intervention: • Funding was made available to small and medium sized businesses (SMEs) as well as researchers working
individually and in collaboration to development innovative technologies in healthcare• Recipients were offered Government grants which had to be leveraged with private sector investment
Impact:• Between 2012 and 2015, the scheme awarded over £250M in financing, with a ca. 50%-50% split between
business-led and academic-led projects• Public investment has been matched by another £120M in private investment • Following a review in 2015, the UK government decided to extend the scheme through to 2021, with another £100M
of financing committed

58
“We believe that the traditional venture capital investment model does not work for Pharma and Biotech companies… our fund seeks to do something different by supporting companies right from the start and continuing to support them throughout their life.”
Founder, evergreen fund
Source: Touchstone Innovations 2016 Annual Report, Touchstone Innovations Press Releases.
Exhibit 30. Touchstone Innovations case study (example of successful “patient” capital fund)
There has also been an increase in innovative co-investment models for the provision of more “patient” equity. For example 2016 saw the birth of a number of such investment structures such as i) the UCL Technology Fund, a GBP 50m fund launched in January 2016 with commitments from the European Investment Fund (EIF) and Imperial Innovations, and the CRT Pioneer Fund; and ii) Apollo Therapeutics, a GBP 40m fund which represents a unique collaboration model between industry (AstraZeneca, GlaxoSmithKline and Johnson & Johnson Innovation) and the technology transfer offices of Imperial College London, University College London and the University of Cambridge.
Venture debt instruments
Biotech financing is still predominantly characterised by grant and equity-based products. However, in recent times, debt instruments have also gradually become available.
Venture debt is a means for commercial lenders to providing investees with an alternative source of capital which is typically less costly and/or dilutive compared to equity-based investments. Unlike traditional bank lending, venture debt is available to start-ups and growth companies that do not have positive cash flows or significant assets to use as collateral. Venture debt providers often combine their loans with warrants, or rights to purchase equity, to compensate for the higher risk of default and to be able to participate in the upside of the business.
This type of financing is still relatively novel across Europe, however, and SMEs appear to be apprehensive about taking on debt – and the obligation to repay this on what some deem to be costly terms – when equity based financing options are also available. From the investor’s perspective, we found that there is a much greater willingness to offer debt-based instruments when SMEs had already received two or more rounds of financing and were looking to complement their equity fundraising with loans.
Prominent providers of debt-based financing to SMEs are the Silicon Valley Bank (SVB) and Creos Capital. A US-based commercial bank, SVB, opened its first European branch in London in 2012 and offers a range of debt and structured finance products to life science companies in the GBP 2m − GBP 100m range. An analysis of SVB’s recent investments shows that within Europe, funding is focused towards UK-based companies, with limited evidence of investments for SMEs in other geographical areas (see Exhibit 31 below for further details).
Case study: Touchstone Innovations Plc (formerly Imperial Innovations)London, United Kingdom
Fund size and investment focus: • Invests in commercialisation of research from the UK’s Golden Triangle region (Cambridge, London, Oxford)• Provides long-term equity financing across the development spectrum, from start-up through to commercialisation• In FY2016, the fund invested £70M across 33 companies and has a further £198M available for investment
Notable investment(s):• Circassia Plc – Touchstone has been an investor in this late-stage, listed biotech since its inception in 2006.
Circassia listed on the London Stock Exchange in 2014 and raised £200M, the largest ever UK biotech flotation• Other notable investments include Cell Medica (mid-stage biotech), PsiOxus Therapeutics (mid-stage biotech),
Mission Therapeutics

59
The European Investment Bank, via the European Fund for Strategic Investments (EFSI) and InnovFin programmes, also offers a venture debt-type instrument for high-growth SMEs and mid-cap companies, including in the life sciences sector.
Source: Silicon Valley Bank Q4 Corporate Overview and Financial Results, Silicon Valley Bank Press Releases.
Exhibit 31. Silicon Valley Bank case study (example of venture debt institution)
Soft/forgivable debt instruments
European public sector institutions are also offering debt financing to life science SMEs. In Spain, soft loans with favourable terms are currently available to SMEs through ENISA (a public company funded by the Ministry of Industry, Energy & Tourism, now under the umbrella of the Ministry of Economy, Industry & Competitiveness) and the Centre for the Development of Industrial Technology (CDTI). Furthermore, ENISA also runs a EUR 40m co-investment fund that provides loans from EUR 0.1 – 1m to promising SMEs in tandem with specialised investors which are willing to match the loan with equity investments. In France, BPI France provides interest-free loans to support R&D projects and innovation.
Another prominent provider of soft debt instruments is the Gates Foundation which uses so-called programme-related investments (PRIs, i.e. loans, equity stakes, and guarantees) to complement its traditional grant provision. Its PRIs have allowed the foundation to reach beyond the non-profit sector to draw on the talent, expertise, and innovations offered by the private sector to advance its mission.
The EIB Group also provides such financing instruments to the innovative life sciences sector. A prominent example is the Infectious Disease Financing Facility, a risk-sharing arrangement between the EIB and the European Commission launched in 2015, which provides debt financing of up to EUR 75m to innovative life science companies developing vaccines, drugs, medical and diagnostic devices, and research infrastructure for combatting infectious diseases. This is offered on a “forgivable” basis whereby companies which do not meet certain success criteria are not obligated to pay back the loan value.
Royalty financing models
There has been a rise in alternative investment companies that aim to bridge the biotech funding gap by purchasing economic interests in drug royalty streams worldwide. The purchase of such late-stage assets allows universities and biopharma companies to monetise their intellectual property whilst preserving company ownership, creating greater financial flexibility for innovators while giving investors an opportunity to participate in the life sciences industry at lower risk32. By combining these ownership interests into a single portfolio, these vehicles are able to provide more attractive risk-reward profiles for their investors and can issue debt to finance their acquisitions. From an investor’s perspective this model also makes it possible to finance a single promising product rather than the company’s entire portfolio.
32 “New Financing Methods in the Biopharma industry: A Case Study of Royalty Pharma, Inc.”, Andrew W. Lo and Sourya V. Naraharisettib, Journal of Investment Management, Vol. 12, No. 1, (2014), pp. 4–19.
Case study: Silicon Valley BankSanta Clara, California, United States (additional offices in Europe, China and Israel)
Fund size and investment focus: • Invests across the technology, life sciences and healthcare sectors• Offers debt financing to start-ups as well as more established companies• As of Dec 31st 2016, SVB had issued loans with a gross value of $20BN of which ca. $2BN was provided to life
sciences & healthcare companies
Notable investment(s):• US: Axome Therapeutics ($20M loan, 2016) Essa Pharma ($10M loan, 2016), aTyr Pharma ($10M loan, 2013)• UK: Oxford Biotherapeutics ($10M loan, 2015), Atopic Therapeutics ($4M loan, 2015)

60
The largest of these late-stage-focused investment companies is New York-based Royalty Pharma. Founded in 1996, Royalty Pharma has invested over USD 9.5bn in biopharmaceutical royalties in the last five years. Since 2003, it has raised and refinanced over USD 20bn of debt based on its relatively stable cash flows derived from its portfolio of royalties on approved drugs. As it has a significant track record of over 20 years and a portfolio of some 50 products valued at over USD 15bn, Royalty Pharma has been able to access the debt markets in a way that newer entities with less established portfolios would struggle to achieve. The debt is segmented into two parts, the larger short-term component targeted at commercial banks and the smaller longer-term component at institutional investors. Over time, this has resulted in a situation where as much as approximately 40% of Royalty Pharma’s capital structure is made up of debt (see Exhibit 32 below for further details).
At present there are few royalty financing providers and these investors have historically only invested in (close-to) marketed products. In supporting SMEs with no marketed products, we have found no evidence of this model being adopted in any of our bio-regions of investigation. However, as a recent positive development, our market consultation revealed that some royalty financing providers are considering investments in late-stage R&D assets and have already established contact with other investors to collaboratively target these opportunities in Europe.
Source: Royalty Pharma Press Releases.
Exhibit 32. Royalty Pharma case study (example of successful royalty financing provider)
Aggregated investment structures, e.g. Fund of Funds
An aggregated investment structure pools capital at scale and seeks to invest in a large portfolio of companies with varying risk-reward profiles. In theory, the large and diversified portfolio of investments reduces overall risk and increases the opportunity to attract additional financing from new investors. For life science companies, this could mean greater availability of financing in the sector.
The concept of an aggregated and securitised fund structure has been proposed by MIT-Sloan as a “Biomedical Megafund”. Professor Andrew W. Lo’s academic research in this area has suggested the creation of a series of “mega-funds” of up to USD 30bn, financed by securitised debt and equity. The theory suggests that despite the high failure rate in the life sciences sector, sufficient scale and diversification could reduce investor risk and yield nominal returns broadly in line with average equity and debt returns in other sectors.
In practice, there are some models of aggregated funds emerging though these tend to be either in their early days of establishment, or have been developed on a smaller scale than the academic proposals.
An example of such an aggregated structure is the global Coalition for Epidemic Preparedness Innovations (CEPI). As a partnership led by the German, Japanese and Norwegian governments as well as two of the world’s largest charitable foundations, the fund aims to invest in a portfolio of companies and assets to
Case study: Royalty Pharma New York, United States
Investment focus: • Acquires revenue producing intellectual property – principally, royalty interests in marketed and late stage
development biopharmaceutical products• Royalty Pharma does not discover, develop, manufacture or market products. Instead, the Company provides
liquidity to royalty owners and assumes the future risks and rewards of ownership• Royalty Pharma has been working with research institutions, inventors and biotechnology & pharmaceutical
companies since 1996, and now owns royalty interests in forty four approved and marketed biopharmaceutical products and seven products in clinical trials and/or under review with the United States Food and Drug Administration (“FDA”) and/or the European Medicines Agency ("EMA”)
• Total fund size is unknown but Royalty Pharma’s investments typically range from $100M - $3BN
Notable investment(s):• Cystic Fibrosis Foundation Therapeutics ($3.3BN cash payment, 2014)

61
accelerate drug development in infectious diseases and stimulate additional long-term investment to build a sustainable model for innovative R&D (see Exhibit 33 below for further details).
Another prominent example is the USD 470m oncology fund launched in April 2016 by the bank UBS to invest in a portfolio of early-stage cancer treatments. This fund will use part of the performance fee and royalties generated from the sale of drugs to help fund cancer care for children in the developing world as well as academic research.
Such large funds, the theory goes, could lend themselves to securitisation (e.g. selling their related cash flows to third party investors as securities, or collateralised debt obligations (CDOs)); securitisation, or debt issuance more generally, would enable the investor to access lower cost finance. This benefit could be passed on to investee companies in the form of more attractive terms than those currently available in the sector.
Another example, though not specifically focused on life sciences as such, is the European Investment Fund’s recently launched Pan-European Venture Capital Fund(s)-of-Funds programme33. Sponsored by the European Union, the programme aims to address Europe’s equity gap and the fragmentation of the venture capital market, and to attract additional private funding from institutional investors into the EU venture capital asset class. The EIF will provide an aggregate target amount of up to 25% of the Fund’s total commitments, within a limit of EUR 300m, and is open to supporting EU-based enterprises across multiple sectors/industries.
Source: CEPI Press Releases, CEPI Preliminary Business Plan.
Exhibit 33. CEPI case study (example of Fund of Funds proposal)
33 http://www.eif.org/what_we_do/equity/paneuropean_venture_capital_fund_of_funds/index.htm
Case study: Coalition for Epidemic Preparedness InnovationsGlobal public-private coalition
CEPI is a partnership of public, private, philanthropic and civil organisations to stimulate, finance and co-ordinate vaccine development against priority threats, particularly when development is unlikely to occur through market incentives alone.
Fund size and investment focus: • Invests in vaccines development against infectious diseases. CEPI will pursue a proactive (“just-in-case”) and
accelerated (“just-in-time”) vaccine development strategy for epidemic threats by:- Moving vaccine candidates through late preclinical studies to proof of concept and safety in humans before epidemics begin, so that larger effectiveness trials can begin swiftly in an outbreak and small stockpiles are ready for potential emergency use;- Building technical platforms and institutional capacities that can be rapidly deployed against new and unknown pathogens.
• The Coalition’s target is to advance 4-6 vaccine candidates to Proof of Concept in 5 years• CEPI was launched in January 2017 with an initial fund size of $460M from the governments of Germany, Japan
and Norway, as well as the Bill & Melinda Gates Foundation and the Wellcome Trust
Notable investment(s):• CEPI recently had its first call for proposals for drug candidates against Middle East respiratory syndrome
coronavirus (MERS), Lassa fever and Nipah virus.

62
Please see below an inset summarising the advantages and limitations of each financing instrument.
Advantages Limitations Examples
Catalytic grants
Public sector financing can be leveraged to draw in private investment in priority sectors or industries
The grant provider does not participate in the potential upside
UK Biomedical Catalyst Germany BMBF grants
(some schemes)
Patient or evergreen equity
Investment duration is adapted to the long lead times associated with drug R&D
Potentially offers better returns to investors as longer-term investments could deliver more successful companies
Well capitalised institutional investors with a willingness to invest long-term in European life sciences VC are required; this is currently limited
Woodford Patient Capital
Touchstone Innovations Arix Biosciences
Venture debt
Provides SMEs with an alternative to equity financing which is less costly and allows the company to retain control
Offers investors a balanced risk-reward profile when the debt is offered in conjunction with equity
Lack of understanding of the instrument by potential beneficiaries
Repayment is seen to be a burden for European SMEs with many favouring equity or grants where they are available
Silicon Valley Bank Creos Capital (food
industry focused) EIB
Soft / forgivable grants
As an alternative to grants, provides investment in priority sectors or industries whilst keeping open the possibility of generating a return for the provider
High-risk instrument that few investors can implement
Spanish national government soft loans
EIB’s Infectious Disease Financing Facility
Royalty financing
Allows the life science company to retain control and obligation for repayment is not immediate
Investors are able to support a particular product rather than the entire company’s portfolio
More suited to close-to-market products; investors have not yet used this model to support high-risk clinical development compounds
Royalty Pharma
Aggregated structures
Highly diversified portfolio reduces risk
Could attract further investment from new institutional investors
Increasing complexity in execution including limited control over fund allocation for the Fund of Funds manager
Requires proof of principle over a number of years before additional investors are likely to join
EIF’s Pan European Venture Capital Fund of Funds
Coalition for Epidemic Preparedness Innovations

63
Summary
The life sciences market is currently characterised by a situation where the nature and scale of funding requirements exceeds the capacity of specialist funds and/or investors, leading to material funding gaps. However, within this context there has been a change in funding trends in the sector over the last few years as outlined earlier, and the interviews conducted indicate that these positive market developments appear likely to continue going forward.
Taken together, the emerging financing instruments considered here indicate that the sector is at an important inflection point.
The limitations associated with the usage of traditional financing instruments in the market – grants, venture capital and public markets – is counteracted with emerging positive developments, such as more “patient” capital being deployed and more diverse financing products being offered. In particular:
Patient/evergreen equity: there has been a rise in new funds or new investment/collaboration models with a more patient investment strategy.
Debt instruments: if the current and past investment landscape has been predominantly characterised by grant and equity, in recent times a greater variety of funding products has gradually become available, including soft debt instruments and venture debt. However, uptake of such products in Europe has been significantly lower overall than the US. Though systemic barriers such as insolvency rules mean life science entrepreneurs are comparatively more conservative in capital structuring compared to the US, greater market awareness of the availability and terms of such products could help increase demand, particularly for later-stage companies with greater capacity to offer collateral;
Royalty financing: there has been a rise of alternative investment companies that aim to bridge the biopharma funding gap by purchasing economic interests in drug royalty streams worldwide. The purchase of such assets allows universities and biopharma companies to monetise their intellectual property, creating greater financial flexibility for them while giving investors an opportunity to participate in the life sciences industry at lower risk.
Aggregated investment structures, e.g. Fund of Funds: which pool capital at scale and seek to invest in a large portfolio of companies with varying risk-reward profiles.
These emerging and more innovative financing instruments have the potential to address the financing challenge for life sciences innovation, though their impact is limited by the current low rates of adoption in Europe.
European institutions including the European Commission and the European Investment Bank have an opportunity to play a role in driving these positive developments, taking into consideration the advantages and limitations of each instrument (see previous page for further details), to deliver a distinctive advantage for the innovative life science industry in Europe.

64
6. THE OPPORTUNITY AND NEED FOR A PUBLIC INTERVENTION
Introduction
The previous sections of this report have outlined the estimated financing gap in each bio-region and defined the investor and investee perspective on the financing challenge.
Our market consultation has consistently shown that there is a material and pervasive financing challenge in the innovative life sciences sector. In addition to our financial analysis, a survey targeted at SMEs, investors, and other stakeholders found that 74% of respondents (n=77) believe that it is “difficult” or “very difficult” for life science companies to receive financing. See Exhibit 34 below for details of the responses from the survey.
Note: Total number of responses is 94, gathered from 29 life science companies, 29 investors and 20 other stakeholders including trade associations, technology transfer offices, research institutes. “Investors” and “other stakeholders” represent more than one geography in some instances while their responses are included for all relevant geographies.
Exhibit 34. SME, investor, and other stakeholders’ responses to the question “How difficult is it for life science companies to obtain financing in your region?”
Total number of responses
(N) = 94
19%13%22%
19%
25%
67%
67%63%
61%
17%6% 8%
6%6%
36
Germany Spain Poland
1624
4%
18
UK
Easy Neutral DifficultVery difficult
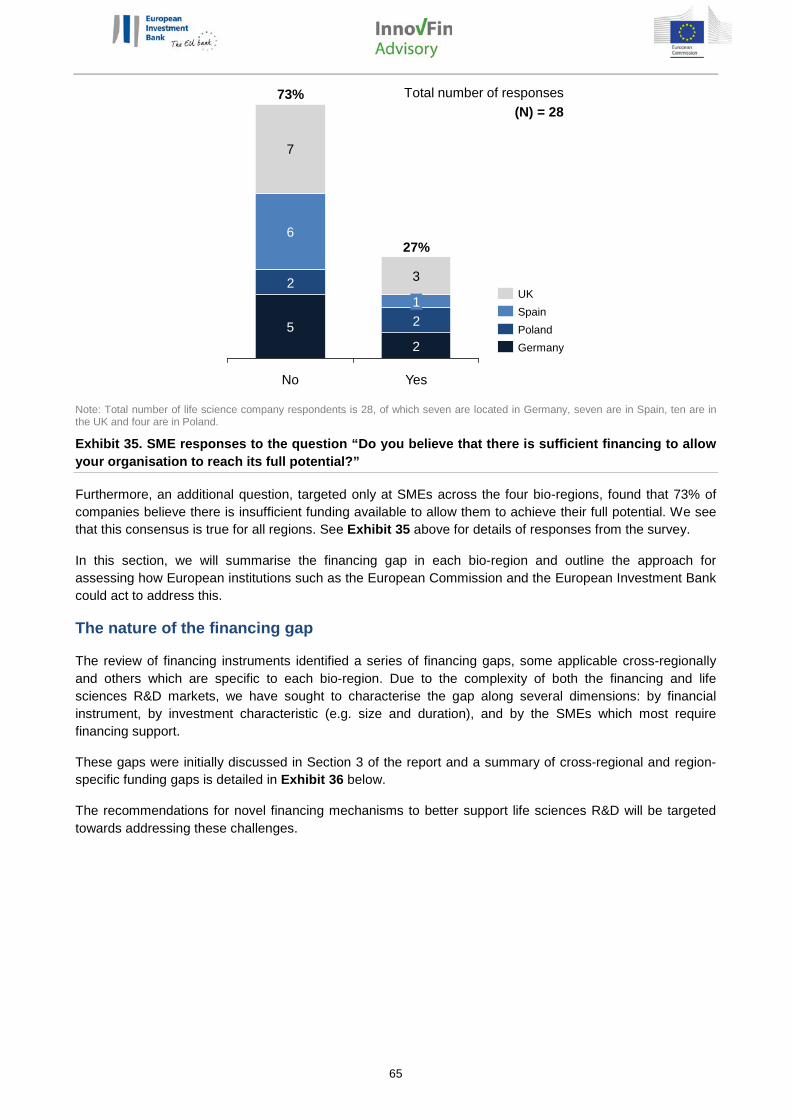
65
Note: Total number of life science company respondents is 28, of which seven are located in Germany, seven are in Spain, ten are in the UK and four are in Poland.
Exhibit 35. SME responses to the question “Do you believe that there is sufficient financing to allow your organisation to reach its full potential?”
Furthermore, an additional question, targeted only at SMEs across the four bio-regions, found that 73% of companies believe there is insufficient funding available to allow them to achieve their full potential. We see that this consensus is true for all regions. See Exhibit 35 above for details of responses from the survey.
In this section, we will summarise the financing gap in each bio-region and outline the approach for assessing how European institutions such as the European Commission and the European Investment Bank could act to address this.
The nature of the financing gap
The review of financing instruments identified a series of financing gaps, some applicable cross-regionally and others which are specific to each bio-region. Due to the complexity of both the financing and life sciences R&D markets, we have sought to characterise the gap along several dimensions: by financial instrument, by investment characteristic (e.g. size and duration), and by the SMEs which most require financing support.
These gaps were initially discussed in Section 3 of the report and a summary of cross-regional and region-specific funding gaps is detailed in Exhibit 36 below.
The recommendations for novel financing mechanisms to better support life sciences R&D will be targeted towards addressing these challenges.
52
7
3
6
Yes
27%
21
No
73%
2
GermanyPolandSpainUK
Total number of responses (N) = 28
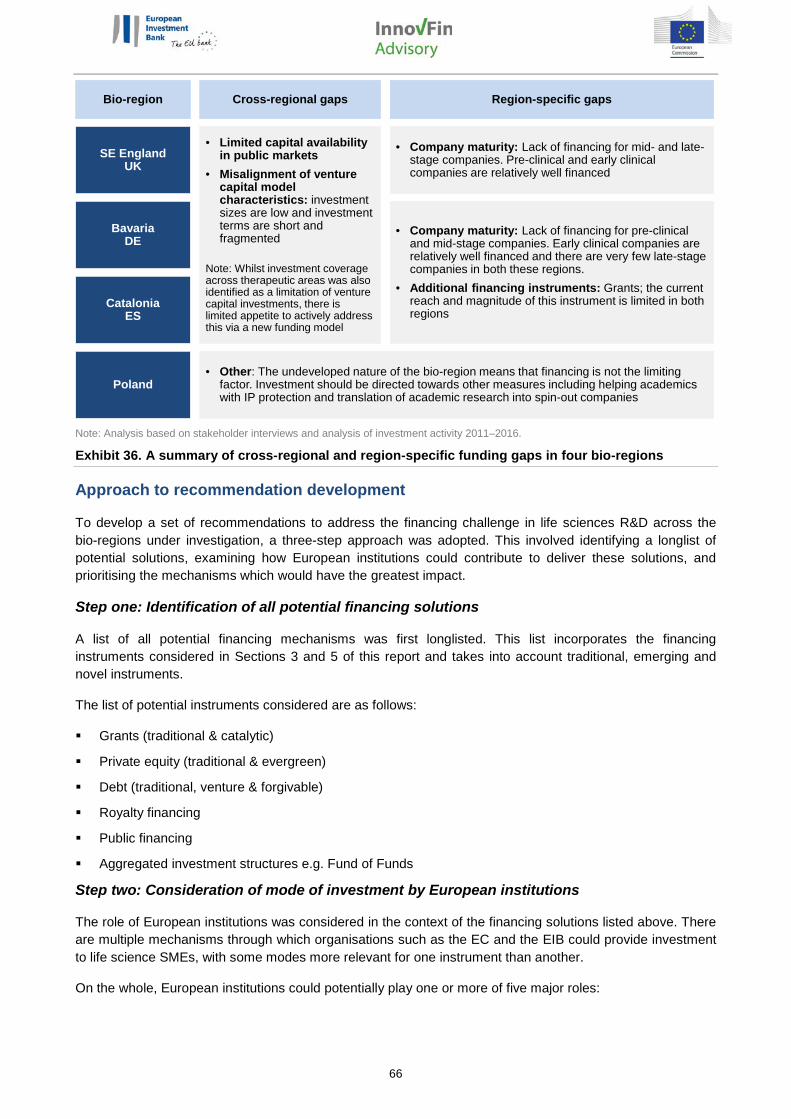
66
Note: Analysis based on stakeholder interviews and analysis of investment activity 2011–2016.
Exhibit 36. A summary of cross-regional and region-specific funding gaps in four bio-regions
Approach to recommendation development
To develop a set of recommendations to address the financing challenge in life sciences R&D across the bio-regions under investigation, a three-step approach was adopted. This involved identifying a longlist of potential solutions, examining how European institutions could contribute to deliver these solutions, and prioritising the mechanisms which would have the greatest impact.
Step one: Identification of all potential financing solutions
A list of all potential financing mechanisms was first longlisted. This list incorporates the financing instruments considered in Sections 3 and 5 of this report and takes into account traditional, emerging and novel instruments.
The list of potential instruments considered are as follows:
Grants (traditional & catalytic)
Private equity (traditional & evergreen)
Debt (traditional, venture & forgivable)
Royalty financing
Public financing
Aggregated investment structures e.g. Fund of Funds
Step two: Consideration of mode of investment by European institutions
The role of European institutions was considered in the context of the financing solutions listed above. There are multiple mechanisms through which organisations such as the EC and the EIB could provide investment to life science SMEs, with some modes more relevant for one instrument than another.
On the whole, European institutions could potentially play one or more of five major roles:
Bio-region Cross-regional gaps
SE EnglandUK
• Limited capital availability in public markets
• Misalignment of venture capital model characteristics: investment sizes are low and investment terms are short and fragmented
Note: Whilst investment coverage across therapeutic areas was also identified as a limitation of venture capital investments, there is limited appetite to actively address this via a new funding model
BavariaDE
CataloniaES
Poland
Region-specific gaps
• Company maturity: Lack of financing for mid- and late-stage companies. Pre-clinical and early clinical companies are relatively well financed
• Company maturity: Lack of financing for pre-clinical and mid-stage companies. Early clinical companies are relatively well financed and there are very few late-stage companies in both these regions.
• Additional financing instruments: Grants; the current reach and magnitude of this instrument is limited in both regions
• Other: The undeveloped nature of the bio-region means that financing is not the limiting factor. Investment should be directed towards other measures including helping academics with IP protection and translation of academic research into spin-out companies
67
1. As a direct investor into life science SMEs
European institutions could increase their direct investment to life science companies. The EC already offers a number of grants to both academia and companies across a wide range of disciplines. In addition, the EIB programmes also allow direct investments to innovative companies via debt-based instruments.
2. As a co-investor in the life science SMEs
European institutions could co-invest with another institution in life science companies. A relevant model is the EIF’s co-investment initiative with business angels, the European Angels Fund, which provides financing to match the investments made by angel investors (while delegating the investment decision to them). A co-investment approach could also be applied to the royalty financing model, where both a private royalty provider and the EIB could co-offer debt to a life science SME.
3. As an investor into existing funds/entities, with particular focus on “patient” capital investments
European institutions could increase co-investment into existing funds, particularly those targeting patient investments, recognising the benefit that commitments to the likes of Woodford Investments and Imperial Innovations (now Touchstone Innovations) have had in leveraging in other institutional investors.
4. As a facilitator and funder of a Fund of Funds (FoF) or other aggregated portfolio structure
European institutions could contribute towards an aggregated structure to address the underfunding in the life-sciences sector. A “Fund of Funds” (FoF) could represent a relevant model. At a high level, such a structure would need to be significantly larger than the ca. EUR 60m34-sized funds that characterise a typical European venture fund, and European bodies could directly contribute by committing a portion of this capital. With committed capital at a scale comparable to/higher than the likes of Woodford Patient Capital Trust (GBP 800m), the FoF could invest in many more opportunities (e.g., across multiple product maturities) and take larger ticket sizes (e.g., follow investments as they mature and require more capital) than the average sector fund. Such portfolio diversification would reduce investor risk, making the FoF an attractive investment proposition for both existing and new investors (e.g. institutional investors such as pension funds).
5. As a market maker in the public capital markets
European institutions could explore opportunities to facilitate greater access to public capital markets for biotech firms, for example through the creation of a single European hub similar to the New York Stock Exchange. In the US, the NASDAQ Biotech Index lists more established companies, with the Russell 2000 Biotech Index listing younger, less-established small-cap biotech groups. Both have a significant proportion of international companies which have chosen to list in the US due to the deeper pool of capital available.
For each of the potential instruments listed in Step One, the means through which European institutions could make their investments were considered and mapped to one of the options listed above. It is recognised that there may be multiple modes of deployment available for some instruments. For example, European institutions could co-invest in SME with existing evergreen private equity players or they could also invest solely at a fund level, acting as a Limited Partner in the fund. In these instances, all levels of engagement were considered and the most promising option was highlighted. A summary of the outcome of this assessment is detailed in Exhibit 37 below.
34 Source: European Commission Research and Innovation News Alert, released 8 November 2016.

68
Note: 1. Includes Funds of Funds and Royalty Financing models; analysis based on stakeholder interviews, survey and analysis of investment activity 2011–2016.
Exhibit 37. Funding instruments and the most suitable mode through which European institutions could contribute
Step three: Assessment of each financing solution against their impact and ease of implementation
Combining Steps One and Two generates a particular financing instrument and its mode of deployment by a European institution. These potential solutions were subsequently mapped onto an ease and effect matrix for the purposes of prioritisation.
In plotting each potential solution along this matrix, the following definitions were used for “ease of implementation” and “impact”:
Ease of implementation, defined as the additional effort required to implement this solution across Europe against the baseline of current levels of adoption in the target sector and geographical area
Impact, defined as the ability of the solution to address current gaps in the market, a view developed on the basis of data analysis, interviews and surveys
See Exhibit 38 below for the results of the ease and effect assessment.
Traditional Grants
CatalyticGrants
Traditional Private Equity
Evergreen Private Equity
Traditional Debt
Venture Debt
Forgivable Debt
Royalty Financing
Public Financing
Fund of Funds
Direct SME investment Co-Investment
Investments into existing / new
fund structures1
Public market facilitator
Inno
vativ
eTr
aditi
onal
Key: Most suitable means for EIB / EIF / EC intervention

69
Note: Analysis based on stakeholder interviews, investment activity 2011–2016 and forecasted demand 2016 - 2021.
Exhibit 38. Ease and effect matrix comparing financing instruments applicable to the life science R&D landscape.
Two priority sets of recommendations have been identified as a result of this matrix.
The first region, circled 1, contains a set of instruments which would require a relatively low level of implementation effort to achieve a relatively high level of impact. These solutions form the basis of our short-term recommendations:
The second region, circled 2, contains a set of instruments which would require a relatively high level of implementation effort and yet could also achieve a very high level of impact. These solutions form the basis of our long term recommendations:
Finally, in markets such as Poland where the underdeveloped nature of innovative life science R&D is limited by a holistic set of factors other than simply financing, a range of solutions should be considered with the national government.
Private Equity (Evergreen)
Royalty Financing
Debt (Forgivable)
HigherImpact
LowerImpact
Fund of Funds
Implementation effort from EIB / EC
Impa
ct (a
bilit
y to
add
ress
mar
ket
chal
leng
es)
More difficult to implement
Grant based Debt based Equity based Other / MixtureKey:
Public Financing
Easier to implement
Private Equity (Traditional)
Grants (Traditional)
Grants (Catalytic)
Debt (Venture)
2
1
Recommendation 1: Provide catalytic grants for company-led R&D projects Recommendation 2: Increase the quantum of risk capital for the sector, targeting in particular “patient” capital investments Recommendation 3: Strengthen the capabilities of European late-stage life sciences investors (including venture debt investors)
Recommendation 4: Establish a new life sciences financing mechanism addressing both financing and therapeutic gaps Recommendation 5: Provide input to the European Commission’s Capital Markets Union initiative and work towards the establishment of a more unified and better capitalised public market for life sciences R&D
Recommendation 6: Strengthen the underlying market for life science R&D through a series of initiatives developed in collaboration with national governments
70
7. RECOMMENDATIONS Short- term financial recommendations
Recommendation 1: Provide catalytic grants for company-led R&D projects in addition to the grants on offer via Horizon 2020
The European Commission currently provides a series of grants to innovative SMEs and research institutions through its Horizon 2020 programme. This is a platform that could be used or tailored to offer catalytic grants to support company-led drug development programmes.
Catalytic grants are a solution that allows public sector funding to be deployed to attract private investment. This option has been used in the South East of England with the Biomedical Catalyst and, to a lesser extent, with the GoBio programme in Germany. The nature of the product would allow SMEs to obtain larger ticket sizes than they would via direct grants, and also enables the recipient to build an early relationship with private investors, paving the way for subsequent follow-on financing.
This mechanism could be especially effective in supporting early-stage life science companies, and is particularly applicable in bio-regions such as Bavaria and Catalonia where there is a shortage of financing for SMEs conducting pre-clinical studies.
Potential characteristics of a new catalytic grant programme
Geographical scope: All European markets as long as applicants meet other eligibility criteria. Such an intervention would be most suitable in supporting pre-clinical and early-stage clinical development programmes/early-stage companies and therefore relevant for all European bio-regions.
Ticket size: EUR 2m+ per successful applicant, on the condition that this is matched by private sector investment. Combined; the EUR 4m+ of financing would provide the recipient with a significant portion of the estimated average cost of EUR 5.5m for a pre-clinical study.
Investment duration: The total value of the grant could be made accessible to SMEs up front, enabling the recipient to plan how best to deploy its finances over a two to three-year period.
Eligibility criteria: Open to SMEs conducting innovative drug development in Europe. Applicants should also be able to match any public sector grants with private investments.
Other conditions: Access to grants for SMEs should be paired with (or made conditional upon) access to incubators or support organisations which provide recipients with commercialisation advice such as IP protection and resource planning.
Implementation considerations and next steps:
Review nature of and map the funding provided to life science SMEs via existing European Commission and European Investment Bank channels to identify opportunities for improvement and ongoing/planned initiatives. Ensure that a hypothetical new catalytic grant programme does not overlap in content, eligibility or target profiles with existing initiatives
Design a pan-European grant programme for company-led R&D projects in life sciences tailored towards attracting private investment whilst building on the strengths of the EC’s existing grant programmes. The features of the Biomedical Catalyst represent a good blueprint as the programme is widely regarded as successful in supporting biotech R&D
Test and refine the precise parameters of the grant programme in association with other European and national grant providers prior to launch.

71
Recommendation 2: Increase the quantum of risk capital for the sector, targeting in particular “patient” capital investments
As we have seen in previous sections, venture capital funds in Europe are typically small in size and many are unable to provide sufficient and longer-term support to life science SMEs. Few specialised VC investors exist in Europe and this report also argues that the investment timeframe associated with the traditional model of venture capital is not fully aligned with that of life sciences R&D, despite the generally good performance of this asset class. These issues are observed across all bio-regions within the scope of this study.
The objective should therefore be to i) increase the quantum of risk capital available in the market, while attracting new investors to the life sciences space, based on its recent positive track record; and ii) identify models for longer-term and more “patient” investments.
The EIB Group is in a strong position to bring about change. As the largest fund-of-funds investor in Europe, the EIF continuously supports the European private equity value chain (from technology transfer to business angels to late-stage funds) by backing established and emerging fund managers. It should continue to do so and, to the extent possible, increase its support for the life sciences sector, building on its recent strong performance. The EIF’s recent initiative to establish a new Fund of Funds with a life sciences-dedicated compartment for i.a. institutional investors is a welcome development addressing both the need to increase the quantum of risk capital for the sector and the need to catalyse new investors to this space.
As mentioned above, however, the traditional VC model alone cannot provide all the answers. More “patient” capital, not only driven by short-term returns, should be part of the solution but few such investors exist and this segment deserves further support. By seeking to invest in life science SMEs at an early stage of development, and through a commitment to provide increasingly larger volumes of follow-on financing, “patient” capital investors offer recipients stability and the opportunity to pursue independent growth options. Having visibility over a continuum of financial support, management teams can pursue longer-term strategies and focus on the development of the technology as opposed to fundraising. From an investor’s perspective, this could lead to better returns over a longer timescale and could also enable the growth of more independent mid-cap life science companies in Europe.
Once again, the EIB Group is in a strong position to drive change. One way to do this would be to concentrate financing efforts towards and develop systematic collaboration models with “patient” capital investors. This category would include some early-stage tech transfer funds (with timeframes of over 16 years), a few specialised VC funds with extended life, evergreen funds and a few public investment companies and trusts. The EIB Group could play an important stimulation and aggregation role for like-minded investors and could support the deployment of more “patient” capital by i.a. i) taking cornerstone positions into already established Funds (with a signalling effect to other investors) or, where possible, leveraging funds with debt instruments; and/or ii) co-investing at the level of the investee via co-investment facilities. Such co-investment models have been established in the context of the EFSI investment platforms. Under this model, the EIB would channel the money to a vehicle managed by the entity in charge of delivering a mutually agreed investment strategy. As the EIB would invest through a dedicated parallel co-investment fund, the Bank would not participate in the governance of the implementing entity. However, the EIB would benefit from an excuse right, according to which the Bank may decide not to co-invest in any given project. See Exhibit 39 below for an illustrative co-investment structure.

72
Exhibit 39. Illustrative co-investment facility
Potential characteristics of a “patient” capital investment programme
Geographic scope: All European markets as long as applicants meet other eligibility criteria. Such an intervention would be desirable in all European bio-regions and particularly for emerging ones.
Ticket size: For early-stage companies conducting pre-clinical and Phase I research, the investor should seek to provide EUR 2-5m of financing. For mid- and late-stage companies progressing Phase II and III compounds, ticket sizes should increase to around EUR 30m – 50m, commensurate with the steep increase in drug development costs.
Investment duration: The investor should aim to provide financing through to the point of commercialisation or other material inflection points before commercialisation (however, supporting the companies through multiple rounds of financing).
Eligibility criteria: A de-minimis definition of “patient capital investor” should be agreed upon. In general, i) an investment strategy of supporting portfolio companies through multiple fundraising rounds, ideally until commercialisation; ii) the explicit objective of growing portfolio companies independently and avoiding early exit routes; iii) a sufficient fund size to implement such a strategy; iv) the ability to fundraise among like-minded investors while ideally attracting new investors into the space.
Implementation considerations and next steps:
Review current contributions to life sciences venture capital funds across Europe and assess the EIB Group’s impact in addressing the financing challenges identified as part of this study
Review planned initiatives to support life science companies, particularly in the context of EIB-EC risk-sharing programmes
Map the existing European “patient” capital investors in the space, their investment strategies and fit vis-à-vis the EIB Group’s investment policies
Assess whether the EIB Group could (a) systematically target investments, going forward, to “patient” capital investors, (b) influence where possible the investment behaviour of existing traditional venture capital investors, (c) forge relationships with new “patient” capital investors
Design a new strategy to optimise the EIB Group’s financing instruments (equity and debt) to support “patient” capital and drive longer-term investments in life sciences R&D
Pilot the model in one particular region or with a select number of funds.
EIB
EIB (EFSI) Co-investment Platform Manager
Investors
Manager
Investee 1 Investee 2 Investee 3
manages manages

73
Recommendation 3: Strengthen the capabilities of European late-stage life sciences investors (including venture debt investors)
The Market analysis carried out as part of this study showed a severe deficiency in capital availability for mid- to late-stage clinical trials (i.e. Phase II to commercialisation). European companies advancing their products to this stage require large volume of investments and while the risk of trial failure decreases towards commercialisation, the opportunity cost of capital increases with larger ticket sizes. Few investors in Europe have the capacity to follow on to such late-stage therefore the options left to the companies are limited – typically an alliance or a trade sale to a Pharma company or a premature IPO.
A few instruments and a number of investors are nevertheless active in this space:
venture debt, for example, provides for a credible alternative source of capital which is typically less costly and/or dilutive compared to equity-based investments and could support the last phase of a product development allowing the company to remain independent for longer;
so called “crossover investors” are also active in this space and provide for financing and support prior to, during and after an IPO;
as we have seen in Section 5, alternative sources of financing like royalty financing, are also emerging and trying to fill the late-stage investment gap, although this is happening to a much less extent in Europe than in the US.
The EIB Group already provides financing to late-stage clinical trials, also thanks to its risk-sharing programmes with the European Commission. However, it could contribute further to addressing this capital deficiency by:
i. enhancing its venture debt capacity (or that of its partners) towards late-stage clinical trials companies; the EIB already successfully deploys a quasi-equity instrument under EFSI, targeting i.a. high-growth SMEs and mid-cap biotech or medtech companies. The instrument and its outreach could be enhanced;
ii. further supporting late-stage funds and investors as cornerstone Limited Partner;
iii. providing specific financing to companies listing on European markets through direct co-investments as well as via cross-over funds.
Implementation considerations and next steps:
Review the EIB quasi-equity portfolio in light of the needs identified in this study, and consider enhancing its support towards late-stage biotech companies
Map the existing European investors in the late-stage space, their investment strategies and compatibility vis-à-vis the EIB Group’s investment policies
Test new financing and co-financing models with late-stage investors, including cross-over funds.

74
Long term financial recommendations
Recommendation 4: Establish a new life sciences financing mechanism addressing both financing and therapeutic gaps
This represents the more ambitious target of developing an innovative financing instrument for the European Life Sciences market. While Recommendations 1 to 3, relevant though they are, represent incremental solutions to existing models, with Recommendation 4 we present a breakthrough opportunity to address a clear market need and to draw in new investors to the sector. The design principles of an innovative financing mechanism that seeks to draw substantial new capital to European life-sciences and address investor risk should consider both current market gaps, as well as future transformative potential.
The analysis has shown that traditional European VCs operate within a limited investment spectrum, both in terms of drug development phase and in terms of therapeutic focus (this is driven by both return expectations and by some degree of “pack mentality”). As mentioned above, more VC-type funding is part of the answer, but cannot alone address all the financing and therapeutic gaps of the sector.
A new life sciences portfolio aggregator (such as a Fund of Funds) could enable diversification of risk and act as an attractive vehicle to draw new investors into what is seen as a specialist and poorly understood sector by them at the moment. Such a facility should be geared to pursuing both financial returns over a longer period of time than the traditional VC as well as policy/mission-oriented investments to address clear therapeutic gaps and medical needs. As a result, it would have the potential to invest in many opportunities across a range of therapeutic areas and company sizes using a variety of different instruments. The fund would take advantage of the portfolio effect to de-risk investments and draw in new investors. In addition to a sufficiently diversified portfolio of promising assets, new (institutional) investors could be drawn in through specific interventions to further mitigate their exposure as we will see below.
However, mobilising capital at scale, which enables investment across a portfolio of compounds, will be a challenge given the limited number of European investors with the depth and breadth of investment expertise required. Drawing on the wealth of experience and expertise of global market participants will be critical to ensuring the FoF has sufficient capability and capacity to deliver on its mandate and support the development of investor skills in the sector more generally.
European institutions could play a critical catalytic and coordination role in establishing a dedicated investment structure, particularly in the context of the InnovFin and EFSI programmes. Such an initiative would fit well with the remit, investment scope and policy goals of both programmes.
A hypothetical dedicated life sciences investment platform can be conceptualised as having four levels. See Exhibit 40 below for an illustrative structure of such a mechanism (e.g. Fund of Funds).
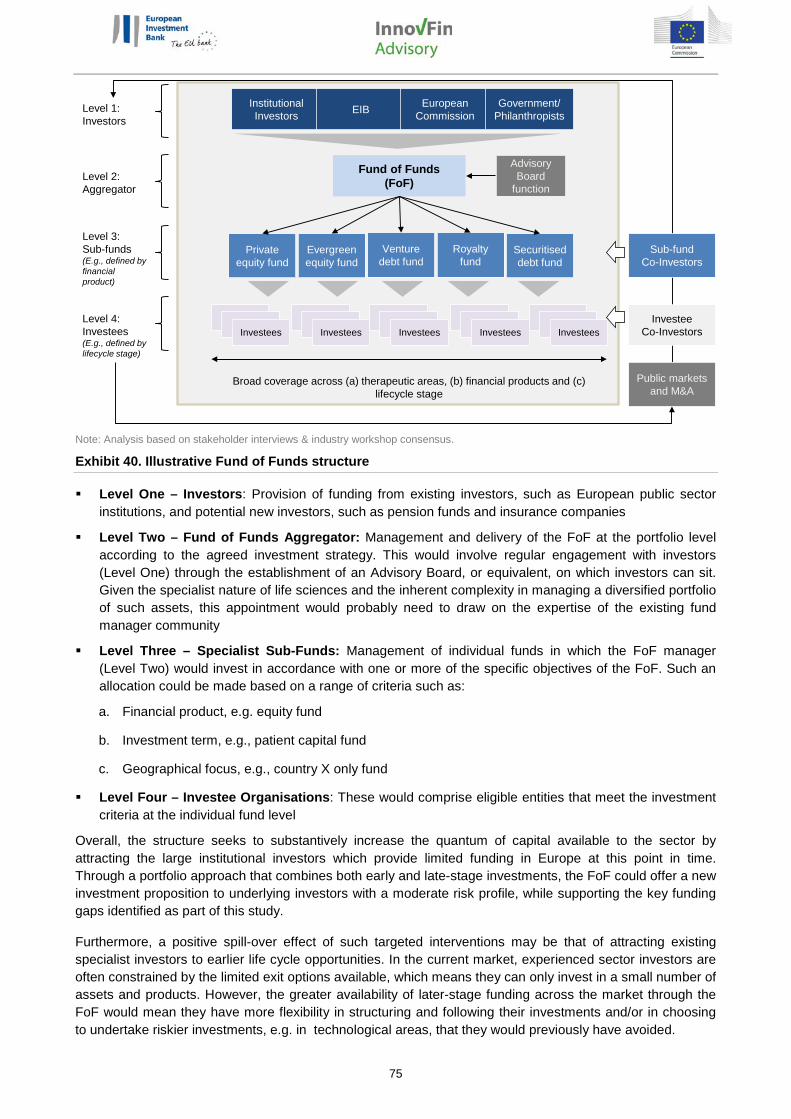
75
Note: Analysis based on stakeholder interviews & industry workshop consensus.
Exhibit 40. Illustrative Fund of Funds structure
Level One – Investors: Provision of funding from existing investors, such as European public sector institutions, and potential new investors, such as pension funds and insurance companies
Level Two – Fund of Funds Aggregator: Management and delivery of the FoF at the portfolio level according to the agreed investment strategy. This would involve regular engagement with investors (Level One) through the establishment of an Advisory Board, or equivalent, on which investors can sit. Given the specialist nature of life sciences and the inherent complexity in managing a diversified portfolio of such assets, this appointment would probably need to draw on the expertise of the existing fund manager community
Level Three – Specialist Sub-Funds: Management of individual funds in which the FoF manager (Level Two) would invest in accordance with one or more of the specific objectives of the FoF. Such an allocation could be made based on a range of criteria such as:
a. Financial product, e.g. equity fund
b. Investment term, e.g., patient capital fund
c. Geographical focus, e.g., country X only fund
Level Four – Investee Organisations: These would comprise eligible entities that meet the investment criteria at the individual fund level
Overall, the structure seeks to substantively increase the quantum of capital available to the sector by attracting the large institutional investors which provide limited funding in Europe at this point in time. Through a portfolio approach that combines both early and late-stage investments, the FoF could offer a new investment proposition to underlying investors with a moderate risk profile, while supporting the key funding gaps identified as part of this study.
Furthermore, a positive spill-over effect of such targeted interventions may be that of attracting existing specialist investors to earlier life cycle opportunities. In the current market, experienced sector investors are often constrained by the limited exit options available, which means they can only invest in a small number of assets and products. However, the greater availability of later-stage funding across the market through the FoF would mean they have more flexibility in structuring and following their investments and/or in choosing to undertake riskier investments, e.g. in technological areas, that they would previously have avoided.
Institutional Investors EIB
Fund of Funds (FoF)
European Commission
Government/ Philanthropists
Private equity fund
Advisory Board
function
Evergreen equity fund
Venture debt fund
Royalty fund
Securitised debt fund
Public markets and M&A
InvesteeInvestee
InvesteesInvestee
InvesteeInvestees
InvesteeInvestee
InvesteesInvestee
InvesteeInvestees
InvesteeInvestee
Investees
Sub-fund Co-Investors
Broad coverage across (a) therapeutic areas, (b) financial products and (c) lifecycle stage
Level 1:Investors
Level 2:Aggregator
Level 3:Sub-funds(E.g., defined by financial product)
Level 4:Investees(E.g., defined by lifecycle stage)
Investee Co-Investors
76
In addition to a sufficiently diversified portfolio of promising assets, institutional investors could be drawn in through specific interventions to further mitigate their exposure. Depending on the structure of the FoF, possible interventions by European institutions could include:
1. At the aggregator level of the structure: provision of “bedrock” equity, upon which senior debt could be secured from a broader range of investors. This could usher investment products into the FoF that better meet the needs of some institutional investors (e.g. pension funds often seek long-term, stable cashflows), while enabling competitively priced equity products to be offered at the investee level through the specialist sub-funds.
2. At the aggregator and/or sub-fund level of the structure: provision of equity on asymmetric terms relative to other investors, subject to state aid clearance. A layered risk coverage mechanism, comprising a First Loss Piece and potentially a Second Loss Piece would support the crowding-in of existing and/or new investors into currently under-served areas of life sciences while providing partial protection from downside risks of the underlying investees. As we saw in Section 3, such models of downside protection of institutional investors are already being tested in some markets (i.e. a guarantee scheme provided to a health insurance company to support its investment as a limited partner in a VC fund).
Note to recommendation 4: Mapping of regulatory frameworks and investment strategies of classes of institutional investors
A new financing mechanism seeking to contribute to the financing gap in the industry should aim to attract new investors. This includes institutional investors (in particular pension funds and insurance companies) and potentially sovereign funds which have generally been little exposed to the sector for a number of reasons including:
Strict regulatory frameworks (both national and international), imposing certain constraints to their investment portfolio;
Statutory restrictions;
(As a result of the above) Conservative investment strategies;
Lack of expertise/knowledge of the sector and perceived inherent riskiness;
Lack of analyst coverage of the sector.
In order to approach a new investor base, a solid understanding of the various regulatory regimes is paramount. We propose to map the main (national and international) European regulatory and statutory constraints applicable to institutional investors and to propose, as a result, a handful of measures compatible with their investment policies. These may include, but not be limited to risk-mitigation measures, like structural subordination of investors (see below), guarantee schemes (as we have seen in the case of the German health insurance company), and asymmetric risk-return profiles (as mentioned above). Having carried out such an assessment, individual institutional investors could be approached for a well-defined investment proposition.
By way of example, in the case of a hypothetical life sciences Fund of Funds, a structure based on different layers of risk tranches bearing different risk/return profiles could be established to cater for the different risk appetite of investors. A structured liability system would allow a significant leverage of public funds by attracting private investments and notably institutional investors. See Exhibit 41 below for an illustrative Fund of Funds capital structure.
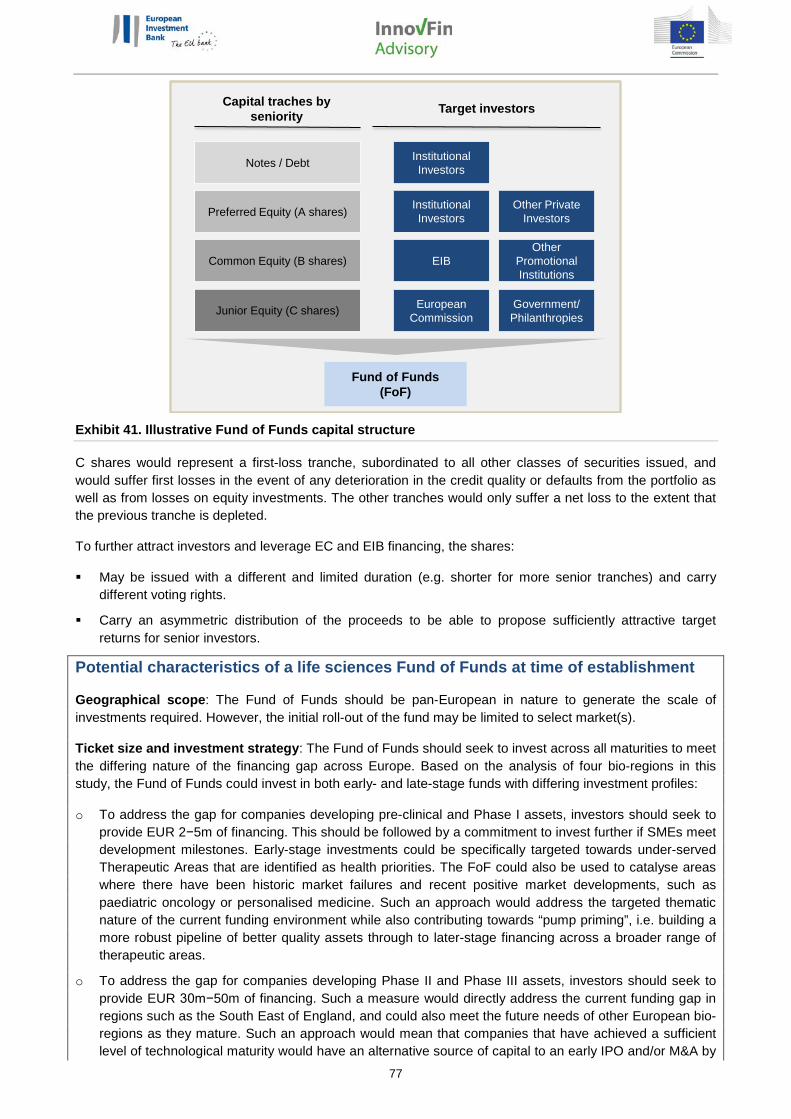
77
Exhibit 41. Illustrative Fund of Funds capital structure
C shares would represent a first-loss tranche, subordinated to all other classes of securities issued, and would suffer first losses in the event of any deterioration in the credit quality or defaults from the portfolio as well as from losses on equity investments. The other tranches would only suffer a net loss to the extent that the previous tranche is depleted.
To further attract investors and leverage EC and EIB financing, the shares:
May be issued with a different and limited duration (e.g. shorter for more senior tranches) and carry different voting rights.
Carry an asymmetric distribution of the proceeds to be able to propose sufficiently attractive target returns for senior investors.
Potential characteristics of a life sciences Fund of Funds at time of establishment
Geographical scope: The Fund of Funds should be pan-European in nature to generate the scale of investments required. However, the initial roll-out of the fund may be limited to select market(s).
Ticket size and investment strategy: The Fund of Funds should seek to invest across all maturities to meet the differing nature of the financing gap across Europe. Based on the analysis of four bio-regions in this study, the Fund of Funds could invest in both early- and late-stage funds with differing investment profiles:
o To address the gap for companies developing pre-clinical and Phase I assets, investors should seek to provide EUR 2−5m of financing. This should be followed by a commitment to invest further if SMEs meet development milestones. Early-stage investments could be specifically targeted towards under-served Therapeutic Areas that are identified as health priorities. The FoF could also be used to catalyse areas where there have been historic market failures and recent positive market developments, such as paediatric oncology or personalised medicine. Such an approach would address the targeted thematic nature of the current funding environment while also contributing towards “pump priming”, i.e. building a more robust pipeline of better quality assets through to later-stage financing across a broader range of therapeutic areas.
o To address the gap for companies developing Phase II and Phase III assets, investors should seek to provide EUR 30m−50m of financing. Such a measure would directly address the current funding gap in regions such as the South East of England, and could also meet the future needs of other European bio-regions as they mature. Such an approach would mean that companies that have achieved a sufficient level of technological maturity would have an alternative source of capital to an early IPO and/or M&A by
Fund of Funds (FoF)
Notes / Debt
Preferred Equity (A shares)
Common Equity (B shares)
Junior Equity (C shares)
Institutional Investors
Institutional Investors
EIB
European Commission
Other Private Investors
Other Promotional Institutions
Government/ Philanthropies
Capital traches by seniority Target investors

78
Large Pharma. As we have seen, European life science companies are currently generally only able to raise smaller volumes of capital on European stock exchanges compared to their US counterparts. In accordance with the policy objectives underpinning the creation of the FoF, this would enable them to continue as growth companies for longer, and possibly remain independent.
At the time of its establishment, the FoF is likely to pursue an investment strategy focused on later-stage assets to reflect the lower risk appetite of new investors, while building the portfolio track record.
Investment duration: The Fund of Funds should have the objective and capacity to support companies from seed investment through to commercialisation.
Eligibility criteria (for SMEs): Open to SMEs conducting innovative drug development in Europe.
Total fund size: To achieve the desired portfolio effect across investments in multiple products, the fund should be in the region of at least EUR 500m, comparable with some other small-scale fund of funds. The remit and size of the Fund of Funds could then be extended in due course (see overleaf for further details). For comparison, some other funds and fund sizes in the sector are:
o Dementia Discovery Fund – GBP 100m capital raised to develop promising therapies in one therapeutic area
o Coalition for Epidemic Preparedness Innovations (CEPI) - USD 460m to develop four to six vaccine candidates to Proof of Concept in five years
o Woodford Patient Capital Trust – GBP 800m raised
Financing products offered: The primary product offered to early-stage companies should be equity-based. For later-stage companies, a broader range of products could be available. For example, the Fund of Funds could start by providing equity investments and then extend this offer to less traditional instruments such as:
o Debt, particularly venture debt – The general characteristics of debt products are suited to the reduced risk associated with late-stage R&D companies though current rates of adoption are low
o Royalty financing – There appears to be increasing willingness to finance late-stage R&D companies via a royalty model though to date they have only been used to finance marketed or very close-to-market products
Longer-term potential of the Fund of Funds
A successful launch and strong early performance of the FoF will support it in raising more capital to grow and expand into new product areas, product maturities and geographical regions.
Such an evolution could take place across various dimensions:
o By sub-fund: New specialist sub-funds (Level Three in the FoF diagram above) could be targeted/raised for a much broader range of areas than those initially identified. It may also be possible to combine areas of focus or structure sub-funds on an alternative basis, for example by technology platforms rather than by therapeutic area
o By financial products offered: The FoF could seek to offer more diversified products than simply private and “patient” equity to its portfolio companies over time. This could include securitised debt instruments35 targeted at appropriate parts of the overall portfolio that could further lower the portfolio risk to investors at the aggregate level and provide greater stability in returns
o By maturity of investee companies: Investments could be undertaken in investee companies (Level Four in the diagram above) at different stages of development in their life cycle
In addition, continued portfolio diversification and the de-risking that should result will over time enable a greater amount of debt to be leveraged into the capital structure of the FoF. This could increase the investor base of the FoF and decrease its cost of capital, the latter of which could be passed on to investees in terms of the cost of finance offered.
35 Raising a bond would require certain pre-requisites such as a stable volume of cash flows over a reasonable period of time. The pace at which these can be attained will be linked to the investment strategy at the time of establishment. Having a significant proportion of the FoF portfolio in later-stage assets is likely to reduce volatility in cash flows even with a comparatively low level of aggregation

79
Overall, as the FoF builds up a track record and expertise over time, its investment strategy and capital structure could diversify to take full advantage of portfolio benefits.
Next steps:
Further market testing of the proposal with:
o Services of the EIB Group to assess the opportunities for integration with existing and other proposed initiatives
o Potential existing and new investors in the sector to test their appetite to participate in such a structure and the terms on which they would do so. Mapping of the regulatory constraints as indicated above
o Potential fund managers to assess their capacity and capability to manage the FoF as well as potential sub-funds below it. In addition, any European supported fund would have certain conditions with respect to the remuneration of fund managers, which would have an impact on how potential fee arrangements may be structured. Given the unique nature of the FoF structure, this would need to be thoroughly explored with fund managers prior to procurement preparation
Quantitative modelling to gain a better understanding of the likely risk-reward trade-offs when considering how the portfolio should be structured at the central and sub-fund level. Discussions with academics who have conducted extensive simulation exercises in particular therapeutic areas like cancer suggest the potential applicability of theoretical securitised mega-fund models to the FoF structure. However, the FoF is a significantly more complex undertaking due to the multiplicity of the variables under consideration, namely stage of investment, therapeutic area and range of financial products.

80
Long-term non-financial recommendations
Recommendation 5: Provide input to the European Commission’s Capital Markets Union initiative and work towards the establishment of a more unified and better capitalised public market for life sciences R&D
European public markets are fragmented and lack liquidity when compared to the NASDAQ in the US, making public listings in the EU an unattractive exit option for life sciences investors.
A better-functioning capital market is attractive for private investors which wish to exit and for companies which are looking to raise large rounds of financing to support later-stage development and commercial activities. Strong capital markets would also incentivise companies to remain independent, reducing the number of companies that are either bought out or decide to list on non-European markets. Finally, a well-functioning capital market for life sciences would help improve analyst coverage, increasing the visibility of the life science sector to generalists and institutional investors, thus growing both the private and public life science financing environment.
The European Commission is currently engaged in the Capital Markets Union (CMU), an initiative to mobilise capital and provide a deeper and more integrated set of capital markets to help lower the cost of financing in Europe. In turn this will provide businesses with a greater choice of funding at lower costs, offer new opportunities for savers and investors and make the financial system more resilient36. An initial report, published by the European Commission in March 2017, addressed the national barriers to cross-border investments in capital markets37.
Going forward, the CMU should seek to address the perspectives of all industries, including that of the innovative life sciences sector, in developing and implementing a set of recommendations by its 2019 deadline.
A number of the actions identified by the European Commission have a direct impact on the life sciences industry, its current and potential investor base, as well as on addressing the identified funding gap. In particular38:
Providing more funding choices for Europe’s businesses and SMEs with a package of measures to support venture capital and equity financing in the EU, including catalysing private investment using EU resources through pan-European funds of funds, regulatory reform, and the promotion of best practice on tax incentives;
Ensuring an appropriate regulatory environment for long-term and sustainable investment, including the review of Solvency II calibrations;
Increasing investment and choices for retail and institutional investors.
Next steps:
Submit a summary of the public market challenges identified as part of this study to the European Commission to ensure that the proposed actions and related measures meet the needs of the innovative life sciences R&D industry.
36 European Commission 37 “Accelerating the capital markets union: addressing national barriers to capital flows”, European Commission, March 2017 38 “Action Plan on Building a Capital Markets Union”, September 2015
81
Recommendation 6: Strengthen the underlying market for life sciences R&D through a series of initiatives developed in collaboration with national governments
In weaker markets where the underdeveloped nature of the life sciences R&D market is limited by factors other than financing, a range of other solutions could be considered.
To begin with, a thorough market assessment should be conducted to understand the current capabilities of key scientific and financial institutions, and to assess the appetite of regional and national level stakeholders in making life sciences R&D a priority area for investment.
Based on such preparatory work, one or two areas of focus should be identified, based on a distinctive value proposition of the region/bio-cluster (be it a specific therapeutic focus, a particular strength identified, etc.) and on the risk-return profile of the underlying technology. For instance, a weaker bio-cluster could chose to initially establish its focal point and build its expertise around less risky technologies like medical devices, which typically have a shorter development cycle, an easier approval process and a generally well-capitalised market (as we have seen, non-specialised investors in particular typically prefer to invest in medical devices rather that new drugs). Similar consideration could be applied to personalised medicines and bio-banks, which today attract much attention and investment.
However, even a more focused development strategy, not subject to the long lead times of drug development, would still require major efforts in nurturing an enabling ecosystem (from scientist to technology transfer offices, to entrepreneurs, to investors). A roadmap of accompanying measures should therefore be developed (e.g. one route could be via national programmes for structural funds). This could include actions to:
strengthen technology transfer capabilities within academic institutions so that scientists are better equipped to identify and commercialise their innovations
In the case of Poland, such support could take the form of:
o Supporting Polish scientists via professional exchange programmes, e.g. the ENTENTE programme (European Network in Knowledge Transfer in Health), which allows professionals working in a European academic TTO to spend a few weeks in a host organisation to share knowledge on health
o Providing funding to Polish institutions to establish technology transfer offices
retain high-performing scientists and entrepreneurs, and incentivise the return of the diaspora, to grow the pool of well-qualified teams to lead early-stage life science companies
In the case of Poland, the Government could build on the existing HOMING Programme to repatriate high-performing academic scientists based in the US and Western Europe in the life sciences industry back to Poland
establish the necessary infrastructure and networks to support early-stage companies with the commercial acumen for success
In the case of Poland, technical and financial support could be provided to the Polish Agency for Enterprise Development (PARP) for their initiatives in the sponsorship of technology parks and incubators
Introduce incentives for companies to conduct research in the region, and for investors to provide funding, e.g. via tax credits and public-backed financing programmes
European institutions could play an important role in accelerating the growth of these emerging bio-regions, though this should be considered on a market-by-market basis in collaboration with the national government (e.g. one route could be via national programmes for structural funds).
The case of Poland, analysed as part of this study, could be an interesting test bed. Its relatively weak enabling environment and small investor base is partially compensated by the quality of its hospitals and its

82
well-trained doctors. This could be the starting point for assessing its strengths and focusing on a specific development area, around which to build an enabling ecosystem and attract investments.

83
GLOSSARY OF TERMS
Term Definition
Acquisition When a company (typically referred to as the ‘acquirer’, ‘buyer’ or ‘bidder’) purchases a second, usually smaller company, taking a controlling interest.
Add-on When a venture capital-backed company acquires another smaller company, or the assets of another company. This is typically to consolidate their market position, or acquire proprietary technologies from their competitors.
Alliance A business arrangement in which two or more parties agree to pool their resources for the purpose of accomplishing a specific task. This task can be a new project or any other business activity. Also known as a joint venture.
Basic research See 'Research Project'. Biomedical Catalyst A UK grants-based financing programme aimed at supporting innovative small and
medium-sized businesses and researchers looking to develop solutions to healthcare challenges. The scheme is coordinated by the UK Medical Research Council and Innovate UK, and opened for applications in Spring 2012.
Cell & gene therapies Overlapping fields of biomedical research with the goal of repairing the direct cause of genetic diseases in the DNA or cellular population, respectively.
Class III Medical Device
The highest risk classification of medical devices. Devices are classified into Class I, Class II, and Class III. Class I devices are deemed to be low risk and are therefore subject to the least regulatory controls.
Co-development programme
An agreement between two or more parties to pursue a shared objective, synergising the resources of both entities.
Commercialisation Office
An entity that assists with identification, protection and commercial exploitation of University Intellectual Property (IP) as well as providing advice on IP-related matters.
Consumer Product Medicines sold directly to a consumer without a prescription, from a healthcare professional.
Cost to Complete Pipeline
The financing required to support all pipeline products through to commercialisation, at each stage of development using typical success rates, development costs and development times.
Deal activity The number of transactions that occur during a specific period of time, also known as “deal volume”.
Deal size The monetary size of the transaction between two or more parties. Deal volume See “deal activity'. Drug discovery The process by which new candidate medications are discovered, including the
identification of screening hits, medicinal chemistry and optimisation to increase affinity, selectivity, efficacy/potency, metabolic stability and oral bioavailability.
Early-stage financing A type of venture fund that invests only in the early stage of a company’s life. Can be either for seed or start-ups.
Early-stage research Research and development activity leading up to the point of clinical Proof of Concept. This includes research projects, pre-clinical testing, Phase I and Phase IIa studies.
Enterprise Investment Scheme
A series of UK tax reliefs launched in 1994 and designed to encourage investments in small unquoted companies carrying out a qualifying trade in the UK.
Evergreen fund A fund in which returns generated on investments are automatically returned to the general pool, with the aim of keeping a continuous supply of capital on hand for investments.
Filed Stage of drug development whereby an application has been filed for approval with the relevant marketing authorities.
Flotation The process of offering a company's shares for sale on the stock market for the first time.
Financing gap The additional financing to complete the pipeline over a defined period of time.
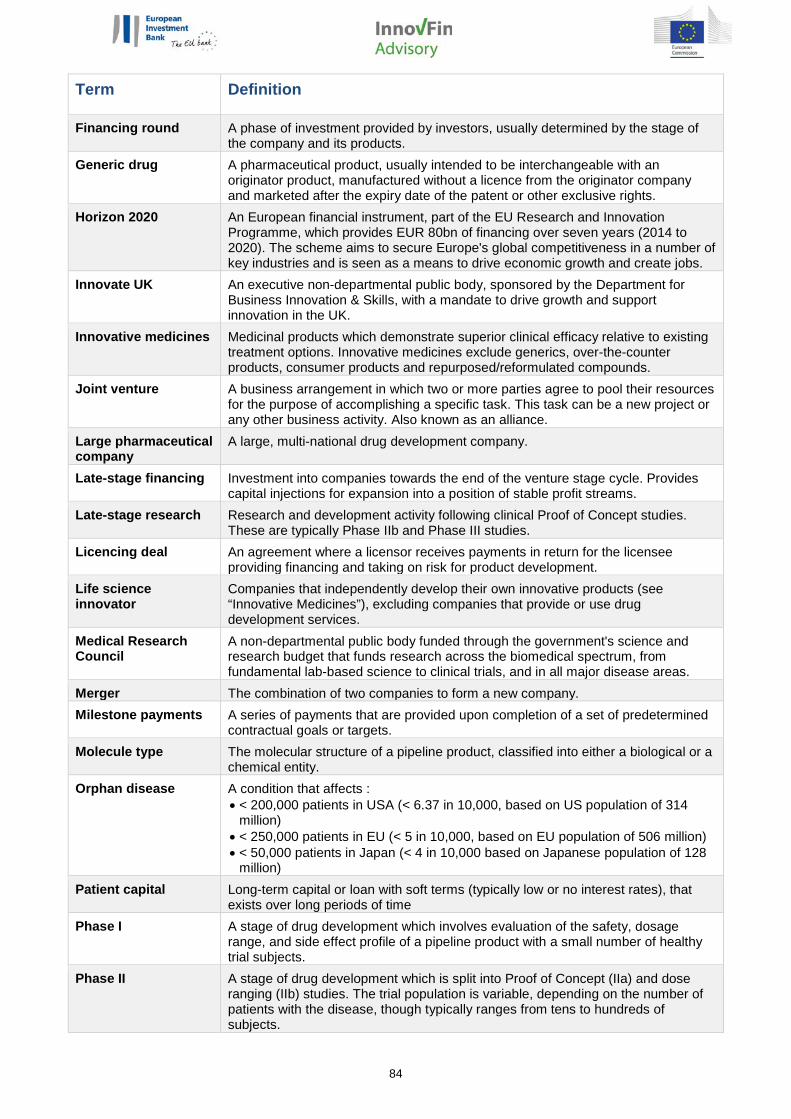
84
Term Definition
Financing round A phase of investment provided by investors, usually determined by the stage of the company and its products.
Generic drug A pharmaceutical product, usually intended to be interchangeable with an originator product, manufactured without a licence from the originator company and marketed after the expiry date of the patent or other exclusive rights.
Horizon 2020 An European financial instrument, part of the EU Research and Innovation Programme, which provides EUR 80bn of financing over seven years (2014 to 2020). The scheme aims to secure Europe's global competitiveness in a number of key industries and is seen as a means to drive economic growth and create jobs.
Innovate UK An executive non-departmental public body, sponsored by the Department for Business Innovation & Skills, with a mandate to drive growth and support innovation in the UK.
Innovative medicines Medicinal products which demonstrate superior clinical efficacy relative to existing treatment options. Innovative medicines exclude generics, over-the-counter products, consumer products and repurposed/reformulated compounds.
Joint venture A business arrangement in which two or more parties agree to pool their resources for the purpose of accomplishing a specific task. This task can be a new project or any other business activity. Also known as an alliance.
Large pharmaceutical company
A large, multi-national drug development company.
Late-stage financing Investment into companies towards the end of the venture stage cycle. Provides capital injections for expansion into a position of stable profit streams.
Late-stage research Research and development activity following clinical Proof of Concept studies. These are typically Phase IIb and Phase III studies.
Licencing deal An agreement where a licensor receives payments in return for the licensee providing financing and taking on risk for product development.
Life science innovator
Companies that independently develop their own innovative products (see “Innovative Medicines”), excluding companies that provide or use drug development services.
Medical Research Council
A non-departmental public body funded through the government's science and research budget that funds research across the biomedical spectrum, from fundamental lab-based science to clinical trials, and in all major disease areas.
Merger The combination of two companies to form a new company. Milestone payments A series of payments that are provided upon completion of a set of predetermined
contractual goals or targets. Molecule type The molecular structure of a pipeline product, classified into either a biological or a
chemical entity. Orphan disease A condition that affects :
• < 200,000 patients in USA (< 6.37 in 10,000, based on US population of 314 million)
• < 250,000 patients in EU (< 5 in 10,000, based on EU population of 506 million) • < 50,000 patients in Japan (< 4 in 10,000 based on Japanese population of 128
million) Patient capital Long-term capital or loan with soft terms (typically low or no interest rates), that
exists over long periods of time Phase I A stage of drug development which involves evaluation of the safety, dosage
range, and side effect profile of a pipeline product with a small number of healthy trial subjects.
Phase II A stage of drug development which is split into Proof of Concept (IIa) and dose ranging (IIb) studies. The trial population is variable, depending on the number of patients with the disease, though typically ranges from tens to hundreds of subjects.

85
Term Definition
Phase III A stage of drug development with the largest trial size. Phase III trials are used to confirm the efficacy of a pipeline product, monitor safety and side effects and compare its efficacy relate to commonly-used products.
Pre-clinical A stage of drug development which involves collecting data from animal pharmacology and toxicology studies. Pre-clinical studies also involve pilot manufacturing and an assessment of clinical trial protocol design and implementation.
Private equity In the context of this study private equity investment consists of all seed capital, venture capital, and venture debt and growth capital.
Product maturity The development stage of a pipeline product using the categorisation: Research Project - Marketed.
Product pipeline Medicinal products under research and development. These products can be categorised by development maturity (ranging from Research Project through to Filed) and by one of the 13 major therapeutic categories based on its therapeutic activity and primary indication.
Public Financing In the context of this study public financing consists of flotations, share placings, rights issues and private investment in public equity (PIPE).
Reformulation Altering the drug delivery system using new and innovative technologies to potentially lower the dose required, permit a new indication, or reduce toxicity.
Repositioning Also known as repurposing. The application of known drugs and compounds to new indications, reducing the time and cost associated with bringing a new drug to the market.
Research Council A non-departmental public body responsible for investing public money into specific areas of research within the UK to advance knowledge and generate new ideas.
Research-intensive institution
An institution that focuses a large proportion of its resources on research and development programmes, achieving a high throughput of high quality academic publications and findings. In this study, they are defined as Imperial College London, King's College London, Queen Mary University of London, University College London, University of Cambridge and University of Oxford.
Research project Very early-stage research and development programmes where pre-clinical assessment has not yet initiated.
Reverse takeover A company that is added by a private equity firm to one of its platform companies, or by a strategic buyer pursuing a consolidation investment strategy.
Rights issue The issue of new shares to existing shareholders to raise additional capital. Series A/Round A The first significant round of venture capital financing where preferred stock is
offered by a portfolio company to the venture capitalist. It is convertible into common stock in certain cases such as an IPO or the sale of the company.
Series B/Round B A mid-stage second round of financing provided by venture capitalists, typically once a company has accomplished certain milestones in developing its business.
Series C/Round C Another successive round offering preferred stock once the company has met milestones, often for products in mid- to late-stage development
Series D/Round D Financing that moves the company into later-stage venture capital financing or public financing.
Seed The first stage of venture capital financing by a professional venture capital firm, typically a small investment in a very early-stage company that has usually not yet established commercial operations.
Seed Enterprise Investment Scheme
A series of UK tax reliefs, complementing the Enterprise Investment Scheme, launched in 2012 to encourage seed investment in early-stage companies.
Series 1 - 4 This follows a similar classification to that of Rounds A - D. Share placement The issue of new shares to the market to raise additional capital. Small and medium- Enterprises that employ fewer than 250 persons and which have an annual

86
Term Definition
sized enterprises turnover not exceeding EUR 50m, and/or an annual balance sheet total not exceeding EUR 43m.
South East of England
For the purpose of this study, the South East of England consists of the following counties within England: Berkshire, Buckinghamshire, Cambridgeshire, East Sussex, Essex, Greater London (all London boroughs), Hampshire, Hertfordshire, Kent, Oxfordshire, Surrey, and West Sussex.
Strategic alliance An agreement between two or more parties to pursue a set of pre-agreed objectives whilst remaining independent organisations.
Therapeutic Area A classification system which categorises drugs according to their therapeutic activity and the primary indication. The system is broadly based on EphMRA Anatomical classification system (ATC). There are 13 therapeutic categories in total and example categories include cardiovascular, oncology & immunomodulators and dermatology.
Translational research
The translation of findings from fundamental research into medical practice and meaningful health outcomes.
Unclassified investment
A record of investment where the stage/class is not publically available.
Venture capital Capital provided to new or growing businesses with perceived, long-term growth potential in exchange for an equity stake.
Venture debt A type of debt financing provided to venture capital-backed companies by a specialised financier to fund working capital or capital expenses.
Venture round A type of financing round used for venture capital financing, by which start-up companies obtain investment, generally from venture capitalists and other institutional investors.
Wellcome Trust An independent global charitable foundation dedicated to improving health through science, research and engagement with society.
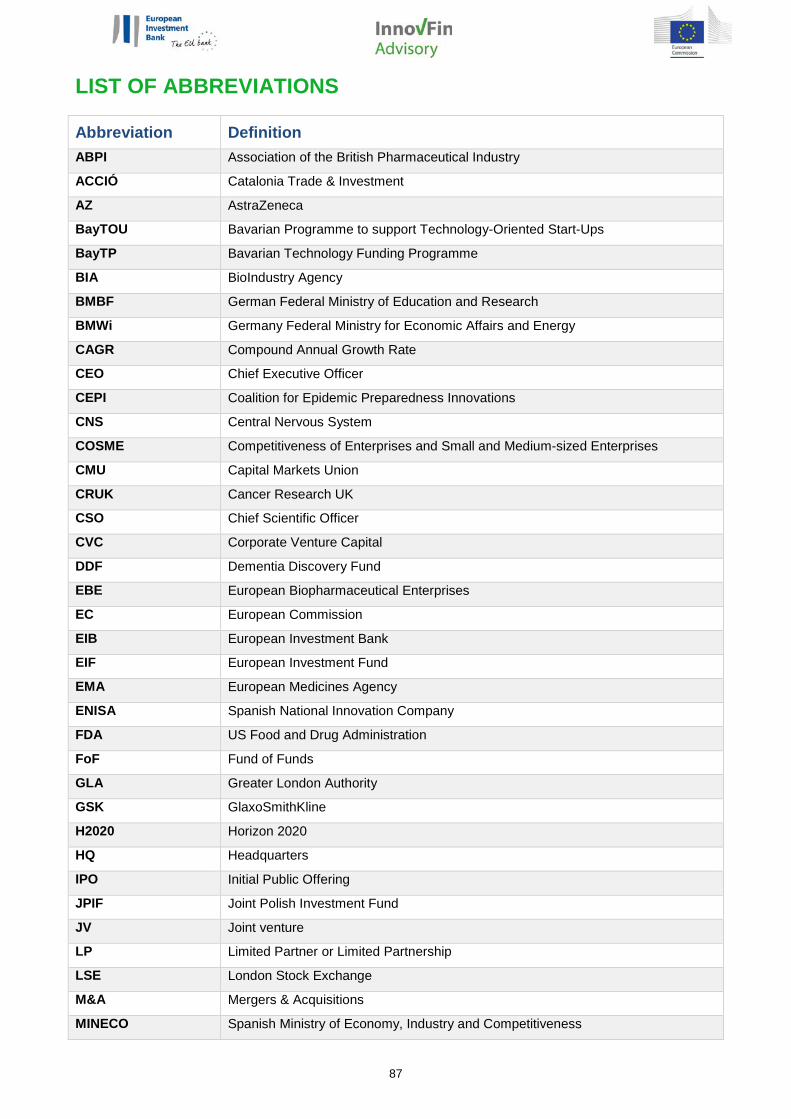
87
LIST OF ABBREVIATIONS
Abbreviation Definition ABPI Association of the British Pharmaceutical Industry
ACCIÓ Catalonia Trade & Investment
AZ AstraZeneca
BayTOU Bavarian Programme to support Technology-Oriented Start-Ups
BayTP Bavarian Technology Funding Programme
BIA BioIndustry Agency
BMBF German Federal Ministry of Education and Research
BMWi Germany Federal Ministry for Economic Affairs and Energy
CAGR Compound Annual Growth Rate
CEO Chief Executive Officer
CEPI Coalition for Epidemic Preparedness Innovations
CNS Central Nervous System
COSME Competitiveness of Enterprises and Small and Medium-sized Enterprises
CMU Capital Markets Union
CRUK Cancer Research UK
CSO Chief Scientific Officer
CVC Corporate Venture Capital
DDF Dementia Discovery Fund
EBE European Biopharmaceutical Enterprises
EC European Commission
EIB European Investment Bank
EIF European Investment Fund
EMA European Medicines Agency
ENISA Spanish National Innovation Company
FDA US Food and Drug Administration
FoF Fund of Funds
GLA Greater London Authority
GSK GlaxoSmithKline
H2020 Horizon 2020
HQ Headquarters
IPO Initial Public Offering
JPIF Joint Polish Investment Fund
JV Joint venture
LP Limited Partner or Limited Partnership
LSE London Stock Exchange
M&A Mergers & Acquisitions
MINECO Spanish Ministry of Economy, Industry and Competitiveness
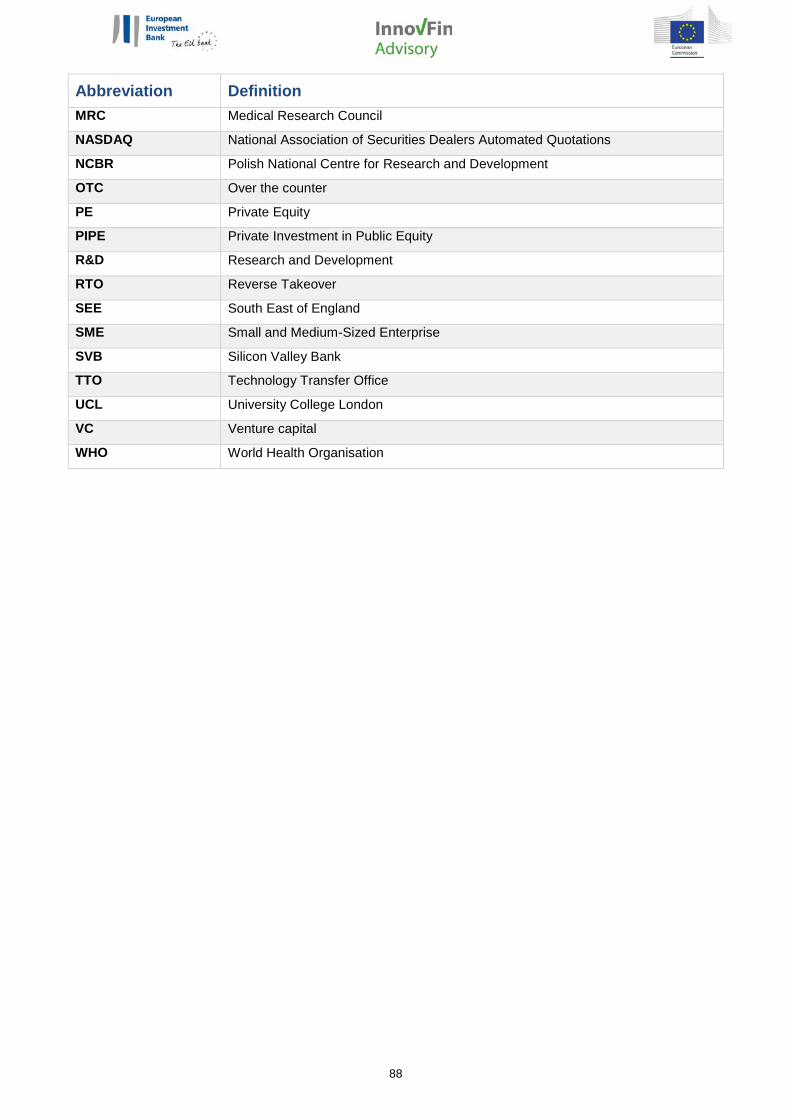
88
Abbreviation Definition MRC Medical Research Council
NASDAQ National Association of Securities Dealers Automated Quotations
NCBR Polish National Centre for Research and Development
OTC Over the counter
PE Private Equity
PIPE Private Investment in Public Equity
R&D Research and Development
RTO Reverse Takeover
SEE South East of England
SME Small and Medium-Sized Enterprise
SVB Silicon Valley Bank
TTO Technology Transfer Office
UCL University College London
VC Venture capital
WHO World Health Organisation
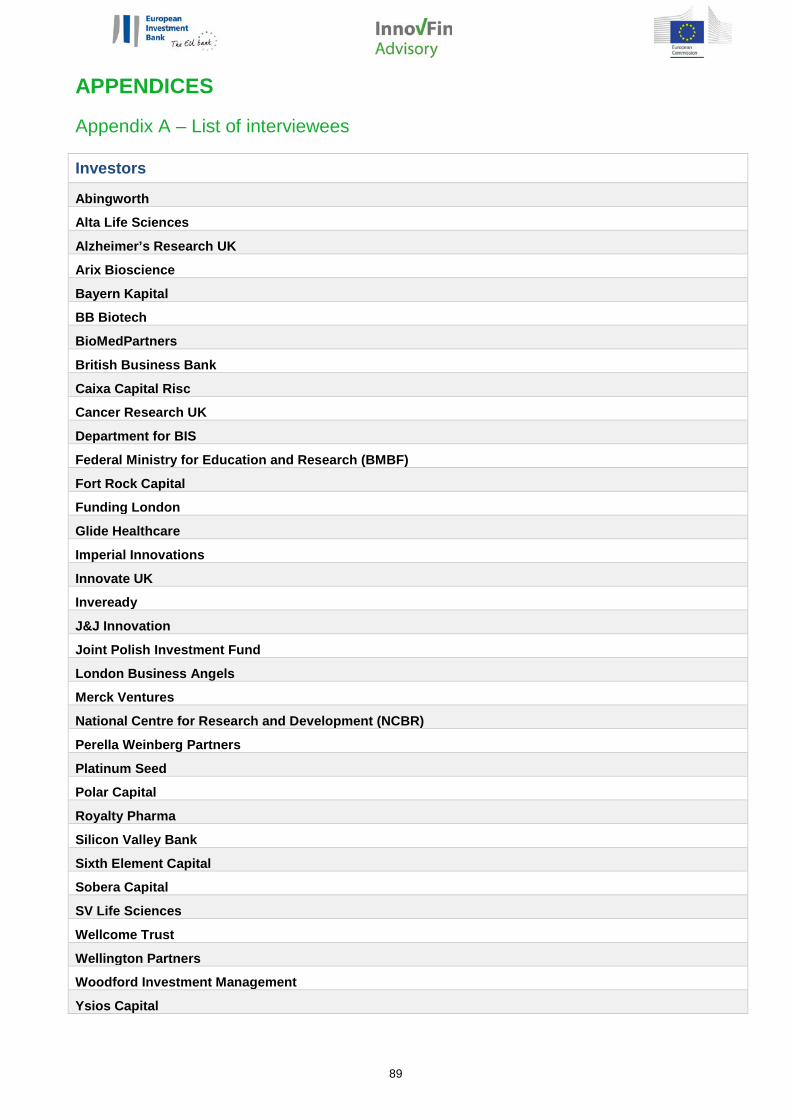
89
APPENDICES
Appendix A – List of interviewees
Investors
Abingworth
Alta Life Sciences
Alzheimer’s Research UK
Arix Bioscience
Bayern Kapital
BB Biotech
BioMedPartners
British Business Bank
Caixa Capital Risc
Cancer Research UK
Department for BIS
Federal Ministry for Education and Research (BMBF)
Fort Rock Capital
Funding London
Glide Healthcare
Imperial Innovations
Innovate UK
Inveready
J&J Innovation
Joint Polish Investment Fund
London Business Angels
Merck Ventures
National Centre for Research and Development (NCBR)
Perella Weinberg Partners
Platinum Seed
Polar Capital
Royalty Pharma
Silicon Valley Bank
Sixth Element Capital
Sobera Capital
SV Life Sciences
Wellcome Trust
Wellington Partners
Woodford Investment Management
Ysios Capital

90
Life science companies
4SC
ABAC Therapeutics
AB-Biotics
Ability Pharma
Acacia Pharma
AdvanceCOR
Aromics
AstraZeneca Poland
Bicycle Therapeutics
Canbex Therapeutics
Captor Therapeutics
Cell Medica
CellCentric
Centauri Therapeutics
Circassia
Enterprise Therapeutics
Genmedica Therapeutics
GSK
Immunocore
ImmuPharma
iOmx Therapeutics
Karus Therapeutics
Kymab
Lilly
Lykera Biomed
Oncoarendi Therapeutics
Oxford BioMedica
ReNeuron
Scope Fluidics
Selvita
Summit Therapeutics
Svanvid
Thermosome
ValiRx
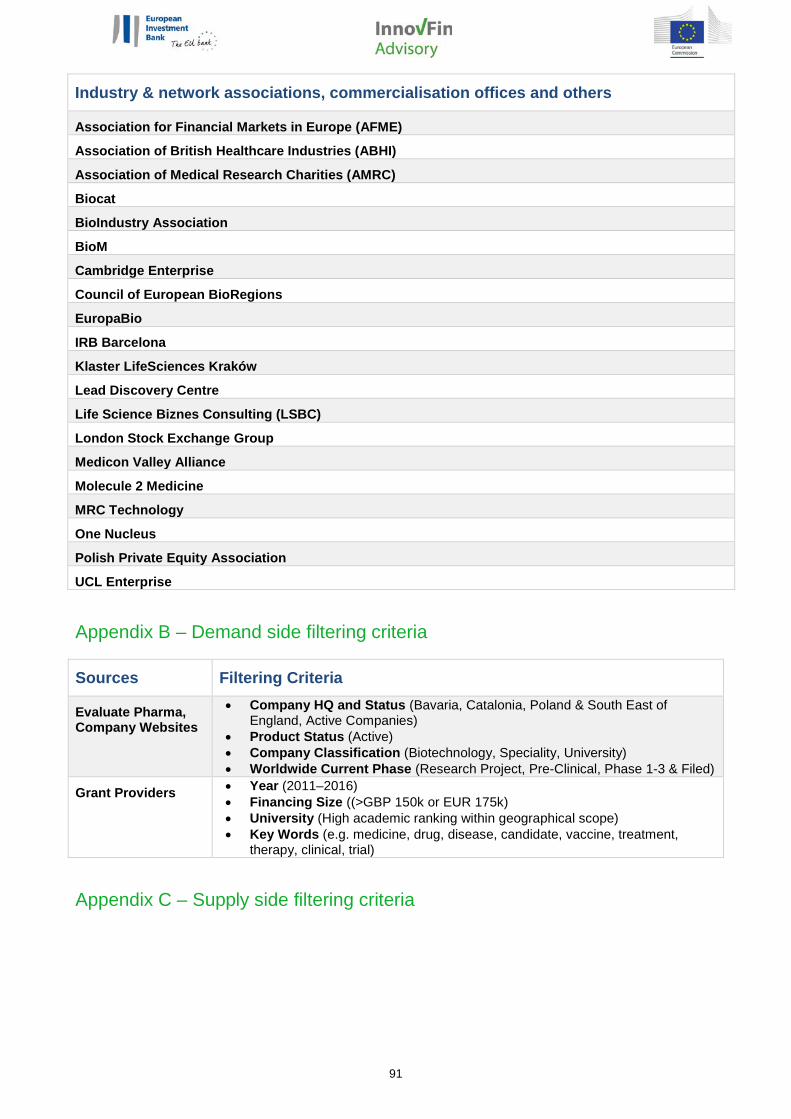
91
Industry & network associations, commercialisation offices and others
Association for Financial Markets in Europe (AFME)
Association of British Healthcare Industries (ABHI)
Association of Medical Research Charities (AMRC)
Biocat
BioIndustry Association
BioM
Cambridge Enterprise
Council of European BioRegions
EuropaBio
IRB Barcelona
Klaster LifeSciences Kraków
Lead Discovery Centre
Life Science Biznes Consulting (LSBC)
London Stock Exchange Group
Medicon Valley Alliance
Molecule 2 Medicine
MRC Technology
One Nucleus
Polish Private Equity Association
UCL Enterprise
Appendix B – Demand side filtering criteria
Sources Filtering Criteria
Evaluate Pharma, Company Websites
• Company HQ and Status (Bavaria, Catalonia, Poland & South East of England, Active Companies)
• Product Status (Active) • Company Classification (Biotechnology, Speciality, University) • Worldwide Current Phase (Research Project, Pre-Clinical, Phase 1-3 & Filed)
Grant Providers • Year (2011–2016) • Financing Size ((>GBP 150k or EUR 175k) • University (High academic ranking within geographical scope) • Key Words (e.g. medicine, drug, disease, candidate, vaccine, treatment,
therapy, clinical, trial)
Appendix C – Supply side filtering criteria
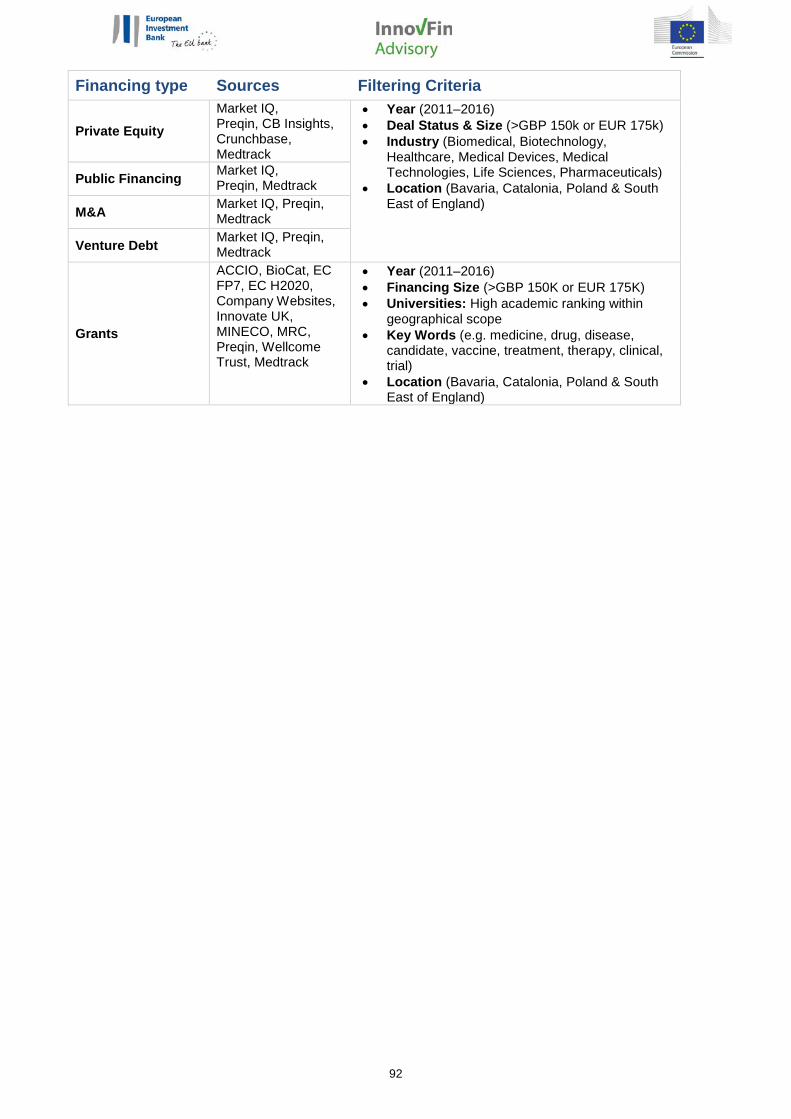
92
Financing type Sources Filtering Criteria
Private Equity Market IQ, Preqin, CB Insights, Crunchbase, Medtrack
• Year (2011–2016) • Deal Status & Size (>GBP 150k or EUR 175k) • Industry (Biomedical, Biotechnology,
Healthcare, Medical Devices, Medical Technologies, Life Sciences, Pharmaceuticals)
• Location (Bavaria, Catalonia, Poland & South East of England)
Public Financing Market IQ, Preqin, Medtrack
M&A Market IQ, Preqin, Medtrack
Venture Debt Market IQ, Preqin, Medtrack
Grants
ACCIO, BioCat, EC FP7, EC H2020, Company Websites, Innovate UK, MINECO, MRC, Preqin, Wellcome Trust, Medtrack
• Year (2011–2016) • Financing Size (>GBP 150K or EUR 175K) • Universities: High academic ranking within
geographical scope • Key Words (e.g. medicine, drug, disease,
candidate, vaccine, treatment, therapy, clinical, trial)
• Location (Bavaria, Catalonia, Poland & South East of England)

93
Appendix D – Demand side modelling assumptions
Development times by phase (years)
Research project Pre-clinical Phase 1 Phase 2 Phase 3 Filed
4 1 1 2 3 1
Development costs phase (out-of-pocket costs, 2017 adjusted, EUR m)
Research project Pre-clinical Phase 1 Phase 2 Phase 3 Filed
15.2 5.6 16.9 45.1 169.1 45.1
Success rates by phase (%)
Research project Pre-clinical Phase 1 Phase 2 Phase 3 Filed
27% 69% 54% 34% 70% 91%
Source: PAREXEL Biopharmaceutical R&D Statistical Sourcebook 2015/2016 & "How to improve R&D productivity: the pharmaceutical industry’s grand challenge" (S.M Paul, 2010).
Modelling Assumptions:
Phase denoted in the product database is first moved into at start of 2017
Costs of development are realised at the end of each year
Success of development is evaluated at the end of each phase
Costs of development increase in line with average annual inflation (2008-2016)
Annual inflation from 2008 to 2016 is estimated to be 2%
The exchange rate used is USD 1 : EUR 0.94
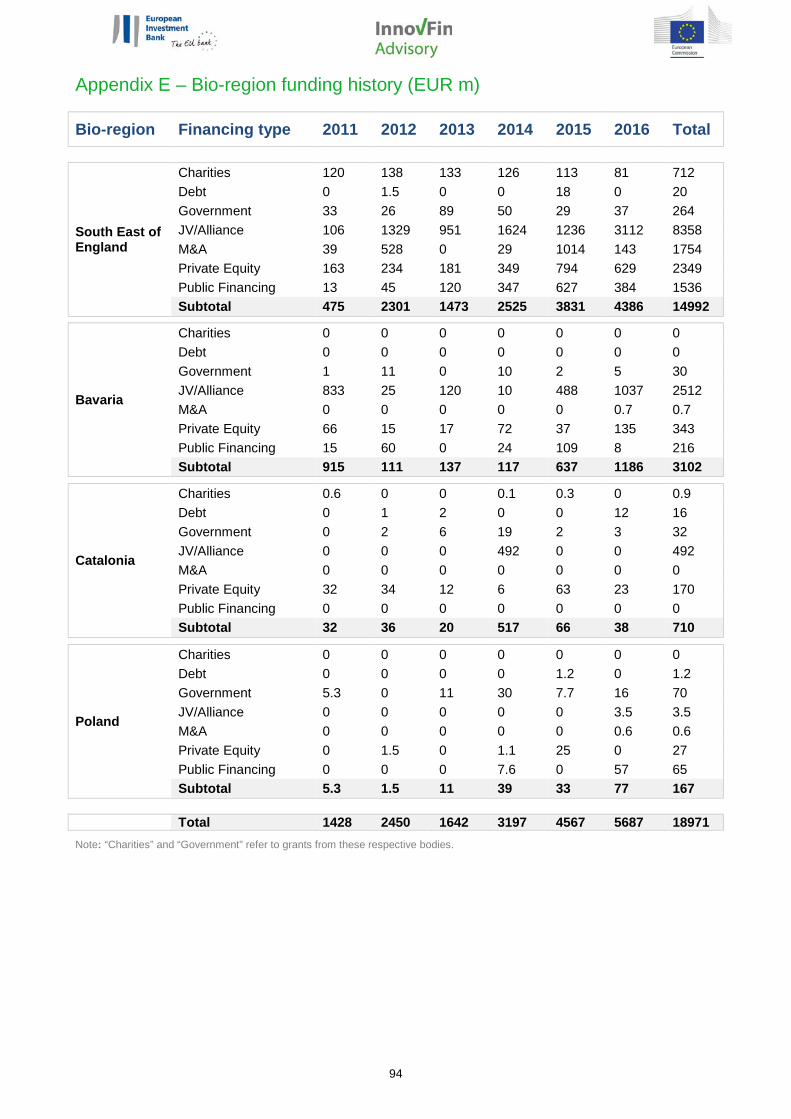
94
Appendix E – Bio-region funding history (EUR m)
Bio-region Financing type 2011 2012 2013 2014 2015 2016 Total
South East of England
Charities 120 138 133 126 113 81 712 Debt 0 1.5 0 0 18 0 20 Government 33 26 89 50 29 37 264 JV/Alliance 106 1329 951 1624 1236 3112 8358 M&A 39 528 0 29 1014 143 1754 Private Equity 163 234 181 349 794 629 2349 Public Financing 13 45 120 347 627 384 1536 Subtotal 475 2301 1473 2525 3831 4386 14992
Bavaria
Charities 0 0 0 0 0 0 0 Debt 0 0 0 0 0 0 0 Government 1 11 0 10 2 5 30 JV/Alliance 833 25 120 10 488 1037 2512 M&A 0 0 0 0 0 0.7 0.7 Private Equity 66 15 17 72 37 135 343 Public Financing 15 60 0 24 109 8 216 Subtotal 915 111 137 117 637 1186 3102
Catalonia
Charities 0.6 0 0 0.1 0.3 0 0.9 Debt 0 1 2 0 0 12 16 Government 0 2 6 19 2 3 32 JV/Alliance 0 0 0 492 0 0 492 M&A 0 0 0 0 0 0 0 Private Equity 32 34 12 6 63 23 170 Public Financing 0 0 0 0 0 0 0 Subtotal 32 36 20 517 66 38 710
Poland
Charities 0 0 0 0 0 0 0 Debt 0 0 0 0 1.2 0 1.2 Government 5.3 0 11 30 7.7 16 70 JV/Alliance 0 0 0 0 0 3.5 3.5 M&A 0 0 0 0 0 0.6 0.6 Private Equity 0 1.5 0 1.1 25 0 27 Public Financing 0 0 0 7.6 0 57 65 Subtotal 5.3 1.5 11 39 33 77 167
Total 1428 2450 1642 3197 4567 5687 18971 Note: “Charities” and “Government” refer to grants from these respective bodies.
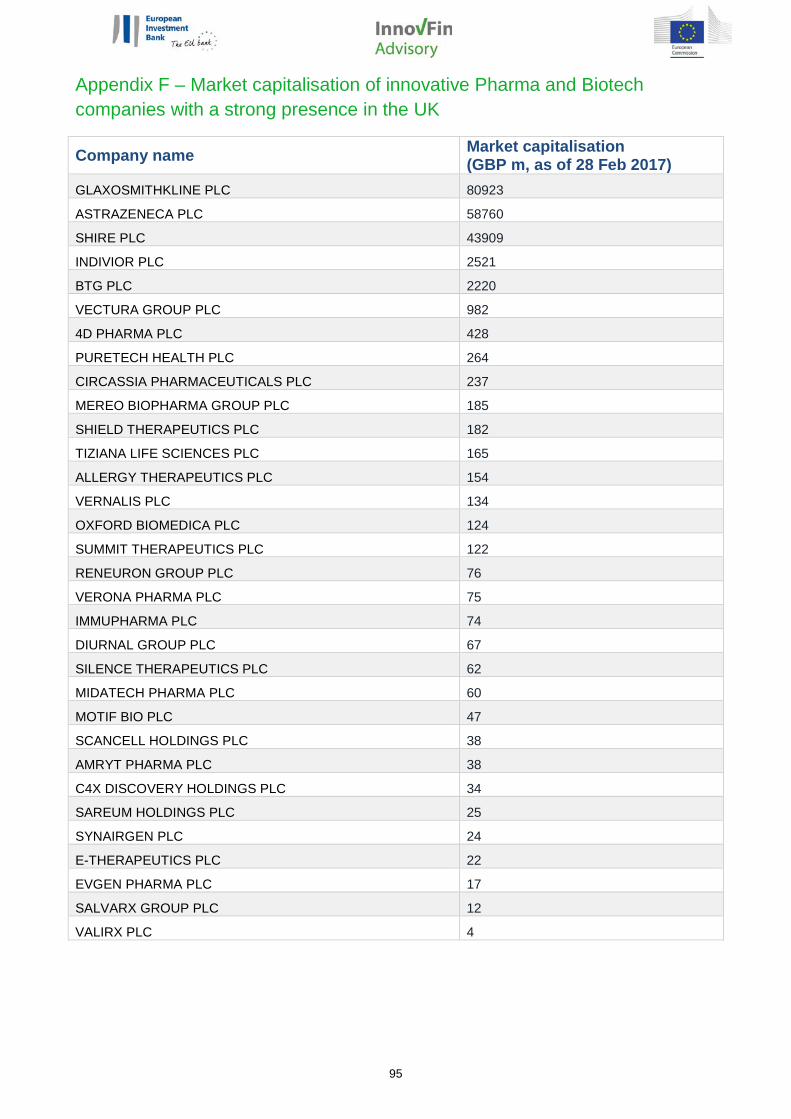
95
Appendix F – Market capitalisation of innovative Pharma and Biotech companies with a strong presence in the UK
Company name Market capitalisation (GBP m, as of 28 Feb 2017)
GLAXOSMITHKLINE PLC 80923
ASTRAZENECA PLC 58760
SHIRE PLC 43909
INDIVIOR PLC 2521
BTG PLC 2220
VECTURA GROUP PLC 982
4D PHARMA PLC 428
PURETECH HEALTH PLC 264
CIRCASSIA PHARMACEUTICALS PLC 237
MEREO BIOPHARMA GROUP PLC 185
SHIELD THERAPEUTICS PLC 182
TIZIANA LIFE SCIENCES PLC 165
ALLERGY THERAPEUTICS PLC 154
VERNALIS PLC 134
OXFORD BIOMEDICA PLC 124
SUMMIT THERAPEUTICS PLC 122
RENEURON GROUP PLC 76
VERONA PHARMA PLC 75
IMMUPHARMA PLC 74
DIURNAL GROUP PLC 67
SILENCE THERAPEUTICS PLC 62
MIDATECH PHARMA PLC 60
MOTIF BIO PLC 47
SCANCELL HOLDINGS PLC 38
AMRYT PHARMA PLC 38
C4X DISCOVERY HOLDINGS PLC 34
SAREUM HOLDINGS PLC 25
SYNAIRGEN PLC 24
E-THERAPEUTICS PLC 22
EVGEN PHARMA PLC 17
SALVARX GROUP PLC 12
VALIRX PLC 4

96
Appendix G – Summary of organisations in scope of study
Bio-region SME Tech Transfer Office
University/ Institute Charity Total
South East of England 133 2 6 1 142
Bavaria 23 0 5 0 28
Catalonia 25 0 3 0 28
Poland 3 0 0 0 3
Total 184 2 14 1 201
Appendix H – Summary of products in development
Bio-region Research project
Pre -clinical Phase I Phase II Phase
III Filed Total South East of England 425 267 89 131 25 4 941
Bavaria 72 71 13 20 2 0 178
Catalonia 49 52 14 13 1 0 129
Poland 14 12 0 0 0 0 26
Total 560 402 116 164 28 4 1274
Appendix I - Total investment by type in Bavaria (2011–2016), EUR m
100 40 8070605030
25
20
15
10
5
019018017090 16015020 140130120110100
Publ
ic F
inan
cing JV & Alliance
Average Investment Size (EUR M)
Grants
Ange
l & S
eed
M&A
Oth
er P
rivat
e
Num
ber o
f Tra
nsac
tions
Serie
s A
Serie
s B
Serie
s D-
F
= EUR 3.1BN

97
Appendix J - Total investment by type in Catalonia (2011–2016), EUR m
Appendix K - Total investment by type in Poland (2011–2016), EUR m
200150100 600
31
50 500450400350300 5500
1
2
250
4
5
6
7
0
3
9
10
8
Oth
er P
rivat
eM
&A
JV & Alliance
Debt
Serie
s D-
F
Serie
s B
Serie
s A
Ange
l & S
eed
Grants
Num
ber o
f Tra
nsac
tions
Average Investment Size (EUR M)
Serie
s C
= EUR 0.7BN
44 46 48 54
18
8
52
16
20 30 40100
12
0
14
42383634
10
4
2
3228262422181614128642 50
6
Num
ber o
f Tra
nsac
tions
Other PrivateM&A
JV &
Alli
ance
Public Financing
Deb
tAn
gel &
See
d
Grants
Average Investment Size (EUR M)
= EUR 0.2BN

98
Appendix L - Total investment by type in South East of England (2011–2016), EUR m
300200150 250 750700650
255
50
45
40
35
30
25
20
15
10
5
0
250
260
600550500450400350100500
Average Investment Size (EUR M)
Num
ber o
f Tra
nsac
tions
Oth
er P
rivat
e
M&A
JV & Alliance
Publ
ic F
inan
cing
DebtSeries D-F
Series C
Serie
s B
Serie
s A
Ange
l & S
eed
Grants
= EUR 15.0BN

99
SURVEY OUTCOMES
Survey overview Start date: 31 January 2017 End date: 30 March 2017 Questions: 37 Target audience (type)
Life science companies, investors, industry/ trade associations, other (academia/ research institutes, government and arm’s length organisations, life science consulting firms)
Target audience (geographical area)
Germany, Poland, Spain and UK
Total respondents: Total = 80. Of these 80 respondents, 60 respondents completed the survey directly and 20 responses were manually inputted following interview discussions. These 20 responses cover 17 UK investors, 1 UK government body representative, 1 UK network association representative and 1 Polish life science company.
Section A: Background (tailored by affiliation) 1. What is your affiliation?
Life science companies, investors, industry/ trade associations, academia/ research institutes and others could respond to this question.
Each respondent could choose only ONE of the following responses.
Life science company Investor
Industry / trade association
Academia / research institute
Other Total
29 29 6 5 11 80
2. What type of life science company do you represent?
Life science companies could respond to this question.
Each respondent could choose only ONE of the following responses.
Country Pharmaceuticals Companion diagnostics
Medical devices Other Total
Germany 6 1 7 Poland 3 1 1 5 Spain 7 7 UK 8 1 1 10 Total 24 1 1 3 29
3. Where is your organisation headquartered?
Life science companies, industry/ trade associations, academia/ research institutes and others could respond to this question.
Each respondent could choose only ONE of the following responses.
Affiliation Germany Poland Spain UK Other Total Academia / research institute 2 1 1 1 5 Industry / trade association 1 4 1 6 Life science company 7 5 7 10 29 Other 4 5 1 1 11 Total 13 11 10 16 1 51

100
4. Is your organisation located in one of the following bio-regions?
Life science companies, industry/ trade associations, academia/ research institutes and others could respond to this question.
Each respondent could choose only ONE of the following responses.
Affiliation
Bavaria - Germany
All regions - Poland
Catalonia - Spain
London & SEE - UK Other Total
Academia / research institute
2 1 1 1 5
Industry / trade association
1 4 1 6
Life science company
3 6 4 11 5 29
Other 2 5 1 1 2 11
Total 7 12 7 17 8 51
5. What is the total number of employees in your organisation?
Life science companies, industry/ trade associations, academia/ research institutes and others could respond to this question.
Each respondent could choose only ONE of the following responses.
Affiliation < 20 20-50 50-250 250-500 >3000 Total
Academia / research institute
1 1 3 5
Industry / trade association
3 1 1 1 6
Life science company
13 7 4 5 29
Other 4 1 2 2 9
Total 21 9 7 7 5 49
6. What was your company’s revenue in 2016?
Life science companies could respond to this question.
Each respondent could choose only ONE of the following responses.
Country < EUR 100k EUR 100k - EUR 1m
EUR 1m - EUR 10m
EUR 10m - EUR 50m
Total
Germany 4 1 1 1 7 Poland 4 1 5 Spain 6 1 7 UK 4 2 2 2 10 Total 18 3 4 4 29
7. How many products has your organisation taken to market to date?
Life science companies could respond to this question.
Each respondent could choose only ONE of the following responses.

101
Country None 1-2 3-4 >10 Total Germany 7 7 Poland 4 1 5 Spain 6 1 7 UK 8 2 10 Total 25 2 1 1 29
8. How many products are currently under development at your company?
Life science companies could respond to this question.
Each respondent could choose only ONE of the following responses.
Country None 1-2 3-4 5-6 7-8 9-10 >10 Total Germany 1 5 1 7 Poland 2 1 1 4 Spain 1 2 2 1 1 7 UK 2 3 4 1 10 Total 1 7 11 6 1 1 1 28
9. Which therapeutic areas does your organisation focus on?
Life science companies could respond to this question (total respondents = 29).
Each respondent could choose MULTIPLE responses.
Affiliation Blood
Cardiovascular
Central nervous
system
Endocrine
Gastro-intestinal
Musculoskeletal
Oncology &
im
munom
odulators
Respiratory
Sensory organs
Systemic anti-
infectives
Total
Life science company 2 4 6 1 1 1 20 3 3 9 50
10. At what stage of the drug development cycle is the majority of your pipeline?
Life science companies could respond to this question.
Each respondent could choose only ONE of the following responses.
Affiliation Research / pre-clinical
Early clinical (phase I / IIa)
Late clinical (phase IIb / III)
Total
Germany 5 1 1 7 Poland 5 5 Spain 3 3 1 7 UK 4 4 2 10 Total 17 8 4 29
11. What type of investment organisation do you represent?
Investors could respond to this question.
Each respondent could choose only ONE of the following responses.
Venture capital / private equity fund
Angel, seed investor / TTO
Bank (commercial)
Corporate Other Total
18 3 1 3 4 29
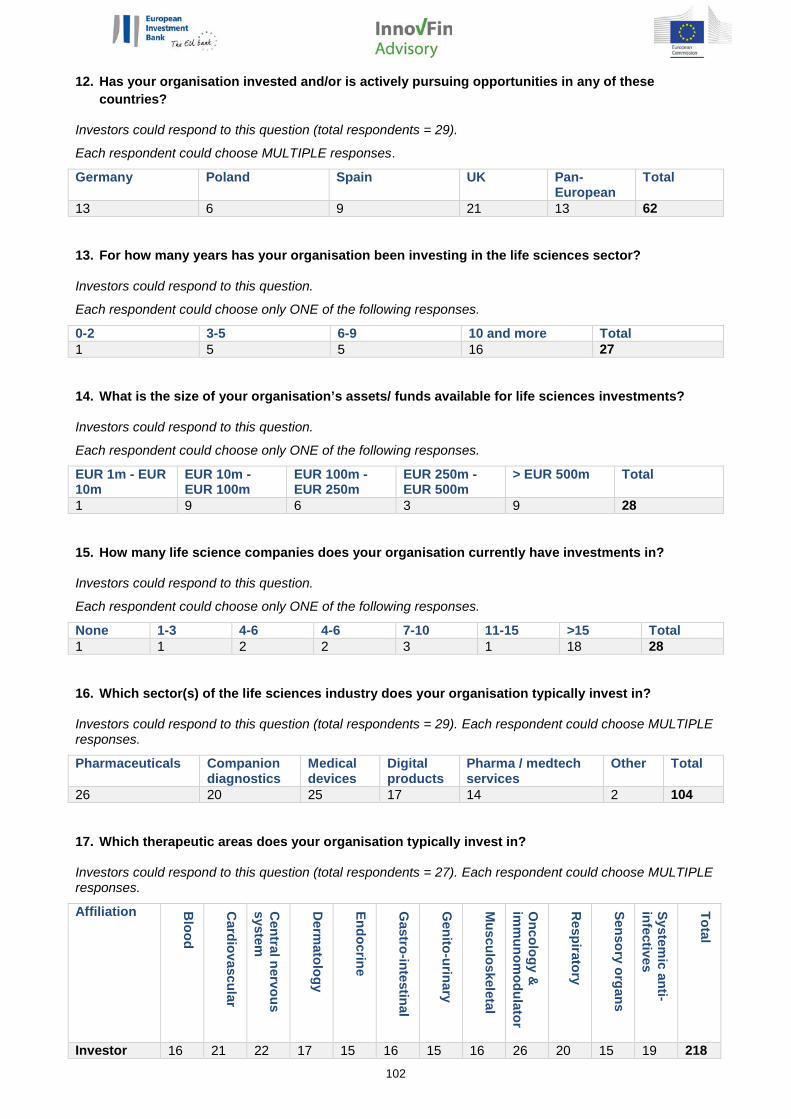
102
12. Has your organisation invested and/or is actively pursuing opportunities in any of these countries?
Investors could respond to this question (total respondents = 29).
Each respondent could choose MULTIPLE responses.
Germany Poland Spain UK Pan-European
Total
13 6 9 21 13 62
13. For how many years has your organisation been investing in the life sciences sector?
Investors could respond to this question.
Each respondent could choose only ONE of the following responses.
0-2 3-5 6-9 10 and more Total 1 5 5 16 27
14. What is the size of your organisation’s assets/ funds available for life sciences investments?
Investors could respond to this question.
Each respondent could choose only ONE of the following responses.
EUR 1m - EUR 10m
EUR 10m - EUR 100m
EUR 100m - EUR 250m
EUR 250m - EUR 500m
> EUR 500m Total
1 9 6 3 9 28
15. How many life science companies does your organisation currently have investments in?
Investors could respond to this question.
Each respondent could choose only ONE of the following responses.
None 1-3 4-6 4-6 7-10 11-15 >15 Total 1 1 2 2 3 1 18 28
16. Which sector(s) of the life sciences industry does your organisation typically invest in?
Investors could respond to this question (total respondents = 29). Each respondent could choose MULTIPLE responses.
Pharmaceuticals Companion diagnostics
Medical devices
Digital products
Pharma / medtech services
Other Total
26 20 25 17 14 2 104
17. Which therapeutic areas does your organisation typically invest in?
Investors could respond to this question (total respondents = 27). Each respondent could choose MULTIPLE responses.
Affiliation Blood
Cardiovascular
Central nervous
system
Derm
atology
Endocrine
Gastro-intestinal
Genito-urinary
Musculoskeletal
Oncology &
im
munom
odulator Respiratory
Sensory organs
Systemic anti-
infectives
Total
Investor 16 21 22 17 15 16 15 16 26 20 15 19 218
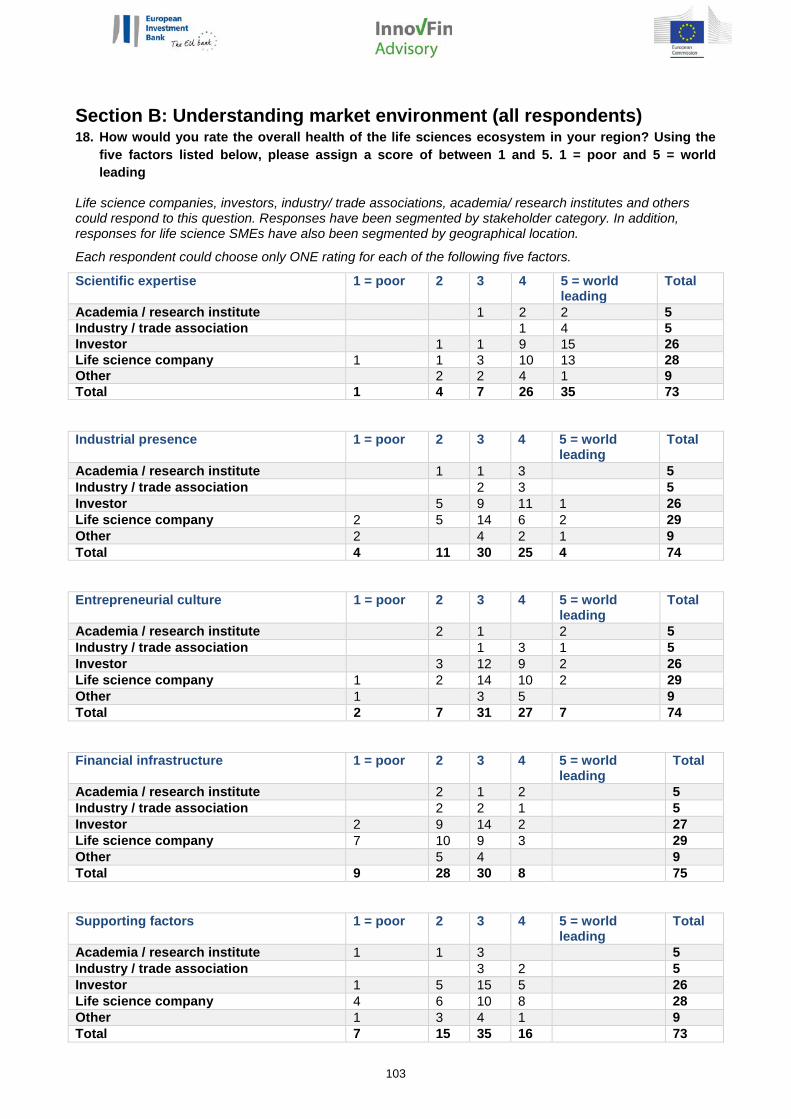
103
Section B: Understanding market environment (all respondents) 18. How would you rate the overall health of the life sciences ecosystem in your region? Using the
five factors listed below, please assign a score of between 1 and 5. 1 = poor and 5 = world leading
Life science companies, investors, industry/ trade associations, academia/ research institutes and others could respond to this question. Responses have been segmented by stakeholder category. In addition, responses for life science SMEs have also been segmented by geographical location.
Each respondent could choose only ONE rating for each of the following five factors.
Scientific expertise 1 = poor 2 3 4 5 = world leading
Total
Academia / research institute 1 2 2 5 Industry / trade association 1 4 5 Investor 1 1 9 15 26 Life science company 1 1 3 10 13 28 Other 2 2 4 1 9 Total 1 4 7 26 35 73
Industrial presence 1 = poor 2 3 4 5 = world leading
Total
Academia / research institute
1 1 3
5 Industry / trade association
2 3
5
Investor
5 9 11 1 26 Life science company 2 5 14 6 2 29 Other 2
4 2 1 9
Total 4 11 30 25 4 74
Entrepreneurial culture 1 = poor 2 3 4 5 = world leading
Total
Academia / research institute 2 1 2 5 Industry / trade association 1 3 1 5 Investor 3 12 9 2 26 Life science company 1 2 14 10 2 29 Other 1 3 5 9 Total 2 7 31 27 7 74
Financial infrastructure 1 = poor 2 3 4 5 = world leading
Total
Academia / research institute 2 1 2 5 Industry / trade association 2 2 1 5 Investor 2 9 14 2 27 Life science company 7 10 9 3 29 Other 5 4 9 Total 9 28 30 8 75
Supporting factors 1 = poor 2 3 4 5 = world leading
Total
Academia / research institute 1 1 3 5 Industry / trade association 3 2 5 Investor 1 5 15 5 26 Life science company 4 6 10 8 28 Other 1 3 4 1 9 Total 7 15 35 16 73
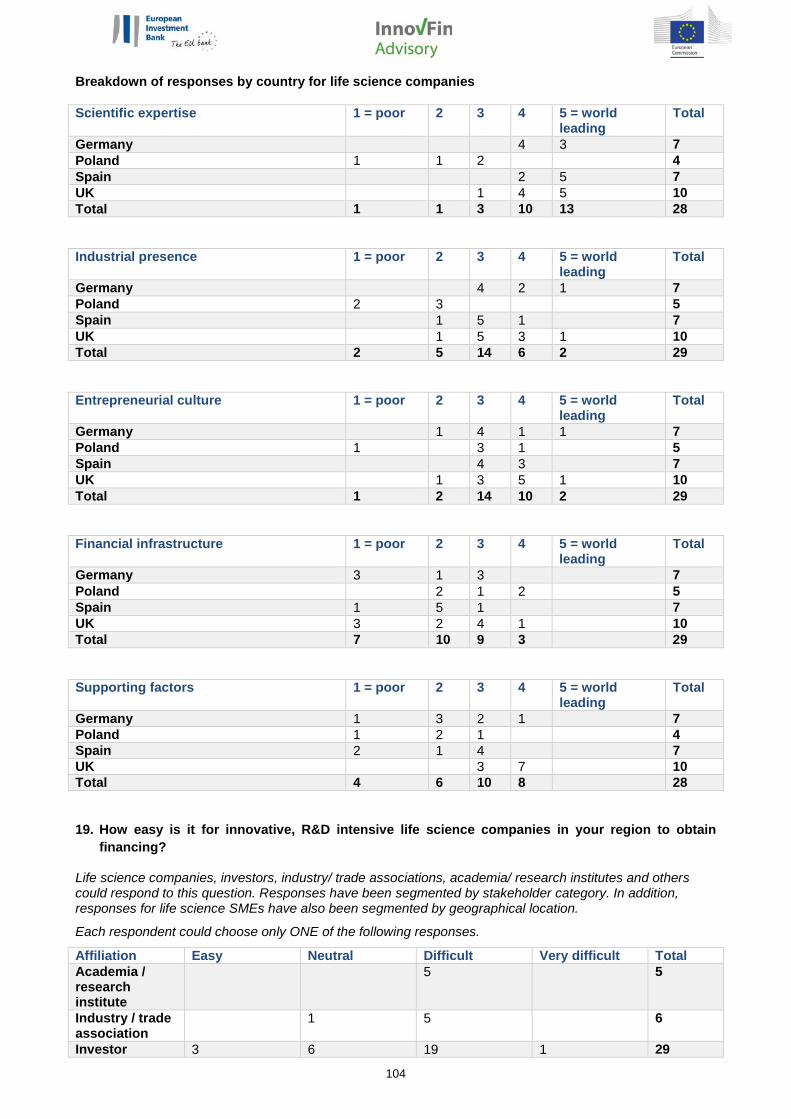
104
Breakdown of responses by country for life science companies
Scientific expertise 1 = poor 2 3 4 5 = world leading
Total
Germany 4 3 7 Poland 1 1 2 4 Spain 2 5 7 UK 1 4 5 10 Total 1 1 3 10 13 28
Industrial presence 1 = poor 2 3 4 5 = world leading
Total
Germany 4 2 1 7 Poland 2 3 5 Spain 1 5 1 7 UK 1 5 3 1 10 Total 2 5 14 6 2 29
Entrepreneurial culture 1 = poor 2 3 4 5 = world leading
Total
Germany 1 4 1 1 7 Poland 1 3 1 5 Spain 4 3 7 UK 1 3 5 1 10 Total 1 2 14 10 2 29
Financial infrastructure 1 = poor 2 3 4 5 = world leading
Total
Germany 3 1 3 7 Poland 2 1 2 5 Spain 1 5 1 7 UK 3 2 4 1 10 Total 7 10 9 3 29
Supporting factors 1 = poor 2 3 4 5 = world leading
Total
Germany 1 3 2 1 7 Poland 1 2 1 4 Spain 2 1 4 7 UK 3 7 10 Total 4 6 10 8 28
19. How easy is it for innovative, R&D intensive life science companies in your region to obtain financing?
Life science companies, investors, industry/ trade associations, academia/ research institutes and others could respond to this question. Responses have been segmented by stakeholder category. In addition, responses for life science SMEs have also been segmented by geographical location.
Each respondent could choose only ONE of the following responses.
Affiliation Easy Neutral Difficult Very difficult Total Academia / research institute
5 5
Industry / trade association
1 5 6
Investor 3 6 19 1 29

105
Life science company
1 7 15 6 29
Other 1 2 5 1 9 Total 5 16 49 8 78
Breakdown of responses by country for life science companies
Country Easy Neutral Difficult Very difficult Total Germany 4 3 7 Poland 1 2 2 5 Spain 2 4 1 7 UK 3 5 2 10
20. How would you rate the availability of funding for innovative life science companies in your region today vs. three years ago?
Life science companies, investors, industry/ trade associations, academia/ research institutes and others could respond to this question. Responses have been segmented by stakeholder category. In addition, responses for life science SMEs have also been segmented by geographical location.
Each respondent could choose only ONE of the following responses.
Affiliation Much lower today
Lower today Same today Higher today
Much higher today
Total
Academia / research institute
3 2 5
Industry / trade association
1 1 4 6
Investor 3 7 18 1 29 Life science company
2 2 12 11 1 28
Other 4 5 9 Total 2 6 27 40 2 77
Breakdown of responses by country for life science companies
Country Much lower today
Lower today Same today Higher today
Much higher today
Total
Germany 1 4 2 7 Poland 4 4 Spain 1 3 2 1 7 UK 1 1 5 3 10 Total 2 2 12 11 1 28
Section C: Additional considerations (tailored by affiliation) 21. To date, what have been the main sources of funding for your company?
Life science companies could respond to this question (total respondents = 29).
Each respondent could choose MULTIPLE responses.
Country Ow
n funds
Angel, seed
funding or TTO
s
Grants
Venture capital or private equity
Corporate
partnerships
Debt
(comm
ercial)
Debt
(from public
sources)
Capital
markets
Other
Total

106
Germany 1 2 5 5 2 1 1 1 18 Poland 5 1 5 2 1 1 15 Spain 5 5 4 4 1 1 2 1 2 25 UK 1 3 5 5 5 2 5 26 Total 12 11 19 16 8 3 3 8 4 84
22. Approximately how much funding from these sources has your company received in the last three years?
Life science companies could respond to this question.
Each respondent could choose only ONE of the following responses.
Country < EUR 500k
EUR 500k - EUR 2m
EUR 2m - EUR 10m
EUR 10m - EUR 50m
EUR 50m - EUR 200m
> EUR 200m
Total
Germany 1 1 2 3 7 Poland 2 2 4 Spain 2 2 3 7 UK 1 2 1 4 2 10 Total 1 4 8 9 4 2 28
23. Was this sufficient to cover your financing needs in the last three years?
Life science companies could respond to this question.
Each respondent could choose only ONE of the following responses.
Country No Yes Total Germany 1 6 7 Poland 1 3 4 Spain 4 3 7 UK 3 7 10 Total 9 19 28
24. What are your company's funding needs for the next three years?
Life science companies could respond to this question.
Each respondent could choose only ONE of the following responses.
Country < EUR 500k
EUR 500k - EUR 2m
EUR 2m - EUR 10m
EUR 10m - EUR 50m
EUR 50m - EUR 200m
> EUR 200m
Total
Germany 1 3 3 7 Poland 2 1 1 1 5 Spain 1 4 1 1 7 UK 1 1 4 2 2 10 Total 1 4 9 9 4 2 29
25. What would be your preferred funding instruments to cover these needs?
Life science companies could respond to this question (total respondents = 29).
Each respondent could choose MULTIPLE responses.
Country Ow
n funds
Angel, seed,
TTO
Grants
Venture capital or private equity
Royalty
financing
Corporate
partnerships
Debt
(comm
ercial)
Debt (from
public sources)
Capital m
arkets
Other
Total
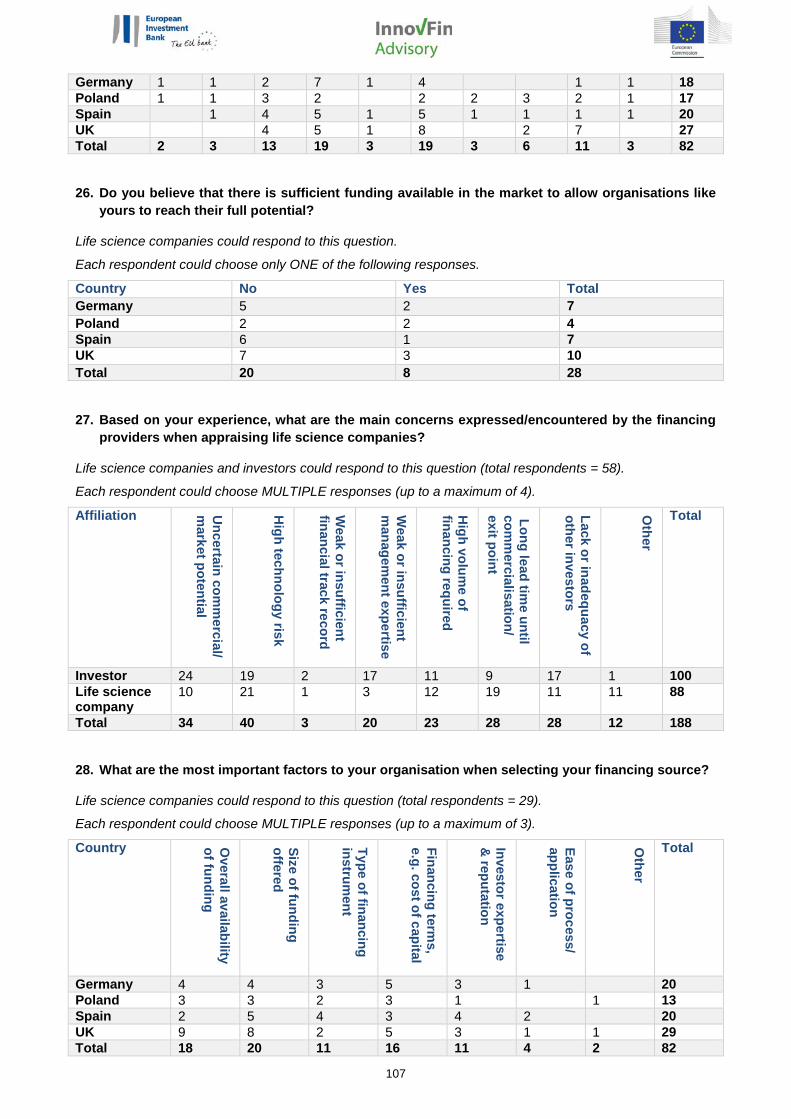
107
Germany 1 1 2 7 1 4 1 1 18 Poland 1 1 3 2 2 2 3 2 1 17 Spain 1 4 5 1 5 1 1 1 1 20 UK 4 5 1 8 2 7 27 Total 2 3 13 19 3 19 3 6 11 3 82
26. Do you believe that there is sufficient funding available in the market to allow organisations like yours to reach their full potential?
Life science companies could respond to this question.
Each respondent could choose only ONE of the following responses.
Country No Yes Total Germany 5 2 7 Poland 2 2 4 Spain 6 1 7 UK 7 3 10 Total 20 8 28
27. Based on your experience, what are the main concerns expressed/encountered by the financing providers when appraising life science companies?
Life science companies and investors could respond to this question (total respondents = 58).
Each respondent could choose MULTIPLE responses (up to a maximum of 4).
Affiliation Uncertain com
mercial/
market potential
High technology risk
Weak or insufficient
financial track record
Weak or insufficient
managem
ent expertise
High volum
e of financing required
Long lead time until
comm
ercialisation/ exit point
Lack or inadequacy of other investors
Other
Total
Investor 24 19 2 17 11 9 17 1 100 Life science company
10 21 1 3 12 19 11 11 88
Total 34 40 3 20 23 28 28 12 188
28. What are the most important factors to your organisation when selecting your financing source?
Life science companies could respond to this question (total respondents = 29).
Each respondent could choose MULTIPLE responses (up to a maximum of 3).
Country Overall availability
of funding
Size of funding offered
Type of financing instrum
ent
Financing terms,
e.g. cost of capital
Investor expertise &
reputation
Ease of process/ application
Other
Total
Germany 4 4 3 5 3 1 20 Poland 3 3 2 3 1 1 13 Spain 2 5 4 3 4 2 20 UK 9 8 2 5 3 1 1 29 Total 18 20 11 16 11 4 2 82

108
29. What is your awareness of the European Investment Bank and the European Investment Fund?
Life science companies, investors, industry/ trade associations, academia/ research institutes and others could respond to this question. Responses have been segmented by stakeholder category. In addition, responses for life science SMEs have also been segmented by geographical location.
Each respondent could choose only ONE of the following responses.
Affiliation Attem
pted to do business w
ith in the past but did not succeed
Good aw
areness but irrelevant to m
y business
No aw
areness
Some aw
areness but no detailed know
ledge
Successfully done business w
ith in the past
Unsuccessfully
applied for funding
Total
Academia / research institute
5 5
Industry / trade association
6 6
Investor 4 16 8 28 Life science company
1 3 22 3 29
Other 1 5 1 7 Total 4 2 3 54 9 3 75
Breakdown of responses by country for life science companies
Country
Attem
pted to do business w
ith in the past but did not succeed
Good aw
areness but irrelevant to m
y business
No aw
areness
Some
awareness but
no detailed know
ledge
Successfully done business w
ith in the past
Unsuccessfully
applied for funding
Total
Germany 5 2 7 Poland 1 4 5 Spain 1 5 1 7 UK 1 1 8 10 Total 1 3 22 3 29
30. What type of financing does your organisation typically provide?
Investors could respond to this question (total respondents = 29).
Each respondent could choose MULTIPLE responses.
Angel, seed funding or TTO
Grants VC or PE Royalty financing
Debt (commercial)
Capital markets
Other Total
8 4 23 2 2 1 1 41
31. What is the typical size of your investment?
Investors could respond to this question (total respondents = 27). Each respondent could choose MULTIPLE responses.
< EUR 100k
EUR 100k - EUR 500k
EUR 500k - EUR 2m
EUR 2m - EUR 10m
EUR 10m - EUR 50m
EUR 50m - EUR 100m
> EUR 100m
Total
2 8 14 19 9 2 1 55

109
32. What is the typical duration of your investment?
Investors could respond to this question (total respondents = 27).
Each respondent could choose MULTIPLE responses.
0 - 3 years 4 -6 years 7 - 10 years Total 8 24 9 41
33. At what stage must a life science company’s (a) most advanced asset and/or (b) major asset be at for you to invest in the company?
Investors could respond to this question.
Each respondent could choose only ONE of the following responses.
Early clinical (phase I / IIa)
Late clinical (phase IIb / III)
Research / pre-clinical
Total
11 1 15 27
34. In your opinion, what are the sources of funding where you perceive the biggest mismatch between demand and supply (i.e. not enough funding in the market) for R&D-intensive life science companies?
Investors, industry/ trade associations, academia/ research institutes and others could respond to this question (total respondents = 48).
Each respondent could choose MULTIPLE responses (up to a maximum of three).
Affiliation Angel, seed
funding or TTO
Grants
Venture capital or private equity
Royalty
financing
Corporate
partnerships
Debt
(comm
ercial)
Debt (from
public sources)
Capital m
arkets
Other
Total
Academia / research institute
3 1 3 1 1 1 3 13
Industry / trade association
1 2 5 1 2 11
Investor 11 3 20 1 3 4 4 17 1 64 Other 6 9 1 2 2 4 2 26 Total 21 6 37 2 4 8 7 26 3 114
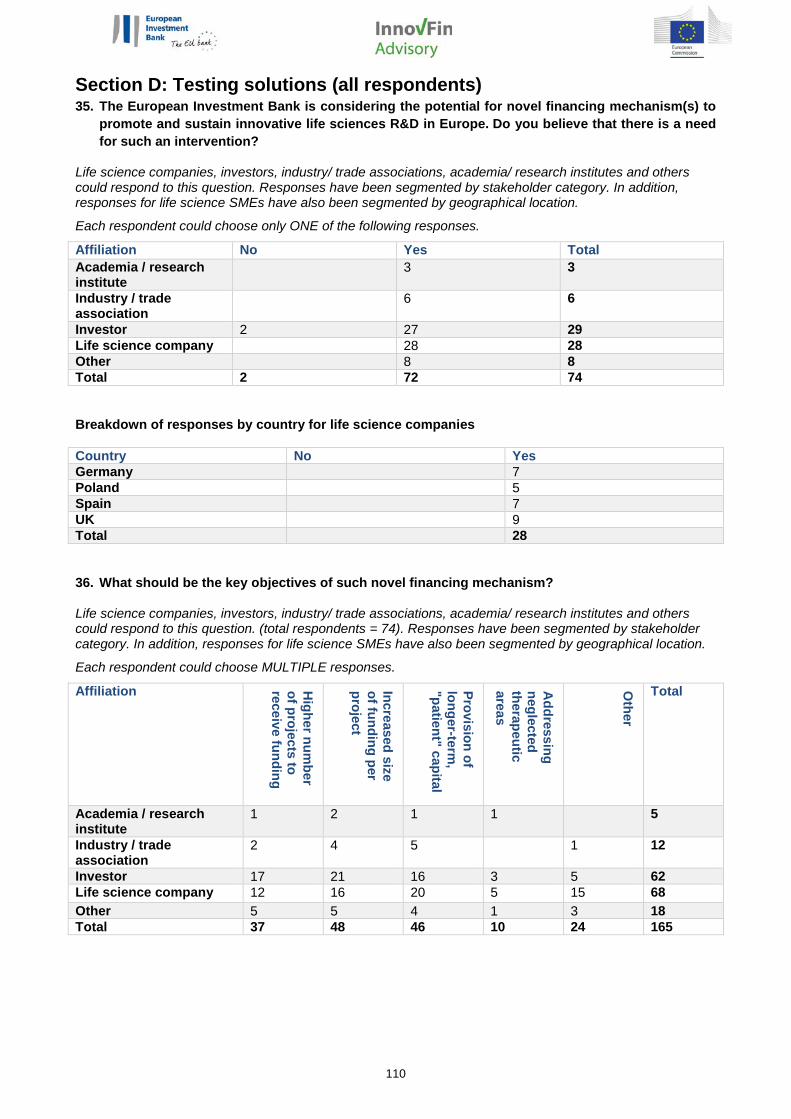
110
Section D: Testing solutions (all respondents) 35. The European Investment Bank is considering the potential for novel financing mechanism(s) to
promote and sustain innovative life sciences R&D in Europe. Do you believe that there is a need for such an intervention?
Life science companies, investors, industry/ trade associations, academia/ research institutes and others could respond to this question. Responses have been segmented by stakeholder category. In addition, responses for life science SMEs have also been segmented by geographical location.
Each respondent could choose only ONE of the following responses.
Affiliation No Yes Total Academia / research institute
3 3
Industry / trade association
6 6
Investor 2 27 29 Life science company 28 28 Other 8 8 Total 2 72 74
Breakdown of responses by country for life science companies
Country No Yes Germany 7 Poland 5 Spain 7 UK 9 Total 28
36. What should be the key objectives of such novel financing mechanism?
Life science companies, investors, industry/ trade associations, academia/ research institutes and others could respond to this question. (total respondents = 74). Responses have been segmented by stakeholder category. In addition, responses for life science SMEs have also been segmented by geographical location.
Each respondent could choose MULTIPLE responses.
Affiliation Higher num
ber of projects to receive funding
Increased size of funding per project
Provision of longer-term
, "patient" capital
Addressing
neglected therapeutic areas
Other
Total
Academia / research institute
1 2 1 1 5
Industry / trade association
2 4 5 1 12
Investor 17 21 16 3 5 62 Life science company 12 16 20 5 15 68 Other 5 5 4 1 3 18 Total 37 48 46 10 24 165

111
Breakdown of responses by country for life science companies
Country
Higher num
ber of projects to receive funding
Increased size of funding per project
Provision of longer-term
, "patient" capital
Addressing
neglected therapeutic areas
Other
Total
Germany 2 3 4 2 5 16 Poland 2 1 5 4 12 Spain 5 5 2 1 4 17 UK 3 7 9 2 2 23 Total 12 16 20 5 15 68
37. At what stage across the drug development cycle do you believe the need for additional financing to be the most acute?
Life science companies, investors, industry/ trade associations, academia/ research institutes and others could respond to this question. (total respondents = 71). Responses have been segmented by stakeholder category. In addition, responses for life science SMEs have also been segmented by geographical location.
Each respondent could choose MULTIPLE responses
Affiliation Research / pre-clinical
Early clinical (Phase I / IIa)
Late clinical (Phase IIb / III)
Total
Academia / research institute
2 2
Industry / trade association
2 4 4 10
Investor 13 12 18 43 Life science company
19 20 9 48
Other 2 7 3 12 Total 36 45 34 115
Breakdown of responses by country for life science companies
Country Research / pre-clinical
Early clinical (Phase I / IIa)
Late clinical (Phase IIb / III)
Total
Germany 5 5 2 12 Poland 5 3 8 Spain 4 5 2 11 UK 5 7 5 17 Total 19 20 9 48


Information Desk3 +352 4379-220005 +352 4379-62000U [email protected]
European Investment Bank98-100, boulevard Konrad AdenauerL-2950 Luxembourg3 +352 4379-15 +352 437704www.eib.org
© European Investment Bank, 04/2018 ENprint: QH-BG-18-004-EN-C ISBN 978-92-861-3600-9 ISSN 2599-7068 doi:10.2867/685453digital: QH-BG-18-004-EN-N ISBN 978-92-861-3599-6 ISSN 2599-7076 doi:10.2867/515571