financing the energy transition: are world bank, … · ifc, and adb energy supply investments...
TRANSCRIPT

WORKING PAPER | May 2017 | 1
WORKING PAPER
FINANCING THE ENERGY TRANSITION: ARE WORLD BANK, IFC, AND ADB ENERGY SUPPLY INVESTMENTS SUPPORTING A LOW-CARBON FUTURE?GIULIA CHRISTIANSON, ALLISON LEE, GAIA LARSEN, AND ASHLEY GREEN
CONTENTSExecutive Summary ............................................. 1 1. Introduction ................................................... .52. Methodology ................................................. .83. Review of MDB Activities ....................................154. Conclusions and Policy Implications ..................... 38Appendix A ......................................................41Appendix B ..................................................... 42Appendix C ..................................................... 42Appendix D ..................................................... 43References ..................................................... 44Endnotes ....................................................... 47
Suggested Citation: Christianson, G., A. Lee, G. Larsen, A. Green. 2017. “Financing the Energy Transition: Whether World Bank, IFC, and ADB Energy Supply Investments Are Supporting a Low-carbon, Sustainable Future.” Working Paper. Washington, DC: World Resources Institute. Available online at [http://www.wri.org/publication/financing-the-energy-transition].
Working Papers contain preliminary research, analysis, findings, and recommendations. They are circulated to stimulate timely discussion and critical feedback, and to influence ongoing debate on emerging issues. Working papers may eventually be published in another form and their content may be revised.
EXECUTIVE SUMMARYHighlights
▪ Finance provided and catalyzed by multilateral development banks (MDBs) will help pay for implementation of the UN Sustainable Development Goals and the Paris Climate Agreement in many developing countries.
▪ Although MDBs already track and report on their climate finance, less is known about how invest-ments across their entire energy supply portfolios relate to achieving sustainable development and climate-change objectives.
▪ This report provides a first-cut assessment of how the energy supply investments of the World Bank, International Finance Corporation (IFC), and Asian Development Bank (ADB) align with the Paris Agreement goal to limit global temperature rise to well below 2°C.
▪ The majority of projects considered in our analysis are 2°C-aligned or could be aligned under the right conditions; getting the conditions right will be key to achieving a low-carbon future.
▪ Our analysis raises important policy questions for MDB shareholders, including the Group of Seven (G7), and for MDB management. These include how best to promote the deployment of technologies that are unambiguously aligned with 2°C scenarios, how to put in place the conditions that foster alignment with such scenarios, whether and how to deploy energy supply technologies that remain controversial, and how to manage the risk of technologies that lock in high- carbon energy generation for long time periods.

2 |
Financing the Energy Transition
IntroductionDeveloping economies will require large-scale infrastructure investments to achieve Sustain-able Development Goals (SDGs) and the Paris Agreement. The New Climate Economy report esti-mates suggest that the world will need to invest $90 trillion in new and replacement infrastructure by 2030, whether under a business-as-usual growth pathway or a low-carbon pathway. Overall, this will require $6 tril-lion a year, about double current levels of investment. About 70 percent of such investment will be needed in developing countries; of this, roughly 30 percent in the energy sector (NCE 2017).
Evidence suggests that urgent action is needed to keep the worst impacts of climate change at bay and secure a sustainable future. Recent assessments indicate that we are not on an adequate trajectory to reduce emissions in line with a 2°C path-way, let alone a 1.5°C pathway, even accounting for the impacts of Nationally Determined Contributions (NDCs) (UNEP 2016). Emissions reductions are needed across economic sec tors: energy, agriculture, forestry and land use, industry, transportation, and buildings (IPCC 2014).
MDB leadership recognizes the centrality of climate change to the development agenda. MDBs support low-carbon sustainable development, while pursuing a range of economic, social, and environmental objectives. They also play a critical role in catalyzing infrastructure finance and promoting enabling environments for private investment in low- and middle-income countries. Over the last several years, MDBs provided an average of $15.5 billion per year in climate finance and mobilized $7.4 billion in private cofinancing (OECD 2015). In October 2015 in Lima, Peru, the MDBs set climate finance targets for 2020 to scale up their climate finance investments.
Despite this progress, less is known about whether the broader portfolios of the MDBs are consistent with pathways to limit global temperature rise this century to well below 2°C above pre-industrial levels. In 2015, climate-related investments accounted for less than a quarter of MDBs’ commitments that year.1 To strategically align resources toward a below 2°C goal, it is important to look beyond the climate finance portion of MDB portfolios.
About This PaperThis study offers a first-cut examination of the extent to which MDBs are supporting the objectives of the Paris Agreement and the
SDGs. The authors of this study do so by providing an initial assessment of whether a sub-sample of MDBs are financing energy-supply infrastructure that is consistent with pathways that limit warming to below 2°C. The research scope focuses on the energy supply sector, which is defined by the Intergovernmental Panel on Climate Change (IPCC) as all energy extraction, conversion, storage, transmission, and distribution processes that deliver final energy to the end-use sectors. The energy supply sector is the largest contributor to greenhouse gas emissions (GHGs), responsible for about 35 percent of total anthropogenic GHGs (IPCC 2014).
We focus on the World Bank (IBRD/IDA), International Finance Corporation (IFC), and Asian Development Bank (ADB). According to a recent study, the World Bank, the IFC, and the ADB provided the most Official Development Finance (ODF) for infrastructure among MDBs in 2014, accounting for about a third of the total (Miyamoto and Chiofalo 2016). We based our analysis on publicly disclosed data on more than 400 energy supply-related projects approved by the banks’ executive boards in 2015 and 2016, as well as those in the project pipeline as of the end of 2016.
We use an existing framework, developed by NewClimate Institute, 2 Degrees Investing Initiative, and GermanWatch (Höhne et al. 2015), to categorize investments as aligned, conditional, misaligned, or controversial, based on their compatibility with a range of 2°C scenarios. We chose this framework because it was developed specifically to help public financial institutions align their investments with 2°C-compatible pathways. The framework is based on a review of multiple scenarios. As a result, it embeds a recognition that multiple pathways can limit global temperature rise to below 2°C. This approach allows for a more nuanced consideration of conditional aspects of investment decisions that are highly relevant in a development finance context.
The aligned category includes technologies and invest-ment areas that are compatible with a 2°C pathway in all of the reviewed scenarios. These are mainly renewables, plus solutions like battery storage. The conditional category includes technologies and investment areas that are compatible with 2°C pathways in all reviewed scenarios, but only under the right conditions. Natural gas-fired power or electricity transmission and distribu-tion, for example, fall in this category. The misaligned category includes technologies and investment areas where there is broad agreement on incompatibility

WORKING PAPER | May 2017 | 3
Financing the Energy Transition
across the reviewed scenarios, such as new coal-fired power plants with unabated emissions over their lifetime (no carbon capture and storage [CCS]) or new coal production. The controversial category consists of technologies and investment areas that were aligned in some scenarios but not others, sometimes because of significant environmental and social risks/tradeoffs. This includes investments in large hydropower, oil and gas production, and CCS technologies.
Key FindingsThe World Bank, IFC, and ADB support a range of technology options—including but not limited to “aligned” technologies—to help countries supply energy to their populations in a manner that is consistent with 2°C pathways. Conditional technologies account for the largest share of energy sup-ply infrastructure investments by project number and volume of finance, as highlighted in Figure ES1. This is not, in itself, problematic. The IPCC notes that no single option is sufficient to reduce CO2-equivalent concentra-tions and eventually eliminate net CO2 emissions (IPCC 2014). Technologies categorized as conditional have a significant role to play in the low-carbon transition, but only if they are designed and implemented properly and
with the right strategies and policies in place to ensure that they fit with NDCs and enhance countries’ ability to ramp up their ambitions over time. This is particularly relevant for MDBs as they work with their clients to explore the full range of possibilities to achieve sustain-able growth and poverty reduction.
Investments in electricity transmission and distribution (T&D), vital to a low-carbon future, account for the highest share of the World Bank and ADB’s recent and planned financing for energy supply, around half of the volume of financing and about 40 percent of the number of projects in both banks. Well-functioning and managed T&D systems are needed to bring renewables onto the grid and increase efficiency in both the delivery and end use of energy (i.e., through smart-grid technologies) (IPCC 2014). Invest-ments in these areas, while “conditional” according to the framework, are necessary to achieve low-carbon growth and could reap benefits down the road if energy systems incorporate a greater proportion of renewable energy and increased energy efficiency. Investments in T&D provide a good illustration of how conditional proj-ects may in fact be well aligned with 2-degree pathways; in this case, the “conditional” categorization serves more as a reminder of the urgent need to decarbonize the electricity grid as it expands and becomes more efficient.
Figure ES-1 | Share of World Bank, International Finance Corporation, and Asian Development Bank Energy Supply Infrastructure Investments across 2-Degree Alignment Categories (Based on Projects Approved in 2015, 2016, or in the Pipeline as of the End of 2016)
Notes: Project numbers include projects funded by own resources as well as administered trust funds. Finance figures are estimates of own resources invested at the energy supply component level (within a project), based on information available through project documents or project pages. Only includes infrastructure investments. See Methodology for further details on categories. Source: WRI, based on raw data from World Bank, IFC, and ADB project databases using 2-degree alignment framework from Höhne et al. (2015), adapted by WRI in 2017 in collaboration with the NewClimate Institute.
WB
IFC
ADB
WB
IFC
ADB
Share of energy supply projects (%) Share of energy supply finance (%)
0% 20% 40% 60% 80% 100%0% 20% 40% 60% 80% 100%
Aligned Conditional Misaligned Controversial
A. NUMBER OF PROJECTS B. ESTIMATED VOLUME OF FINANCE
4 |
Financing the Energy Transition
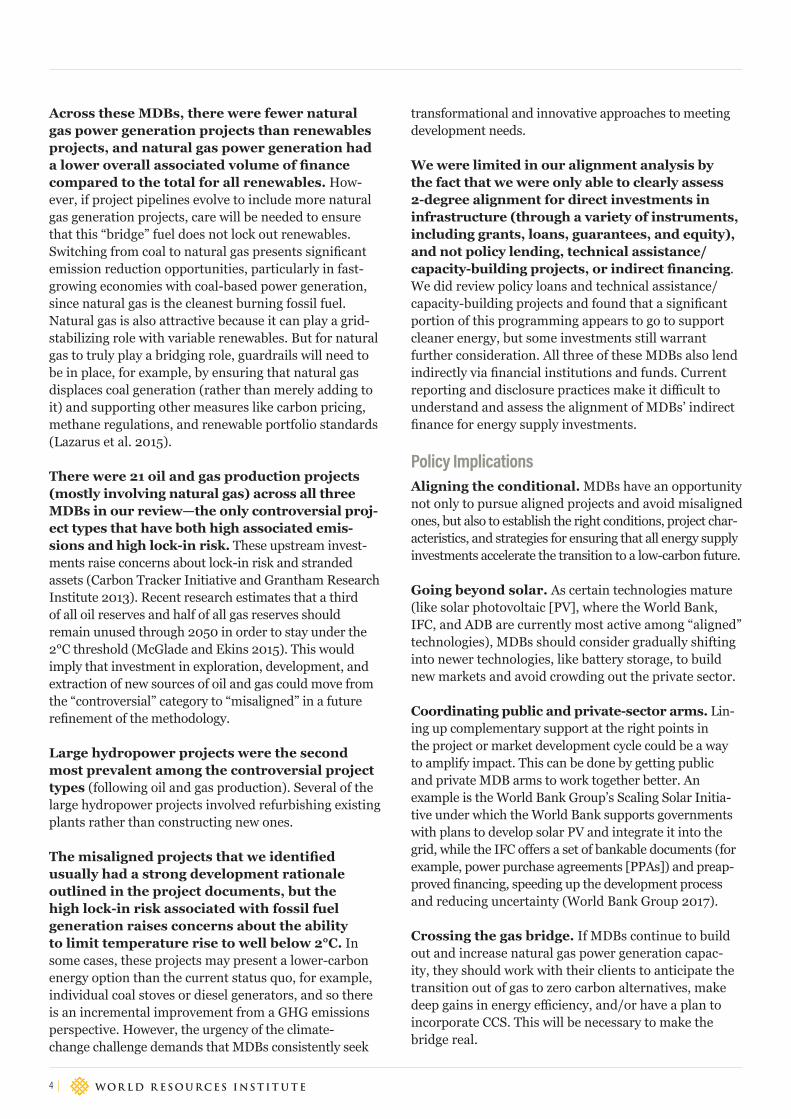
Across these MDBs, there were fewer natural gas power generation projects than renewables projects, and natural gas power generation had a lower overall associated volume of finance compared to the total for all renewables. How-ever, if project pipelines evolve to include more natural gas generation projects, care will be needed to ensure that this “bridge” fuel does not lock out renewables. Switching from coal to natural gas presents significant emission reduction opportunities, particularly in fast-growing economies with coal-based power generation, since natural gas is the cleanest burning fossil fuel. Natural gas is also attractive because it can play a grid-stabilizing role with variable renewables. But for natural gas to truly play a bridging role, guardrails will need to be in place, for example, by ensuring that natural gas displaces coal generation (rather than merely adding to it) and supporting other measures like carbon pricing, methane regulations, and renewable portfolio standards (Lazarus et al. 2015).
There were 21 oil and gas production projects (mostly involving natural gas) across all three MDBs in our review—the only controversial proj-ect types that have both high associated emis-sions and high lock-in risk. These upstream invest-ments raise concerns about lock-in risk and stranded assets (Carbon Tracker Initiative and Grantham Research Institute 2013). Recent research estimates that a third of all oil reserves and half of all gas reserves should remain unused through 2050 in order to stay under the 2°C threshold (McGlade and Ekins 2015). This would imply that investment in exploration, development, and extraction of new sources of oil and gas could move from the “controversial” category to “misaligned” in a future refinement of the methodology.
Large hydropower projects were the second most prevalent among the controversial project types (following oil and gas production). Several of the large hydropower projects involved refurbishing existing plants rather than constructing new ones.
The misaligned projects that we identified usually had a strong development rationale outlined in the project documents, but the high lock-in risk associated with fossil fuel generation raises concerns about the ability to limit temperature rise to well below 2°C. In some cases, these projects may present a lower-carbon energy option than the current status quo, for example, individual coal stoves or diesel generators, and so there is an incremental improvement from a GHG emissions perspective. However, the urgency of the climate-change challenge demands that MDBs consistently seek
transformational and innovative approaches to meeting development needs.
We were limited in our alignment analysis by the fact that we were only able to clearly assess 2-degree alignment for direct investments in infrastructure (through a variety of instruments, including grants, loans, guarantees, and equity), and not policy lending, technical assistance/capacity-building projects, or indirect financing. We did review policy loans and technical assistance/capacity-building projects and found that a significant portion of this programming appears to go to support cleaner energy, but some investments still warrant further consideration. All three of these MDBs also lend indirectly via financial institutions and funds. Current reporting and disclosure practices make it difficult to understand and assess the alignment of MDBs’ indirect finance for energy supply investments.
Policy ImplicationsAligning the conditional. MDBs have an opportunity not only to pursue aligned projects and avoid misaligned ones, but also to establish the right conditions, project char-acteristics, and strategies for ensuring that all energy supply investments accelerate the transition to a low-carbon future.
Going beyond solar. As certain technologies mature (like solar photovoltaic [PV], where the World Bank, IFC, and ADB are currently most active among “aligned” technologies), MDBs should consider gradually shifting into newer technologies, like battery storage, to build new markets and avoid crowding out the private sector.
Coordinating public and private-sector arms. Lin-ing up complementary support at the right points in the project or market development cycle could be a way to amplify impact. This can be done by getting public and private MDB arms to work together better. An example is the World Bank Group’s Scaling Solar Initia-tive under which the World Bank supports governments with plans to develop solar PV and integrate it into the grid, while the IFC offers a set of bankable documents (for example, power purchase agreements [PPAs]) and preap-proved financing, speeding up the development process and reducing uncertainty (World Bank Group 2017).
Crossing the gas bridge. If MDBs continue to build out and increase natural gas power generation capac-ity, they should work with their clients to anticipate the transition out of gas to zero carbon alternatives, make deep gains in energy efficiency, and/or have a plan to incorporate CCS. This will be necessary to make the bridge real.

WORKING PAPER | May 2017 | 5
Financing the Energy Transition
Thinking twice about fossil fuel production. Development finance for fossil fuel production can effectively serve as a type of fossil fuel subsidy (Bast et al. 2015). G7 leaders—major MDB shareholders—have committed to phase out inefficient fossil fuel subsidies by 2025 (G7 2016). The G7 should review MDB support for fossil fuel production in light of these commitments.
Exploring more refined approaches to existing large hydropower. As existing large hydropower plants age, questions about refurbishment will continue to arise. A better understanding of the available options, alternatives, and impacts will be helpful to determine whether these investments could be less controversial than installing new generation capacity.
Avoiding any misalignment and overcompensat-ing for exceptions. Given the MDBs’ commitments to help address the climate-change challenge, continued investments in fossil fuel generation should only occur while ramping up investments in fuel switching (to renewables), energy efficiency, and/or CCS technologies to minimize the climate impacts of misaligned projects. This will leave room for exceptions that meet acute energy access challenges for which countries request financing for fossil fuel generation projects, particularly if these countries are very low emitters with low pro-jected growth in energy demand.
Shining a light in dark corners. To fully understand the alignment of MDBs’ activities, it will be necessary for them to have the right systems in place to account for and disclose the climate impacts of their indirect support through financial intermediaries, as well as upstream advisory work that supports policies, institu-tions, and private-sector development.
Aiming for 1.5°C. As more literature becomes avail-able on pathways to limit temperature rise below 1.5°C, the MDBs and their shareholders would do well to follow these developments, as they will likely shift our understanding of how technologies align with achieving a low-carbon, sustainable future.
1. INTRODUCTIONThe Need to Deliver Low-Carbon, Sustainable DevelopmentThe World Bank estimates that 767 million people lived in extreme poverty in 2013, down from 1.85 billion in 1990 (World Bank 2016b). While development actors continue their efforts to alleviate poverty and promote economic growth, the effects of climate change threaten these and future gains. In recognition of this, the global community came together in a historic way in 2015 to confront climate change and sustainable develop-ment challenges. The UN General Assembly endorsed the Addis Ababa Action Agenda, which provides the framework for financing sustainable development. Countries then adopted 17 Sustainable Development Goals (SDGs)—including goals on clean energy and climate action—establishing a 2030 Agenda for Sustain-able Development that seeks to end poverty, protect the planet, and ensure prosperity for all (UN 2017d).2
Then, through the Paris Agreement, countries agreed to strengthen their efforts to limit global temperature rise well below 2°C above pre-industrial levels and to endeavor to limit it to 1.5°C.
Public and private-sector capital must be directed toward sustainable activities in order to achieve these global commitments. This necessity is reflected in the agreements themselves. The Addis Ababa Action Agenda focuses on aligning all financing flows and poli-cies with economic, social, and environmental priorities (UN DESA 2017). Goal 17 of the SDGs calls for invest-ments to reinforce sustainable development (UN 2017c). The Paris Agreement calls for “making finance flows consistent with a pathway towards low greenhouse gas emissions and climate-resilient development” (Article 2.1 (c), UNFCCC 2016).
The shift of global capital toward investments in more sustainable infrastructure and services cannot wait. Evidence suggests that urgent action is needed in order to limit GHGs and keep the worst impacts of climate change at bay. In its Fifth Assessment Report, the IPCC estimated that, as of 2011, 66 percent of the carbon budget compatible with a 2°C scenario had already been used (IPCC 2014). Recent assessments indicate that we are not on an adequate trajectory to reduce emissions, even accounting for Nationally Determined Contributions (NDCs) (UNEP 2016). Furthermore, implementation of the Paris Agreement is essential for the achievement of the SDGs (UN 2017a).3

6 |
Financing the Energy Transition
Emissions reductions are needed across economic sec-tors: energy, agriculture, forestry and land use, industry, transportation, and buildings (IPCC 2014). While action is needed on many fronts, the investments that are made in the energy supply sector in the coming years will be critical, given that this sector is the largest con-tributor to global GHGs (Bruckner et al. 2014). Energy supply also has strong linkages with other sectors and cuts across all of the other SDGs. As noted by the United Nations, energy is central to nearly every major chal-lenge and opportunity the world faces today. Delivering energy sustainably will be key to transforming lives, economies, and our environment (UN 2017b).
Future contributions to energy GHGs will vary by region and country as economies and populations grow. Decisions elsewhere in the world, particularly in larger carbon-intensive economies, will have an impact on possible pathways to keeping global warming well below 2°C. Investments in clean energy supply and energy efficiency will be critical to allowing a wider range of pathways and decoupling economic growth from GHG emissions.
The Multilateral Development Banks (MDBs) are central players in the global climate finance architecture (and in the development finance architecture more gen-erally), helping mobilize significant amounts of public and private capital for climate mitigation and adapta-tion.4 The Organisation for Economic Co-operation and Development (OECD) estimates that the MDBs have provided an average of $15.5 billion per year in climate finance in recent years, and they have mobilized $7.4 billion in private co-financing (OECD 2015).5 In October 2015, the MDBs unveiled a series of climate finance tar-gets, mostly with a view toward 2020 (see Table 2 later in this section). These targets will further enhance the role of the MDBs in climate finance. More broadly, the MDBs are key players in financing infrastructure around the world, including in the energy supply sector, which the IPCC defines as all energy extraction, conversion, storage, transmission, and distribution processes that deliver final energy to the end-use sectors (Bruckner et al. 2014). Understanding the evolving role of MDBs in the development and climate finance architecture is important to help shift global capital flows toward climate-resilient, low-carbon development activities.
Objectives and Structure of This PaperThe objective of this paper is to take stock of several MDBs’ recent (2015–16) approvals and pipeline develop-ment in the energy supply sector to better understand how their activities in this area reflect efforts to limit global temperature rise to well below 2°C above pre-industrial levels, and therefore help to ensure sustainable
development. As significant intermediaries for develop-ment finance that often co-finance projects with other public as well as private-sector actors, ensuring that MDBs’ investments are compatible with a 2°C scenario should accelerate the shift of global finance toward low-carbon, climate-resilient activities that promote sustain-able development.
With the Paris Agreement having entered into force in November 2016, the next few months provide a window of opportunity for MDB shareholders and stakeholders to find ways to accelerate MDBs’ efforts to support climate change and sustainable development goals. First, they must have a better understanding of where the MDBs are in this process. The target audiences for the paper are MDB shareholders and MDB leadership. This paper should foster a more meaningful dialogue on how to support MDBs’ efforts to shift their portfolios and mainstream climate change within their policies and operations.
Our analysis and conclusions are based on a review of projects approved in 2015–2016 and planned invest-ments of a subset of three MDBs: the World Bank (International Development Association (IDA) and International Bank for Reconstruction and Development (IBRD)), International Finance Corporation (IFC), and the Asian Development Bank (ADB). We chose these three MDBs because they were the largest multilateral sources of Official Development Finance (ODF) for infrastructure in 2014, accounting for more than a third of the total (Miyamoto and Chiofalo 2016).6
We undertake an in-depth review of investments in the energy supply sector because it is the sector with the largest share of direct global GHG emissions, and a significant portion (over one-third) of recent ODF for infrastructure was in energy (IPCC 2014; Miyamoto and Chiofalo 2016).7 Our analysis focuses on the climate change mitigation aspects of development projects. Although these projects may have a range of other economic, social, and environmental objectives, an analysis of these other objectives falls outside the scope of this study.
The central question we seek to answer is how we might assess the alignment of recent and planned energy supply investments of several MDBs with efforts to limit global temperature rise below 2°C.8 While we recognize that there is a wider research question about how all MDBs’ activities can support sustainable development, including both climate-change mitigation and adaptation, we begin with a narrower focus that can still reveal key insights and demonstrate how such an assessment can be done.
WORKING PAPER | May 2017 | 7
Financing the Energy Transition
The paper is structured in five parts. Section 2 explains our methodology/approach for assessing the climate compatibility of projects. Section 3 provides in-depth analyses of WB, IFC, and ADB investments in the energy supply sector. Section 4 highlights our key findings and suggests policy implications for further dialogue between MDB shareholders and leadership.
The Role of MDBsMDBs are multilateral financial institutions that support economic and social development in countries, primarily through the extension of loans on terms that would not typically be accessible to countries tapping the markets on their own. This is made possible by the MDBs’ preferred creditor status and capacity to borrow in international capital markets on the strength of their capital base and their high credit ratings relative to those of the borrowing clients. The MDBs provide technical and financial assistance for projects that may not otherwise come to fruition on a strictly commercial basis and for programs that reform policies and build local capacity. Further, the MDBs have the capacity to mobilize private-sector investment at scale using non-grant instruments, including in some cases making equity investments. Thus, they play a catalytic role in sector and country development.
MDBs have three main approaches for providing assistance to countries and other partners, including private-sector actors. The first is through direct investments in which the MDBs use a range of instruments to finance or de-risk public or private-sector investments. The second approach is indirect via investments in funds or credit lines and on-lending arrangements with local financial institutions. Finally, MDBs provide technical assistance and capacity building, including through policy loans to support institutions, stakeholders, and policies. These approaches are not mutually exclusive and are often combined as part of a broader program or package of support.
As financial institutions, MDBs raise and manage their own capital. Shareholder countries contribute capital, but MDBs also earn revenues from fees and interest and raise funds through capital markets by issuing bonds or notes (debt instruments). Although the MDBs are not fundamentally profit-maximizing institutions, as finan-cial institutions with limited access to donor capital, they face strong incentives to generate profits, manage risks, and achieve overall strong financial performance (in particular to maintain their strong credit ratings). Therefore, outside concessional resources from donor
countries and external multilateral funds can be blended with MDBs’ own resources to support viability gap funding, especially in cases where technologies are new or where there is less awareness and trust in technolo-gies or approaches. This outside concessional financing also supports MDBs in providing technical assistance to countries and supports efforts of countries to develop strategies and investment plans.
MDBs and Climate FinanceMDBs work with developing-country partners to develop investment opportunities and are already sup-porting some of the necessary climate investments as part of their total development finance portfolios. MDBs also channel climate finance from multilateral funds like the Green Climate Fund, Climate Investment Funds, and the Global Environment Facility, blending these concessional resources with their own (Amerasinghe et al. 2017).
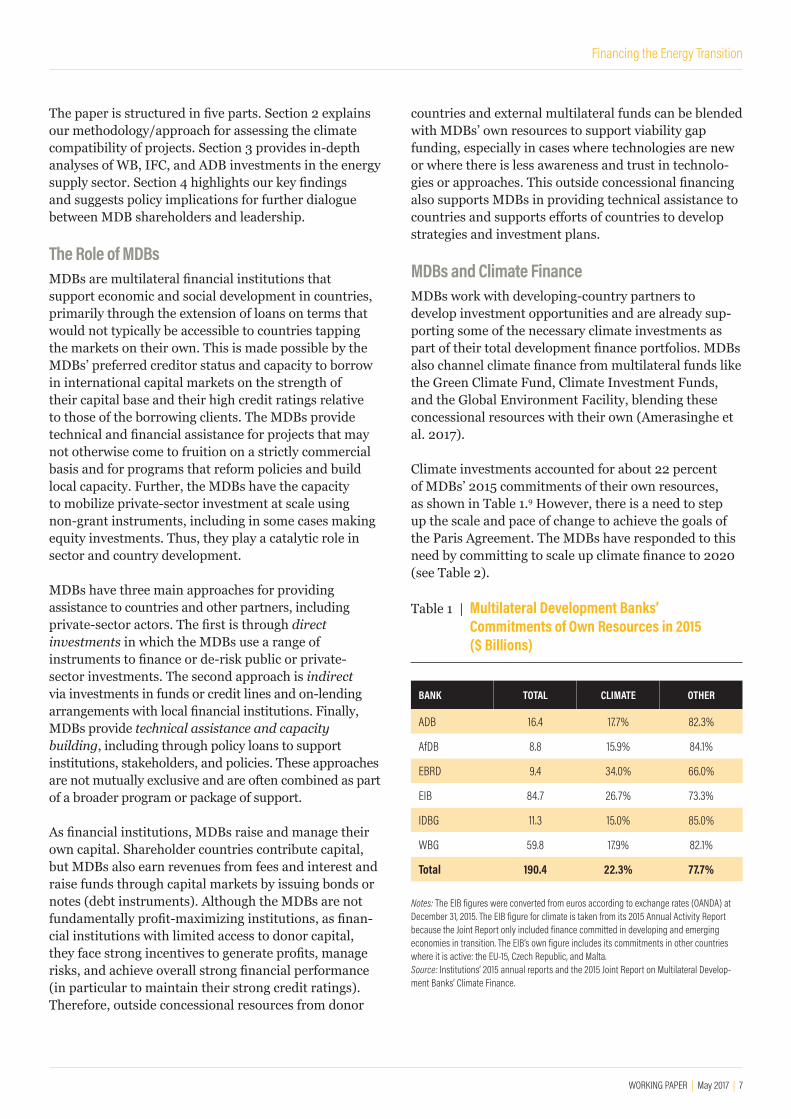
Climate investments accounted for about 22 percent of MDBs’ 2015 commitments of their own resources, as shown in Table 1.9 However, there is a need to step up the scale and pace of change to achieve the goals of the Paris Agreement. The MDBs have responded to this need by committing to scale up climate finance to 2020 (see Table 2).
Table 1 | Multilateral Development Banks’ Commitments of Own Resources in 2015 ($ Billions)
BANK TOTAL CLIMATE OTHER
ADB 16.4 17.7% 82.3%
AfDB 8.8 15.9% 84.1%
EBRD 9.4 34.0% 66.0%
EIB 84.7 26.7% 73.3%
IDBG 11.3 15.0% 85.0%
WBG 59.8 17.9% 82.1%
Total 190.4 22.3% 77.7%
Notes: The EIB figures were converted from euros according to exchange rates (OANDA) at December 31, 2015. The EIB figure for climate is taken from its 2015 Annual Activity Report because the Joint Report only included finance committed in developing and emerging economies in transition. The EIB’s own figure includes its commitments in other countries where it is active: the EU-15, Czech Republic, and Malta.Source: Institutions’ 2015 annual reports and the 2015 Joint Report on Multilateral Develop-ment Banks’ Climate Finance.

8 |
Financing the Energy Transition
Table 2 | Targets Announced by Multilateral Development Banks in 2015 to Support Climate Action
BANK TARGETS ANNOUNCED
ADB Doubling climate finance to $6 billion annually by 2020 (own resources only), of which $4 billion is for mitigation and $2 billion is for adaptation
AfDB Triple climate financing to reach 40 percent of investments by 2020
EBRD 40 percent of EBRD annual business investment by 2020 in green finance
EIB Global target of greater than 25 percent of all lending. Increased target of 35 percent of lending in developing countries by 2020
IDBG Goal to double climate finance to 30 percent of operational approvals by 2020 to an average $4 billion per annum, and to improve evaluation of climate risks and identify opportunities for resilience and adaptation measures
WBG A one-third increase in climate financing, from 21 percent to 28 percent of annual commitments by 2020. If current financing levels are maintained, this would mean an increase to $16 billion in 2020. The WBG intends to continue current levels of leveraging co-financing for climate-related projects, which could mean up to another $13 billion a year in 2020. The direct financing and lev-eraged co-financing together represent potentially an estimated $29 billion in 2020.
Notes: World Bank Group includes the World Bank, International Finance Corporation, and Multilateral Investment Guarantee Agency. Targets based on MDBs’ own financing, not other vehicles such as trust funds under their management.Source: 2015 Joint Report on Multilateral Development Banks’ Climate Finance.
For the last five years, the MDBs have jointly reported on their climate finance. They define climate finance as the financial resources that they have committed to development operations and components thereof that deliver climate change mitigation and adaptation co-benefits in developing and emerging economies (AfDB et al. 2016). In March 2015, the MDBs, together with the International Development Finance Club, launched the common principles for tracking climate finance (World Bank 2015a). These principles have helped to bring more transparency to the MDBs’ climate finance commitments from their own resources and consistency in how those commitments are tracked across development finance institutions. Tracking and reporting on the magnitude and destinations of climate finance commitments could help MDBs and other development finance institutions determine where and how to direct scarce public and concessional climate finance to maximize impact.
Under the common principles for tracking climate mitigation finance, an activity is classified as related to climate-change mitigation if it promotes “efforts to
reduce or limit greenhouse gas emissions or enhance greenhouse gas sequestration” (AfDB et al. 2015b and IDFC 2015). The principles stress conservativeness in reporting, and are based on activity types (as opposed to purpose, origin of resources, or actual results). Activities can be a stand-alone project, subcomponents of a project, or programs financed through financial intermediaries. MDBs report financial commitments, not approvals, in their climate finance reporting. The methodology also acknowledges the importance of long-term structural changes in certain areas, particularly in transportation and energy production and use. Appendix C includes more information on the activities related to energy supply that are considered climate finance under the principles.
2. METHODOLOGYScopeThe overarching research question that we set out to answer in this paper is whether recent and planned energy-supply investments of several MDBs are gener-ally consistent with the Paris Agreement goal to limit global temperature rise to well below 2°C. To help answer this question, we focus our analysis on a subset of three MDBs: the World Bank (IDA/IBRD), IFC, and ADB. A 2016 OECD study focused on ODF found that the WBG, including the World Bank and IFC, disbursed the highest amount of ODF for infrastructure in 2014, nearly $13.8 billion or a quarter of the total. The ADB had the next highest disbursement amount among MDBs, with $5.5 billion. Together, the World Bank, the IFC, and the ADB provided nearly 35 percent of global ODF for infrastructure (Miyamoto and Chiofalo 2016).10
The MDBs published their most recent annual joint report on climate finance in August 2016 (for 2015, see Table 1). While the joint reporting has helped shed light on MDBs’ climate finance contributions in different sectors, includ-ing energy, this paper seeks to provide a clearer picture of the full spectrum of select MDBs’ energy supply invest-ments, not just those that reduce or limit GHG emissions. Our figures and analysis are not comparable with the joint reports on climate finance not only because of the differ-ence in coverage and methodology, but also because the joint reports focus on commitments; whereas our paper focuses on approvals and pipeline projects.
To take stock of the current state of play, we focus on projects approved in calendar years 2015 and 2016 and projects in the pipeline as of December 31, 2016, for which data are publicly available via MBDs’ respective project databases on their websites (see Table 3). Our analysis of these projects consists of two parts:

WORKING PAPER | May 2017 | 9
Financing the Energy Transition
1. Portfolio-level analysis: We provide snapshots of all energy supply-related investments recently approved and in the pipeline relative to the entire range of investments in each time frame both in terms of the number of projects and the estimated volume of finance associated with those projects.
2. Project-level analysis: We performed an in-depth review of energy supply projects using a 2°C alignment framework (described later in this section). The energy supply dataset includes the full range of MDB investment activities—direct investments in physical assets and infrastructure; indirect investments (for example, through a fund or on-lending arrangement); and policy loans, technical assistance, and capacity building—that were tagged in the respective databases as being energy related. We tagged projects according to the technology component types within projects in our dataset to the greatest extent possible based on public project documents. Appendix A provides more details on our use of the MDB databases. Although we reviewed policy loans, technical assistance, and capacity-building projects and tagged them by technology component type whenever possible and relevant, we did not apply the 2°C alignment framework due to the more fluid nature of these activities.
For our project-level analysis, we use the IPCC defini-tion of the energy supply sector. As noted earlier in this paper, the IPCC found that this sector is the largest contributor to global GHG emissions, responsible for approximately 35 percent of total anthropogenic GHG emissions (Bruckner et al. 2014). The energy supply sec-tor comprises all energy extraction, conversion, storage, transmission, and distribution processes that deliver final energy to the end-use sectors. Energy supply also
includes all upstream investments in the fossil fuel sup-ply chain (exploration, development, production/extrac-tion, processing, and transportation and distribution).
Although we acknowledge that energy use and efficiency in end-use sectors will be essential to achieve the 2°C limit, investments in the demand side of energy (e.g., buildings, industry, transport) are beyond the scope of this paper. However, investments that improve the efficiency of the supply of energy—for example, upgrad-ing or rehabilitating turbines or transmission lines—are within the scope of our analysis. The inclusion of energy efficiency as part of a broader energy investment analy-sis of both the supply and demand side of energy could show different patterns across the MDBs’ recent and planned activities and could therefore be an area for follow-up research. Appendix A includes details about our data collection approach, which included a combi-nation of desk and primary research.
Assessment Framework for Project AnalysisScenario and data availability considerations led us to focus on 2°C as the long-term global climate change goal for this paper. In its 2016 Emissions Gap Report, UNEP noted the breadth of existing research on least-cost pathways that limit warming to below 2°C with a 66 percent or higher probability. Meanwhile, research on a 1.5°C goal is still relatively scarce, and no published scenarios meet the 1.5°C limit permanently with more than 66 percent probability. Despite the lack of available literature on investment criteria for a 1.5°C scenario, evidence suggests that achieving a 1.5°C scenario will require greater urgency and rapid scaling up of invest-ments and actions pre-2020 to transition to low-carbon pathways (see Box 1) (UNEP 2016).
Table 3 | Number of Projects in WRI’s Study on MDB Energy Supply Investments
PROJECT TYPES NUMBER OF PROJECTS APPROVED 2015
NUMBER OF PROJECTS APPROVED 2016
NUMBER OF PROJECTS IN DISCLOSED PIPELINE
TOTAL NUMBER OF PROJECTS
World Bank Energy supply 68 74 68 210
Total (all sectors) 466 441 459 1,366
International Finance Corporation
Energy supply 21 22 21 64
Total (all sectors) 248 210 105 563
Asian Development Bank
Energy supply 52 62 41 155
Total (all sectors) 320 341 168 829
Source: World Bank: Projects and Operations: http://projects.worldbank.org/sector?lang=en&page=, IFC: IFC Project Information Portal (investment and advisory projects): https://disclosures.ifc.org/#/landing, ADB: ADB Projects: https://www.adb.org/projects/search (February 2017).

10 |
Financing the Energy Transition
To establish a framework for assessing MDBs’ energy supply projects, we completed an extensive literature review of existing approaches for defining “align-ment” of investments with 2°C. Following our review, we decided to draw on recent research commissioned by the G7. This work—a pair of 2015 reports jointly authored by the NewClimate Institute, 2 Degrees Invest-ing Initiative, and GermanWatch—focused on develop-ing criteria that public financial institutions can use to align their investments with 2°C compatible pathways (Höhne et al. May 2015; Höhne et al. November 2015). Thus, the reports provide an approach that closely fits our research question and that provides a relevant starting point for our analysis. For ease of reference, we will refer to these studies jointly as the 2°C Compatible Reports. Other approaches in our review, for instance, climate friendliness metrics or GHG lifecycle assess-ments in comparison with a global carbon budget, are complementary but do not consider or incorporate as fully as some of the more conditional aspects of invest-ment decisions, especially as they relate to local or time-related factors that are highly relevant in a development finance context.
To categorize technologies and investment areas according to their 2°C alignment, the authors of the 2°C Compatible Reports reviewed several available 2°C scenarios and models, including
▪ scenarios from Integrated Assessment Models, which are based on cost optimization over a broad scope of sectors but which lack resolution on energy demand options, assume large amounts of Bioen-ergy CCS (BECCS) and Land Use, Land Use Change, and Forestry (LULUCF), e.g. as in the IPCC report;
▪ energy sector models, such as those by the Interna-tional Energy Agency (IEA), which include technol-ogy option level details but still lack resolution on certain technologies;
▪ renewables and efficiency scenarios that focus on certain technologies and exclude others (especially CCS and nuclear), for example, the World Wild-life Fund (WWF) Energy Report and Greenpeace Energy [R]evolution; and
▪ sector-specific bottom-up scenarios, such as the IPCC Working Group 3 report, which provide detailed analyses of mitigation potentials and costs but lack an integrated approach across sectors.
Based on their review of the scenarios, the 2°C Compat-ible Reports categorize each investment area/technol-ogy into one of four categories from the perspective of
alignment with the 2°C pathways: 2°C compatible, con-ditional, misaligned, and ambiguous/controversial. For ease of reference and for the purposes of this paper, we renamed these categories as aligned, conditional, mis-aligned, and controversial. The categorization of invest-ment areas/technologies is based on the consistency of their role across the different scenarios analyzed:
▪ Aligned: 2°C aligned in all scenarios analyzed
▪ Conditional: 2°C aligned in all scenarios analyzed, under certain conditions, e.g., the way that a project is designed or implemented and/or the dynamics with the broader energy system
▪ Misaligned: Consistently misaligned with 2°C in all scenarios analyzed
▪ Controversial: 2°C aligned in some scenarios but not in others. Some scenarios do not include or fac-tor in certain technologies because of other consid-erations that may relate to assumptions of economic feasibility or environmental or social risks, rather than simply 2°C compatibility.
The conditional and controversial categories (versus a binary aligned/misaligned categorization) reflect the fact that multiple pathways can limit global temperature rise to below 2°C, based on different assumptions and technology choices. While using one scenario or model as the basis for developing 2°C investment criteria may have provided more concrete conclusions, those conclusions would have been contingent on the world unfolding according to that scenario and its underly-ing assumptions. Instead, the 2°C Compatible Reports maintained the concept of multiple pathways within their methodology by incorporating different scenarios and models. While scenarios and models are typi-cally not comparable due to their different underlying assumptions and research questions, reviewing them to draw out insights about investment areas helps to highlight commonalities that exist despite different underlying assumptions.
In this paper, we use the Höhne et al. (2015) 2-degree alignment framework to categorize MDB projects in the energy supply sector. The categories for energy supply investments are shown in Table 4. We collaborated with the original authors to revisit their underlying research and adapt the table to include more technologies than what they highlighted in the 2°C Compatible Reports. Our intention in using this table as a framework for our analysis is not to introduce these categories for use as elements of an exclusion list or screens, but rather to help encourage thinking and discussion around how an
WORKING PAPER | May 2017 | 11
Financing the Energy Transition
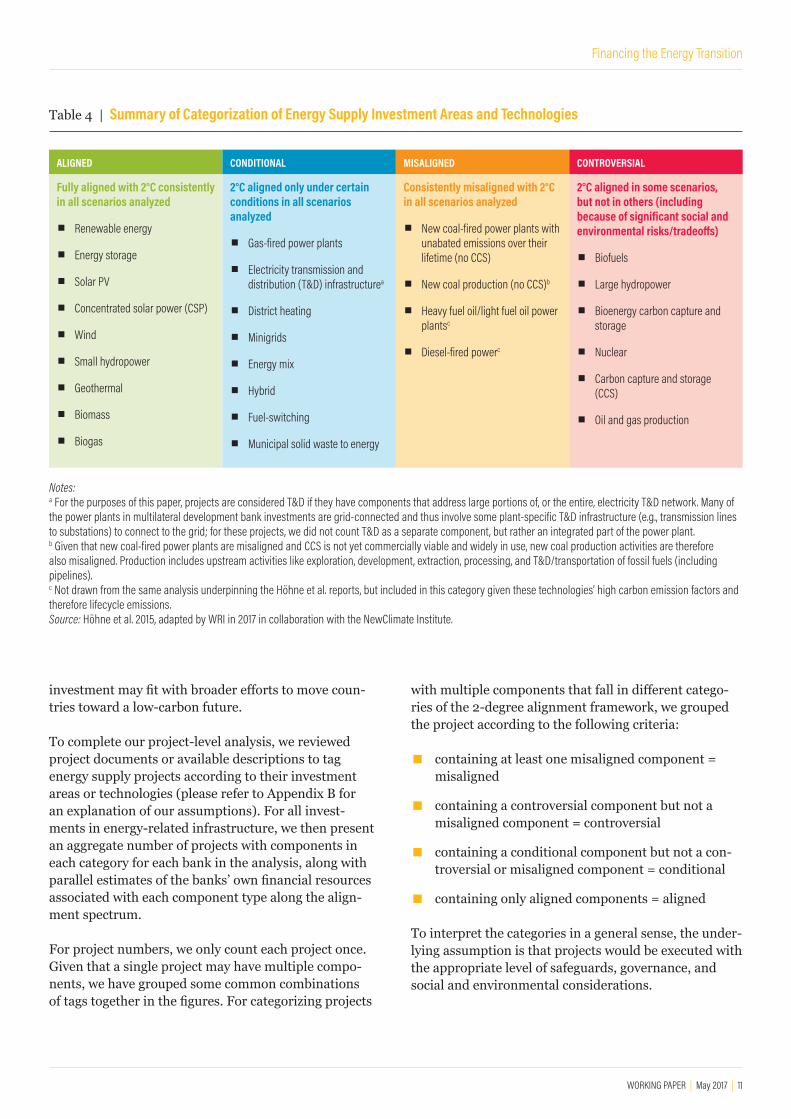
Table 4 | Summary of Categorization of Energy Supply Investment Areas and Technologies
ALIGNED CONDITIONAL MISALIGNED CONTROVERSIAL
Fully aligned with 2°C consistently in all scenarios analyzed
▪ Renewable energy
▪ Energy storage
▪ Solar PV
▪ Concentrated solar power (CSP)
▪ Wind
▪ Small hydropower
▪ Geothermal
▪ Biomass
▪ Biogas
2°C aligned only under certain conditions in all scenarios analyzed
▪ Gas-fired power plants
▪ Electricity transmission and distribution (T&D) infrastructurea
▪ District heating
▪ Minigrids
▪ Energy mix
▪ Hybrid
▪ Fuel-switching
▪ Municipal solid waste to energy
Consistently misaligned with 2°C in all scenarios analyzed
▪ New coal-fired power plants with unabated emissions over their lifetime (no CCS)
▪ New coal production (no CCS)b
▪ Heavy fuel oil/light fuel oil power plantsc
▪ Diesel-fired powerc
2°C aligned in some scenarios, but not in others (including because of significant social and environmental risks/tradeoffs)
▪ Biofuels
▪ Large hydropower
▪ Bioenergy carbon capture and storage
▪ Nuclear
▪ Carbon capture and storage (CCS)
▪ Oil and gas production
Notes: a For the purposes of this paper, projects are considered T&D if they have components that address large portions of, or the entire, electricity T&D network. Many of the power plants in multilateral development bank investments are grid-connected and thus involve some plant-specific T&D infrastructure (e.g., transmission lines to substations) to connect to the grid; for these projects, we did not count T&D as a separate component, but rather an integrated part of the power plant. b Given that new coal-fired power plants are misaligned and CCS is not yet commercially viable and widely in use, new coal production activities are therefore also misaligned. Production includes upstream activities like exploration, development, extraction, processing, and T&D/transportation of fossil fuels (including pipelines). c Not drawn from the same analysis underpinning the Höhne et al. reports, but included in this category given these technologies’ high carbon emission factors and therefore lifecycle emissions. Source: Höhne et al. 2015, adapted by WRI in 2017 in collaboration with the NewClimate Institute.
investment may fit with broader efforts to move coun-tries toward a low-carbon future.
To complete our project-level analysis, we reviewed project documents or available descriptions to tag energy supply projects according to their investment areas or technologies (please refer to Appendix B for an explanation of our assumptions). For all invest-ments in energy-related infrastructure, we then present an aggregate number of projects with components in each category for each bank in the analysis, along with parallel estimates of the banks’ own financial resources associated with each component type along the align-ment spectrum.
For project numbers, we only count each project once. Given that a single project may have multiple compo-nents, we have grouped some common combinations of tags together in the figures. For categorizing projects
with multiple components that fall in different catego-ries of the 2-degree alignment framework, we grouped the project according to the following criteria:
▪ containing at least one misaligned component = misaligned
▪ containing a controversial component but not a misaligned component = controversial
▪ containing a conditional component but not a con-troversial or misaligned component = conditional
▪ containing only aligned components = aligned
To interpret the categories in a general sense, the under-lying assumption is that projects would be executed with the appropriate level of safeguards, governance, and social and environmental considerations.

12 |
Financing the Energy Transition
Conditional TechnologiesThe categorization by itself does not provide an indica-tion as to the degree of compatibility/misalignment of conditional or controversial projects. Projects within the conditional or controversial categories may in fact be 2°C aligned, misaligned, or on a spectrum between definitively aligned and misaligned, and require further consideration.
This level of detailed consideration goes beyond the scope of our analysis, but below we highlight a set of questions that can help determine whether these proj-ects are aligned in practice (Höhne et al. 2015):
▪ Is the project viable with shadow carbon price (assuming the price is set at a high level that is com-patible with 2°C scenarios)?
▪ Does the project fit into a path toward zero gCO2/kWh in 2050?
▪ Is the project consistent with the country’s climate strategy (NDC or other decarbonization strategy) when considering lifetime, operation mode, fuel source, and capacity requirements?
▪ Would the investment switch to the misaligned category when ratcheting up domestic ambition in the context of the Global Stocktake or other future climate policy development?
For conditional projects in particular—which the ana-lyzed scenarios agree have a role in a low-carbon future or at least the transition to one—the key for MDBs and their clients is to consider how to design and implement these projects such that they are aligned with 2°C path-ways. In this context, the project’s lifetime and choices regarding the fuel source (renewable energy, fossil fuel type, organic or inorganic waste), technology/operation mode, timing, and plans to further decarbonize (e.g., in the case of fuel switching, to renewables, or in the case of T&D, decarbonizing the grid). Projects that originally fall in the conditional category by technology type but that involve coal, diesel, or heavy fuel oil as a primary or significant fuel source are considered misaligned. For indicative examples of specific considerations for conditional projects, see Appendix B.
Given the urgent need to decarbonize the power sec-tor in order to reach net zero CO2 emissions in the second half of the century (IPCC 2014, UNEP 2016), conditional projects that involve fossil fuels, especially those with longer lifetimes, like power plants or district
heating systems, may be misaligned before the end of their lifetime.11 This could change if the gas-fired power plants are retrofitted with carbon-capture technologies and if district heating systems are refurbished to run on renewables. The urgency of these actions will depend on other factors, for instance, the widespread adoption of efficient energy end use and whether other high-emis-sions energy infrastructure is retired early or retrofitted with carbon capture technologies (Pfeiffer et al. 2016).
Controversial TechnologiesControversial projects involve the same line of question-ing as above, but with additional considerations.
▪ Biofuels: These are liquid fuels that contain energy derived from recently living organisms, mainly plants. Although biofuels are considered low-carbon (Bruckner et al. 2014), they compete for the same fertile land as food crops and are often derived from food crops like maize, sugarcane, sugar beets, wheat, and other vegetables that are purposely grown to produce biofuels (versus using waste). Thus, they can pose a threat to food security. Depending on how they are derived (and what they are displacing), biofuels may not in fact contribute to net emission reductions (Searchinger and Heim-lich 2015). In “The Energy Report: 100% Renewable Energy by 2050,” WWF calls for urgent action to reduce the demand for biofuels, citing threats to food security, deforestation, water use/scarcity, and loss of biodiversity (WWF 2011).
▪ Large hydropower: Large hydropower plants are usually defined as those with greater than 10 mega-watts capacity (Greenpeace et al. 2015). Hydro-power is currently the largest source of renewable energy globally and provides flexible capacity (which can help accommodate variable renewables) (IEA 2015). However, large hydropower projects, which typically require large dams and flooding areas, often displace communities and destroy natural habitats (IPCC 2014; WWF 2011). Another consideration is that hydropower plants with large reservoir areas in relation to electricity production can have considerable GHG emissions (IPCC 2014).
▪ Nuclear power: The development of nuclear plants has slowed in recent years due to concerns about the potential for widespread and severe impacts from accidents. Nuclear power plays an important role in many 2°C scenarios, including those from the IPCC and IEA; however, Greenpeace and WWF scenarios assume that a 2°C pathway is

WORKING PAPER | May 2017 | 13
Financing the Energy Transition
achievable with nuclear power sources completely phased out by 2050. In addition to health and environmental concerns, there is also the argument that when lifecycle costs are properly accounted for, nuclear power is much more expensive relative to renewable options (Greenpeace et al. 2015).
▪ Carbon capture and storage (CCS): This is a process in which carbon dioxide (CO2) from indus-trial and energy-related sources is separated (cap-tured), conditioned, compressed, and transported to a storage location for long-term isolation from the atmosphere. CCS plays an important role in many models’ ability to achieve 2°C pathways by abat-ing emissions, particularly from fossil fuels (IPCC 2014). However, there are concerns that the promise of CCS enables fossil fuel generation and production in the short term, encouraging lock-in, rather than a transition to low-carbon options. The IPCC also notes social and environmental concerns with CCS, for example, risk of CO2 leakage. Greenpeace excludes CCS from its Energy [R]evolution analysis, due to what it considers highly speculative assumptions about costs, effectiveness, and environmental effects
of CCS. In its World Energy Outlook (IEA 2015), the IEA noted that CCS efforts to date have not advanced enough to achieve the pace and scale of CCS deploy-ment necessary to achieve a 2°C pathway.
▪ Bioenergy carbon capture and storage (BECCS): The application of CCS technology to bioenergy conversion processes. The IPCC’s AR5 report notes that, “many models could not limit likely warming to below 2°C if bioenergy, CCS, and their combination (BECCS) are limited,” (IPCC 2014). In very simplistic terms, the controversy around BECCS involves elements of the controversy with biofuels and CCS: land use and food security on one side and the pace and reliability of CCS technol-ogy development on the other.
▪ Oil and gas production: Although consumption of these fuels must drop dramatically in the coming years to achieve 2°C pathways, some production, particularly from existing wells and fields, may be possible in the near term if phased out over time, beginning with oil and then gas (Greenpeace 2015).
Box 1 | Comparisons between 1.5°C and 2°C
The 2015 Paris Agreement commits coun-tries to hold the global average temperature increase to “well below 2°C,” and to “pursue efforts” to limit the increase to 1.5°C (UNFCCC 2016). The differences between a 1.5°C world and a 2°C world are significant: Relative to a 1.5°C world, 2°C of warming would result in nearly two more weeks of heat waves per year, 20 percent greater sea level rise, and significantly reduced yields across a variety of staple crops, among other impacts (Schleuss-ner et al. 2016).
Prior to the Paris Agreement, the bulk of scientific literature exploring scenarios for limiting temperature increase focused on a 2°C benchmark. Accordingly, the framework on which this paper is based also uses a 2°C benchmark. Would adopting a 1.5°C benchmark change the results of this analysis?
Since 2015, additional literature on 1.5°C path-ways has become available. (A 2018 special report by the IPCC will examine published literature on pathways associated with achiev-ing a 1.5°C goal (IPCC 2016).) Rogelj et al. (2016) summarize key differences characterizing 1.5°C versus 2°C scenarios from recent literature:
Net zero and negative emissions: 1.5°C scenarios reach global net zero CO2 emissions one to two decades earlier than 2°C scenarios. Moreover, in contrast to 2°C scenarios, they require net negative emissions (for example, through bioenergy paired with CCS) in the second half of the century.
Rapid, profound decarbonization of energy supply: 1.5°C scenarios require a faster and deeper decarbonization of energy supply than do 2°C scenarios. Notably, the earlier CO2 reductions in 1.5°C scenarios are achieved through early reductions in the power sector.
Demand-side mitigation: By 2050, mitigation in industry, transport, and especially the build-ing sector leads to significantly greater reduc-tions for 1.5°C scenarios than for 2°C scenarios.
Crucial role for energy efficiency: In 1.5°C scenarios, the energy intensity of GDP falls faster than historical rates, and policy-induced demand reductions are greater than in 2°C scenarios.
Higher mitigation costs: Over the course of the century, migration costs are twice as high in 1.5°C scenarios as in 2°C scenarios. (It is important to note that this does not consider
the relative cost of the impacts of 1.5°C vs. 2°C temperature changes.)
The next decade is critical: The range of 2030 emissions that are compatible with 1.5°C scenarios is much narrower than for 2°C, suggesting that investments in low-carbon technologies over the next decade are particu-larly critical.
A critical question for this analysis is whether these characteristics shift the balance of technologies categorized as aligned, con-ditional, misaligned, or controversial. In the context of the need to rapidly decarbonize the energy sector in the near future, the role of natural gas—categorized in the framework as “conditional”—is of particular interest. On the one hand, natural gas results in significantly lower emissions than coal. On the other hand, natural gas infrastructure locks in associated emissions, complicating decarbonization. Forthcoming literature is likely to greatly enhance understanding of the role of a range of energy technology in achieving the Paris goals. Future efforts to bring investments in line with the Paris Agreement would do well to follow these developments closely.
Source: Contributed by Taryn Fransen, WRI

14 |
Financing the Energy Transition
The IEA notes that investment in new oil supply will be needed as the decline in currently producing fields is greater than the decline in demand. Natural gas production may also be necessary, given its role in the transition across several sectors (OECD/IEA 2017). However, recent research estimates that a third of all oil reserves and half of all gas reserves should remain unused through 2050 in order to stay under the 2°C threshold (McGlade and Ekins 2015). Thus, exploration may be misaligned if the intention is to exploit new reserves.
As noted earlier, the categories are not intended to infer judgment, but rather to indicate the degree of agree-ment around whether there is alignment with 2-degree pathways. For instance, we recognize that low-income and vulnerable countries may seek support for “mis-aligned” technologies as a way of addressing urgent social and economic needs. In light of this, we provide country income-level information and links to project descriptions in Appendix D to give more context about the projects that we reviewed.
Limitations and CaveatsThere are several limitations and caveats to these pre-liminary results. First among these is that our analysis relies heavily upon publicly-disclosed information. Not only is this relevant in terms of determining what is in our sample of approved and pipeline projects, but our analysis and tagging of projects is contingent on the clarity of the project documents themselves.
The units of our analysis are the number of projects and the amounts of finance directed toward components within projects. The number of projects is based on projects that include both the banks’ own resources as well as those financed from bank-administered trust funds.
Projects often involve multiple components, so we drew from project documents to ascertain, whenever pos-sible, financing amounts assigned to each component. We found that this breakdown was typically clearer for the banks’ own resources, thus our finance figures focus more narrowly on the banks’ own resources.12 Some projects did not involve any of the banks’ own resources, so the project sample for the estimated volume of finance does not exactly correspond to that of the proj-ect number analysis.
We depended on each MDB’s respective sector tags to help identify the pool of projects for our project-level analysis. Thus, the dataset for energy supply projects excludes indirect investments (for example, through a
fund or on-lending arrangement) that are not explic-itly tagged as energy-related by the MDBs themselves. Transactions through financial intermediaries constitute a significant share of the private sector activity of MDBs and are also the most opaque in terms of the underlying portfolios for such transactions (further discussion on this in Sections 3 and 4). Our project-level analysis also excludes projects that involved crosscutting market or infrastructure programs unless energy was also explic-itly a sector or subsector tag. Due to this combination of factors, our analysis likely underestimates energy supply investments supported by the MDBs.
Although we include findings from our review of policy loans, technical assistance, and capacity-building activi-ties in our project-level analysis, we found it difficult to apply the 2-degree alignment framework to these transactions due to their more fluid or sectoral nature. These transactions are not included in our overall sum-mary figures of the alignment of energy supply project alignment.
We keep a narrow focus for this paper, which we hope could serve as an initial study that sparks further research. This working paper primarily focuses on project-level analysis; we do not perform an analysis on higher-level “mainstreaming climate change” issues such as institutional targets, commitments, and strate-gies, except to provide context and aid our interpreta-tion of findings. We focus on assessing projects accord-ing to climate-change mitigation considerations; we do not address resilience or complex issues that affect project value, including concepts such as equity, eco-nomic inclusion, development priorities, and other goals associated with the Paris Agreement or the SDGs, along with other co-benefits and costs.
We also recognize that projects approved in 2016 were likely in development for two to three years prior to the Paris Agreement’s signing. However, the global community made the initial political commitment to a 2°C future at COP15 in Copenhagen in 2009 (UNFCCC 2009), before enshrining it in international law through the Cancun Agreements (UNFCCC 2010) and the Paris Agreement. Additionally, not every project that is under preparation will come to fruition, so it is possible that our analysis includes pipeline projects that will not be approved or implemented.
As noted earlier, our analysis should not be compared with the MDBs’ own reporting on climate finance, given the different scope and methodology of the banks’ joint climate finance reporting (see Section 1. MDBs and Climate Finance). In addition, since we consider projects

WORKING PAPER | May 2017 | 15
Financing the Energy Transition
that have received Board approval and not commitment (and some projects that receive approval do not ultimately receive full commitment), our analysis should not be com-pared with what MDBs report in their annual reports.
The 2°C Compatible Reports were published in 2015, and the scenario analysis underpinning the categoriza-tion focused on 2°C pathways, whereas the Paris Agree-ment aims for 1.5°C. Thus, the categorization of what is misaligned with the Paris Agreement in this assessment is likely to be conservative (see Box 1).Scenarios themselves, while useful for outlining possible pathways to 2°C and grounding considerations of how certain technologies fit in those pathways, are by their nature hypothetical constructs with significant limita-tions. One of these is their inability to provide exact predictions, for instance, in determining with certainty the exact energy technology mix needed within a certain pathway (Paltsev 2016), let alone within a country or region, which is the context in which these MDB investment decisions are being considered. The current scenarios do show that a move to a low-carbon energy future requires a drastic change in energy investment; and by categorizing these investments, one might have a clearer sense of how an energy system fits with different visions of this future.
Lastly, the MDBs do not operate in a vacuum. In addition to global commitments like the Paris Agree-ment and SDGs, other external factors can shape their strategies and operations. For example, fluctuations in global investments in developing countries, technol-ogy advances, changes in trade patterns, and conflict situations are some examples of circumstances that can shape MDB operations. Client demand is also an important factor, which we will discuss more in the next section.
REVIEW OF MDB ACTIVITIESContextThe World Bank, IFC, and ADB project cycles are com-parable to one another, beginning with an overarching country strategy developed in collaboration with country governments. The institutions’ project cycles are further elaborated in Appendix C. Government and private-sec-tor actors can identify and propose projects for financ-ing that fit within this strategy, although the MDBs may also identify potential projects and collaborate with country partners in their preparation. Thus, while the project pipeline largely reflects country demand, MDBs have an opportunity to shape this demand during strat-egy and planning discussions and through their policy and advisory assistance.
The MDBs are collaborating to address shared chal-lenges on both the supply and demand for infrastructure finance. On the supply side, they have jointly set up an infrastructure working group to build harmonized approaches to project preparation, procurement, super-vision, monitoring, and reporting. They have also joined forces to support the G20 Global Infrastructure Hub and the WBG-hosted Global Infrastructure Facility as a way to collaborate on the preparation and structuring of large-scale infrastructure investments that can success-fully attract private investors. On the demand side, they have set up project preparation facilities to help build the pipeline of investable projects (AfDB et al. 2015a). Demand-side efforts are especially critical in the context of the Paris Agreement and Agenda 2030, given that public and private investors cite the lack of investment-ready “bankable” projects as a major constraint to greater investment in low-carbon and climate-resilient infrastructure (Nassiry et al. 2016).
Another area of collaboration is on mainstreaming climate action and climate finance measurement and reporting. MDBs (along with several IDFC members and commercial financial institutions) jointly developed and signed on to the Principles for Mainstreaming Climate Action within Financial Institutions at the Paris COP, five voluntary principles intended to help financial insti-tutions integrate climate-change considerations into their strategies and operations (World Bank 2015c).13 As noted earlier, although the World Bank, IFC, and ADB collaborate with other MDBs on an annual joint report on climate finance, this analysis looks beyond these banks’ climate-finance activities, particularly in the energy supply sector.
World Bank (IBRD/IDA)ContextThe World Bank is the world’s largest multilateral development bank. It provides funding to public institu-tions in developing countries through IDA and IBRD. IDA provides concessional finance to poorer developing countries. In fiscal year 2016 (July 1, 2015─June 30, 2016), 77 countries were eligible to receive IDA financ-ing, and IDA made $16.2 billion in commitments. The IBRD, which funds middle-income and credit-worthy lower-income countries, made commitments totaling $29.7 billion (World Bank 2017b).
CLIMATE CHANGE AND ENERGY POLICY AT THE WORLD BANK
In 2016 the World Bank Group (WBG, comprising the World Bank, IFC, Multilateral Investment Guarantee Agency (MIGA), and the International Centre for the Settlement of Investment Disputes) endorsed a Climate

16 |
Financing the Energy Transition
Change Action Plan for 2016-20, which contains com-mitments to increase investment in climate-compatible activities. The plan includes a pledge to support policy and institutional changes within client countries, as well as sector-specific commitments in the energy, trans-port, urban, and land-use sectors. For example, in the plan the World Bank promises to support 20 gigawatt (GW) in renewable energy generation and enable an additional 10 GW, for example, by supporting related infrastructure. The World Bank also commits to invest-ing $1 billion in energy efficiency and to mobilizing an additional $25 billion in commercial funding for clean energy. Overall, the World Bank Group pledges to make at least 28 percent of its portfolio “climate related” by 2020 (World Bank Group 2016b).
Beyond the Climate Action Plan, the World Bank’s new Environmental and Social Framework, approved in 2016, requires the Bank to assess the climate-related risks of its project investments, including associated GHG emissions (World Bank 2016a). All IDA projects have been screened for climate and disaster risk since 2014 through use of the World Bank’s climate and disas-ter risk screening tools (World Bank 2017a).
The World Bank Group’s 2013 Energy Sector Directions Paper outlines principles for its energy sector work. It establishes a focus on expanding access to energy, along with accelerating energy efficiency and renewable energy. The paper notes that the WBG will support low-cost energy supply options with moderate to high emis-sions if private-sector financing cannot be secured or if concessional financing for low-emissions, higher-cost alternatives is not otherwise available. According to the paper, the WBG is even more likely to support low-cost, higher-emissions projects if they extend access to energy (World Bank 2013). The paper describes natural gas as an important bridging or transitional fuel and states that the WBG will provide financial support for “greenfield” (new) coal power generation projects or coal mining only in rare circumstances (World Bank 2013).
In addition to these portfolio-related commitments, the World Bank supports global dialogue on solutions to combating climate change, including through the Car-bon Pricing Leadership Coalition, which aims to support the global agenda on carbon pricing.14 Box 2 highlights the key findings from our analysis of the World Bank.
Snapshot: Energy Supply Projects as a Share of Total Recent Approvals and PipelineFigure 1 A, provides a sense of the number of energy supply projects relative to the total number of projects in the periods that we reviewed. About 15 percent of the projects recently approved and in the pipeline for the World Bank involve energy supply. This includes projects with the World Bank’s own resources (IBRD/IDA) as well as projects financed from Bank-adminis-tered trust funds. About a fifth of the World Bank’s own resources for projects recently approved and in the pipe-line is associated with energy supply-related projects, as shown in Figure 1 B.
Box 2 | Key Findings: World Bank
▪ Policy lending and technical assistance or capacity-building support accounts for roughly half of the World Bank’s recent and planned energy supply investments (both in terms of the number of projects and IDA/IBRD resources), most of it directed at general institutional or sectoral support. Among projects for which we were able to ascertain a more targeted technology or investment area focus, natural gas stood out for receiving the most IDA/IBRD resources.
▪ Of the World Bank’s infrastructure projects reviewed, a quarter are in the aligned category when measured by the number of projects. Aligned projects account for 20 percent of the volume of IDA/IBRD resources approved and in the pipeline for energy supply components.
▪ Well over half—60 percent—of projects fall in the conditional category. Most of these involve a dedicated electricity T&D compo-nent, accounting for 41 percent of overall projects. More than half the volume of IDA/IBRD resources for energy supply components is associated with components that fall in the conditional category; with 46 percent overall for T&D.
▪ There are three misaligned projects in our sample, representing 3 percent of approved and planned projects. One, a coal-fired project in Kosovo, is indefinitely stalled in the pipeline. The other two, which involved heavy-fuel oil power generation in Sierra Leone and the Gambia, were approved in 2015 and 2016. Together, these projects represent 1 percent of IDA/IBRD approved or planned resources for energy supply-related components.
▪ Eleven percent of projects fall in the controversial category, mainly involving large hydropower. However, controversial project components account for nearly a quarter of the volume of recently approved and pipeline IDA/IBRD resources; 14 percent of the total is associated with gas production.
Source: Authors, WRI.

WORKING PAPER | May 2017 | 17
Financing the Energy Transition
Figure 1 | World Bank Energy Supply Projects as a Proportion of Total Projects (by Calendar Year)
Source: World Bank project database (February 2017), adapted by WRI.
Project-Level Analysis: Energy Supply SectorGiven that the World Bank has a variety of product lines and lending instruments, we distinguished between the following project types:
▪ infrastructure: direct and indirect investment in physical energy-supply infrastructure assets and projects. This category includes grants, loans, de-risking instruments (e.g. guarantees), credit lines, financing facilities, and on-lending arrange-ments for physical infrastructure projects. Most also have components of technical assistance for policy reform, sector planning, project preparatory assis-tance, and institutional capacity building.
▪ development policy lending (DPLs): grants, loans, credits, or policy-based guarantees to sup-port a program of policy and institutional actions within a country. DPLs are disbursed after mutually
agreed policy and institutional actions—called prior actions—are met. DPL provides non-earmarked general budget financing subject to the borrower’s implementation processes and systems (World Bank Group 2015).15
▪ technical assistance and capacity building: pure technical assistance and capacity building (that is not directly attached to an infrastructure invest-ment) and Extractive Industries Transparency Ini-tiative (EITI) projects. EITI projects aim to increase transparency around resource revenue from the oil, gas, and mining sectors.
Figure 2 illustrates the breakdown of these activities using our project type classification, by number of projects and by allocation of the World Bank’s own resources. Although there are relatively few DPLs related to energy supply, they account for a large portion of own-resources associated with energy supply-related projects.
Energy supply Other
A. NUMBER OF PROJECTS (OVERALL, INCLUDING OTHER ADMINISTERED FUNDS) B. ESTIMATED VOLUME OF IDA/IBRD FINANCE
0
50
100
150
200
250
300
350
400
450
500
Tota
l num
ber o
f pro
jects
(inclu
des o
wn re
sour
ces +
adm
inist
ered
fund
s)
Disclosedpipeline
0
5
10
15
20
25
30
35
40
45
50
Approved2015
Approved2016
Approved2015
Approved2016
Disclosedpipeline
Estim
ated
tota
l IDA/
IBRD
finan
ce($
billio
ns)

18 |
Financing the Energy Transition
Figure 2 | World Bank Energy Supply Project Types (by Calendar Year)
Source: World Bank project database (February 2017), adapted by WRI.
Development Policy Loans, Technical Assistance, and Capacity BuildingApproximately 50 percent of recently approved projects and about 40 percent of pipeline projects focus exclusively on policy and other enabling environment assistance (see Figure 2) that influence different energy systems and infrastructure pathways. These projects are heavily concentrated in low and lower middle-income countries where capacity-building needs tend to be greater.
While the projects support a range of different interven-tions, around two-thirds provide general support to help countries better govern or manage the energy sector in their country (see Figure 3). This includes support for capacity building and reforms related to
▪ pricing: subsidy reform, electricity and heat tariffs, carbon pricing, carbon markets
▪ regulatory: legal frameworks, regulations, policy reform, market liberalization, private-sector participation, competitive processes, targets, licensing, sector reform
▪ institutional: management capacity, operational and financial performance, governance, planning, data systems, strategies for utility fuel diversification, revenue collection and payments, project preparation, resource management projects focused on another sector (e.g., water) that affect the operations or performance of physical energy supply assets, investment plans
▪ transparency: systems for tracking revenue from the extractive industries, accountability mechanisms16
Development policy lending Technical assistance/capacity building Infrastructure
A. NUMBER OF PROJECTS (OVERALL, INCLUDING OTHER ADMINISTERED FUNDS) B. ESTIMATED VOLUME OF IDA/IBRD FINANCE
Tota
l num
ber o
f pro
jects
(inclu
des o
wn re
sour
ces +
adm
inist
ered
fund
s)
Approved2015
Approved2016
Disclosedpipeline
Approved2015
Approved2016
Disclosedpipeline
Estim
ated
tota
l IDA/
IBRD
finan
ce ($
billio
ns)
0
2
4
6
8
10
12
0
10
20
30
40
50
60
70
80

WORKING PAPER | May 2017 | 19
Financing the Energy Transition
Figure 3 | World Bank Development Policy Loans and Technical Assistance/Capacity Building in Energy Supply (Number of Projects by Calendar Year)
Notes: “Renewable energy,” when the source is not specified, refers to one or more of the following technologies: solar PV, wind, small hydropower, energy storage, geothermal, CSP, biomass, or biogas. Certain project documents refer to “renewable energy” broadly; others involve multiple renewable energy components. Source: World Bank project database (February 2017), with WRI-modified categories.
The remaining third of the projects focus on reforms and technical assistance that can be linked more clearly to specific types of energy supply technologies or investment areas. Thirteen of the projects focused on renewable energy generally, while seven support poli-cies related to natural gas, and another seven focused on hydropower. Two of the projects supported reforms related specifically to petroleum production, while one involved use of heavy fuel oil.
Slightly over half of the policy or stand-alone technical assistance initiatives managed by the World Bank dur-ing 2015–16 were funded by sources other than IDA or IBRD (such as trust funds for which the World Bank is administrator).
Of the IDA or IBRD-funded DPLs and technical assis-tance initiatives, more than 90 percent were concen-trated either in the general energy supply sector ($2.5 billion) or in the natural gas sector ($1.2 billion) (see
Figure 4). The remaining finance went to initiatives related to general renewables ($60 million), hydropower ($34.5 million) and heavy fuel oil ($4 million). The focus on general reforms and natural gas is also seen in the current IDA/IBRD pipeline.
Investments for policy and institutional reform can be vital in helping countries shift their energy sectors toward climate compatibility. However, it is generally more difficult to track the precise destination of these investments, compared to investments in physical infra-structure. For example, reforms in the gas or hydroelec-tric sectors may or may not increase energy supply from these sectors. Meanwhile, general tariff or institutional reforms can influence energy supply and/or demand, depending on how the reforms are implemented.17 For this reason, we have not categorized these initiatives according to their 2-degree alignment.
General institutional/policy support Renewable energy Hydropower Natural gas sector
Oil production Geothermal Electricity T&D Heavy fuel oil CCS
2015 2016 PIPELINE
TOTAL
38TOTAL
33TOTAL
26

20 |
Financing the Energy Transition
Figure 4 | World Bank Development Policy Loans and Technical Assistance/Capacity Building in Energy Supply (Estimated Volume of IBRD/IDA Finance by Calendar Year)
Notes: Finance figures are estimates based on information available through project documents or project pages. “Renewable energy,” when the source is not specified, refers to one or more of the following technologies: solar PV, wind, small hydropower, energy storage, geothermal, CSP, biomass, or biogas. Certain project documents refer to “renewable energy” broadly; others involve multiple renewable energy components. Source: World Bank project database (February 2017), with WRI-modified categories.
Infrastructure ProjectsTurning to infrastructure projects, Figure 5 illustrates how they are distributed by project number, using the technologies/investment areas from our alignment framework. The bands highlight where these projects fall according to the categories from the 2-degree alignment framework.18 Most projects fall in the condi-tional category. Electricity T&D projects, or those with a dedicated T&D component, are the most prevalent project types. Figure 6 provides a view, based on estimates from component breakdowns available in project documents, of how the World Bank’s own resources (IBRD/IDA finance) are allocated across component types. Electric-ity T&D investments remain prominent in the mix, but the three projects that involve oil and gas production also stand out for having a large volume of recently approved IBRD/IDA finance. These projects involved investments in natural gas development and distribu-tion or transportation specifically.
Section 4 will provide an overview of crosscutting implications associated with investments in different technology types. Here we would like to provide more context on the misaligned energy supply projects that we identified.
The coal-fired power plant in the pipeline is a project introduced in 2011 to finance a coal-fired power plant and associated coal mine in Kosovo. Our current under-standing from discussions with experts is that this project is no longer being pursued as part of the Bank’s portfolio, even if it is publicly disclosed as a pipeline project in the online database.
The Board approved two heavy fuel-oil-fired power plants in 2016. The first is a $40 million IDA guarantee to support payment security under the 20-year power purchase agreement (PPA) for a 57 Megawatt (MW) greenfield power plant running on heavy fuel oil (HFO) in Sierra Leone (World Bank Group 2016a). The second is $7 million in IDA financing to expand and improve the efficiency of Gambia’s two main power generation plants that have an installed capacity of 41 and 47 MW, respectively. Both plants run on HFO. Total installed generation capacity in the country was estimated at 102 MW, of which only 62 MW were available. Table 5 provides a snapshot of the projects.
The explanations for these two HFO “misaligned” projects, combined with these two countries’ status as “fragile situation” countries with the World Bank,19 highlight the complex nature of these investment deci-sions. Next, we will look more closely at the IFC’s recent and planned investments in the energy supply sector.
Approved 2015 Approved 2016 Disclosed pipeline
General institutional/policy support
Renewable energyHydropowerNatural gas sector
Heavy fuel oil
0
500
1000
1500
2000
2500
$ Mi
llions

WORKING PAPER | May 2017 | 21
Financing the Energy Transition
Figure 5 | World Bank Infrastructure Energy Supply Project Alignment Analysis (Number of Projects by Calendar Year)
Notes: “Energy mix” contains projects that have both renewable and fossil fuel components under the same project ID or where sub-project investments are energy-related but yet to be determined (e.g., on-lending for infrastructure funds). “Renewable energy,” when the source is not specified, refers to one or more of the following technologies: solar PV, wind, small hydropower, energy storage, geothermal, CSP, biomass, or biogas. Certain project documents refer to “renewable energy” broadly; others involve multiple renewable energy components. Source: World Bank project database (February 2017), with WRI-modified categories using 2-degree alignment framework from Höhne et al. (2015), adapted by WRI in 2017 in collaboration with the NewClimate Institute.
Num
ber o
f pro
jects
Approved2015
Approved2016
Disclosedpipeline
Oil and gas productionBiofuels
AlignedConditionalMisalignedControversial
Large hydropowerHFO/LFO/Diesel-fired power plantCoal-fired power plantEnergy mixDistrict heatingGas-fired power plantElectricity T&D, renewable energyElectricity T&D, fossil fuelsElectricity T&DMinigridsBiomassBiogasGeothermalCSPSolar PVRenewable energy
0
5
10
15
20
25
30
35
40
45

22 |
Financing the Energy Transition
Figure 6 | World Bank Infrastructure Energy Supply Project Alignment Analysis (Estimated Volume of IBRD/IDA Finance at the Component Level by Calendar Year)
Notes: Finance figures are estimates based on information provided in project documents. Total figures for each year may not match with those in other graphs due to focus on the component level. “Energy mix” contains projects that have both renewable and fossil fuel components under the same project ID or where subproject investments are energy-related but yet to be determined (e.g., on-lending for infrastructure funds). “Renewable energy,” when the source is not specified, refers to one or more of the following technologies: solar PV, wind, small hydropower, energy stor-age, geothermal, CSP, biomass, or biogas. Certain project documents refer to “renewable energy” broadly; others involve multiple renewable energy components. Source: World Bank project database (February 2017), with WRI-modified categories using 2-degree alignment framework from Höhne et al. (2015), adapted by WRI in 2017 in collaboration with the NewClimate Institute.
Approved2015
Approved2016
Disclosedpipeline
$ Milli
ons
Oil and gas production
AlignedConditionalMisalignedControversial
Large hydropowerHFO/LFO/Diesel-fired power plantCoal-fired power plantEnergy mixDistrict heatingGas-fired power plantElectricity T&D, renewable energyElectricity T&DMinigridsBiogasGeothermalCSPSolar PVRenewable energy
-
0
1000
2000
3000
4000
5000
6000
7000

WORKING PAPER | May 2017 | 23
Financing the Energy Transition
International Finance CorporationContextThe IFC is the biggest global development institution with a sole focus on the private sector in developing countries (IFC 2017b). It only invests in for-profit projects. In fiscal year 2016, IFC provided $11.1 billion in long-term finance to private investors (from its own account) and an additional $7.8 billion in mobilized finance (IFC 2016a). This money went to projects in nearly 100 developing countries (IFC 2016a). Around half of the financing went to IDA countries.
IFC provides three broad types of services that are managed as separate businesses: investment, advisory, and asset management. In this paper, we focus on IFC’s investment operations and advisory services. IFC’s Asset Management Company manages funds for which the details about specific holdings are not available, and thus it was not possible to include them in our analysis. This could be an area for future research. IFC provides financing and risk-management instruments through its investment services arm and technical assistance and capacity building through its advisory arm.
CLIMATE CHANGE AND ENERGY POLICY AT THE IFC
The IFC is part of the World Bank Group and is covered by the Climate Change Action Plan. In the plan, the IFC commits to increasing its own investments in climate-related activities to 28 percent of its annual financing or around $3.5 billion (of long-term finance) by FY2020, up from $2.3 billion in FY15. Target sectors include, for example, renewable energy, sustainable urban infrastructure, and resilient agribusiness (IFC 2016b). In addition, the IFC commits to catalyzing $13 billion in external private-sector capital annually by 2020 for climate sectors. It aims to do this through public-private partnerships, de-risking products to help attract new types of investors, and aggregation and securitization to help attract larger institutional investors (IFC 2016b). To reduce the climate impacts across its portfolio, the IFC commits to reducing greenhouse gas emissions and enhancing climate resilience of all its investments (IFC 2016b).
The Energy Directions Paper also applies to the IFC, as part of the World Bank Group. The paper directs the IFC to support “affordable, reliable, sustainable energy,” and to scale up investments in natural gas while limit-ing coal-related investments to rare circumstances (IFC 2017a).
Table 5 | Snapshot of Misaligned World Bank Projects
PROJECT NAME COUNTRY INSTALLED CAPACITY (MW) FUEL SOURCE HIGH-LEVEL RATIONALE (INDICATIVE EXCERPTS FROM PROJECT
DESCRIPTIONS)
Kosovo Power Project
Kosovo Not Available Coal Help meet baseload power needs.a
Western Area Power Generation Project
Sierra Leone 57 HFO Help support economic growth post-Ebola and provide reliable electricity services to the Freetown Capital Western Area. The World Bank’s analysis concluded that HFO-based generation is the only feasible (and least-cost) alternative for delivering reliable, year-around electricity services in the short to medium term, given Sierra Leone’s high reliance on seasonal hydropower.
Gambia Electricity Support Project
Gambia Rehabilitating and replacing equipment for 41 and 47 MW plants
HFO Increase the availability and reliability of electricity supply by rehabilitating and replacing equipment in existing HFO power plants so they can run closer to their full capacity.
Note: a It appears that this project is no longer being pursued.Source: World Bank 2015b; World Bank Group 2016a; World Bank 2011.

24 |
Financing the Energy Transition
Through its Environmental and Social Performance Standards, the IFC requires clients to assess climate-related impacts on funded initiatives and to account for GHGs if the clients expect emissions to be more than 25,000 tonnes of CO2 equivalent per year (IFC 2012). Box 3 highlights the key findings from our analysis of the IFC.
Box 3 | Key Findings: IFC
▪ IFC’s energy supply-related advisory services (run separately from investment services) appear to be largely focused on helping companies and countries adopt renewable energy technologies.
▪ Of investment services projects reviewed, about half of the IFC’s energy supply investment projects are in “aligned” technologies, most of that driven by the number of renewable projects in the pipeline, which is 81 percent renewables. An estimated 27 percent of IFC’s financing for energy supply is associated with aligned technologies.
▪ Conditional projects account for about one-fifth of IFC’s recent and planned energy supply projects, with about 26 percent of the volume of IFC’s energy supply-related financing associated with components in this category.
▪ Out of the 64 projects we reviewed, we identified 7, or 11 percent, that are misaligned with 2-degree pathways. IFC’s financing for these power generation projects involving HFO, LFO, and/or diesel represents an estimated 15 percent of its energy supply financing in the period reviewed. These projects were approved in 2015 and 2016; there are no misaligned projects in the disclosed pipeline.
▪ One-fifth of projects falls into the controversial category of predominantly oil and gas production projects. Controversial projects—of which there are none in the currently disclosed pipe-line—received an estimated third of the total volume of estimated IFC financing for recently approved and pipeline energy-supply projects. Oil and gas production alone accounts for a quarter of the estimated approved and planned financing for energy supply activities.
Source: Authors, WRI
Snapshot: Energy Supply Projects as a Share of Total Recent Approvals and PipelineFigure 7 illustrates the share of the energy supply investment projects in the total for each year and current pipeline.
A large proportion of IFC’s projects is in the “financial institutions” (FI) sector: more than half of the number of projects and the volume of finance (see Figure 8). This includes loans, equity, guarantees, and risk man-agement instruments for banks, microfinance institu-tions, insurance companies, private equity funds, and other non-banking financial intermediaries.
Little is known about the ultimate activities that this financing supports and, therefore, how compatible they are with achieving climate change goals. In fact, a 2012 independent audit of the IFC’s financial institutions’ investments found that the IFC does not have a way to determine that its money is being used in a way that avoids harm and improves environmental and social outcomes at the sub-client level, and that the IFC did not have the procedures in place to support broader environmental and social outcomes within its clients’ organizations (CAO 2013).
In response to the Compliance Advisor Ombudsman’s (CAO) 2012 report, to further enhance the risk man-agement of its FI clients and to take the next steps in improving FI clients’ environmental and social (E&S) performance, the IFC developed an action plan outlining the following three key areas of focus:
▪ Formalize a continual improvement framework with the objective to focus on strengthening implementa-tion of the 2012 policies and promoting best prac-tices where feasible and required.
▪ Establish a formal ongoing process of outreach, consultation, and dialogue with key stakeholders on IFC’s FI business.
▪ Strengthen IFC’s advisory services to support regu-latory, market, and client-level capacity building to help raise the standard of E&S risk management in the financial sector in emerging markets.
The CAO’s third follow-up report to the audit, released in March 2017, noted that, although the IFC’s review and supervision of FI investments has improved, the IFC still has no real way of ensuring FI compliance with its E&S requirements. This could mean that the IFC is inadvertently supporting projects with high E&S risks or projects that do not meet its performance standards

WORKING PAPER | May 2017 | 25
Financing the Energy Transition
(CAO 2017). The follow-up report based its findings on an audit of a sample of active FI investments.
The IFC maintains that items in its action plan are on target or completed and IFC’s E&S portfolio perfor-mance in its FI business continues to improve. The IFC’s FI continuous improvement process is informed by its own investment and portfolio experience, reviews by the Independent Evaluation Group and CAO, third-party analysis commissioned by IFC, consideration of market practice and practice among other MDBs and DFIs in the FI space, and ongoing feedback from external stakeholders.20 We also include advisory services in our analysis but only with a focus on energy supply projects. This will be covered next.
Figure 7 | IFC Energy Supply Investment Services Projects as a Proportion of Total Investment Services Projects (by Calendar Year)
Source: IFC investment project database (February 2017), adapted by WRI.
Project-level Analysis: Energy Supply Sector Though the IFC’s advisory services and investment businesses operate separately, we have grouped them together to give a comprehensive picture of the volume of finance and number of transactions that involve energy supply components (see Figure 8).
ADVISORY SERVICES
We identified 23 advisory projects related to energy supply approved in 2015 or 2016 (see Figure 9).21 Eight of these projects, or nearly one-third, focused on solar energy while an additional five, or nearly a quarter, focused on renewable energy more generally. Four of the projects focused on support for the energy sector that was not tied specifically to one energy supply technol-ogy. This included, for example, support for increasing private-sector involvement in a country’s energy market.
A. NUMBER OF PROJECTS B. ESTIMATED VOLUME OF FINANCE
Num
ber o
f pro
jects
Approved2015
Approved2016
Disclosedpipeline
Approved2015
Approved2016
Disclosedpipeline
$ Billi
ons
Energy supply OtherFinancial institutions and funds
0
50
100
150
200
250
300
0
2
4
6
8
10
12
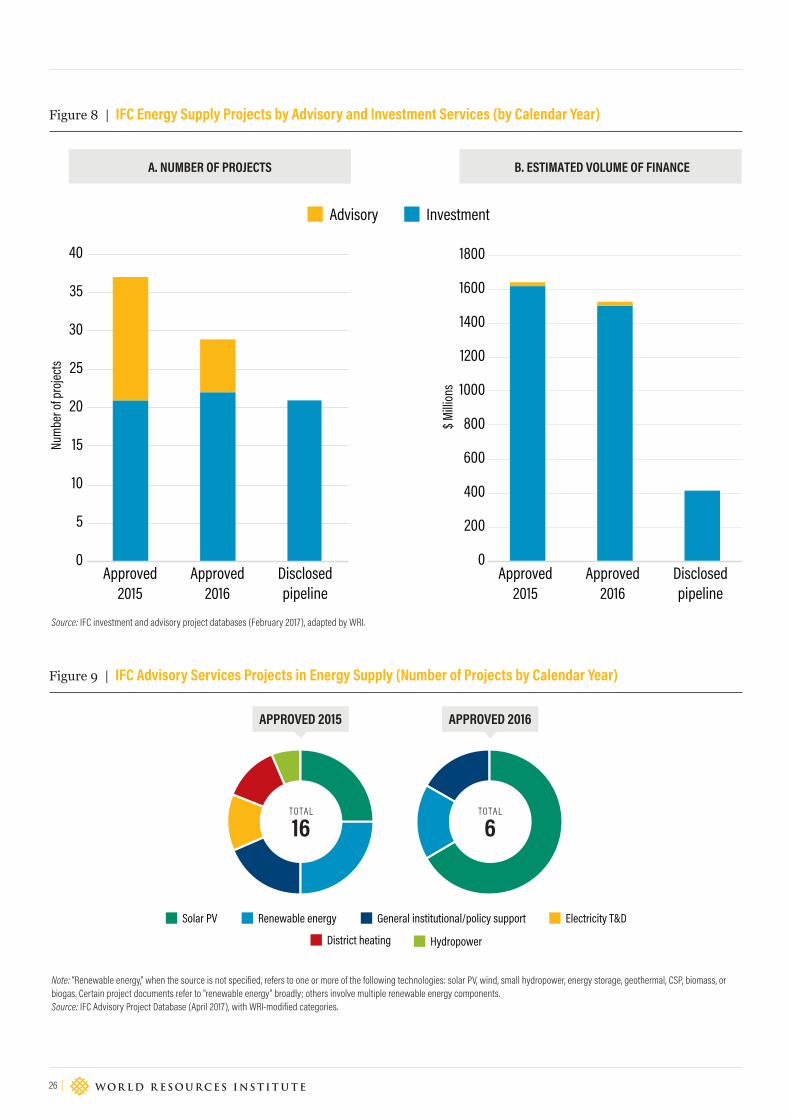
26 |
Financing the Energy Transition
Figure 8 | IFC Energy Supply Projects by Advisory and Investment Services (by Calendar Year)
Figure 9 | IFC Advisory Services Projects in Energy Supply (Number of Projects by Calendar Year)
Source: IFC investment and advisory project databases (February 2017), adapted by WRI.
Note: “Renewable energy,” when the source is not specified, refers to one or more of the following technologies: solar PV, wind, small hydropower, energy storage, geothermal, CSP, biomass, or biogas. Certain project documents refer to “renewable energy” broadly; others involve multiple renewable energy components. Source: IFC Advisory Project Database (April 2017), with WRI-modified categories.
APPROVED 2015 APPROVED 2016
General institutional/policy supportRenewable energy Electricity T&DSolar PV
HydropowerDistrict heating
TOTAL
16TOTAL
6
A. NUMBER OF PROJECTS B. ESTIMATED VOLUME OF FINANCE
Num
ber o
f pro
jects
Approved2015
Approved2016
Disclosedpipeline
Approved2015
Approved2016
Disclosedpipeline
$ Milli
ons
0
200
400
600
800
1000
1200
1400
1600
1800
0
5
10
15
20
25
30
35
40
Advisory Investment

WORKING PAPER | May 2017 | 27
Financing the Energy Transition
Figure 10 | IFC Advisory Services in Energy Supply (Estimated Volume of Finance by Calendar Year)
Notes: Finance figures are estimates based on information available through project documents or project pages. “Renewable energy,” when the source is not specified, refers to one or more of the following technologies: solar PV, wind, small hydropower, energy storage, geothermal, CSP, biomass, or biogas. Certain project documents refer to “renewable energy” broadly; others involve multiple renewable energy components. Source: IFC Advisory Project Database (April 2017), with WRI-modified categories.
In terms of volumes of finance, IFC provided a bit more than $18 million of advisory services related to solar PV during 2015–16, and nearly $15 million in services related to renewable energy generally. Together these constitute nearly 80 percent of funding for advisory services focused on the energy supply sector (see Figure 10). The remaining 20 percent covered services related to large hydropower, district heating, electricity T&D, and general institutional or policy support. The large hydropower project focuses on reducing environmental and social risks associated with the sector.
As with the World Bank, we have not categorized IFC’s advisory services according to their 2-degree alignment, since services related to specific technologies may or may not increase use of that technology. That said, most of the advisory projects we assessed focused specifically on renewable energy (especially solar) and are therefore supportive of a low-carbon future.
INVESTMENT SERVICES
As seen in Figure 8, the IFC’s investment arm has a larger number of energy-supply transactions and financing associated with those transactions. Figure 11 illustrates how these projects are distributed by number of projects, using the technologies/investment areas and the categories from our alignment framework. Again, the bands highlight where these projects fit within the 2-degree alignment framework.
We find that the overall number of positive projects is greater than those in the conditional or controversial category, as shown in Figure 11, but this is largely due to the high number of solar projects in the pipeline.
A closer look at the estimated financing associated with these projects reveals a more even distribution across technology areas (Figure 12).
General institutional/policy supportDistrict heating
Solar PVRenewable energyLarge hydropower
Electricity T&D
$ Milli
ons
0
5
10
15
20
25
Approved 2015 Approved 2016

28 |
Financing the Energy Transition
Figure 11 | IFC Energy Supply Investment Services Alignment Analysis (Number of Projects by Calendar Year)
Notes: The biofuel project approved in 2016 contains a biomass component, the estimated financing for which appears in the financing figure. One of the HFO projects contains a gas-fired power plant component, the estimated financing for which appears in the financing figure. “Energy mix” contains projects that have both renewable and fossil fuel components under the same project ID or where sub-project investments are energy-related but yet to be determined (e.g., on-lending for infrastructure funds). “Renewable energy,” when the source is not specified, refers to one or more of the following technologies: solar PV, wind, small hydropower, energy storage, geothermal, CSP, biomass, or biogas. Source: IFC project database (February 2017), with WRI-modified categories using 2-degree alignment framework from Höhne et al. (2015), adapted by WRI in 2017 in collaboration with the New Climate Institute.
AlignedConditionalMisalignedControversial
Oil and gas productionLarge hydropower
HFO/LFO-fired power plantBiofuels
Diesel-fired power plant
Energy mix
Municipal solid waste to energyGas-fired power plant, energy mixGas-fired power plant
Wind, solar PVWindSmall hydropower
CSPSolar PVRenewable energy
Electricity T&D
0
5
10
15
20
25
Num
ber o
f pro
jects
Approved2015
Approved2016
Disclosedpipeline

WORKING PAPER | May 2017 | 29
Financing the Energy Transition
Figure 12 | IFC Energy Supply Investment Services Alignment Analysis (Estimated Volume of Finance by Calendar Year)
Notes: Financing amounts are estimates based on a mix of information contained in project documents and expert judgment. Certain projects involved equity investments with no indication of the allocation of resources. In those cases, we recorded the investment amount jointly, for example, as we did with the gas-fired power plant/district heating investment. “Energy mix” contains projects that have both renewable and fossil fuel components under the same project ID or where sub-project investments are energy-related but yet to be determined (e.g., on-lending for infrastructure funds). “Renewable energy,” when the source is not specified, refers to one or more of the following technologies: solar PV, wind, small hydropower, energy storage, geothermal, CSP, biomass, or biogas. Certain project documents refer to “renewable energy” broadly; others involve multiple renewable energy components. Source: IFC project database (February 2017), with WRI-modified categories using 2-degree alignment framework from Höhne et al. (2015), adapted by WRI in 2017 in collaboration with the New Climate Institute.
0
200
400
600
800
1000
1200
1400
1600
1800
AlignedConditionalMisalignedControversial
Oil and gas productionLarge hydropower
HFO/LFO-fired power plantBiofuels
Diesel-fired power plant
Energy mix
Municipal solid waste to energyGas-fired power plant, energy mixGas-fired power plant
Wind, solar PVWindSmall hydropowerBiomass
CSPSolar PV
Renewable energy
Electricity T&D
$ Milli
ons
Approved2015
Approved2016
Disclosedpipeline

30 |
Financing the Energy Transition
It is also clear from the financing figures that the wind and solar projects in the pipeline have smaller invest-ment sizes relative to other types of projects. This is not surprising given that renewable energy projects can often be smaller in size than conventional energy infrastructure investments. The smaller size can act as a barrier to investment without public support (Venugo-pal and Srivastava 2012).
There is a large volume of approved finance to support oil and gas exploration projects. More information about these projects is included in Appendix D. They span the supply chain, from exploration to development/extrac-tion, processing, and transportation (pipeline). Four—in Argentina, Egypt, Kenya, and Mexico—involve explora-tion for oil and/or gas. We will elaborate on some of the implications of these types of “controversial” projects more in Section 4.
Table 6 | Snapshot of Misaligned International Finance Corporation Projects
PROJECT NAME COUNTRY INSTALLED CAPACITY (MW)
FUEL SOURCE HIGH-LEVEL RATIONALE (INDICATIVE EXCERPTS FROM PROJECT DESCRIPTIONS)
ACWA Power Zarqa Thermal Power Station
Jordan 485 Natural gas with light distillate fuel oil backup
Replaces one of the oldest and most inefficient power plants in the country.a
Summit Mezzanine Bangladesh 715 (across 4 projects)
HFO, HFO-LNG, and LNG
Enhances provision of electricity and expands access to grid-connected power.
Cap des Biches and CG CdB II
Senegal 53 HFO with an option to convert to gas
Creates one of the most efficient thermal power plants in Senegal and helps meet the country’s growing electricity demand.
CEC Africa Sierra Leone 57 HFO Increases power supply in a country with significant power needs; adds much needed electricity generation capacity to the grid, thereby helping to stimulate economic growth and job creation.
Siranjganj Power Company
Bangladesh 414 Dual-fuel: natural gas and high speed diesel
Helps to address chronic electricity shortages and to meet the growing demand for power in Bangladesh.
MGES Power Iraq 1,000 Natural gas with diesel backup
Addresses the significant supply-demand gap in Iraq via freeing up equity resources to be reinvested in independent power producer projects and financing the energy efficient expansion of the plant.a
Note: a Although fuel oil or diesel serve as a backup fuel, given the scale of the power plant, we classified this as a misaligned project (whereas a minigrid with diesel or fuel oil backup would be categorized as conditional). Source: Project documents from IFC Investment Project Database, February 2017.
The seven misaligned projects involve heavy fuel oil or diesel power generation. One of the projects is the same 57 MW HFO plant in Sierra Leone for which the World Bank is providing a guarantee. Two of the misaligned projects are transactions supporting the same project in Senegal. Table 6 provides a snapshot of the projects.
While the rationale helps to provide the development context and impact of these investments, Table 6 also serves to highlight the MW of fossil fuel-fired power generation supported by these transactions: roughly 2.7 GW of power, more than Ethiopia’s total installed electricity capacity in 2014 (U.S. EIA 2017).

WORKING PAPER | May 2017 | 31
Financing the Energy Transition
Asian Development BankContextIn 2015, ADB committed $16.4 billion in loans, grants, equity investments, guarantees, and technical assis-tance. It leveraged another $10.74 billion in co-financing from partners (ADB 2016a). ADB has 48 developing member countries (DMCs) that it serves in Asia and the Pacific. ADB recently merged its concessional Asian Development Fund loan portfolio with its ordinary capital resources balance sheet, which should allow ADB to further scale up its operations in the region by close to 50 percent (ADB 2016a).
CLIMATE CHANGE AND ENERGY POLICY AT THE ADB
ADB is in the process of developing the “Climate Change Operational Framework (2017-2030),” as well as its next long-term strategic framework that would set its strategy from now until 2030. In its Strategy 2020, ADB highlights the importance of supporting action on climate change in its DMCs. To this end, it says it will emphasize climate change in its programs, policies, and strategies, including climate change as a priority under one of its five core areas (environment). The importance of supporting action on climate change is reiterated in the Mid-Term Review (MTR) of Strategy 2020 carried out in 2014. The MTR identified key action areas such as investing $2 billion annually in clean energy, including energy efficiency supporting clean energy investments, and strengthening environmental policies and institutional capacities for compliance and enforcement (ADB 2014).
ADB’s Energy Policy paper from 2009 lays out its energy strategy and policies. Three pillars guide ADB’s energy activities: promoting energy efficiency and renewable energy; maximizing access to energy for all; and pro-moting energy sector reform, capacity building, and gov-ernance. Under its current policies, ADB will selectively support coal-based power projects that involve cleaner, more efficient technology. It will not support coal mine development except for captive use by power plants, nor will it support oil field development except for marginal and already proven fields. The policy also excludes sup-port for nuclear power (ADB 2009).
Energy sector investments must follow ADB’s safe-guard policies regarding the environment, involuntary resettlement, and indigenous peoples. ADB’s Safeguard Policy Statement requires borrowers to identify project impacts and assess their significance; examine alterna-tives; and prepare, implement, and monitor environ-mental management plans (ADB 2017a). Box 4 high-lights the key findings from our analysis of the ADB.
Box 4 | Key Findings: ADB
▪ Policy lending and technical assistance projects account for about 42 percent of recent and planned energy supply projects. The projects take up a smaller share of ADB’s recently approved and proposed financing for energy supply activities: only about 7 percent, with the lion’s share of that for policy-based loans. Among projects for which we were able to ascertain a more targeted technology/investment area focus, natural gas T&D stood out as the area with the most approved/planned ADB resources through policy lending and technical assistance.
▪ Of the infrastructure projects reviewed, nearly a third of ADB’s recently approved and publicly disclosed pipeline energy supply-related projects are in the aligned category. Aligned energy supply components account for 15 percent of ADB resources recently approved and proposed.
▪ About half of projects fall in the conditional category. Most of these involve a dedicated electricity T&D component, accounting for 41 percent of overall projects. Two-thirds of ADB’s resources for recently approved and proposed energy supply projects are directed at conditional technology components, with 50 percent overall supporting electricity T&D components.
▪ There are three misaligned projects in the period that we exam-ined, representing 3 percent of approved and planned projects. One involved a US$4.7 Australian grant (not considered ADB’s own resources) for diesel-fired power generation in Nauru. The other two, which involve coal-fired district heating and power in Ulaanbaatar, are in the publicly disclosed pipeline. Together, these projects represent an estimated 2 percent of ADB-approved or planned resources for energy supply projects.
▪ Seventeen percent of projects are in the controversial category, over half of which involve natural gas production (development, processing, and transportation and distribution). Controversial projects account for 21 percent of recently approved and pipeline ADB resources for energy supply; 12 percent of the overall total resources associated with energy supply are for gas production.
Source: Authors, WRI
Snapshot: Energy Supply Projects as a Share of Total Recent Approvals and PipelineFigure 13 illustrates the share of ADB energy supply projects in the total projects for each year and cur-rent pipeline—roughly 20 percent of projects recently approved and in the pipeline involve energy supply.
Project-Level Analysis: Energy Supply SectorSimilar to what we studied for the World Bank, we also distinguish between three broad project types: infrastructure, stand-alone technical assistance, and policy-based loans. In terms of number of projects,
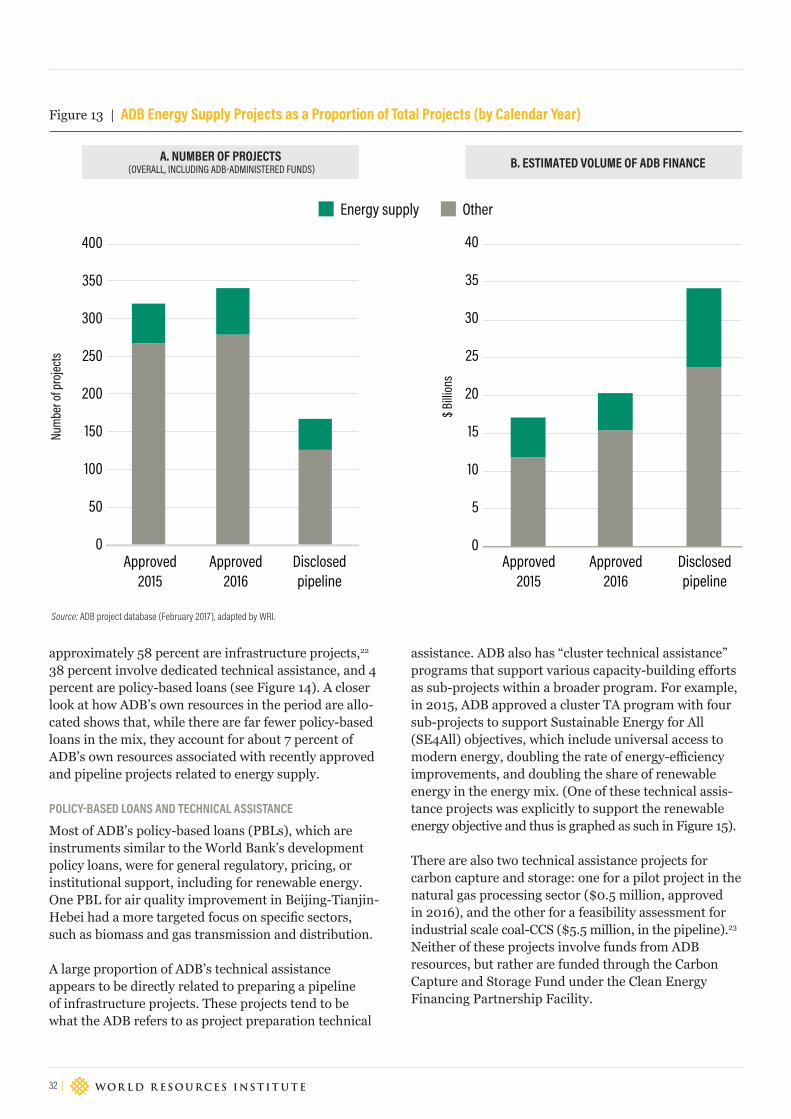
32 |
Financing the Energy Transition
approximately 58 percent are infrastructure projects,22 38 percent involve dedicated technical assistance, and 4 percent are policy-based loans (see Figure 14). A closer look at how ADB’s own resources in the period are allo-cated shows that, while there are far fewer policy-based loans in the mix, they account for about 7 percent of ADB’s own resources associated with recently approved and pipeline projects related to energy supply.
POLICY-BASED LOANS AND TECHNICAL ASSISTANCE
Most of ADB’s policy-based loans (PBLs), which are instruments similar to the World Bank’s development policy loans, were for general regulatory, pricing, or institutional support, including for renewable energy. One PBL for air quality improvement in Beijing-Tianjin-Hebei had a more targeted focus on specific sectors, such as biomass and gas transmission and distribution.
A large proportion of ADB’s technical assistance appears to be directly related to preparing a pipeline of infrastructure projects. These projects tend to be what the ADB refers to as project preparation technical
Figure 13 | ADB Energy Supply Projects as a Proportion of Total Projects (by Calendar Year)
Source: ADB project database (February 2017), adapted by WRI.
assistance. ADB also has “cluster technical assistance” programs that support various capacity-building efforts as sub-projects within a broader program. For example, in 2015, ADB approved a cluster TA program with four sub-projects to support Sustainable Energy for All (SE4All) objectives, which include universal access to modern energy, doubling the rate of energy-efficiency improvements, and doubling the share of renewable energy in the energy mix. (One of these technical assis-tance projects was explicitly to support the renewable energy objective and thus is graphed as such in Figure 15).
There are also two technical assistance projects for carbon capture and storage: one for a pilot project in the natural gas processing sector ($0.5 million, approved in 2016), and the other for a feasibility assessment for industrial scale coal-CCS ($5.5 million, in the pipeline).23 Neither of these projects involve funds from ADB resources, but rather are funded through the Carbon Capture and Storage Fund under the Clean Energy Financing Partnership Facility.
Energy supply Other
A. NUMBER OF PROJECTS (OVERALL, INCLUDING ADB-ADMINISTERED FUNDS) B. ESTIMATED VOLUME OF ADB FINANCE
Num
ber o
f pro
jects
Disclosedpipeline
Approved2015
Approved2016
Approved2015
Approved2016
Disclosedpipeline
$ Billi
ons
0
50
100
150
200
250
300
350
400
0
5
10
15
20
25
30
35
40

WORKING PAPER | May 2017 | 33
Financing the Energy Transition
Figure 14 | ADB Energy Supply Project Types (by Calendar Year)
Source: Asian Development Bank project database (January 2017), adapted by WRI.
Although the policy loans in the period that we reviewed all involved ADB’s own resources, over a third of the stand-alone technical assistance projects managed by the ADB in the period reviewed are funded (or proposed to be) by sources other than ADB’s own resources, such as trust funds for which the ADB is an administrator.Figure 16 A. illustrates the distribution of ADB’s own resources across different component types within policy-based loans and technical assistance projects. The large allocation in the oil and gas production component is from the $145 million of support tied to natural gas T&D support under the air quality policy-based loan discussed earlier in this section.
As with the World Bank and IFC, we have not catego-rized ADB’s advisory services according to their align-ment with 2-degree pathways, for the same reasons previously highlighted.
Infrastructure ProjectsTurning to the ADB’s infrastructure projects, Figure 17 illustrates how they are distributed by project number, using the technologies/investment areas from our align-ment framework. The bands highlight where these proj-ects fall according to the categories from the 2-degree alignment framework. Similar to the World Bank, most of the ADB’s projects fall in the conditional category. Electricity T&D projects, or those with a dedicated T&D component, are the most prevalent project types.
Figure 18 gives an indication, based on estimates from component breakdowns available in project documents, of how the ADB’s own resources are allocated across component types. Electricity T&D investments remain prominent in the mix (with 50 percent of overall esti-mated approved and pipeline financing), but the nine projects that involve oil and gas production (across all periods) also stand out for having a large share of recently approved and planned use of ADB’s resources. These projects involved investments in natural gas development, processing, and distribution/transporta-tion specifically (see Appendix D for more details).
Infrastructure Technical assistance Policy-based loans
A. NUMBER OF PROJECTS (OVERALL, INCLUDING ADB-ADMINISTERED FUNDS) B. ESTIMATED VOLUME OF ADB FINANCE
Num
ber o
f pro
jects
Disclosedpipeline
Approved2015
Approved2016
Approved2015
Approved2016
Disclosedpipeline
$ Milli
ons
0
10
20
30
40
50
60
70
0
1000
2000
3000
4000
5000
6000
7000
8000
9000
10000

34 |
Financing the Energy Transition
Figure 15 | ADB’s Policy-Based Loans and Technical Assistance in Energy Supply (Number of Projects by Calendar Year)
Figure 16 | Asian Development Bank Policy-Based Loans and Technical Assistance in Energy Supply (Estimated Own Resources by Calendar Year)
Note: “Renewable energy,” when the source is not specified, refers to one or more of the following technologies: solar PV, wind, small hydropower, energy storage, geothermal, CSP, biomass, or biogas. Certain project documents refer to “renewable energy” broadly; others involve multiple renewable energy components. Source: ADB project database (February 2017), with WRI-modified categories.
Notes: Finance figures are estimates based on information available through project documents or project pages. “Renewable energy,” when the source is not specified, refers to one or more of the following technologies: solar PV, wind, small hydropower, energy storage, geothermal, CSP, biomass, or biogas. Certain project documents refer to “renewable energy” broadly; others involve multiple renewable energy components. Source: ADB project database (February 2017), with WRI-modified categories.
Approved 2015 Approved 2016 Disclosed pipeline
$ Mi
llions
0
200
400
600
800
1000
1200
Gas-fired powerplantLarge Hydropower
Small HydropowerWindSolar PVRenewable energyGeneral institutional/policy support
Oil and gas production
Electricity T&DBiomass/BiogasGeothermal
General institutional/policy support Renewable energy Hydropower
Wind Oil and gas productionElectricity T&D
APPROVED 2015 APPROVED 2016 DISCLOSED PIPELINE
Geothermal Biomass/Biogas
Gas-fired powerplant CCS Electricity T&D and renewable energy
Solar PV
TOTAL
23TOTAL
46TOTAL
5
SE4ALL

WORKING PAPER | May 2017 | 35
Financing the Energy Transition
Figure 17 | ADB Infrastructure Energy Supply Project Alignment Analysis (Number of Projects by Calendar Year)
Notes: “Energy mix” contains projects that have both renewable and fossil fuel components under the same project ID or where sub-project investments are energy-related but yet to be determined (e.g., on-lending for infrastructure funds). “Renewable energy,” when the source is not specified, refers to one or more of the following technologies: solar PV, wind, small hydropower, energy storage, geothermal, CSP, biomass, or biogas. Certain project documents refer to “renewable energy” broadly; others involve multiple renewable energy components. Source: Asian Development Bank project database (January 2017), with WRI-modified categories using 2-degree alignment framework from Höhne et al. (2015), adapted by WRI in 2017 in col-laboration with the NewClimate Institute.
AlignedConditionalMisalignedControversial
Oil and gas productionCCS
Oil and gas production and gas-fired power plant
Large hydropowerDiesel-fired powerCoal-fired power and district heatingEnergy mix
WindSmall hydropower
Biomass
Electricity T&D
District heating
Gas-fired power plant
Electricity T&D, Renewable energyElectricity T&D and fuel generation
Minigrids
Geothermal
CSPSolar PVEnergy storageRenewable energy
Biogas
0
5
10
15
20
25
30
35
Num
ber o
f pro
jects
Approved2015
Approved2016
Disclosedpipeline

36 |
Financing the Energy Transition
Figure 18 | ADB Infrastructure Energy Supply Project Alignment Analysis (Estimated Volume of Own Resources by Calendar Year)
Notes: Finance figures are estimates based on information provided in project documents. Total figures for each year may not match with those in other graphs due to focus on the component level. “Energy mix” contains projects that have both renewable and fossil fuel components under the same project ID or where subproject investments are energy-related but yet to be determined (e.g. on-lending for infrastructure funds). “Renewable energy,” when the source is not specified, refers to one or more of the following technologies: solar PV, wind, small hydropower, energy stor-age, geothermal, CSP, biomass, or biogas. Certain project documents refer to “renewable energy” broadly; others involve multiple renewable energy components. Source: Asian Development Bank project database (February 2017), with WRI-modified categories using 2-degree alignment framework from Höhne et al. (2015), adapted by WRI in 2017 in col-laboration with the NewClimate Institute.
AlignedConditionalMisalignedControversial
Oil and gas productionLarge hydropowerCoal-fired power and district heatingEnergy mix
WindSmall hydropower
Biomass
Electricity T&DDistrict heating
Gas-fired power plant
Minigrids
Geothermal
CSPSolar PVRenewable energy
0
1000
2000
3000
4000
5000
6000
7000
8000
9000
10000
$ Milli
ons
Approved2015
Approved2016
Disclosedpipeline

WORKING PAPER | May 2017 | 37
Financing the Energy Transition
The proposed financing for natural gas fired-power plants appears robust in comparison to financing approved in 2015 and 2016. This proposed financing comprises loans for one project in Uzbekistan and another in Bangladesh; more information is available in Appendix D.
Over two-thirds of the proposed financing for large hydropower plants in the pipeline is associated with one project: the Multi-tranche Financing Facility (MFF) for Pakistan’s Hydropower Development Investment Program to develop 21 run-of-the river hydropower plants with a total potential of 3,600 MW over a period of 10 years. One of the project documents specifically mentions a 300 MW hydropower plant as part of this program. The MFF aims to increase the clean energy share in the energy mix currently dominated by thermal energy (ADB 2017c).
In focusing on projects that involve ADB’s own resources, we also see that one of the misaligned proj-ects that was approved in 2015 is not included in Figure 18. This diesel generation project in Nauru involved additional financing via an Australian grant of US$4.74 million for an ADB project previously approved in 2014, co-financed by the European Union.
There are two misaligned projects involving ADB’s own resources. The first is a $150 million loan to construct a coal-fired combined heat and power plant (referred to as CHP5) that will provide district heating and electricity to Ulaanbaatar. The plant will generate 463.5 MW of
gross electricity in condensing mode through 3 x 154.5 MWe generation units or 587 MW of thermal energy for district heating and 426 MWe of gross electricity while operating in combined heat and power mode. CHP offers the most efficient district heating technol-ogy because it simultaneously generates heat and power from a single fuel or energy source at or close to the point of use (which reduces transmission losses) (IEA 2009). However, CHP plants also involve high lock-in risk given their limited ability to switch fuels without further investment. CHP5 has an expected operational lifetime of 30 years (Mott MacDonald 2015).
The second project is a $32.9 million loan (part of a loan for a larger project) to build three new coal-fired heating plants in Denjiin 1000 (32 MW), Selbe (48 MW), and Bayankhoshuu (32.5 MW). The project documents note that the high efficiency circulating fluidized bed com-bustion boilers that are planned for the three heating plants are expected to meet the current national and international emission standards (SOx, NOx, particu-late matter) for small boilers by design. This project is related to the CHP5 project as part of a larger district heating program under way in the city. Table 7 provides a snapshot of the projects.
District heating is a conditional technology type that provides an efficient option for urban heating. The use of coal as the fuel source (instead of biomass, biogas, or municipal solid waste, for instance) makes these proj-ects misaligned with 2-degree pathways.
Table 7 | Snapshot of Misaligned Asian Development Bank Projects
PROJECT NAME COUNTRY INSTALLED CAPACITY (MW) FUEL SOURCE HIGH-LEVEL RATIONALE (INDICATIVE EXCERPTS FROM PROJECT DESCRIPTIONS)
Electricity Supply Security and Sustainability—Additional Financing
Nauru 2.6–3 Diesel Addresses reliability and efficiency shortcomings in Nauru’s current diesel generation fleet to “mitigate the risk of catastrophic failure of Nauru’s power generation.” a
Ulaanbaatar Urban Services and Ger Areas Development Investment Program—Tranche 2
Mongolia 112.5 (via three heating plants: 32, 48, 32.5 MW capacity)
Coal Improves urgent infrastructure needs for Ulaanbaatar’s peri-urban area. The justification for using coal-fired heat and power includes an explanation of the long, harsh winters that drive up energy demand for heat. Many residents use individual coal stoves for heating, generating high indoor and outdoor air pollution that is associated with high health costs, so investing in district heating would result in greater energy efficiency alongside social benefits. The country is also rich in coal resources and has limited access to alternatives sources of energy. Both projects will use circulating fluidized bed combustion (CFB) boiler technology because of its high efficiency, high reliability, and relatively low SO2 and NOx emissions.
Combined heat and power plant number 5 project (CHP5)
Mongolia 463.5 electricity (in condensing mode)587 MW of thermal energy for district heating and 426 MWe of gross electricity (in combined heat and power mode)
Coal
Note: a Additional financing through ADB-administered fundsSource: ADB 2015a; ADB 2015b; ADB 2016b; ADB 2017b.

38 |
Financing the Energy Transition
CONCLUSIONS AND POLICY IMPLICATIONSIn this section, we highlight crosscutting insights and expand on some of the policy implications of our analy-sis of recent and planned energy supply investments by the World Bank, IFC, and ADB. These insights are drawn mainly from our review of infrastructure projects, except where noted.
ConclusionsMDBs support a range of technology options, including but not limited to aligned technolo-gies, to help countries supply energy to their populations in a manner that is consistent with 2°C pathways. The World Bank, IFC, and ADB have approved or proposed the full range of conditional technologies to different degrees. Conditional tech-nologies account for the largest share of energy supply
investments by project number and volume of finance, as highlighted in Figure 19. This is not, in itself, prob-lematic. The IPCC notes that no single option is suf-ficient to reduce CO2eq concentrations and eventually eliminate net CO2 emissions (IPCC 2014). Technologies categorized as conditional have a significant role to play in the low-carbon transition, but only if designed and implemented properly and with the right strategies and policies in place to ensure that they fit with NDCs and enhance countries’ ability to ramp up their ambitions over time. The same could be said about the controver-sial technologies, although there is less agreement in that category over their role, not just from a 2°C path-way perspective, but from a broader social and environ-mental one. This is particularly relevant for MDBs as they work with their clients to explore the full range of possibilities to achieve sustainable growth and poverty reduction (see Figure 19).
Figure 19 | Share of World Bank, International Finance Corporation, and Asian Development Bank Energy Supply Infrastructure Investments across 2-Degree Alignment Categories (Based on Projects Approved in 2015, 2016, or in the Pipeline as of the End of 2016)
Note: Project numbers include projects funded by own resources as well as administered trust funds. Finance figures are estimates of own resources invested at the energy-supply component level (within a project) based on information available through project documents or project pages. Only includes infrastructure investments. See Methodology for further details on categories. Source: WRI, based on raw data from World Bank, IFC, and ADB project databases using 2-degree alignment framework from Höhne et al. (2015), adapted by WRI in 2017 in collaboration with the NewClimate Institute.
WB
IFC
ADB
WB
IFC
ADB
Share of energy supply projects (%) Share of energy supply finance (%)
0% 20% 40% 60% 80% 100%0% 20% 40% 60% 80% 100%
Aligned Conditional Misaligned Controversial
A. NUMBER OF PROJECTS B. ESTIMATED VOLUME OF FINANCE

WORKING PAPER | May 2017 | 39
Financing the Energy Transition
The different investment patterns seem to reflect the different mandates of the MDBs. The World Bank and ADB work mainly with public counter-parts, and we see that they invest heavily in infrastruc-ture projects that have more of a public-good nature, like electricity T&D. The IFC, on the other hand, works with the private sector and invests more in areas where the private sector is more engaged, like power genera-tion (for example, the IFC had nearly as many stand-alone solar PV projects as ADB and WB combined). To expand energy access and deliver energy service to end users, both generation as well as T&D are necessary.
In general, aligned projects in our review tend to be relatively small by volume of finance per project, which echoes market characteristics (Venugopal and Srivastava 2012). It is therefore important to consider the number of aligned projects alongside the volume of finance to have a more complete picture of investment patterns and to avoid creating a bias against smaller projects.
Investments in electricity T&D, vital to a low-carbon future, account for the highest share of World Bank and ADB’s recent and approved financing for energy supply (around half, with about 40 percent of projects for both banks). Well functioning and managed electricity T&D systems are needed to bring renewables onto the grid and increase efficiency in both the delivery and end use of energy (through smart-grid technologies) (IPCC 2014). Invest-ments in these areas, although conditional according to the framework, are necessary to achieve low-carbon growth and could reap benefits down the road if energy systems incorporate a greater proportion of renewable energy and increased energy efficiency. Most of the MDBs’ investments in the T&D infrastructure involved improving the efficiency of existing T&D systems, which has the effect of lowering the carbon-intensity of exist-ing energy sources by reducing losses. Many projects also involved a component that focused on building capacity for managing renewable energy sources as they are brought onto the grid. Investments in T&D provide a good illustration of how conditional projects may in fact be aligned well with 2-degree pathways; in this case, the conditional categorization serves more as a reminder of the urgent need to decarbonize the electricity grid as it expands and becomes more efficient.
Across these MDBs, there were fewer natural gas generation projects than renewables proj-ects, and natural gas generation had a lower overall associated volume of finance compared to the total for all renewables. However, if project
pipelines evolve to include more natural gas genera-tion, care will be needed to ensure that this bridge fuel does not lock out renewables. Fuel switching from coal to natural gas presents significant emission reduction opportunities, particularly in fast-growing economies with coal-based power generation, because natural gas is the cleanest burning fossil fuel. Natural gas is also attractive because it can play a grid-stabilizing role with variable renewables. However, given that the entire power sector needs to be decarbonized by 2050, gas-fired power plants built from 2015 on would have to be decommissioned or paired with CCS before the actual end of their life cycle (typically 35 years) (Höhne et al. November 2015). Research suggests that for natural gas to truly play a bridging role, guardrails will need to be in place, for example, by ensuring that natural gas displaces coal generation (rather than merely adding to it) and supporting other measures like carbon pricing, methane regulations, and renewable portfolio standards (Lazarus et al. 2015).
There were 21 oil and gas production projects (mostly involving natural gas) across all three MDBs in our review—the only controversial project types that have both high associ-ated emissions and high lock-in risk. These upstream investments raise concerns about lock-in risk and stranded assets (Carbon Tracker Initiative and Grantham Research Institute 2013). As highlighted earlier, by 2011 we had already used over two-thirds of our carbon budget. Recent research estimates that a third of all oil reserves and half of all gas reserves should remain unused through 2050 in order to stay under the 2°C threshold (McGlade and Ekins 2015). This would imply that investment in exploration, development, and extraction of new sources of oil and gas could move from the controversial category to misaligned in a future refinement of the methodology.24
Large hydropower projects were the second most prevalent among the controversial project types (following oil and gas production). As noted earlier, these low-carbon technologies present trade-offs that would need to be considered on a case-by-case basis. Several of the large hydropower projects involved refurbishing existing plants rather than constructing new ones.
We identified three CCS projects—all with ADB—and no BECCs projects in the dataset, possibly reflecting the nascent and controversial nature of these technologies. All three of them are either grant or technical assistance projects financed by the Carbon Capture and Storage Fund under the Clean

40 |
Financing the Energy Transition
Energy Financing Partnership Facility administered by the ADB. Given that BECCs and CCS play such a prominent role in IPCC AR5, but remain controversial and largely unexplored by the three MDBs in our study, it will be important for the banks to stay abreast of new 1.5°C scenarios, in particular to see whether there is further convergence around the role of these technolo-gies in a low-carbon future.
The misaligned projects that we identified usually had a strong development rationale outlined in the project documents (elaborated upon in Section 3), but the high lock-in risk associated with fossil fuel generation raises concerns about the ability to limit temperature rise well below 2 degrees. In some cases, the fossil fuel generation projects may present a lower-carbon energy option than the status quo, which may be individual heating or individual diesel generators, and so there is an incremental improvement from a GHG emissions perspective. However, the urgency of the climate challenge demands that MDBs consistently seek transformational and innovative approaches to meeting development needs.
Over one-third of the MDB’s energy supply-related projects that we analyzed provide policy support, capacity building, and technical assis-tance. Our preliminary estimates suggest that this rep-resents around a quarter of the total financing associated with recent approvals and proposed financing for energy supply. This figure is largely driven by the World Bank, which had the largest number of projects and volume of financing for policy loans related to energy supply. These projects include support for a variety of activities, ranging from project preparation assistance to budget-ary support linked to national policy and institutional reforms. Although all three MDBs provide such finance, their approaches vary. The World Bank does not tend to fund project preparation activities and instead focuses its funding on institutional and regulatory reforms. The ADB, meanwhile, covers much of the cost of project prep-aration, while also providing some support for broader reform. The IFC focuses its advisory services on helping private and public actors engage with new markets.
Policy loans and technical assistance/capacity building, while difficult to assess in terms of their alignment because of their more institutional and often sectoral nature, have important implications for the climate-change impacts of energy supply investment and therefore warrant careful attention. Currently, a significant portion of this programming goes to support cleaner energy. Of the IFC advisory services
analyzed, for example, nearly 80 percent were explicitly dedicated to renewable energy. That said, there remain some investments that warrant further consideration. For example, the great majority of the World Bank’s energy-related portfolio of development policy loans goes toward general policy reform and reforms related to natural gas. The World Bank does not publish full impact assessments of these loans and so it is difficult to fully assess the level of analysis of risks and alternatives that has gone into the preparation of these loans.
We were limited in our alignment analysis by the fact that we were only able to review direct investments, policy lending, and technical assistance/capacity building projects, and not indirect financing, except if it was tagged as energy-related. All three of these institutions lend indirectly via financial institutions and funds. Current reporting and disclosure practices make it very difficult to understand and assess alignment of MDBs’ indirect finance for energy supply investments.
Policy Implications The policy implications below are drawn from our research. We present them as areas for future dialogue among MDB shareholders (including the G7) and between the MDBs’ management and their boards.
Aligning the conditional. MDBs have an opportunity not only to pursue aligned projects and avoid misaligned ones, but also to establish the right conditions, project characteristics, and strategies for ensuring that all energy supply investments accelerate the transition to a low-carbon future.
Going beyond solar. As certain technologies mature (like solar PV, where the World Bank, IFC, and ADB are currently most active among aligned technolo-gies), MDBs should consider gradually shifting into newer technologies, like battery storage, to build new markets and avoid crowding out the private sector.
Coordinating public and private-sector arms. Lining up complementary support at the right points in the project or market development cycle could be a way to amplify impact. This can be done by getting public and private MDB arms to work together better. An example is the World Bank Group’s Scaling Solar initiative, under which the World Bank supports gov-ernments with plans to develop solar PV and integrate it into the grid, while the IFC offers a set of bankable documents (for example, PPAs) and preapproved financing, thereby speeding up the development process and reducing uncertainty (World Bank Group 2017).

WORKING PAPER | May 2017 | 41
Financing the Energy Transition
Crossing the gas bridge. If MDBs continue to build out and increase natural gas power generation capac-ity, they should work with their clients to anticipate the transition out of gas to zero carbon alternatives, make deep gains in energy efficiency, and/or have a plan to incorporate CCS. This will be necessary to make the bridge real.
Thinking twice about fossil fuel produc-tion. Development finance for fossil fuel production can effectively serve as a type of fossil fuel subsidy (Bast et al. 2015). G7 leaders—major MDB sharehold-ers—have committed to phase out inefficient fossil fuel subsidies by 2025 (G7 2016). The G7 should review MDB support for fossil fuel production in light of these commitments.
Exploring more refined approaches to existing large hydropower. As existing large hydropower plants age, questions about refurbishment will continue to arise. A better understanding of the available options, alternatives, and impacts will be helpful to determine whether these investments could be less controversial than installing new generation capacity.
Avoiding any misalignment and overcompensat-ing for exceptions. Given the MDBs’ commitments to help address the climate-change challenge, continued investments in fossil fuel generation should only occur while ramping up investments in fuel switching (to renewables), energy efficiency, and/or CCS technologies to minimize the climate impacts of misaligned projects. This will leave room for exceptions that meet particu-larly acute energy access challenges for which countries request financing for fossil fuel generation projects, particularly if these countries are very low emitters with low projected growth in energy demand.
Shining a light in dark corners. To fully understand the alignment of MDBs’ activities, it will be necessary for them to have the right systems in place to account for and disclose the climate impacts of their indirect support through financial intermediaries, as well as upstream advisory work that supports policies, institu-tions, and private-sector development.
Aiming for 1.5°C. As more literature becomes avail-able on pathways to limit temperature rise below 1.5 degrees, the MDBs and their shareholders would do well to follow these developments as they will likely shift our understanding of technologies that are aligned with achieving a low-carbon, sustainable future.
APPENDIX A Background on Project DatabasesWorld Bank Database ▪ The World Bank lending portfolio database was downloaded and finalized
from the World Bank website as of February 2017. We exclude advisory services and analytics for non-lending ASA activities; they are not publicly disclosed for the lending portfolio.
▪ Our database has active and closed projects approved in 2015 and 2016 and pipeline projects. We exclude dropped projects.
▪ We include World Bank projects with an “Energy and Mining” major sector tag and those with no sector data that were relevant to energy supply based on titles or project descriptions. We exclude demand-size energy efficiency and mining projects that did not involve fossil fuels or uranium.
▪ Our analysis is primarily based on the PAD, PID, project paper, or Integrated Safeguards documents.
▪ The World Bank administers many funds and product lines. We considered all projects in our analysis, even if they did not include IBRD/IDA resources. The database distinguishes between IBRD/IDA lending and total lending cost.
IFC Database ▪ The IFC database of investment projects (based on the Summary of
Investment Information (SIIs)) was downloaded and finalized from the IFC website as of February 2017.
▪ We include approved and completed projects with projected board approval dates for 2015 and 2016. Approved projects included projects pending signing, pending disbursement, active and completed.
▪ We include publicly disclosed pipeline projects disclosed between 2014 and February 2017 (promotion, pending mandate, pend PDS-IR, pend FAP, and hold). We exclude projects on hold with projected board dates older than 2015.
▪ We assume projected board date is the same year as the actual approval date.
▪ We include energy supply projects from industry categories: Agribusiness and Forestry; Infrastructure; Oil, Gas, and Mining; and Manufacturing. We exclude projects under Financial Institutions or Funds.
▪ Our analysis is based on information publicly disclosed in the SII and the Environmental and Social Review Summary (ESRS), when available.
ADB Database ▪ The ADB database was downloaded and finalized from the ADB website as
of February 2017. ▪ Our analysis is at the level of the project ID unit. Many of these units are
additional financing or transactions for a broader program or project; however, because they require board approval, we consider them separate projects for the purposes of this report.
▪ We included approved, active, and closed projects, as well as projects that were dropped/terminated after ADB board approval.
▪ We include ADB projects with an energy sector tag, excluding demand-side energy efficiency projects and projects with limited or no data.
▪ ADB administers many funds, including special funds, trust funds, financing partnership facilities, and others. We considered all projects in our analysis, even if they did not include ADB’s own resources. We captured sources and amounts as in the database, separated into broader columns for ADB’s own resources and MDB-managed external resources.

42 |
Financing the Energy Transition
APPENDIX BAlignment Analysis AssumptionsThe alignment analysis is based on investment areas and technologies outlined in the 2015 studies by Höhne et al., adapted for this paper in col-laboration with the original authors. The following explanation outlines our assumptions for how we tagged projects:
“Renewable energy,” when the source is not specified, refers to one or more of the following technologies: solar PV, wind, small hydropower, energy storage, geothermal, CSP, biomass, or biogas.
“Energy transmission and distribution” only refers to electricity T&D. “Fossil fuel production” includes anything that spans the upstream supply chain activities for fossil fuels; we distinguished between coal and oil and gas production. Thus, we included T&D for fuels as part of the fossil fuel produc-tion category (transportation and delivery of fossil fuels), based on the IPCC Energy Systems paper.
There are no globally accepted size categories for hydropower (IPCC), but for this paper and purposes of aligned categorization, we define small hydro as 10 MW or less. We also considered the project small hydro if MW are not provided in the project documents, but they explicitly describe the project as small or micro hydro.
Hydropower projects are considered large when they are greater than 10 MW (2015 IRENA Hydropower Technology Brief ).
Indicative Project-Specific Considerations for Conditional Technologies ▪ Gas-fired plants: Natural gas can be a bridge fuel from coal, but the
technology choice, expected lifetime (typically around 35 years), and ability to incorporate CCS will affect the long-term compatibility of these power plants and are important considerations, particularly for new build projects.
▪ Electricity transmission and distribution: Rehabilitating, improving, and expanding T&D infrastructure and capacity should increase the ability to integrate renewables onto the grid, efficiently manage the power system, and deliver renewable generation to end users. In grid expansion projects, the alternative sources of power without the grid as well as the scale and pace of efforts to decarbonize the grid are important considerations in considering their impacts on emissions. Specific T&D technologies also have an impact on electricity losses and therefore emissions. For example, high voltage direct current transmission systems have lower losses than lower voltage systems.
▪ District heating: Considered an efficient way to deliver urban heat supply. The power/fuel source, system design and flexibility, and technology/process—e.g., combined heat and power versus heat-only boilers— will affect the compatibility of these projects. Coal-fired district heating systems are considered misaligned.
▪ Mini-grids: These often involve a mix of power sources, for example, a renewable and backup source. The choice of backup technology, battery or diesel, will affect the emissions associated with the mini-grid. Mini-grids that run solely on diesel generators would be considered misaligned.
▪ Energy mix: For projects with multiple and distinct components, the technologies, fuel sources, emissions, and lock-in risks associated with each of the activities would need to be considered.
▪ Hybrid: These have similar considerations as energy mix projects, only there are multiple energy technologies at the component level, such as wind and solar PV (similar also to mini-grids, but can be smaller or larger in scale).
▪ Municipal solid waste to energy: The type of waste (organic versus nonorganic) and the process for turning the waste to energy (biogas versus incineration)
APPENDIX CBackground on the World Bank, International Finance Corporation, and Asian Development BankAlthough the MDBs in our study share similar broad development mandates, they do each have their own unique missions and approaches, as outlined below:
The World Bank Group—which includes the World Bank and IFC (along with the Multilateral Guarantee Agency and the International Centre for the Settlement of Investment Disputes, which are not part of this study)—has two ambitious goals: End extreme poverty within a generation and boost shared prosperity. ▪ The World Bank comprises two organizations: the International Bank
for Reconstruction and Development (IBRD) and the International Development Association (IDA).
□ IBRD works closely with the rest of the World Bank Group to help develop-ing countries reduce poverty, promote economic growth, and build pros-perity. IBRD provides a combination of financial resources, knowledge and technical services, and strategic advice to developing countries, including middle-income and credit-worthy lower-income countries.
□ IDA is the part of the World Bank that helps the world’s poorest coun-tries. IDA aims to reduce poverty by providing loans (called “credits”) and grants for programs that boost economic growth, reduce inequali-ties, and improve people’s living conditions.
▪ IFC focuses exclusively on the private sector in developing countries. IFC helps developing countries achieve sustainable growth by financing investment, mobilizing capital in international financial markets, and providing advisory services to businesses and governments.
The Asian Development Bank’s mission is to help its developing member coun-tries in Asia and the Pacific reduce poverty and improve the quality of life of their people. ADB is a regional development bank that focuses on fostering economic growth and cooperation in Asia, one of the poorest regions in the world. ADB as-sists its members, and partners, by providing loans, technical assistance, grants, and equity investments to promote social and economic development.
Source: World Bank, IFC, and ADB websites (2017).
Links to Project Cycle Information PagesWorld Bank: http://documents.worldbank.org/curated/en/696601478501928227/The-World-Bank-project-cycle
IFC: http://www.ifc.org/wps/wcm/connect/corp_ext_content/ifc_exter-nal_corporate_site/solutions/ifc-project-cycle
ADB: https://www.adb.org/site/disclosure/public-communications-policy/cycle
Information on Climate Finance Reporting The MDBs, namely, African Development Bank, Asian Development Bank, European Bank for Reconstruction and Development (EBRD), the European Invest-ment Bank (EIB), the Inter-American Development Bank Group (IDBG), and the World Bank Group (WBG), currently report climate finance for mitigation under the Common Principles for Climate Mitigation Finance Tracking (AfDB et al. 2016). The principles were developed by the joint climate finance group of MDBs and the International Development Finance Club (IDFC).
According to the principles, activities are considered climate-change mitigation if they promote “efforts to reduce or limit greenhouse gas (GHG) emissions or enhance GHG sequestration” (OECD/DAC Climate Markers, September 2011, as cited in Common Principles for Climate Mitigation Finance Tracking). Report-ing under the principles does not imply evidence of climate-change impacts. Project-specific data are needed to demonstrate GHG emissions mitigation.
The principles stress conservativeness in reporting and are based on activity types (as opposed to purpose, origin of resources, or actual results). Activi-
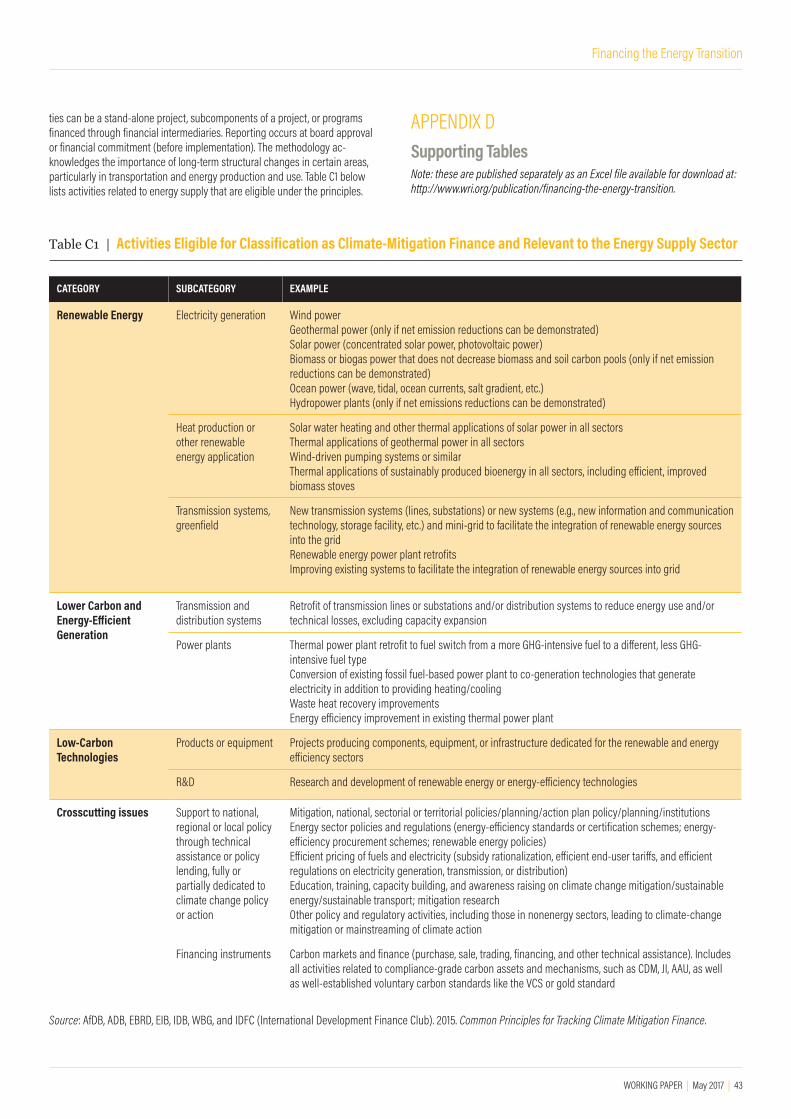
WORKING PAPER | May 2017 | 43
Financing the Energy Transition
Table C1 | Activities Eligible for Classification as Climate-Mitigation Finance and Relevant to the Energy Supply Sector
CATEGORY SUBCATEGORY EXAMPLE
Renewable Energy Electricity generation Wind powerGeothermal power (only if net emission reductions can be demonstrated)Solar power (concentrated solar power, photovoltaic power)Biomass or biogas power that does not decrease biomass and soil carbon pools (only if net emission reductions can be demonstrated)Ocean power (wave, tidal, ocean currents, salt gradient, etc.)Hydropower plants (only if net emissions reductions can be demonstrated)
Heat production or other renewable energy application
Solar water heating and other thermal applications of solar power in all sectorsThermal applications of geothermal power in all sectorsWind-driven pumping systems or similarThermal applications of sustainably produced bioenergy in all sectors, including efficient, improved biomass stoves
Transmission systems, greenfield
New transmission systems (lines, substations) or new systems (e.g., new information and communication technology, storage facility, etc.) and mini-grid to facilitate the integration of renewable energy sources into the gridRenewable energy power plant retrofitsImproving existing systems to facilitate the integration of renewable energy sources into grid
Lower Carbon and Energy-Efficient Generation
Transmission and distribution systems
Retrofit of transmission lines or substations and/or distribution systems to reduce energy use and/or technical losses, excluding capacity expansion
Power plants Thermal power plant retrofit to fuel switch from a more GHG-intensive fuel to a different, less GHG-intensive fuel typeConversion of existing fossil fuel-based power plant to co-generation technologies that generate electricity in addition to providing heating/coolingWaste heat recovery improvementsEnergy efficiency improvement in existing thermal power plant
Low-Carbon Technologies
Products or equipment Projects producing components, equipment, or infrastructure dedicated for the renewable and energy efficiency sectors
R&D Research and development of renewable energy or energy-efficiency technologies
Crosscutting issues Support to national, regional or local policy through technical assistance or policy lending, fully or partially dedicated to climate change policy or action
Mitigation, national, sectorial or territorial policies/planning/action plan policy/planning/institutionsEnergy sector policies and regulations (energy-efficiency standards or certification schemes; energy-efficiency procurement schemes; renewable energy policies)Efficient pricing of fuels and electricity (subsidy rationalization, efficient end-user tariffs, and efficient regulations on electricity generation, transmission, or distribution)Education, training, capacity building, and awareness raising on climate change mitigation/sustainable energy/sustainable transport; mitigation researchOther policy and regulatory activities, including those in nonenergy sectors, leading to climate-change mitigation or mainstreaming of climate action
Financing instruments Carbon markets and finance (purchase, sale, trading, financing, and other technical assistance). Includes all activities related to compliance-grade carbon assets and mechanisms, such as CDM, JI, AAU, as well as well-established voluntary carbon standards like the VCS or gold standard
Source: AfDB, ADB, EBRD, EIB, IDB, WBG, and IDFC (International Development Finance Club). 2015. Common Principles for Tracking Climate Mitigation Finance.
ties can be a stand-alone project, subcomponents of a project, or programs financed through financial intermediaries. Reporting occurs at board approval or financial commitment (before implementation). The methodology ac-knowledges the importance of long-term structural changes in certain areas, particularly in transportation and energy production and use. Table C1 below lists activities related to energy supply that are eligible under the principles.
APPENDIX DSupporting Tables Note: these are published separately as an Excel file available for download at: http://www.wri.org/publication/financing-the-energy-transition.

44 |
Financing the Energy Transition
REFERENCESADB (Asian Development Bank). 2009. “Energy Policy.” https://www.adb.org/sites/default/files/institutional-document/32032/energy-policy-2009.pdf.
ADB. 2014. “Midterm Review of Strategy 2020: Meeting the Challenges of a Transforming Asia and Pacific.” https://www.adb.org/sites/default/files/institutional-document/34149/files/midterm-review-strategy-2020-r-paper.pdf.
ADB. 2015a. “Mongolia: Combined Heat and Power Plant Number 5 Project (CHP5).” Project Document, Nonsovereign Project 46915-014. https://www.adb.org/projects/46915-014/main#project-pds.
ADB. 2015b. “Nauru: Electricity Supply Security and Sustainability— Additional Financing.” Project Document, Sovereign Project 46455-004. https://www.adb.org/projects/46455-004/main.
ADB. 2016a. “2015 Annual Report Asian Development Bank: Scaling Up to Meet New Development Challenges.” https://www.adb.org/sites/default/files/institutional-document/182852/adb-annual-report-2015.pdf.
ADB. 2016b. “Mongolia: Strengthening Electricity and Heat Supply Network in Ulaanbaatar.” Project Document, Sovereign Project 46343-001. https://www.adb.org/projects/46343-001/main#project-pds.
ADB. 2017a. “Environment Safeguards.” https://www.adb.org/site/safeguards/environment.
ADB. 2017b. “Mongolia: Ulaanbaatar Urban Services and Ger Areas Development Investment Program—Tranche 2.” Project Document, Sovereign Project 45007–005. https://www.adb.org/projects/45007-005/main#project-pds.
ADB. 2017c. “Pakistan: MFF Hydropower Development Investment Program.” Project Document, Sovereign Project 49055-002. https://www.adb.org/projects/49055-002/main.
AfDB (African Development Bank), ADB, EBRD (European Bank for Reconstruction and Development), EIB (European Investment Bank), IDB (Inter-American Development Bank), and WBG (World Bank Group). 2015a. From Billions to Trillions: MDB Contributions to Financing for Development. Washington, DC: World Bank Group. http://documents.worldbank.org/curated/en/602761467999349576/pdf/98023-BR-SecM2015-0233-IDA-SecM2015-0147-IFC-SecM2015-0105-MIGA-SecM2015-0061-Box391499B-OUO-9.pdf.
AfDB, ADB, EBRD, EIB, IDB, WBG and IDFC (International Development Finance Club). 2015b. “Common Principles for Tracking Climate Mitigation Finance.” http://www.ifc.org/wps/wcm/connect/65d37952-434e-40c1-a9df-c7bdd8ffcd39/MDB-IDFC+Common-principles-for-climate-mitigation-finance-tracking.pdf?MOD=AJPERES.
AfDB, ADB, EBRD, EIB, IDB, and WBG. 2016. “2015 Joint Report on Multilateral Development Banks’ Climate Finance.” http://www.eib.org/attachments/documents/joint_mdb_report_on_climate_finance_2015.pdf.
Amerasinghe, N., J. Thwaites, G. Larsen, and A. Ballesteros. 2017. The Future of the Funds: Exploring the Architecture of Multilateral Climate Finance. Washington, DC: World Resources Institute. http://www.wri.org/publication/future-of-the-funds.
BIC (Bank Information Center). 2017. “World Bank Development Policy Finance Props up Fossil Fuels and Exacerbates Climate Change: Findings from Peru, Indonesia, Egypt, and Mozambique.” http://www.bankinformationcenter.org/wp-content/uploads/2017/01/Exec-Summary-1.11.17-2.pdf.
Bast, E., A. Doukas, S. Pickard, L. van der Burg, and S. Whitley. 2015. Empty Promises: G20 Subsidies to Oil, Gas and Coal Production. London and
Washington, DC: Overseas Development Institute and Oil Change International. https://www.odi.org/sites/odi.org.uk/files/odi-assets/publications-opinion-files/9957.pdf
Bruckner, T., I.A. Bashmakov, Y. Mulugetta, H. Chum, A. de la Vega Navarro, J. Edmonds, A. Faaij, et al. 2014. “Energy Systems.” In Climate Change 2014: Mitigation of Climate Change. Contribution of Working Group III to the Fifth Assessment Report of the Intergovernmental Panel on Climate Change, edited by O. Edenhofer, R. Pichs-Madruga, Y. Sokona, E. Farahani, S. Kadner, K. Seyboth, A. Adler, I. Baum, S. Brunner, P. Eickemeier, B. Kriemann, J. Savolainen, S. Schlömer, C. von Stechow, T. Zwickel and J.C. Minx. Cambridge, UK, and New York: Cambridge University Press.
CAO (Compliance Advisor/Ombudsman). 2013. “CAO Compliance Audit of IFC’s Financial Sector Investments.” http://www.cao-ombudsman.org/newsroom/documents/FIAUDIT.htm.
CAO. 2017. “Third Monitoring Report of IFC’s Response to: CAO Audit of a Sample of IFC Investments in Third-Party Financial Intermediaries.” http://www.cao-ombudsman.org/newsroom/documents/documents/CAOMonitoringReport_FIAudit_March2017.pdf.
Carbon Tracker Initiative and Grantham Research Institute on Climate Change and the Environment. 2013. “Unburnable Carbon 2013: Wasted Capital and Stranded Assets.” London School of Economics. http://www.carbontracker.org/wp-content/uploads/2014/09/Unburnable-Carbon-2-Web-Version.pdf.
G7 (Group of Seven). 2016. “G7 Ise-Shima Leaders’ Declaration.” http://www.mofa.go.jp/mofaj/files/000160266.pdf.
Greenpeace International, Global Wind Energy Council, Solar Power Europe. 2015. Energy [R]evolution: A Sustainable World Energy Outlook. 5th Edition, World Energy Scenario. Hamburg, Greenpeace.
Höhne, N., C. Bals, F. Röser, L. Weischer, M. Hagemann, A. El Alaoui, D. Eckstein, J. Thomä, and M. Rossé. May 2015. “Developing Criteria to Align Investments with 2°C Compatible Pathways.” NewClimate Institute, Germanwatch, and 2 Degrees Investing Initiative. https://newclimateinstitute.files.wordpress.com/2015/06/2015-06-01-investments-global-temperature-increase.pdf.
Höhne, N., F. Röser, M. Hagemann, L. Weischer, A. El Alaoiu, C. Bals, D. Eckstein, S. Kreft, J. Thomä, and M. Rossé. November 2015. “Developing 2°C Compatible Investment Criteria.” NewClimate Institute, Germanwatch, and 2 Degrees Investing Initiative. https://newclimate.org/2015/11/30/developing-2c-compatible-investment-criteria/.
IEA (International Energy Agency). 2009. “Co-generation and District Energy: Sustainable Energy Technologies for Today and Tomorrow.” https://www.iea.org/media/topics/cleanenergytechnologies/chp/CHPbrochure09.pdf, p. 12.
IEA. 2015. World Energy Outlook 2015. Paris: OECD/IEA.
IFC (International Finance Corporation). 2012. “Performance Standards on Environmental and Social Sustainability.” http://www.ifc.org/wps/wcm/connect/115482804a0255db96fbffd1a5d13d27/PS_English_2012_Full-Document .pdf?MOD=AJPERES.
IFC. 2016a. “Annual Report 2016: Experience Matters.” https://openknowledge.worldbank.org/bitstream/handle/10986/25084/IFC_AR16_Full_Volume1.pdf?sequence=1&isAllowed=y.
IFC. 2016b. “IFC Climate Change Implementation Plan.” https://www.ifc.org/wps/wcm/connect/5f5402804c60b510b6bbbeaccf53f33d/IFC_Climate_Implementation_Plan_03152016_WBG_v2.pdf?MOD=AJPERES.

WORKING PAPER | May 2017 | 45
Financing the Energy Transition
IFC. 2017a. “IFC’s Priorities in Oil and Gas.” http://www.ifc.org/wps/wcm/connect/Industry_EXT_Content/IFC_External_Corporate_Site/OGM+Home/Priorities/Oil+and+Gas/.
IFC. 2017b. “Overview: About IFC.” http://www.ifc.org/wps/wcm/connect/CORP_EXT_Content/IFC_External_Corporate_Site/About+IFC_New.
IPCC (Intergovernmental Panel on Climate Change). 2014. Climate Change 2014: Synthesis Report. Contribution of Working Groups I, II, and III to the Fifth Assessment Report of the Intergovernmental Panel on Climate Change, edited by R.K. Pachauri and L.A. Meyer. Geneva, Switzerland: IPCC.
IPCC. 2016. “XLIV/Doc. 11 (19.IX.2016).”
IRENA (International Renewable Energy Agency). 2015. Hydropower Technology Brief. Paris: IRENA. http://www.irena.org/DocumentDownloads/Publications/IRENA-ETSAP_Tech_Brief_E06_Hydropower.pdf.
Lazarus, M., K. Tempest, P. Klevnäs, and J. Korsbakken. 2015. Natural Gas: Guardrails for a Potential Climate Bridge. New Climate Economy contributing paper. Stockholm, Sweden: Stockholm Environment Institute.
McGlade, C., and P. Ekins. 2015. “The Geographical Distribution of Fossil Fuels Unused When Limiting Global Warming to 2°C.” Nature 517: 187–90. doi:10.1038/nature14016.
Miyamoto, K., and E. Chiofalo. 2016. “Official Development Finance for Infrastructure: With a Special Focus on Multilateral Development Banks.” Working Paper No. 30. Paris: OECD Development Cooperation. http://www.oecd-ilibrary.org/docserver/download/9e93790e-en.pdf?expires=1488128494&id=id&accname=guest&checksum=A7424482A21259671E5340E58C6B8C51.
Mott MacDonald. 2015. “MON: Combined Heat and Power Plant Number 5 Project.” Draft Environmental and Social Impact Assessment, Project number 46915-014. https://www.adb.org/sites/default/files/project-document/175845/46915-014-esia-01.pdf.
Nassiry, D., S. Nakhooda, and S. Barnard. 2016. “Finding the Pipeline: Project Preparation for Sustainable Infrastructure.” New Climate Economy Working Paper. London: Overseas Development Institute.
NCE (New Climate Economy). 2016. The Sustainable Infrastructure Imperative: Financing for Better Growth and Development. Washington, DC: New Climate Economy. http://newclimateeconomy.report/2016/wp-content/uploads/sites/4/2014/08/NCE_2016Report.pdf.
OECD (Organisation for Economic Co-Operation and Development). 2015. Climate Finance in 2013–14 and the USD 100 Billion Goal: A Report by the OECD in collaboration with Climate Policy Initiative. Paris: OECD Publishing.
OECD/IEA. 2017. Chapter 2: Perspectives for the Energy Transition—Investment Needs for a Low-Carbon Energy System. Paris: OECD/IEA.
Oil Change International. 2016. The Sky’s Limit: Why the Paris Climate Goals Require a Managed Decline of Fossil Fuel Production. Washington DC: Oil Change International. http://priceofoil.org/content/uploads/2016/09/OCI_the_skys_limit_2016_FINAL_2.pdf.
Paltsev, S. 2016. “Energy Scenarios: The Value and Limits of Scenario Analysis.” MIT Center for Energy and Environmental Policy Research. Working Paper 2016-007. http://ceepr.mit.edu/files/papers/2016-007.pdf.
Pfeiffer, A., R. Millara, C. Hepburn, and E. Beinhockera. 2016. “The ‘2°C capital stock’ for electricity generation: Committed cumulative carbon emissions from the electricity generation sector and the transition to a green economy.” Applied Energy 179: 1395–1408. doi:http://doi.org/10.1016/j.apenergy.2016.02.093.
Rogelj, J., G. Luderer, C. Pietzcker, E. Kriegler, M. Schaeffer, V. Krey, and K. Riahi. 2016. “Energy System Transformations for Limiting End-of-Century Warming to below 1.5C.” Nature Climate Change 5: 519–527.
Searchinger, T., and R. Heimlich. 2015. “Avoiding Bioenergy Competition for Food Crops and Land: Creating a Sustainable Food Future, Installment Nine.” Working Paper. Washington, DC: World Resources Institute.
Schleussner, C., T. Lissner, E. Fischer, J. Wohland, M. Perrette, A. Golly, J. Rogelj, et al. 2016. “Differential Climate Impacts for Policy-Relevant Limits to Global Warming: The Case of 1.5°C and 2°C.” Earth System Dynamics 7: 327–351.
UN (United Nations). 2017a. “Climate Change—United Nations Sustainable Development.” http://www.un.org/sustainabledevelopment/climate-change-2/.
UN. 2017b. “Energy—United Nations Sustainable Development.” http://www.un.org/sustainabledevelopment/energy/.
UN. 2017c. “Global Partnerships—United Nations Sustainable Development.” http://www.un.org/sustainabledevelopment/globalpartnerships/.
UN. 2017d. “Sustainable Development Goals—United Nations.” http://www.un.org/sustainabledevelopment/sustainable-development-goals/ .
UN DESA (UN Department of Economic and Social Affairs). 2017. “Financing for Development.” http://www.un.org/esa/ffd/publications/aaaa-outcome.html.
UNEP (United Nations Environment Programme). 2016. The Emissions Gap Report 2016: A UNEP Synthesis Report. Nairobi: United Nations Environment Programme (UNEP) . http://bit.ly/2fhCX3x.
UNFCCC. 2009. “Copenhagen Climate Change Conference.” http://unfccc.int/meetings/copenhagen_dec_2009/meeting/6295.php.
UNFCCC (United Nations Framework Convention on Climate Change). 2010. “Cancun Agreement.” https://unfccc.int/resource/docs/2010/cop16/eng/07a01.pdf.
UNFCCC. 2016. “Paris Agreeement.” http://unfccc.int/files/essential_background/convention/application/pdf/english_paris_agreement.pdf.
U.S. EIA (United States Energy Information Administration). 2017. “International—U.S. Energy Information Administration.” https://www.eia.gov/beta/international/.
Venugopal, S., and A. Srivastava. 2012. Moving the Fulcrum: A Primer on Public Climate Financing Instruments Used to Leverage Private Capital. Washington, DC: World Resources Institute. http://www.wri.org/publication/moving-fulcrum.
World Bank. 2011. “Kosovo Power Project.” Project Information Document, Report No.: AB6334. http://documents.worldbank.org/curated/en/913151468271574701/pdf/1108030Kosovo00PID000concept0stage.pdf.
World Bank. 2013. “Toward a sustainable energy future for all: directions for the World Bank Group’s energy sector.” http://documents.worldbank.org/curated/en/745601468160524040/Toward-a-sustainable-energy-future-for-all-directions-for-the-World-Bank-Group-8217-s-energy-sector.
World Bank. 2015a. “Developing Common Principles for Tracking Climate Finance.” http://www.worldbank.org/en/news/feature/2015/04/03/common-principles-for-tracking-climate-finance.
World Bank. 2015b “Gambia Electricity Support Project.” Project Appraisal Document, Report No.: PAD1375. http://documents.worldbank.org/curated/en/847081468197378280/pdf/PAD1375-PAD-P152659-IDA-R2016-0067-1-OUO-9.pdf.

46 |
Financing the Energy Transition
World Bank. 2015c. “Press Release: Major Financial Institutions Move to Integrate Climate Change.” http://www.worldbank.org/en/news/press-release/2015/12/07/major-financial-institutions-move-to-integrate-climate-change.
World Bank. 2016a. “Environmental and Social Framework: Setting Environmental and Social Standards for Investment Project Financing.” http://consultations.worldbank.org/Data/hub/files/consultation-template/review-and-update-world-bank-safeguard-policies/en/materials/the_esf_clean_final_for_public_disclosure_post_board_august_4.pdf.
World Bank. 2016b. “Poverty Overview.” http://www.worldbank.org/en/topic/poverty/overview.
World Bank. 2017a. “Climate and Disaster Risk Screening Tools.” http://climatescreeningtools.worldbank.org/.
World Bank. 2017b. “International Bank for Reconstruction and Development.” http://www.worldbank.org/en/who-we-are/ibrd.
World Bank Group. 2015. “2015 Development Policy Financing Retrospective: Results and Sustainability.” http://pubdocs.worldbank.org/en/420441457100264616/DevelopmentPolicyRetrospective2015.pdf.
World Bank Group. 2016a. “Sierra Leone Western Area Power Generation (P153805).” Project Appraisal Document, Report No.: 103305-SL. http://documents.worldbank.org/curated/en/617041468589434922/pdf/103305-PAD-P153805-IDA-R2016-0174-1-Box396252B-OUO-9.pdf.
World Bank Group. 2016b. “World Bank Group Climate Change Action Plan.” http://pubdocs.worldbank.org/en/677331460056382875/WBG-Climate-Change-Action-Plan-public-version.pdf.
World Bank Group. 2017. “Scaling Solar.” http://www.scalingsolar.org/.
WWF (World Wildlife Fund). 2011. The Energy Report. Gland, Switzerland: WWF—World Wide Fund for Nature. http://www.worldwildlife.org/publications/the-energy-report.
WORKING PAPER | May 2017 | 47
Financing the Energy Transition
ENDNOTES1. WRI analysis based on institutions’ 2015 annual reports and the 2015 Joint
Report on Multilateral Development Banks’ Climate Finance. See Table 1.
2. SDG 7 is to “Ensure access to affordable, reliable, sustainable, and modern energy for all” and SDG 13 is to “Take urgent action to combat climate change and its impacts.” (UN 2017d)
3. “Sustainable Development Goal 13: Take urgent action to combat climate change and its impacts.” (UN 2017a)
4. The term MDBs is used in this paper to collectively refer to the African De-velopment Bank (AfDB), the Asian Development Bank (ADB), the European Bank for Reconstruction and Development (EBRD), the European Invest-ment Bank (EIB), the Inter-American Development Bank Group (IDBG), and the World Bank Group (WBG). However, there are other multilateral development banks, such as the Asia Infrastructure Investment Bank (AIIB), CAF-Development Bank of Latin America, and the Islamic Develop-ment Bank.
5. These figures (based on data from 2013–2014) are lower than the MDBs’ own estimates because they only include finance attributed to developed countries.
6. According to a 2016 OECD study, the top 10 development partners of ODF for infrastructure were (in order) the World Bank Group, Japan, Asian Develop-ment Bank, European Union Institutions, Korea, Germany, Inter-American Development Bank Group, African Development Bank, France, and CAF-Development Bank of Latin America. The authors note that the sources of financing for infrastructure are largely concentrated among a few develop-ment partners, with the top 5 financing almost 55 percent and the top 10 financing 75 percent of the total ODF (Miyamoto and Chiofalo 2016).
7. In their 2016 OECD study, Miyamoto and Chiofalo estimate that investments in energy infrastructure accounted for 35 percent of ODF disbursements in 2014 (transport accounted for 42 percent, water and sanitation for 19 percent, and communication for 4 percent). The working paper also cites UNCTAD estimates suggesting that the investment gap is much higher for energy than transport, at 44 percent and 22 percent, respectively.
8. Although countries agreed in Paris to strive for 1.5⁰C, methodological constraints (discussed in Section 2) drove us to explore the question of alignment with 2⁰C in this working paper.
9. WRI analysis based on institutions’ 2015 annual reports and the 2015 Joint Report on Multilateral Development Banks’ Climate Finance. See Table 1.
10. With the caveat that the infrastructure universe of projects considered for this ODF figure includes other activities outside the energy sector (for ex-ample, roads, airports, ports, etc.) (Miyamoto and Chiofalo 2016). The ADB is also of interest because of the concentration of new coal/high emitting power sector investments planned in Asia for which countries may turn to the ADB for support. The NCE found that more than 80 percent of the new coal power plants due to start operation between 2015 and 2020 are in just six Asian countries: China, India, Vietnam, Indonesia, the Philippines and Pakistan (NCE 2016).
11. The Paris Agreement also refers to the need for net-zero emissions by stating: “(…) to achieve a balance between anthropogenic emissions by sources and removals by sinks of greenhouse gases in the second half of this century” (Article 4.1); meaning, emissions can continue, but must be balanced by negative emissions technologies or activities, for example, reforestation and bioenergy carbon capture and storage.
12. In cases where exact breakdowns were unavailable, we made informed estimates as to how the resources were divided among the components, based on the project characteristics. For equity investments (by the IFC) that involved multiple components, due to the more amorphous nature of
equity stakes in companies, we did not make any estimates about the dis-tribution but captured the finance amounts for the components jointly (e.g., natural gas-fired power plant and district heating together—see Figure 12).
13. More information about the initiative is available on the European Invest-ment Bank webpage, “Mainstreaming climate action within financial institutions,” http://www.eib.org/about/global-cooperation/climate/fi-climate-mainstreaming.htm.
14. For more information, refer to the Carbon Pricing Leadership Coalition page, https://www.carbonpricingleadership.org/.
15. For the purposes of our analysis, DPLs were tagged based on the prior actions and indicators associated with that DPF operation.
16. Many of these projects aim to support implementation of the Extractive Industries Transparency Initiative, or EITI. For more information, see the EITI website: https://eiti.org/.
17. The Bank Information Center (BIC) explored this topic in its recent report (BIC 2017). The World Bank’s response and BIC’s rebuttal can be found at “BIC Rebuttal to the World Bank’s Response to BIC’s case studies on De-velopment Policy Operations in Peru, Egypt, Mozambique, and Indonesia,” March 9, 2017. http://www.bankinformationcenter.org/bic-rebuttal-to-the-world-banks-response-to-bics-case-studies-on-development-policy-operations-in-peru-egypt-mozambique-and-indonesia/.
18. Our project number analysis was conducted at the project unit level. If projects had a combination of aligned, conditional, misaligned, or controversial components, we categorized the entire project as the least aligned or clear category—that is, if a project had aligned and conditional subcomponents, we categorized the entire project as conditional; if a project had both conditional and controversial components, we catego-rized the entire project as controversial. Any project that had a misaligned component was categorized as misaligned.
19. Fragile situation countries are countries that the World Bank identifies as being affected by violence and instability. For more information, see the World Bank’s page, “The Harmonized List of Fragile Situations.” http://www.worldbank.org/en/topic/fragilityconflictviolence/brief/harmonized-list-of-fragile-situations.
20. IFC’s Action Plan and continuous improvement process details are based on information provided to WRI by the IFC.
21. The IFC does not tag its advisory services by sector. To identify relevant projects, we searched the IFC’s database using the following key words: coal, electricity, energy, gas, geothermal, heating, hydropower, nuclear, power, solar, and wind. The IFC does not list advisory services in the pipeline.
22. Nearly 40 percent of infrastructure projects also had components of technical assistance.
23. More information is available through the project pages: Technical As-sistance Pilot Carbon Capture and Storage Activity in the Natural Gas Processing Sector, Project ID: 49204-002, https://www.adb.org/proj-ects/49204-002/main and Feasibility Assessment of an Industrial Scale Carbon Capture Utilization and Storage (CCUS), Project ID: 48453-001, https://www.adb.org/projects/48453-001/main.
24. Research published by Oil Change International in 2016—using a different methodology—reached a similar conclusion as the McGlade and Ekins (2015) study. In its study, Oil Change International found that the potential carbon emissions from the oil, gas, and coal in the world’s currently op-erating fields and mines would take us beyond 2°C of warming. Moreover, the reserves in currently operating oil and gas fields alone, even with no coal, would take the world beyond 1.5°C. In light of this, Oil Change Inter-national argues for a managed decline of fossil fuel production, including by halting the construction of or government permitting for new fossil fuel extraction or transportation infrastructure (Oil Change International 2016).

ACKNOWLEDGMENTSThis paper has been commissioned by the Italian Presidency of the G7 Envi-ronment. We would like to thank the Ministry of the Environment, Land & Sea of Italy, whose generous financial contribution made this publication possible. We are particularly grateful to Francesco La Camera (Director General for Sus-tainable Development, EU & Global Affairs), Aldo Ravazzi, Gionata Castaldi, and Karima Oustadi (T.A. Sogesid) for their valuable inputs, guidance, and review.
The authors would like to acknowledge the many people who supported this publication. Thanks go to our colleagues at WRI: Taryn Fransen, Jan Corfee- Morlot, Kelly Levin, Shilpa Patel, and Helen Mountford for their extensive con- tributions, expert guidance, and feedback; Finance Center colleagues for their valuable support and research assistance: Niranjali Amerasinghe, Lee Hager, Indira Masullo, Ariel Pinchot, Joe Thwaites, and Lihuan Zhou; Deborah Drew, Tirthankar Mandal, Sarah Martin, and Debbie Weyl for their peer review; Daryl Ditz for shepherding the publication through review, and Leonardo Martinez- Diaz for his guidance and strategic advice. We would like to thank Devika Jaipuriar for her programmatic support. We also wish to acknowledge all those who granted their valuable support in editing, graphic design, layout, and printing: Bill Dugan, Carin Hall, Carni Klirs, Emily Matthews, Julie Moretti, Lauri Scherer, and Caroline Taylor.
We would like to thank various external experts who supported this pub-lication, including Frauke Röser, Lutz Weischer, Julia Bingler, and Markus Hagemann for their collaboration on the methodology and feedback on the draft working paper. We are grateful to the following external experts for their review: Naeeda Crishna Morgado, Alex Doukas, Francis Masawi, and Chiara Trabacchi. We benefited from inputs and suggestions from experts at the G7 Environment Meeting on MDBs Supporting the Paris Agreement and SDGs, held in Rome in March 2017. We received valuable feedback and insights from the following staff at the multilateral development banks covered in this paper: James Close, Zuzana Dobrotkova, Stephen Hammer, Rohit Khanna, Gisu Mohadjer, Neha Mukhi, Kevin Nyamweya, Neeraj Prasad, Riccardo Puliti, Monali Ranade, John Roome, Anne Schopp, Sundus Siddiqi, Michael Stanley (World Bank); Shari Friedman, Dan Goldblum, Alzbeta Klein, Liane Lohde, Rusmir Music, Peer Stein (IFC); Preety Bhandari, David Elzinga, Charito Isidro, Esmyra Javier, and Yongping Zhai (ADB).
We are pleased to acknowledge our institutional strategic partners, who provide core funding to WRI: Netherlands Ministry of Foreign Affairs, Royal Danish Ministry of Foreign Affairs, and Swedish International Development Cooperation Agency.
10 G Street NE | Washington, DC 20002 | WRI.org
Copyright 2017 World Resources Institute. This work is licensed under the Creative Commons Attribution 4.0 International License. To view a copy of the license, visit http://creativecommons.org/licenses/by/4.0/
ABOUT THE AUTHORSGiulia Christianson is a Senior Associate with the Finance Center at WRI.Contact: [email protected]
Allison Lee is a Research Analyst II with the Finance Center at WRI.Contact: [email protected]
Gaia Larsen is a Senior Associate with the Finance Center at WRI.Contact: [email protected]
Ashley Green is a Research Analyst I with the Finance Center at WRI.Contact: [email protected]
ABOUT WRI World Resources Institute is a global research organization that turns big ideas into action at the nexus of environment, economic opportunity, and human well-being.
Our ChallengeNatural resources are at the foundation of economic opportunity and human well-being. But today, we are depleting Earth’s resources at rates that are not sustainable, endangering economies and people’s lives. People depend on clean water, fertile land, healthy forests, and a stable climate. Livable cities and clean energy are essential for a sustainable planet. We must address these urgent, global challenges this decade.
Our VisionWe envision an equitable and prosperous planet driven by the wise manage-ment of natural resources. We aspire to create a world where the actions of government, business, and communities combine to eliminate poverty and sustain the natural environment for all people.
Our ApproachCOUNT ITWe start with data. We conduct independent research and draw on the latest technology to develop new insights and recommendations. Our rigorous analysis identifies risks, unveils opportunities, and informs smart strategies. We focus our efforts on influential and emerging economies where the future of sustainability will be determined.
CHANGE ITWe use our research to influence government policies, business strategies, and civil society action. We test projects with communities, companies, and government agencies to build a strong evidence base. Then, we work with partners to deliver change on the ground that alleviates poverty and strength-ens society. We hold ourselves accountable to ensure our outcomes will be bold and enduring.
SCALE ITWe don’t think small. Once tested, we work with partners to adopt and expand our efforts regionally and globally. We engage with decision-makers to carry out our ideas and elevate our impact. We measure success through govern-ment and business actions that improve people’s lives and sustain a healthy environment.