financing growth foreign aid vs. foreign loans
DESCRIPTION
Foreign aid and povertyTRANSCRIPT

Research Division Federal Reserve Bank of St. Louis Working Paper Series
Financing Growth: Foreign Aid vs. Foreign Loans
Subhayu Bandyopadhyay Sajal Lahiri
and Javed Younas
Working Paper 2013-031A http://research.stlouisfed.org/wp/2013/2013-031.pdf
October 2013
FEDERAL RESERVE BANK OF ST. LOUIS Research Division
P.O. Box 442 St. Louis, MO 63166
______________________________________________________________________________________
The views expressed are those of the individual authors and do not necessarily reflect official positions of the Federal Reserve Bank of St. Louis, the Federal Reserve System, or the Board of Governors.
Federal Reserve Bank of St. Louis Working Papers are preliminary materials circulated to stimulate discussion and critical comment. References in publications to Federal Reserve Bank of St. Louis Working Papers (other than an acknowledgment that the writer has had access to unpublished material) should be cleared with the author or authors.
This draft: October 10, 2013
Financing Growth: Foreign Aid vs. Foreign Loans
By
Subhayu Bandyopadhyay§, Sajal Lahiri‡ and Javed Younas§§
Abstract
Compared to foreign grants, do concessional loans from foreign governments and/or unsubsidized loans from foreign private banks lead to faster growth in developing nations? The answer has implications for aid agencies (i) in allocating a given amount of resources between grants and concessional loans; and (ii) in encouraging financial market reforms. We examine the effects of ODA grants, concessional ODA loans, and private offshore bank loans on growth rates of 131 developing nations over 1996-2010 in a unified way. We find evidence of non-linearities in all three relationships, suggesting that at low (high) levels grants are better (worse) than loans (concessional or private). Keywords: Foreign aid, concessional loans, offshore bank loans, economic growth. JEL Classification: F35, O10. ______________________
§ Federal Reserve Bank of St. Louis, Research Division, PO Box 442, St. Louis, MO 63166-0442, U.S.A.; and Research Fellow at IZA, Bonn, Germany; E-mail: [email protected] ‡ Department of Economics, Southern Illinois University Carbondale, Carbondale, IL 62901-4515, U.S.A.; E-mail: [email protected] §§ Department of Economics, American University of Sharjah, PO Box 26666, Sharjah, UAE; Email: [email protected] The views expressed are those of the authors and do not necessarily represent official positions of the Federal Reserve Bank of St. Louis or of the Federal Reserve System.

1
1 Introduction
The literature has explored effects of foreign aid on growth. Another strand of the literature has
explored effects of credits on growth. In the context of developing nations needing scarce external
resources, this poses the following question. Compared to foreign aid, do external loans lead to
faster growth in developing nations? This is the central question of our study. The answer has
implications for aid agencies (i) in deciding on the allocation of a given amount of aid dollars
between grants and concessional loans; and (ii) in encouraging financial market reforms for the
inflow of private foreign capital. Our central question also relates to the strand of literature which is
critical of foreign aid and suggests that it should be replaced by better access to international credit
(see, for example, Bauer, 1971).
Empirical studies on the effectiveness of foreign aid can be broadly classified into three
types: foreign aid works (see for example Dalgaard et al., 2004; Hansen and Tarp, 2000); foreign aid
does not work (see, for example, Easterly, 2003); and foreign aid works under some conditions
(Burnside and Dollar, 2000; Collier and Dollar, 2002). Foreign aid can help foster the economic
growth of a developing country through various channels: (i) they add to the investible resources for
domestic investment, and, thus, augment capital stock; and (ii) they can bridge the foreign exchange
gap of a developing country, which, in turn, may provide it with a necessary cushion to import
capital goods.1 On the other hand, aid flows can also have effects that are detrimental to the
recipient’s economy: (i) transfers to the governments may induce politicians to engage in its
misappropriation; and (ii) large inflows can result in overvaluation of exchange rate of a recipient
country, which may render its exports less competitive in the world market. Since most of foreign
aid constitutes direct transfers to governments, its impact on economic growth also depends on how
it is utilized. If aid is used to finance complementary goods in developing countries, such as
1 These arguments are based on the so-called two-gap model of economic development.

2
infrastructure and human development, its effect will be positive. But if it crowds out private
investment or is used to generate rent seeking activities by politicians, its effect will be negative. As
indicated by Harms and Lutz (2006), the net effect of aid on the economy, therefore, will depend on
which effect dominates. Recent studies continue to provide mixed guidance. Rajan and
Subramanian (2008) do not find any robust relationship between aid inflows and economic growth.
Djankov et al. (2008) find that aid may actually worsen the democratic institutions of a nation.
Although they do not focus on the effect of aid on growth per se, a worsening of political institutions
will likely contribute to greater rent seeking and wastage, and consequently reduced effectiveness of
aid. On the other hand, a recent study by Arndt et al. (2010) concludes that aid has significant and
positive effects in the long-run. The study warns against the mistake of abolishing foreign aid, and
suggests a more nuanced view which focuses on improved aid effectiveness.2
On the relationship between international credit and growth, Rajan and Zingales (1998) ask a
slightly different but related question: do industries that are relatively more dependent on external
finance grow more rapidly in nations with more developed financial markets? Their empirical
analysis suggests that this is indeed the case.3 This suggests a causal link between external finance
and growth, where reductions of cost of external finance may allow a financially dependent firm to
grow, or new firms to enter.
As indicated by Arndt et al. (2010), it is important to allow for non-linearities in the aid-
growth relationship. Levine (2005) discusses its importance in the context of the finance-growth
2 There is a large literature on different motives for giving aid (see, for example, Alesina and Dollar, 2000). 3 There is a separate, but not directly related to the present context, link between financial development in general and growth. For example, King and Levine (1993) investigate this for a cross-section of nations using a variety of indicators for financial development, including the ratio of assets of “deposit money banks” and the sum of assets of the “deposit money banks” and the respective central banks of different nations in the cross-country analysis. They conclude that “The data are consistent with the view that financial services stimulate economic growth by increasing the rate of capital accumulation and by improving the efficiency with which economies use that capital.” Levine (2005) provides a comprehensive survey of this strand of the literature. He concludes that the overall evidence from research on the topic suggests that both financial intermediaries (e.g., banks) and financial markets (e.g., stock markets) are important for growth.
3
literature. The lack of consensus about the nature of these relationships may have something to do
with the absence of a thorough treatment of non-linearities in this literature. The inflow of foreign
aid in some countries now constitute 20% or more of their national income and there have been
concerns because of the possible adverse effect of large inflow of foreign aid via their effects on,
among others, the exchange rate (see, for example, Mavrotas (2006) for a discussion of the issues).
In fact, Hansen and Tarp (2001) do find diminishing returns to aid in promoting growth.
There are theoretical reasons why the relationship between credit and growth can also be
non-linear. For example, existence of indivisibilities in investments, such as in Acemoglu and
Zilibotti (1997), may give rise to convexities. In early stages of development, risk diversification
possibilities are limited, and this leads to investment in less productive but safer projects. As the
process of development matures, more of the start-up hurdles are crossed, risk diversification
opportunities improve, and consequently more productive investment occurs. This leads to a non-
linear relationship between capital accumulation and growth. Among others, Rioja and Valev (2004)
have explored the non-linear relationship between finance and growth. They divide their sample of
nations into three groups, low, intermediate and high levels of financial development. They find the
strongest positive effects of financial development on growth in the intermediate region, supporting
the idea of a convex relationship, at least towards the lower end of the spectrum of financial
development.
In this paper, we bring together the two literatures by exploring both the aid-growth and the
aid-loans relationships in a single framework. We consider total aid as well as its separate grant and
concessional loan components. We also consider loans to the private sector by foreign banks. We
also allow for non-linearities in the relationships of these variables with growth. Our panel-data
framework draws on 131 aid-recipient countries for the period 1996-2010. Data on foreign aid is
collected from the OECD, and to measure a developing nation’s access to foreign borrowing in the

4
private market, we take offshore bank loans data from the Bank of International Settlements (BIS)
Locational Banking Statistics. Our empirical procedure attempts to address a host of estimation
issues such as measurement problems, reverse causality, and omitted variables bias - ignoring these
would risk estimation bias and inconsistency. We employ alternative econometric techniques and
model specifications to ensure that our results are robust. We also examine whether the presence of
sample heterogeneity affects our findings, because countries at different levels of income may
experience distinct outcomes.
We find interesting patterns of non-linearities. The relationship between grants and growth
is an inverted-U one, confirming the diminishing returns findings of Hansen and Tarp (2001),
among others. We also find, along the lines of the finance-growth literature, that the loans-growth
relationship is U-shaped. The latter is true for concessional loan by aid agencies and credit by
foreign banks. Interestingly, we find that the nature of non-linear relationships between the two
components of foreign aid, namely grants and concessional loans, are very different, highlighting the
importance of separating the two. Taking cue from these non-linearities, we compute critical levels
of international transfers such that the marginal effect of grants is larger than that of loans if and
only if the transfer (grant, concessional loan or private bank loan) is below the relevant critical level.
This suggests that when an aid agency finds itself with a very small amount of resources to allocate,
it may choose grants over loans. Otherwise, loans may be the preferred tool.
Section 2 lays out the empirical model and describes the variables and data. Section 3
discusses econometric methodology. Section 4 presents estimation results and robustness analysis.
Section 5 concludes.

5
2 Empirical Model and the Description of Variables
Following the empirical literature on aid and growth, we use the growth rate of real GDP per capita
(e.g., Arndt et al., 2010; Burnside and Dollar, 2000; Hansen and Tarp, 2001) to measure the impact
of aid on growth. Because we are interested in estimating the relative effectiveness of aid and loans
in stimulating growth, we include both of these as explanatory variables. To account for potential
non-linearities, we also include squared terms for these central variables. The sample includes 131
developing countries over the period 1996-2010. The reason for choosing this time period is that
the cross-border lending data from the Bank of International Settlements for all four quarters is
available from 1996. Thus, the relationship takes the following form:4
( ) ( ) ( )( )
20 1 2 3
2 '4
/ / /
/ ,
it it it it
it t i itit
growth aid gdp aid gdp loans gdp
loans gdp Z
β β β β
β θ τ η µ
= + + +
+ + + + + (1)
where i refers to countries, t to time, κt indicates year-specific effects, ηi reflects country-specific
effects, and µit is the error term. Z is the vector of commonly used control variables in the literature,
which are detailed below. While the time effects account for the impact of time varying common
shocks to the economy, the country-specific fixed-effects control for the influence of unobservable
factors that may affect the economy. Inclusion of the fixed-effects not only accounts for
unobserved heterogeneity, but also reduces biases related to the omission of relevant variables.
Our main variables of interest are: aid/gdp, (aid/gdp)2, loans/gdp and (loans/gdp)2. We further
subdivide our aid variable into ODA (Overseas Development Assistance) grants and ODA loans,
while our main variable on international loans contains information on private (non-concessional)
offshore private bank lending.
4 Appendix A provides the list of countries in our study. We eliminate Egypt and Israel from our analysis as they receive disproportionately higher amount of aid from the United States for strategic reasons.

6
Data for foreign assistance, including ODA grants and ODA loans, are taken from the
online database of Development Aid Committee (DAC-2012) of the OECD. The aid data consists
of net disbursements for development purposes and, hence, does not include military aid. Access to
foreign borrowing is gauged by taking offshore bank loans data from the Bank of International
Settlements (BIS) Locational Banking Statistics.5 These data consist of cross-border loans to all
sectors in developing nations from banks situated in the BIS reporting countries. Local lending by
banks in a BIS member country is hence not included. For example, loans to India are those from
BIS reporting banks located outside of India. Even though India is a BIS reporting country, local
lending in foreign currencies by banks situated in India are not included in the cross-border
borrowing. The activities of all banking offices residing in each reporting country are measured by
the cross-border lending data (based on the residence of the reporting institutions). The
aforementioned offices report singularly on their own unconsolidated business, which, thus, includes
international transactions with any of their own affiliates.6
The quarterly loans data for exchange rate changes are fine-tuned by BIS. BIS also converts
the relevant flow of new loans (net of repayments) in each quarter of the year into its original
currency using end-of-period exchange rates, and eventually converts the changes in stocks into
dollar amounts using period-average exchange rates. Quarterly observations can be converted to
annual observations by just adding up data for the four quarters. The data for loans are corrected
5 There are a few other data sources for credits in the literature. The Financial Structure Database provides the country-level measures of credit constraints which is compiled by Beck et al., (2000) and updated by Beck and Demirgüç-Kunt (2009). Rajan and Zingales (1998) provide the sector level variables such as external finance dependence and asset tangibility, and these have been updated in Chor and Manova (2012). The third is the BIS data (see, for example, Papaioannou (2009) and Hermann and Mihaljek (2011)). The first two sources present us with knowledge on the extent of credit constraints and the third source gives us data on the flow of foreign loans. Since the rationale of this paper is to compare the flow of net foreign aid with that of net foreign loans received by a country, we concentrate on the third source. 6 Detailed information on the locational banking statistics is available on the BIS website under http://www.bis.org/statistics/.

7
for the size of the loans recipient country (as in the foreign aid case) as percentage of the GDP of
the loans receiving country.
While all of our main econometric specifications include both time-specific and country-
specific fixed effects, we take guidelines from the recent aid-growth literature for the selection of
time-variant control variables (e.g., Arndt et al., 2010; Burnside and Dollar, 2000; Hansen and Tarp,
2001). Specifically, we include: investment/GDP as commonly proxied by fixed capital formation,
government consumption/GDP, initial real GDP per capita, inflation as measured by GDP deflator,
trade openness as measured by export plus imports/GDP and the variable of voice & accountability
to capture formal institutions’ effectiveness.7 We employ alternative measures of institutional quality
to check robustness of our main results. Data for the indicators of institutional quality, i.e., voice
and accountability, political stability and absence of violence, rule of law, government effectiveness,
regulatory quality, and control of corruption, are taken from Kaufmann et al. (2010; updated 2012).
In our sample, the values of these indices range from -2.986 to +1.645, where a higher score
indicates better institutional quality. Data for growth rate of real GDP per capita, initial real GDP
per capita, inflation and trade openness are taken from WDI (2012), while data for
investment/GDP and government consumption/GDP come from the Penn World Table, compiled
by Heston et al., (2011).
We take log transformation of all of main variables of interests because these variables, i.e.,
foreign aid, ODA grants, ODA loans, offshore bank loans and growth rate of real GDP per capita,
exhibit skewed distribution. Their log transformation helps smooth the data and reduces the effect
of outliers on estimates. Taking the log of these variables overcomes the measurement problem
7 Another valid control variable for inclusion in a growth regression is a factor that may capture the level of human capital stock in a country such as secondary school attainment. Since there are plenty of missing observations in the per annum data for this variable, we do not explicitly include this variable in the regressions as its inclusion results in a substantial reduction in number of observations. However, to check whether our results remain robust with its inclusion, we interpolated missing observations by calculating averages from available values. The findings remain qualitatively and quantitatively similar.

8
involved with the scaling of different variables. Another important advantage is that, with log
transformation, the estimated coefficients can be interpreted as elasticities. The descriptive statistics
are reported in Table 1.8
[Table 1near here]
3 The Empirical Methodology
The issue of establishing causation is a challenge in any growth equation. We take several measures
to ensure that our findings are not spurious: First, we report results of our baseline regressions and
then sequentially add a myriad of control variables along with time and country-specific fixed effects.
Second, we apply alternative econometric techniques on the data − the feasible generalized least
squares (FGLS), the first-differenced regressions, and the dynamic difference-generalized method of
moments (DGMM) estimator. Finally, we divide our sample countries into different income groups
and then conduct our analysis.
Heteroscedasticity and autocorrelation may also bias the estimates. Therefore, we run a
series of FGLS regressions where we explicitly allow for the presence of heteroscedasticity across
panels and serial correlation within a panel, which gives panel-corrected robust standard errors.
Another concern is that it is indeed likely and quite plausible that both foreign aid and foreign loans
may be influenced by economic growth in a country, raising concerns about their simultaneous
causation in equation (1). A conventional solution to deal with this issue is to use the instrumental
variable (IV) approach. This, however, requires the validity of the utilized instruments (and the
availability of their data) for potentially endogenous variables such as aid, ODA grants, ODA loans,
8 Data on some observations for some variables, i.e., foreign aid, foreign loans, growth rate of GDP per capita and inflation, exhibit negative values. Following others in the literature, we linearly transform the variables with negative observations by adding a constant of one in their respective minimum values in the sample so that after taking log their lowest value equals zero. This ensures that log transformation does not drop observations with negative values. Note that several past empirical studies on aid have used log-log transformation for deriving estimation result (e.g., Dollar and Levin, 2004; Younas, 2008).

9
and offshore bank loans. Since we employ the fixed-effects model specification, any chosen
instruments should be time-varying. Also, their exclusion restriction in the growth model requires
that they should have high correlation with the instrumented variables, but be uncorrelated with the
error term, if they are to be valid. Insurmountable difficulty in finding such instruments and their
data for multiple endogenous variables, especially when our main variables of interest enter the
model in non-linear form, makes this approach infeasible. Indeed, the use of invalid instruments
could instead contaminate the estimation results. In view of these limitations, we take one year
lagged values of our variables of interest, which reduces their contemporaneous correlation with the
dependent variable and alleviates concerns about endogeneity. With these
transformations, equation (1) takes the following form:
( ) ( ) ( )
( ) ( )
20 1 2, 1 , 1
2 '3 4, 1 , 1
ln ln / ln /
ln / ln / .
it i t i t
it t i iti t i t
growth aid gdp aid gdp
loans gdp loans gdp Z
β β β
β β θ τ η µ
− −
− −
= + +
+ + + + + + (2)
We acknowledge that the lagging of our variables of interest may not completely resolve the concern
about reverse causation in equation (2). Thus, we also check robustness of results by employing the
generalized method of moments (GMM) estimation technique, which has also been applied by
several recent contributions in the aid-growth literature (e.g., Arndt et al., 2010; Hansen and Tarp,
2001). Although some studies have pointed out that GMM should not be taken as a panacea for all
estimation issues, it has been used extensively in the recent literature.9 For example, Baltagi et al.,
(2009) preferred using the difference-GMM (DGMM) for their panel-data analysis of the impact of
openness on financial development. They argued that this estimator not only eliminates endogeneity
to a great extent, but first differencing of data also ensures that all regressors are stationary (p. 287).
9 See Arndt et al., (2010) for discussion on the application of the GMM estimator in aid-growth literature.

10
We also employ the dynamic DGMM estimator, as proposed by Arellano and Bond (1991).
To tackle the issue of endogeneity, DGMM takes the first difference of the data and then employs
lagged values of endogenous variables as their instruments. The literature, however, has pointed out
two issues that should to be taken into account when applying this estimator: First, estimates are
inconsistent in the presence of autocorrelation in the residuals. For this reason, we employ two
specification tests for each regression: (i) second-order serial correlation test to validate the absence
of autocorrelation, and (ii) the Sargan test of over-identifying restrictions to confirm the validity of
our internal instruments.10 If the null hypothesis fails to be rejected, this bolsters support for the
model, which is the case in all of our regressions. Second, these tests may lose power when the
countries-to-instruments ratio, r = n/i, is less than one, where n is the number of countries and i is
the number of instruments (e.g., Asiedu and Lien 2011, Roodman, 2009). Note that in almost all of
our regressions r >1. Furthermore, we use two-step GMM estimation technique in all regressions,
which is considered asymptotically efficient and robust to all types of heteroskedasticity (e.g., Asiedu
and Lien, 2011). First differencing of the DGMM model eliminates the time invariant country-
specific fixed-effects, and thus the relationship that we estimate will take the following form:
( ) ( ) ( ) ( )
( ){ } ( ){ }( ) ( )
( ){ } ( ){ }( )
0 1, 1 , 1 , 2
2 22 , 1 , 2
3 , 1 , 2
2 24 , 1 , 2
, 1
ln ln ln / ln /
ln / ln /
ln / ln /
ln / ln /
ln l
it i t i t i t
i t i t
i t i t
i t i t
i t
growth growth aid gdp aid gdp
aid gdp aid gdp
loans gdp loans gdp
loans gdp loans gdp
growth
β β
β
β
β
γ
− − −
− −
− −
− −
−
− = + − + − + − + −
+ − ( ) ( ) ( ) ( )' ', 1 1 . 1, 2
n .it i t t t it i ti tgrowth Z Zθ θ τ τ µ µ− − −−
+ − + − + −
(3)
10 We treat all explanatory variables as endogenous and only utilize their internal instruments generated in the model.

11
4 Estimation Results
4.1 Baseline regressions
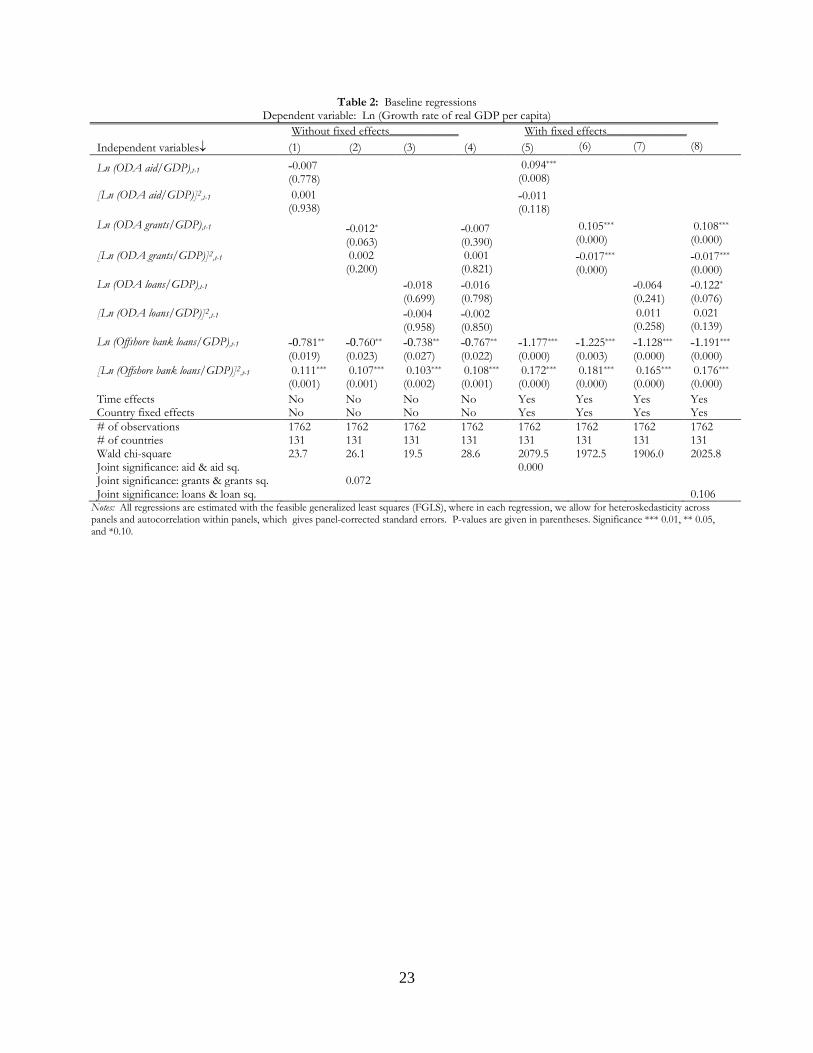
In Table 2, we report results of our baseline regressions by applying FGLS estimation technique,
where we only include our primary variables of interest. In columns (1-4), we first estimate the
model by imposing the restriction that both time and country-specific fixed-effects, which account
for other influences of growth and omitted factors bias, do not matter (i.e., τt = 0∀t, and ηi = 0∀i).
Column (1) regresses log growth rate of real GDP per capita on log aid/GDP, log offshore bank
loans/GDP and their squared terms. Columns (2) and (3) subdivide aid into ODA grants and ODA
loans, respectively. Column (4) includes all of our main variables of interest, i.e., log ODA
grants/GDP, log ODA loans/GDP, log offshore loans/GDP and their squared terms. Columns (5-
8) repeat this exercise by also including both time and country-specific fixed-effects in each
specification. In Table 3, we take first-difference of the data and report estimation results. Note
that first differencing eliminates the country-specific fixed effects. The results show that the
coefficients of log offshore bank loans/GDP and its squared term are statistically significant in all
the regressions and their signs are as expected. However, the coefficients of log aid/GDP and its
subdivided components (i.e., log ODA grants/GDP, log ODA loans/GDP and their squared terms)
are mainly statistically significant in the regressions that include both time and country-specific
fixed-effects (columns 5-8 in Table 2 and columns 1-4 in Table 3). Their signs also agree with the
concavity of the aid-growth and the convexity of the finance-growth relationship one may expect
based on the existing literature. In contrast to the diminishing marginal effect of aid and of ODA
grants on growth, both ODA loans and offshore bank loans have an increasing marginal effect on
growth. These baseline regression results suggest that models that account for unobserved country
level heterogeneity and common time shocks to the economy perform better. In the following
section, we check for robustness of our results by sequentially including a number of control

12
variables and applying alternative econometric techniques to the data.
[Tables 2 & 3 near here]
4.2 Fully specified model
In Table 4, we report results for our fully specified models by including a full set of control variables
as mentioned above. All of these regressions include both time and country-specific fixed-effects.
Columns (1) through (4) present results of FGLS regressions. In column (1), the positively
significant coefficient of log aid/GDP and negatively significant coefficient of its squared term
confirm its diminishing marginal impact on growth. This finding implies that while some countries
may utilize aid effectively, others lack the absorptive capacity or institutional quality with which to
complement aid.11 As also pointed out by Harms and Lutz (2006), this also indicates that, after
reaching a threshold level, the negative rent seeking effect of aid dominates its positive infrastructure
building effect. On the other hand, the negatively significant coefficient of log offshore bank
loans/GDP and positively significant coefficient of its squared term point to its increasing marginal
return on growth, as may be anticipated in the light of Acemoglu and Zilibotti (1997).
Next, we split the aid variable into ODA grants and ODA loans to determine whether the
diminishing marginal effect of aid is being reflected from its grants or its loans component, or from
both. Accordingly, our revised estimating equation takes the form:
( ) ( ) ( )
( ) ( )
( ) ( )
20 1 2, 1 , 1
23 4, 1 , 1
25 6, 1 , 1
'
ln ln / ln /
ln / ln /
ln / ln /
.
it i t i t
i t i t
i t i t
it t i it
growth ODAgrants gdp ODAgrants gdp
ODAloans gdp ODAloans gdp
OffshoreBankLoans gdp OffshoreBankLoans gdp
Z
β β β
β β
β β
θ τ η µ
− −
− −
− −
= + +
+ +
+ +
+ + + +
(4)
11 See Hansen and Tarp (2001) for a detailed discussion on the theoretical argument about non-linear effect of aid on economic growth, which relate to absorptive capacity constraints, Dutch disease and institutional destruction problems in developing countries.

13
First, we include these two components of aid separately (columns 2-3), then we include them
together in the regressions (column 4). Their signs and statistical significance show the inverted-U
shaped relationship between ODA grants and growth, but a U-shaped relationship between ODA
loans and growth. Past studies attribute the finding of diminishing marginal impact of aid to
absorptive capacity constraints, Dutch disease and institutional weaknesses in developing countries.
Our findings reveal that this relationship stems from the grant component of aid only, while the
loans component, in fact, has an increasing marginal impact on growth. The regressions results of
the first-differenced regression are also qualitatively and quantitatively the similar (columns 5-8).
[Table 4 near here]
In a footnote to Table 4, we evaluate and report the marginal effect of aid, ODA grants,
ODA loans and offshore bank loans on growth at their mean values, which stand at 2.075, 1.43,
4.858, and 5.95, respectively. In column (1), the marginal effect of aid is 0.047 [0.084 − 2×(0.009)×
(2.08)], while the marginal effect of ODA grants is 0.05 [0.096 − 2×(0.016)×(1.43)]. Interestingly,
this marginal impact of aid (grants) declines when it is evaluated at higher than mean value in our
sample. For example, this effect of aid (grants) is 0.036 (0.024) and 0.029 (0.005) when we evaluate
at its 75th and 90th percentile levels in our sample, respectively. This suggests that although aid
(grants) is more effective at its low level, its marginal effect decreases at increasing rate at the higher
level of such transfer. In part, this finding appears to appeal to the morals of giving aid as
underscored by Stern (1974), who argues for the transfer from the rich to the poor if the benefit to
the latter justifies the cost to the former.
In column (3), we evaluate and report the marginal effect of ODA loans and offshore bank
loans on growth at their mean values, which stand at 4.86 and 5.95 in our sample, respectively. The
marginal effect of the former is 0.078 [−0.107 + 2×(0.019)×(4.86)], while the marginal effect of the

14
latter is 0.631 [−0.916 + 2×(0.130)×(5.95)]. Notice that: (i) the marginal effect of offshore bank
loans on growth is 8.09 times larger than the marginal effect of ODA loans; and (ii) the marginal
effect of both these types of transfers is larger than the marginal effect of aid or grants on growth.
That effect, in fact, is substantially larger in the case of offshore bank loans. Calculations in column
(4), where we include ODA grants, ODA loans and offshore bank loans together in the regression,
reveal similar results. These findings suggests that starting at the mean level, an increase in aid
(grants) leads to a reduction in its positive marginal effect on growth, while an increase in both types
of loans causes an increase in their positive marginal effects on growth. This also implies that at
lower level of transfers, grants have larger positive effects on growth compared to loans.
The marginal effects of each type of transfers computed above have been calculated at their
mean values. However, it is of interest to compute the critical level of each of ODA grants vs.
ODA loans, and ODA grants vs. offshore bank loans, below (above) which the marginal effect of
ODA grants (loans) may be larger. First, we compute the value of X by equating the marginal effect
of ODA grants with the marginal effect of ODA loans, i.e., β1 + 2×β2×X = β3 + 2×β4×X.
Similarly, we compute the value of Y by equating the marginal effect of ODA grants with the
marginal effect of offshore bank loans, i.e., β1 + 2×β2×Y = β5 + 2×β6×Y. For these calculations, we
use the coefficients in the fully specified model in column 4 of table 2. These values of X and Y are
3.048 and 3.48, respectively, which are higher than the mean value of log ODA grant/GDP and
lower than the mean values of both log ODA loans/GDP and of log offshore bank loans/GDP.
Our results that we derive using the first-differenced regressions and calculations of the marginal
effects and of the critical values are qualitatively the same (columns 5-8).
Figures 1, 2 and 3 plot the estimated effect of log ODA grants/GDP, log ODA loans/GDP
and log offshore loans/GDP on fitted values of log growth rate of real income per capita,
respectively. Over most of the range of log ODA grants/GDP, lower levels of grants are associated

15
with higher level of economic growth. This effect, however, diminishes with higher levels of grants,
suggesting its inverted U-shaped relationship with growth. On other hand, lower levels of both
ODA loans and offshore bank loans cause downward pressure on economic growth, while after
reaching a certain threshold level their positive effect dominates their negative effect suggesting their
inverted U-shaped relationship with growth.
[Figures 1, 2 and 3 near here]
We now briefly discuss the results of control variables. Our results strongly support the past
findings that domestic investment, trade openness and institutional quality (as proxied by voice and
accountability) positively affect growth, while government consumption and inflation have negative
influence on growth. The sign of log initial GDP per capita is negative in all the FGLS regressions,
while its sign is positive in all the first-differenced regressions; however, none of its coefficient are
found to be statistically significant.
Many past studies state that employing different control variables can change the results in
growth regression (see, for example, Dollar and Levin, 2004). Thus, we check whether the results of
our variables of interest are robust to the introduction of alternative institutional quality indicators
that may explain growth. In Table 5, we replace voice and accountability with political stability,
government effectiveness, regulatory quality, rule of law and control of corruption, one at a time.
These results show that the sign, significance and even the magnitude of the coefficients of the main
variables remain the same with the inclusion of different institutional variables. All these results
support the past assertion that institutions are important for growth. Similar exercise for the first-
differenced regressions provides the same results. To conserve space, those results are not reported
here.
[Table 5 near here]

16
4.3 Analysis at different income levels
In this section, we check whether our results are qualitatively the same when we apply our analysis to
countries which are at the different levels of income. Thus, we divide our sample into four category:
(i) countries with real GDP per capita less than 25th percentile (403.68 USD); (ii) countries with real
GDP per capita less than 50th percentile (1116 USD); (iii) countries with real GDP per capita less
than mean level (2229.53 USD); and (iv) countries with real GDP per capita less than 75th percentile
level (3029.77 USD). There are a total of 38, 71, 94 and 101 countries in the first, second, third and
fourth group, respectively. In Table 6, columns (1-4) reports results for the FGLS, while columns
(5-8) presents results for the DGMM regressions. These results strongly reinforce our above
findings, except that the coefficients of log ODA grants/GDP and its squared terms are not
statistically significant in columns 5 and 6. We also calculate and report the marginal effects and
critical values of ODA grants, ODA loans and offshore bank loans in Table 6. These values draw
the similar conclusion as in Tables 4 and 5. Note that the coefficient of log initial GDP per capita,
which was statistically insignificant in Tables 4 and 5, is negative and significant in 7 out of 8
regressions in Table 6. In all the DGMM regressions, p-values of Sargan and autocorrelation tests
confirm the validity of instruments and the absence of second-order serial correlation in the
residuals, respectively.
[Table 6 near here]
We also check the robustness of our results by excluding Oil Producing and Exporting
Countries (OPEC) and Transition economies from our regressions. OPEC economies generate
high foreign reserves from sale of oil and petroleum products in the international market.
Therefore, their dependence on foreign aid for financing development projects is minimal. In fact,
allocation of foreign aid to these economies has been quite low in our sample period, and most of
the aid flows to them has been mainly comprised of humanitarian assistance and of ODA loans. On

17
the other hand, starting in the early 1990s, Transition economies received substantially larger
amounts of aid to support their transition to the free market system and new political regimes. Our
main findings remain intact with the exclusion of these economies.12
5 Concluding Remarks
Should foreign aid be replaced by concessional loans or an easier access to international credit
markets? One way to approach this question is to see which policy is more effective in spurring
growth in developing nations. Accordingly, we pursue an empirical strategy of uncovering the
relationship between growth, aid and loans for a cross-section of developing nations. We find that
the growth-grant relationship is an inverted-U one, suggesting strong diminishing returns. This
tends to reduce the desirability of grants at high levels. On the other hand, we find that the
relationship between loans and growth is U-shaped, suggesting increasing returns, and hence an
argument to expand loans from initial levels that are beyond a critical level.
We should note that offshore bank loans are a market determined variable, and so whether
they should be substituted by (or substituted for) aid is not a directly relevant policy question.
However, reforms in the financial market can induce more inflow of private foreign capital and thus
policies can indirectly affect private international credits. Moreover, aid itself has a loan and a grant
component. Our study shows that the loan component of aid exhibits increasing returns, while the
grant component has the traditional concave relationship with growth. Thus, it is very important to
separate out the two components of foreign aid in examining the aid-growth relationship.
Accordingly, we can suggest two things: (i) if loans are used by aid agencies, they should be used in
large quantities to avail of increasing returns; (ii) facing binding resource constraints, the aid agencies
have to determine precisely where a particular developing nation is on their grant-growth or loans-
12 To save space, these results are not reported in the paper; however, they are available from the authors upon request.

18
growth curves to have a definitive answer on whether aid or loans may be a better tool at the
margin. Finally, our findings suggest that where financial markets are not well-developed, availing of
increasing returns will require major policy reforms to ease international capital flows, such that
tangible growth benefits may be realized.

19
References
Acemoglu, D. and Zilibotti, F. (1997). “Was Prometheus Unbound by Chance? Risk, Diversification, and Growth,” Journal of Political Economy, 105(4), 709-751.
Alesina, A. and Dollar, D. (2000). “Who gives foreign aid to whom and why?”, Journal of Economic
Growth, 5, 33-63. Arellano, M. and Bond, S. R. (1991). “Some tests of specification for panel data: monte carlo
evidence and an application to employment equations," Review of Economic Studies, 58, 277-97. Arndt, C., Jones, S. and Tarp, F. (2010). “Aid, growth, and development: have we come full circle?",
Journal of Globalization and Development, 1(2), Article 5. Asiedu, E. and Lien, D. (2011). “Democracy, foreign direct investment, and natural resources."
Journal of International Economics, 84, 99-111. Baltagi, B.H., Demetriades, P.O., and Law, S.H. (2009) Financial development and openness:
evidence from panel data, Journal of Development Economics, 89, 285–96. Bauer, P.T. (1971). Dissent on Development, London: Widenfeld and Nicolson. Beck, T., Demirgüç-Kunt, A. and Levine, R. (2000). “A new database on financial development and
structure," World Bank Economic Review, 14, 597-605. Beck, T. and Demirgüç-Kunt, A. (2009). “Financial institutions and markets across countries and
over time: data and analysis", World Bank Policy Research Working Paper No. 4943. Burnside, C. and Dollar, D. (2000). “Aid, policies, and growth," American Economic Review, 90, 847-
868. Chor, D. and Manova, K. (2012). “Off the cliff and back? Credit conditions and international trade
during the global financial crisis,” Journal of International Economics, 87, 117-133. Collier, P. and Dollar, D. (2002). “Aid allocation and poverty reduction," European Economic Review,
45, 1-26. Dollar, D. and Levin, V. (2004). “The increasing selectivity of foreign aid, 1984-2002," World Bank
Policy Research Paper 3299. Dalgaard, C.J., Hansen, H. and Tarp, F. (2004). "On the empirics of aid and growth," Economic
Journal, 114, 191-216. Djankov, S., Montalvo, J.G., and Reynal-Querol M. (2008). “The curse of aid,” Journal of Economic
Growth, 13, 169-194.

20
Dudley, L. and Montmarquette, C. (1976). “A model of supply of bilateral aid foreign aid," American Economic Review, 66, 132-142.
Easterly, W. (2003). “Can foreign aid buy growth?" Journal of Economic Perspectives, 17, 23-48. Freedom House (2010). Freedom in the World, Freedom House, New York. Hansen, H. and Tarp, F. (2000). “Aid effectiveness disputed," Journal of International Development, 12,
375-398. Hansen H. and Tarp, F. (2001). “Aid and growth regressions," Journal of Development Economics, 64,
547-570. Harms, P. and Lutz, M. (2006). “Aid, governance and private foreign investment: some puzzling
findings for the 1990s," Economic Journal, 116, 773-790. Heston, A., Summers, R., Aten, B., (2011). Penn World Table Version 7.0, Center for International Comparisons of Production, Income and Prices at the University of Pennsylvania. Hermann, S. and Mihaljek, D. (2011). “The determinants of cross-border bank flows to emerging
markets: new evidence on the spread of financial crises," Bank of Finland Working Paper No. 3-2011.
Kaufmann, D., Kraay, A. and Mastruzzi, M. (2010). “The worldwide governance indicators: A
summary of methodology, data and analytical issue," World Bank Policy Research Working paper No. 5430. Updated 2012. http://info.worldbank.org/governance/wgi/sc_country.asp
King, R.G. and Levine, R. (1993). “Finance and Growth: Schumpeter Might Be Right”. Quarterly
Journal of Economics, 108(3), 717-736. Levine, R. (2005). “Finance and Growth: Theory and Evidence”. Handbook of Economic Growth,
Volume 1A, 865-934. Eds. Philippe Aghion and Steven N. Durlauf. Elsevier B.V. Mavrotas, G. (2006). “Scaling up of foreign aid and the emerging new agenda," Chapter 13 in Lahiri, S. (ed.), Theory and Practice of Foreign aid (Frontiers of Economics and Globalization, Volume 1), Emerald Group Publishing Limited, pp. 211-233. Papaioannou, E. (2009). “What drives international financial flows? politics, institutions and other
determinants," Journal of Development Economics, 88, 269-281. Rajan, R. and Subramanian, A. (2008) “Aid and Growth: What Does the Cross-Country Evidence
Really Show?," The Review of Economics and Statistics, 90(4), 643-665. Rajan, R. and Zingales, L. (1998) “Financial dependence and growth," American Economic Review, 88,
559-586. Rioja, F. and Valev, N. (2004) “Does one size fit all?: A reexamination of the finance and growth
relationship,” Journal of Development Economics, 74, 429-447.

21
Roodman, D. (2009). “A note on the theme of too many instruments," Oxford Bulletin of Economics and Statistics, 71, 135-58. Stern, N.H. (1974). “Professor Bauer on development: a review article," Journal of Development
Economics, 1, 191-211. World Bank (2012). World Development Indicators, 2012. World Bank, Washington, DC. Younas, J. (2008). “Motivation for bilateral aid allocation: altruism or trade benefits," European
Journal of Political Economy, 24, 661-674.

22
Table 1: Summary statistics
Variables Obs. Mean S.D. Min Max
Ln (Growth rate of real GDP per capita) 1938 3.614 0.164 0.000 4.847 Ln (ODA aid/GDP) 1906 2.075 0.709 0.000 5.014 Ln (ODA grants/GDP) 1906 1.430 1.053 0.000 5.100 Ln (ODA loans/GDP) 1906 4.858 0.118 0.000 5.145 Ln (Offshore bank loans/GDP) 1955 5.950 0.140 0.000 6.612 Investment/GDP 1965 23.220 11.390 1.722 88.004 Government consumption/GDP 1965 12.271 7.930 0.928 58.001 Ln (Initial GDP per capita) 1931 6.885 1.190 4.079 9.367 Ln (Inflation) 1936 3.756 0.365 0.000 8.600 Trade/GDP 1965 83.893 40.169 14.074 265.687 Voice & accountability 1965 -0.377 0.821 -2.158 1.471 Political stability 1944 -0.344 0.888 -2.986 1.544 Government effectiveness 1946 -0.423 0.646 -2.248 1.590 Regulatory quality 1947 -0.407 0.702 -2.675 1.645 Rule of law 1965 -0.456 0.714 -2.234 1.599 Corruption 1946 -0.429 0.635 -2.057 1.553
Notes: The data span over the period 1996-2010. ODA stands for official development assistance. In this study, we use data of net disbursement of ODA. All of the ratios are denoted as percentage of GDP. Offshore bank loan data from Bank for International Settlement (BIS) is adjusted for exchange rate movements (done by BIS).
23
Table 2: Baseline regressions Dependent variable: Ln (Growth rate of real GDP per capita)
Without fixed effects_____________ With fixed effects_______________
Independent variables↓
(1)
(2)
(3)
(4)
(5) (6) (7) (8)
Ln (ODA aid/GDP),t-1
˗0.007
(0.778)
0.094***
(0.008)
[Ln (ODA aid/GDP)]2,t-1
0.001
(0.938) ˗0.011
(0.118)
Ln (ODA grants/GDP),t-1
˗0.012*
(0.063)
˗0.007
(0.390)
0.105***
(0.000)
0.108***
(0.000) [Ln (ODA grants/GDP)]2,t-1 0.002
(0.200) 0.001
(0.821) ˗0.017***
(0.000) ˗0.017***
(0.000) Ln (ODA loans/GDP),t-1
˗0.018
(0.699) ˗0.016
(0.798) ˗0.064
(0.241) ˗0.122*
(0.076) [Ln (ODA loans/GDP)]2,t-1 ˗0.004
(0.958) ˗0.002
(0.850) 0.011
(0.258) 0.021
(0.139) Ln (Offshore bank loans/GDP),t-1
˗0.781**
(0.019) ˗0.760**
(0.023) ˗0.738**
(0.027) ˗0.767**
(0.022) ˗1.177***
(0.000) ˗1.225***
(0.003) ˗1.128***
(0.000) ˗1.191***
(0.000) [Ln (Offshore bank loans/GDP)]2,t-1 0.111***
(0.001) 0.107***
(0.001) 0.103***
(0.002) 0.108***
(0.001) 0.172***
(0.000) 0.181***
(0.000) 0.165***
(0.000) 0.176***
(0.000) Time effects No No No No Yes Yes Yes Yes Country fixed effects No No No No Yes Yes Yes Yes # of observations 1762 1762 1762 1762 1762 1762 1762 1762 # of countries 131 131 131 131 131 131 131 131 Wald chi-square 23.7 26.1 19.5 28.6 2079.5 1972.5 1906.0 2025.8 Joint significance: aid & aid sq. 0.000 Joint significance: grants & grants sq. 0.072 Joint significance: loans & loan sq. 0.106
Notes: All regressions are estimated with the feasible generalized least squares (FGLS), where in each regression, we allow for heteroskedasticity across panels and autocorrelation within panels, which gives panel-corrected standard errors. P-values are given in parentheses. Significance *** 0.01, ** 0.05, and *0.10.

24
Table 3: Baseline regressions Dependent variable: ∆Ln (Growth rate of real GDP per capita)
First-differenced model____________
Independent variables↓
(1)
(2)
(3)
(4)
∆Ln (ODA aid/GDP),t-1
0.104***
(0.010)
∆[Ln (ODA aid/GDP)]2,t-1
˗0.016**
(0.043)
∆Ln (ODA grants/GDP),t-1
0.094***
(0.000)
0.099***
(0.000) ∆[Ln (ODA grants/GDP)]2,t-1 ˗0.018***
(0.000) ˗0.019***
(0.000) ∆Ln (ODA loans/GDP),t-1
˗0.145**
(0.021) ˗0.127
(0.106) ∆[Ln (ODA loans/GDP)]2,t-1 0.048***
(0.010) 0.019
(0.218) ∆Ln (Offshore bank loans/GDP),t-1
˗0.925***
(0.003) ˗0.965***
(0.002) ˗0.925***
(0.003) ˗0.934***
(0.003) ∆[Ln (Offshore bank loans/GDP)]2,t-1 0.102***
(0.001) 0.109***
(0.001) 0.102***
(0.002) 0.104***
(0.001) Time effects Yes Yes Yes Yes # of observations 1630 1630 1630 1630 # of countries 131 131 131 131 Wald chi-square 355.3 379.9 358.3 372.6
Notes: The first-differencing of the data eliminate the country-specific fixed effects. Other notes are same as of Table 2.

25
Table 4 Dependent variable: Ln (Growth rate of real GDP per capita)
Estimation technique→ With fixed effects________________ First-differenced__________________
Notes: Marginal effects calculated at the mean values. All regressions are estimated with the feasible generalized least squares (FGLS), where in each regression, we allow for heteroskedasticity across panels and autocorrelation within panels, which gives panel-corrected standard errors. P-values are given in parentheses as well as for the test of joint significance. Significance *** 0.01, ** 0.05, and *0.10.
Independent variables↓
(1)
(2)
(3)
(4)
(5)
(6)
(7)
(8)
Ln (ODA aid/GDP),t-1
0.084**
(0.020)
0.120***
(0.003)
[Ln (ODA aid/GDP)]2,t-1
˗0.009
(0.191) ˗0.019**
(0.020)
Ln (ODA grants/GDP),t-1
0.096***
(0.000)
0.098***
(0.000)
0.090***
(0.000)
0.095***
(0.000) [Ln (ODA grants/GDP)]2,t-1 ˗0.016***
(0.000) ˗0.015***
(0.000) ˗0.017***
(0.000) ˗0.018***
(0.000) Ln (ODA loans/GDP),t-1
˗0.107*
(0.053) ˗0.158**
(0.025) ˗0.150**
(0.014) ˗0.142*
(0.064) [Ln (ODA loans/GDP)]2,t-1 0.019*
(0.062) 0.027*
(0.057) 0.029***
(0.008) 0.022
(0.143) Ln (Offshore bank loans/GDP),t-1
˗0.907***
(0.005) ˗0.938***
(0.004) ˗0.916***
(0.005) ˗0.905***
(0.005) ˗0.842***
(0.006) ˗0.866***
(0.005) ˗0.819***
(0.009) ˗0.833***
(0.007) [Ln (Offshore bank loans/GDP)]2,t-1 0.128***
(0.000) 0.134***
(0.000) 0.130***
(0.000) 0.129***
(0.000) 0.089***
(0.005) 0.093***
(0.003) 0.084***
(0.007) 0.088***
(0.000) Investment/GDP
0.001***
(0.000) 0.001***
(0.000) 0.002***
(0.000) 0.001***
(0.000) 0.002***
(0.000) 0.002***
(0.000) 0.002***
(0.000) 0.002***
(0.000) Government consumption/GDP ˗0.004***
(0.000) ˗0.004***
(0.000) ˗0.003***
(0.001) ˗0.004***
(0.000) ˗0.009***
(0.000) ˗0.009***
(0.000) ˗0.009***
(0.000) ˗0.009***
(0.000) Ln (Initial GDP per capita) ˗0.368
(0.169) ˗0.258
(0.340) ˗0.179
(0.500) ˗0.232
(0.388) 0.725
(0.435) 0.763
(0.407) 0.837
(0.354) 0.862
(0.345) Ln (Inflation)
˗0.018*** (0.002)
˗0.017*** (0.004)
˗0.012*** (0.004)
˗0.019*** (0.002)
˗0.037*** (0.000)
˗0.038*** (0.000)
˗0.036*** (0.000)
˗0.038*** (0.002)
Trade/GDP
0.001**
(0.049) 0.001*
(0.060) 0.001
(0.104) 0.001*
(0.062) 0.001*
(0.060) 0.001*
(0.055) 0.001*
(0.052) 0.001*
(0.060) Voice & accountability
0.041***
(0.000) 0.039***
(0.000) 0.045***
(0.000) 0.039***
(0.000) 0.040***
(0.007) 0.043***
(0.003) 0.043***
(0.003) 0.042***
(0.005) Time effects Yes Yes Yes Yes Yes Yes Yes Yes Country fixed effects Yes Yes Yes Yes # of observations 1748 1748 1748 1748 1617 1617 1617 1617 # of countries 130 130 130 130 130 130 130 130 Wald chi-square 1759.7 1668.9 1703.5 1703.4 412.8 430.62 415.3 427.7 Joint significance: aid & aid sq. 0.000 Joint significance: loans & loans sq. 0.085 Marginal effect of ODA aid 0.047 0.041
Marginal effect of ODA grants 0.050 0.055 0.041 0.043 Marginal effect of ODA loans 0.078 0.104 0.132 0.072 Marginal effect of bank loans 0.616 0.657 0.631 0.630 0.217 0.241 0.181 0.214 Critical values grants/ODA loans (X) 3.447 3.048 4.345 2.963 Critical values grants/bank loans (Y) 3.48 4.377

26
3.53.5
53.6
3.65
Fitted
value
s: Ln
(Grow
th ra
te re
al inc
ome p
.c.)
0 1 2 3 4 5Ln (ODA grants/GDP)
95% CI Fitted values
Figure 1. Income per capita and ODA grants
3.53.6
3.73.8
3.9Fit
ted va
lues:
Ln (G
rowth
rate r
eal in
coem
p.c.)
0 1 2 3 4 5Ln (ODA loans/GDP)
95% CI Fitted values
Figure 2. Income per capita and ODA loans
33.5
44.5
Fitted
value
s: Ln
(Grow
th rat
e rea
l inco
me p.
c.)
0 2 4 6 8Ln (offshore bank loans/GDP)
95% CI Fitted values
Figure 3. Income per capita and offshore bank loans

27
Table 5 Dependent variable: Ln (Growth rate of real GDP per capita)
Notes: Same as for Table 4.
Independent variables↓
(1)
(2)
(3)
(4)
(5)
Ln (ODA grants/GDP),t-1
0.104***
(0.000)
0.102***
(0.000)
0.106***
(0.000)
0.110***
(0.000)
0.103***
(0.000) [Ln (ODA grants/GDP)]2,t-1 ˗0.015***
(0.001) ˗0.015***
(0.001) ˗0.015***
(0.001) ˗0.017***
(0.000) ˗0.015***
(0.001) Ln (ODA loans/GDP),t-1
˗0.182***
(0.010) ˗0.178**
(0.012) ˗0.187***
(0.025) ˗0.161**
(0.021) ˗0.182***
(0.010) [Ln (ODA loans/GDP)]2,t-1 0.032**
(0.022) 0.032**
(0.024) 0.034**
(0.018) 0.028**
(0.046) 0.033**
(0.021) Ln (Offshore bank loans/GDP),t-1
˗1.065***
(0.001) ˗1.013***
(0.002) ˗1.049***
(0.001) ˗1.017***
(0.002) ˗1.037***
(0.001) [Ln (Offshore bank loans/GDP)]2,t-1 0.154***
(0.000) 0.146***
(0.000) 0.152***
(0.000) 0.146***
(0.000) 0.150***
(0.000) Investment/GDP
0.001***
(0.000) 0.001***
(0.000) 0.001***
(0.000) 0.001***
(0.000) 0.001***
(0.000) Government consumption/GDP ˗0.004***
(0.000) ˗0.004***
(0.000) ˗0.004***
(0.000) ˗0.004***
(0.000) ˗0.004***
(0.000) Ln (Initial GDP per capita) ˗0.150
(0.572) ˗0.129
(0.618) ˗0.092
(0.721) ˗0.072
(0.783) ˗0.071
(0.785) Ln (Inflation)
˗0.032*** (0.000)
˗0.024*** (0.001)
˗0.027*** (0.0020
˗0.025*** (0.002)
˗0.026*** (0.000)
Trade/GDP
0.001***
(0.004) 0.001**
(0.012) 0.001**
(0.037) 0.001**
(0.016) 0.001**
(0.025) Political stability
0.021***
(0.000)
Government effectiveness
0.029***
(0.006)
Regulatory quality
0.013
(0.154)
Rule of law
0.002
(0.823)
Corruption 0.003
(0.731) Time effects Yes Yes Yes Yes Yes Country fixed effects Yes Yes Yes Yes Yes # of observations 1730 1737 1737 1748 1737 # of countries 130 130 130 130 130 Wald chi-square 2059.5 2574.0 2334.3 2174.8 2231.9
Marginal effect of ODA grants 0.061 0.059 0.063 0.061 0.060 Marginal effect of ODA loans 0.129 0.133 0.143 0.111 0.139 Marginal effect of bank loans 0.767 0.724 0.760 0.720 0.748 Critical values grants/ODA loans (X) 3.042 2.979 2.990 3.011 2.969 Critical values grants/bank loans (Y) 3.459 3.463 3.458 3.458 3.455

28
Table 6 Dependent variable: Ln (Growth rate of real GDP per capita)
Estimation technique→ FGLS-Fixed effects_______________ Difference-GMM_______________
Notes: p.=percentile. Marginal effects calculated at the percentile levels of the respective income group. In all FGLS regressions, we allow for heteroskedasticity across panels and autocorrelation within panels, which gives panel-corrected standard errors. We employ two-step estimation for the difference-GMM regressions. This procedure is asymptotically efficient and robust to all kinds of heteroskedasticity. P-values are given in parentheses, as well as for Sargan test, autocorrelation tests and test of joint significance. Significance *** 0.01, ** 0.05, and *0.10. 1. The null hypothesis is that the instruments are not correlated with the residuals. 2. The null hypothesis is that the error term exhibits no second-order serial correlation.
Independent variables↓
Income <25th p.
(1)
Income <50th p.
(2)
Income <mean
(3)
Income <75th p.
(4)
Income <25th p.
(5)
Income <50th p.
(6)
Income <mean
(7)
Income <75th p.
(8)
Ln (ODA grants/GDP),t-1
0.240***
(0.000)
0.069***
(0.005)
0.070***
(0.001)
0.085***
(0.000)
0.010
(0.905)
0.063
(0.177)
0.106**
(0.014)
0.135***
(0.009) [Ln (ODA grants/GDP)]2,t-1 ˗0.036***
(0.005) ˗0.009
(0.122) ˗0.008 (0.104)
˗0.011**
(0.022) 0.011
(0.423) ˗0.001
(0.874) ˗0.013
(0.109) ˗0.019*
(0.070) Ln (ODA loans/GDP),t-1
˗4.951**
(0.019) ˗4.292**
(0.012) ˗0.175**
(0.016) ˗0.166**
(0.020) ˗8.700**
(0.000) ˗8.017**
(0.000) ˗0.303**
(0.025) ˗0.278*
(0.060) [Ln (ODA loans/GDP)]2,t-1 0.526**
(0.021) 0.467***
(0.011) 0.034**
(0.024) 0.031**
(0.036) 0.992***
(0.000) 0.897***
(0.000) 0.057**
(0.053) 0.050
(0.123) Ln (Offshore bank loans/GDP),t-1
˗1.536***
(0.009) ˗1.477***
(0.006) ˗1.141***
(0.003) ˗1.076***
(0.005) ˗1.539***
(0.000) ˗1.625***
(0.000) ˗1.639***
(0.000) ˗1.650***
(0.000) [Ln (Offshore bank loans/GDP)]2,t-1 0.237***
(0.006) 0.227***
(0.000) 0.171***
(0.000) 0.159***
(0.001) 0.203***
(0.000) 0.217***
(0.000) 0.219***
(0.000) 0.221***
(0.000) Investment/GDP
0.002**
(0.018) 0.001*
(0.060) 0.001**
(0.049) 0.001*
(0.056) 0.008***
(0.000) 0.006***
(0.001) 0.003*
(0.056) 0.003
(0.162) Government consumption/GDP ˗0.005***
(0.011) ˗0.005***
(0.000) ˗0.005***
(0.000) ˗0.005***
(0.000) ˗0.013***
(0.000) ˗0.015***
(0.000) ˗0.011***
(0.000) ˗0.012***
(0.000) Ln (Initial GDP per capita) ˗1.023
(0.267) ˗1.699***
(0.267) ˗1.117***
(0.001) ˗0.934***
(0.004) ˗3.271***
(0.002) ˗3.795***
(0.000) ˗2.050***
(0.001) ˗1.451**
(0.023) Ln (Inflation)
˗0.050*** (0.005)
˗0.041*** (0.001)
˗0.037*** (0.001)
˗0.045*** (0.000)
˗0.020 (0.116)
˗0.059*** (0.000)
˗0.056*** (0.000)
˗0.058*** (0.000)
Trade/GDP
0.0003
(0.920) ˗0.0001
(0.610) 0.0001
(0.401) 0.0002
(0.103) 0.001
(0.116) 0.0004
(0.306) 0.0001
(0.844) ˗0.0001
(0.788) Voice & accountability
0.061***
(0.003) 0.058***
(0.000) 0.042***
(0.000) 0.041***
(0.000) 0.206***
(0.000) 0.124***
(0.002) 0.091***
(0.009) 0.064*
(0.065) Lagged dependent variable 0.005
(0.747) 0.070***
(0.000) 0.084***
(0.000) 0.111***
(0.000) Time effects Yes Yes Yes Yes Yes Yes Yes Yes Country fixed effects Yes Yes Yes Yes # of observations 433 871 1207 1317 398 801 1112 1216 # of countries 38 71 94 101 38 72 94 101 # of instruments 39 39 39 39 Wald chi-square 417.0 2880.2 1517.6 1522.6 Sargan test1 0.363 0.188 0.245 0.224 Autocorrelation test2 0.265 0.268 0.232 0.275 Joint significance: aid & aid sq. 0.000 0.000 0.002 Joint significance: loans & loans sq. 0.000
Marginal effect of ODA grants 0.067 0.033 0.041 0.047 0.059 0.069 Marginal effect of ODA loans 0.165 0.250 0.155 0.135 0.946 0.707 0.251 0.208 Marginal effect of bank loans 1.281 1.222 0.893 0.815 0.875 0.955 0.965 0.979 Critical values grants/ODA loans (X) 4.618 4.581 2.917 2.988 2.921 2.993 Critical values grants/bank loans (Y) 3.253 3.276 3.383 3.415 3.761 3.719

29
Appendix A: List of 131 developing countries in our study.
Albania Djibouti Libya Serbia Algeria Dominica Macedonia Seychelles Angola Dominican Republic Madagascar Sierra Leone Argentina Ecuador Malawi Slovenia Armenia El Salvador Malaysia Solomon Islands Azerbaijan Equatorial Guinea Maldives South Africa Bahrain Eritrea Mali Sri Lanka Bangladesh Ethiopia Malta St. Lucia Barbados Fiji Mauritania St. Vincent & Grenadines Belarus Gabon Mauritius Sudan Belize Gambia Mexico Suriname Benin Georgia Moldova Swaziland Bhutan Ghana Mongolia Syrian Arab Republic Bolivia Grenada Morocco Tajikistan Botswana Guatemala Mozambique Tanzania Brazil Guinea Namibia Thailand Burkina Faso Guinea-Bissau Nepal Togo Burundi Guyana Nicaragua Tonga Cambodia Haiti Niger Trinidad and Tobago Cameroon Honduras Nigeria Tunisia Cape Verde India Oman Turkey Central African Republic Indonesia Pakistan Turkmenistan Chad Iran, Islamic Republic Palau Uganda Chile Jamaica Panama Ukraine China Jordan Papua New Guinea Uruguay Colombia Kazakhstan Paraguay Uzbekistan Comoros Kenya Peru Vanuatu Congo, Democratic Republic Kiribati Philippines Venezuela Congo, Republic Kyrgyz Republic Rwanda Vietnam Costa Rica Laos Samoa Yemen, Republic Cote d'Ivoire Lebanon Sao Tome & Principe Zambia Croatia Lesotho Saudi Arabia Zimbabwe Cuba Liberia Senegal