financials 2020 - fortum
TRANSCRIPT

Financials 2020

OPERATING AND FINANCIAL
REVIEW
CONSOLIDATED FINANCIAL
STATEMENTS NOTES KEY
FIGURES
PARENT COMPANY FINANCIAL
STATEMENTS
SIGNATURES FOR THE OPERATING AND FINANCIAL REVIEW AND
FINANCIAL STATEMENTS AUDITOR’S
REPORT
KEY FIGURES
2011–2020
QUARTERLY FINANCIAL
INFORMATION INVESTOR
INFORMATION
Financials 2020 – Reader’s guide This report consists of the operating and financial review and the consolidated financial statements of Fortum Group, including the parent company financial statements. Other parts of Fortum’s reporting entity include CEO’s business review, corporate governance statement, remuneration report as well as tax footprint, which are published on Fortum’s webpage. Sustainability reporting is an integrated part of Fortum’s annual reporting and additional information on sustainability operations can be found on Forum’s website in sustainability section.
Operating and financial review This section includes description of Fortum’s financial performance during 2020. Here you will also find a description of the risk management as well as information on sustainability and Fortum share performance.
Consolidated financial statements Primary statements include Fortum’s consolidated income statement, statement of comprehensive income, balance sheet, statement of changes in total equity and cash flow statement.
Notes The notes to the consolidated financial statements are grouped to six sections based on their nature. Use the note number list on the right side of the notes pages to navigate in the financial statements.
Key figures Key figures consist of financial key figures, share key figures and operational key figures for 2019–2020. The financial key figures derive mainly from the primary statements. Segment key figures include information on segments.
Parent company financial statements Here you can read the parent company financial statements including the primary statements, cash flow and notes to the financial statements.
Signatures for the operating and financial review and financial statements The Board of Directors’ and the CEO’s signatures of the operating and financial review and financial statements are in this section.
Auditor’s report This section includes the audit report issued by Fortum Oyj’s auditor, Deloitte Oy.
Key figures 2011–2020, operational key figures and quarterly financial information Look here for financial key figures, share key figures, operational key figures and volume related key figures for 2011–2020 as well as capex and quarterly financial information for the years 2019 and 2020.
Investor information Here you will find information on Fortum’s Annual General Meeting, dividend payment, basic share information as well as details of the financial information available to shareholders in 2021.
Notes
1–3 Basis of preparation These notes describe the basis of preparing the consolidated financial statements and consist of the accounting policies, critical accounting estimates and judgements and information about acquisitions and disposals.
4–5 Risks In the Risks section you will find notes that disclose how Fortum manages financial risks and capital risks.
6–13 Income statement These notes provide supporting information for the income statement.
14–33 Balance sheet These notes provide supporting information for the balance sheet.
34–36 Off balance sheet items The notes in this section provide information on items that are not included on the balance sheet.
37–39 Group structure and related parties This section includes information on related party transactions, events after balance sheet date and the group companies of Fortum group.
The following symbols show which amounts in the notes reconcile to the items in income statement, balance sheet and cash flow statement.
IS = Income statement BS = Balance sheet CF = Cash flow
OPERATING AND FINANCIAL
REVIEW
CONSOLIDATED FINANCIAL
STATEMENTS NOTES KEY
FIGURES
PARENT COMPANY FINANCIAL
STATEMENTS
SIGNATURES FOR THE OPERATING AND FINANCIAL REVIEW AND
FINANCIAL STATEMENTS AUDITOR’S
REPORT
KEY FIGURES
2011–2020
QUARTERLY FINANCIAL
INFORMATION INVESTOR
INFORMATION 11
Financials 2020
Reader’s guide
OPERATING AND FINANCIAL REVIEW 2 Financial performance and position 2 Sustainability 21 Risk management 27 Fortum share and shareholders 36
FINANCIAL STATEMENTS 39 Consolidated financial statements 39 Consolidated income statement 39 Consolidated statement of comprehensive income 40 Consolidated balance sheet 41 Consolidated statement of changes in total equity 42 Consolidated cash flow statement 44
Notes to the consolidated financial statements 46 1 Significant accounting policies 46 2 Critical accounting estimates and judgements 50 3 Acquisitions, disposals and assets held for sale 51 4 Financial risk management 55 5 Capital risk management 62 6 Segment reporting 63 7 Items affecting comparability 69 8 Other income and other expenses 70 9 Materials and services 71
10 Employee benefits and Board remuneration 71 11 Finance costs – net 75
12 Income tax expense 76 13 Earnings and dividend per share 77 14 Financial assets and liabilities by categories 78 15 Financial assets and liabilities by fair value hierarchy 82 16 Intangible assets 85 17 Property, plant and equipment and right-of-use assets 87 18 Participations in associated companies and joint ventures 89 19 Other non-current assets 94 20 Interest-bearing receivables 94 21 Inventories 95 22 Trade and other receivables 95 23 Liquid funds 96 24 Share capital 97 25 Non-controlling interests 97 26 Interest-bearing liabilities 98 27 Income taxes on the balance sheet 101 28 Nuclear related assets and liabilities 103 29 Other provisions 106 30 Pension obligations 108 31 Other non-current liabilities 111 32 Trade and other payables 111 33 Leases 112 34 Capital and other commitments 114 35 Pledged assets and contingent liabilities 115 36 Legal actions and official proceedings 116 37 Related party transactions 116 38 Events after the balance sheet date 117 39 Group companies by segment 118
Key figures 122 Financial key figures 122 Share key figures 123 Segment key figures 124 Definitions of key figures 126
Parent company financial statements 130 Income statement 130 Balance sheet 130 Cash flow statement 131 Notes 132
Proposal for the use of the profit shown on the balance sheet 139
Auditor’s report 140
Key figures 2011–2020 145 Financial key figures 145 Share key figures 147 Segment key figures 148 Capital expenditure 154 Operational key figures 156
Quarterly financial information 160
Investor information 162
OPERATING AND FINANCIAL
REVIEW
CONSOLIDATED FINANCIAL
STATEMENTS NOTES KEY
FIGURES
PARENT COMPANY FINANCIAL
STATEMENTS
SIGNATURES FOR THE OPERATING AND FINANCIAL REVIEW AND
FINANCIAL STATEMENTS AUDITOR’S
REPORT
KEY FIGURES
2011–2020
QUARTERLY FINANCIAL
INFORMATION INVESTOR
INFORMATION 22
Financial performance and position Sustainability Risk management Fortum share and shareholders
Financial performance and position Good performance in a challenging year – Strategy updated to drive the clean energy transition
Key figures
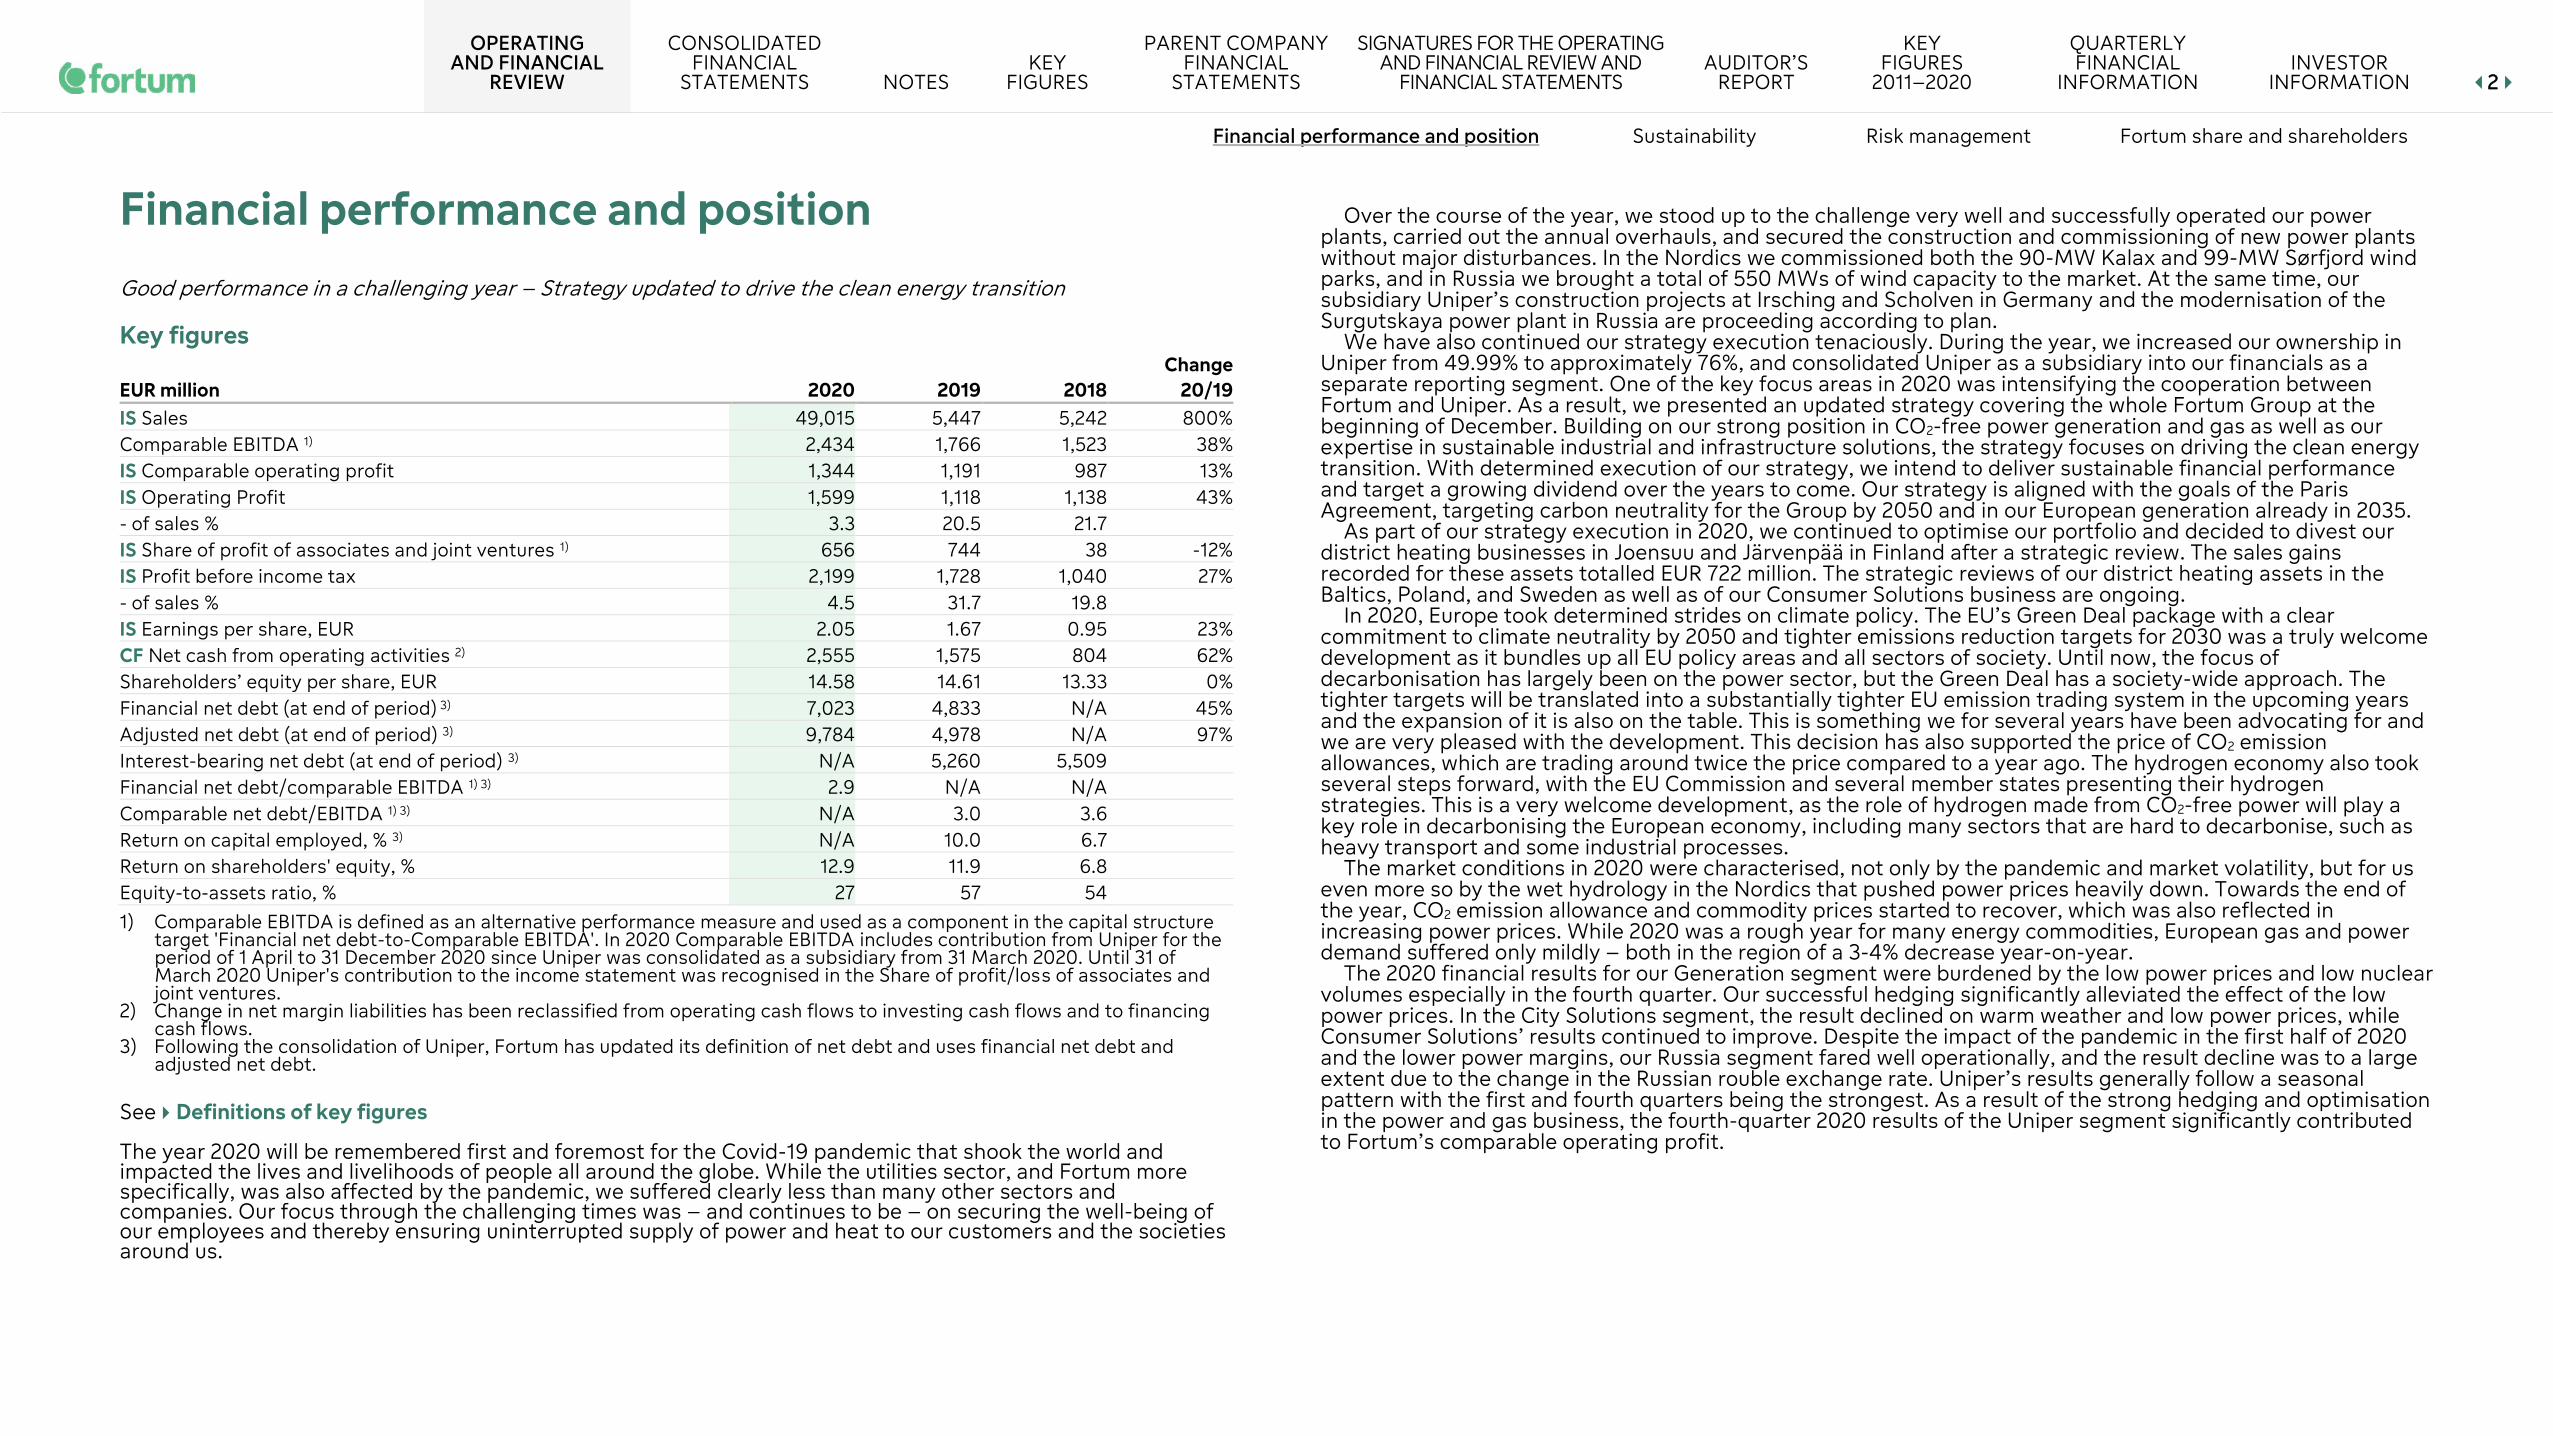
EUR million 2020 2019 2018 Change
20/19 IS Sales 49,015 5,447 5,242 800% Comparable EBITDA 1) 2,434 1,766 1,523 38% IS Comparable operating profit 1,344 1,191 987 13% IS Operating Profit 1,599 1,118 1,138 43% - of sales % 3.3 20.5 21.7 IS Share of profit of associates and joint ventures 1) 656 744 38 -12% IS Profit before income tax 2,199 1,728 1,040 27% - of sales % 4.5 31.7 19.8 IS Earnings per share, EUR 2.05 1.67 0.95 23% CF Net cash from operating activities 2) 2,555 1,575 804 62% Shareholders’ equity per share, EUR 14.58 14.61 13.33 0% Financial net debt (at end of period) 3) 7,023 4,833 N/A 45% Adjusted net debt (at end of period) 3) 9,784 4,978 N/A 97% Interest-bearing net debt (at end of period) 3) N/A 5,260 5,509 Financial net debt/comparable EBITDA 1) 3) 2.9 N/A N/A Comparable net debt/EBITDA 1) 3) N/A 3.0 3.6 Return on capital employed, % 3) N/A 10.0 6.7 Return on shareholders' equity, % 12.9 11.9 6.8 Equity-to-assets ratio, % 27 57 54
1) Comparable EBITDA is defined as an alternative performance measure and used as a component in the capital structure target 'Financial net debt-to-Comparable EBITDA'. In 2020 Comparable EBITDA includes contribution from Uniper for the period of 1 April to 31 December 2020 since Uniper was consolidated as a subsidiary from 31 March 2020. Until 31 of March 2020 Uniper's contribution to the income statement was recognised in the Share of profit/loss of associates and joint ventures.
2) Change in net margin liabilities has been reclassified from operating cash flows to investing cash flows and to financing cash flows.
3) Following the consolidation of Uniper, Fortum has updated its definition of net debt and uses financial net debt and adjusted net debt.
See Definitions of key figures The year 2020 will be remembered first and foremost for the Covid-19 pandemic that shook the world and impacted the lives and livelihoods of people all around the globe. While the utilities sector, and Fortum more specifically, was also affected by the pandemic, we suffered clearly less than many other sectors and companies. Our focus through the challenging times was – and continues to be – on securing the well-being of our employees and thereby ensuring uninterrupted supply of power and heat to our customers and the societies around us.
Over the course of the year, we stood up to the challenge very well and successfully operated our power
plants, carried out the annual overhauls, and secured the construction and commissioning of new power plants without major disturbances. In the Nordics we commissioned both the 90-MW Kalax and 99-MW Sørfjord wind parks, and in Russia we brought a total of 550 MWs of wind capacity to the market. At the same time, our subsidiary Uniper’s construction projects at Irsching and Scholven in Germany and the modernisation of the Surgutskaya power plant in Russia are proceeding according to plan.
We have also continued our strategy execution tenaciously. During the year, we increased our ownership in Uniper from 49.99% to approximately 76%, and consolidated Uniper as a subsidiary into our financials as a separate reporting segment. One of the key focus areas in 2020 was intensifying the cooperation between Fortum and Uniper. As a result, we presented an updated strategy covering the whole Fortum Group at the beginning of December. Building on our strong position in CO2-free power generation and gas as well as our expertise in sustainable industrial and infrastructure solutions, the strategy focuses on driving the clean energy transition. With determined execution of our strategy, we intend to deliver sustainable financial performance and target a growing dividend over the years to come. Our strategy is aligned with the goals of the Paris Agreement, targeting carbon neutrality for the Group by 2050 and in our European generation already in 2035.
As part of our strategy execution in 2020, we continued to optimise our portfolio and decided to divest our district heating businesses in Joensuu and Järvenpää in Finland after a strategic review. The sales gains recorded for these assets totalled EUR 722 million. The strategic reviews of our district heating assets in the Baltics, Poland, and Sweden as well as of our Consumer Solutions business are ongoing.
In 2020, Europe took determined strides on climate policy. The EU’s Green Deal package with a clear commitment to climate neutrality by 2050 and tighter emissions reduction targets for 2030 was a truly welcome development as it bundles up all EU policy areas and all sectors of society. Until now, the focus of decarbonisation has largely been on the power sector, but the Green Deal has a society-wide approach. The tighter targets will be translated into a substantially tighter EU emission trading system in the upcoming years and the expansion of it is also on the table. This is something we for several years have been advocating for and we are very pleased with the development. This decision has also supported the price of CO2 emission allowances, which are trading around twice the price compared to a year ago. The hydrogen economy also took several steps forward, with the EU Commission and several member states presenting their hydrogen strategies. This is a very welcome development, as the role of hydrogen made from CO2-free power will play a key role in decarbonising the European economy, including many sectors that are hard to decarbonise, such as heavy transport and some industrial processes.
The market conditions in 2020 were characterised, not only by the pandemic and market volatility, but for us even more so by the wet hydrology in the Nordics that pushed power prices heavily down. Towards the end of the year, CO2 emission allowance and commodity prices started to recover, which was also reflected in increasing power prices. While 2020 was a rough year for many energy commodities, European gas and power demand suffered only mildly – both in the region of a 3-4% decrease year-on-year.
The 2020 financial results for our Generation segment were burdened by the low power prices and low nuclear volumes especially in the fourth quarter. Our successful hedging significantly alleviated the effect of the low power prices. In the City Solutions segment, the result declined on warm weather and low power prices, while Consumer Solutions’ results continued to improve. Despite the impact of the pandemic in the first half of 2020 and the lower power margins, our Russia segment fared well operationally, and the result decline was to a large extent due to the change in the Russian rouble exchange rate. Uniper’s results generally follow a seasonal pattern with the first and fourth quarters being the strongest. As a result of the strong hedging and optimisation in the power and gas business, the fourth-quarter 2020 results of the Uniper segment significantly contributed to Fortum’s comparable operating profit.
OPERATING AND FINANCIAL
REVIEW
CONSOLIDATED FINANCIAL
STATEMENTS NOTES KEY
FIGURES
PARENT COMPANY FINANCIAL
STATEMENTS
SIGNATURES FOR THE OPERATING AND FINANCIAL REVIEW AND
FINANCIAL STATEMENTS AUDITOR’S
REPORT
KEY FIGURES
2011–2020
QUARTERLY FINANCIAL
INFORMATION INVESTOR
INFORMATION 33
Financial performance and position Sustainability Risk management Fortum share and shareholders
In line with our updated dividend policy and what we communicated in early December, the Board of Directors proposes a dividend of EUR 1.12 per share for the financial year 2020, an increase from the stable dividend we have been paying for several years.
Changes in reporting
Uniper consolidation As the majority owner of Uniper, Fortum consolidated Uniper as a subsidiary as of 31 March 2020. Uniper is a separate reportable segment of Fortum. Fortum consolidated Uniper into its balance sheet as of 31 March 2020 and, from 1 April 2020, consolidated Uniper’s results into its income statement. In 2019 and in the first quarter of 2020, Uniper was consolidated as an associated company into Fortum’s income statement.
When consolidating Uniper’s results into Fortum’s income statement, the income statement line items have been classified in accordance with Fortum’s income statement categorisation and, as such, may not be fully comparable to Uniper’s standalone income statement. In the consolidation of Uniper’s results, Fortum has utilised the ‘Components of adjusted EBIT’ reported by Uniper (see Uniper’s Annual Report 2020, page 38). Furthermore, reporting of both the Uniper segment and the Generation segment are impacted by adjustments for the joint ownership in the Swedish nuclear company, OKG AB.
Purchase price allocation The preparation of the purchase price allocation for the Uniper acquisition is being finalised and will be completed within the one-year window from the acquisition date, i.e. by 31 March 2021.
At 31 December 2020, Fortum presents the preliminary purchase price allocation for the Uniper acquisition, which has resulted in adjustments to Uniper’s opening balance sheet on 31 March 2020. These adjustments led to restatement of the first, second, and third quarters of 2020 (Restated quarterly financials separately published on 12 March 2021).
The financial effect of the purchase price allocation of the Uniper acquisition on the comparable operating profit of the Uniper segment in 2020 totals EUR 57 million resulting from one-time adjustments of EUR +68 million and recurring adjustments of EUR -11 million. See below.
Recurring adjustments: • Fair value adjustments made to Uniper’s opening balance sheet on 31 March 2020 mainly relate to
property, plant, and equipment and right-of-use assets, participations in associates and joint ventures, lease liabilities, other provisions, as well as deferred taxes. The increase in the value of property, plant, and equipment resulted in additional depreciations (EUR 11 million in 2020) impacting Comparable operating profit. In addition the increase in the value of the lease liability (due to a lower discount rate) resulted in lower interest costs (EUR 26 million in 2020).
One-time adjustments: • The purchase price allocation resulted in certain one-time adjustments to the results of the Uniper
segment for the second, third and fourth quarters of 2020, which are now reflected in the acquisition date opening balance sheet on 31 March 2020. The total one-time impact in 2020 on comparable operating profit is EUR +68 million, and on items affecting comparability EUR -31 million.
Excess of the acquisition value over the fair value of Uniper’s net assets, resulted in a preliminary goodwill amount of EUR 515 million.
Other changes The following changes have been made in comparison to Fortum’s 2019 Annual Financial Statements in order to align with Uniper:
• Fortum updated the definition of ‘net debt’ and applied the use of ‘financial net debt’ and ‘adjusted net debt’ when following indebtedness of the Group.
• Fortum updated the definition of ‘Items affecting comparability’ and ‘Comparable operating profit’. • Fortum reclassified the ‘change in net margin liabilities from operating cash flows’ in the consolidated
cash flow statement so that the ‘change in margin receivables’ is presented in ‘investing cash flows’, and the ‘change in margin liabilities’ is presented in ‘financing cash flows’. The comparison figures have been reclassified accordingly.
• Nuclear fund adjustments in the consolidated income statement were reclassified from ‘Items affecting comparability’ to ‘Other financial expenses, net’. This change does not impact Comparable operating profit. Further, in the consolidate cash flow statement, ‘nuclear fund-related payments and repayments’ have been reclassified from ‘cash flow from operating activities’ to ‘cash flow from investment activities’. The comparison figures have been reclassified accordingly.
Uniper’s energy trading and optimisation business accounts for more than 90% of the Uniper Group’s sales. A substantial portion of Uniper’s sales arises from the physical assets and contract portfolio optimisation, which is accounted for on a gross basis.
For further details on the consolidation of Uniper, see Note 1.
Strategy update
In December 2020, Fortum updated the strategy for the whole Fortum Group to drive the clean energy transition and deliver sustainable financial performance. Aligned with the goals of the Paris Agreement, Fortum targets carbon neutrality by 2050 with ambitious mid-term targets.
The updated strategy builds on four priorities: ‘Transform own operations to carbon neutral’, ‘Strengthen and grow in CO2-free power generation’, ‘Leverage strong position in gas to enable the energy transition’, and ‘Partner with industrial and infrastructure customers’.
Fortum has committed to the following ambitious climate and environmental targets: • Carbon neutral, in line with the goals of the Paris Agreement, by 2050 at the latest (Scope 1, 2, and 3
emissions) • Carbon neutral in European generation by 2035 at the latest (Scope 1 and 2) • Reduction of CO2 emissions (Scope 1 and 2) in European generation by at least 50% by 2030 (base year
2019) • Number of major voluntary measures enhancing biodiversity ≥12 in 2021 During 2021, Fortum will develop a target for the reduction of Scope 3 emissions addressing the indirect
emissions from our fuel sales business (category 11). Fortum’s coal-fired generation capacity will be reduced by more than 50% by the end of 2025, to
approximately 5 GW. Measures for the reduction include the coal-fired plant closures in Germany announced by Uniper earlier in 2020 (and updated in December): 0.9 GW at the end of 2020, 1.5 GW by the end of 2022, and a further 0.5 GW by the end of 2025. The reduction also includes the closure of Uniper’s 2 GW in the UK by the end of 2025 and Fortum’s previously announced commitment to discontinue the use of coal in Espoo by 2025.

OPERATING AND FINANCIAL
REVIEW
CONSOLIDATED FINANCIAL
STATEMENTS NOTES KEY
FIGURES
PARENT COMPANY FINANCIAL
STATEMENTS
SIGNATURES FOR THE OPERATING AND FINANCIAL REVIEW AND
FINANCIAL STATEMENTS AUDITOR’S
REPORT
KEY FIGURES
2011–2020
QUARTERLY FINANCIAL
INFORMATION INVESTOR
INFORMATION 44
Financial performance and position Sustainability Risk management Fortum share and shareholders
In addition to the above-mentioned planned power plant closures, Uniper will close its 1-GW coal-fired plant in the Netherlands by the end of 2029. As defined in the German coal-exit law, Uniper’s 1.1-GW coal-fired power plant in Germany, Datteln 4, will be decommissioned by 2038.
Fortum will also focus on growing a sizeable portfolio of onshore wind and solar based power generation primarily in Europe to make it a meaningful EBITDA contributor. The target is to build 1.5-2 GW of new capacity by 2025. This capacity will be built partly on our own balance sheet and partly using the ‘build-operate-transfer’ business model.
Fortum will gradually transform its Russian asset portfolio towards renewables, while over time reducing our fossil exposure.
In parallel with the strategy alignment, Fortum and Uniper have together identified cooperation benefits with a positive cash impact on a consolidated Group basis of approximately EUR 100 million annually. More than EUR 50 million of these annual benefits are estimated to be achieved by the end of 2023, with full effect of approximately EUR 100 million annually in 2025. Through this cooperation we will be able to create value for both companies and their shareholders.
Financial targets and dividend policy Following the consolidation of Uniper, Fortum’s business profile has changed. Consequently on 15 May 2020, Fortum’s Board of Directors decided to remove the financial targets (return on capital employed of at least 10% and comparable net debt-to-EBITDA of around 2.5x) as of the first quarter of 2020.
In December 2020, Fortum updated its financial targets and dividend policy. Fortum continues to be committed to maintaining a rating of at least BBB. The long-term financial targets are:
• Financial net debt/comparable EBITDA below 2x • Hurdle rates for new investments of WACC
• +100 bps for green investments • +200 bps for other investments
Fortum's dividend policy was revised and is ‘to pay a stable, sustainable, and over time increasing dividend’.
Comparability of information presented in tables As the majority owner of Uniper, Fortum consolidated Uniper as a subsidiary as of 31 March 2020. Uniper is a separate reportable segment of Fortum. This entailed changes in Fortum’s reporting structure, accounting policies, as well as definitions of certain key figures and reclassification of nuclear fund adjustment, among others. For additional information, see Note 1 Significant accounting policies.
Fortum consolidated Uniper’s income statement from 1.4.2020, which is the main reason for the change in the figures compared to the previous year. Financial results discussed in the operating and financial review are for Fortum, including Uniper unless otherwise stated.
Financial results
Sales by segment
EUR million 2020 2019 Change
20/19 Generation 2,006 2,141 -6% Russia 929 1,071 -13% City Solutions 1,075 1,200 -10% Consumer Solutions 1,267 1,835 -31% Uniper 44,514 - 100% Other Operations 140 115 22% Netting of Nord Pool transactions 1) -317 -529 Eliminations -598 -387 IS Total 49,015 5,447 800%
1) Sales and purchases with Nord Pool Spot are netted at the Group level on an hourly basis and posted either as revenue or cost depending on whether Fortum is a net seller or net buyer during any particular hour.
Comparable EBITDA by segment
EUR million 2020 2019 Change
20/19 Generation 886 939 -6% Russia 394 469 -16% City Solutions 239 308 -22% Consumer Solutions 153 141 9% Uniper 856 - 100% Other Operations -94 -91 -3% Total 2,434 1,766 38%
Comparable operating profit by segment
EUR million 2020 2019 Change
20/19 Generation 722 794 -9% Russia 251 316 -21% City Solutions 47 120 -61% Consumer Solutions 90 79 14% Uniper 363 - 100% Other Operations -129 -118 -9% IS Total 1,344 1,191 13%

OPERATING AND FINANCIAL
REVIEW
CONSOLIDATED FINANCIAL
STATEMENTS NOTES KEY
FIGURES
PARENT COMPANY FINANCIAL
STATEMENTS
SIGNATURES FOR THE OPERATING AND FINANCIAL REVIEW AND
FINANCIAL STATEMENTS AUDITOR’S
REPORT
KEY FIGURES
2011–2020
QUARTERLY FINANCIAL
INFORMATION INVESTOR
INFORMATION 55
Financial performance and position Sustainability Risk management Fortum share and shareholders
Operating profit by segment
EUR million 2020 2019 Change
20/19 Generation 711 780 -9% Russia 252 317 -21% City Solutions 775 127 510% Consumer Solutions 129 20 545% Uniper 29 - 100% Other Operations -298 -126 -136% IS Total 1,599 1,118 43%
Share of profits of associated companies and joint ventures
EUR million 2020 2019 Change
20/19 Generation 29 10 188% Russia 47 59 -21% City Solutions 57 37 54% Consumer Solutions - - - Uniper 54 - 100% Other Operations 470 638 - IS Total 656 744 -12%
For further information see Note 6 Segment reporting.
Sales were EUR 49,015 (5,447) million. Comparable operating profit increased by 13% and was EUR 1,344 (1,191) million, mainly due to the
consolidation of Uniper, partly offset by the weaker results in the heating and cooling business, and the negative effect of the change in the Russian rouble exchange rate. In the Generation segment the negative impact of the lower achieved power price and lower nuclear volumes was partly offset by the higher hydro volumes.
Operating profit for the period was impacted by EUR 255 (-72) million of items affecting comparability, mainly due to the sales gains of EUR 722 million from the divestments of the Joensuu and Järvenpää district heating operations, changes in fair values of non-hedge-accounted derivatives of EUR -675 (-72) million, and a one-time, non-cash tax-exempt income statement impact of EUR -222 million from Uniper becoming Fortum’s subsidiary on 31 March 2020. This one-time item did not affect Fortum’s total equity, as it is merely a reclassification within equity ( Note 1 and Note 7).
The share of profits of associates and joint ventures was EUR 656 (744) million. Since Fortum has accounted for Uniper’s share of profits with a time-lag of one quarter, Fortum's first-quarter 2020 results include the share of Uniper’s fourth-quarter 2019 profits of EUR 162 million and first-quarter 2020 profits of EUR 307 million. Fortum’s share of Uniper’s profits, EUR 469 (632) million, includes a reversal of the adjustment that Fortum recorded in the fourth quarter of 2019 related to the positive impact from the reinstatement of the UK capacity market. Further, Fortum also made a reversal of EUR 449 million after tax, related to the impairments Uniper recorded in the fourth quarter of 2019 and first quarter of 2020. In this reversal, Fortum utilised the fair value adjustments recorded in the purchase price allocation in 2018 ( Note 18).
Net finance costs amounted to EUR 56 (134) million. Profit before income taxes was EUR 2,199 (1,728) million.
Taxes for the period totalled EUR 344 (221) million. The effective income tax rate according to the income statement was 15.7% (2019: 12.8%). The comparable effective income tax rate (excluding the impact of the share of profit of associated companies and joint ventures as well as items affecting comparability, tax rate changes, and other major one-time income tax effects) was 23.8% (22.0%) ( Note 12).
The profit for the period was EUR 1,855 (1,507) million. Earnings per share were EUR 2.05 (1.67), of which EUR 0.38 (-0.07) per share were related to items affecting comparability.
Financial position and cash flow
EUR million 2020 2019 Change
20/19 Interest expense -170 -167 2% Interest income 111 28 297% Other financial expenses - net 3 5 43% IS Finance costs - net -56 -134 58% Financial net debt 7,023 4,833 45% Adjusted net debt 9,784 4,978 97%
Cash flow In 2020, net cash from operating activities increased by EUR 980 million to EUR 2,555 (1,575) million.
Net cash used in investing activities was EUR 2,140 (-118) million. Capital expenditure increased by EUR 406 million to EUR 1,101 (695) million. Acquisition of shares, net of liquid funds, amounted to EUR 1,801 million, mainly from acquiring shares in Uniper. Divestment of shares, mainly from the divestments of the Joensuu and Järvenpää district heating operations, amounted to EUR 1,244 million. Change in margin receivables was EUR -522 (403) million. The non-cash collateral arrangement to release pledged cash from the Nordic power exchange in the first quarter of 2019 had a one-time positive impact of EUR 310 million presented in ‘Change in other interest-bearing receivables’. Operational cash flow and divestments more than covered the investments resulting in cash flow before financing activities of EUR 415 (1,693) million.
Proceeds from long-term liabilities were EUR 2,569 (2,805) million. On 24 March 2020, Fortum drew a term loan of EUR 2,000 million and on 6 May 2020 a bridge loan of EUR 300 million to finance the acquisition of Uniper shares. In 2019, Fortum issued new bonds totalling EUR 2.5 billion under the Euro Medium Term Note (EMTN) programme. The total payments of long-term liabilities were EUR 507 (2,567) million including repayment of bridge loan. Change in margin liabilities was EUR -623 (-47) million. The net increase in liquid funds was EUR 920 (806) million.
Assets At the end of 2020, total assets amounted to EUR 57,810 (23,364) million. The increase mainly relates to the consolidation of Uniper. Liquid funds at the end of the period were EUR 2,308 (1,433) million.

OPERATING AND FINANCIAL
REVIEW
CONSOLIDATED FINANCIAL
STATEMENTS NOTES KEY
FIGURES
PARENT COMPANY FINANCIAL
STATEMENTS
SIGNATURES FOR THE OPERATING AND FINANCIAL REVIEW AND
FINANCIAL STATEMENTS AUDITOR’S
REPORT
KEY FIGURES
2011–2020
QUARTERLY FINANCIAL
INFORMATION INVESTOR
INFORMATION 66
Financial performance and position Sustainability Risk management Fortum share and shareholders
Equity Equity attributable to owners of the parent company totalled EUR 12,953 (12,982) million. The change was mainly related to the net profit for the period of EUR 1,823 million, the dividend payment of EUR 977 million and the negative translation differences of EUR 492 million.
Financing In 2020, Fortum updated the definition of net debt and started to use financial net debt and adjusted net debt when following indebtedness of the Group. At the end of 2020, financial net debt was EUR 7,023 (4,833) million and adjusted net debt EUR 9,784 (4,978) million. Net debt according to the old definition was EUR 5,260 million at the end of 2019 ( Note 26).
At the end of 2020, the Group’s liquid funds totalled EUR 2,308 (1,433) million. Liquid funds include EUR 289 million held by Uniper.
At the end of 2020, Fortum had undrawn committed credit facilities amounting to EUR 5,000 million. The undrawn facilities include a EUR 1,450 million revolving credit facility, maturing in November 2021 (with an option to extend the maturity by one year), a EUR 1,750 million revolving credit facility maturing in June 2023, and Uniper’s revolving credit facility of EUR 1,800 million, which matures in September 2025. In addition to the revolving credit facilities, Fortum has EUR 100 million of committed overdraft limits that are valid until further notice.
In January 2020 Fortum cancelled EUR 3,000 million, in June 2020 EUR 1,200 million and in August 350 million of facilities and the revolving credit facility maturing in November 2021. The facilities were for purchase of Uniper shares and liquidity purposes.
In March 2020, Fortum drew a term loan of EUR 2,000 million, maturing on 31 October 2022, under these facilities for the acquisition of Uniper shares. In April 2020, Fortum signed a ten-year EUR 70 million bilateral loan agreement. In May 2020, under the facilities, Fortum drew a bridge loan of EUR 300 million, which was prepaid in June 2020. On 21 December 2020, Fortum drew a ten-year SEK 814 million (EUR 80 million) bilateral loan.
In March 2020, Standard & Poor’s resolved its CreditWatch Negative placement by affirming Fortum’s BBB long-term rating, with a Negative Outlook. The short-term rating is at level A 2. In April 2020, Fitch removed Fortum’s Rating Watch Negative placement by affirming Fortum’s BBB long-term rating, with a Negative Outlook.
In March 2020, Standard & Poor’s also resolved the CreditWatch Negative on Uniper’s rating by affirming Uniper’s BBB rating, with a Negative Outlook.
+180
Change in financial net debt 2020, EUR million
Financial net debt
2019
Divest- ments
Including acquired
debt
CF from operating activities
Dividends paid to
minorities
Acquired financial
debt
Dividends paid
Financial net debt
2020
Invest ments paid
4,833
2,010 6,843 2,555 2,902 1,260 977 160 44 7,023
FX and other
OPERATING AND FINANCIAL
REVIEW
CONSOLIDATED FINANCIAL
STATEMENTS NOTES KEY
FIGURES
PARENT COMPANY FINANCIAL
STATEMENTS
SIGNATURES FOR THE OPERATING AND FINANCIAL REVIEW AND
FINANCIAL STATEMENTS AUDITOR’S
REPORT
KEY FIGURES
2011–2020
QUARTERLY FINANCIAL
INFORMATION INVESTOR
INFORMATION 77
Financial performance and position Sustainability Risk management Fortum share and shareholders
Operating and regulatory environment
European power markets According to preliminary statistics, electricity consumption in the Nordic countries was 383 (394) TWh during 2020. The lower power demand in the Nordics was mainly related to mild weather. Lower industrial demand in Finland and Sweden also contributed to the decline in power demand.
Measures taken to prevent the spread of Covid-19 impacted power demand in various European countries, especially during the second quarter of 2020. However, the European power demand recovered significantly in the third quarter according to preliminary statistics, demand in the fourth quarter in central western Europe (Germany, France, Austria, Switzerland, Belgium, and the Netherlands) was just 1% below the 2019 level. As a whole, consumption in 2020 in central western Europe saw a 4% decline year-on-year.
In the long term, electricity is expected to continue to gain a higher share of total energy consumption. The growth rate, however, will largely be determined by the macroeconomic development in Europe and the Nordic countries. In the longer term, the rate of electrification of the industrial, transportation, and heating sectors is a key element determining the growth in electricity consumption.
At the beginning of 2020, the Nordic water reservoirs were at 79 TWh, which is 5 TWh lower than the long-term average and 5 TWh higher than one year earlier. The rainy and mild winter led to a rapid increase of the Nordic water reservoirs during the first quarter. Spring was fairly cold and the spring inflows were significantly delayed, but once melting started, the very large snow pack resulted in the spring inflows bringing water levels close to the historical maximum levels in most Nordic water reservoirs. At the end of 2020, the reservoirs were at 105 TWh, which is 21 TWh above the long-term average and 26 TWh higher than one year earlier.
During 2020, the average system spot price in Nord Pool was EUR 10.9 (38.9) per MWh. The average area price in Finland was EUR 28.0 (44.0) per MWh, in the SE3-area in Sweden (Stockholm) EUR 21.2 (38.4) per MWh, and in the SE2-area in Sweden (Sundsvall) EUR 14.4 (37.9) per MWh. The very large hydrological surplus in many hydro reservoirs was the main reason for the low Nordic spot prices during 2020.
In Germany, the average spot price in 2020 was EUR 30.5 (37.7) per MWh. At the end of February 2021, the Nordic system electricity forward price on Nasdaq Commodities for the
remainder of 2021 was around EUR 26 per MWh and for 2022 equally around EUR 26 per MWh. The Nordic water reservoirs were about 9 TWh above the long-term average and 1 TWh lower than one year earlier. The German electricity forward price for the remainder of 2021 was around EUR 48 per MWh and for 2022 around EUR 52 per MWh.
Commodity markets Gas demand in central western Europe was 2,119 (2,184) TWh during 2020. The central western European gas storage levels decreased from 539 TWh at the beginning of the year to 439 TWh at the end of the year, which is 8 TWh higher than the five-year average (2015–2019).
The average gas spot price (TTF) during 2020 was EUR 9.5 (13.5) per MWh. The 2021 forward price increased from EUR 16.4 per MWh at the beginning of the year to EUR 17.1 per MWh at the end of the year.
During 2020, European Emission Allowances (EUA) traded in the range of EUR 14-33 per tonne. The price increased from EUR 24.6 per tonne at the beginning of the year to EUR 32.7 per tonne at the end of the year.
The forward quotation for coal (ICE Rotterdam) for 2021 increased from USD 62.0 per tonne at the beginning of the year to USD 68.9 per tonne at the end of the year.
At the end of February 2021, the TTF forward price for gas for the remainder of 2021 was EUR 16.4 per MWh and for 2022 EUR 16.6 per MWh. The forward quotation for EUAs for 2021 was at the level of EUR 37 per tonne. The forward price for coal (ICE Rotterdam) for the remainder of 2021 was USD 67 per tonne.
Russian market Fortum’s Russia division operates thermal power plants mainly in the Tyumen and Khanty-Mansiysk area of western Siberia, where industrial production is dominated by the oil and gas industries, and in the Chelyabinsk area of the Urals, which is dominated by the metal industry. Uniper’s Russian subsidiary Unipro PJSC operates in the Smolensk, Moscow, Sverdlovsk, and Krasnoyarsk regions, as well as in the Khanty-Mansiysk Autonomous District.
The Russian market is divided into two price zones; Fortum’s Russia division operates in the first price zone (European and Urals part of Russia), while Uniper operates in both the first and second price zones.
In 2020, the average electricity spot price, excluding capacity prices, was RUB 1,220 (1,289) per MWh in the first price zone and by RUB 873 (892) in the second price zone. The spot price in the Urals hub was RUB 1,068 (1,117) per MWh.
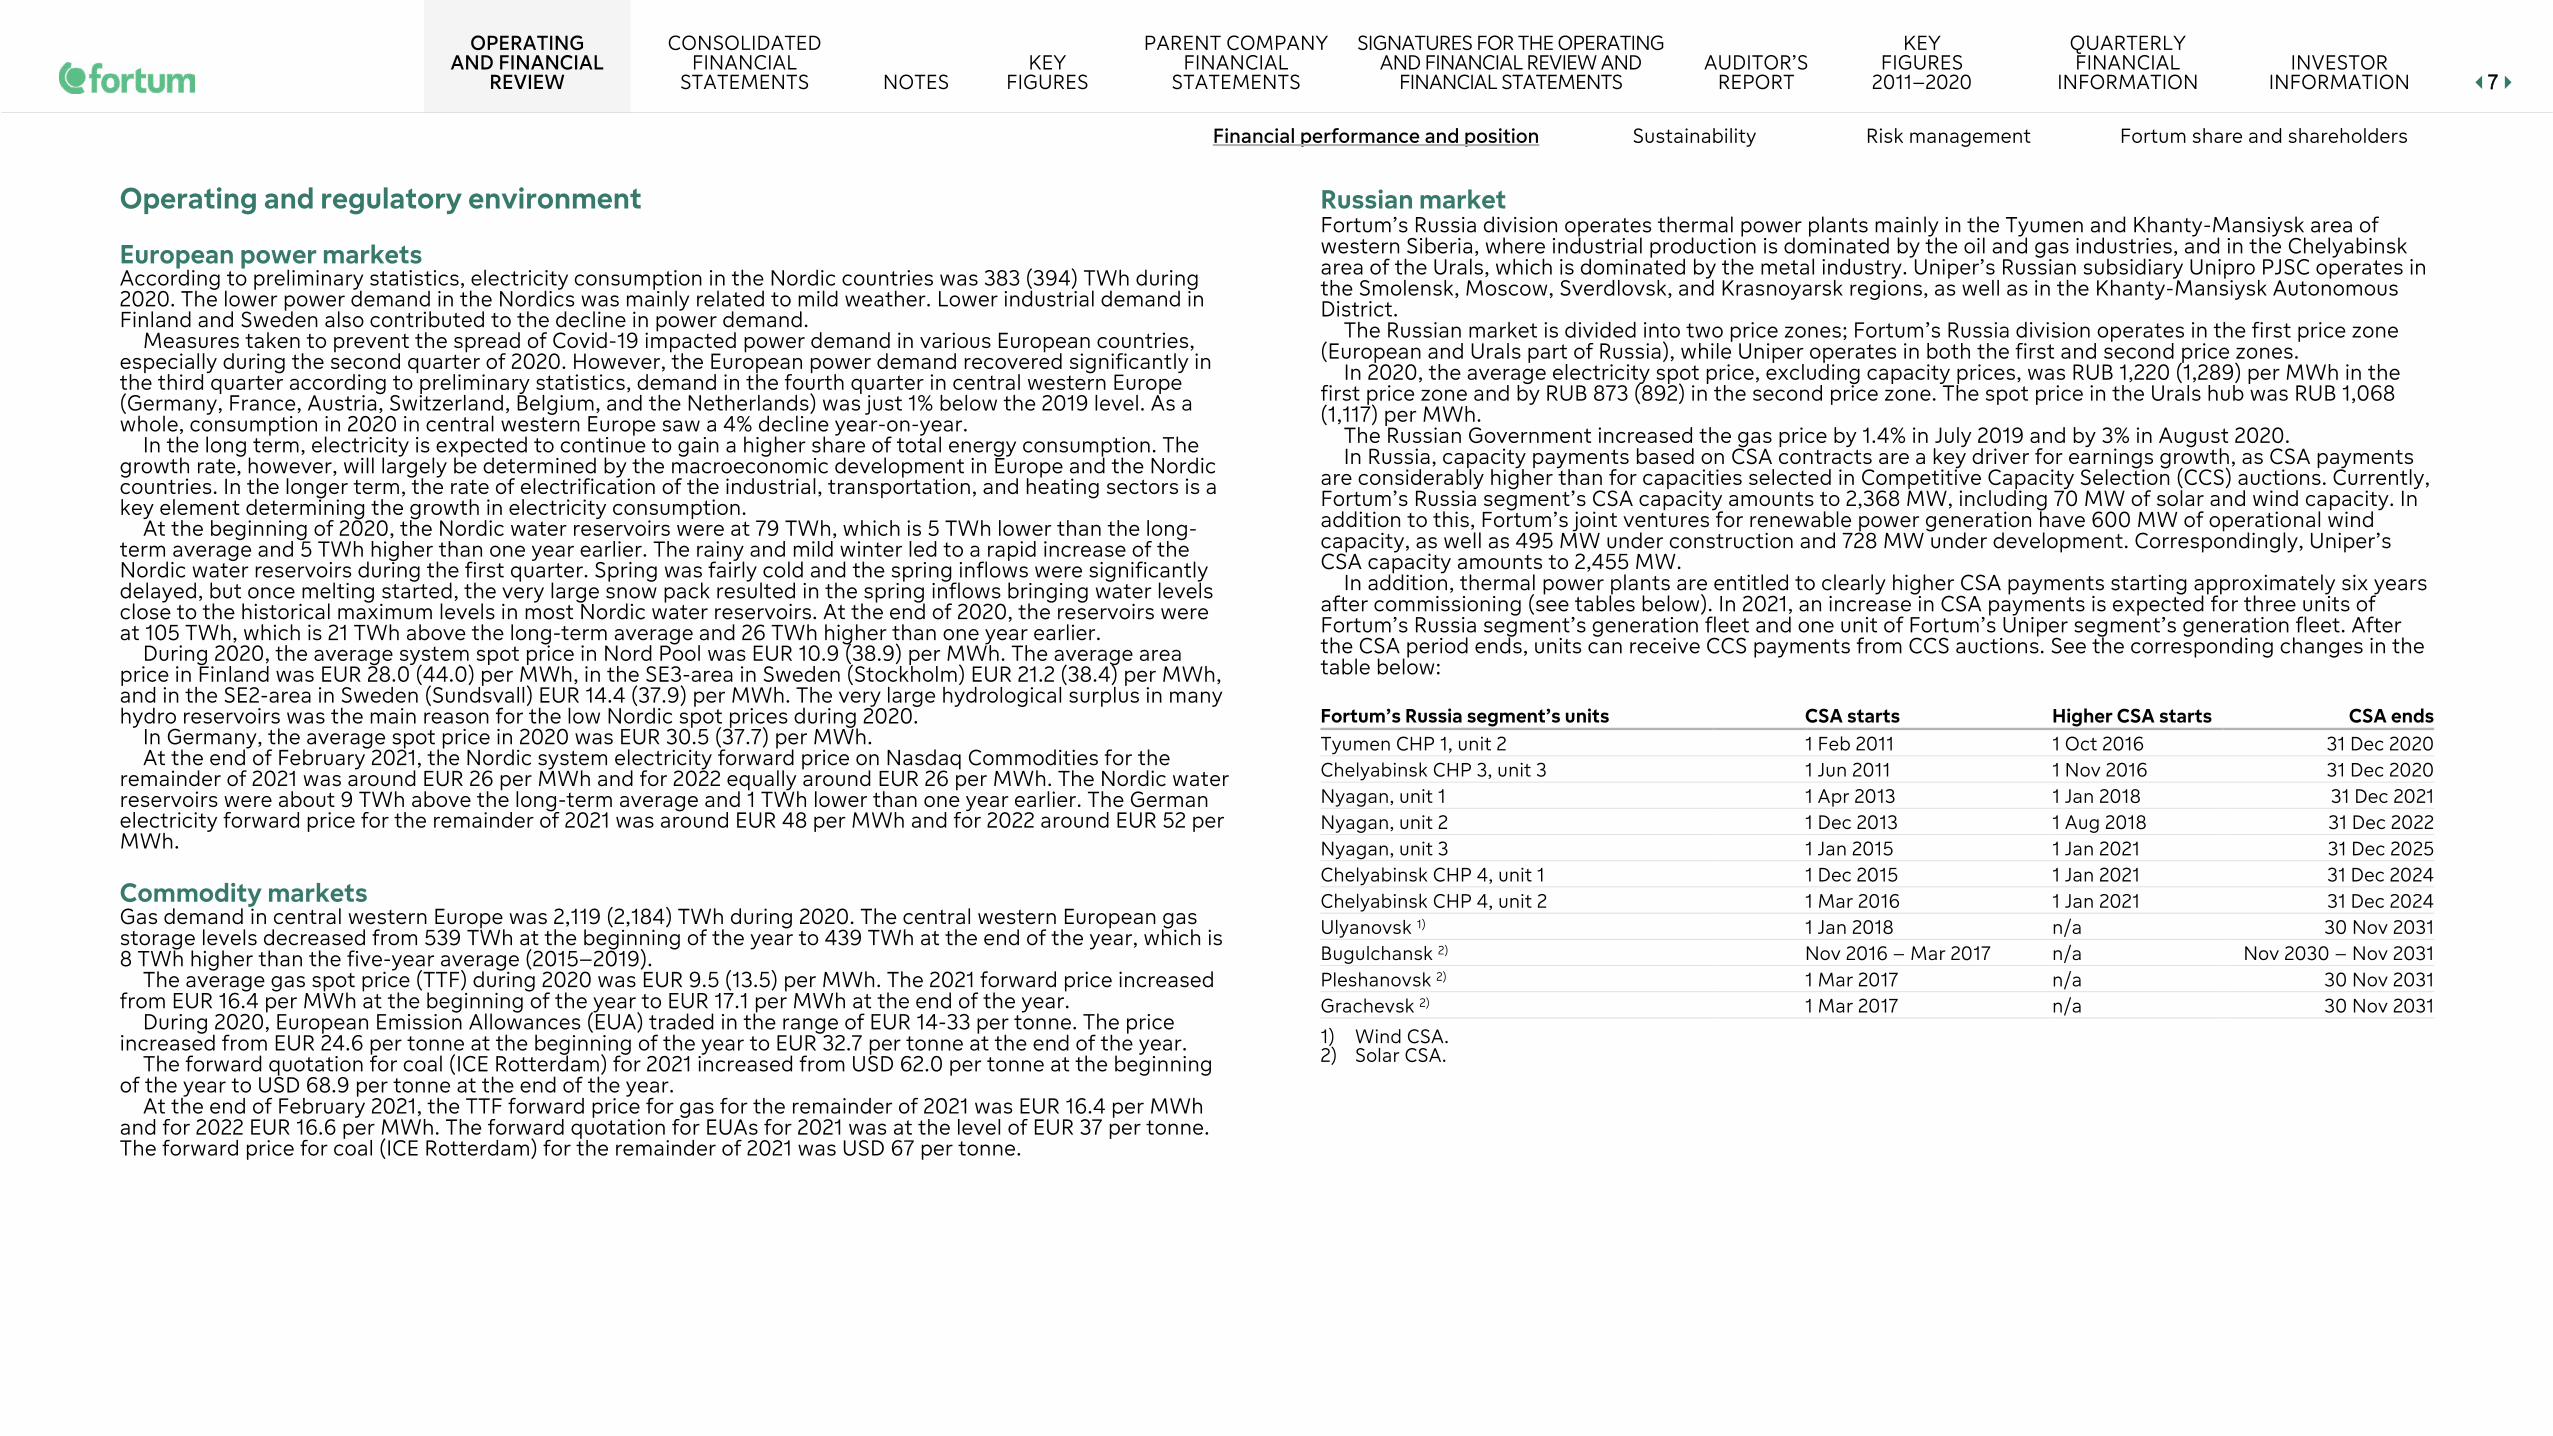
The Russian Government increased the gas price by 1.4% in July 2019 and by 3% in August 2020. In Russia, capacity payments based on CSA contracts are a key driver for earnings growth, as CSA payments
are considerably higher than for capacities selected in Competitive Capacity Selection (CCS) auctions. Currently, Fortum’s Russia segment’s CSA capacity amounts to 2,368 MW, including 70 MW of solar and wind capacity. In addition to this, Fortum’s joint ventures for renewable power generation have 600 MW of operational wind capacity, as well as 495 MW under construction and 728 MW under development. Correspondingly, Uniper’s CSA capacity amounts to 2,455 MW.
In addition, thermal power plants are entitled to clearly higher CSA payments starting approximately six years after commissioning (see tables below). In 2021, an increase in CSA payments is expected for three units of Fortum’s Russia segment’s generation fleet and one unit of Fortum’s Uniper segment’s generation fleet. After the CSA period ends, units can receive CCS payments from CCS auctions. See the corresponding changes in the table below: Fortum’s Russia segment’s units CSA starts Higher CSA starts CSA ends Tyumen CHP 1, unit 2 1 Feb 2011 1 Oct 2016 31 Dec 2020 Chelyabinsk CHP 3, unit 3 1 Jun 2011 1 Nov 2016 31 Dec 2020 Nyagan, unit 1 1 Apr 2013 1 Jan 2018 31 Dec 2021 Nyagan, unit 2 1 Dec 2013 1 Aug 2018 31 Dec 2022 Nyagan, unit 3 1 Jan 2015 1 Jan 2021 31 Dec 2025 Chelyabinsk CHP 4, unit 1 1 Dec 2015 1 Jan 2021 31 Dec 2024 Chelyabinsk CHP 4, unit 2 1 Mar 2016 1 Jan 2021 31 Dec 2024 Ulyanovsk 1) 1 Jan 2018 n/a 30 Nov 2031 Bugulchansk 2) Nov 2016 – Mar 2017 n/a Nov 2030 – Nov 2031 Pleshanovsk 2) 1 Mar 2017 n/a 30 Nov 2031 Grachevsk 2) 1 Mar 2017 n/a 30 Nov 2031 Wind CSA. Solar CSA. 1) Wind CSA. 2) Solar CSA.

OPERATING AND FINANCIAL
REVIEW
CONSOLIDATED FINANCIAL
STATEMENTS NOTES KEY
FIGURES
PARENT COMPANY FINANCIAL
STATEMENTS
SIGNATURES FOR THE OPERATING AND FINANCIAL REVIEW AND
FINANCIAL STATEMENTS AUDITOR’S
REPORT
KEY FIGURES
2011–2020
QUARTERLY FINANCIAL
INFORMATION INVESTOR
INFORMATION 88
Financial performance and position Sustainability Risk management Fortum share and shareholders
Fortum’s Uniper segment’s units CSA starts Higher CSA starts CSA ends Surgutskaya-2 GRES-2, unit 7 1 May 2011 1 May 2017 31 Jul 2021 Surgutskaya-2 GRES-2, unit 8 1 Jun 2011 1 Jun 2017 31 Aug 2021 Shaturskaya GRES, unit 7 1 Oct 2010 1 Oct 2016 31 Dec 2020 Yaivinskaya GRES, unit 5 1 Jan 2011 1 Jan 2017 31 Dec 2020 Berezovskaya GRES, unit 3 1) 1 Nov 2014 1 Nov 2020 31 Oct 2024 Surgutskaya-2 GRES-2, unit 1 2) Mar 2022 n/a Feb 2038 Surgutskaya-2 GRES-2, unit 2 2) Dec 2026 n/a Nov 2042 Surgutskaya-2 GRES-2, unit 4 2) Dec 2025 n/a Nov 2041 Surgutskaya-2 GRES-2, unit 6 2) Sep 2024 n/a Aug 2042
1) Currently under repair and not receiving CSA payments. 2) Modernisation CSA.
Fortum’s Russia division’s generation capacity not receiving CSA payments, totalling 2,560 MW, is allowed to participate in the annual CCS auctions. Uniper’s generation capacities allowed to participate in the CCS auction totalled 8,790 MW. The next CCS auction, for the year 2027, is expected to be held in November 2021. Year 2019 2020 2021 2022 2023 2024 2025 2026 CCS auction price, tRUB/MW/month, first price zone 1) 110 115 134 168 171 182 193 195 CCS auction price, tRUB/MW/month, second price zone 1) 190 191 225 264 267 279 303 299 Fortum’s Russia segment
Selected in CCS auction, MW, first price zone 2,365 2,331 2,848 3,451 3,904 3,904 4,351 4,852 Fortum’s Uniper segment
Selected in CCS auction, MW, first price zone 7,190 7,190 8,829 8,035 8,035 7,225 6,427 6,326 Selected in CCS auction, MW, second price zone 1,600 1,600 1,600 1,600 1,600 2,400 2,400 2,400
1) Excluding inflation
In June 2019, Fortum won the right to build 5.6 MW of solar capacity in a CSA auction, in addition to the 110 MW won in June 2018. The power plants will receive a guaranteed CSA price for a period of 15 years, corresponding to approximately RUB 14,000 per MWh and RUB 15,000 per MWh, respectively. These plants are to be commissioned during 2021-2022.
In June 2018, the Fortum-Rusnano wind investment fund won the right to build 823 MW of wind capacity in a CSA auction. The wind parks were to be commissioned during 2019-2023 and will receive a guaranteed CSA price corresponding to approximately RUB 7,000-8,000 per MWh for a period of 15 years.
In June 2017, the Fortum-Rusnano wind investment fund won the right to build 1,000 MW of wind capacity in a CSA auction. The wind parks were to be commissioned during 2018-2022 and will receive a guaranteed CSA price corresponding to approximately RUB 7,000-9,000 per MWh for a period of 15 years.
Power consumption TWh 2020 2019 2018 Nordic countries 383 392 399 Russia 1,033 1,059 1,055 Tyumen 86 94 92 Chelyabinsk 36 35 35 Russia Urals area 246 260 260 Russia Siberia area 1) 209 211 -
1) Reported from 2019 onwards.
Average prices 2020 2019 2018 Spot price for power in Nord Pool power exchange, EUR/MWh 10.9 38.9 44.0 Spot price for power in Finland, EUR/MWh 28.0 44.0 46.8 Spot price for power in Sweden, SE3, Stockholm, EUR/MWh 21.2 38.4 44.5 Spot price for power in Sweden, SE2, Sundsvall, EUR/MWh 14.4 37.9 44.2 Spot price for power in the First Price Zone of Russia, RUB/MWh 1) 1,220 1,289 1,247 Spot price for power in the Second Price Zone of Russia, RUB/MWh 1) 4) 873 892 - Average capacity price for the Russia segment, tRUB/MW/month 608 624 609 Average capacity price for the Uniper segment, tRUB/MW/month 261 - - Spot price for power in Germany, EUR/MWh 30.4 37.7 44.5 Average regulated gas price in Urals region, RUB/1,000 m3 3,977 3,910 3,801 Average capacity price for the Russia segment's CCS, tRUB/MW/month 2) 3) 156 154 148 Average capacity price for the Russia segment's CSA, tRUB/MW/month 3) 1,058 1,096 1,075 Average capacity price for the Uniper segment's CCS, tRUB/MW/month 2) 3) 136 - - Average capacity price for the Uniper segment's CSA, tRUB/MW/month 3) 951 - - Spot price for power (market price), Urals hub, RUB/MWh 1) 1,068 1,117 1,043 CO2, (ETS EUA), EUR/tonne CO2 25 25 16 Coal (ICE Rotterdam), USD/tonne 50 61 92 Oil (Brent Crude), USD/bbl 43 64 72
1) Excluding capacity tariff. 2) Including capacity receiving payments under "forced mode status", regulated tariffs, and bilateral agreements. 3) Capacity prices paid for the capacity volumes, excluding unplanned outages, repairs, and own consumption. 4) Reported from 2019 onwards.

OPERATING AND FINANCIAL
REVIEW
CONSOLIDATED FINANCIAL
STATEMENTS NOTES KEY
FIGURES
PARENT COMPANY FINANCIAL
STATEMENTS
SIGNATURES FOR THE OPERATING AND FINANCIAL REVIEW AND
FINANCIAL STATEMENTS AUDITOR’S
REPORT
KEY FIGURES
2011–2020
QUARTERLY FINANCIAL
INFORMATION INVESTOR
INFORMATION 99
Financial performance and position Sustainability Risk management Fortum share and shareholders
Water reservoirs TWh 31 Dec 2020 31 Dec 2019 31 Dec 2018 Nordic water reservoirs level 105 79 74 Nordic water reservoirs level, long-term average 84 84 83
Export/import TWh (+ = import to, - = export from Nordic area) 2020 2019 2018 Export/import between Nordic area and Continental Europe+Baltics -24 -8 -10 Export/import between Nordic area and Russia 3 8 8 Export/import Nordic area, total -21 - -2
Regulatory environment
EU legislation under preparation to implement the revised 2030 climate target On 11 December, the European Council adopted conclusions on the new 2030 climate target. The Council’s decision is in line with the Commission’s original proposal to reduce greenhouse gas emissions by at least 55% by 2030 compared to 1990 level, increasing the ambition level from the current reduction target of 40%.
The new target is expected to be officially approved as part of the adoption of the European Climate Law during the first quarter of 2021 in the negotiations between the Council, the Parliament, and the Commission. The Parliament has called for a 60% emission reduction target.
Legislative proposals to implement the new target are under preparation and expected to be published in mid-2021. Revisions will be made e.g. to the directives on Emissions Trading, Renewable Energy, and Energy Efficiency. In early 2021, public consultations on the various legislative files were carried out, and Fortum has responded to all of them. The Commission is also working on extensive impact assessments for each legislative file.
The key issue that will potentially have a large effect on the ETS and carbon price is the allocation of the new target between the ETS and non-ETS sectors. In Fortum’s view, the ETS sector should take the main responsibility for the more ambitious target.
EU Commission’s delegated act on EU taxonomy regulation delayed The consultation on the Commission’s draft delegated act on climate adaptation and mitigation ended in December, with an unprecedented bulk of 46,000 responses. The act has turned even more technology-oriented than expected, raising challenges for essential power technologies such as hydro, nuclear, natural gas, and also hydrogen. The proposed criteria are of significant concern for the largely CO2-free Nordic power generation, as hydro and nuclear might not be taxonomy-aligned.
Based on a coalition of like-minded companies and associations, Fortum has placed significant pressure on the Commission to review the delegated act to comply with the principle of technology neutrality and EU sectorial legislation.
According to the EU taxonomy regulation, the final climate change delegated acts should have been adopted by the end of 2020, but the adoption is now due during the second half of April 2021. The separate environmental assessment of nuclear should be finalised mid of this year and supporting member states stressed the need to include nuclear in the second wave of delegated acts due for adoption by year end.
Fortum firmly supports the objective of transitioning the European economy towards carbon neutrality by mid-century. However, we caution against arbitrarily ruling out 40% of European net electricity generation and two thirds of European CO2-free electricity generation by excluding hydro and nuclear from taxonomy-aligned operations.
Nordic water reservoirs, energy content, TWh
Source: Nord Pool
0
20
40
60
80
100
120
Q1 Q2 Q3 Q4
2000 2003 2019 2020 Average 2000–2018
1

OPERATING AND FINANCIAL
REVIEW
CONSOLIDATED FINANCIAL
STATEMENTS NOTES KEY
FIGURES
PARENT COMPANY FINANCIAL
STATEMENTS
SIGNATURES FOR THE OPERATING AND FINANCIAL REVIEW AND
FINANCIAL STATEMENTS AUDITOR’S
REPORT
KEY FIGURES
2011–2020
QUARTERLY FINANCIAL
INFORMATION INVESTOR
INFORMATION 1100
Financial performance and position Sustainability Risk management Fortum share and shareholders
Last minute Brexit deal secured On 24 December, the EU and the UK agreed on a broad trade and cooperation agreement only one week before the end of the Brexit transition period. The agreement provisionally entered into force on 1 January, and the ratification process is to be concluded during the first quarter of 2021.
The scope of the agreement is more limited compared to the EU internal market, but it goes beyond several other EU trade agreements. Provisions in the Energy Chapter aim to enable energy trading and investments between the parties as well as to support security of supply and ecological sustainability. The terminology and definitions are aligned with the EU legislation. The UK will maintain its earlier commitment to the energy and climate targets.
From the beginning of 2021, the UK needs to establish its own carbon pricing system covering emissions from energy production, industry, and air traffic. The aim is to assess the possibilities to link the UK trading system to the EU ETS while maintaining the integrity of both systems.
Most importantly a hard Brexit was avoided and there is a deal, but Fortum regrets losing a firm supporter of the strong climate policy and the free market. No major changes in the energy market are envisaged but the linkage of the UK to the EU ETS is still open.
Segment reviews
Business model Fortum is a European energy company with activities in more than 40 countries. We provide our customers with electricity, gas, heating and cooling as well as smart solutions to improve resource efficiency. Together with our subsidiary Uniper, we are the third largest producer of CO2-free electricity in Europe. Fortum is the largest electricity retailer in the Nordic countries and one of the leading heat producers globally.
Fortum’s organisation consists of four business divisions: Generation, Russia, City Solutions, and Consumer Solutions, and additionally Uniper as a segment. Fortum employs a diverse team of almost 20,000 energy-sector professionals.
Generation Generation is responsible for Nordic power generation. The division comprises nuclear, hydro, wind, and thermal power generation, as well as power portfolio optimisation, trading, industrial intelligence, and global nuclear services. The segment does not include the Nordic hydro and nuclear power generation or the trading activities of Uniper. As of 31 March 2020, the segment includes Generation’s proportionate share of OKG ( Note 1).
EUR million 2020 2019 Change
20/19 Sales 2,006 2,141 -6%
- power sales 1,878 2,006 -6% of which Nordic power sales 1) 1,478 1,568 -6%
- other sales 128 135 -5% Comparable EBITDA 886 939 -6% Comparable operating profit 722 794 -9% Operating profit 711 780 -9% Share of profits of associates and joint ventures 2) 29 10 188% Comparable net assets (at period-end) 6,234 6,019 4% Comparable return on net assets, % 11.8 13.3 -11% Capital expenditure and gross investments in shares 228 260 -12% Number of employees 1,143 1,109 3%
1) The Nordic power sales income and volume includes hydro and nuclear generation, excluding minorities. It does not include thermal generation, minorities, customer business or other purchases.
2) Power plants are often built jointly with other power producers, and owners purchase electricity at cost including interest cost and production taxes. The share of profit/loss is mainly IFRS adjustments (e.g. accounting for nuclear-related assets and liabilities) and depreciations on fair-value adjustments from historical acquisitions ( Note 18).
The Generation segment’s total power generation in the Nordic countries decreased, mainly due to longer planned and some unplanned nuclear outages, the effect of which was almost offset by clearly higher hydro volumes. The CO2 free generation accounted for 100% (99%) of the total power generation.
The achieved power price in the Generation segment decreased by EUR 2.0 per MWh, down 5%. Supported by the fairly high hedge price and hedge level, the decline was minor compared to the 44% drop in spot power prices in Fortum’s power generation areas.
Comparable operating profit decreased by 9%. The negative impact of the lower achieved power price and lower nuclear volumes was partly offset by the higher hydro volumes. Hydro volumes were somewhat above the long term average annual level. Comparable operating profit was also positively affected by EUR 15 million, due to the consolidation of the Generation segment’s proportionate share of OKG ( Note 1).
Operating profit was affected by EUR -11 (14) million of items affecting comparability (see ‘Changes in reporting’ and Note 6).
The share of profits of associates and joint ventures totalled EUR 29 (10) million ( Note 18). The Swedish hydropower real-estate tax decreased from 1.0% to 0.5% in January 2020. In 2019, the tax amounted to EUR 40 million and in 2020 it was EUR 25 million.

OPERATING AND FINANCIAL
REVIEW
CONSOLIDATED FINANCIAL
STATEMENTS NOTES KEY
FIGURES
PARENT COMPANY FINANCIAL
STATEMENTS
SIGNATURES FOR THE OPERATING AND FINANCIAL REVIEW AND
FINANCIAL STATEMENTS AUDITOR’S
REPORT
KEY FIGURES
2011–2020
QUARTERLY FINANCIAL
INFORMATION INVESTOR
INFORMATION 1111
Financial performance and position Sustainability Risk management Fortum share and shareholders
Power generation by source
TWh 2020 2019 Change
20/19 Hydropower, Nordic 22.4 20.3 10% Nuclear power, Nordic 21.0 23.5 -11% Wind power, Nordic 0.4 0.4 0% Thermal power, Nordic 0.1 0.2 -58% Total 43.9 44.4 -1%
Nordic sales volume
TWh 2020 2019 Change
20/19 Nordic sales volume 51.4 51.3 0% of which Nordic Power sales volume 1) 42.5 42.7 0%
1) The Nordic power sales income and volume includes hydro and nuclear generation, excluding minorities. It does not include thermal generation, minorities, customer business or other purchases.
Sales price
EUR/MWh 2020 2019 Change
20/19 Generation's Nordic power price 1) 34.8 36.8 -5%
1) Generation’s Nordic power price includes hydro and nuclear generation, excluding minorities. It does not include thermal generation, minorities, customer business or other purchases.
Russia The Russia segment comprises power and heat generation and sales in Russia. The segment also includes Fortum’s joint ventures for building and operating approximately 2 GW of renewable power generation and for power and heat sales, as well as Fortum’s more than 29% holding in TGC 1. These joint ventures and associated company are accounted for using the equity method. The segment does not include Uniper’s Russian subsidiary Unipro.
EUR million 2020 2019 Change
20/19 Sales 929 1,071 -13% - power sales 791 924 -14% - heat sales 134 145 -8% - other sales 4 2 108% Comparable EBITDA 394 469 -16% Comparable operating profit 251 316 -21% Operating profit 252 317 -21% Share of profits of associates and joint ventures 47 59 -21% Comparable net assets (at period-end) 2,431 3,212 -24% Comparable return on net assets, % 11.1 12.3 -10% Capital expenditure and gross investments in shares 91 133 -32% Number of employees 2,935 2,955 -1% Power generation volumes declined by 8% and heat production volumes declined by 5%. The load factor was among the highest in the Russian Federation according to market data published by the Wholesale Market Trading Administrator. Reduced oil production and lower overall economic activity following the OPEC+ decisions and Covid-19 restrictions had an adverse effect on power demand especially in the first nine months of the year. Heat production volumes were negatively affected especially by the warmer weather in the Chelyabinsk and Tyumen areas during the first three quarters.
Sales decreased by 13%, EUR 142 million, due to the weaker Russian rouble and lower power prices and volumes. The effect of the change in the Russian rouble exchange rate was EUR -127 million.
Comparable operating profit decreased by 21%, EUR 65 million, mainly due to the weaker Russian rouble, lower power margins and volumes, as well as lower CSA payments, partly offset by higher heat tariffs. To counter the effects of Covid-19 focus was put on cost efficiency and securing good availability. The effect of the change in the Russian rouble exchange rate was EUR -34 million. The decline in CSA payments is a consequence of the lower Government bond yields.
The share of profits of associates and joint ventures totalled EUR 47 (59) million, including the lower share of profits of EUR 24 (54) million from TGC-1 and the share of profits EUR 18 (2) million from the joint ventures for renewables power generation ( Note 18).
Nord Pool, power price, 2016–2020, EUR/MWh
Source: Nord Pool, Fortum
0
20
40
60
80
2016 2017 2018 2019 2020
Fortum achieved Spot average Spot price
1

OPERATING AND FINANCIAL
REVIEW
CONSOLIDATED FINANCIAL
STATEMENTS NOTES KEY
FIGURES
PARENT COMPANY FINANCIAL
STATEMENTS
SIGNATURES FOR THE OPERATING AND FINANCIAL REVIEW AND
FINANCIAL STATEMENTS AUDITOR’S
REPORT
KEY FIGURES
2011–2020
QUARTERLY FINANCIAL
INFORMATION INVESTOR
INFORMATION 1122
Financial performance and position Sustainability Risk management Fortum share and shareholders
Key electricity, capacity and gas prices for Fortum Russia
2020 2019 Change
20/19 Electricity spot price (market price), Urals hub, RUB/MWh 1,068 1,117 -4% Average regulated gas price, Urals region, RUB/1,000 m3 3,977 3,910 2% Average capacity price for CCS and other, tRUB/MW/month 1) 2) 156 154 1% Average capacity price for CSA, tRUB/MW/month 2) 1,058 1,096 -3% Average capacity price, tRUB/MW/month 608 624 -3% Achieved power price for the Russia segment, RUB/MWh 1,940 1,990 -3% Achieved power price for the Russia segment, EUR/MWh 3) 23.4 27.3 -14%
1) Including capacity receiving payments under "forced mode status", regulated tariffs, and bilateral agreements. 2) Capacity prices paid for the capacity volumes, excluding unplanned outages, repairs, and own consumption. 3) Translated using the average exchange rate.
Russian power generation and heat production
TWh 2020 2019 Change
20/19 Russian power generation 27.1 29.3 -8% Russian heat production 16.4 17.3 -5%
City Solutions City Solutions is responsible for sustainable solutions for urban areas. The segment comprises heating, cooling, waste-to-energy, and other circular economy solutions, as well as solar power generation, services, and development of new biomass-based businesses. The business operations are located in the Nordics, the Baltic countries, Poland, and India. The segment also includes Fortum’s 50% holding in Stockholm Exergi, which is a joint venture and is accounted for using the equity method. The segment does not include the operations of Fortum’s subsidiary Uniper.
EUR million 2020 2019 Change
20/19 Sales 1,075 1,200 -10% - heat sales 516 615 -16% - power sales 121 153 -21% - waste treatment sales 1) 252 250 1% - other sales 2) 186 181 3% Comparable EBITDA 239 308 -22% Comparable operating profit 47 120 -61% Operating profit 775 127 510% Share of profits of associates and joint ventures 57 37 54% Comparable net assets (at period-end) 3,679 3,945 -7% Comparable return on net assets, % 2.8 4.6 -39% Capital expenditure and gross investments in shares 333 323 3% Number of employees 2,093 1,970 6%
1) Waste treatment sales comprise gate fees at waste treatment plants and environmental construction services. 2) Other sales comprise mainly operation and maintenance services and fuel sales.
Heat sales volumes decreased by 11% as temperatures were clearly higher than normal throughout the year, especially in the first quarter of 2020. The decline in the power sales volumes and part of the lower heat sales volumes were related to the divestments of the Joensuu and Järvenpää district heating businesses.
Comparable operating profit decreased by 61%. The main reasons for the clearly weaker profitability were lower heat sales volumes, lower power prices, and lower Norwegian heat prices, as well as weaker performance in the recycling and waste business. In Norway, the district heat pricing is linked to the power price development, which in this market environment had in a clear negative impact on the heat prices. Furthermore, the results declined due to positive one-time items of EUR 16 million in the Finnish district heating business in the fourth quarter of 2019. In addition, the results were negatively impacted by structural changes, the most significant of these being the divestments of the Joensuu and Järvenpää district heating businesses with a EUR 14 million impact. The Pavagada 2 solar park, commissioned in August 2019, contributed positively to the result. The Covid-19 pandemic had adverse effects mainly on the recycling and waste business, negatively affecting the results of City Solutions.
Operating profit was affected by EUR 728 (7) million of items affecting comparability, mainly the tax-exempt capital gains of EUR 431 million and EUR 291 million, respectively, from the divestments of the Joensuu and Järvenpää district heating businesses ( Note 6).
The share of profits of associates and joint ventures totalled EUR 57 (37) million ( Note 18), EUR 46 (24) million of which is related to the share of profit of Stockholm Exergi.

OPERATING AND FINANCIAL
REVIEW
CONSOLIDATED FINANCIAL
STATEMENTS NOTES KEY
FIGURES
PARENT COMPANY FINANCIAL
STATEMENTS
SIGNATURES FOR THE OPERATING AND FINANCIAL REVIEW AND
FINANCIAL STATEMENTS AUDITOR’S
REPORT
KEY FIGURES
2011–2020
QUARTERLY FINANCIAL
INFORMATION INVESTOR
INFORMATION 1133
Financial performance and position Sustainability Risk management Fortum share and shareholders
The cost synergies from integrating Fortum Oslo Varme’s business operations materialised gradually starting in 2019, and annual synergies in line with the target level of EUR 5-10 million were achieved by the end of 2020.
On 20 December 2019, Fortum signed an agreement to sell its district heating business in Joensuu, Finland, to Savon Voima Oyj. The total consideration on a debt- and cash-free basis was approximately EUR 530 million, and the cash was received at the completion of the divestment on 10 January 2020. Fortum recorded a tax-exempt capital gain of EUR 431 million in the City Solutions segment’s first-quarter 2020 results.
On 3 July 2020, Fortum announced it had agreed to sell the district heating business in Järvenpää, Finland for approximately EUR 375 million. In August, Fortum closed the transaction and recorded a tax-exempt capital gain of EUR 291 million in the City Solutions segment’s third-quarter 2020 results.
Heat sales by country
TWh 2020 2019 Change
20/19 Finland 2.9 3.8 -23% Poland 3.4 3.3 3% Norway 1.5 1.7 -13% Other countries 1.9 2.0 -5% Total 9.6 10.8 -11%
Power sales by country
TWh 2020 2019 Change
20/19 Finland 1.0 1.6 -38% Poland 0.6 0.6 0% Other countries 1.4 1.0 40% Total 3.0 3.2 -6%
Consumer Solutions Consumer Solutions is responsible for the electricity and gas retail businesses in the Nordics, Poland, and Spain, including the customer service and invoicing businesses. Fortum is the largest electricity retail business in the Nordics, with approximately 2.4 million customers across different brands in Finland, Sweden, Norway, Poland, and Spain. The business provides electricity as well as related value-added and digital services.
EUR million 2020 2019 Change
20/19 Sales 1,267 1,835 -31% - power sales 1,057 1,630 -35% - gas sales 139 132 6% - other sales 70 73 -4% Comparable EBITDA 153 141 9% Comparable operating profit 90 79 14% Operating profit 129 20 545% Comparable net assets (at period-end) 565 637 -11% Capital expenditure and gross investments in shares 57 55 4% Number of employees 1,048 1,327 -21% The electricity sales volumes decreased by 5%, mainly due to warmer weather in the Nordics in the first quarter. Total sales revenue decreased by 31%. The gas volume increased by 20%, mainly due to an increase of enterprise customers in Poland. The Covid-19 pandemic has increased market uncertainty especially in the small and medium-sized enterprises’ sector; so far, however, no major negative implications on the business, such as credit losses, have materialised. Despite these uncertainties, Consumer Solutions’ competitiveness continued to strengthen, and the customer recommendation and employee engagement indices remained at all-time high levels.
Comparable operating profit continued to improve and increased by 14%, mainly driven by higher margins from value-added services and higher sales margins. The higher margins are a result of active development of the service offering following the Hafslund integration and subsequent development of the business.
Operating profit was affected by EUR 39 (-59) million of items affecting comparability, due to the fair value change of non-hedge-accounted derivatives ( Note 6).
Consumer Solutions offers various services enabling our customers to reduce their carbon footprint. Positive progress has been achieved among all measured sustainability categories during 2020, with increased CO2-free electricity volumes as the main contributor.

OPERATING AND FINANCIAL
REVIEW
CONSOLIDATED FINANCIAL
STATEMENTS NOTES KEY
FIGURES
PARENT COMPANY FINANCIAL
STATEMENTS
SIGNATURES FOR THE OPERATING AND FINANCIAL REVIEW AND
FINANCIAL STATEMENTS AUDITOR’S
REPORT
KEY FIGURES
2011–2020
QUARTERLY FINANCIAL
INFORMATION INVESTOR
INFORMATION 1144
Financial performance and position Sustainability Risk management Fortum share and shareholders
Sales volumes
TWh 2020 2019 Change
20/19 Electricity 29.1 30.6 -5% Gas 1) 4.9 4.1 20%
1) Not including wholesale volumes.
Number of customers
Thousands 1) 2020 2019 Change
20/19 Electricity 2,280 2,340 -3% E-mobility 2) 60 - 100% Gas 50 40 25% Total 2,390 2,380 0%
1) Rounded to the nearest 10,000. 2) Measured as quarterly paying customers.
Uniper The Uniper segment comprises Fortum’s majority ownership in Uniper, a subsidiary of Fortum. Uniper is a leading international energy company with activities in more than 40 countries. Its business is the secure provision of energy and related services. Its main activities include power generation in Europe and Russia as well as global energy trading and optimisation, which Uniper reports in three businesses – European Generation, Global Commodities, and Russian Power Generation – in its financial statements. The segment includes Uniper’s proportionate share of OKG ( Note 1).
EUR million 2020 2019 Change
20/19 Sales 44,514 - 100% - power sales 16,994 - 100% of which Nordic power sales 1) 373 - 100% - heat sales 191 - 100% - gas sales 22,176 - 100% - other sales 5,154 - 100% Comparable EBITDA 856 - 100% Comparable operating profit 363 - 100% Operating profit 29 - 100% Share of profits of associates and joint ventures 2) 54 - 100% Comparable net assets (at period-end) 7,432 - 100% Capital expenditure and gross investments in shares 627 - 100% Number of employees 11,751 - 100%
1) The Nordic power sales income and volume includes hydro and nuclear generation, excluding minorities. It does not include thermal generation, minorities, customer business or other purchases.
During the last three quarters of 2020, the Continental European power markets were characterised by slightly lower demand, due to the Covid-19 pandemic. The European supply from renewable power generation was on a robust level with high water reservoir levels in the Nordics. This resulted in lower power prices and lower spreads in Uniper’s core markets, especially in the Nordics. However, given the optimisation and hedging activities of the power generation fleet, and an increased focus on spot, intraday, and system-services the financial impact of the lower thermal generation was offset to a large extent.
European gas prices were depressed by reduced market demand combined with relatively high storage levels and robust supply with some support from a more balanced market to the end of the year. This presented gas suppliers with the challenge of optimising the supply and sales portfolio, leading to unusual weak results for the reporting period after a strong first quarter.

OPERATING AND FINANCIAL
REVIEW
CONSOLIDATED FINANCIAL
STATEMENTS NOTES KEY
FIGURES
PARENT COMPANY FINANCIAL
STATEMENTS
SIGNATURES FOR THE OPERATING AND FINANCIAL REVIEW AND
FINANCIAL STATEMENTS AUDITOR’S
REPORT
KEY FIGURES
2011–2020
QUARTERLY FINANCIAL
INFORMATION INVESTOR
INFORMATION 1155
Financial performance and position Sustainability Risk management Fortum share and shareholders
The Russian business contributed positively to Uniper’s comparable operating profit despite lower electricity prices in the day-ahead market, due to demand decreases caused by the Covid-19 pandemic as well as reduced oil production in Russia, reduced foreign demand, the lower Russian rouble exchange rate, and a weather-related increase in supply.
Comparable operating profit amounted to EUR 363 (-) million. Operating profit was affected by EUR -333 (-) million of items affecting comparability, mainly EUR -706 (-)
million of fair value change of non-hedge-accounted derivatives, and income of EUR 376 (-) million resulting primarily from reversals of temporary reductions in current assets and adjustments of provisions ( Note 6).
The share of profits of associates and joint-ventures totalled EUR 54 (-) million ( Note 18). On 20 May 2020, Uniper held its Annual General Meeting, which approved the dividend of EUR 421 million. On 28 May 2020, Uniper and its co-shareholders decided to return the Irsching 4 and 5 gas power plants to
the market as of 1 October 2020, due to improved market prices – in particular, lower gas prices – which should make it possible to operate the highly efficient gas power plant economically.
On 30 May 2020, Uniper commissioned the Datteln 4 coal power plant. On 10 June 2020, the German Federal Government passed the national hydrogen strategy and decided on the
members of the National Hydrogen Council (Nationaler Wasserstoffrat). The CEO of Uniper, Andreas Schierenbeck, was appointed to the expert committee.
In June 2020, Uniper and General Electric signed an agreement aiming at long-term collaboration on the decarbonisation of Uniper's gas-fired power plants and natural gas storage facilities.
On 1 December 2020, Uniper announced that the German Federal Network Agency had accepted the bid from the Heyden 4 power plant as part of the first round of auctions for the closure of hard-coal-fired power plants. The commercial electricity generation at the plant ended already by the end of 2020, five years earlier than previously announced.
Power generation by source
TWh 2020 2019 Change
20/19 Hydropower, Nordics 6.8 - 100% Nuclear power, Nordics 7.6 - 100% Hydropower, Central Europe 3.3 - 100% Thermal power, Central Europe 22.1 - 100% Thermal power, Russia 28.5 - 100% Total 68.3 - 100%
Nordic sales volume
TWh 2020 2019 Change
20/19 Nordic sales volume 14.6 - 100%
of which Nordic outright power sales volume 1) 14.4 - 100%
1) The Nordic outright power sales volume includes hydro and nuclear generation. It does not include thermal generation, minorities, customer business, or other purchases.
Sales price
EUR/MWh 2020 2019 Change
20/19 Uniper's Nordic achieved power price 1) 26.0 - 100% Average capacity price for Uniper CCS and other, tRUB/MW/month 2) 3) 136 - 100% Average capacity price for Uniper CSA, tRUB/MW/month 3) 951 - 100% Average capacity price for Uniper, tRUB/MW/month 261 - 100% Achieved power price for Uniper in Russia, RUB/MWh 1,798 - 100% Achieved power price for Uniper in Russia, EUR/MWh 4) 21.7 - 100% 1) Uniper’s Nordic achieved power price includes hydro and nuclear generation. It does not include thermal generation,
minorities, customer business, or other purchases. 2) Including capacity receiving payments under "forced mode status", regulated tariffs, and bilateral agreements. 3) Capacity prices paid for the capacity volumes, excluding unplanned outages, repairs, and own consumption. 4) Translated using the average exchange rate.
Uniper is an international energy company with operations in more than 40 countries. With more than 35 GW of installed generation capacity, Uniper is among the largest global power generators. Approximately 50% of the power generating capacity is gas-based, 30% coal-based, and 20% hydro- or nuclear-based. Its main activities include power generation in Europe and Russia as well as global energy trading and optimisation, including a diversified gas portfolio that makes Uniper one of Europe’s leading gas midstream companies.
Uniper’s energy trading and optimisation business accounts for more than 90% of the Uniper Group’s sales. A substantial portion of Uniper’s sales arises from the physical assets and contract portfolio optimisation, which is accounted for on a gross basis.
The Uniper business generally follows a seasonal pattern with the first and fourth quarters being the strongest. Therefore, the result contribution in the second and third quarters is usually limited.
Fortum consolidated Uniper into its balance sheet as of 31 March 2020 and, from the second quarter, consolidated Uniper’s results into its income statement. The main reason for the change in the figures compared to the previous year is thus the consolidation of Uniper.
Uniper investment Fortum is the majority owner of Uniper with an ownership of 76.1% (as of 31 December 2020) of the shares and voting rights.
Fortum consolidated Uniper into its balance sheet as of 31 March 2020 and, from the second quarter, Fortum consolidated Uniper as a subsidiary into its income statement. The reason for the change in the figures compared to the previous year is thus the consolidation of Uniper. Fortum’s first-quarter share of Uniper’s results is reported in the share of profits of associates and joint venture of ‘Other operations’; see Changes in reporting and Note 1.
In 2017, Fortum announced a public takeover offer to buy shares in Uniper. In June 2018, the offer was settled and Fortum’s ownership was 47.35%. At the end of 2018, Fortum’s ownership in Uniper was 49.99%. The total acquisition cost for the initial 49.99% stake in Uniper, including direct costs relating to the acquisition, was EUR 3,968 million ( Note 3).
On 8 October 2019, Fortum entered into agreements with Elliott and Knight Vinke to acquire an additional stake of at least 20.5% in Uniper, increasing Fortum’s share in Uniper to more than 70% and the total investment in Uniper to approximately EUR 6.5 billion. The transaction closed in two tranches. On 26 March 2020, Fortum closed the first tranche of the transaction after receiving all necessary regulatory clearances. Fortum’s shareholding in Uniper thereby increased to 69.6%. On 8 May 2020, Fortum closed the second and final tranche, thereby increasing the ownership to 73.4%. In August 2020, Fortum increased its ownership in Uniper to more than 75%. On 31 December 2020, Fortum’s ownership in Uniper was 76.1% ( Note 3 and Note 18).

OPERATING AND FINANCIAL
REVIEW
CONSOLIDATED FINANCIAL
STATEMENTS NOTES KEY
FIGURES
PARENT COMPANY FINANCIAL
STATEMENTS
SIGNATURES FOR THE OPERATING AND FINANCIAL REVIEW AND
FINANCIAL STATEMENTS AUDITOR’S
REPORT
KEY FIGURES
2011–2020
QUARTERLY FINANCIAL
INFORMATION INVESTOR
INFORMATION 1166
Financial performance and position Sustainability Risk management Fortum share and shareholders
In April 2020, the chairman of Uniper’s Supervisory Board as well as four other board members resigned from their duties and the Düsseldorf District Court appointed five new Supervisory Board members. Fortum’s Executive Management members Sirpa-Helena Sormunen and Tiina Tuomela, as well as Klaus-Dieter Maubach, member of Fortum’s Board of Directors, joined Fortum’s current President and CEO Markus Rauramo on the Supervisory Board of Uniper. The Supervisory Board elected Mr. Maubach as the new chairman of Uniper’s Supervisory Board.
In March 2021, amendments to the Russian Strategic Investment Law were approved. According to these amendments Fortum is able to exercise direct control in Uniper’s Russian subsidiary Unipro PJSC. However, a customary merger control approval from the Russian Federal Antimonopoly Service under the Competition Law is still required.
For further information, see Uniper’s full year 2020 results published on 4 March 2021.
Capital expenditures, divestments and investments in shares
EUR million 2020 2019 Capital expenditure Intangible assets 124 75 Property, plant and equipment 1,010 638 Total 1,135 713 Gross investments in shares Subsidiaries 3,646 13 Associated companies and joint ventures 119 73 Other investments 42 20 Total 3,807 106 In 2020, capital expenditures and investments in shares totalled EUR 4,941 (819) million. Capital expenditures were EUR 1,135 (713) million ( Note 3 and Note 6).
Fortum expects to start, or has started, power and heat production capacity of new power plants and expects to upgrade its existing plants as follows:
Type
Electricity capacity
MW
Heat capacity
MW Supply starts/ started Generation Sørfjord, Norway 1) Wind 99 26 October 2020 Russia Solar 2) Solar 116 2021-2022 City Solutions Kivenlahti, Finland Bio HOB 3) 58 May 2020 Suomenoja, Finland Heat pump 20 2021 Rajasthan, India Solar 250 Q2/2021 Uniper Datteln IV, Germany Coal 1,052 380 30 May 2020 Berezovskaya 3, Russia Lignite 754 Q1-Q2/2021 Irsching 6, Germany Gas 300 October 2022 Scholven, Germany Gas 137 125 Q4/2022 Killingholme and Grain, UK Grid stability Q4/2021 and Q1/2022 Surgutskaya 1, Russia Gas 20 Q1/2022 Surgutskaya 4, Russia Gas 20 Q4/2025 Surgutskaya 6, Russia Gas 20 Q3/2024
1) The Sørfjord wind park is part of the transaction with Credit Suisse Energy Infrastructure Partners and the sale of an 80% took place in January 2021.
2) On 2 March 2021, Fortum announced it has decided to construct the solar power plant through a joint venture recently established with RDIF.
3) Biofuel-fired heat-only boiler (HOB).
Generation In December 2020, Fortum decided to sell eight small hydropower plants in Sweden with an average annual power generation of 0.1 TWh to Downing Renewables & Infrastructure Trust plc. The power plants are mainly run-off river plants and not essential to Fortum’s strategic focus due to their small size and limited flexibility. The total purchase price on a debt- and cash-free basis was EUR 64.5 million. The transaction was closed on 2 February 2021.
In December 2019, Fortum and Energy Infrastructure Partners AG (EIP, formerly Credit Suisse Energy Infrastructure Partners) signed an agreement whereby funds advised by EIP would acquire an 80% stake in Fortum’s Nordic wind portfolio. Fortum retained a 20% minority ownership in this wind power portfolio and will continue to manage the construction and serve as the long-term asset manager for the wind portfolio. The transaction was closed on 14 May 2020 ( Note 3). The Sørfjord wind park, commissioned on 26 October 2020, is part of the transaction with EIP and the sale of an 80% share took place in January 2021.
Russia Together with its joint ventures in Russia, Fortum holds the largest portfolio of wind and solar power parks and projects in Russia, almost 2 GW. Once operational, the wind and solar parks receive a guaranteed CSA price for a period of 15 years.

OPERATING AND FINANCIAL
REVIEW
CONSOLIDATED FINANCIAL
STATEMENTS NOTES KEY
FIGURES
PARENT COMPANY FINANCIAL
STATEMENTS
SIGNATURES FOR THE OPERATING AND FINANCIAL REVIEW AND
FINANCIAL STATEMENTS AUDITOR’S
REPORT
KEY FIGURES
2011–2020
QUARTERLY FINANCIAL
INFORMATION INVESTOR
INFORMATION 1177
Financial performance and position Sustainability Risk management Fortum share and shareholders
In 2017 and 2018, the Fortum-Rusnano wind investment fund (joint venture, Fortum's ownership 50%) won the right to build a total of 1,823 MW of wind capacity in CSA auctions. 600 MW of the wind capacity is operational, 495 MW under construction, and 728 MW under development. In 2020, 550 MW of new wind capacity, including four wind power plants in the Rostov region (Kamenskaya, Sulinskaya, Gukovo and Kazachiya) and two in the Kalmykia region (Salynskaya and Tselinskaya) started operations. During the second half of 2020, the Fortum-Rusnano wind investment fund sold the 50-MW Ulyanovsk 2 and the 300-MW Rostov wind farms to a joint venture recently established with the Russian Direct Investment Fund (RDIF) aimed at the operation of renewable power plants in Russia.
In 2018 and 2019, Fortum won the right to build a total of 116 MW of solar capacity in CSA auctions. On 2 March 2021, Fortum announced it has decided to construct the solar power plant through a joint venture recently established with RDIF. 78 MW of the capacity is expected to be commissioned in the fourth quarter of 2021 and the remaining part in the fourth quarter of 2022.
The investment decisions related to the solar and wind capacities won by Fortum and the Fortum-Rusnano wind investment fund in the Russian CSA auctions in 2017, 2018, and 2019 are made on a case-by-case basis. Fortum’s maximum equity commitment is RUB 15 billion.
City Solutions On 20 December 2019, Fortum signed an agreement to sell its district heating business in Joensuu, Finland, to Savon Voima Oyj. The total consideration on a debt- and cash-free basis was approximately EUR 530 million, and the cash was received at the completion of the divestment on 10 January 2020. Fortum recorded a tax-exempt capital gain of EUR 431 million in the City Solutions segment’s first-quarter 2020 results.
On 6 February 2020, Fortum decided to assess strategic options, including possible divestment, of its district heating and cooling businesses in Poland, Estonia, Lithuania, Latvia, and in Järvenpää, Finland. Based on initial assessments, these district heating and cooling businesses have been identified as operations that could provide higher growth and value potential with an alternative ownership structure. In July, Fortum increased its ownership in the Tartu district heating business to 100% in order to increase the flexibility in potential future options for the Estonian district heating businesses.
On 3 July 2020, Fortum announced it had agreed to sell the district heating business in Järvenpää for approximately EUR 375 million. In August, Fortum closed the transaction and recorded a tax-exempt capital gain of EUR 291 million in the City Solutions segment’s third-quarter 2020 results.
On 31 July 2020, Fortum announced its decision to assess strategic options, including possible divestment, of its 50% holding in Stockholm Exergi. As part of the process, Fortum has held discussions on the matter with the City of Stockholm, the owner of the other 50% share in Stockholm Exergi. In December 2020, as part of the discussions, the City of Stockholm informed Fortum that they have concluded to keep their ownership in Stockholm Exergi at the current level and not consider entering into discussions to acquire Fortum’s ownership share. Fortum and the City of Stockholm will continue cooperating to ensure an efficient assessment and a mutually beneficial outcome of the process. Fortum continues the assessment of strategic options as planned.
Consumer Solutions In December 2020, Fortum decided to assess strategic options, including possible divestment, of its Consumer Solutions business. Based on initial assessments, this business has been identified as operations that could provide higher growth and value potential with an alternative ownership structure.
Uniper In February 2020, Uniper signed an agreement to sell its 58% stake in Schkopau, a lignite‐fired power plant in Saxony‐Anhalt in eastern Germany, to Saale Energie GmbH, a subsidiary of Czech energy producer EPH, which owns the other 42%. The transfer of ownership will take place in October 2021.
Research and development
Sustainability is at the core of Fortum’s strategy and, alongside Fortum’s current businesses, the company is carefully exploring and developing new sources of growth within renewable energy production.
Fortum’s goal is to be at the forefront of energy technology and application development. To accelerate innovation and the commercialisation of new offerings, Fortum is strengthening its in-house innovation and digitalisation efforts and building partnerships with leading global suppliers, technology and service companies, and research institutions. Fortum makes direct and indirect investments in start-ups that have promising new innovations focused on connectivity, have disruptive potential and accelerate the transition towards a circular economy. Fortum also invests in technologies that support better utilisation of the current asset base and that can create new markets and products for Fortum. The company is continuously looking for emerging clean energy solutions and for solutions that increase resource and system efficiency.
The Group reports its R&D expenditure on a yearly basis. In 2020, Fortum’s R&D expenditure was EUR 56 (67) million, or 0.1% (1.2%) of sales.
2020 2019 2018 Change
20/19 R&D expenditure, EUR million 56 67 56 -16% R&D expenditure, % of sales 0.1 1.2 1.1
Changes in Group management
On 2 March 2020, Fortum announced that the President and CEO Pekka Lundmark had resigned from the company. Mr. Lundmark left Fortum at the end of July 2020.
On July 1 2020, Fortum’s CFO Markus Rauramo started as President and CEO of Fortum, and Timo Karttinen, former CFO of Fortum (2014-2017), started as acting CFO for an interim period.
On 18 December 2020, Fortum announced that Mr. Bernhard Günther (age 53, Ph.D. Econ.) was appointed as Chief Financial Officer (CFO) and member of the Executive Management Team as of 1 February 2021.
Annual General Meeting 2020
Fortum’s Annual General Meeting (AGM) 2020 was scheduled for 17 March 2020. On 16 March 2020, Fortum’s Board of Directors decided to cancel the AGM due to the accelerated situation with the Covid-19 pandemic and the consequent restrictions announced by the Finnish Government on that same day. The AGM 2020 was held on Thursday, 23 April 2020.

OPERATING AND FINANCIAL
REVIEW
CONSOLIDATED FINANCIAL
STATEMENTS NOTES KEY
FIGURES
PARENT COMPANY FINANCIAL
STATEMENTS
SIGNATURES FOR THE OPERATING AND FINANCIAL REVIEW AND
FINANCIAL STATEMENTS AUDITOR’S
REPORT
KEY FIGURES
2011–2020
QUARTERLY FINANCIAL
INFORMATION INVESTOR
INFORMATION 1188
Financial performance and position Sustainability Risk management Fortum share and shareholders
The Annual General Meeting adopted the Financial Statements and the Consolidated Financial Statements for the financial period 1 January-31 December 2019 and discharged from liability the members of the Fortum Board of Directors and the President and CEO for the year 2019.
The Annual General Meeting decided that a dividend of EUR 1.10 per share be paid for the financial year that ended on 31 December 2019. The record date for the dividend payment was 27 April 2020, and dividends of EUR 977 million were paid on 5 May 2020.
The Annual General Meeting decided to approve the remuneration policy for the company’s governing bodies. The Annual General Meeting confirmed the remuneration for the Board of Directors for the upcoming term as
follows: for the chair EUR 77,200 per year, for the deputy chair EUR 57,500 per year, for a member EUR 40,400 per year, and for the member acting as the chair of the Audit and Risk Committee EUR 57,500 per year, if he or she is not simultaneously acting as chair or deputy chair of the board. In addition, a fee of EUR 600 will be paid for each board meeting and board committee meeting. For members living outside Finland in Europe, the fee for each meeting will be doubled, and for members living outside Europe, the fee for each meeting will be tripled. For members living in Finland, the fee for each board and board committee meeting will be doubled for meetings held outside Finland and tripled for meetings held outside Europe. For board and committee meetings held as a telephone conference, the basic fee will be paid to all members.
The Annual General Meeting decided that the number of the members of the Board of Directors will be nine. Mr Matti Lievonen was elected as chair, Mr Veli-Matti Reinikkala as deputy chair, and Ms Eva Hamilton, Ms Essimari Kairisto, Mr Klaus-Dieter Maubach, Ms Anja McAlister, Mr Philipp Rösler, Mr Teppo Paavola, and Ms Annette Stube as members.
In addition, Deloitte Oy was re-elected as the auditor, with Reeta Virolainen, APA, as the responsible auditor. The auditor's fee is paid pursuant to an invoice approved by the company. In September 2020, Jukka Vattulainen of Deloitte Oy was appointed as the responsible auditor for Fortum.
Fortum’s Annual General Meeting 2020 authorised the Board of Directors to decide on the repurchase and disposal of the company's own shares up to a maximum number of 20,000,000 shares, which corresponds to approximately 2.25% of all the shares in the company. These authorisations will be effective until the next Annual General Meeting and, in any event, for a period no longer than 18 months. These authorisations have not been used as per 11 March 2021.
The Annual General Meeting authorised the Board of Directors to decide on contributions in the total maximum amount of EUR 500,000 for charitable or similar purposes and to decide on the recipients, purposes, and other terms of the contributions. The authorisation will be effective until the next Annual General Meeting. As per 11 March 2021, EUR 165,000 of this authorisation has been used.
After a vote, the Annual General Meeting rejected the proposal of shareholder Maailman Luonnon Säätiö, World Wide Fund for Nature, Suomen rahasto sr to amend the Articles of Association of the company.
Board decisions At the meeting held after the Annual General Meeting 2020, Fortum’s Board of Directors elected to the Nomination and Remuneration Committee Matti Lievonen as chair, and Eva Hamilton, Klaus-Dieter Maubach, and Anja McAlister as members.
Furthermore, the board elected to the Audit and Risk Committee Essimari Kairisto as chair and Teppo Paavola, Veli-Matti Reinikkala, Philipp Rösler, and Annette Stube as members.
Shareholders’ Nomination Board On 11 September 2020, Mr. Kimmo Viertola, Director General, Prime Minister's Office, Ownership steering department (chair), Mr. Jouko Pölönen, President and CEO, Ilmarinen Mutual Pension Insurance Company, and Mr. Risto Murto, President and CEO, Varma Mutual Pension Insurance Company, were appointed to Fortum's Shareholders' Nomination Board. In addition, the chair of Fortum's Board of Directors, Mr. Matti Lievonen, is a member of the Shareholders' Nomination Board.
Other major events during the reporting period
On 18 December 2020, the Board of Directors decided to commence the 2021-2023 long-term incentive (LTI) plan for key employees and executives. The 2021-2023 LTI plan is part of Fortum's ongoing LTI programme and follows the same principles as the previous plan. The performance measures applied to the 2021-2023 LTI plan will be based on the total shareholder return measured relative to the peer group comprising selected European utility and gas companies, as well as a target linked to the reduction of Fortum’s coal-based power generation capacity in line with Fortum’s coal-exit path, with a minimum level requiring exceeding the communicated ambition level. The 2021-2023 LTI plan will comprise approximately 150 participants, including the members of Fortum Executive Management. The Board of Directors also decided to commence the 2021-2023 restricted share (RS) plan as a supplement to the LTI programme and reserve shares that potentially will be delivered in spring 2024. The maximum number of shares that may be delivered as a reward is expected to be 800,000 shares for the 2021-2023 LTI plan and 60,000 shares for the 2021-2023 RS plan.
On 30 September 2020, Fortum’s Board of Directors decided to launch the savings period for the year 2021 under its Employee Share Savings (ESS) programme. The ESS programme was established in October 2019 and the Board of Directors decides separately on the annual launch of each individual savings period.
Events after the balance sheet date
There have been no material events after the balance sheet date.
Key drivers and risks
Fortum’s financial results are exposed to a number of financial, operational, strategic, and sustainability-related risks. Fortum is exposed to these risks both directly and indirectly through its subsidiaries, associated companies, and joint ventures. The principal associated companies and joint ventures are Teollisuuden Voima Oyj (TVO), Forsmarks Kraftgrupp AB, Kemijoki Oy, TGC 1, and Stockholm Exergi AB. For more information about the risk exposures, please see each respective company’s annual report.
On 26 March 2020, Fortum became the majority shareholder of Uniper. Fortum consolidated Uniper into Fortum’s balance sheet as of 31 March 2020, and the income statement from the second quarter. However, Uniper remains a separate listed company operating under German law and regulations; Uniper has its own risk management systems including a set of risk policies defining the risk management organisation principles, processes, and responsibilities for managing risks. Therefore, Uniper does not directly apply the risk management systems applicable to Fortum’s other divisions and corporate functions. The risk management systems of Uniper, including the key principles and processes, are materially in line with those of Fortum. The target is to further align the risk management systems going forward.
For more information about Uniper’s risk management systems and risk exposures, please see Uniper’s annual report for 2020.
In December 2020, Fortum presented the updated strategy for the whole Fortum Group. Fortum and Uniper have agreed to co-operate in a number areas including physical trading and optimisation of Nordic hydro operations, jointly developing a portfolio of solar and wind projects in Europe, and a joint growth strategy in hydrogen. In addition, Fortum has announced a number of growth areas for future investments and has initiated a strategic review of the heating and cooling businesses in the Baltics and Poland, it’s 50% stake in Stockholm Exergi, and the Consumer Solutions business. The ability of Fortum to deliver on its strategic targets and achieve the expected benefits depends on successful portfolio restructuring and co-operation between the two companies.

OPERATING AND FINANCIAL
REVIEW
CONSOLIDATED FINANCIAL
STATEMENTS NOTES KEY
FIGURES
PARENT COMPANY FINANCIAL
STATEMENTS
SIGNATURES FOR THE OPERATING AND FINANCIAL REVIEW AND
FINANCIAL STATEMENTS AUDITOR’S
REPORT
KEY FIGURES
2011–2020
QUARTERLY FINANCIAL
INFORMATION INVESTOR
INFORMATION 1199
Financial performance and position Sustainability Risk management Fortum share and shareholders
Fortum is exposed to power, emissions, and fuel price movements and volume changes mainly through its power and heat generation. The profitability of outright production assets, such as hydro, nuclear, and wind power generation, are primarily exposed to fluctuations in electricity prices and volumes, whereas the profitability of coal and gas fired generation assets depend on the spread between the electricity price and the emission and fuel prices.
In the Nordics and central European countries, power prices and, consequently, the amount of profitable production, exhibit significant variation on the back of several factors, for instance, but not limited to weather conditions, outage patterns in production and transmission lines, CO2 allowance prices, fuel prices, as well as the power demand.
Uniper has long-term gas supply contracts which generally include the possibility for the customer and the supplier to adapt contractual terms to changed market conditions. This entails the risk that suppliers will impose contractual changes and/or new conditions that are detrimental, but also represents an opportunity as renegotiated conditions may be beneficial for Fortum.
For Fortum’s Russian businesses, the key drivers are economic growth, the rouble exchange rate, regulation of the heat business, and the further development of the electricity and capacity markets. A key profitability driver is the received capacity payments based on the CSA contracts and CCS auctions. The main part of Fortum’s generation capacity built after 2007 is entitled to CSA payments for approximately 10 years after commissioning of each new unit (approximately 15 years for renewable generation). The received capacity payments vary, depending on the age, location, type, and size of the plant, as well as on seasonality and availability. The CSA payments are adjusted for, among other factors, the Government bond yield, the rate of return, the consumer price index (CPI), and re-examination of earnings from the electricity-only (spot) market (done every three and six years after commissioning of a unit). In addition, thermal power plants are entitled to clearly higher CSA payments starting approximately six years after commissioning.
The energy sector is heavily influenced by national and EU-level energy policies and regulations. Fortum's strategy has been developed based on scenarios of the future development of the regulatory environment in both existing and potential new businesses and market areas. The overall complexity and possible regulatory changes in Fortum's various operating countries pose risks and create opportunities for the energy, environmental management, and consumer businesses. Fortum analyses and assesses a number of future market and regulation scenarios, including the impact of these on different generation forms and technologies in the development of its strategy.
Fortum has cash flows, assets, and liabilities in currencies other than the euro and is therefore exposed to fluctuations in exchange rates. Currency risk arise mainly from physical and financial trading of commodities, existing and new investments, external financing, and shareholder loans within the Group. The main currency exposure is toward euro/Swedish krona, euro/Russian rouble, and euro/British pound sterling, arising from Fortum’s extensive operations in Sweden, Russia, and the United Kingdom.
Fortum is currently rated BBB with a negative outlook by both Standard & Poor’s and Fitch credit rating agencies. The key risk factors that could lead to a weakening credit metrics and rating downgrade include a continuing decline in European and Russian power prices, lower-than-expected amounts received from planned divestments, and an increase in leverage. A lowering of the credit rating, in particular to below investment-grade level (BB+ or below), could affect access to capital markets and the increase cost of new financing. Uniper is also currently rated BBB with a negative outlook by Standard & Poor’s. A downgrade from the current BBB investment-grade rating to BBB- or below could negatively affect liquidity as it would trigger counterparties’, especially in the trading business, right to demand increased collateral, which would need to be provided via liquid assets or bank guarantees.
Energy generation, storage, distribution, and control of operations is a complex process and therefore accidents can occur. Any unwanted operational event (which could be caused by e.g. technical failure, human or process error, natural disasters, sabotage, or terrorist attack) can endanger personal safety or lead to environmental or physical damage, business interruptions and possible third-party liability. The cost of repairing damage can be high especially in the Group’s largest units.
Fortum’s business activities involve the construction, modernisation, maintenance, and decommissioning of power plants or other energy industry facilities. There is a risk that construction costs exceed planned costs or construction delays occur as the result of regulatory or permit issues, failure of key suppliers, being unable to obtain permits, or as a result of Covid-19 causing the discontinuation of the project. Asset projects also face environmental, health, and safety risks. Asset project risks may realise both for Fortum’s own assets projects, or projects carried out through joint ventures or associated companies. The most significant asset projects which are still exposed to significant risks are Datteln 4, Nord Stream 2, and Olkiluoto 3.
During 2020, the Covid-19 pandemic resulted in new and partly unexpected risks as societies and governments across the world implemented drastic measures to contain the spread of the disease. Although the impacts for Fortum have so far been limited, the exposure to risk and uncertainty in all risk categories has increased compared to the 2019 year-end situation. If the Covid-19 pandemic continues longer than expected or results in a more severe economic downturn than anticipated, results will be negatively impacted, as the hedge level for future years is lower. The main risk factors include lower commodity prices and decreased demand, credit defaults and delayed payments, project delays and increased risk of operational incidents or prolonged maintenance as a result of travel restrictions, absence of key personnel, as well as difficulties in obtaining key materials and spare parts.
Fortum is closely monitoring the development of the pandemic and its effects on our operations so that we can quickly respond to changes and continue to ensure the safe and reliable delivery of electricity, heat and related services. For further details on Fortum’s risks and risk management, see the Risk management section of the Operating and financial review and Note 4 Financial risk management.
Outlook
Hedging At the end of 2020, approximately 75% of the Generation segment’s estimated Nordic power sales volume was hedged at EUR 33 per MWh for 2021 and approximately 50% at EUR 31 per MWh for 2022.
At the end of 2020, approximately 90% of the Uniper segment’s estimated Nordic power sales volume was hedged at EUR 27 per MWh for 2021, approximately 65% at EUR 24 per MWh for 2022 and approximately 25% at EUR 22 per MWh for 2023.
The reported hedge ratios are based on the hedges and power generation forecasts of the Generation segment and of the Uniper segment’s Nordic generation. The underlying generation assets and definition of hedges differ to some extent and thus are not fully comparable.
The reported hedge ratios may vary significantly, depending on Fortum’s and Uniper’s actions on the electricity derivatives markets. Hedges are mainly financial contracts, most of them electricity derivatives quoted on Nasdaq Commodities.

OPERATING AND FINANCIAL
REVIEW
CONSOLIDATED FINANCIAL
STATEMENTS NOTES KEY
FIGURES
PARENT COMPANY FINANCIAL
STATEMENTS
SIGNATURES FOR THE OPERATING AND FINANCIAL REVIEW AND
FINANCIAL STATEMENTS AUDITOR’S
REPORT
KEY FIGURES
2011–2020
QUARTERLY FINANCIAL
INFORMATION INVESTOR
INFORMATION 2200
Financial performance and position Sustainability Risk management Fortum share and shareholders
Capital expenditure and divestments Fortum estimates its capital expenditure, including maintenance but excluding acquisitions, to be approximately EUR 1,400 million in 2021, of which the share of maintenance capital expenditure is estimated to be approximately EUR 700 million, well below the level of depreciation.
Generation The Generation segment’s achieved Nordic power price typically depends on factors such as hedge ratios, hedge prices, spot prices, availability and utilisation of Fortum’s flexible generation portfolio, as well as currency fluctuations. Excluding the potential effects from changes in the power generation mix (currently approximately 45 TWh), a EUR 1 per MWh change in the Generation segment’s achieved Nordic power price will result in an approximately EUR 45 million change in the segment’s annual comparable operating profit. The achieved power price also includes the results of optimisation of Fortum’s hydro and nuclear generation, as well as operations in the physical and financial commodity markets.
Russia In February 2021, the Wholesale Market Trading Administrator published data from 2020 regarding the rate of return and the CPI, which are used to calculate the CSA price for 2021. The CSA payments were revised downwards, mainly due to the lower Government bond yield (6.3% for 2021 vs. 7.6% for 2020). In 2021, in the Russia segment, the negative financial effect related to the ending of the CSA period of two production units is expected to exceed the positive effect of three units entering the four-year period of higher CSA payments.
Uniper Excluding the potential effects from changes in the power generation mix, a EUR 1 per MWh change in the Uniper segment’s power sales price for the outright generation (hydro and nuclear, currently approximately 25 TWh) will result in an approximately EUR 25 million change in the segment’s annual comparable operating profit. Uniper also has generation other than hydro and nuclear power, and the sensitivity for that generation is different and is not included in the previously mentioned sensitivity.
With regard to Uniper, reference is made to the guidance that the company publishes quarterly.
Income taxation In 2021, the comparable effective income tax rate for Fortum is estimated to be in the range of 20-25%. The actual effective income tax rate on the income statement differs from the guided comparable effective income tax rate range depending on capital gains, share of profits from associates and joint ventures, and volatility in fair valuations.
In June 2018, the Swedish Government decided to lower the Swedish corporate tax in two steps, from 22.0% to 21.4%, effective January 2019, and to 20.6%, effective January 2021.

OPERATING AND FINANCIAL
REVIEW
CONSOLIDATED FINANCIAL
STATEMENTS NOTES KEY
FIGURES
PARENT COMPANY FINANCIAL
STATEMENTS
SIGNATURES FOR THE OPERATING AND FINANCIAL REVIEW AND
FINANCIAL STATEMENTS AUDITOR’S
REPORT
KEY FIGURES
2011–2020
QUARTERLY FINANCIAL
INFORMATION INVESTOR
INFORMATION 2211
Financial performance and position Sustainability Risk management Fortum share and shareholders
Sustainability
Sustainability at Fortum
Introduction This section covers Fortum’s non-financial reporting in accordance with the Finnish Accounting Act 1336/1997, Securities Market Act 746/2012 and Limited Liability Companies Act 624/2006. The reporting scope includes Uniper, which Fortum has consolidated as a subsidiary as of 31 March 2020.
Indicators following the same calculation principles have been consolidated and are disclosed as one figure. In cases where the definitions currently differ, two KPIs are presented; one for Fortum, excluding Uniper, and one for Uniper. No historical figures have been restated.
Fortum Group’s business model is described in the Segment review section on page 10. Uniper is a listed company in Germany, and has its own sustainability processes, approach and standalone
sustainability reporting. Uniper also prepares and publishes a Combined Separate Non-Financial Report in accordance with §§315c in conjunction with 289c to 289e of the German Commercial Code.
Material non-financial aspects Fortum’s non-financial reporting includes information on the four mandatory aspects defined in the Finnish Accounting Act. These are: environmental matters, social and personnel matters, respect for human rights, and prevention of corruption and bribery.
As a result of Uniper consolidation, Fortum has reassessed its material aspects. Fortum’s materiality assessment was originally conducted in 2019, and the 2020 reassessment was based on a desk-top review following the same methodology Uniper applies. The assessment results of the two companies were combined with an equal weight in the end result.
Fortum highlights the importance of decarbonisation and climate change mitigation, while at the same time the necessity to secure reliable and affordable energy for all. Fortum also gives balanced consideration in its operations to the promotion of energy efficiency and a circular economy, as well as its impacts on personnel and societies.
Based on the above-mentioned priorities, Fortum’s updated sustainability priority areas include: Climate and resources Personnel and society Climate change and GHG emissions Employee wellbeing, health and safety Business ethics and compliance Emissions to air, land and water Corporate governance Labour rights Energy efficiency Human rights Diversity and equal opportunity Security of supply Innovation and digitalisation Stakeholder engagement Water use Economic value creation Customer rights and satisfaction Biodiversity Circular economy Fortum’s sustainability performance is monitored and disclosed in interim and annual reporting. Fortum publishes an annual Sustainability Report with more extensive information on Fortum’s sustainability performance.
Revised Sustainability targets Fortum updated its climate targets aligned with the goals of the Paris Agreement in December 2020 and is committed to carbon neutrality by 2050 at the latest. The target covers direct CO2 emissions (Scope 1) and indirect CO2 emissions (Scope 2 and 3). Fortum’s roadmap to reduce emissions in Europe has also been defined. Fortum is committed to at least 50% CO2 emissions reduction (Scope 1 and 2) in its European generation by 2030 (compared to base-year 2019) and to be carbon neutral by 2035 at the latest.
Scope 3 emissions play a significant role in Fortum’s total emissions. During 2021, Fortum will develop a target for the reduction of Scope 3 GHG emissions, addressing the indirect emissions from fossil fuel sales to end users.
Fortum has also set a target for biodiversity, addressing the year 2021. Fortum aims at conducting a minimum of 12 major voluntary measures that improve the living conditions of species and strengthen populations, covering all countries where Fortum has hydropower production. The projects focus on threatened species or habitats, in particular, and in 2021 are planned to include restoring aquatic and terrestrial habitats, improving fish migration and migratory fish populations and combating invasive species.
For Fortum, excellence in safety is the foundation of the company’s business and an absolute prerequisite for efficient and interruption-free production. The new safety target is measured as Total Recordable Injury Frequency (TRIF), for own personnel and contractors, and the ambitious goal is to be below 1.0 by the end of 2025. Fortum’s Total Recordable Injury Frequency (TRIF) was 2.3 in 2020.
Development of sustainability targets will continue in 2021 and Fortum aims to align targets also addressing other areas of sustainability in addition to climate, biodiversity and safety.
The sustainability targets for the year 2020 were defined for Fortum, excluding Uniper. However, as Fortum started to consolidate Uniper as a subsidiary as of 31 March 2020, the extent of operations, sustainability impacts and performance figures of Fortum materially changed. Therefore, Fortum only reports sustainability performance with selected key indicators presented in the tables below without comparing performance against the previously set targets for 2020, as they are no longer relevant for the altered Group.
Group sustainability performance 2020 2019 Climate and resources Specific CO2 emissions from total energy production 1), gCO2/kWh 287 189 Energy availability of CHP plants 2), % 93.2 95.9 Asset availability of Uniper’s power generation plants 3), % 75.0 - Personnel and society Lost Time Injury Frequency (LTIF), own personnel and contractors 1) 1.3 1.7 Severe occupational accidents 1), no. 1 1
Fortum consolidated Uniper as a subsidiary into its income statement from the second quarter of 2020. The figures for 2020 do not include Uniper for the first-quarter 2020. The figures for full-year 2019 do not include Uniper. 1) 2020 figures include Uniper from the second-quarter 2020. 2) Excludes Uniper 3) 2020 figures include Uniper’s power generation from gas and coal power plants from the second-quarter 2020.

OPERATING AND FINANCIAL
REVIEW
CONSOLIDATED FINANCIAL
STATEMENTS NOTES KEY
FIGURES
PARENT COMPANY FINANCIAL
STATEMENTS
SIGNATURES FOR THE OPERATING AND FINANCIAL REVIEW AND
FINANCIAL STATEMENTS AUDITOR’S
REPORT
KEY FIGURES
2011–2020
QUARTERLY FINANCIAL
INFORMATION INVESTOR
INFORMATION 2222
Financial performance and position Sustainability Risk management Fortum share and shareholders
Other key sustainability performance indicators 1) 2020 2019 Climate and resources Energy-efficiency improvement by 2020, baseline 2012, GWh/a 1,840 1,707 Major EHS incidents, no. 16 11 Personnel and society Reputation index, based on One Fortum Survey, scale 0–100 72.5 72.3 Customer satisfaction index (CSI), based on One Fortum Survey, scale 0–100 61–81 54–80 Quality of investigation process of occupational accidents, major EHS incidents and near misses, scale 1–5 Level 4.0 Level 3.0 GAP index, implementation of EHS minimum requirements, scale 1–5 Level 3.0 Level 3.0 Contractor safety improvement index, scale 1–5 Level 4.0 Level 2.0 2) Sickness-related absences, % 2.9 2.9 3)
1) All figures excluding Uniper. 2) Reporting of the Contactor Safety Improvement index started in the second quarter of 2019. 3) The figure has been revised from the one presented in the Financials 2019 report (3.0).
Fortum’s goal is to achieve excellent financial performance in strategically selected core areas through strong competence and responsible ways of operating. The financial targets include a target for capital structure (financial net debt/comparable EBITDA below 2x) and two different hurdle rates for new investments (WACC +100 BPS for green investments and WACC +200 BPS for other investments). Accordingly, Fortum aims to provide good returns for its owners, and its dividend policy stipulates to pay a stable, sustainable, and over time increasing dividend.
Fortum is a significant economic actor in its operating countries. The most significant direct monetary flows of Fortum’s operations come from revenue from customers, procurements of goods and services from suppliers, compensation to lenders, dividends to shareholders, growth and maintenance investments, employee wages and salaries, and taxes paid.
Fortum supports social development and wellbeing in its operating countries by, e.g., paying taxes. The tax benefits Fortum produces to society include not only corporate income taxes, but also several other taxes. Fortum’s, excluding Uniper, approach to taxation and the principles that steer the tax management are presented in Fortum’s Tax Principles disclosed on Fortum’s website. Fortum publishes its tax footprint annually, and Uniper will publish its first tax footprint in spring 2021.
Fortum is included in several sustainability indices and has been assessed by many sustainability ratings; see the list on Fortum’s website. Fortum’s sustainability reporting covers functions under Fortum’s operational control, including subsidiaries in all its operating countries, if not otherwise stated.
Sustainability risks and opportunities Fortum’s operations are exposed to risks, which, if materialised, can have adverse effects on the environment and on the safety and security of employees, contractors and neighbouring societies. Key sustainability risks, including climate-related risks, are reported to Fortum Executive Management and the Audit and Risk Committee as part of the annual review of material risks and uncertainties for Fortum Group. Fortum Group’s risks are presented in the Risk management section in the Operating and financial review.
As a separate listed company, Uniper applies its own processes aligned with its enterprise risk management to systematically identify, assess and manage Environmental, Social and/or Governance (ESG) risks. In 2020 Uniper had no reportable ESG risks pursuant to Section 289c of the German Commercial Code. The impact of its net risks was below the reporting threshold.
Climate change and the need for decarbonisation and resource efficiency are changing the energy industry in a profound way, and these changes also create new business opportunities for Fortum. Fortum has transformed itself, having invested about EUR 11 billion over the past six years to become Europe’s third largest CO2-free power generator and a significant player in gas. As such, Fortum is now well positioned to capture opportunities resulting from the energy transition, aimed at curbing climate change. To be successful, the energy transition must balance sustainability, affordability, and security of supply. It requires not only renewables, but also increasingly clean gas (e.g. hydrogen), energy storage, and other flexible solutions to provide security of supply and to decarbonise also industry, transportation, heating, and cooling. Fortum’s updated strategic priorities address and provide solutions for these very areas: Fortum aims to decarbonise its own operations and to strengthen and grow in CO2-free power generation while leveraging its strong position in gas to enable the energy transition. At the same time, Fortum aims to provide industrial and infrastructure customers with decarbonisation and environmental solutions, such as grid stability, waste-to-energy, and low-carbon industrial solutions, and to capture the opportunities in hydrogen as they become commercially available.
Sustainability governance and policies As sustainability is an integral part of Fortum’s strategy, the highest decision making on sustainability and climate-related matters falls within the duties of the members of the Board of Directors, who share joint responsibility in these matters.
Fortum Executive Management decides on the sustainability approach and Group-level sustainability targets that guide annual planning. The Group’s performance targets, including sustainability and climate-related targets, are approved by Fortum’s Board of Directors. Fortum’s line management is responsible for the implementation of Fortum Group’s policies and instructions and for day-to-day sustainability management and improvement plans. Realisation of the safety targets (Lost Time Injury Frequency, own employees and contractors combined) is a part of Fortum’s short-term incentive (STI) programme. Fortum’s long-term incentive (LTI) programme includes a climate-related metric. In the 2020–2022 LTI plan, the target is related to the reduction of CO2 emissions aligned with Fortum’s strategy. In the 2021–2023 LTI plan, the target is linked to the reduction of coal-fired power generation capacity in line with Fortum’s coal-exit path. Both STI and LTI targets are applicable to Fortum, excluding Uniper. Uniper continues to follow its own STI and LTI plans.
The Uniper SE Management Board bears the overall responsibility for the adoption and implementation of Uniper’s sustainability measures. Uniper’s highest governance board, the Supervisory Board, monitors the fulfilment of Uniper’s sustainability obligations. Three of Fortum’s Executive Managers, including the President and CEO of Fortum, as well as one member of Fortum’s Board of Directors are members of the Supervisory Board.
Sustainability management at Fortum is strategy-driven and based on its Values, Code of Conduct, Supplier Code of Conduct, sustainability-related policies, and other Group policies and their specifying instructions. For now, Uniper continues to have its own separate Code of Conduct and Supplier Code of Conduct. Both companies’ Codes of Conduct are based on similar fundaments and they establish the basic principles of conduct that everyone must follow. They define how we treat each other, do business and engage with the world. The companies’ Supplier Codes of Conduct, both based on the ten principles of UN Global Compact, outline the requirements for Fortum’s and Uniper’s suppliers and business partners.
Fortum’s Sustainability Policy and Uniper’s Health, Safety, Security and Environment (HSSE) and Sustainability Policy Statement define the companies’ ambitions and priorities for sustainability. Both companies have sound policies and specifying instructions guiding the operations in the areas of environmental matters, social and personnel matters, human rights, and anti-corruption and bribery. The most important policies and instructions are described in the respective sections of this report.
OPERATING AND FINANCIAL
REVIEW
CONSOLIDATED FINANCIAL
STATEMENTS NOTES KEY
FIGURES
PARENT COMPANY FINANCIAL
STATEMENTS
SIGNATURES FOR THE OPERATING AND FINANCIAL REVIEW AND
FINANCIAL STATEMENTS AUDITOR’S
REPORT
KEY FIGURES
2011–2020
QUARTERLY FINANCIAL
INFORMATION INVESTOR
INFORMATION 2233
Financial performance and position Sustainability Risk management Fortum share and shareholders
Fortum follows and respects the International Bill of Human Rights, the United Nations Convention on the Rights of the Child, and the core conventions of the International Labour Organisation (ILO). Additionally, Fortum recognises in its operations the UN Guiding Principles on Business and Human Rights, the OECD Guidelines for Multinational Enterprises, the International Chamber of Commerce’s anti-bribery and anti-corruption guidelines, and the Bettercoal initiative’s Code on responsible coal mining.
Fortum is a participant of the UN Global Compact initiative and the UN Caring for Climate initiative. Uniper follows the ten principles of the UN Global Compact, but is not a formal participant.
Business ethics Zero tolerance for corruption and bribery is highlighted in both Fortum’s and Uniper’s Codes of Conduct and Supplier Codes of Conduct. In addition, separate instructions and guidelines have been created to address, e.g., anti-bribery, compliance management, safeguarding company assets, conflict of interest, anti-money laundering and competition law.
Fortum’s Board of Directors has approved the company’s Code of Conduct and Supplier Code of Conduct. Uniper’s Code of Conduct and Supplier Code of Conduct have been approved by the Uniper Management Board.
The Codes of Conduct are regularly reviewed in order to ensure compliance with evolving company and regulatory requirements. Fortum’s Code of Conduct and Supplier Code of Conduct were updated during 2020 and published in early 2021. Training on the updated Codes will be organised during 2021. The Code of Conduct online training is mandatory to all employees. Uniper’s updated Code of Conduct was released in early 2020. Uniper seeks to make all compliance and Code of Conduct training mandatory to all employees starting in 2021. In addition, relevant individuals are regularly trained in policies and systems that prevent corruption.
Internal and external reporting channels are offered for reporting suspicions of misconduct. The channels are described in the Codes of Conduct and accessible on the companies’ internal and external webpages. Suspected misconduct and measures related to ethical business practices and compliance with regulations are regularly monitored and assessed by Fortum’s Audit and Risk Committee. Uniper’s Compliance Management System includes quarterly compliance reports to the Uniper Management Board. Uniper’s Audit and Risk Committee monitors compliance issues on a regular basis. Uniper Management Board’s Compliance Commitment is published annually on the company’s webpage in accordance with the German Governance Code.
During 2020, one case of corruption or bribery was confirmed in Fortum’s operations, excluding Uniper. Two instances of alleged corruption and bribery were reported at Uniper during the year. One case is pending, the other was closed as unfounded.
Climate and resources
Fortum’s key performance indicators for climate and resources are related to CO2 emissions, security of supply, energy efficiency, and major Environmental, Health and Safety (EHS) incidents.
Fortum’s Sustainability Policy together with the Minimum Requirements for EHS Management steer environmental management. Uniper has its HSSE & Sustainability Policy Statement and HSSE and Sustainability Improvement Plan. Operational-level activities follow the requirements set forth in the ISO 14001 environmental management standard, and 99.9% of Fortum’s power and heat production worldwide has ISO 14001 certification.
Energy Fortum Group’s power generation is mainly based on natural gas-fired generation, and carbon dioxide-free hydro and nuclear power. Fortum targets to reduce the share of coal in power generation rapidly. A minor share of Fortum’s power generation is currently based on solar and wind, but Fortum targets significant growth in the area over the next five years.
Fortum is also a large producer of district heat. The heat is mainly produced at natural gas-fired and energy-efficient combined heat and power (CHP) plants. In addition, Uniper operates a large commodities trading business and has natural gas storage sites, which play an important role in ensuring a secure and flexible gas supply.
Fortum wants to enable the energy transition by providing a reliable and affordable supply of low-carbon energy. In the future, the energy system – and Fortum’s asset portfolio – will be based on renewable energy, increasingly clean gas (e.g. hydrogen) and nuclear power. In addition, Fortum will continue to offer industrial and infrastructure solutions, e.g., waste-to-energy, grid stability services, as well as energy sales and storage.
In 2020, Fortum’s power generation was 142.1 TWh and heat and steam production 29.6 TWh. 45% of Fortum’s total power generation was CO2-free. In Europe, 73% of the power generation was CO2-free. The figures for power and heat generation and capacities also include figures from Fortum’s share in associated companies and joint ventures that sell their production to the owners at cost.
Fortum uses various fuels, such as natural gas, uranium, coal, lignite, waste-derived fuels and biomass fuels, to produce electricity, heat and steam. The most significant fuel used was natural gas.
An uninterrupted and reliable energy supply is critical for society to function. With planned preventive maintenance and condition monitoring, Fortum ensures that the power plants operate reliably to produce the electricity and heat customers need. In the exceptional conditions caused by the Covid-19 pandemic, Fortum’s top priority was to maintain business continuity. This goal was well achieved; there were no interruptions in Fortum’s energy production due to the pandemic. Maintenance outages were, in general, also implemented as scheduled with careful planning and special measures to protect own and contractors’ employees’ health. In some cases, the duration of maintenance periods was extended to reduce the number of workers on site at the same time.
Uniper’s definition for asset availability differs from that of the rest of the Fortum Group. The energy availability of Fortum’s CHP plants, excluding Uniper, excludes planned maintenance outages, whereas Uniper’s asset availability for power production includes planned outages in addition to unplanned technical unavailability. In 2020, the energy availability of Fortum’s CHP plants, excluding Uniper, was, on average, 93.2%, and the asset availability of Uniper’s gas and coal-fired power production plants was, on average, 75.0%. For Uniper, the figure (75.0%) was for the time period of consolidation as a subsidiary, i.e. the second-fourth quarters 2020 only.

OPERATING AND FINANCIAL
REVIEW
CONSOLIDATED FINANCIAL
STATEMENTS NOTES KEY
FIGURES
PARENT COMPANY FINANCIAL
STATEMENTS
SIGNATURES FOR THE OPERATING AND FINANCIAL REVIEW AND
FINANCIAL STATEMENTS AUDITOR’S
REPORT
KEY FIGURES
2011–2020
QUARTERLY FINANCIAL
INFORMATION INVESTOR
INFORMATION 2244
Financial performance and position Sustainability Risk management Fortum share and shareholders
Climate In December 2020, Fortum Group committed to carbon neutrality by 2050 at the latest, in line with the goals of the Paris Agreement. Fortum’s priority is to transform its own operations to carbon neutral by continuously strengthening and growing in CO2-free power generation and by decarbonising its carbon-emitting energy production fleet.
In 2020, Fortum’s direct CO2 emissions were 48.7 Mt. 63% of CO2 emissions originated from Russian power and heat production. Of the total CO2 emissions, 17.5 Mt were within the EU emissions trading system (ETS). The estimate for Fortum’s free emission allowances in 2020 is 0.9 Mt.
Fortum’s total CO2 emissions 1) (million tonnes, Mt) 2020 2019 2018 Total emissions 48.7 19.1 20.1 Emissions subject to ETS 17.5 2.1 2.5 Free emission allowances 0.9 0.7 0.8 Emissions not subject to ETS in Europe 0.7 0.7 0.7 Emissions in Russia 30.5 16.3 16.9
1) Fortum consolidated Uniper as a subsidiary into its income statement from the second quarter of 2020. The figures for 2020 do not include Uniper for the first-quarter 2020. The figures for full years 2018 and 2019 do not include Uniper.
In 2020, Fortum Group’s specific CO2 emissions from total energy production were 287 gCO2/kWh. Fortum, excluding Uniper, achieved annual energy-efficiency improvements of 1,840 GWh/a by the end of
2020 compared to 2012.
EHS incidents Major EHS incidents are monitored, reported and investigated, and corrective actions are implemented. In 2020, there were 16 major EHS incidents in Fortum’s operations, excluding Uniper. The major EHS incidents consisted of six fires, eight leaks or spills, one environmental non-compliance, and one INES level 1 incident. The major EHS incidents did not have significant environmental impacts, apart from the oil spill that occurred at the Inkoo oil storage in Finland. The clean-up measures in Inkoo have been completed. As Uniper’s definitions of major EHS incidents vary from that of the rest of the Fortum Group, Uniper’s EHS incidents are currently not included in the reporting.
Water and biodiversity Fortum uses large volumes of water at various types of power plants and in district heating networks. The majority of water is used for cooling. In most cases, power plants do not consume water – the water is discharged back to the same water system from where it was withdrawn.
Fortum’s operations in e.g. hydropower generation impact biodiversity. Fuel procurement and flue-gas emissions may also have a negative impact on biodiversity. On the other hand, increasing CO2-free production mitigates the biodiversity loss caused by climate change. Fortum’s Biodiversity Manual and Biodiversity Action Plan define the company’s approach to biodiversity management, excluding Uniper. Fortum has set a new Group target for biodiversity for 2021: number of major voluntary measures enhancing biodiversity ≥12. The measures planned for 2021 are primarily related to hydropower generation in Sweden, Finland and Germany.
Personnel and society
Fortum’s key performance indicators for personnel and society are related to operational and occupational safety, as well as employee health and wellbeing. In addition Fortum, excluding Uniper, annually measures its reputation and customer satisfaction with the One Fortum Survey.
Personnel Fortum places a significant emphasis on an open and trusting corporate culture and highlights systematic two-way feedback on employees’ performance and engagement. Diversity and equal opportunity are seen to contribute to competitiveness and innovation. Fortum and Uniper Values and Codes of Conduct form the foundation for all daily work. For Fortum, the People Policy and Leadership Principles guide personnel-related matters, excluding Uniper. For Uniper, the Uniper Way builds corporate culture and describes the core elements and guiding statements for leadership, teamwork and individual contribution. Uniper defined a new People Strategy in 2020 to support the journey towards a green future.
Fortum’s operations are mainly based in the Nordic countries, Central Europe, the UK, Russia, Poland and the Baltic Rim area. The total number of employees at the end of 2020 was 19,933.
Group personnel statistics 1) 2020 2019 2018 Number of employees, 31 December 19,933 8,191 8,286 Average number of employees 19,988 8,248 8,767 Total amount of employee benefits, EUR million 1,195 480 459 Departure turnover, % (of permanent employees) 7.4 11.2 16.1 Permanent employees, % 94.8 96.8 95.9 Full-time employees, % 98.2 97.7 2) 98.2 2) Female employees, % 27 32 32 Females in management, % 27 3) 30 30
1) Fortum consolidated Uniper as a subsidiary into its income statement from the second quarter of 2020. The figures for 2020 do not include Uniper for the first-quarter 2020. The figures for full years 2018 and 2019 do not include Uniper.
2) Figure includes only permanent, not temporary, employees. 3) Calculation principle changed due to alignment with Uniper.
Occupational safety For Fortum, excellence in safety is the foundation of the company’s business and an absolute prerequisite for efficient and interruption-free production. Fortum strives to be a safe workplace for the employees, contractors and service providers who work for the company. For Fortum, the Sustainability Policy, the Minimum Requirements for EHS Management and more detailed EHS manuals steer the work. For Uniper, the most important tools guiding safety efforts are the HSSE & Sustainability Policy Statement and the HSSE and Sustainability Improvement Plan. A certified OHSAS 18001 or ISO 45001 safety management system covers 98.8% of Fortum’s power and heat production worldwide.
New tools were implemented in 2020 to improve occupational safety in pandemic conditions. Fortum, excluding Uniper, created a concept for virtual safety walks to replace physical visits at the sites, the goal being to reinforce positive safety behaviour and raise safety awareness. In addition, guidelines for safe remote working were issued, including tips on how to ensure fire safety at home as well as paying attention to ergonomics.

OPERATING AND FINANCIAL
REVIEW
CONSOLIDATED FINANCIAL
STATEMENTS NOTES KEY
FIGURES
PARENT COMPANY FINANCIAL
STATEMENTS
SIGNATURES FOR THE OPERATING AND FINANCIAL REVIEW AND
FINANCIAL STATEMENTS AUDITOR’S
REPORT
KEY FIGURES
2011–2020
QUARTERLY FINANCIAL
INFORMATION INVESTOR
INFORMATION 2255
Financial performance and position Sustainability Risk management Fortum share and shareholders
In 2020, Fortum’s Lost Time Injury Frequency (LTIF) for own personnel and contractors was 1.3. Fortum strives for zero severe occupational accidents. In 2020, there was one severe occupational accident in the operations. In September 2020, an employee of Uniper was fatally injured by an electrical shock while working on a switchgear upgrade project at a customer’s premises in Germany. A comprehensive investigation was conducted to determine the incident’s circumstances and root causes. Specific actions resulting from the investigation are in the process of being implemented.
Fortum, excluding Uniper, applies three internal control points covering its EHS processes. These include the quality of the investigation process of occupational accidents, major EHS incidents, and serious near misses; the GAP index; and the Contractor Safety Improvement index, all measured on a scale of 1–5, with five indicating the highest maturity level.
In 2020, the quality of the investigation process of occupational accidents, major EHS incidents, and serious near misses was at a very good level of 4.0.
In 2020, the GAP index was at the desired level of 3.0. The GAP index measures how well Fortum’s, excluding Uniper, EHS minimum requirements are realised at the power plant level.
The Contractor Safety Improvement index was at a very good level of 4.0 in 2020. The Contractor Safety Improvement index measures how well Fortum, excluding Uniper, has managed to implement measures targeting improvements in contractor safety.
In 2020, Fortum, excluding Uniper, launched new mandatory online training addressing the most important safety requirements expressed in the updated Safety and Security Handbook. In addition, online courses were offered in chemical safety and the use of safety walks to support the safety culture. More than 200 managers participated in training on how to conduct a virtual safety walk utilising a smartphone. Uniper provides safety leadership training to all newly hired senior managers and to current senior managers as a periodic refresher.
Personnel wellbeing Fortum’s goal regarding workplace wellbeing activities is to promote the health and occupational safety of employees and the functionality of the work community. Employees have access to a wide range of services, from medical check-ups to exercise and coaching programmes also addressing stress management and mental wellbeing.
In 2020, the company’s efforts focused on safeguarding personnel from the Covid-19 pandemic and supporting their physical and mental wellbeing in the exceptional conditions. At the beginning of the pandemic, coordination teams consisting of senior management were established in both Fortum and Uniper to closely monitor the development of the pandemic and its effects on the companies’ operations and personnel, and to agree on related actions.
Examples of measures to combat the Covid-19 pandemic include remote working in those positions in which a physical presence is not required, as well as on-site work with special arrangements, such as staggered arrival, breaks and lunch, maintaining physical distance, use of face masks and enhanced cleaning.
Travel restrictions have been in place since March 2020. Several measures have been implemented to support employees working remotely; examples include cloud-based IT solutions and HR processes that support flexible, mobile work arrangements. Also virtual wellbeing services and events have been offered to employees. More than 80% of Fortum personnel, excluding Uniper, felt that they are well informed and supported when working remotely, according to an employee survey.
In 2020, the percentage of sickness-related absences was 2.9. The figure excludes Uniper.
Society
Customer satisfaction Fortum’s performance regarding reputation and customer satisfaction, excluding Uniper, is monitored annually. In 2020, the combined reputation index of all stakeholder groups based on the One Fortum Survey was 72.5 points, on a scale of 0–100, and the customer satisfaction index (CSI) was, depending on the business area, between 61 and 81 points, on a scale of 0–100. Fortum’s overall reputation improved slightly, with all-time high results from employees; however, a negative development was seen amongst NGOs and opinion influencers especially in Finland.
One of Fortum’s top priorities at the beginning of the Covid-19 pandemic was to ensure interruption-free customer service while enabling employees in call centres to shift to remote work as swiftly as possible. To support this, several new technical solutions were implemented successfully, and the company was able to maintain good quality services for customers during this major change in ways of working.
Supply chain Fortum and Uniper expect their business partners to act responsibly and to comply with the requirements set forth in their respective Codes of Conduct and Supplier Codes of Conduct. Fortum assesses the performance of its business partners with supplier qualification and supplier audits. In 2020, Fortum, excluding Uniper, conducted a total of four on-site supplier audits in India, Indonesia, China and Finland. Due to the Covid-19 pandemic and travel restrictions, the possibilities to conduct on-site supplier audits have been limited since March 2020. Consequently, Fortum, excluding Uniper, conducted two remote audits in 2020: one of a Finnish supplier and one of a Dutch supplier. Uniper applies its own processes for ESG Due Diligence and Know Your Counterparty. Both companies are members of the Bettercoal Initiative and use the Bettercoal tools to improve sustainability in the coal supply chain.
Human rights Fortum follows and respects internationally recognised human rights, which are included in the key human rights treaties. Respect for human rights is expressed in both Fortum’s and Uniper’s Codes of Conduct and Supplier Codes of Conduct. The UN Guiding Principles on Business and Human Rights are taken into account in own operations and in supply chain management.
Fortum, excluding Uniper, conducts a human rights assessment for investment projects – especially in new operating areas – and also for new countries where Fortum plans to expand the sales of products and services. In 2020, five of these assessments were made.
Uniper annually performs a worldwide assessment, which is based on a combination of economic and social indexes, to map key potential country-specific issues that may directly affect the company. The assessment findings contribute to the implementation of modified due diligence requirements and mitigation measures, such as the inclusion of specific contract clauses.

OPERATING AND FINANCIAL
REVIEW
CONSOLIDATED FINANCIAL
STATEMENTS NOTES KEY
FIGURES
PARENT COMPANY FINANCIAL
STATEMENTS
SIGNATURES FOR THE OPERATING AND FINANCIAL REVIEW AND
FINANCIAL STATEMENTS AUDITOR’S
REPORT
KEY FIGURES
2011–2020
QUARTERLY FINANCIAL
INFORMATION INVESTOR
INFORMATION 2266
Financial performance and position Sustainability Risk management Fortum share and shareholders
Corporate citizenship Fortum, excluding Uniper, launched a Corporate Social Responsibility (CSR) programme to steer its support to society and co-operation with local communities. The programme’s focus areas, aligned with the company’s strategic targets, are Climate, People and Material Revolution. A new CSR programme Governance Model Group Instruction was approved. Steering of CSR activities was concentrated to a Fortum-wide Steering Group.
During the Covid-19 pandemic, Fortum has supported local communities, e.g. by providing face masks to local communities, including health care workers in Russia, Poland, Latvia and India. Uniper provided 5,100 face masks for public transportation customers in Düsseldorf, Germany. Fortum also supported charity organisations in order to help its local communities during the pandemic. In addition, Fortum engages in collaboration with universities through different research and development projects. In 2020, Fortum’s, excluding Uniper, support for activities promoting the common good totalled approximately EUR 2.5 million. In addition, the grants awarded by Fortum and Neste Foundation (earlier Fortum Foundation), not part of Fortum Group, totalled EUR 612,500.

OPERATING AND FINANCIAL
REVIEW
CONSOLIDATED FINANCIAL
STATEMENTS NOTES KEY
FIGURES
PARENT COMPANY FINANCIAL
STATEMENTS
SIGNATURES FOR THE OPERATING AND FINANCIAL REVIEW AND
FINANCIAL STATEMENTS AUDITOR’S
REPORT
KEY FIGURES
2011–2020
QUARTERLY FINANCIAL
INFORMATION INVESTOR
INFORMATION 2277
Financial performance and position Sustainability Risk management Fortum share and shareholders
Risk management
Risk management framework and objectives
The Group Risk Policy provides a risk management framework for Fortum, the purpose of which is to support business in managing risks effectively and to ensure compliance with relevant regulations. The Group Risk Policy includes an overview of Fortum’s risk management systems consisting of the general principles of risk management, the main features of the risk management process and responsibilities for managing and controlling risks within the Group.
The risk management systems have been designed to support Fortum’s Board of Directors, Audit and Risk Committee, Fortum’s Executive Management as well as the operative business in fulfilling their duties in relation to risk management. The objectives of the risk management systems are to:
• support Fortum Executive Management (FEM) in the development of the strategy, • support business in strategy execution, • support business in achieving agreed targets within acceptable risk levels so that the Group’s ability to
meet financial commitments is not compromised, • ensure the understanding of the Group’s material risks and uncertainties , and • the prevention of accidents that can have a severe effect on the health and safety of employees or third
parties, and incidents that can have a material impact on Fortum’s assets, reputation or the environment.
Risk management organisation
Fortum’s Board of Directors approves the Group Risk Policy and the President and CEO approves Fortum, excluding Uniper, risk instructions covering commodity market risks, counterparty credit risks, and operational risks as well as instructions for compliance management, EHS management, treasury and the governance framework for cyber and information security risks all of which are aligned with the Group Risk Policy. Fortum’s Divisions and Corporate Functions, issue risk manuals and guidelines as needed which detail how the Group Risk Policy and relevant risk instructions are implemented within their organisations.
Uniper remains a separate listed company operating under German law and regulations with its own risk management systems including a set of risk policies which define the risk management organisation principles, processes and responsibilities for managing risks. Uniper does therefore not directly apply the risk management systems applicable to Fortum’s other Divisions and Corporate Functions. The risk management systems of Uniper including the key risk management principles and processes are materially in line with those of the rest of Fortum. The target is to further align the risk management systems going forward. For more information about Uniper’s risk management systems, please see Uniper’s annual report.
Risk Governance
The main principle is that risks are managed at source meaning that each Division and Corporate Function Head, as well as Uniper’s Management Board, is responsible for managing risks that arise within their business operations.
Fortum’s Audit and Risk Committee (ARC) is responsible for monitoring the efficiency of the company’s risk management systems and for annually reviewing the Group Risk Policy and the Group’s material risks and uncertainties. Corporate Risk Management, a function headed by the Chief Risk Officer (CRO) reporting to the CFO, provides instructions, methods and tools which support the Divisions and Corporate Functions, excluding Uniper, in running an efficient risk management process. Corporate Risk Management is responsible for assessing and reporting on the maturity of risk management in Divisions and Corporate Functions and for providing independent monitoring and reporting of the Group’s material risk exposures to Fortum Executive Management (FEM), the ARC and the Board of Directors. Risk control functions and controllers in the business monitor and report risks to the CRO.
Uniper, a separate listed company operating under German law and regulations, is consolidated to Fortum’s balance sheet and income statement, and reported as a separate segment. Four out of the six shareholder representatives on the Supervisory Board have been appointed by Fortum. Any changes to the risk management systems which are considered to be material within the governance framework of Uniper, are reviewed by the Audit and Risk Committee of Uniper and informed to the Supervisory Board of Uniper.
Corporate Risk Policy Structure
President and CEO
Approving body Reviewing Body
Board of Directors
Division / Corporate Function Head
Audit and Risk Committee
CFO
CRO
GroupRisk Policy
GroupRisk Instructions
Division / Corporate FunctionRisk manuals and Guidelines

OPERATING AND FINANCIAL
REVIEW
CONSOLIDATED FINANCIAL
STATEMENTS NOTES KEY
FIGURES
PARENT COMPANY FINANCIAL
STATEMENTS
SIGNATURES FOR THE OPERATING AND FINANCIAL REVIEW AND
FINANCIAL STATEMENTS AUDITOR’S
REPORT
KEY FIGURES
2011–2020
QUARTERLY FINANCIAL
INFORMATION INVESTOR
INFORMATION 2288
Financial performance and position Sustainability Risk management Fortum share and shareholders
Risk management process
Uniper operates a separate risk management process from the rest of Fortum which follow similar principles.
Both risk management processes are designed to support effective risk management and ensure that risks are regularly monitored and followed-up. The risk management processes consist of identification, risk assessment, response and control processes and procedures. Identification is regularly carried out according to a structured process which includes analysis of root causes of the risk and consequences should the risk materialise. Risks are assessed in terms of impact and likelihood or probability of the risk realising. Impact is primarily assessed in monetary terms in relation to forecasted earnings and / or cash flows, but also in terms of health and safety, environment and reputation where relevant. Identified risks have a risk owner responsible for implementing actions to respond to the risk. Risk responses can be to accept, avoid, mitigate or transfer the risk. Risk control processes and procedures, which include validating, monitoring, aggregating and reporting risks, are designed to ensure compliance with relevant external regulations and recommendations as well as with internal policies, instructions, manuals and guidelines. This includes strict controls to ensure that risk exposures remain within approved limits and mandates related to, for example, credit and market risks.
Risk factors
Fortum is exposed to a number of financial, operational, strategic, and sustainability-related risks both directly and indirectly through its subsidiaries, associated companies, and joint ventures. The associated companies and joint ventures have their own risk management systems. The principal associated companies and joint ventures are TVO, Forsmarks Kraftgrupp AB, Kemijoki Oy, TGC-1, and Stockholm Exergi AB. For more information about these indirect risk exposures, please see each respective company’s annual report.
Strategic risks The main strategic risks are that energy policy, regulation, technology or the business environment develop in ways that have not been foreseen and prepared for. Future energy market and regulation scenarios, including the impact of these to Fortum's business, are continuously assessed and analysed.
Risks which could hinder Fortum in executing its strategy are continuously assessed, monitored and reported as part of the strategy work.
IdentifyRoot causes
and consequences
AssessImpact
andlikelihood
RespondAccept, avoid,
mitigate or transfer
ControlMonitor
and report
Fortum’s
Risks
Stra
tegic
Sustainability
Operational
Financia
l
EHS & SocialInvestments &
Acquisitions
BusinessEnvironment
Technology
Energy Policy & Regulations
Property, Plant &
Equipment
Systems & Processes
Business Ethics& Compliance
Taxation
Commodity Markets & Fuels
Currency &Interest Rates
Cyber & Information
Security
Liquidity &RefinancingCounter-
party & Credit

OPERATING AND FINANCIAL
REVIEW
CONSOLIDATED FINANCIAL
STATEMENTS NOTES KEY
FIGURES
PARENT COMPANY FINANCIAL
STATEMENTS
SIGNATURES FOR THE OPERATING AND FINANCIAL REVIEW AND
FINANCIAL STATEMENTS AUDITOR’S
REPORT
KEY FIGURES
2011–2020
QUARTERLY FINANCIAL
INFORMATION INVESTOR
INFORMATION 2299
Financial performance and position Sustainability Risk management Fortum share and shareholders
Business Environment Fortum operates in a global business environment and is therefore exposed to political and other risks which affect the macroeconomic development and consumer behaviour in the markets where Fortum operates. As operations expand to new geographical regions, markets and businesses, the operating environment becomes more complex and these risks may increase. The current trend of nationalistic policies and protectionism may lead to trade restrictions or imposed sanctions which in turn could affect demand for Fortum’s products and services, asset values and financing. Fortum continuously monitors how the business environment develops in its operating countries in order to be able to react quickly to market shifts and changes in consumer behaviour.
Investment and acquisition risks Fortum is the majority shareholder of Uniper, a separate listed company operating under German regulation, with an ownership of 76.1% as per 31 December 2020. The companies have initiated strategic alignment and agreed to co-operate in a number areas including physical trading and optimisation of Nordic hydro operations, jointly developing a portfolio of solar and wind projects in Europe and a joint growth strategy in hydrogen. The benefits from these and other areas of co-operation are estimated to be in the range of MEUR 50-100 annually materialising during the period 2023 to 2025. The ability of Fortum to deliver on its strategic targets and achieve the expected benefits depends on successful strategy execution and co-operation between the two companies.
Fortum has ruled out a domination and profit & loss transfer agreement or squeeze out of minority shareholders at least until the end of 2021, with Uniper continuing as a separate listed company operating under German regulation under these circumstances. In the event that such steps would be made at a later stage, and if that would lead to a potential full merger of the companies, it would entail both increased risks and opportunities. The risks and opportunities related to the potential integration of business operations could include. creating a common culture, realizing cost and revenue synergy benefits, combining operating models of the two companies, and motivating and keeping key personnel during the integration phase.
Fortum is continuously assessing its’ business portfolio and evaluates opportunities for acquisitions, investments and divestments primarily in the Nordic, EU and Russian markets. As part of the updated strategy, Fortum has announced a number of growth areas for future investments including a sizeable renewables portfolio. Even if Fortum is able to identify candidates for acquisition or investment, it may be difficult to complete transactions. Competition for acquisitions or greenfield investments could limit Fortum's ability to grow or could raise the prices and make them less attractive to Fortum. Furthermore, Fortum has initiated a strategic review of the heating and cooling businesses in the Baltics and Poland, it’s 50% stake in Stockholm Exergi and the Consumer Solutions business. The ongoing Covid-19 pandemic has led to increased uncertainty about macroeconomic development and possible impact on future regulation. As a result, there may currently be less potential investors which could lead to planned divestments being postponed or not being carried out as planned.
Risks related to acquisitions, divestments and investments are managed as part of the investment process. The Investment Manual includes requirements for risk identification, assessment and action plans for mitigating identified risks before investment decisions are made. It also sets requirements to follow-up risks in projects and acquisitions. Risks in large projects are mitigated through contract structures and insurance coverage. Partner risk assessments are performed before entering into joint ventures or other material partnership agreements. There is also a country entry process which includes a country risk assessment before decisions to enter into a new market can be made.
Energy policy and regulation risks The energy sectors is heavily influenced by national and EU-level energy policies and regulations. Fortum’s strategy has been developed based on scenarios of the future development of the regulatory environment in both existing and potential new businesses and market areas. The overall complexity and possible regulatory changes in the various operating countries pose a risk if Fortum is not able to anticipate, identify and manage those changes efficiently.
Fortum maintains an active dialogue with different bodies and stakeholders involved in the development of laws and regulations in order to manage these risks and proactively contribute to the development of the energy and climate policy and regulatory framework.
EU, Nordics and UK Fortum has to manage risks related to both EU regulation and national regulation in the countries where we operate. Key risks related to the future energy, circular economy and climate policy framework development are listed below.
• Reaching the established (EU and national) decarbonization targets requires that all CO2 free energy production technologies are treated equally in legislation and that there is political acceptance for them to play a role in decarbonization. Despite being CO2 free production technologies, there is a risk that some technologies are preferred for reasons other than their CO2 footprint, leading to uneven playing field between different production forms.
• Growing acceptability issues relating to various energy forms and energy technologies create uncertainty and risks for planned investments. Increasing and broadening sustainability requirements e.g. in the context of the EU Sustainable Finance taxonomy could lead to a situation where a big part of Fortum’s CO2 free or low carbon energy production is classified as non-sustainable which might lead to higher capital costs for new investments. Similarly, there is a risk that technologies or activities not regarded as sustainable in the context of taxonomy will be excluded from the EU and national financing schemes.
• National climate policies or steering mechanisms that exceed the EU climate targets can lead to policy overlaps. Policy overlaps risk diluting the EU emissions trading system (the ETS) and creating inefficiencies based on uncoordinated national non-market-based carbon reduction mechanisms. This in turn could lead to inefficiencies for Fortum in execution of its strategy. In addition, lower carbon prices may lead to decreased profitability of carbon-free assets.
• In the context of national climate strategies several countries have decided to phase out certain energy production technologies such as coal and nuclear. In case such political decisions are done without offering sufficient compensation to investors/asset owners there is a risk of lost earnings as well as dismantling costs. Following the coal exit law in Germany coming into effect in August 2020, the coal exit paths and conditions are now largely determined in most European countries where Fortum operates coal plants. Consequently the financial uncertainty which existed for Uniper around such exits has reduced significantly. The residual risk in Germany stems from the coal exist law having agreed review points, which could result in the German government deciding to shorten the runtime of Datteln 4. In the Netherlands, the Dutch government is proposing additional measures for coal-fired plants as a result of the Urgenda Verdict to achieve the greenhouse gas reduction targets. These measures for coal-fired power production restrictions could affect the Maasvlakte3 plant for the years 2021 to 2024 although compensation by the Dutch government is expected.

OPERATING AND FINANCIAL
REVIEW
CONSOLIDATED FINANCIAL
STATEMENTS NOTES KEY
FIGURES
PARENT COMPANY FINANCIAL
STATEMENTS
SIGNATURES FOR THE OPERATING AND FINANCIAL REVIEW AND
FINANCIAL STATEMENTS AUDITOR’S
REPORT
KEY FIGURES
2011–2020
QUARTERLY FINANCIAL
INFORMATION INVESTOR
INFORMATION 3300
Financial performance and position Sustainability Risk management Fortum share and shareholders
• National investment schemes and support systems for new renewable energy production such as offshore wind may lower the profitability of incumbent electricity production and lead to market distortions.
• Tightening emission standards, restrictions or taxation of waste incineration and increasing tax burden on heating fuels can also negatively impact Fortum’s targeted earnings in the future.
The inter-linkage of these issues create uncertainty as changes in policies in one area could undermine the effects of policy changes in other areas.
Russia Fortum’s business in Russia is exposed to political, economic and social uncertainties and risks resulting from changes in regulation, legislation, economic and social upheaval and other similar factors. Among the more significant risks are those arising from the establishment or enforcement of foreign exchange restrictions, which could effectively prevent Fortum from repatriating profits or liquidating assets, and changes in tax regulations or enforcement mechanisms, which could substantially reduce or eliminate any revenues derived from operations and reduce significantly the value of assets related to such operations.
The ongoing political tensions between the EU, U.S. and Russia and the unpredictable nature of the threat of sanctions pose a risk for Fortum. Transactions from Russian units, Uniper’s global trading business, as well as Uniper’s financing of the Nord Stream 2 project, are the main sources of potential sanctions risk. The imposition of any further sanctions, may have a direct and indirect impact on the business environment and may negatively affect the operations and value of certain investments in Russia. Fortum actively monitors the situation in order to ensure continued compliance with prevailing rules and applicable sanctions laws.
The main energy policy-related risks in Russia are linked to the development of the whole energy sector which to a large extent is regulated. Regulated sectors are inherently exposed to a risk of regulatory changes which could affect Fortum’s operations.
Technology risks Fortum’s strategy includes investing in new or not yet commercially viable technologies, such as hydrogen production, which will support the transition towards a future low-carbon economy as well as developing circular economy solutions, bio-economy, other renewable energy concepts and innovative solutions for its customers There are risks inherent in investing in new technologies including if and when these will become economically viable and protecting intellectual property rights. Technology risks are managed by assessing and monitoring the viability of new technology throughout its development cycle, and selectively developing and investing in a diversified portfolio of projects consisting of different technologies.
Sustainability risks Corporate social responsibility and sustainable development are integral parts of Fortum’s strategy. Fortum gives balanced consideration to economic, environmental and social responsibility aspects. Changes to laws, regulations and the business environment, including the views of our main stakeholder, can pose a risk if not identified and managed effectively. In order to identify and manage these risks, Fortum endorses a number of international voluntary charters, standards and guidelines in the area of sustainability, conducts stakeholder surveys annually in order to identify the most material issues for our stakeholders, engages with non-governmental organisations and has defined internal policies and instructions on how to conduct business.
Environmental, health and safety and social risks Operating power and heat generation plants, gas transmission and storage facilities and circular economy services involves the usage, storage and transportation of fuels and materials, including hazardous waste, that can have adverse effects on the environment and expose personnel, contractors and third parties to safety risks. Assessment of environmental risks and preparedness to operate in exceptional and emergency situations follows legislative requirements as well as the requirements in the environmental management standard (ISO 14001). The same approach, based on the requirements in the operational health and safety standard (OHSAS 18001 or ISO 45001), applies to risks related to occupational health and safety and how to operate in emergency situations.
Environmental, health and safety (EHS) risks as well as social risks related to the supply chain are evaluated through supplier qualification as well as internal and external audits and risk assessments including partner and country risk assessments. Corrective and preventive actions are implemented when necessary. EHS and social risks related to investments are evaluated in accordance with Fortum’s Investment Manual. Environmental risks and liabilities in relation to past actions have been assessed and, where necessary, provisions have been made for future remedial costs. As a separate listed company Uniper applies its own processes aligned with its enterprise risk management to systematically identify, assess and manage Environmental, Social and or Governance (ESG) risks.
Tax risk Tax risk refers to the risk associated with changes, errors or disagreements in the interpretation of applicable tax laws, changes in operations, long-term profitability or changes in tax laws in one or multiple countries which could result in increased charges or financial loss. Fortum operates in a number of countries and is therefore exposed to these events in multiple countries. These risks may materialise through a tax authority initiated process followed by a legal process in one or multiple jurisdictions with a court confirming valid interpretation of local or EU law or tax treaties. In case multiple countries are involved, it may result in a mutual agreement process defining the final stand in the case. A legal process may result in a tax assessment of deductibility, income recognition or applicable tax rate on withholding in a business transaction. Risk may materialise also by a revaluation of tax related assets, so called deferred tax assets, and liabilities due to changes in operations or tax law.
Fortum manages tax-related uncertainties by targeting tax predictability for the business operations in all our operating countries. As risk mitigation actions, we have identified simplifying legal structures, improving data management, seeking strategic clearance from tax authorities, improving transparency, improving resources and reviewing accountabilities and responsibilities.
Business ethics and compliance risks Fortum’s operations are subject to laws, rules and regulations set forth by the relevant authorities, exchanges, and other regulatory bodies in all markets in which Fortum operates. Fortum aims to comply with all relevant laws, rules and regulations, but the ability to operate in certain countries may be affected by future changes to local laws and regulations.
Since Fortum trades financial instruments, it is exposed to risks arising from the implementation and amendment of financial market regulations and directives that affect Fortum, such as the European Market Infrastructure Regulation (EMIR), the Regulation on Energy Market Integrity and Transparency (REMIT) and the Markets in Financial Instruments Directive (MiFiD II). Potential changes to existing financial market regulation could significantly increase administrative burdens and result in the need for additional liquidity.

OPERATING AND FINANCIAL
REVIEW
CONSOLIDATED FINANCIAL
STATEMENTS NOTES KEY
FIGURES
PARENT COMPANY FINANCIAL
STATEMENTS
SIGNATURES FOR THE OPERATING AND FINANCIAL REVIEW AND
FINANCIAL STATEMENTS AUDITOR’S
REPORT
KEY FIGURES
2011–2020
QUARTERLY FINANCIAL
INFORMATION INVESTOR
INFORMATION 3311
Financial performance and position Sustainability Risk management Fortum share and shareholders
Fortum’s operations in a variety of jurisdictions expose Fortum to various legal risks. These mainly comprise risks arising from threatened or pending legal proceedings regarding contract and price adjustments in connection with long-term supply or sales contracts, energy law and regulatory issues, licensing matters, liabilities arising from acquired companies as well as supplier disputes or disputes related to investment agreements.
Fortum systematically identifies, assesses, mitigates and reports compliance risks including risks related to business ethics as part of the risk management process. Effective internal controls are a key mitigating activity and have been implemented to prevent the possibilities of unauthorised activities or non-compliance with relevant policies and instructions. Furthermore, continuous training and communication play a key role in increasing the awareness and ensuring the understanding of the importance of business ethics and compliance in the organisation. Regular trainings include mandatory e-learnings to ensure coverage throughout the organisation.
Uniper has a separate Code of Conduct and Supplier Code of Conduct from the rest of the Fortum Group, both of which stress the importance of business ethics for all employees, contractors and partners. Zero tolerance for corruption and bribery is highlighted in the Codes of Conduct and Supplier Codes of Conduct. In addition, separate instructions and guidelines have been created to address e.g. anti-bribery, compliance management, safeguarding company assets, conflict of interest, anti-money laundering and competition law. Both companies have procedures for anti-corruption including prevention, oversight, reporting and enforcement based on the requirements prescribed in international legislation. The Supplier Codes of Conduct set sustainability requirements for suppliers of goods and services. The Supplier Codes of Conduct are based on the ten principles of the United Nations Global Compact.
Financial risks
Commodity market and fuel risks Fortum’s business is exposed to fluctuations in prices and availability of commodities used in the production, transmission and sales of energy products. The main exposure is toward electricity prices and volumes, gas prices and volumes, prices of emissions and prices and availability of fuels. Fortum hedges its exposure to commodity market risks in order to reduce volatility in cash flow and to increase the predictability of future results. For further information on hedge ratios, sensitivities and outstanding derivatives contracts, see Note 4 Financial risk management.
Electricity price and volume risks Fortum is exposed to electricity market price movements and volume changes mainly through its power and heat generation.
In the Nordics and central European countries, market prices and, consequently, the amount of profitable production exhibit significant variation on the back of several factors, for instance, but not limited to weather conditions, outage patterns in production and transmission lines, CO2 allowance prices, fuel prices, as well as the amount of electricity demand. Electricity price risks in the Nordics and central European markets are mainly hedged by entering into electricity derivatives contracts on exchanges such as the Nasdaq Commodities exchange or the European Energy Exchange as well as directly with counterparties active in the energy and financial markets.. The ability to efficiently implement hedging strategies is dependent on a well-functioning and liquid derivatives market. There is a risk of decreasing liquidity of especially Nordic electricity derivatives on the Nasdaq Commodities exchange. Alternatives including use of OTC derivative contracts and correlated products traded on other exchanges are used to mitigate this risk. The Generation segment and Uniper segment have separate hedging strategies covering several years in the short to medium term. Hedging strategies are continuously evaluated as electricity and other commodity market prices, the hydrological balance and other relevant parameters change. Hedging of the Generation segment’s power sales is performed in EUR on a Nordic level covering both Finland and Sweden, and the currency component of these hedges in the Swedish entity is currently not hedged. Uniper’s Nordic power hedging is performed only in Sweden and the currency component of these hedges in the Swedish entity is hedged.
In Russia, electricity and capacity prices are the main source of market risk. Capacity from newer units is sold under capacity supply agreements where the price is set by the Russian Federation to ensure the return on investments. Capacity from old units has been sold until 2024 via capacity supply auctions which have already been conducted.
Electricity price exposure is partly mitigated through regulated fixed-price bilateral agreements, but the majority of electricity sales is exposed to spot price risk. In the short-term, electricity prices and volumes are mainly impacted by changes in industrial demand, gas prices and weather-driven demand changes. As a result of the Covid-19 pandemic and temporary restrictions in the oil and gas industry following the OPEC+ decisions, closure of many factories and industries caused a significant decline oil production, followed by lower electricity consumption.
Gas prices and volumes Long-term gas supply contracts of Uniper generally include the possibility for the customer and the supplier to adapt contractual terms to changed market conditions.
This entails the major risk for Uniper that suppliers will impose conditions that are detrimental. In order to limit the risk, negotiations are conducted by the most experienced employees utilizing all available internal and external expertise.
A deterioration in the economic situation or upheavals in the market for LNG could lead to a lower than planned utilization of the long-term capacity booked in the regasification plants in Uniper’s LNG business and make it necessary to set up provisions for onerous contracts over the entire remaining booking period. Uniper strives to further increase the utilization of this booked capacity and thus improve the revenue situation.
Emission and environmental value risks The European Union and the United Kingdom have emissions trading schemes to reduce the amount of CO2 emissions. In addition to the emissions trading schemes, there are other trading schemes in environmental values in place in Sweden, Norway and Poland. Part of Fortum’s power and heat generation is subject to requirements of these schemes. There is currently no trading scheme in Russia for emissions or other environmental values. However, Russia has announced intentions to comply with the Paris Agreement, but there is uncertainty related to how and when a possible carbon market could be implemented.
The main factors influencing the prices of CO2 emission allowances and other environmental values are political decisions and the supply and demand balance. Fortum hedges its exposure to these prices and volumes through the use of CO2 derivatives and environmental certificates.
Fuel price and volume risks Power and heat generation requires use of fuels that are purchased on global or local markets. The main fuels used by Fortum are natural gas, uranium, coal, various biomass-based fuels and waste. The main risk factor for fuels that are traded on global markets such as coal and natural gas, is the uncertainty in price. Prices are largely affected by demand and supply imbalances that can be caused by, e.g. increased demand growth in developing countries, natural disasters or supply constraints in countries experiencing political or social unrest. For fuels that are sourced on local or regional markets, such as bio-fuels, the volume risk in terms of availability of the raw material of appropriate quality is more significant as there may be a limited number of suppliers. Due to the current sanctions, there are also risks related to imported fuels from Russia.

OPERATING AND FINANCIAL
REVIEW
CONSOLIDATED FINANCIAL
STATEMENTS NOTES KEY
FIGURES
PARENT COMPANY FINANCIAL
STATEMENTS
SIGNATURES FOR THE OPERATING AND FINANCIAL REVIEW AND
FINANCIAL STATEMENTS AUDITOR’S
REPORT
KEY FIGURES
2011–2020
QUARTERLY FINANCIAL
INFORMATION INVESTOR
INFORMATION 3322
Financial performance and position Sustainability Risk management Fortum share and shareholders
The exposure to fuel price risk is mitigated through fixed- price physical delivery contracts or derivative contracts. The main fuel source for heat and power generation in Russia is natural gas which is partially regulated limiting the price risk exposure. Long-term gas supply contracts are concluded with gas suppliers to ensure gas availability for power plants.
Liquidity and refinancing risks Fortum's business is capital intensive and there is a constant need to ensure efficient financing. Fortum maintains a diversified financing structure in terms of debt maturity profile, debt instruments and geographical markets. Liquidity and refinancing risks are managed through a combination of cash positions and committed credit facility agreements. The credit risk of cash positions has been mitigated by diversifying the deposits to high-credit quality financial institutions and issuers of corporate debt.
Fortum Corporation is currently rated BBB with a negative outlook by both Fitch and Standard & Poor’s (S&P) rating agencies. The key risk factors which could lead to a weakening credit metrics and potentially trigger rating downgrade include a continuing decline in European and Russian power prices, lower-than-expected amounts received from planned divestments and an increase in leverage A lowering of credit ratings, in particular to below investment grade level (BB+ or below) could affect access to the capital markets and increase the costs of new financing.
Uniper, a separate listed company operating under German laws and regulations, is currently also rated BBB with a negative outlook by S&P. The negative outlook on Uniper’s rating reflect the negative outlook on the BBB rating of Fortum, which serves as a cap for Uniper’s rating. A downgrade of Fortum’s rating could lead to a corresponding downgrade of Uniper’s rating. A downgrade from the current BBB investment grade rating to BBB- or below could negatively affect Uniper’s liquidity as it would trigger counterparties’ – particularly in the trading business – right to demand additional collateral which would need to be provided via liquid assets or bank guarantees. The related risk is measured, monitored and managed against a given limit.
Fortum is targeting to maintain at least its current rating and to strengthen its financial profile and to improve its business risk profile. Fortum and Uniper maintain an active dialogue with credit rating agencies to ensure understanding of Fortum and Uniper’s aligned strategy and planned measures which target to achieve a financial and business profile that supports the current rating.
Currency and interest rate risks Fortum’s debt portfolio consists of interest-bearing liabilities and derivatives on a fixed- and floating-rate basis with differing maturity profiles. Fortum is exposed to cash flow risk from changes in interest rates mainly from interest-bearing liabilities and derivatives on a fixed- and floating rate basis. Additionally changes in general interest rate levels may have an impact on discount rates of various provisions like pension provisions and asset retirement obligations causing changes in amount of interest-bearing debt and finance net, but without a cash flow impact. Fortum manages the interest rate exposure through a duration mandate of the loan portfolio excluding leasing liabilities and provisions, and cash flow at risk limit. Fortum uses different types of financing contracts and interest rate derivative contracts to manage the interest rate exposure and evaluates and develops the strategies in order to find an optimal balance between risk and financing cost.
Fortum has cash flows, assets and liabilities in currencies other than EUR and is therefore exposed to fluctuations in exchange rates. Currency exposures are divided into transaction exposures (foreign exchange exposures relating to contracted cash flows and balance sheet items where changes in exchange rates will have an impact on earnings and cash flows) and translation exposure (foreign exchange exposure that arises when profits and balance sheets in foreign entities are consolidated at the Group level).
The main translation exposure is toward EUR/Russian Rouble ("RUB"), EUR/Swedish Krona ("SEK") and EUR/British Pound Sterling ("GBP"), arising from Fortum's extensive operations in Russia, Sweden and the United Kingdom. Fluctuations of the RUB, SEK and the GBP against the EUR could have an adverse effect on future results and equity when consolidating and translating results and net assets in Russian, Swedish and UK affiliates into euros. Translation exposures in the Fortum Group are generally not hedged as the majority of these assets are considered to be long-term strategic holdings.
Transaction exposure arises mainly from physical and financial trading of commodities, existing and new investments, external and internal financing and shareholder loans within the Group. Fortum hedges major transaction exposures on a local level in the reporting currency of each legal entity in order to avoid exchange differences in the profit and loss statement. An exception is the Generation segment’s hedging of power sales in Sweden where the currency component is currently not hedged.
Centralised treasury functions in Uniper and the rest of the Fortum Group separately coordinate currency risk management and execute external hedges consisting of currency derivative contracts, which are matched against the underlying future cash flow according to maturity. Derivatives are used exclusively to hedge existing foreign exchange risks, not for proprietary trading.
Counterparty and credit risks Fortum is exposed to counterparty risk whenever there is a contractual arrangement with an external counterparty including customers, suppliers, partners, banks, clearing houses and trading counterparties.
Credit risk exposures relating to financial derivative instruments are often volatile and include both the replacement risk and the settlement risk. Exchange-traded derivatives are cleared through central clearing parties (CCPs) or through clearing banks while OTC derivative contracts are concluded directly with a number of different counterparties including energy wholesalers and retailers, utilities, trading companies, energy companies, industrial end-users and financial institutions active in the financial and energy markets.
Due to the financing needs and management of liquidity, Fortum has counterparty credit exposure toward a number of banks and financial institutions. The majority of the exposure is toward Fortum's key relationship banks, which are highly creditworthy institutions. Fortum also has exposure to the Russian financial sector in terms of deposits with financial institutions as well as to banks that provide guarantees for suppliers and contracting parties. Deposits in Russia have been concentrated to the most creditworthy state-owned or controlled banks as well as affiliates of the key relationship banks.
Credit risk exposures relating to customers, suppliers and trading partners is spread across a wide range of industrial counterparties, energy companies, government and municipal entities, utilities, small businesses, housing associations and private individuals over a range of geographic regions. The risk of credit losses in the electricity and heat sales business in Russia is deemed higher than in Fortum’s other operating countries.
In order to manage counterparty credit risk, Fortum has routines and processes to identify, assess and control exposure. Credit checks are performed before entering into commercial obligations and exposure limits are set for larger individual counterparties. Creditworthiness is monitored through the use of internal and external sources so that mitigating actions can be taken when needed. Mitigating actions include demanding collateral, such as guarantees, managing payment terms and contract length, and the use of netting agreements.

OPERATING AND FINANCIAL
REVIEW
CONSOLIDATED FINANCIAL
STATEMENTS NOTES KEY
FIGURES
PARENT COMPANY FINANCIAL
STATEMENTS
SIGNATURES FOR THE OPERATING AND FINANCIAL REVIEW AND
FINANCIAL STATEMENTS AUDITOR’S
REPORT
KEY FIGURES
2011–2020
QUARTERLY FINANCIAL
INFORMATION INVESTOR
INFORMATION 3333
Financial performance and position Sustainability Risk management Fortum share and shareholders
Operational risks Operational risks are unexpected events which can lead to negative monetary, safety, environmental or reputational impacts as a result of inadequate or failed internal processes, systems or equipment, or from external events.
People and Process Risks People risks include an inability to attract and retain the right competences, risks due to the loss of special skills and risks due to errors on the part of employees who have not been sufficiently trained or who are not sufficiently qualified. Specifically, in its commodity trading business, Uniper has particular expertise and key persons which - in case they were to leave - could have a tangible impact on Uniper Global Commodities earnings potential, business continuation, innovation and development. In order to reduce people risks, Fortum invests in the development and distribution of skills and succession planning. In addition, the existing compensation system for employees is regularly reviewed and adjusted.
Process risks are mainly caused by design failures or human errors. Mitigation includes process automation, testing and education. Process-related risks are assessed and controls for the most relevant risks are defined and implemented as part of the internal controls framework. IT-system risk management is based on an IT Service Lifecycle Model, and related processes and practices which has been developed using reference frameworks such as COBIT and ITIL. Business continuity plans are in place for business critical processes.
Property, plant and equipment Operational events at power and heat generation, gas storage and distribution, fuel handling and recycling and waste facilities can lead to environmental and physical damages, business interruption, clean-up costs and third party liabilities Property, plant and equipment risks are primarily managed through condition monitoring and maintenance planning. In addition, Fortum's industrial assets are covered by insurance policies for property damage and business interruption risks which mitigates the impact of internal and external events should they occur.
Hydro power Fortum has large number of hydro power plants and dams in the Nordics and Germany. A dam breach is a serious accident with the threat of possible significant damage downstream. A long-term programme is in place for improving the surveillance of the condition of dams and for securing the discharge capacity in extreme flood situations. Third-party liabilities from dam failures are strictly the plant owner’s responsibility. Together with other hydro power producers, Fortum has a shared dam liability insurance programme in place that covers Finnish and Swedish dam failure liabilities up to SEK 10,000 million.
Nuclear power Fortum owns and operates the Loviisa nuclear power plant and is the owner of OKG AB which owns three nuclear power reactors in Sweden, of which one is in operation. Additionally, Fortum has minority interests in two Finnish and two Swedish nuclear power companies. Any severe accident or nuclear release in nuclear power plants could lead to high costs, environmental damages and third-party liabilities. At the Loviisa power plant, the assessment and improvement of nuclear safety is a continuous process performed under the supervision of the Radiation and Nuclear Safety Authority of Finland (STUK).
Owners of nuclear facilities in Finland and Sweden have statutory liabilities for damages resulting from accidents occurring in those nuclear facilities and for accidents involving any radioactive substance connected to the operation of those facilities. Third-party liability relating to nuclear accidents is strictly the plant operator’s responsibility and must be covered by insurance. In Finland, as the operator of the Loviisa power plant, Fortum has a statutory liability insurance policy of 600M SDR (Special Drawing Right) equivalent of approximately EUR 700 million. In Sweden, legislation requires that operators of nuclear power plants have a liability insurance or other financial cover in the amount equivalent to EUR 1.2 billion per incident.
In both Finland and Sweden, the future costs of the final disposal of spent fuel, the management of low and intermediate-level radioactive waste and the decommissioning of the radioactive part of the nuclear power plant are provided for by a state-established fund to which nuclear power plant operators finance. Contributions to these funds should be sufficient to fully cover expected costs for handling all the produced radioactive waste, but the possibility exists that future costs could exceed currently estimated fund provisions. If this were to occur, Fortum, would be responsible for any such excess costs in relation to its share of operations and assets.
Asset project risks Fortum’s business activities involve construction, modernisation, maintenance and decommissioning of power plants or other energy industry facilities. There is a risk that construction costs exceed planned costs or construction delays occur as the result of regulatory or permit issues, failure of key suppliers, being unable to obtain permits or as a result of Covid-19 discontinuing the project. Asset projects also face environmental, health and safety risks. Asset project risks may realise both for Fortum’s own assets projects, or projects carried out through joint ventures or associated companies. The most significant of these asset projects are listed below.
Managing asset project risk is an integral part of every project. Project managers are responsible for ensuring that project-related risks which may lead to delays, increased costs, negative impacts to the environment or which could jeopardise the health and safety of personnel and contractors are identified and assessed and that actions are taken to minimise such risks.
Datteln 4: Permitting risk Since May 30, 2020, the coal-fired power plant Datteln 4 with a net electrical output of approximately 1,055 MW is in commercial operation. Construction and operation are based on the currently granted immission control permit from the district government of Munster and the project-based development plan No. 105a by the city of Datteln. However, the project continues to be the subject of several administrative lawsuits. If, as a result of the pending legal proceedings, the permit is revoked, or the development plan is declared ineffective, there is the risk that all investments made to date will have to be written off and planned earnings cannot be realised. The coal exit law which entered into force in August 2020 has also not changed the potential for this permitting risk.
Nord Stream 2: Project Failure Risk Uniper is involved in financing the Nord Stream 2 project. As part of this financing, there is a default risk for receivables from Nord Stream 2 AG, particularly in the event the project cannot be completed successfully. The main risk for the completion of the project are actual and potential US sanctions. Current sanctions have only been imposed on a pipelay vessel and its owner. Nord Stream 2 AG confirmed repeatedly that they are working to complete the project.
Olkiluoto 3 project delay risk In Finland, Fortum is participating in the country's fifth nuclear power plant unit, Olkiluoto 3 (OL3), through the shareholding in Teollisuuden Voima Oyj (TVO) with an approximately 25% share representing some 400 MW in capacity. Olkiluoto 3 EPR (OL3 EPR), currently under construction, was procured as a fixed-price turnkey project from a consortium formed by Areva GmbH, Areva NP SAS and Siemens AG. As stipulated in the plant contract, the consortium companies have joint and several liability for the contractual obligations. According to the latest schedule regular electricity production starts in February 2022.
OPERATING AND FINANCIAL
REVIEW
CONSOLIDATED FINANCIAL
STATEMENTS NOTES KEY
FIGURES
PARENT COMPANY FINANCIAL
STATEMENTS
SIGNATURES FOR THE OPERATING AND FINANCIAL REVIEW AND
FINANCIAL STATEMENTS AUDITOR’S
REPORT
KEY FIGURES
2011–2020
QUARTERLY FINANCIAL
INFORMATION INVESTOR
INFORMATION 3344
Financial performance and position Sustainability Risk management Fortum share and shareholders
The risk related to the planned completion refers to a situation in which commercial use cannot be launched as planned, which leads to additional costs of electricity for Fortum. During 2020, several risk management measures related to the OL3 EPR project have been executed to improve TVO’s readiness to commission the OL3 EPR plant. For more information about these measures, please see TVO’s annual report.
Cyber and information security risks Fortum’s business operations and customer related services are dependent on well-functioning IT, communications and information management systems and processes. Due to the nature of the business, large amounts of data are processed, often in real-time, and used for operating critical infrastructure including power stations and gas storage facilities, decision-making, serving customers and in internal and external communication and reporting. Like all operators of critical infrastructure, Fortum is increasingly exposed to cyber security risks, including risks related to information and operational technology systems, digitalisation and privacy. Also, physical attacks against Issuer’s assets are possible and can have material impacts.
Securing information and availability of the systems are essential for Fortum. Cyber and physical security risks, including risks related to information, operation technology (OT) and digitalisation, are managed in collaboration with business and other support functions. There are cyber security instructions and procedures in place which set requirements for managing and mitigating cyber security risks.
Support functions and outsourcing partners are responsible for identifying and mitigating operational IT/OT security related risks as well as managing IT/OT security incidents. Business is responsible for business continuity planning and IT functions are responsible for IT service continuity.
Climate-related risks Mitigating climate change, adapting to it and driving the transition to a lower-carbon economy is an integral part of Fortum’s strategy.
As a result, Fortum has committed to ambitious climate targets and to be carbon-neutral as a Group by 2050 at the latest in line with the goals of the Paris Agreement.
Management of climate-related risks is integrated into Fortum’s and Uniper’s respective risk management frameworks and follows the same governance and processes as for other material risk and uncertainties, Risks are regularly identified and assessed through a structured process. Risk owners are assigned for managing the risks and they are regularly reported and followed-up in various management teams and expert forums. In Fortum, excluding Uniper, there is a specific review of the key climate-related risks by a group of experts from selected functions. These risks are reported to FEM and the ARC as part of the annual review of material risks and uncertainties for the Fortum Group.
Climate-related risks are divided into two categories; transition risks and physical risks. The identified physical risks are generally found in the operational risk category whereas transition risks are generally part of the strategic risk category. As Uniper currently does not apply the same approach to climate-related risks, the transition risks and physical risks described below have been assessed for Fortum, excluding Uniper.
Transition risks Fortum’s strategy is to a large extent built on taking advantage of the opportunities associated with the transition to a low-carbon economy and successfully mitigating the risks. The transition to a low carbon economy poses a number of strategic risks related to changes in energy and climate policy and regulation, technology development and the business environment in which Fortum operates. Additionally, Fortum’s brand and reputation can be negatively impacted by changes in stakeholder perception about Fortum’s ability to deliver on its strategy.
The key risks related to climate policy and regulation include national climate policies or steering mechanisms that exceed EU targets for greenhouse gas reduction, renewable energy production and energy efficiency. This can lead to overlapping or inefficient mechanisms such as diluting the EU emissions trading system (ETS), tighter restrictions on incineration and burning of various fuels and a more regulated electricity market. In the context of national climate strategies, several countries have decided to phase out certain energy production technologies such as coal and nuclear. In case such political decisions are done without offering sufficient compensation there is a risk of write-offs, impairments or early retirement of existing assets as well as social and dismantling costs. Fortum favours a market-based approach to decarbonisation with CO2 pricing as a key tool and clear criteria for capacity remuneration in case such mechanisms are implemented. Additionally, increased demand flexibility is needed to cope with the expected increase in intermittent renewable production.
The transition to a low-carbon economy also poses risks if there emerge new, disruptive technologies that create cheap sources of flexibility or storage in the energy market. Additionally, if there is an accelerated decline in the cost of renewable energy, it could decrease the value of existing conventional power and heat generation assets. Fortum continuously monitors technology development and invests into a broad portfolio of innovative technologies. Fortum aims to grow a sizeable renewables portfolio, focusing on wind and solar primarily in Europe, and therefore monitors the price development of renewables and evaluates both divestment and investment opportunities to optimise the portfolio with the aim of lower carbon emissions. As part of the updated strategy, Fortum is targeting to invest in hydrogen and clean gas solutions. Technological challenges could prevent or slow-down the growth of hydrogen negatively impacting any such investments and delaying the decarbonisation of natural gas and industrial sectors.
Climate-change may affect the demand and supply of energy products due to consumer behaviour and changing weather patterns. This could lead to, e.g. lower and more volatile electricity and gas prices which negatively affect the revenues of power generation assets. Energy efficiency measures and warmer weather may also impact the demand for heating to a larger extent than currently expected.
Increasing and broadening sustainability requirements, e.g. in the context of the EU Sustainable Finance taxonomy, could lead to a situation where a big part of Fortum’s CO2 free or low carbon energy production is classified as non-sustainable which might lead to higher capital costs for new investments. Additionally, there is a risk of increasing activity by NGOs which could affect key stakeholder perception. Fortum’s exposure to these risks is increasing as a result of the consolidation of Uniper as a subsidiary with coal and gas-fired power generation assets. In order to mitigate these risks, Fortum focuses on the sustainability impacts of strategy and business decisions, communicating transparently about strategy implementation to key stakeholders, ensuring a broad base of investors and flexibility in financing. The aligned strategy for the Fortum Group includes a commitment to reduce its’ coal exposure and reach a carbon neutral European generation by 2035 at the latest and reducing CO2 emissions in European generation with at least 50% by 2030.

OPERATING AND FINANCIAL
REVIEW
CONSOLIDATED FINANCIAL
STATEMENTS NOTES KEY
FIGURES
PARENT COMPANY FINANCIAL
STATEMENTS
SIGNATURES FOR THE OPERATING AND FINANCIAL REVIEW AND
FINANCIAL STATEMENTS AUDITOR’S
REPORT
KEY FIGURES
2011–2020
QUARTERLY FINANCIAL
INFORMATION INVESTOR
INFORMATION 3355
Financial performance and position Sustainability Risk management Fortum share and shareholders
Physical risks Fortum’s operations and assets are exposed to external events, the frequency and magnitude of which may increase as a result of climate change. Changes in precipitation, inflows and temperatures may affect hydropower production as well as bioenergy supply and availability. Intense storms with, e.g. flash floods could increase the risk of dam breaches as well as causing local damages and production outages. Warmer weather may also lead to a need for new cooling or process water sources and extreme warm and dry summer periods could result in forest fires which potentially damage assets or lead to grid outages restricting power supply. Fortum adapts its operations to the changing climate and takes it into consideration in production and maintenance planning and in evaluating growth and investment projects. Climate change scenarios are. taken into account in long-term dam safety investments so that extreme flooding situations can be managed.
Covid-19 Risks During 2020, the Covid-19 pandemic resulted in new and partly unexpected risks as societies and governments across the world implemented drastic measures to contain the spread of the disease. As a result, the exposure to risk and uncertainty in all risk categories has increased compared to the 2019 year-end situation. There has been a certain stabilisation and partial recovery of commodity prices in the three last quarters, but market prices for electricity remain lower than at the beginning of 2020 due to lower commodity prices and European demand as well as the extremely wet, warm, and windy winter in the Nordics during the first quarter. Fortum’s hedges, especially for the year 2021, will offer some protection against short-term fluctuations in electricity and other commodity market prices, but if the Covid-19 pandemic continues longer than expected or results in a more severe economic downturn than anticipated, results will be negatively impacted, as the hedge level for future years is lower.
Additionally, there is an increased risk of credit defaults caused by the abrupt shut-down of society in many parts of the world. Fortum has OTC derivative contracts with a number of energy wholesalers and retailers, utilities, trading companies, energy companies, industrial end-users and financial institutions active on the energy and financial markets. Fortum also has credit exposure toward customers and suppliers consisting of industrial counterparties, energy companies, government and municipal entities, utilities, small businesses, housing associations and private individuals, over a range of geographic regions. Credit defaults have not yet had a significant impact, but if the pandemic continues for a longer period of time without extension of effective support schemes for affected businesses, we expect to see increased default rates and delayed payments from customers, especially in the small and medium businesses in high-risk sectors and from non-investment grade counterparties that have been weakened economically by the pandemic. Fortum applies the expected credit loss model when recognising loss allowances for expected credit losses on financial assets. A similar model is applied when making credit value adjustments to the fair value of derivatives contracts. The model inputs have been reviewed taking into account the ongoing Covid-19 pandemic. There is no significant increase in credit losses due to Covid-19, however, the probability of defaults used in the expected credit loss model have been increased compared to before the pandemic, resulting in slightly higher loss allowances and credit value adjustments.
Operational risks have also increased due to the pandemic. Travel restrictions, risk of prolonged absences of key personnel, and difficulties in obtaining key materials, spare parts, and resources from our suppliers increase the risk of operational incidents or prolonged maintenance periods. So far, the risks have been mitigated through the activation of business continuity plans and a review of the timing and prioritisation of maintenance work. Although there have been some delays impacting maintenance periods and projects, there have been no significant incidents that have impacted Fortum’s operations. However, the longer the Covid-19 pandemic continues, the higher the risk of such incidents in the future.
Fortum is closely monitoring the development of the pandemic and its effects on our operations so that we can quickly respond to changes and continue to ensure the safe and reliable delivery of energy and related services.

OPERATING AND FINANCIAL
REVIEW
CONSOLIDATED FINANCIAL
STATEMENTS NOTES KEY
FIGURES
PARENT COMPANY FINANCIAL
STATEMENTS
SIGNATURES FOR THE OPERATING AND FINANCIAL REVIEW AND
FINANCIAL STATEMENTS AUDITOR’S
REPORT
KEY FIGURES
2011–2020
QUARTERLY FINANCIAL
INFORMATION INVESTOR
INFORMATION 3366
Financial performance and position Sustainability Risk management Fortum share and shareholders
Fortum share and shareholders Fortum Corporation’s shares have been listed on Nasdaq Helsinki since 18 December 1998. The trading code is FORTUM (until 25 January 2017: FUM1V). Fortum Corporation’s shares are in the Finnish book entry system maintained by Euroclear Finland Ltd which also maintains the official share register of Fortum Corporation.
Share key figures EUR 2020 2019 2018 Earnings per share 2.05 1.67 0.95 Cash flow per share 2.88 2.27 0.91 Equity per share 14.58 14.61 13.33 Dividend per share 1.12 1) 1.10 1.10 Payout ratio, % 54.6 1) 65.9 115.8 Dividend yield, % 5.7 1) 5.0 5.8
1) Board of Directors' proposal for the planned Annual General Meeting 28 April 2021.
For full set of share key figures, see the sectionKey figures in the Financial Statements.
Shareholders value, share price performance and volumes
Fortum's mission is to deliver excellent value to its shareholders. Fortum’s share price has appreciated approximately 42% during the last five years, while Dow Jones European Utility Index has increased 26%. During the same period Nasdaq Helsinki Cap index has increased 36%. During 2020 Fortum’s share price depreciated approximately 10%, while Dow Jones European Utility index increased approximately 8% and Nasdaq Helsinki Cap index increased approximately 10%.
In 2020, a total of 647.9 million (2019: 372.3) Fortum Corporation shares, totalling EUR 11,142 million, were traded on Nasdaq Helsinki. The highest quotation of Fortum Corporation shares during 2020 was EUR 23.46, the lowest EUR 12.25, and the volume-weighted average EUR 17.20. The closing quotation on the last trading day of the year 2020 was EUR 19.70 (2019: 22.00). Fortum's market capitalisation, calculated using the closing quotation of the last trading day of the year, was EUR 17,499 million (2019: 19,542).
In addition to the Nasdaq Helsinki, Fortum shares were traded on several alternative market places, for example at Boat, Cboe and Turquoise, and on the OTC market. During 2020, approximately 68% (2019: 73%) of Fortum's shares were traded on markets other than the Nasdaq Helsinki Ltd.
Share capital
Fortum Corporation has one class of shares. By the end of 2020, a total of 888,294,465 shares (2019: 888,294,465) had been issued. Each share entitles the holder to one vote at the Annual General Meeting. All shares entitle holders to an equal dividend. At the end of 2020 Fortum Corporation’s share capital, paid in its entirety and entered in the trade register, was EUR 3,046,185,953.00.
Shareholders
At the end of 2020 the Finnish State owned 50.76% of the company’s shares. The Finnish Parliament has authorised the Government to reduce the Finnish State’s holding in Fortum Corporation to no less than 50.1% of the share capital and voting rights.
The proportion of nominee registrations and direct foreign shareholders was 24.2% (2019: 30.5%).
Shareholders, 31 December 2020 Shareholders No. of shares Holding % Finnish State 450,932,988 50.76 Ilmarinen Mutual Pension Insurance Company 14,681,000 1.65 Varma Mutual Pension Insurance Company 8,621,167 0.97 Elo Mutual Pension Insurance Company 7,679,921 0.86 The Finnish Social Insurance Institution 7,030,896 0.79 Kurikan Kaupunki 6,203,500 0.70 The State Pension Fund 4,600,000 0.52 OP-Finland 2,292,000 0.26 Danske Invest Finnish Equity Fund 2,250,000 0.25 Nordea Bank Abp 1,988,386 0.22 Schweizerische Nationalbank 1,772,532 0.20 Mandatum Life Insurance Company Ltd. 1,504,618 0.17 OP-Henkivakuutus Ltd. 1,436,708 0.16 Säästöpankki Korko Plus Mutual Fund 1,265,800 0.14 Nominee registrations and direct foreign ownership 1) 213,460,801 24.03 Other shareholders in total 162,574,148 18.30 Total 888,294,465 100.00 1) Excluding Schweizerische Nationalbank

OPERATING AND FINANCIAL
REVIEW
CONSOLIDATED FINANCIAL
STATEMENTS NOTES KEY
FIGURES
PARENT COMPANY FINANCIAL
STATEMENTS
SIGNATURES FOR THE OPERATING AND FINANCIAL REVIEW AND
FINANCIAL STATEMENTS AUDITOR’S
REPORT
KEY FIGURES
2011–2020
QUARTERLY FINANCIAL
INFORMATION INVESTOR
INFORMATION 3377
Financial performance and position Sustainability Risk management Fortum share and shareholders
By shareholder category % of total amount
of shares Finnish shareholders
Corporations 2.29 Financial and insurance institutions 2.24 General government 56.57 Non-profit organisations 1.50 Households 13.16
Non-Finnish shareholders 24.24 Total 100.00
Breakdown of share ownership, 31 December 2020
Number of shares owned No. of
shareholders % of
shareholders No. of shares
% of total amount of
shares 1-100 79,926 39.19 3,814,834 0.43 101-500 73,119 35.85 18,774,960 2.11 501-1,000 24,308 11.92 17,956,092 2.02 1,001-10,000 25,137 12.32 65,336,522 7.36 10,001-100,000 1,354 0.66 30,637,906 3.45 100,001-1,000,000 92 0.05 23,891,053 2.69 1,000,001-10,000,000 15 0.01 49,890,281 5.62 over 10,000,000 2 0.00 465,613,988 52.42
203,953 100.00 675,915,636 76.09 In the joint book-entry account and in special accounts on 31 December 596 0.00 Nominee registrations 212,378,233 23.91 Total 888,294,465 100.00
Management shareholding 31 December 2020
At the end of 2020, the President and CEO and other members of the Fortum Executive Management owned 281,308 shares (2019: 263,002) representing approximately 0.03% (2019: 0.03%) of the total shares in the company.
A full description of the shareholdings and interests in long-term incentive schemes of the President and CEO and other members of the Fortum Executive Management is shown in Note 10 Employee benefits and Board remuneration.
Authorisations from the Annual General Meeting 2020
In 2020, the Annual General Meeting decided to authorise the Board of Directors to decide on the repurchase and disposal of the company’s own shares up to a maximum number of 20,000,000 shares, which corresponds to approximately 2.25% of all the shares in the company. These authorisations are effective until the next Annual General Meeting and, in any event, for a period no longer than 18 months. These authorisations had not been used as per 11 March 2021.
Dividend policy
The dividend policy ensures that shareholders receive a fair remuneration for their entrusted capital, supported by the company’s long-term strategy that aims at increasing earnings and cash flow and thereby the dividend. When proposing the dividend, the Board of Directors looks at a range of factors, including the macro environment, balance sheet strength as well as future investment plans. Fortum Corporation’s dividend policy is to pay a stable, sustainable and over time increasing dividend.

OPERATING AND FINANCIAL
REVIEW
CONSOLIDATED FINANCIAL
STATEMENTS NOTES KEY
FIGURES
PARENT COMPANY FINANCIAL
STATEMENTS
SIGNATURES FOR THE OPERATING AND FINANCIAL REVIEW AND
FINANCIAL STATEMENTS AUDITOR’S
REPORT
KEY FIGURES
2011–2020
QUARTERLY FINANCIAL
INFORMATION INVESTOR
INFORMATION 3388
Financial performance and position Sustainability Risk management Fortum share and shareholders
Dividend distribution proposal
The distributable funds of Fortum Corporation as at 31 December 2020 amounted to EUR 4,915,857,735 including the profit of the financial period 2020 of EUR 1,678,521,550. The company’s liquidity is good and the dividend proposed by the Board of Directors will not compromise the company’s liquidity.
The Board of Directors proposes to the Annual General Meeting that a dividend of EUR 1.12 per share be paid for 2020.
Based on the number of registered shares as at 11 March 2021 the total amount of dividend would be EUR 994,889,801. The Board of Directors proposes, that the remaining part of the distributable funds be retained in the shareholders’ equity.
The Annual General Meeting is planned to take place on 28 April 2021 at 14:00 EEST.
Market capitalisation, EUR billion
0
5
10
15
20
25
2016 2017 2018 2019 2020
1
05
101520253035404550
2011 2012 2013 2014 2015 2016 2017 2018 2019 2020
Fortum's share price, (EUR 19.70)Fortum's total shareholder return, EUR 40.09 (dividends reinvested)
Total shareholder return, EUR
1
Share quotations, index 100 = quote on 4 January 2016
0
50
100
150
200
2016 2017 2018 2019 2020
Fortum OMXHCap DJ STOXX
1
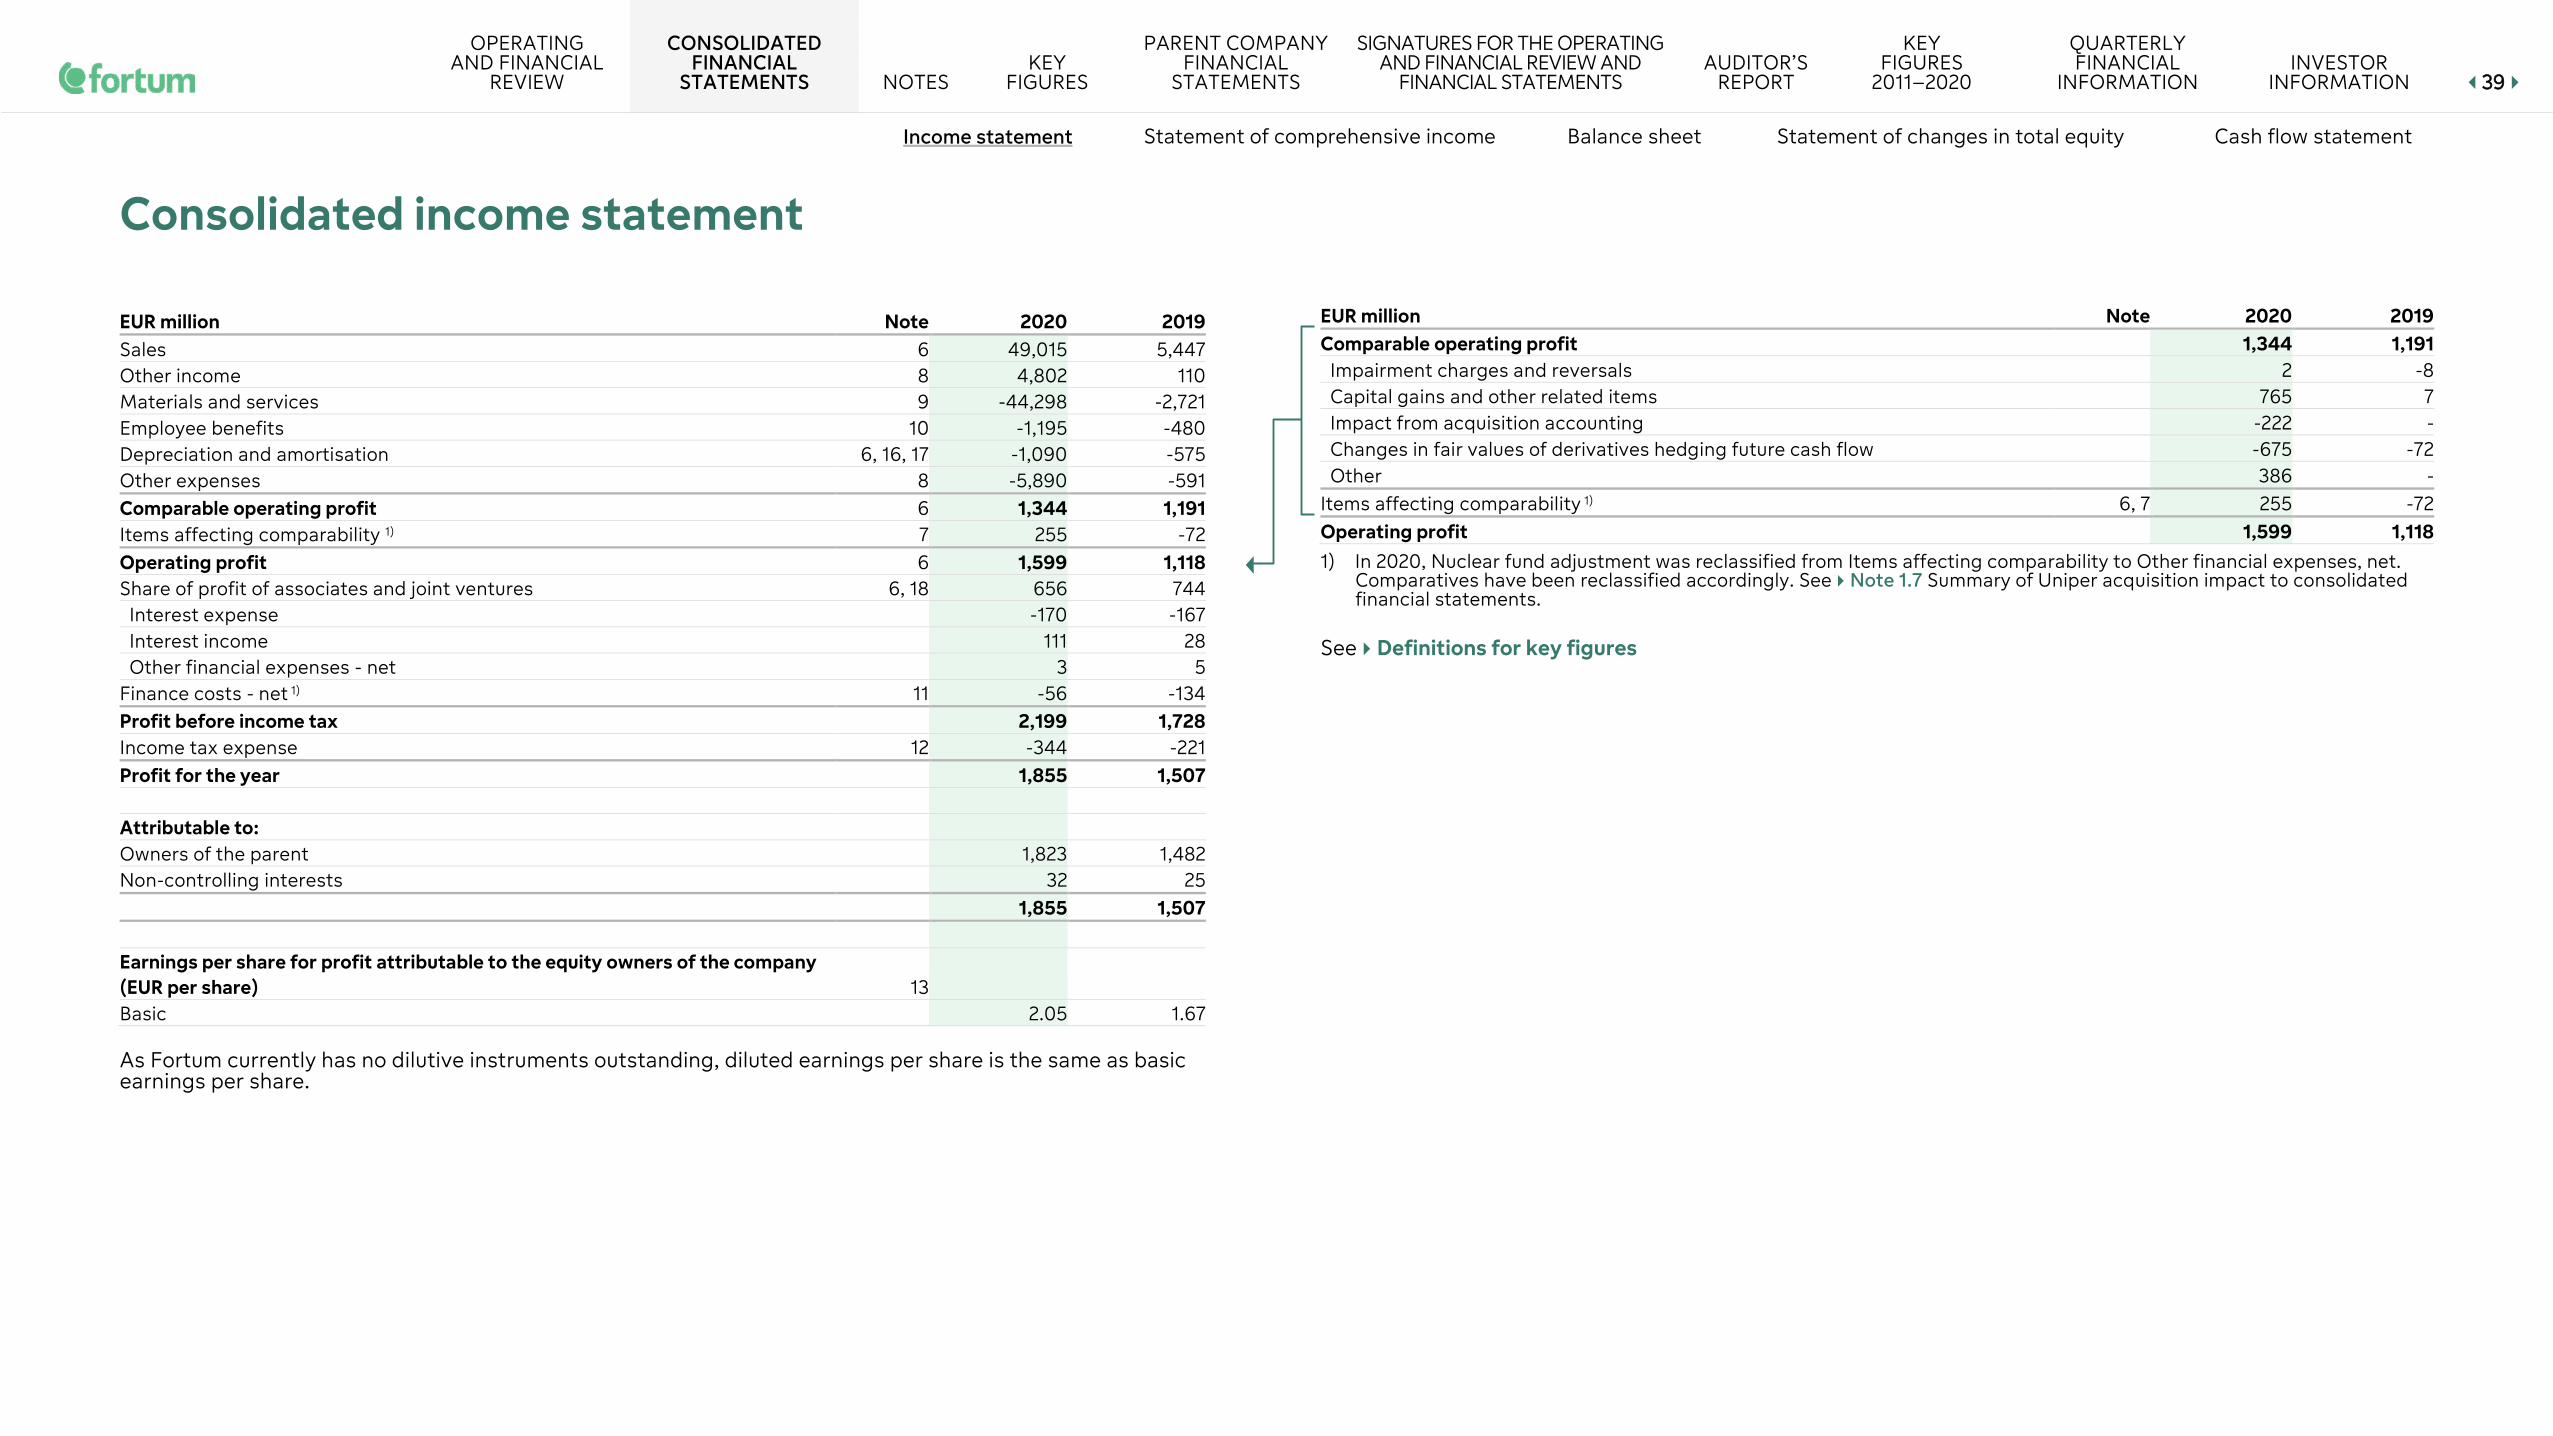
OPERATING AND FINANCIAL
REVIEW
CONSOLIDATED FINANCIAL
STATEMENTS NOTES KEY
FIGURES
PARENT COMPANY FINANCIAL
STATEMENTS
SIGNATURES FOR THE OPERATING AND FINANCIAL REVIEW AND
FINANCIAL STATEMENTS AUDITOR’S
REPORT
KEY FIGURES
2011–2020
QUARTERLY FINANCIAL
INFORMATION INVESTOR
INFORMATION 3399
Income statement Statement of comprehensive income Balance sheet Statement of changes in total equity Cash flow statement
Consolidated income statement
EUR million Note 2020 2019 Sales 6 49,015 5,447 Other income 8 4,802 110 Materials and services 9 -44,298 -2,721 Employee benefits 10 -1,195 -480 Depreciation and amortisation 6, 16, 17 -1,090 -575 Other expenses 8 -5,890 -591 Comparable operating profit 6 1,344 1,191 Items affecting comparability 1) 7 255 -72
Operating profit 6 1,599 1,118 Share of profit of associates and joint ventures 6, 18 656 744
Interest expense -170 -167 Interest income 111 28 Other financial expenses - net 3 5
Finance costs - net 1) 11 -56 -134 Profit before income tax 2,199 1,728 Income tax expense 12 -344 -221 Profit for the year 1,855 1,507 Attributable to: Owners of the parent 1,823 1,482 Non-controlling interests 32 25 1,855 1,507 Earnings per share for profit attributable to the equity owners of the company (EUR per share) 13 Basic 2.05 1.67 As Fortum currently has no dilutive instruments outstanding, diluted earnings per share is the same as basic earnings per share.
EUR million Note 2020 2019 Comparable operating profit 1,344 1,191
Impairment charges and reversals 2 -8 Capital gains and other related items 765 7 Impact from acquisition accounting -222 - Changes in fair values of derivatives hedging future cash flow -675 -72 Other 386 -
Items affecting comparability 1) 6, 7 255 -72 Operating profit 1,599 1,118 1) In 2020, Nuclear fund adjustment was reclassified from Items affecting comparability to Other financial expenses, net.
Comparatives have been reclassified accordingly. See Note 1.7 Summary of Uniper acquisition impact to consolidated financial statements.
See Definitions for key figures

OPERATING AND FINANCIAL
REVIEW
CONSOLIDATED FINANCIAL
STATEMENTS NOTES KEY
FIGURES
PARENT COMPANY FINANCIAL
STATEMENTS
SIGNATURES FOR THE OPERATING AND FINANCIAL REVIEW AND
FINANCIAL STATEMENTS AUDITOR’S
REPORT
KEY FIGURES
2011–2020
QUARTERLY FINANCIAL
INFORMATION INVESTOR
INFORMATION 4400
Income statement Statement of comprehensive income Balance sheet Statement of changes in total equity Cash flow statement
Consolidated statement of comprehensive income
EUR million Note 2020 2019 Profit for the year 1,855 1,507 Other comprehensive income Items that may be reclassified to profit or loss in subsequent periods: Cash flow hedges
Fair value gains/losses -155 82
Transfers to income statement 45 635 Transfers to inventory/property, plant and equipment 2 -4 Deferred taxes 21 -151
Net investment hedges Fair value gains/losses 48 -24 Deferred taxes -8 5
Exchange differences on translating foreign operations 4.3 -524 259
Share of other comprehensive income of associates and joint ventures 18 -250 72 Transfer to income statement due to impact from acquisition accounting 222 - Other changes -70 5 --666677 877 Items that will not be reclassified to profit or loss in subsequent periods: Remeasurement of investments -28 - Actuarial gains/losses on defined benefit plans 30 -244 -21
Actuarial gains/losses on defined benefit plans in associates and joint ventures 67 -208
--220055 -229 Other comprehensive income/expense for the year, net of deferred taxes -873 649 Total comprehensive income for the year 982 2,155 Total comprehensive income attributable to:
Owners of the parent 1,052 2,120 Non-controlling interests -70 36
998822 2,155
Other comprehensive income (OCI) includes items of income and expense that are recognised in equity and not recognised in the consolidated income statement. They include unrealised items, such as fair value gains and losses on financial instruments hedging future cash flows. These items will be realised in the Consolidated income statement when the underlying hedged items is recognised. OCI also includes gains and losses on fair valuation of other investments, actuarial gains and losses from defined benefit plans, items on comprehensive in come in associated companies and translation differences.
Fair valuation of cash flow hedges mainly relates to fair valuation of derivatives, such as futures and forwards, hedging electricity price for future transactions, where hedge accounting is applied. When electricity price is higher (lower) than the hedging price, the impact on equity is negative (positive).
Translation differences from translation of foreign entities, mainly RUB and SEK.
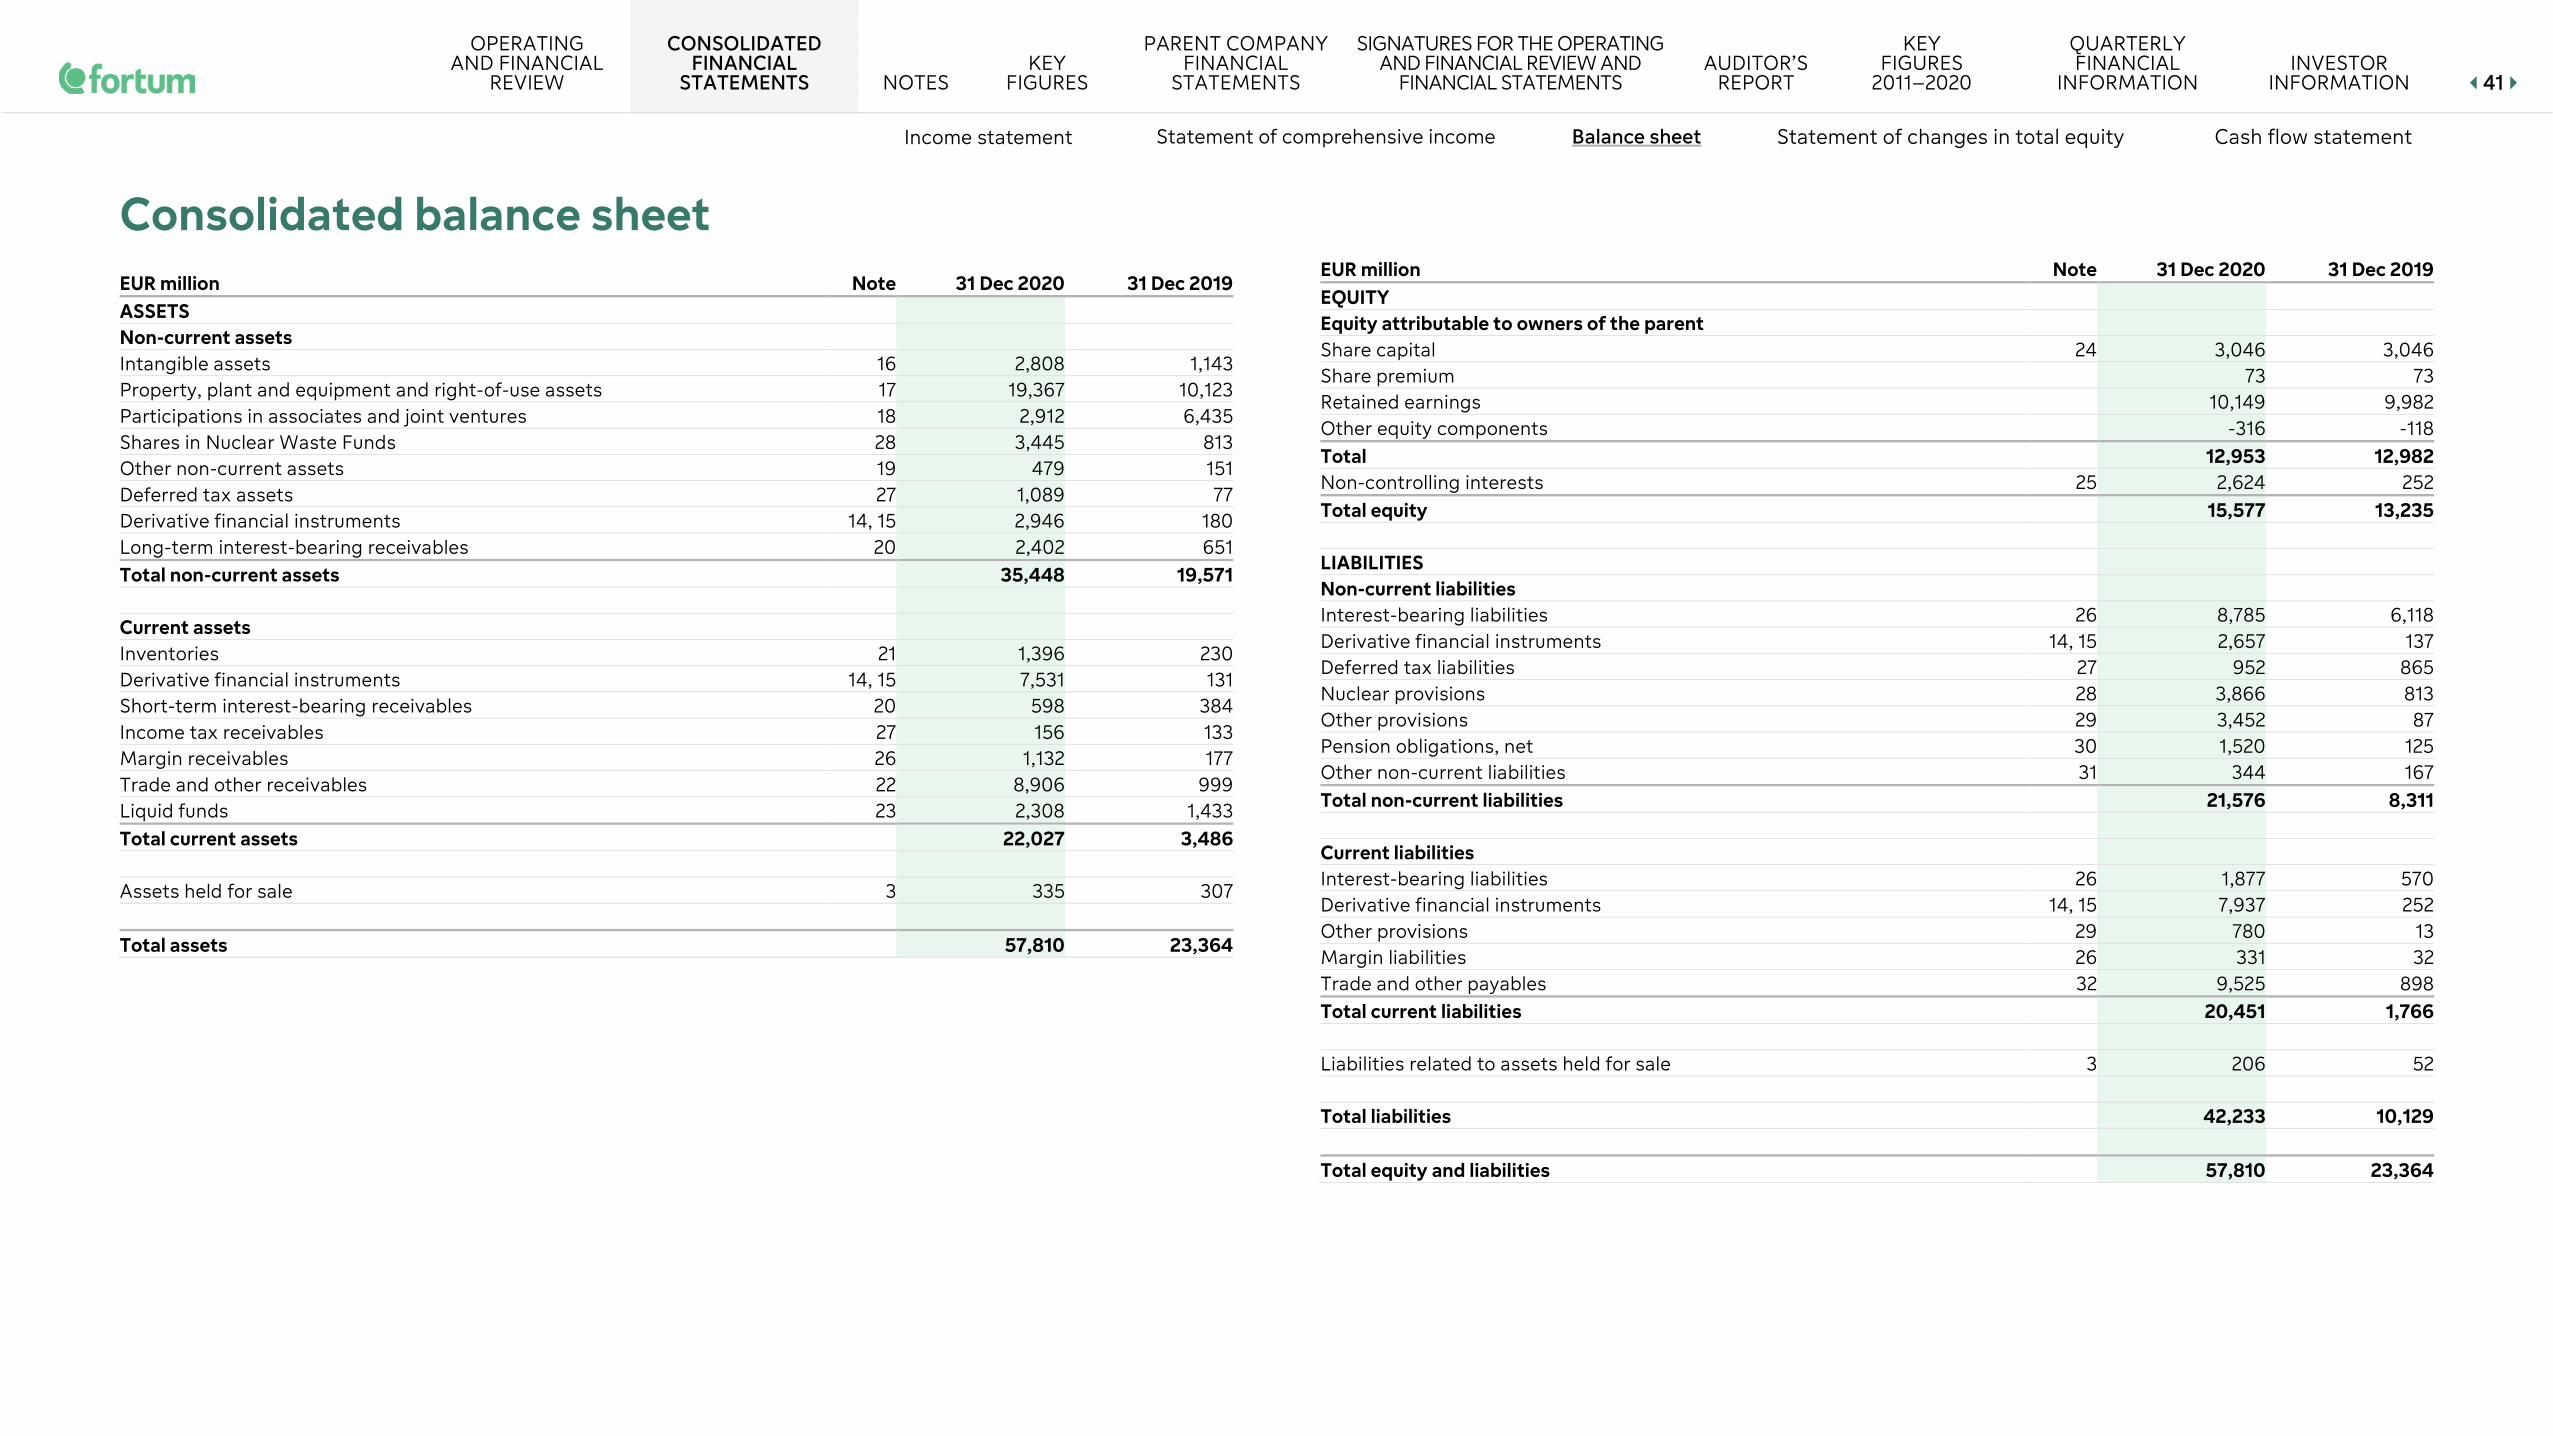
OPERATING AND FINANCIAL
REVIEW
CONSOLIDATED FINANCIAL
STATEMENTS NOTES KEY
FIGURES
PARENT COMPANY FINANCIAL
STATEMENTS
SIGNATURES FOR THE OPERATING AND FINANCIAL REVIEW AND
FINANCIAL STATEMENTS AUDITOR’S
REPORT
KEY FIGURES
2011–2020
QUARTERLY FINANCIAL
INFORMATION INVESTOR
INFORMATION 4411
Income statement Statement of comprehensive income Balance sheet Statement of changes in total equity Cash flow statement
Consolidated balance sheet
EUR million Note 31 Dec 2020 31 Dec 2019 ASSETS Non-current assets Intangible assets 16 2,808 1,143 Property, plant and equipment and right-of-use assets 17 19,367 10,123 Participations in associates and joint ventures 18 2,912 6,435 Shares in Nuclear Waste Funds 28 3,445 813 Other non-current assets 19 479 151 Deferred tax assets 27 1,089 77 Derivative financial instruments 14, 15 2,946 180 Long-term interest-bearing receivables 20 2,402 651 Total non-current assets 35,448 19,571 Current assets Inventories 21 1,396 230 Derivative financial instruments 14, 15 7,531 131 Short-term interest-bearing receivables 20 598 384 Income tax receivables 27 156 133 Margin receivables 26 1,132 177 Trade and other receivables 22 8,906 999 Liquid funds 23 2,308 1,433 Total current assets 22,027 3,486 Assets held for sale 3 335 307 Total assets 57,810 23,364
EUR million Note 31 Dec 2020 31 Dec 2019 EQUITY Equity attributable to owners of the parent Share capital 24 3,046 3,046 Share premium 73 73 Retained earnings 10,149 9,982 Other equity components -316 -118 Total 12,953 12,982 Non-controlling interests 25 2,624 252 Total equity 15,577 13,235 LIABILITIES Non-current liabilities Interest-bearing liabilities 26 8,785 6,118 Derivative financial instruments 14, 15 2,657 137 Deferred tax liabilities 27 952 865 Nuclear provisions 28 3,866 813 Other provisions 29 3,452 87 Pension obligations, net 30 1,520 125 Other non-current liabilities 31 344 167 Total non-current liabilities 21,576 8,311 Current liabilities Interest-bearing liabilities 26 1,877 570 Derivative financial instruments 14, 15 7,937 252 Other provisions 29 780 13 Margin liabilities 26 331 32 Trade and other payables 32 9,525 898 Total current liabilities 20,451 1,766 Liabilities related to assets held for sale 3 206 52 Total liabilities 42,233 10,129 Total equity and liabilities 57,810 23,364

OPERATING AND FINANCIAL
REVIEW
CONSOLIDATED FINANCIAL
STATEMENTS NOTES KEY
FIGURES
PARENT COMPANY FINANCIAL
STATEMENTS
SIGNATURES FOR THE OPERATING AND FINANCIAL REVIEW AND
FINANCIAL STATEMENTS AUDITOR’S
REPORT
KEY FIGURES
2011–2020
QUARTERLY FINANCIAL
INFORMATION INVESTOR
INFORMATION 4422
Income statement Statement of comprehensive income Balance sheet Statement of changes in total equity Cash flow statement
Consolidated statement of changes in total equity
Share
capital Share
premium Retained earnings
Other equity components
Owners of the
parent
Non- controlling
interests Total
equity
EUR million Note Retained earnings
Translation of foreign
operations
Cash flow
hedges
Other OCI
items
OCI items associates
and joint ventures
Total equity 1 January 2020 3,046 73 12,441 -2,459 -70 60 -108 12,982 252 13,235 Net profit for the year 1,823 1,823 32 1,855 Translation differences -490 -1 -3 2 -492 -32 -524 Other comprehensive income -87 -231 40 -279 -70 -349 Total comprehensive income for the year 1,823 -490 -88 -235 42 1,052 -70 982 Cash dividend 13 -977 -977 -160 -1,137 Changes due to business combinations 3 - 2,847 2,847 Impact from acquisition accounting 7 -84 84 - - - Transactions with non-controlling interests -107 -107 -247 -354 Other 2 2 1 4 BS Total equity 31 December 2020 3,046 73 13,097 -2,948 -158 -175 18 12,953 2,624 15,577 Total equity 1 January 2019 3,046 73 11,937 -2,705 -638 99 30 11,841 236 12,077 Net profit for the year 1,482 1,482 25 1,507 Translation differences 247 7 0 -1 253 6 259 Other comprehensive income 561 -40 -136 385 5 390 Total comprehensive income for the year 1,482 247 568 -40 -137 2,120 36 2,155 Cash dividend 13 -977 -977 -23 -1,000 Other -2 -2 4 2 BS Total equity 31 December 2019 3,046 73 12,441 -2,459 -70 60 -108 12,982 252 13,235
Translation differences Translation of financial information from subsidiaries in foreign currency is done using the average rate for the income statement and the end rate for the balance sheet. The exchange rate differences arising from translation (mainly related to RUB and SEK) to EUR are recognised in equity.
For information regarding exchange rates used, see Note 1 Significant accounting policies. For information about translation exposure see Note 4.3 Interest rate risk and currency risk.

OPERATING AND FINANCIAL
REVIEW
CONSOLIDATED FINANCIAL
STATEMENTS NOTES KEY
FIGURES
PARENT COMPANY FINANCIAL
STATEMENTS
SIGNATURES FOR THE OPERATING AND FINANCIAL REVIEW AND
FINANCIAL STATEMENTS AUDITOR’S
REPORT
KEY FIGURES
2011–2020
QUARTERLY FINANCIAL
INFORMATION INVESTOR
INFORMATION 4433
Income statement Statement of comprehensive income Balance sheet Statement of changes in total equity Cash flow statement
Impact from acquisition accounting Consolidation of an associated company results includes recording a share of the associated company’s other comprehensive income (OCI). If an associated company is either divested or becomes a subsidiary, IFRS requires that these previously recorded OCI items are reclassified inside equity either via the consolidated income statement or directly to retained earnings, depending on the nature of the OCI item. Reclassification does not have an impact on total equity. The above resulted in EUR -84 million being reclassified from OCI to retained earnings. See Note 7 Items affecting comparability.
Cash flow hedges The impact on equity attributable to owners of the parent from fair valuation of cash flow hedges mainly relates to fair valuation of derivatives, such as futures and forwards, hedging electricity price for future transactions, where hedge accounting is applied. When electricity price is higher (lower) than the hedging price, the impact on equity is negative (positive).
Cash dividends A dividend for 2019 was decided in the Annual General Meeting on 23 April 2020 and paid on 5 May 2020. See Note 13 Earnings and dividend per share.
Non-controlling interests Non-controlling interests increased by EUR 2,847 million following the acquisition of Uniper at 31 March 2020, including EUR 424 million non-controlling interest from Uniper’s standalone balance sheet; and EUR 2,423 million representing the 26.6% non-controlling interest in Uniper when Uniper was consolidated as a subsidiary to Fortum Group. See Note 3 Acquisitions, disposals and assets held for sale.

OPERATING AND FINANCIAL
REVIEW
CONSOLIDATED FINANCIAL
STATEMENTS NOTES KEY
FIGURES
PARENT COMPANY FINANCIAL
STATEMENTS
SIGNATURES FOR THE OPERATING AND FINANCIAL REVIEW AND
FINANCIAL STATEMENTS AUDITOR’S
REPORT
KEY FIGURES
2011–2020
QUARTERLY FINANCIAL
INFORMATION INVESTOR
INFORMATION 4444
Income statement Statement of comprehensive income Balance sheet Statement of changes in total equity Cash flow statement
Consolidated cash flow statement
EUR million Note 2020 2019 Cash flow from operating activities Profit for the year 1,855 1,507 Adjustments: Income tax expense 344 221 Finance costs - net 56 134 Share of profit/loss of associates and joint ventures -656 -744 Depreciation and amortisation 1,090 575 Operating profit before depreciations (EBITDA) 2,688 1,693 Items affecting comparability -255 72 Comparable EBITDA 2,434 1,766 Non-cash and other items 1) 293 -83 Interest received 46 29 Interest paid -208 -177 Dividends received 121 239 Income taxes paid -267 -165 Funds from operations 2,419 1,608 Change in working capital 136 -33 Net cash from operating activities 2,555 1,575 Cash flow from investing activities Capital expenditures 16, 17 -1,101 -695 Acquisitions of shares 6 -1,801 -107 Proceeds from sales of property, plant and equipment 16 35 Divestments of shares and capital returns 1,244 53 Shareholder loans to associated companies and joint ventures -44 9 Change in margin receivables 2) -552 403 Change in other interest-bearing receivables 1) 98 420 Net cash from/used in investing activities -2,140 118
EUR million Note 2020 2019 Cash flow before financing activities 415 1,693 Cash flow from financing activities Proceeds from long-term liabilities 2,569 2,805 Payments of long-term liabilities -507 -2,567 Change in short-term liabilities 207 -78 Dividends paid to the owners of the parent 13 -977 -977 Dividends paid to non-controlling interests -160 -23 Change in margin liabilities 2) -623 -47 Other financing items -3 1 Net cash from/used in financing activities 505 -886 Net increase(+)/decrease(-) in liquid funds 920 806 Liquid funds 1 January 1,435 584 Foreign exchange differences in liquid funds -45 44 Liquid funds 31 December 3) 23 2,308 1,435
1) In 2020, nuclear fund-related payments and repayments have been reclassified from cash flow from operating activities to cash flow from investing activities. Comparatives have been reclassified accordingly. See Note 1.7 Summary of Uniper acquisition impact to consolidated financial statements.
2) In 2020, in order to align with the presentation of net debt and to better to reflect the nature of these items, Fortum reclassified in the consolidated cash flow statement the change in net margin liabilities from operating cash flows so that the change in margin receivables is presented in investing cash flows, and the change in margin liabilities is presented in financing cash flows. Comparatives have been reclassified accordingly.
3) Included cash balances of EUR 2 million relating to assets held for sale at 31 December 2019. See Note 3 Acquisitions, disposals and assets held for sale.
Capital expenditures in cash flow do not include not yet paid investments. Capitalised borrowing costs are presented in interest paid.

OPERATING AND FINANCIAL
REVIEW
CONSOLIDATED FINANCIAL
STATEMENTS NOTES KEY
FIGURES
PARENT COMPANY FINANCIAL
STATEMENTS
SIGNATURES FOR THE OPERATING AND FINANCIAL REVIEW AND
FINANCIAL STATEMENTS AUDITOR’S
REPORT
KEY FIGURES
2011–2020
QUARTERLY FINANCIAL
INFORMATION INVESTOR
INFORMATION 4455
Income statement Statement of comprehensive income Balance sheet Statement of changes in total equity Cash flow statement
Change in net debt
From I/2020 Fortum updated the definition of net debt to align it with Uniper. See further details in Note 26 Interest-bearing liabilities.
EUR million Note 2020 Net debt 1 January 5,260 Collateral arrangement securities -281 Net margin liabilities -145 Financial net debt 1 January 4,833
Comparable EBITDA 2,434 Non-cash and other items 293 Paid net financial costs and dividends received -40 Income taxes paid -267 Change in working capital 136 Capital expenditures -1,101 Acquisitions -1,801 Divestments and proceeds from sale of property, plant and equipment 1,260 Change in interest-bearing receivables 54 Dividends to the owners of the parent -977 Dividends to non-controlling interests -160 Other financing activities -3
Net cash flow -173 Acquired financial debt 2,010 Foreign exchange rate differences and other changes 6 Financial net debt 31 December 26 7,023 Excludes financial net debt relating to assets held for sale at 31 December 2020, see Note 3 Acquisitions, disposals and assets held for sale.
Additional cash flow information
Change in working capital EUR million 2020 2019 Change in interest-free receivables, decrease(+)/increase(-) -1,106 63 Change in inventories, decrease(+)/increase(-) 407 4 Change in interest-free liabilities, decrease(-)/increase(+) 835 -100 CF Total 136 -33
Capital expenditure in cash flow EUR million Note 2020 2019 Capital expenditure 16, 17 1,135 713 Change in not yet paid investments, decrease(+)/increase(-) -6 -9 Capitalised borrowing costs 17 -27 -9 CF Total 1,101 695
Acquisition of shares in cash flow Acquisition of shares, net of cash acquired, amounted to EUR 1,801 million during 2020 (2019: 107), including mainly the acquisition of shares in Uniper SE. For further information see Note 3 Acquisitions, disposals and assets held for sale.
Divestment of shares in cash flow EUR million Note 2020 2019 Proceeds from sales of subsidiaries, net of cash disposed 3 1,156 15 Proceeds from sales and capital returns of associates and joint ventures 18, 3 49 33 Proceeds from sales of other investments 3 40 4 CF Total 1,244 53
During 2020 Fortum completed the divestment of the district heating business in Järvenpää and Joensuu, Finland, the 80% stake in the Nordic wind portfolio and the 60% stake in the public charging point operator for electrical vehicles in the Nordics. For further information, see Note 3 Acquisitions and disposals and assets held for sale.
OPERATING AND FINANCIAL
REVIEW
CONSOLIDATED FINANCIAL
STATEMENTS NOTES KEY
FIGURES
PARENT COMPANY FINANCIAL
STATEMENTS
SIGNATURES FOR THE OPERATING AND FINANCIAL REVIEW AND
FINANCIAL STATEMENTS AUDITOR’S
REPORT
KEY FIGURES
2011–2020
QUARTERLY FINANCIAL
INFORMATION INVESTOR
INFORMATION 4466
Basis of preparation Risks Income statement Balance sheet Off balance sheet items Group structure and related parties
1 Significant accounting policies 1.1 Basic information Fortum Corporation (the company) is a Finnish public limited liability company domiciled in Espoo, Finland. Fortum’s shares are traded on Nasdaq Helsinki. Fortum is a European energy company with activities in more than 40 countries. We provide our customers with electricity, gas, heating and cooling as well as smart solutions to improve resource.
These financial statements were approved by the Board of Directors on 11 March 2021. The Financial Statements are also published in accordance with the European Single Electronic Format (ESEF) reporting requirement. The audit firm, Deloitte Oy, has provided an independent auditor’s reasonable assurance report on Fortum’s ESEF Financial Statements in accordance with ISAE 3000 (Revised). The ESEF report is available at https://www.fortum.com/about-us/investors/reports-and-presentations.
1.2 Basis of preparation The consolidated financial statements of Fortum Group for the year ended 31 December 2020 have been prepared in accordance with International Financial Reporting Standards (IFRS) and IFRIC Interpretations as adopted by the European Union. The consolidated financial statements also comply with Finnish accounting principles and corporate legislation.
The consolidated financial statements have been prepared under the historical cost convention, except for financial assets and financial liabilities (including derivative instruments) that are valued at fair value through profit and loss or other comprehensive income.
The figures in the consolidated financial statements have been rounded and consequently the sum of individual figures may deviate from the sum presented. Key figures have been calculated using exact figures. Unless otherwise indicated, all amounts are presented in millions of euro (EUR million).
1.3 Principles for consolidation These consolidated financial statements comprise of the parent company, subsidiaries, joint ventures and associated companies.
Fortum Group was formed in 1998 by using the pooling-of-interests method for consolidating Fortum Power and Heat Oy and Fortum Oil and Gas Oy (the latter demerged to Fortum Oil Oy and Fortum Heat and Gas Oy 1 May 2004). In 2005 Fortum Oil Oy (current Neste Oyj) was separated from Fortum by distributing 85% of its shares to Fortum’s shareholders and by selling the remaining 15%. This means that the acquisition cost of Fortum Power and Heat Oy and Fortum Heat and Gas Oy has been eliminated against the share capital of the companies. The difference has been entered as a decrease in shareholders’ equity.
1.3.1 Subsidiaries Subsidiaries are defined as companies over which Fortum has control. Control exists when Fortum is exposed to, or has rights to, variable returns from its involvement with the entity and has the ability to affect those returns through its power over the entity. See Note 3 Acquisitions, disposals and assets held for sale.
Intercompany transactions, balances and unrealised gains on transactions between Group companies are eliminated. Unrealised losses are also eliminated unless the transaction provides evidence of an impairment of the asset transferred.
Where necessary, subsidiaries’ accounting policies have been changed to ensure consistency with the policies the Group has adopted.
Certain subsidiaries and associated companies are not included in the consolidated financial statements on materiality grounds. These companies are accounted for outside the scope of IFRS 9 and measured at cost, with adjustments for any loss allowance.
Fortum Group subsidiaries are disclosed in Note 39 Group companies by segment. Group holding % for companies owned via subsidiaries is based on the Fortum Corporation ownership % in the direct subsidiary times the ownership % of the direct subsidiary in the indirect subsidiary / associate / joint venture.
1.3.2 Associates Associated companies are entities over which the Group has significant influence but not control, generally accompanying a shareholding of between 20% and 50% of the voting rights. The Group’s interests in associated companies are accounted for using the equity method of accounting. See Note 18 Participations in associated companies and joint ventures.
1.3.3 Joint ventures Joint ventures are arrangements in which the Group has joint control. Joint ventures are accounted for using the equity method of accounting. See Note 18 Participations in associated companies and joint ventures.
1.3.4 Non-controlling interests Non-controlling interests in subsidiaries are identified separately from the equity of the owners of the parent company. Non-controlling interests are generally initially measured at the non-controlling interests’ proportionate share of the fair value of the acquiree’s identifiable net assets. Changes in non-controlling interest due to changes in ownership interest of a subsidiary are accounted for as equity transactions. Subsequent to acquisition, the carrying amount of non-controlling interests is the amount of those interests at initial recognition plus the non-controlling interests’ share of subsequent changes in equity. See Note 25 Non-controlling interests.
1.4 Measures for performance According to the ESMA Guidelines on Alternative Performance Measures, an Alternative Performance Measure (APM) is understood as a financial measure of historical or future financial performance, financial position, or cash flows, other than a financial measure defined or specified in the applicable financial reporting framework.
Fortum uses APMs, such as Comparable operating profit and Comparable EBITDA in the financial target setting and forecasting, management's follow-up of financial performance of segments and the Group, as well as for the allocation of resources in the Group's performance management process. Items affecting comparability are excluded from Comparable operating profit and Comparable EBITDA and disclosed separately in Fortum's consolidated income statement to support the transparency of underlying business performance when comparing results between periods.
Items classified as Items affecting comparability include accounting effects from valuation according to IFRS not arising from the performance of business operations. Such items include fair value changes of financial derivatives hedging future cash flows where hedge accounting is not applied and fair value changes of physical contracts accounted for as derivatives according to IFRS 9, Financial Instruments.
Further, business performance of operations cannot be compared from one period to another without adjusting for one-time items relating to capital gains and other related items, such as transaction costs arising from acquisitions; impacts from acquisition accounting; significant impairments and reversals of impairments as well as other miscellaneous non-operating items, such as restructuring and cost management expenses. Such items are also treated as Items affecting comparability.
1
2
3
4
5
6
7
8
9
10
11
12
13
14
15
16
17
18
19
20
21
22
23
24
25
26
27
28
29
30
31
32
33
34
35
36
37
38
39

OPERATING AND FINANCIAL
REVIEW
CONSOLIDATED FINANCIAL
STATEMENTS NOTES KEY
FIGURES
PARENT COMPANY FINANCIAL
STATEMENTS
SIGNATURES FOR THE OPERATING AND FINANCIAL REVIEW AND
FINANCIAL STATEMENTS AUDITOR’S
REPORT
KEY FIGURES
2011–2020
QUARTERLY FINANCIAL
INFORMATION INVESTOR
INFORMATION 4477
Basis of preparation Risks Income statement Balance sheet Off balance sheet items Group structure and related parties
According to IFRS 3, Business Combinations, transaction costs related to the acquisitions of subsidiary shares are recognised in the consolidated income statement. Such costs are presented in Capital gains and other within Items affecting comparability.
Following the consolidation on Uniper’s income statement in 2020, Fortum updated the definition of Items affecting comparability and Comparable operating profit to align with Uniper’s Adjusted earnings before interest and tax (Adjusted EBIT) definition. This update resulted in some changes to the definitions of existing items, as well as one new category (Other) for other non-operating items.
Further, Nuclear fund adjustment was reclassified from Items affecting comparability to Other financial expenses, net. This change did not impact Comparable operating profit. Items affecting comparability are now categorised as follows:
• Impairment charges and reversals (reversal of previously recorded impairment charges has been added) • Capital gains and other related items • Impact from acquisition accounting • Changes in fair values of derivatives hedging future cash flow • Other (including restructuring and cost management expenses and other miscellaneous non-operating
items)
See Note 7 Items affecting comparability. Definitions are presented in the section Definitions of key figures.
In 2020, Fortum updated the definition of net debt and started to use financial net debt and adjusted net debt when following indebtedness of the Group. The previously used net debt included interest-bearing loans, lease liabilities and liquid funds. See Note 26 Interest-bearing liabilities for details. Fortum also updated its long-term financial target to be financial net debt / comparable EBITDA below 2x. See Note 5 Capital risk management.
1.5 Foreign currency transactions and translation
1.5.1 Functional and presentation currency Items included in the financial statements of each of the Group’s entities are measured using the currency of the primary economic environment in which the entity operates (the functional currency). The consolidated financial statements are presented in euros, which is the company’s functional and presentation currency.
1.5.2 Transactions and balances Transactions denominated in foreign currencies are translated using the exchange rate at the date of transaction. Receivables and liabilities denominated in foreign currencies outstanding on the balance sheet date are translated using the balance sheet date exchange rate. Exchange rate differences are recognised in the consolidated income statement. Net exchange differences relating to financing components are recognised in the income consolidated statement, except when deferred to equity as qualifying cash flow hedges. Translation differences on financial assets through other comprehensive income are included in Other equity components in equity.
1.5.3 Group companies Income statement and cash flow statement of subsidiaries, whose functional currencies are not euro, are translated into euro using the average exchange rates; whereas the balance sheets of such subsidiaries are translated into euro using the closing exchange rates on the balance sheet date. On consolidation, exchange rate differences arising from the translation of net investment in foreign entities, as well as borrowings and other currency instruments designated as hedges for such investments, are taken to equity. When a foreign operation is sold, such exchange differences are recognised in the consolidated income statement as part of the gain or loss on sale. Goodwill and fair value adjustments arising on the acquisition of a foreign entity are treated as assets and liabilities of the foreign entity and translated at closing rate.
The balance sheet date rate is based on the exchange rate published by the European Central Bank for the closing date. The average exchange rate is calculated as an average of daily closing rates from the European Central Bank. Until 2019 the average exchange rate was calculated as an average of each month's ending rate.
Key exchange rates used in consolidated financial statements Average rate Balance sheet date rate Currency 2020 2019 31 Dec 2020 31 Dec 2019 United Kingdom GBP 0.8897 0.8773 0.8990 0.8508 Norway NOK 10.7228 9.8524 10.4703 9.8638 Poland PLN 4.4430 4.2992 4.5597 4.2568 Russia RUB 82.7248 72.7949 91.4671 69.9563 Sweden SEK 10.4848 10.5572 10.0343 10.4468 United States USD 1.1422 1.1214 1.2271 1.1234
1.5.4 Associates and joint ventures Associates and joint ventures, whose measurement and reporting currencies are not euro, are translated into the Group reporting currency using the same principles as for subsidiaries.
1
2
3
4
5
6
7
8
9
10
11
12
13
14
15
16
17
18
19
20
21
22
23
24
25
26
27
28
29
30
31
32
33
34
35
36
37
38
39

OPERATING AND FINANCIAL
REVIEW
CONSOLIDATED FINANCIAL
STATEMENTS NOTES KEY
FIGURES
PARENT COMPANY FINANCIAL
STATEMENTS
SIGNATURES FOR THE OPERATING AND FINANCIAL REVIEW AND
FINANCIAL STATEMENTS AUDITOR’S
REPORT
KEY FIGURES
2011–2020
QUARTERLY FINANCIAL
INFORMATION INVESTOR
INFORMATION 4488
Basis of preparation Risks Income statement Balance sheet Off balance sheet items Group structure and related parties
1.6 Other significant accounting policies Fortum describes other significant accounting policies in conjunction with the relevant disclosure information. The table below lists significant accounting policies and the financial statement note where they are presented, as well as the relevant IFRS standard.
Accounting policy Note IFRS standard Subsidiaries 3 Acquisitions, disposals and assets held for sale IFRS 3, IFRS 10 Assets held for sale 3 Acquisitions, disposals and assets held for sale IFRS 5 Financial instruments 4, 14, 15 Financial risk management, Financial assets and
liabilities by categories and Financial assets and liabilities by fair value hierarchy
IAS 32, IFRS 7, IFRS 9, IFRS 13
Segment reporting 6 Segment reporting IFRS 8, IFRS 15 Revenue recognition 6, 22 Segment reporting and Trade and other receivables IFRS 15 Other income 8 Other income and other expenses IFRS 15 Research and development costs 8 Other income and other expenses IAS 38 Share-based payments 10 Employee benefits and Board remuneration IFRS 2 Earnings per share 13 Earnings and dividend per share IAS 33 Other shares and participations 14, 19 Financial assets and liabilities by categories and Other
non-current assets IAS 32, IAS 36, IFRS 9
Fair value measurement 15 Financial assets and liabilities by fair value hierarchy IFRS 13 Intangible assets 16 Intangible assets IAS 38 Government grants 17 Property, plant and equipment and Right-of-use Assets IAS 20 Tangible assets 17 Property, plant and equipment and Right-of-use Assets IAS 16, IAS 36,
IAS 40 Joint arrangements 18 Participations in associated companies and joint
ventures IFRS 11, IAS 28, IFRS 12
Investments in associates 18
Participations in associated companies and joint ventures
IAS 28, IFRS 12
Inventories 21 Inventories IAS 2 Trade receivables 22 Trade and other receivables IFRS 9 Liquid funds 23 Liquid funds IAS 7 Borrowings 26 Interest-bearing liabilities IFRS 9 Income taxes 27 Income taxes on the balance sheet IAS 12 Decommissioning obligation 28 Nuclear related assets and liabilities IFRIC 5 Provisions 29 Other provisions IAS 37 Pensions and similar obligations 30 Pension obligations IAS 19 Leases 33 Leases IFRS 16 Contingent liabilities 35 Pledged assets and contingent liabilities IAS 37
1.7 Summary of Uniper acquisition impact on consolidated financial statements
1.7.1 Consolidation of Uniper as a subsidiary at 31 March 2020 On 8 October 2019, Fortum entered into agreements to acquire all the shares held by funds managed by Elliott Management Corporation and its affiliates (“Elliott”) and Knight Vinke Energy Advisors Limited and its affiliates (“Knight Vinke“). The transaction was closed in two tranches. Control over Uniper was acquired on 26 March 2020 upon closing of the first tranche of the agreement, 19.6% of the shares. A liability for the maximum amount of shares in the second tranche, 3.8% of the shares, was recognised on the acquisition date. The second tranche of the agreement was closed on 8 May 2020 with the maximum amount of shares.
On 31 March 2020, Fortum’s consolidated stake in Uniper was 73.4%, including the shares from the second tranche. On 31 March 2020, Fortum consolidated the balance sheet of Uniper. The income statement impact from 26 March 2020 to 31 March 2020 was not material. See Note 3.1 Acquisitions. In August 2020 Fortum’s stake in Uniper exceeded 75%, and was 76.1% on 31 December 2020.
Fortum consolidated Uniper’s results into its income statement from 1 April 2020. Income statement line items have been classified in accordance with Fortum’s income statement categorisation and, as such, may not be fully comparable to Uniper’s standalone income statement. Further, reporting of both the Uniper segment, and the Generation segment are impacted by adjustments for the joint ownership in the Swedish nuclear company, OKG AB. See paragraph below.
1.7.2 Purchase price accounting on 31 March 2020 The purchase price allocation is being finalised and will be completed within the one-year window from the acquisition date, i.e. by 31 March 2021.
In these financial statements, Fortum presents the preliminary purchase price allocation for the Uniper acquisition, which has resulted in adjustments to Uniper’s 31 March 2020 opening balance sheet.
Fair value adjustments made to Uniper’s 31 March 2020 opening balance sheet mainly relate to property, plant and equipment and right-of-use assets, participations in associates and joint ventures, lease liabilities, other provisions, and deferred taxes. Increase in the value of property, plant and equipment resulted in additional depreciation (EUR 11 million in 2020); and increase in the value of the lease liability (due to a lower discount rate) resulted in lower interest cost (EUR 26 million in 2020).
In connection with the purchase price allocation, Fortum is also required to assess the circumstances giving rise to items recognised in Uniper segment’s income statement during the one-year window from the acquisition date, and to reflect these in the acquisition date opening balance if they give more information on acquisition date fair values of assets or liabilities. This has led to certain one-time adjustments to Uniper segment’s 2020 income statement, which are now reflected in the acquisition date opening balance sheet on 31 March 2020. Total impact on Comparable operating profit is EUR +68 million, and Items affecting comparability EUR -31 million in 2020.
Excess of the acquisition value over the fair value of Uniper’s net assets, EUR 515 million, is preliminary goodwill. See Note 3.1 Acquisitions.
1.7.3 Alignment of accounting policies and presentation Following the acquisition of Uniper, Fortum has reviewed Uniper’s accounting policies to identify any significant differences to Fortum accounting policies. No significant accounting policy differences have been identified, except as explained below.
Fortum has aligned accounting policies and assumptions for nuclear related asset and liabilities on 31 December 2020. The alignment led to an increase in nuclear provisions, as well as a corresponding increase in nuclear funds for the overfunded plans; and resulted in 2020 in a positive net impact of EUR 12 million to other financial expenses in the consolidated income statement.
1
2
3
4
5
6
7
8
9
10
11
12
13
14
15
16
17
18
19
20
21
22
23
24
25
26
27
28
29
30
31
32
33
34
35
36
37
38
39
OPERATING AND FINANCIAL
REVIEW
CONSOLIDATED FINANCIAL
STATEMENTS NOTES KEY
FIGURES
PARENT COMPANY FINANCIAL
STATEMENTS
SIGNATURES FOR THE OPERATING AND FINANCIAL REVIEW AND
FINANCIAL STATEMENTS AUDITOR’S
REPORT
KEY FIGURES
2011–2020
QUARTERLY FINANCIAL
INFORMATION INVESTOR
INFORMATION 4499
Basis of preparation Risks Income statement Balance sheet Off balance sheet items Group structure and related parties
The accounting policies and assumptions have also been aligned for the respective balances of the co-owned nuclear companies. The total impact of the alignment to share of profits from associated companies and joint ventures in 2020 was EUR 47 million, net of tax.
Differences in financial statement presentation have also been addressed. The following changes have been made in comparison to Fortum’s 2019 annual report to align with Uniper:
• Fortum updated the definition of net debt and started to use financial net debt and adjusted net debt when following indebtedness of the Group. The previously used net debt included interest-bearing loans, lease liabilities and liquid funds. See Note 26 Interest-bearing liabilities for details.
• Fortum updated the definition of Items affecting comparability and Comparable operating profit. The update resulted in some changes to definitions of existing items, as well as one new category (Other) for other non-operating items. See Note 1.4 Measures for performance for details.
• In order to align with the presentation of net debt and to better to reflect the nature of these items, Fortum reclassified in the consolidated cash flow statement the change in net margin liabilities (in 2019, presented as change in settlements for futures) from operating cash flows so that the change in margin receivables is presented in investing cash flows, and the change in margin liabilities is presented in financing cash flows. Comparatives have been reclassified accordingly.
• Nuclear fund adjustment in the consolidated income statement was reclassified from Items affecting comparability to Other financial expenses, net. This change does not impact Comparable operating profit. Further, in the consolidate cash flow statement, nuclear fund-related payments and repayments have been reclassified from cash flow from operating activities to cash flow from investment activities. Comparatives have been reclassified accordingly.
Further changes to the presentation of financial statements are still possible.
1.7.4 Joint ownership in the Swedish nuclear company OKG AB Fortum and Uniper are co-owners in the Swedish nuclear company OKG Aktiebolag (OKG AB). OKG AB is consolidated into Uniper Group as a subsidiary with a 45.5% minority representing Fortum’s ownership in OKG AB. Fortum accounted for the shareholding in OKG AB as an associated company until 31 March 2020. As of 31 March 2020, OKG AB is consolidated as a subsidiary to Fortum Group.
Fortum has adjusted Uniper’s standalone income statement and balance sheet numbers in respect of Fortum’s shareholding in OKG AB, as well as adjusted operating profit, share of profit/loss in associates and joint ventures and net assets of OKG AB recorded in the Generation segment. Consequently, the Group’s subsidiary, OKG AB, is split between the two segments according to ownership. This means that the standalone income statement and balance sheet as reported by Uniper in its interim reports is not fully comparable to Uniper’s income statement and balance sheet as consolidated to Fortum Group. The adjustments made to Uniper’s standalone income statement and balance sheet mainly impact Interest-bearing liabilities, Share of Nuclear fund, Nuclear provisions and Non-controlling interest as reported by Uniper. See Note 3.1 Acquisitions and Note 26 Interest-bearing liabilities.
1.7.5 Segment reporting Following the consolidation of Uniper as a subsidiary on 31 March 2020, Fortum revised its reportable segments and reports Uniper as a separate segment. Until 31 March 2020 Fortum’s share of Uniper’s associated company results was presented in Other operations. See Note 6 Segment reporting.
Fortum previously accounted for Uniper as an associated company with a three-month time lag as Fortum published the annual report before Uniper’s financial information was available. From the first quarter 2020, Fortum revised its financial reporting schedule and publishes annual and interim reports after Uniper. Fortum's first quarter results therefore included Fortum's share of Uniper’s results from 1 October 2019 to 31 March 2020. See Note 18 Participations in associated companies and joint ventures.
Reporting of both the Uniper segment, and the Generation segment are impacted by adjustments for the joint ownership in the Swedish nuclear company, OKG AB. See paragraph above.
1.7.6 One-time impact from acquisition accounting Consolidation of an associated company results includes recording a share of the associated company’s other comprehensive income (OCI). If an associated company is either divested or becomes a subsidiary, IFRS requires that these previously recorded OCI items are reclassified inside equity either via the consolidated income statement or directly to retained earnings, depending on the nature of the OCI item. Reclassification does not have an impact on total equity.
The above reclassification resulted in a one-time, non-cash income statement impact of EUR -222 million on 31 March 2020 when Uniper became Fortum’s subsidiary. This amount represented a part of Fortum's share of Uniper's OCI for the time when Uniper was an associated company, with no impact to Fortum’s total equity. The amount mainly related to exchange rate differences arising from the translation of foreign operations recorded by Uniper. See Note 7 Items affecting comparability
1.8 New accounting standards, amendments and interpretations New accounting standards, amendments and interpretations effective from 1 January 2020 did not have a material impact on Fortum's consolidated financial statements.
New accounting standards, amendments and interpretations issued by the balance sheet date and effective from 1 January 2021, or later, are not expected to have a material impact on Fortum’s consolidated financial statements.
1
2
3
4
5
6
7
8
9
10
11
12
13
14
15
16
17
18
19
20
21
22
23
24
25
26
27
28
29
30
31
32
33
34
35
36
37
38
39

OPERATING AND FINANCIAL
REVIEW
CONSOLIDATED FINANCIAL
STATEMENTS NOTES KEY
FIGURES
PARENT COMPANY FINANCIAL
STATEMENTS
SIGNATURES FOR THE OPERATING AND FINANCIAL REVIEW AND
FINANCIAL STATEMENTS AUDITOR’S
REPORT
KEY FIGURES
2011–2020
QUARTERLY FINANCIAL
INFORMATION INVESTOR
INFORMATION 5500
Basis of preparation Risks Income statement Balance sheet Off balance sheet items Group structure and related parties
2 Critical accounting estimates and judgements The preparation of IFRS consolidated financial statements requires management to make estimates and assumptions that affect the reported amounts of assets and liabilities, the disclosure of contingent assets and liabilities existing at the balance sheet date, as well as the reported amounts of revenues and expenses during the reporting period.
Estimates and judgements are continually evaluated and are based on historical experience and other factors, including expectations of future events that are believed to be reasonable under the circumstances. Actual results and timing may differ from these estimates.
The table below lists the areas where management’s accounting estimates and judgements are most critical to reported results and financial position; as well as where to find more information on the areas of critical accounting estimate and judgement. Critical accounting estimates and judgements Note Judgement used in the purchase price allocation of the acquisition of Uniper shares
3. Acquisitions, disposals and assets held for sale
Judgement used in determining the valuation of certain financial instruments
14. Financial assets and liabilities by categories 15. Financial assets and liabilities by fair value hierarchy
Assigned values and useful lives determined for intangible assets and property, plant and equipment acquired in a business combination
16, 17. Intangible assets; Property, plant and equipment and right-of-use assets
Assumptions related to impairment testing of property, plant and equipment and intangible assets as well as associated companies and joint ventures
16, 17. Intangible assets; Property, plant and equipment and right-of-use assets
Judgement used when assessing the nature of Fortum's interest in its investees, when considering the classification of Fortum's joint arrangements, as well as commitments arising from these arrangements
18. Participations in associated companies and joint ventures
Estimates used for the recognition and measurement of deferred tax assets
27. Income taxes on the balance sheet 36. Legal actions and official proceedings
Assumptions made to determine long-term cash flow forecasts of estimated costs for provision related to nuclear production
28. Nuclear related assets and liabilities
Assumptions made when estimating provisions 29. Other provisions Assumptions used to determine future pension obligations 30. Pension obligations Assumptions used to determine the lease liability 33. Leases Judgement used in accounting for price-adjustment clauses contained in long-term contracts
34. Capital and other commitments
Impact of Covid-19 on consolidated financial statements Fortum has considered the potential impact of the Covid-19 pandemic on its business operations, and concluded the overall effect in the consolidated financial statements not to be significant.
During 2020, the Covid-19 pandemic resulted in new and partly unexpected risks as societies and governments across the world implemented drastic measures to contain the spread of the disease. As a result, the exposure to risk and uncertainty in all risk categories has increased compared to the 2019 year-end situation. There has been a certain stabilisation and partial recovery of commodity prices in the three last quarters, but market prices for electricity remain lower than at the beginning of 2020 due to lower commodity prices and European demand as well as the extremely wet, warm, and windy winter in the Nordics during the first quarter. Fortum’s hedges, especially for the year 2021, will offer some protection against short-term fluctuations in electricity and other commodity market prices, but if the Covid-19 pandemic continues longer than expected or results in a more severe economic downturn than anticipated, results will be negatively impacted, as the hedge level for future years is lower.
Additionally, there is an increased risk of credit defaults caused by the abrupt shut-down of society in many parts of the world. Fortum has OTC derivative contracts with a number of energy wholesalers and retailers, utilities, trading companies, energy companies, industrial end-users and financial institutions active on the energy and financial markets. Fortum also has credit exposure toward customers and suppliers consisting of industrial counterparties, energy companies, government and municipal entities, utilities, small businesses, housing associations and private individuals, over a range of geographic regions. Credit defaults have not yet had a significant impact, but if the pandemic continues for a longer period of time without extension of effective support schemes for affected businesses, we expect to see increased default rates and delayed payments from customers, especially in the small and medium businesses in high-risk sectors and from non-investment grade counterparties that have been weakened economically by the pandemic. Fortum applies the expected credit loss model when recognising loss allowances for expected credit losses on financial assets. A similar model is applied when making credit value adjustments to the fair value of derivatives contracts. The model inputs have been reviewed taking into account the ongoing Covid-19 pandemic. There is no significant increase in credit losses due to Covid-19, however, the probability of defaults used in the expected credit loss model have been increased compared to before the pandemic, resulting in slightly higher loss allowances and credit value adjustments.
Fortum has further assessed whether there are any indications for impairment based on internal and external sources of information, such as the effects of the Covid-19. Fortum does not currently foresee that Covid-19 would have such long-term effects that it would impact the overall values of its non-current assets, such as property, plant and equipment and intangible assets. See Note 16 Intangible assets for details on 2020 impairment testing.
Discount rates for pension plans were updated to reflect the fall in interest rates, which led to a corresponding increase in pension provisions during 2020. See Note 30 Pension obligations.
1
2
3
4
5
6
7
8
9
10
11
12
13
14
15
16
17
18
19
20
21
22
23
24
25
26
27
28
29
30
31
32
33
34
35
36
37
38
39

OPERATING AND FINANCIAL
REVIEW
CONSOLIDATED FINANCIAL
STATEMENTS NOTES KEY
FIGURES
PARENT COMPANY FINANCIAL
STATEMENTS
SIGNATURES FOR THE OPERATING AND FINANCIAL REVIEW AND
FINANCIAL STATEMENTS AUDITOR’S
REPORT
KEY FIGURES
2011–2020
QUARTERLY FINANCIAL
INFORMATION INVESTOR
INFORMATION 5511
Basis of preparation Risks Income statement Balance sheet Off balance sheet items Group structure and related parties
3 Acquisitions, disposals and assets held for sale ACCOUNTING POLICIES
SUBSIDIARIES Acquisition of subsidiaries are accounted for using the acquisition method. The consideration transferred is measured as the aggregate of acquisition date fair values of acquired net assets. Identifiable assets acquired and liabilities assumed are measured initially at acquisition date fair values, irrespective of the extent of any minority interest. The excess of the cost of acquisition over the fair value of the identifiable net assets acquired is recorded as goodwill.
Subsidiaries are fully consolidated from the date on which control is transferred to the Group and are no longer consolidated from the date that control ceases. See Note 1.3 Principles for consolidation.
ASSETS HELD FOR SALE Assets or disposal groups are classified as assets held for sale if their carrying amounts will be recovered principally through a sale transaction rather than through continuing use. For this to be the case, the asset, or the disposal group, must be available for immediate sale in its present condition subject only to terms that are usual and customary for sales of such assets or disposal groups, and the sale must be highly probable. These assets, or in the case of disposal groups, assets and liabilities, are presented separately on the consolidated balance sheet and measured at the lower of the carrying amount and fair value less costs to sell. Assets classified as held for sale, or included in a disposal group classified as held for sale, are not depreciated.
CRITICAL ACCOUNTING ESTIMATES AND JUDGMENTS: UNIPER PURCHASE PRICE ALLOCATION Preparing purchase price allocation requires management to make judgements when determining the fair value of the assets acquired and liabilities assumed. In the Uniper transaction, determining the fair values of property, plant and equipment and right-of-use assets, lease liabilities, provisions, contingent liabilities and long-term purchase obligations has required management judgement.
3.1 Acquisitions EUR million 2020 2019 Gross investments in shares in subsidiary companies 3,646 13 Gross investments in shares in associated companies and joint ventures 119 73 Gross investments in other shares 42 20 Total 3,807 106
3.1.1 Acquisitions of subsidiary companies 2020
Uniper acquisition in March 2020 On 8 October 2019, Fortum entered into agreements to acquire all the shares held by funds managed by Elliott Management Corporation and its affiliates (“Elliott”) and Knight Vinke Energy Advisors Limited and its affiliates (“Knight Vinke“). The transaction was closed in two tranches. Control over Uniper was acquired on 26 March 2020 upon closing of the first tranche of the agreement, 19.6% of the shares. A liability for the maximum amount of shares in the second tranche, 3.8% of the shares, was recognised on the acquisition date. The second tranche of the agreement was closed on 8 May 2020 with the maximum amount of shares.
At 31 March 2020 Fortum’s consolidated stake in Uniper was 73.4%. The total purchase consideration for the combined shareholding was EUR 2.6 billion, which increased Fortum’s total investment in Uniper to EUR 6.5 billion.
EUR million Uniper Acquisition of shares 2,858 Liquid funds in acquired companies -1,328 Acquisition of shares in cash flow 1,530 Interest-bearing liabilities in acquired companies 1,414 Other financial net debt in acquired companies 596 Gross investments in shares 3,540
Acquisition accounting The purchase price allocation on the Uniper acquisition is being finalised and will be completed within the one-year window from the acquisition date, i.e. by 31 March 2021. The preliminary purchase price allocation for the Uniper acquisition has resulted in adjustments to Uniper’s 31 March 2020 opening balance sheet. Fair value adjustments were mainly made to property, plant and equipment and right-of-use assets, participations in associates and joint ventures, lease liabilities, other provisions, and deferred taxes. See Note 1.7 Summary of Uniper acquisition impact to consolidated financial statements. Excess of the acquisition value over Uniper’s net assets is presented as preliminary goodwill.
Fortum elected to measure non-controlling interest in Uniper based on the proportionate value of acquired net assets. Any adjustments to the fair values of the assets acquired and liabilities assumed will impact the value of non-controlling interest.
1
2
3
4
5
6
7
8
9
10
11
12
13
14
15
16
17
18
19
20
21
22
23
24
25
26
27
28
29
30
31
32
33
34
35
36
37
38
39

OPERATING AND FINANCIAL
REVIEW
CONSOLIDATED FINANCIAL
STATEMENTS NOTES KEY
FIGURES
PARENT COMPANY FINANCIAL
STATEMENTS
SIGNATURES FOR THE OPERATING AND FINANCIAL REVIEW AND
FINANCIAL STATEMENTS AUDITOR’S
REPORT
KEY FIGURES
2011–2020
QUARTERLY FINANCIAL
INFORMATION INVESTOR
INFORMATION 5522
Basis of preparation Risks Income statement Balance sheet Off balance sheet items Group structure and related parties
Acquired net assets are presented in the following table. EUR million 31 Mar 2020 ASSETS Goodwill 1,779 Other intangible assets 980 Property, plant and equipment and right-of-use assets 9,268 Participations in associates and joint ventures 750 Derivative financial instruments 21,958 Interest-bearing receivables 1,840 Shares in Nuclear Waste Funds 1,602 Margin receivables 413 Trade and other receivables 7,236 Deferred and income tax assets 1,021 Inventories 1,565 Liquid funds 1,328 Total assets 49,739 LIABILITIES Derivative financial instruments 21,084 Interest-bearing liabilities 1,575 Pension obligations 953 Nuclear provisions 1,758 Other provisions 3,935 Deferred and income tax liabilities 348 Margin liabilities 924 Trade and other payables 7,852 Total liabilities 38,428 Net assets on Uniper's balance sheet 11,312 Less goodwill on Uniper's balance sheet 1) -1,779 Net assets from Uniper excluding goodwill 9,533 Purchase consideration 2,587 Previously held equity interest 4,613 Acquisition value 7,201 Non-controlling interest on Uniper's balance sheet -424 Non-controlling interest from Uniper acquisition -2,423 Total non-controlling interest (NCI) -2,847 Preliminary goodwill 515 1) Goodwill on Uniper’s balance sheet is deducted as it is not an identifiable asset of Fortum according to IFRS.
Acquired net assets are based on Uniper’s first quarter financial report published on 7 May 2020. Balance sheet line items have been classified in accordance with Fortum’s balance sheet categorisation and, as such, is not fully comparable to Uniper’s standalone balance sheet. Further, Fortum and Uniper are both co-owners in the Swedish nuclear company OKG AB. OKG AB is consolidated into Uniper Group as a subsidiary with a 45.5% minority representing Fortum’s ownership in OKG AB. Fortum accounted for the shareholding in OKG AB as an associated company until 31 March 2020, and consolidated OKG AB as a subsidiary from 31 March 2020.
Shareholding in Uniper has been acquired in stages as Fortum held 49.99% of Uniper shares prior to the acquisition of control on 26 March 2020. Under IFRS, the previously held associated company interest is fair valued upon gaining control, and any gain or loss from the difference between the balance sheet value and the fair value of the interest is recognised to the consolidated income statement. The fair value of the previously held associated company interest in Uniper was EUR 4,613 million. The fair value was based on Uniper share price at 26 March 2020, slightly adjusted by a premium for significant influence. There are no significant unobservable inputs used in the valuation (market approach corresponding to fair value hierarchy level 2). No gain or loss was recognised from fair valuing the previously held equity interest as the fair value was approximately equal to the carrying amount.
Acquisition-related costs of EUR 20 million are included in items affecting comparability in the consolidated income statement. See Note 7 Items affecting comparability.
Preparing a purchase price allocation requires management to make judgements when determining the fair values of the assets acquired and liabilities assumed. The preliminary purchase price allocation may change when analyses are conducted and further information becomes available. Any adjustments to the fair values of the assets acquired and liabilities assumed will impact the preliminary estimate of goodwill. These adjustments may be material. Fortum expects to conduct further analysis to assess the fair values of items such as property, plant and equipment, provisions, contingent liabilities and long-term purchase obligations.
See Note 6 Segment reporting for Uniper’s impact on Fortum’s consolidated income statement.
3.1.2 Acquisitions of subsidiary companies 2019 In May 2019, Fortum announced the restructuring of Fortum’s and Skellefteå Kraft’s ownership in the two jointly owned Swedish wind parks Solberg and Blaiken. Through an asset swap arrangement Fortum, became the sole owner of the 76-MW Solberg wind park and Skellefteå Kraft the sole owner of the 248-MW Blaiken wind park. Both the investments in Solberg and divestment of Blaiken includes shares and assets. The asset swap arrangement was finalised in August 2019 and had only a minor impact on Fortum’s cash flow and results.
3.1.3 Other share transactions During 2020 Fortum invested EUR 25 million (2019: 66) to the wind investment fund 50/50 owned by Fortum and RUSNANO in Russia.
During 2020, Fortum’s joint venture, the Fortum-Rusnano Wind Investment Fund, sold the 50-MW Ulyanovsk 2 and the 300-MW Rostov wind farms to a new joint venture recently established with Russian Direct Investment Fund (RDIF) aimed at the operation of renewable power plants in Russia.
1
2
3
4
5
6
7
8
9
10
11
12
13
14
15
16
17
18
19
20
21
22
23
24
25
26
27
28
29
30
31
32
33
34
35
36
37
38
39

OPERATING AND FINANCIAL
REVIEW
CONSOLIDATED FINANCIAL
STATEMENTS NOTES KEY
FIGURES
PARENT COMPANY FINANCIAL
STATEMENTS
SIGNATURES FOR THE OPERATING AND FINANCIAL REVIEW AND
FINANCIAL STATEMENTS AUDITOR’S
REPORT
KEY FIGURES
2011–2020
QUARTERLY FINANCIAL
INFORMATION INVESTOR
INFORMATION 5533
Basis of preparation Risks Income statement Balance sheet Off balance sheet items Group structure and related parties
3.2 Disposals
EUR million 2020 2019 Gross divestments of shares in subsidiary companies 1,156 15 Gross divestments of shares in associated companies and joint ventures 31 10 Gross divestments of other investments 40 4 Total 1,226 30
3.2.1 Disposals of subsidiary companies In December 2019, Fortum signed an agreement to sell its district heating business in Joensuu, Finland to Savon Voima Oyj. The total consideration on a debt- and cash-free basis was approximately EUR 530 million. The transaction was completed on 10 January 2020, and Fortum recorded a tax-exempt capital gain of EUR 431 million in the City Solutions segment’s 2020 results.
In December 2019, Fortum and Credit Suisse Energy Infrastructure Partners (CSEIP) signed an agreement whereby funds advised by CSEIP acquired an 80% stake in Fortum’s Nordic wind portfolio. The total consideration on a debt- and cash-free basis was approximately EUR 170 million. The transaction, excluding the Sørfjord wind park, which was still under construction, was closed on 14 May 2020.
On 27 April 2020, Fortum signed an agreement to sell 60% of its public charging point operator, Fortum Recharge AS, for electrical vehicles in the Nordics to Infracapital. The transaction closed on 29 May 2020, and Fortum recorded a tax-exempt capital gain of EUR 72 million in Other Operation’s 2020 results. The cash consideration was EUR 87 million.
On 3 July, Fortum announced it had agreed to sell the district heating business in Järvenpää, Finland for EUR 375 million to a consortium consisting of Vantaa Energy Ltd, Infranode, and Keva. Fortum completed the transaction on 19 August 2020 and recorded a tax-exempt capital gain of EUR 291 million in the City Solutions segment’s 2020 results.
In December 2020, Fortum decided to sell eight small hydropower plants in Sweden with an average annual power generation of 0.1 TWh to Downing Renewables & Infrastructure Trust plc. The total purchase price on a debt and cash free basis is EUR 64.5 million. The transaction closed on 2 February 2021.
During 2019 there were no material divestments.
Divestments of shares in subsidiaries - Impact on financial position EUR million 2020 2019 Gross divestments of shares in subsidiary companies 1,156 15 Intangible assets and property, plant and equipment 394 9 Other non-current and current assets 66 1 Liquid funds 10 0 Interest-bearing loans -250 - Other liabilities and provisions -79 -1 Net assets divested 142 9 Reclassified to participations in associates and joint ventures 11 - Result from transaction 794 7
3.2.2 Other disposals In August 2019, the restructuring of Fortum’s and Skellefteå Kraft’s ownership in the two jointly owned Swedish wind parks Solberg and Blaiken was finalised. See Note 3.1.2 Acquisitions of subsidiary companies 2019 for additional information.
1
2
3
4
5
6
7
8
9
10
11
12
13
14
15
16
17
18
19
20
21
22
23
24
25
26
27
28
29
30
31
32
33
34
35
36
37
38
39

OPERATING AND FINANCIAL
REVIEW
CONSOLIDATED FINANCIAL
STATEMENTS NOTES KEY
FIGURES
PARENT COMPANY FINANCIAL
STATEMENTS
SIGNATURES FOR THE OPERATING AND FINANCIAL REVIEW AND
FINANCIAL STATEMENTS AUDITOR’S
REPORT
KEY FIGURES
2011–2020
QUARTERLY FINANCIAL
INFORMATION INVESTOR
INFORMATION 5544
Basis of preparation Risks Income statement Balance sheet Off balance sheet items Group structure and related parties
3.3 Assets held for sale Assets held for sale at 31 December 2020 include Schkopau lignite-fired power plant (Uniper segment) and Sørfjord wind park (Generation segment).
In February 2020, Uniper signed an agreement with Saale Energie GmbH, a subsidiary of the Czech company Energetický a průmyslový holding, a. s., on the sale of the interest in the Schkopau lignite-fired power plant in Germany. Uniper is the operator of the power plant and holds a stake of about 58%. Saale Energie holds a stake of around 42% in the Schkopau power plant and will take over Uniper’s stake effective 1 October 2021. The proceeds from the sale will be determined when the transaction closes on 1 October 2021, taking into account various purchase price adjustment clauses.
In December 2019, Fortum and Credit Suisse Energy Infrastructure Partners (CSEIP) signed an agreement whereby funds advised by CSEIP acquired an 80% stake in Fortum’s Nordic wind portfolio. The transaction, excluding the Sørfjord wind park which was still under construction, was closed on 14 May 2020. The transaction on Sørfjord wind park was closed on 20 January 2021.
Assets held for sale at 31 December 2019 included the Nordic wind portfolio, excluding the Sørfjord wind park which was still under construction (Generation segment); as well as the district heating business in Joensuu, Finland (City Solutions segment). These transactions were closed on 14 May 2020 and 10 January 2020, respectively.
EUR million 31 Dec 2020 31 Dec 2019 Assets held for sale Intangible assets and property, plant and equipment and right-of-use assets 230 290 Deferred tax assets 9 0 Other non-current and current assets 96 15 Liquid funds 0 2 Total 335 307 Liabilities related to assets held for sale Interest-bearing liabilities 43 6 Deferred tax liabilities 33 20 Pension and asset retirement obligations 18 - Other liabilities and provisions 112 26 Total 206 52
1
2
3
4
5
6
7
8
9
10
11
12
13
14
15
16
17
18
19
20
21
22
23
24
25
26
27
28
29
30
31
32
33
34
35
36
37
38
39

OPERATING AND FINANCIAL
REVIEW
CONSOLIDATED FINANCIAL
STATEMENTS NOTES KEY
FIGURES
PARENT COMPANY FINANCIAL
STATEMENTS
SIGNATURES FOR THE OPERATING AND FINANCIAL REVIEW AND
FINANCIAL STATEMENTS AUDITOR’S
REPORT
KEY FIGURES
2011–2020
QUARTERLY FINANCIAL
INFORMATION INVESTOR
INFORMATION 5555
Basis of preparation Risks Income statement Balance sheet Off balance sheet items Group structure and related parties
4 Financial risk management Fortum's risk management framework, objectives, organization and processes as well as a description of strategic, sustainability, financial and operational risks can be found in the Risk management section of the Operating and financial review (OFR).
Uniper was consolidated to Fortum as a subsidiary as of March 31, 2020 and Uniper is a separate reportable segment of Fortum. Additionally, Uniper is a separate listed company operating under German laws and regulations with its own risk management systems including a set of risk policies defining the risk management organisation principles, processes and responsibilities. Uniper does not directly apply the risk management systems applicable to other Fortum segments, however its key risk management principles and processes are materially similar.
4.1 Commodity market and fuel risks Fortum’s business is exposed to fluctuations in prices and availability of commodities used in the production, transmission and sales of energy products. The main exposure is toward electricity prices and volumes, gas prices and volumes, prices of emissions and prices and availability of fuels. Fortum hedges its exposure to commodity market risks in order to reduce volatility in cash flow and to increase the predictability of future results.
Risk management for commodity hedging and trading activities is based on general standards in the industry and involves the segregation of duties as well as daily calculation, monitoring and reporting of results, positions and risks. Instructions and guidelines, and controls are in place to ensure exposures are kept within approved limits and mandates. Hedging involves the use of derivative financial instruments as well as fixed-price physical delivery contracts.
The derivatives are also entered into for proprietary trading purposes. This takes place exclusively in the compliance with tight internal and regulatory restrictions.
4.1.1. Sensitivity arising from commodity derivatives according to IFRS 7 Sensitivity analysis shows the sensitivity arising from financial commodity derivatives as defined in IFRS 7. Sensitivities are presented with most descriptive measure about the risk management and usage of derivatives in Uniper segment and other Fortum’s segments.
Fortum, excluding Uniper In Fortum, excluding Uniper, derivatives are used for hedging purposes with hedge accounting applied to most hedging strategies. Sensitivities in the table below are calculated based on the electricity position as of 31 December 2020 (31 December 2019). Positions are actively managed in the day-to-day business operations and therefore the sensitivities vary from time to time. Sensitivity analysis includes only the market risks arising from derivatives i.e. the underlying physical electricity sales and purchases are not included. Sensitivity is calculated with the assumption that electricity forward and futures quotations would change 1 EUR/MWh for the period Fortum, excluding Uniper, has derivatives.
Sensitivity according to IFRS 7 +/- 1 EUR/MWh change in electricity forward and futures quotations, EUR million Effect 2020 2019 Effect on profit before income tax -/+ 1 4 Effect on equity -/+ 58 49
Uniper In Uniper, derivatives are used mainly for hedging, but also for proprietary trading purposes. Hedge accounting is not applied in Uniper for commodity derivatives.
Commodity price risks in Uniper are measured based on a value-at-risk approach with 95% confidence interval and take into account the amount of open position as well as the prices, their volatility and the liquidity on the respective markets. Value-at-risk figures are supplemented by stop-loss and volume based indicators. When necessary, additional portfolio-specific restrictions are set.
Based on the current Uniper portfolio, as of December 2020, the calendar year based, weighted value-at-risk, which takes market liquidities into account and ignores correlations between years, was EUR 463 million for financial and physical commodity positions covering next three years.
4.1.2. Electricity price and volume risk Electricity price and volume risk in the Nordic region is the largest commodity market risk exposure for Fortum. The exposure arising from outright power production (hydro and nuclear production assets) is mainly hedged by entering into electricity derivatives contracts on exchanges such as Nasdaq Commodities exchange or the European Energy Exchange as well as directly with counterparties active in the energy and financial markets. The main objective of hedging is to reduce the effect of electricity price volatility on cash flows and to increase the predictability of future results. The Generation segment and Uniper have separate hedging strategies covering several years in the short to medium term. These hedging strategies are executed within approved mandates and are continuously evaluated as electricity and other commodity market prices, the hydrological balance and other relevant parameters change.
Generation segment’s hedging for power sales is performed in EUR on a Nordic level covering both Finland and Sweden. The currency component of these hedges in the Swedish entity is currently not hedged. Generation segment’s sensitivity to the Nordic electricity market price is dependent on the hedge level for a given time period. As per 31 December 2020, approximately 75% of the Generation segment's estimated Nordic power sales volume was hedged for the calendar year 2021 with a price 33 EUR/MWh and approximately 50% for the calendar year 2022 with a price 31 EUR/MWh.
Uniper segment’s power hedging is performed in EUR only in Sweden as there is no electricity production in other Nordic countries. The currency exposure in the Swedish entity is hedged according to a separate hedging strategy. Uniper segment’s sensitivity to the Nordic electricity price is dependent on the hedge level for a given time period. The Uniper segment’s Nordic generation hedges as per 31 December 2020 was approximately 90% at 27 EUR/MWh for 2021, and approximately 65% at 24 EUR/MWh for 2022.
In the Russia segment, electricity prices are the main sources of market risk. The electricity price is highly correlated with the gas price. Exposure is partly mitigated through regulated fixed-price bilateral agreements, but the majority of electricity sales is exposed to spot price risk. There are no derivatives contracts in Russia segment.
1
2
3
4
5
6
7
8
9
10
11
12
13
14
15
16
17
18
19
20
21
22
23
24
25
26
27
28
29
30
31
32
33
34
35
36
37
38
39
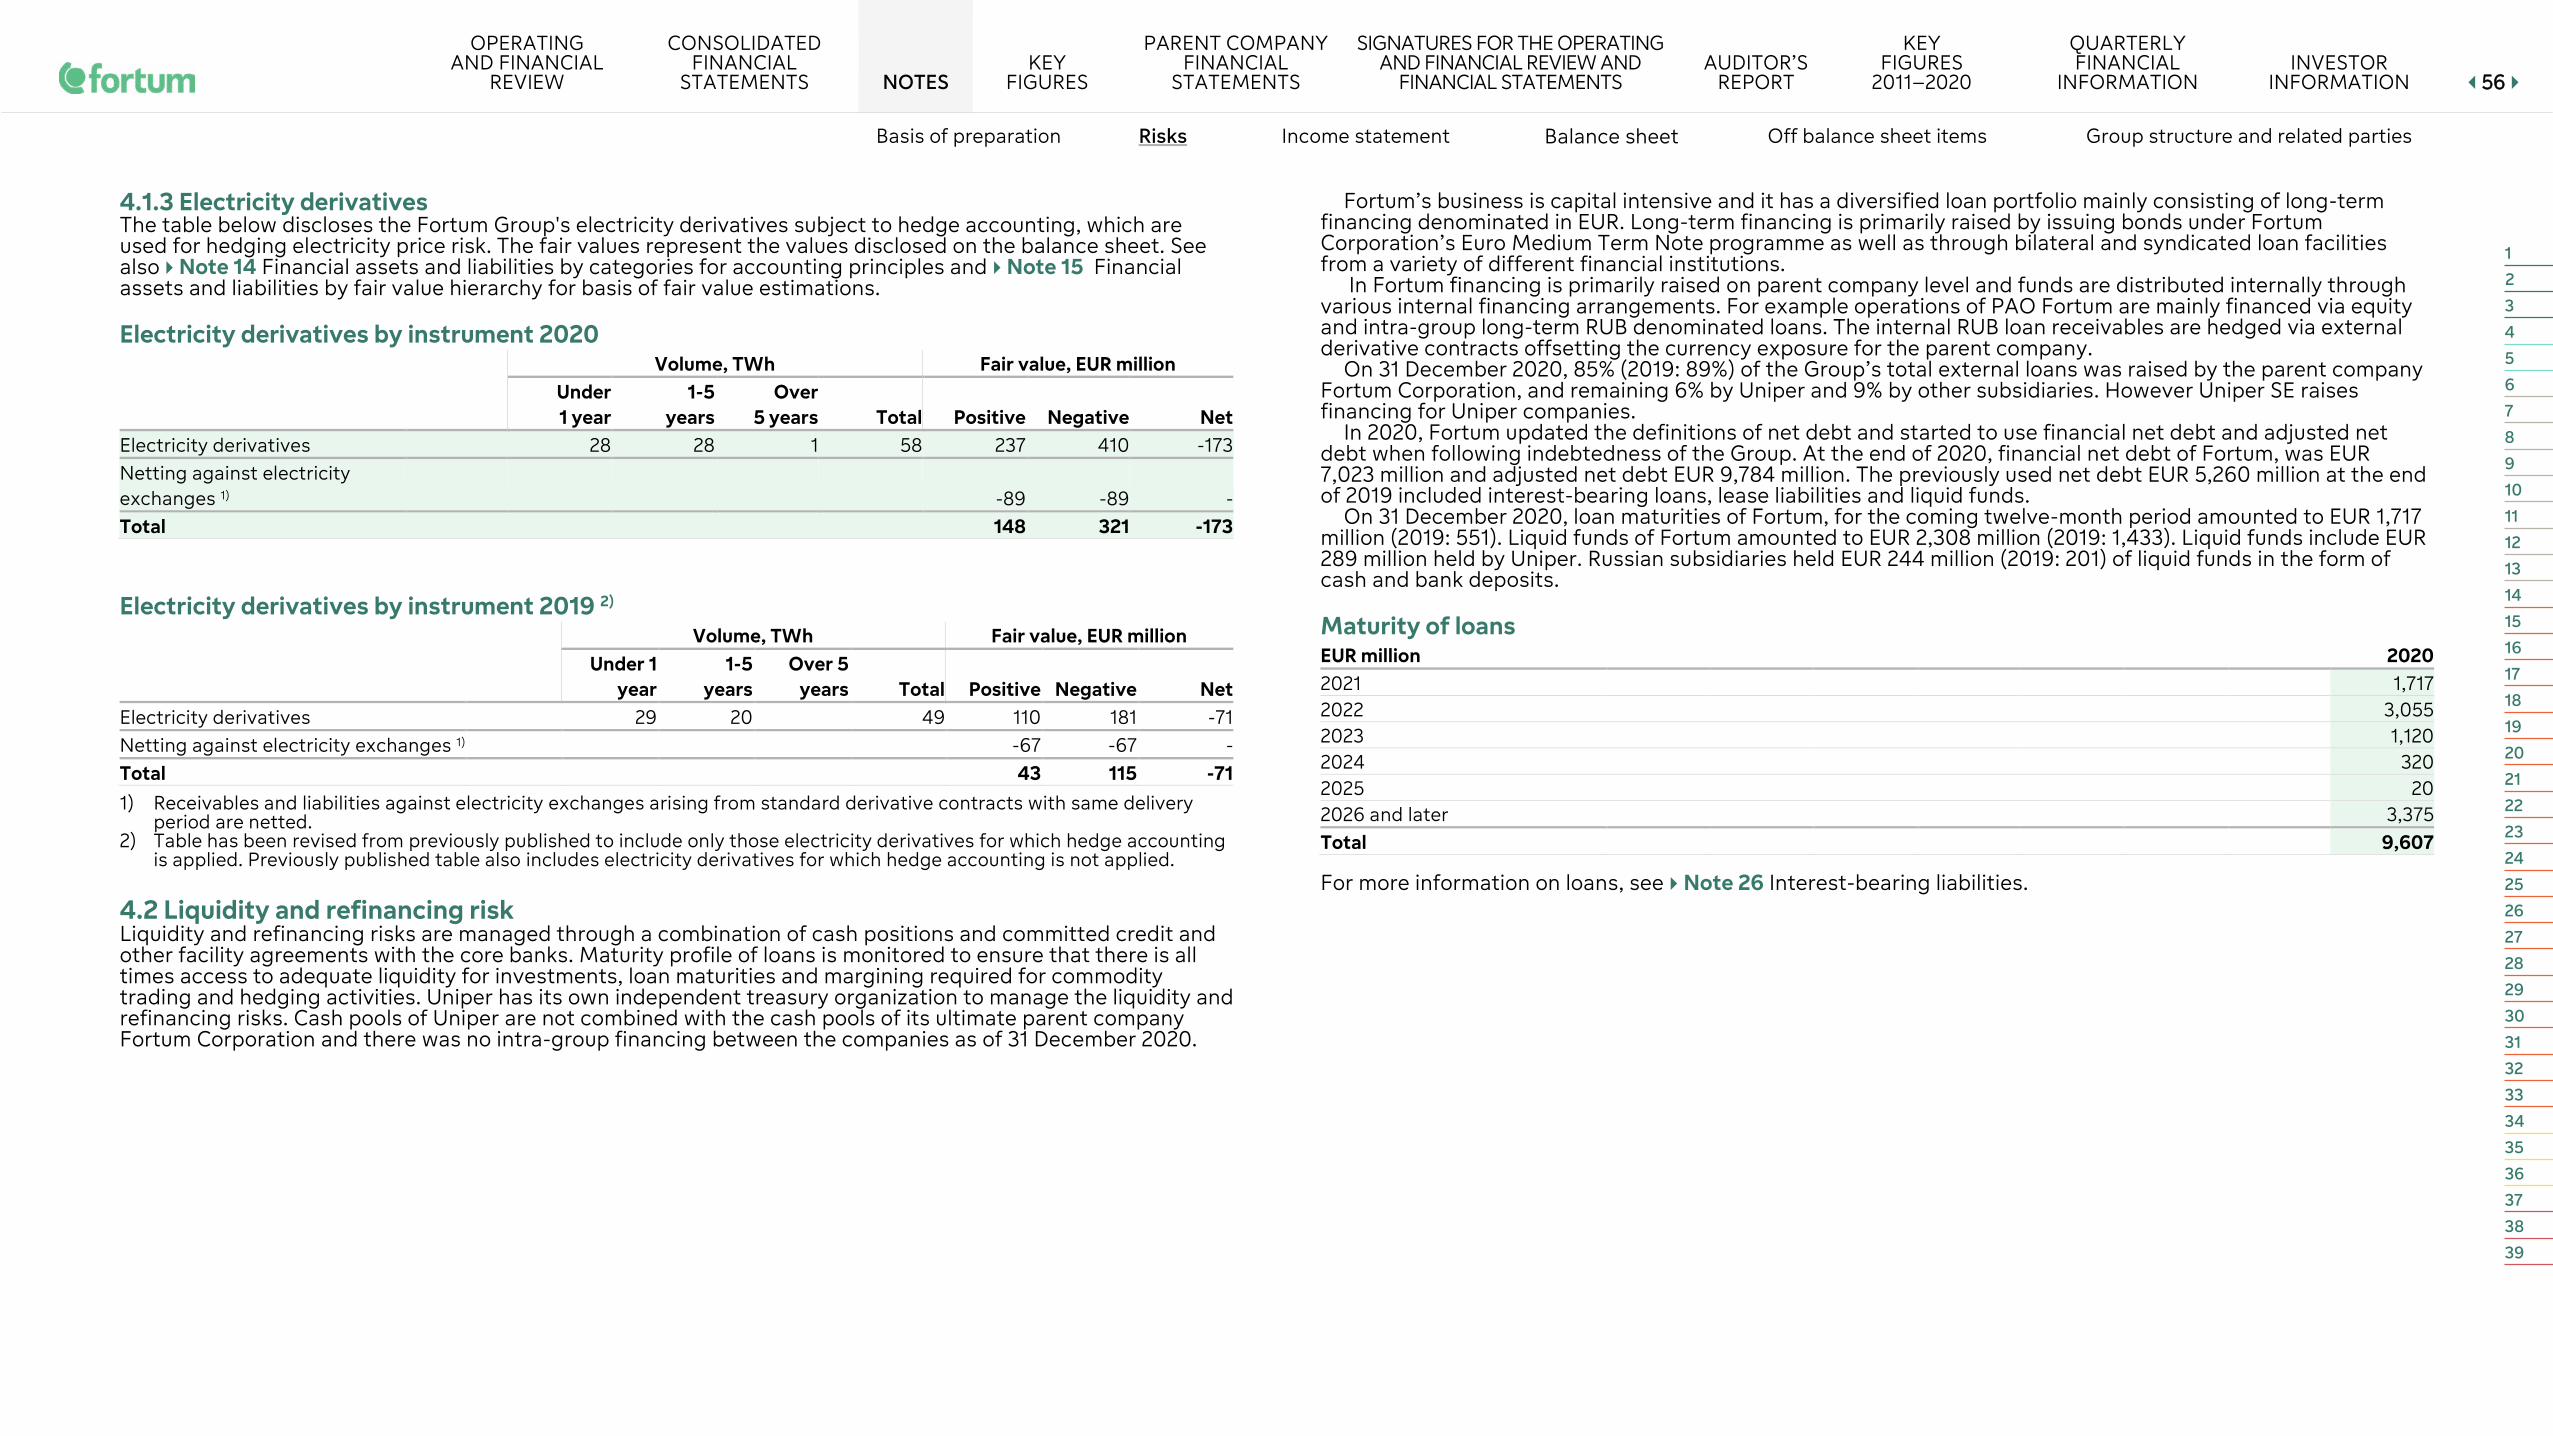
OPERATING AND FINANCIAL
REVIEW
CONSOLIDATED FINANCIAL
STATEMENTS NOTES KEY
FIGURES
PARENT COMPANY FINANCIAL
STATEMENTS
SIGNATURES FOR THE OPERATING AND FINANCIAL REVIEW AND
FINANCIAL STATEMENTS AUDITOR’S
REPORT
KEY FIGURES
2011–2020
QUARTERLY FINANCIAL
INFORMATION INVESTOR
INFORMATION 5566
Basis of preparation Risks Income statement Balance sheet Off balance sheet items Group structure and related parties
4.1.3 Electricity derivatives The table below discloses the Fortum Group's electricity derivatives subject to hedge accounting, which are used for hedging electricity price risk. The fair values represent the values disclosed on the balance sheet. See also Note 14 Financial assets and liabilities by categories for accounting principles and Note 15 Financial assets and liabilities by fair value hierarchy for basis of fair value estimations.
Electricity derivatives by instrument 2020 Volume, TWh Fair value, EUR million
Under 1 year
1-5 years
Over 5 years Total Positive Negative Net
Electricity derivatives 28 28 1 58 237 410 -173 Netting against electricity exchanges 1) -89 -89 - Total 148 321 -173
Electricity derivatives by instrument 2019 2)
Volume, TWh Fair value, EUR million
Under 1
year 1-5
years Over 5
years Total Positive Negative Net Electricity derivatives 29 20 49 110 181 -71 Netting against electricity exchanges 1) -67 -67 - Total 43 115 -71 1) Receivables and liabilities against electricity exchanges arising from standard derivative contracts with same delivery
period are netted. 2) Table has been revised from previously published to include only those electricity derivatives for which hedge accounting
is applied. Previously published table also includes electricity derivatives for which hedge accounting is not applied.
4.2 Liquidity and refinancing risk Liquidity and refinancing risks are managed through a combination of cash positions and committed credit and other facility agreements with the core banks. Maturity profile of loans is monitored to ensure that there is all times access to adequate liquidity for investments, loan maturities and margining required for commodity trading and hedging activities. Uniper has its own independent treasury organization to manage the liquidity and refinancing risks. Cash pools of Uniper are not combined with the cash pools of its ultimate parent company Fortum Corporation and there was no intra-group financing between the companies as of 31 December 2020.
Fortum’s business is capital intensive and it has a diversified loan portfolio mainly consisting of long-term financing denominated in EUR. Long-term financing is primarily raised by issuing bonds under Fortum Corporation’s Euro Medium Term Note programme as well as through bilateral and syndicated loan facilities from a variety of different financial institutions.
In Fortum financing is primarily raised on parent company level and funds are distributed internally through various internal financing arrangements. For example operations of PAO Fortum are mainly financed via equity and intra-group long-term RUB denominated loans. The internal RUB loan receivables are hedged via external derivative contracts offsetting the currency exposure for the parent company.
On 31 December 2020, 85% (2019: 89%) of the Group’s total external loans was raised by the parent company Fortum Corporation, and remaining 6% by Uniper and 9% by other subsidiaries. However Uniper SE raises financing for Uniper companies.
In 2020, Fortum updated the definitions of net debt and started to use financial net debt and adjusted net debt when following indebtedness of the Group. At the end of 2020, financial net debt of Fortum, was EUR 7,023 million and adjusted net debt EUR 9,784 million. The previously used net debt EUR 5,260 million at the end of 2019 included interest-bearing loans, lease liabilities and liquid funds.
On 31 December 2020, loan maturities of Fortum, for the coming twelve-month period amounted to EUR 1,717 million (2019: 551). Liquid funds of Fortum amounted to EUR 2,308 million (2019: 1,433). Liquid funds include EUR 289 million held by Uniper. Russian subsidiaries held EUR 244 million (2019: 201) of liquid funds in the form of cash and bank deposits.
Maturity of loans EUR million 2020 2021 1,717 2022 3,055 2023 1,120 2024 320 2025 20 2026 and later 3,375 Total 9,607
For more information on loans, see Note 26 Interest-bearing liabilities.
1
2
3
4
5
6
7
8
9
10
11
12
13
14
15
16
17
18
19
20
21
22
23
24
25
26
27
28
29
30
31
32
33
34
35
36
37
38
39

OPERATING AND FINANCIAL
REVIEW
CONSOLIDATED FINANCIAL
STATEMENTS NOTES KEY
FIGURES
PARENT COMPANY FINANCIAL
STATEMENTS
SIGNATURES FOR THE OPERATING AND FINANCIAL REVIEW AND
FINANCIAL STATEMENTS AUDITOR’S
REPORT
KEY FIGURES
2011–2020
QUARTERLY FINANCIAL
INFORMATION INVESTOR
INFORMATION 5577
Basis of preparation Risks Income statement Balance sheet Off balance sheet items Group structure and related parties
Liquid funds, major credit lines and debt programmes 2020
EUR million Total
facility Drawn
amount Available
amount Liquid funds Fortum Corporation 2,019 Uniper 289 Total 2,308
of which in Russia 244 Committed credit lines Fortum Corporation, EUR 1,750 million syndicated credit facility 1,750 - 1,750 Fortum Corporation, EUR 1,450 million syndicated credit facility1) 1,450 - 1,450 Uniper, EUR 1,800 million syndicated credit facility 1,800 - 1,800 Fortum Corporation, Bilateral overdraft facilities 100 - 100 Total 5,100 - 5,100 Debt programmes (uncommitted) Fortum Corporation, CP programme EUR 1,000 million 1,000 120 880 Fortum Corporation, CP programme SEK 10,000 million 997 75 921 Uniper, CP programme EUR 1,800 million 1,800 65 1,735 Fortum Corporation, EMTN programme EUR 8,000 million 8,000 4,195 3,805 Uniper, Debt Issuance programme EUR 2,000 million 2,000 - 2,000 Total 13,797 4,455 9,341
Liquid funds, major credit lines and debt programmes 2019
EUR million Total
facility Drawn
amount Available
amount Liquid funds Cash and cash equivalents 1,357 Deposits and securities over 3 months 76 Total 1,433
of which in Russia (PAO Fortum) 201 Committed credit lines EUR 1,750 million syndicated credit facility 1,750 - 1,750 EUR 8,300 million syndicated credit facility1) 8,300 - 8,300 Bilateral overdraft facilities 50 - 50 Total 10,100 - 10,100 Debt programmes (uncommitted) Fortum Corporation, CP programme EUR 1,000 million 1,000 10 990 Fortum Corporation, CP programme SEK 10,000 million 957 - 957 Fortum Corporation, EMTN programme EUR 8,000 million 8,000 4,196 3,804 Total 9,957 4,206 5,751 1) In 2019, Fortum signed committed credit facilities of EUR 8.3 billion for the purchase of Uniper shares announced on 8
October 2019 and for the liquidity purposes. At the end of 2020 Fortum had EUR 2.0 billion drawn and outstanding under the facilities and EUR 1.45 billion available. The rest of the facilities (EUR 4.85 billion) was either prepaid or cancelled during 2020. For further information, see Note 23 Liquid funds and Note 26 Interest-bearing liabilities.
Maturity analysis of interest-bearing loans and derivative liabilities
2020 2019
EUR million Under 1 year
1-5 years
Over 5 years Total
Under 1 year
1-5 years
Over 5 years Total
Interest-bearing loans 1,856 4,912 3,711 10,479 661 3,207 3,333 7,201 Commodity derivatives 8,523 3,715 37 12,275 1,146 206 0 1,352 Interest rate and currency derivatives 181 82 37 300 53 53 21 127 Cash outflows of interest-bearing loans and derivatives 10,560 8,709 3,785 23,053 1,860 3,466 3,354 8,680 Interest-bearing loans are non-discounted expected cash flows including future interest payments and amortisations. For derivative contracts that are settled in cash or another financial instrument, the amounts represent the fair value of the derivative liability before any offsetting of assets and liabilities in the balance sheet. Commodity purchase contracts with physical settlement included within the scope of IFRS 9 (“failed own use transactions”) are presented at the contractually agreed settlement amount.
1
2
3
4
5
6
7
8
9
10
11
12
13
14
15
16
17
18
19
20
21
22
23
24
25
26
27
28
29
30
31
32
33
34
35
36
37
38
39

OPERATING AND FINANCIAL
REVIEW
CONSOLIDATED FINANCIAL
STATEMENTS NOTES KEY
FIGURES
PARENT COMPANY FINANCIAL
STATEMENTS
SIGNATURES FOR THE OPERATING AND FINANCIAL REVIEW AND
FINANCIAL STATEMENTS AUDITOR’S
REPORT
KEY FIGURES
2011–2020
QUARTERLY FINANCIAL
INFORMATION INVESTOR
INFORMATION 5588
Basis of preparation Risks Income statement Balance sheet Off balance sheet items Group structure and related parties
4.3 Interest rate risk and currency risk
4.3.1 Interest rate risk Fortum is exposed to cash flow risk from changes in interest rates mainly from interest-bearing liabilities and derivatives on a fixed- and floating rate basis. Additionally changes in general interest rate level may have impact on discount rates of various provisions like pension provisions and asset retirement obligations causing changes in amount of adjusted net debt and finance costs without cash flow impact.
Fortum manages the interest rate exposure through a duration target of the loan portfolio (excluding leasing liabilities and provisions), and cash flow at risk limit. Fortum uses different types of financing contracts and interest rate derivative contracts to manage the interest rate exposure and evaluates and develops the strategies in order to find an optimal balance between risk and financing cost.
On 31 December 2020, the duration of the Fortum’s loan portfolio (including derivatives) was 2.0 years (2019: 2.6). Approximately 76% (2019: 65%) of the loan portfolio was on a floating rate basis or fixed rate loans maturing within the next 12-month period. The flow risk, measured as the difference between the base case interest cost estimate and the worst-case scenario estimate for Fortum’s loan portfolio for the coming 12 months, was EUR 16 million (2019: 10).
The average interest rate for the total loan portfolio including derivatives in finance costs was 1.5% at the balance sheet date (2019: 2.3%). Part of the external loans EUR 634 million (2019: 787) have been swapped to RUB and the average interest cost for these loans, including cost for hedging the RUB, was 6.2% at the balance sheet date (2019: 7.8%). The average interest rate of EUR loans was 0.9 % (2019: 0.9%).
4.3.2 Currency risk Fortum’s policy is to hedge major transaction exposures on a local level in the reporting currency of each legal entity in order to avoid exchange differences in the profit and loss statement. An exception is Generation segment’s hedging of power sales in Sweden where the currency component is currently not hedged. Fortum Treasury and Uniper Treasury manage each own risks centrally by executing internal and external currency deals to mitigate the currency risk. Derivatives are used to hedge existing foreign exchange risks, not for proprietary trading.
Fortum transaction exposure, excluding Uniper 2020 2019
EUR million Net
Position Hedge Open Net
Position Hedge Open RUB 455 -455 0 570 -570 - SEK 1,825 -1,825 1 1,439 -1,440 -1 PLN 417 -416 2 439 -439 1 NOK 84 -82 2 245 -244 - INR 86 -86 0 132 -132 - USD -87 89 1 -147 147 - Other -4 4 0 -4 5 1 Total 2,777 -2,771 6 2,674 -2,673 1
Fortum has cash flows, assets and liabilities in currencies other than EUR and is therefore exposed to fluctuations in exchange rates. Currency exposures are divided into transaction exposures (foreign exchange exposures relating to contracted or estimated cash flows and balance sheet items where changes in exchange rates will have an impact on earnings and cash flows) and translation exposure (foreign exchange exposure that arises when profits and balance sheets in foreign entities are consolidated).
Transaction exposures arise mainly from physical and financial trading of commodities, existing and new investments, external and internal financing and shareholder loans. Contracted cash flow exposures shall be hedged to reduce volatility in future cash flows. These hedges normally consist of currency derivative contracts, which are matched against the underlying future cash flow according to maturity. Fortum has currency cash flow hedges both with and without hedge accounting treatment under IFRS. Those currency cash flow hedges for which hedge accounting is not applied are mainly hedging commodity derivatives and create volatility in the operating profit. There was no significant ineffectiveness arising from cash flow hedges in 2020.
As of 31 December 2020 Fortum, excluding Uniper, the one day value at risk (VAR) with 99% confidence from loans, receivables and derivatives was EUR 1.4 million (2019: 2.2) in income statement and EUR 2.4 million (2019: 1.5) in equity. Income statement sensitivity resulted mainly from flows in SEK and NOK and equity sensitivity mainly from flows in RUB, SEK and PLN. For Uniper one day VAR with 99% confidence from translation of deposits and borrowings in foreign currency and derivatives was EUR 18.4 million and resulted primarily from the positions in GBP, USD and SEK.
Translation exposure position includes net investments in foreign subsidiaries and associated companies. Translation exposures in Fortum are generally not hedged as the majority of these assets are considered to be long-term strategic holdings. In Fortum, this means mainly entities operating in Sweden, Russia and UK, whose base currency is not euro.
Exchange differences arising from the translation of the net investment in foreign entities are taken to equity. The net effect of exchange differences on equity attributable to equity holders mainly from RUB and SEK was EUR -492 million in 2020 (2019: 253). Part of this translation exposure has been hedged and the notional amount of foreign currency hedges were -238 million in 2020 (2019: -365). The foreign currency hedge result amounted to EUR 53 million in 2020 (2019: -14). There was no significant ineffectiveness arising from net investment hedges in 2020.
1
2
3
4
5
6
7
8
9
10
11
12
13
14
15
16
17
18
19
20
21
22
23
24
25
26
27
28
29
30
31
32
33
34
35
36
37
38
39

OPERATING AND FINANCIAL
REVIEW
CONSOLIDATED FINANCIAL
STATEMENTS NOTES KEY
FIGURES
PARENT COMPANY FINANCIAL
STATEMENTS
SIGNATURES FOR THE OPERATING AND FINANCIAL REVIEW AND
FINANCIAL STATEMENTS AUDITOR’S
REPORT
KEY FIGURES
2011–2020
QUARTERLY FINANCIAL
INFORMATION INVESTOR
INFORMATION 5599
Basis of preparation Risks Income statement Balance sheet Off balance sheet items Group structure and related parties
Interest rate and currency derivatives by instrument 2020 Notional amount Fair value Remaining lifetimes
EUR million Under 1 year
1-5 years
Over 5 years Total Positive Negative Net
HHeeddggee aaccccoouunnttiinngg Foreign exchange derivatives 304 88 - 392 4 5 -1 Interest rate swaps 825 1,875 1,675 4,375 154 61 93 Cross currency swaps 14 261 - 275 38 3 35 NNoonn--hheeddggee aaccccoouunnttiinngg Foreign exchange derivatives 7,991 1,743 - 9,734 135 228 -93 Interest rate swaps - 20 - 20 - 0 0 Cross currency swaps - 24 - 24 - 1 -1 Total 9,134 4,010 1,675 14,819 331 299 32 Of which long-term 216 118 98 Short-term 115 181 -66
Interest rate and currency derivatives by instrument 2019 Notional amount Fair value Remaining lifetimes
EUR million Under 1 year
1-5 years
Over 5 years Total Positive Negative Net
HHeeddggee aaccccoouunnttiinngg Foreign exchange derivatives 280 97 - 376 3 5 -2 Interest rate swaps - 2,696 1,525 4,221 153 53 100 Cross currency swaps 104 263 - 367 8 17 -9 NNoonn--hheeddggee aaccccoouunnttiinngg Foreign exchange derivatives 3,645 263 - 3,908 9 52 -43 Interest rate swaps - 19 - 19 - - - Cross currency swaps - - - - - - - Total 4,029 3,337 1,525 8,891 172 127 45 Of which long-term 156 74 82 Short-term 16 53 -37
4.4 Credit risk Fortum is exposed to counterparty risk whenever there is a contractual arrangement with an external counterparty.
Credit risk exposures relating to financial derivative instruments are often volatile and include both the replacement risk and the settlement risk. Exchange-traded derivatives are cleared through central clearing parties (CCPs) or through clearing banks while over-the-counter (OTC) derivative contracts are concluded directly with a number of different counterparties including energy wholesalers and retailers, utilities, trading companies, energy companies, industrial end-users and financial institutions active in the financial and energy markets. Currency and interest rate derivative counterparties are limited to investment grade banks and financial institutions. ISDA Master agreements, which include netting clauses and in some cases Credit Support Annex agreements, are in place with most of these counterparties. The majority of commodity derivative counterparties have investment-grade or comparable ratings. Master agreements, such as ISDA, FEMA and EFET, which include netting clauses, are in place with the majority of the counterparties.
Due to the financing needs and management of liquidity, Fortum has counterparty credit exposure towards a number of banks and financial institutions in the form of deposits and towards corporate issuers of commercial papers, mainly in the Nordic market. The majority of the exposure is towards Fortum’s key relationship banks, which are highly creditworthy institutions. Investments in commercial papers were all with investment grade issuers at 31 December 2020. Fortum also has exposure to the Russian financial sector in terms of deposits with financial institutions as well as to banks that provide guarantees for suppliers and contracting parties. Deposits in Russia have been concentrated to the most creditworthy state-owned or controlled banks as well as affiliates of key relationship banks. The creditworthiness of banks and financial institutions is monitored so that mitigating actions can be taken as ratings or the financial situation changes.
Credit risk relating to customers, suppliers and trading partners is spread across a wide range of industrial counterparties, energy companies, government and municipal entities, utilities, small businesses, housing associations and private individuals over a range of geographic regions. The majority of exposure is in the form of trade receivables from the sale of electricity, gas and heat in the Nordic market, continental Europe and Russia. The credit risk in the electricity and heat sales business in Russia is deemed to be higher than in the Nordic and continental European market.
4.4.1 Credit quality of major financial assets Fortum recognises the loss allowance for expected credit losses on financial assets classified to amortised cost category at each reporting date. The impairment model is applied to financial assets such as trade receivables, deposits, commercial papers and loan and other interest-bearing receivables. Please see Note 22 Trade and other receivables for details on expected credit losses recognised for trade receivables.
1
2
3
4
5
6
7
8
9
10
11
12
13
14
15
16
17
18
19
20
21
22
23
24
25
26
27
28
29
30
31
32
33
34
35
36
37
38
39
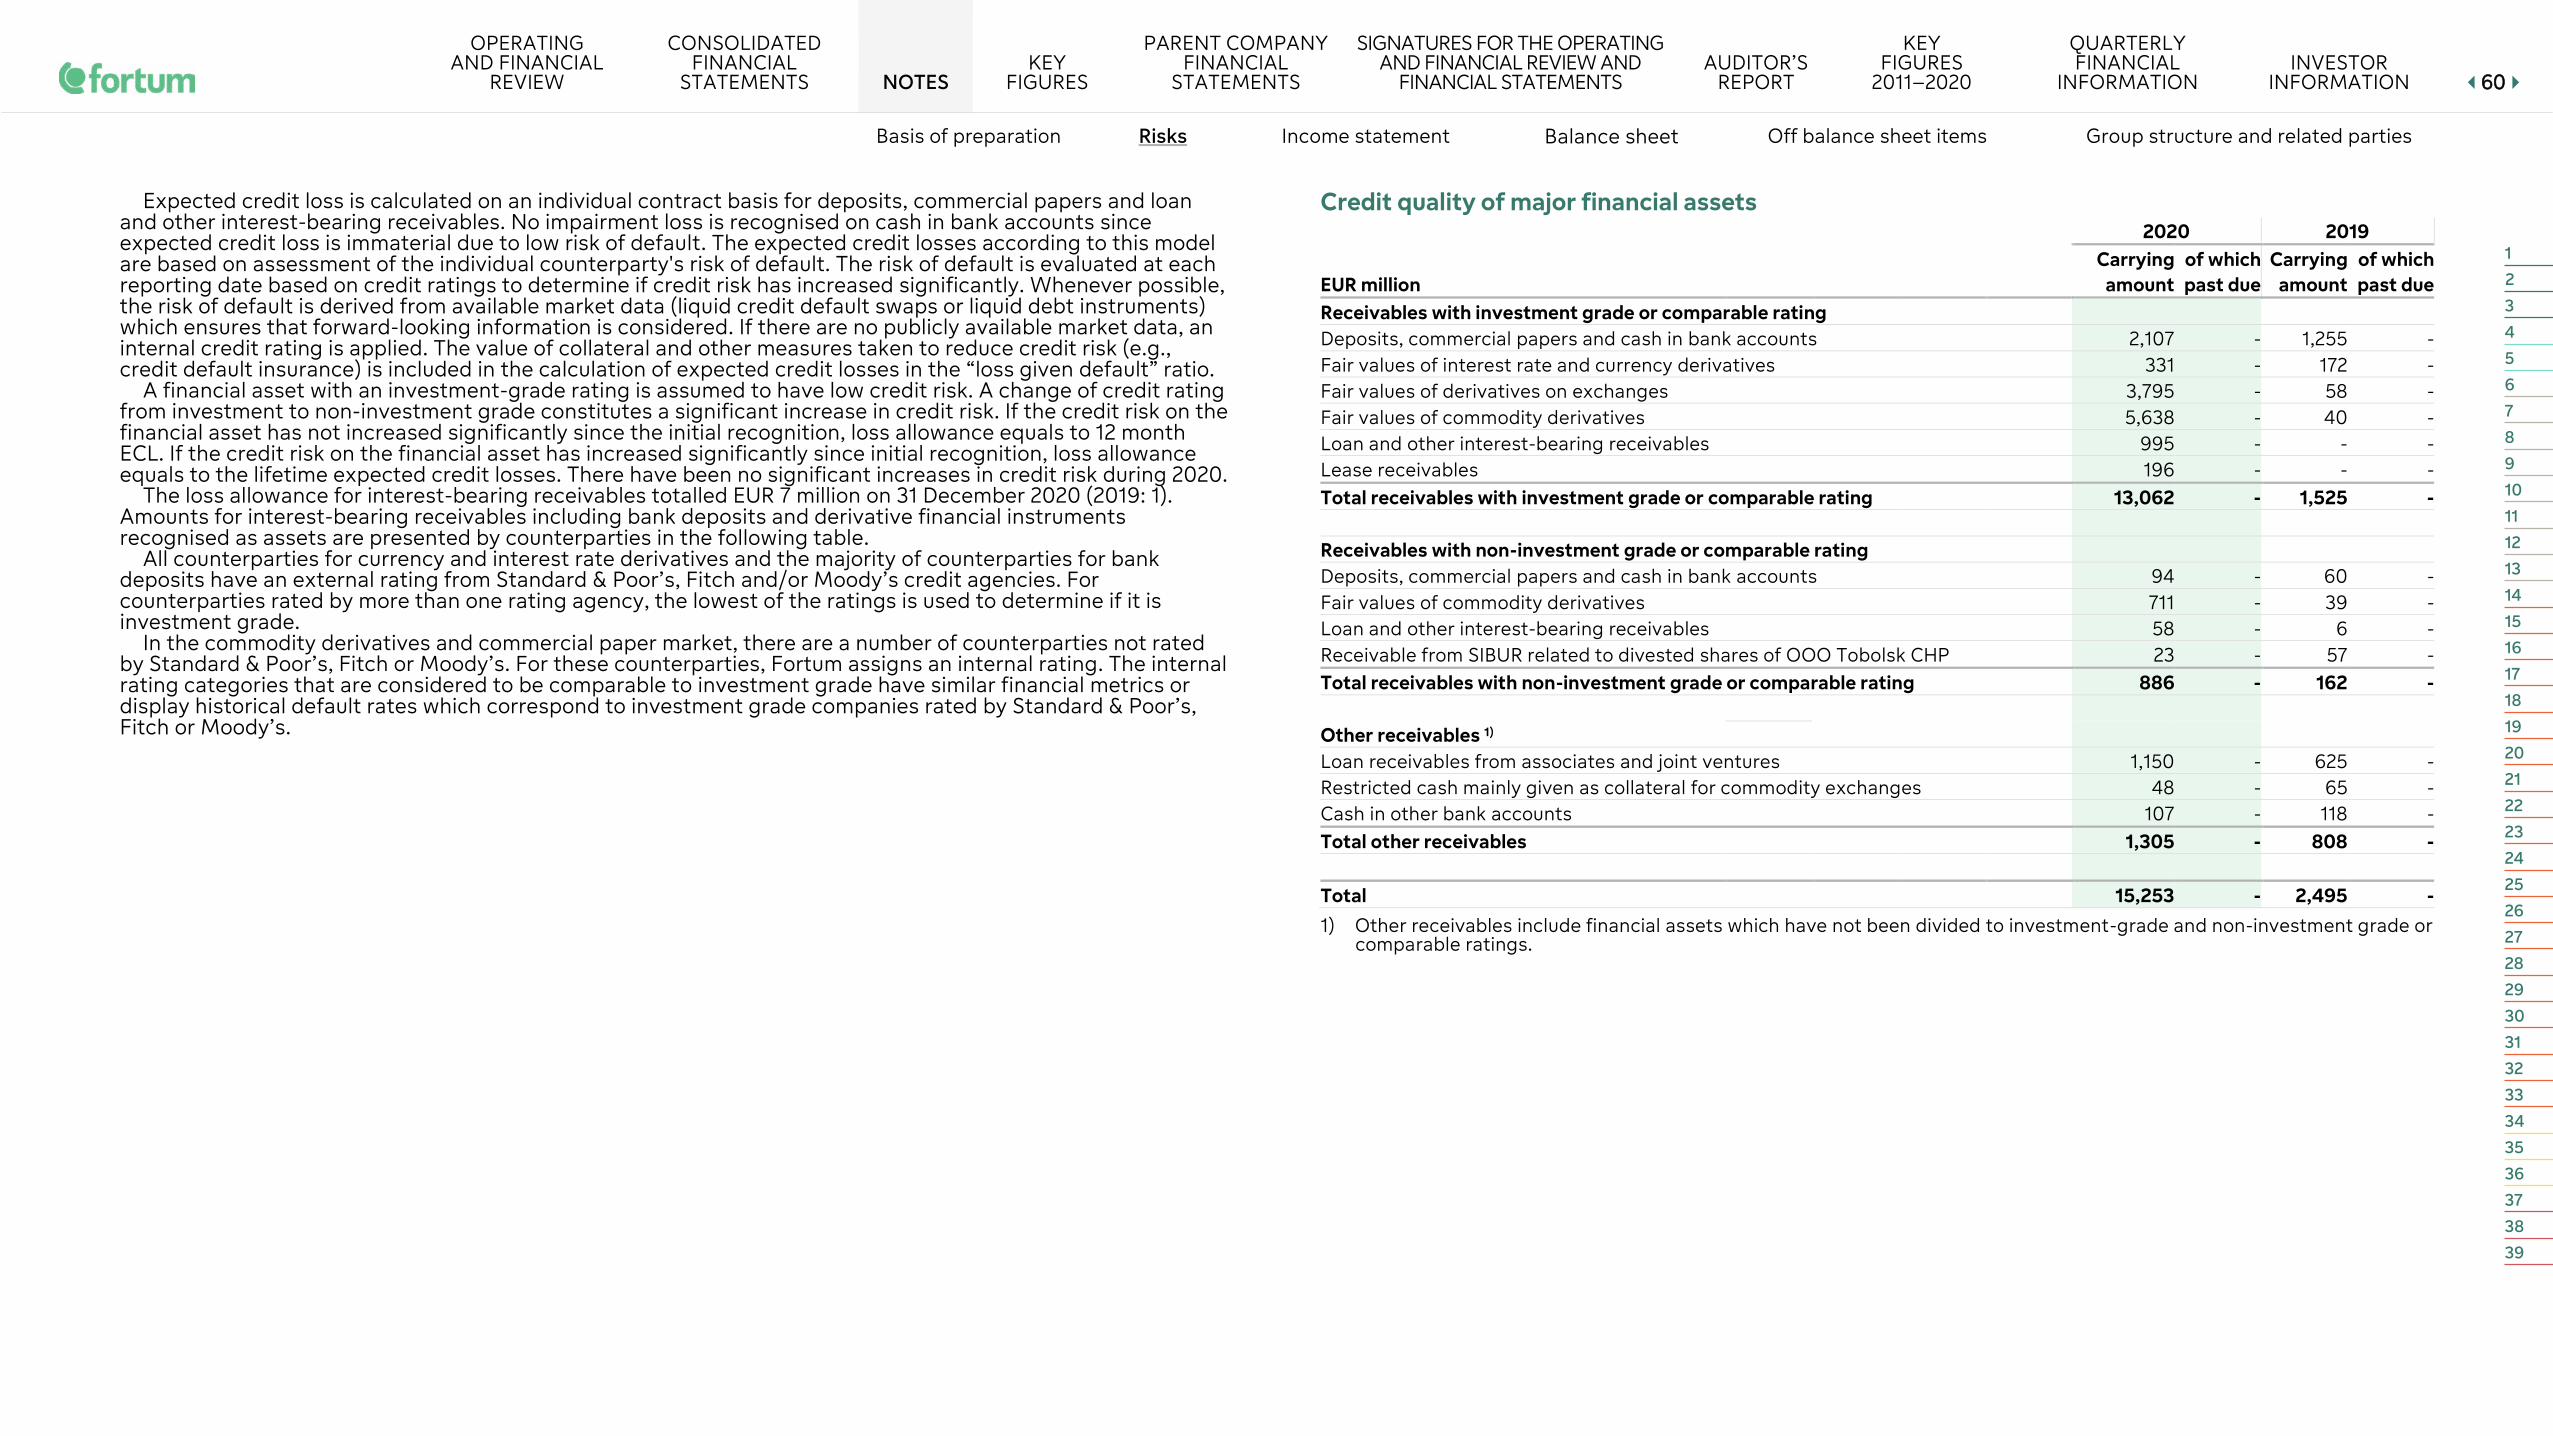
OPERATING AND FINANCIAL
REVIEW
CONSOLIDATED FINANCIAL
STATEMENTS NOTES KEY
FIGURES
PARENT COMPANY FINANCIAL
STATEMENTS
SIGNATURES FOR THE OPERATING AND FINANCIAL REVIEW AND
FINANCIAL STATEMENTS AUDITOR’S
REPORT
KEY FIGURES
2011–2020
QUARTERLY FINANCIAL
INFORMATION INVESTOR
INFORMATION 6600
Basis of preparation Risks Income statement Balance sheet Off balance sheet items Group structure and related parties
Expected credit loss is calculated on an individual contract basis for deposits, commercial papers and loan and other interest-bearing receivables. No impairment loss is recognised on cash in bank accounts since expected credit loss is immaterial due to low risk of default. The expected credit losses according to this model are based on assessment of the individual counterparty's risk of default. The risk of default is evaluated at each reporting date based on credit ratings to determine if credit risk has increased significantly. Whenever possible, the risk of default is derived from available market data (liquid credit default swaps or liquid debt instruments) which ensures that forward-looking information is considered. If there are no publicly available market data, an internal credit rating is applied. The value of collateral and other measures taken to reduce credit risk (e.g., credit default insurance) is included in the calculation of expected credit losses in the “loss given default” ratio.
A financial asset with an investment-grade rating is assumed to have low credit risk. A change of credit rating from investment to non-investment grade constitutes a significant increase in credit risk. If the credit risk on the financial asset has not increased significantly since the initial recognition, loss allowance equals to 12 month ECL. If the credit risk on the financial asset has increased significantly since initial recognition, loss allowance equals to the lifetime expected credit losses. There have been no significant increases in credit risk during 2020.
The loss allowance for interest-bearing receivables totalled EUR 7 million on 31 December 2020 (2019: 1). Amounts for interest-bearing receivables including bank deposits and derivative financial instruments recognised as assets are presented by counterparties in the following table.
All counterparties for currency and interest rate derivatives and the majority of counterparties for bank deposits have an external rating from Standard & Poor’s, Fitch and/or Moody’s credit agencies. For counterparties rated by more than one rating agency, the lowest of the ratings is used to determine if it is investment grade.
In the commodity derivatives and commercial paper market, there are a number of counterparties not rated by Standard & Poor’s, Fitch or Moody’s. For these counterparties, Fortum assigns an internal rating. The internal rating categories that are considered to be comparable to investment grade have similar financial metrics or display historical default rates which correspond to investment grade companies rated by Standard & Poor’s, Fitch or Moody’s.
Credit quality of major financial assets 2020 2019
EUR million Carrying
amount of which past due
Carrying amount
of which past due
Receivables with investment grade or comparable rating Deposits, commercial papers and cash in bank accounts 2,107 - 1,255 - Fair values of interest rate and currency derivatives 331 - 172 - Fair values of derivatives on exchanges 3,795 - 58 - Fair values of commodity derivatives 5,638 - 40 - Loan and other interest-bearing receivables 995 - - - Lease receivables 196 - - - Total receivables with investment grade or comparable rating 13,062 - 1,525 - Receivables with non-investment grade or comparable rating Deposits, commercial papers and cash in bank accounts 94 - 60 - Fair values of commodity derivatives 711 - 39 - Loan and other interest-bearing receivables 58 - 6 - Receivable from SIBUR related to divested shares of OOO Tobolsk CHP 23 - 57 - Total receivables with non-investment grade or comparable rating 886 - 162 - Other receivables 1) Loan receivables from associates and joint ventures 1,150 - 625 - Restricted cash mainly given as collateral for commodity exchanges 48 - 65 - Cash in other bank accounts 107 - 118 - Total other receivables 1,305 - 808 - Total 15,253 - 2,495 - 1) Other receivables include financial assets which have not been divided to investment-grade and non-investment grade or
comparable ratings.
1
2
3
4
5
6
7
8
9
10
11
12
13
14
15
16
17
18
19
20
21
22
23
24
25
26
27
28
29
30
31
32
33
34
35
36
37
38
39

OPERATING AND FINANCIAL
REVIEW
CONSOLIDATED FINANCIAL
STATEMENTS NOTES KEY
FIGURES
PARENT COMPANY FINANCIAL
STATEMENTS
SIGNATURES FOR THE OPERATING AND FINANCIAL REVIEW AND
FINANCIAL STATEMENTS AUDITOR’S
REPORT
KEY FIGURES
2011–2020
QUARTERLY FINANCIAL
INFORMATION INVESTOR
INFORMATION 6611
Basis of preparation Risks Income statement Balance sheet Off balance sheet items Group structure and related parties
Financial instruments subject to master netting agreements: The following tables present the recognised financial instruments that are offset, or subject to enforceable master netting arrangements and other similar agreements but not offset. The column 'net amount' shows the impact on the Group's balance sheet if all netting rights were exercised.
Netting agreements for financial assets and liabilities 2020
EUR million Gross amount
Gross amount netted in the
balance sheet 1)
Net amounts presented in
the balance sheet
Conditional netting amount
(netting agreements)
Financial collateral received
/pledged Net amount Financial assets Interest-rate and currency derivatives 331 0 331 87 109 135 Commodity derivatives 10,939 793 10,146 5,290 -100 4,956 Trade receivables 7,115 0 7,115 3,692 0 3,424 Total 18,386 793 17,593 9,069 9 8,515 EUR million Financial liabilities Interest-rate and currency derivatives 299 0 299 87 3 209 Commodity derivatives 11,088 793 10,295 5,290 151 4,854 Trade payables 7,126 0 7,126 3,692 0 3,434 Total 18,513 793 17,720 9,069 154 8,497 1) In Fortum, excluding Uniper, receivables and liabilities from electricity and other commodity exchanges arising against
standard derivative contracts with same delivery period are netted.
Netting agreements for financial assets and liabilities 2019
EUR million Gross amount
Gross amount netted in the
balance sheet 1)
Net amounts presented in
the balance sheet
Conditional netting amount
(netting agreements)
Financial collateral received
/pledged Net amount Financial assets Interest-rate and currency derivatives 172 0 172 76 65 31 Commodity derivatives 817 679 139 61 0 78 Trade receivables 736 0 736 0 0 736 Total 1,725 679 1,046 137 65 844 EUR million Financial liabilities Interest-rate and currency derivatives 127 0 127 76 4 47 Commodity derivatives 941 679 262 61 0 201 Trade payables 316 0 316 0 0 316 Total 1,383 679 705 137 4 564 1) In Fortum, excluding Uniper, receivables and liabilities from electricity and other commodity exchanges arising against
standard derivative contracts with same delivery period are netted.
1
2
3
4
5
6
7
8
9
10
11
12
13
14
15
16
17
18
19
20
21
22
23
24
25
26
27
28
29
30
31
32
33
34
35
36
37
38
39

OPERATING AND FINANCIAL
REVIEW
CONSOLIDATED FINANCIAL
STATEMENTS NOTES KEY
FIGURES
PARENT COMPANY FINANCIAL
STATEMENTS
SIGNATURES FOR THE OPERATING AND FINANCIAL REVIEW AND
FINANCIAL STATEMENTS AUDITOR’S
REPORT
KEY FIGURES
2011–2020
QUARTERLY FINANCIAL
INFORMATION INVESTOR
INFORMATION 6622
Basis of preparation Risks Income statement Balance sheet Off balance sheet items Group structure and related parties
5 Capital risk management In December 2020, Fortum updated the strategy for the whole Fortum Group to drive the clean energy transition and deliver sustainable financial performance. Aligned with the goals of the Paris Agreement, Fortum targets carbon neutrality by 2050 with ambitious mid-term targets.
The updated strategy builds on four priorities: • ‘Transform own operations to carbon neutral’, • ‘Strengthen and grow in CO2-free power generation’, • ‘Leverage strong position in gas to enable the energy transition’, as well as • ‘Partner with industrial and infrastructure customers’.
Fortum’s coal-fired generation capacity will be reduced by more than 50% by the end of 2025, to approximately 5 GW. Measures for the reduction include coal-fired plant closures in Germany announced by Uniper in 2020: 0.9 GW at the end of 2020, 1.5 GW by end of 2022, and a further 0.5 GW by the end of 2025. The reduction also includes the closure of Uniper’s 2 GW in the UK by the end of 2025 and Fortum’s previously announced commitment to discontinue the use of coal in Espoo by 2025.
Fortum will also focus on growing a sizeable portfolio of onshore wind and solar based power generation primarily in Europe to make it a meaningful EBITDA contributor. The target is to build 1.5-2 GW of new capacity by 2025. This capacity will partly be built on our own balance sheet and partly using the ‘build-operate-transfer’ business model.
Further, Fortum aims to gradually transform its Russian asset portfolio towards renewables, while over time reducing our fossil exposure.
In parallel with the strategy alignment, Fortum and Uniper have together identified cooperation benefits expected to bring a positive cash impact on a consolidated Group basis of approximately EUR 100 million annually. More than EUR 50 million of these annual benefits are estimated to be achieved by the end of 2023, with full effect of approximately EUR 100 million annually in 2025 creating value for both companies and their shareholders.
Financial targets, dividend policy, and 2021 guidance for capital expenditure
Following the consolidation of Uniper, Fortum’s business profile changed. In May 2020, Fortum’s Board of Directors decided to remove the financial targets (return on capital employed of at least 10% and comparable net debt-to-EBITDA of around 2.5x) as of the first quarter of 2020.
In December 2020, in connection with its strategy update, the Group also updated its financial targets. Fortum continues to be committed to maintaining a rating of at least BBB. The long-term financial targets are:
• Financial net debt/comparable EBITDA below 2x, defined as Alternative Performance Measure. • Hurdle rates for new investments based on weighted average cost of capital (“WACC”)
• +100 basis points for green investments • +200 basis points for other investments
Fortum's revised dividend policy is ‘to pay a stable, sustainable, and over time increasing dividend’. Fortum’s Board of Directors proposes a dividend of EUR 1.12 per share for the year 2020 with the target to increase the dividend going forward.
The estimated annual capital expenditure for the whole Fortum Group, including Uniper, for 2021 is approximately EUR 1,400 million, including maintenance and excluding acquisitions. The share of maintenance is estimated to be EUR 700 million.
Standard & Poor's long-term credit rating for Fortum is BBB with Negative Outlook. Fitch Ratings long-term credit rating for Fortum is BBB with Negative Outlook.
Standard & Poor's long-term credit rating for Uniper is BBB with Negative Outlook.
Financial net debt/comparable EBITDA ratio
EUR million Note 2020 +Interest-bearing liabilities 10,662 - Liquid funds 2,308
- Non-current securities 98 - Collateral arrangement securities 432
- Securities in interest-bearing receivables 530 - Margin receivables 1,132 + Margin liabilities 331
+ Net margin liabilities -801 Financial net debt 26 7,023 Operating profit 1,599 + Depreciation and amortisation -1,090 EBITDA 2,689 - Items affecting comparability -255 Comparable EBITDA 2,434 Financial net debt/comparable EBITDA 2.9
See Definitions of key figures. Comparable EBITDA is defined as an alternative performance measure and used as a component in the capital structure target 'Financial net debt-to-Comparable EBITDA'. In 2020 Comparable EBITDA includes contribution from Uniper for the period of 1 April to 31 December 2020 since Uniper was consolidated as a subsidiary from 31 March 2020. Until 31 of March 2020 Uniper's contribution to the income statement was recognised in the Share of profit/loss of associates and joint ventures.
1
2
3
4
5
6
7
8
9
10
11
12
13
14
15
16
17
18
19
20
21
22
23
24
25
26
27
28
29
30
31
32
33
34
35
36
37
38
39
OPERATING AND FINANCIAL
REVIEW
CONSOLIDATED FINANCIAL
STATEMENTS NOTES KEY
FIGURES
PARENT COMPANY FINANCIAL
STATEMENTS
SIGNATURES FOR THE OPERATING AND FINANCIAL REVIEW AND
FINANCIAL STATEMENTS AUDITOR’S
REPORT
KEY FIGURES
2011–2020
QUARTERLY FINANCIAL
INFORMATION INVESTOR
INFORMATION 6633
Basis of preparation Risks Income statement Balance sheet Off balance sheet items Group structure and related parties
6 Segment reporting SIGNIFICANT ACCOUNTING POLICIES
REVENUE RECOGNITION Fortum's operations comprise the provision of gas, electricity, heating and cooling as well global energy trading and optimisation and waste management services. Revenue streams can be divided into five groups: gas sales, power sales to wholesale markets, power sales to retail customers, heating sales and waste treatment sales. Revenue is recognised when goods are transferred or services are performed, i.e. when a performance obligation is satisfied and control of the good or service underlying the particular performance obligations is transferred to the customer. Revenue is shown at the price that Fortum expects to be entitled to and it is presented net of rebates, discounts, value-added tax and selective taxes, such as electricity tax. Revenues also include the surcharge mandated by the German Renewable Energy Sources Act in the Uniper segment. Revenues include effects from physically settled contracts for which own use exemption cannot be used according to IFRS 9, see Note 7 Items affecting comparability. Accounting policies for the different revenue streams are described below.
POWER SALES TO WHOLESALE MARKETS AND THROUGH BILATERAL CONTRACTS Physical electricity trades to wholesale markets are made at a spot price and thus there are no variable elements. Electricity sales are recognised on delivery at the price defined in wholesale market. Fortum is also selling power to industrial customers and municipalities through bilateral contracts. These contracts can include fixed price components that are recognised in line with the customer’s actual consumption profile, when the nature of the performance obligation is to deliver power instead of standing-ready to deliver power. When Fortum is acting as an agent in electricity trade by granting access to Nord Pool power trading system, Fortum presents the bilateral trades between Fortum and the customer on a net basis and only the service fee is recorded as revenue.
POWER SALES TO RETAIL CUSTOMERS Fortum’s contracts with consumer and business customers cover electricity sales, while the distribution service is delivered by the transmission company operating the local network. There is only one performance obligation, which is to stand-ready to supply electricity to the customer. The transaction price generally includes both a fixed monthly charge and a variable fee based on the volume of electricity supplied. As Fortum’s promise is to stand ready to deliver electricity, the fixed and variable components are recognised based on the fees chargeable from the customer. If automated meter reading is not available, electricity consumption between the last meter reading and the end of the month is estimated.
HEAT SALES In many areas the district heating service covers both the distribution and sale of heat. Fortum is usually responsible for delivering the whole service, even when heat is being produced by a third party, and is acting as a principal for heat sales as well. There is only one performance obligation, which is to stand-ready to supply heat to the customer. The fees charged from the customer generally comprise a fixed monthly charge
and a variable fee based on the volume of heat supplied. As Fortum’s promise is to stand ready to deliver heat, the fixed and variable components are recognised based on the fees chargeable from the customer. In Russia, Baltics and Poland there are also areas where Fortum operates only the heat production facilities while some third party is responsible for the distribution of heat. In these areas the performance obligation is to supply heat and revenue is recognised based on the volume of heat that Fortum is entitled to charge from the customer.
GAS SALES Revenues are generated from sales of gas via traded markets, as well as to industrial customers and resellers, and include hedges settled through physical delivery, which are recognised when delivery takes place and control is transferred to the customer. Gas sales include also revenues earned from the transportation of gas. Contracts generally contain one performance obligation for which the entire transaction price is recognised.
For physically settled transactions that are in the scope of IFRS 15 (own-use transactions), revenue is recognised based on contract prices, as these reflect the economic character of the transactions and the contractually agreed consideration amounts. If IFRS 15 provides for a different method, for example when constraint on variable considerations is applicable, contract prices are adjusted accordingly.
Gas contracts can also include fixed price components that are recognised in line with the customer’s actual consumption profile, when the nature of the performance obligation is to deliver gas instead of standing-ready to deliver gas.
WASTE TREATMENT SALES Majority of revenue from waste management services arises from fees charged for receiving waste from customers (i.e. gate fees). The fee is usually determined based on the volume of waste received, there are no variable elements in pricing. Fortum is required to treat the waste and this performance obligation is satisfied when treatment has been performed. Transportation of the waste forms another performance obligation. Fees for waste treatment and transportation services are separately agreed in the contract and correspond to the price that would be charged for these services separately. Revenue for transportation service is recognised when the service has been provided.
Waste treatment sales include also various types of soil and landfill site projects, which mostly take place at customer sites. Fees charged are invoiced based on payment schedules agreed with the customer. The customer obtains the benefit of the construction work simultaneously when the construction work proceeds, and therefore project revenues are recognised over time. Progress of the construction is best measured either through costs incurred, or the completed area of the construction site.
NETTING AND INTER-SEGMENT TRANSACTIONS Generation and City Solution segments sell their electricity production to Nord Pool and Consumer Solutions segment buys its electricity from Nord Pool. For these segments eliminations of sales include eliminations of sales and purchases with Nord Pool that are netted at Group level on an hourly basis and posted either as revenue or cost depending on if Fortum is a net seller or net buyer during any particular hour. Intersegment sales, expenses and results for the different business segments are affected by intragroup deliveries, which are eliminated on consolidation. Inter-segment transactions are based on commercial terms.
1
2
3
4
5
6
7
8
9
10
11
12
13
14
15
16
17
18
19
20
21
22
23
24
25
26
27
28
29
30
31
32
33
34
35
36
37
38
39

OPERATING AND FINANCIAL
REVIEW
CONSOLIDATED FINANCIAL
STATEMENTS NOTES KEY
FIGURES
PARENT COMPANY FINANCIAL
STATEMENTS
SIGNATURES FOR THE OPERATING AND FINANCIAL REVIEW AND
FINANCIAL STATEMENTS AUDITOR’S
REPORT
KEY FIGURES
2011–2020
QUARTERLY FINANCIAL
INFORMATION INVESTOR
INFORMATION 6644
Basis of preparation Risks Income statement Balance sheet Off balance sheet items Group structure and related parties
Fortum anticipates revenues of EUR 922 million (2019: 15) from unsatisfied performance obligations, mostly relating to gas and bilateral electricity contracts. Of this total, EUR 234 million is attributable to 2021 (2019: EUR 14 million to 2020) and EUR 688 million to years after 2021 (2019: EUR 1 million to years after 2020).
6.1 Business structure Fortum’s reportable segments are Generation, Russia, City Solutions, Consumer Solutions and Uniper. Other Operations includes corporate functions, R&D and technology development projects.
Fortum revised its reportable segments following the consolidation of Uniper as a subsidiary on 31 March 2020, and reports Uniper as a separate segment.
As Fortum has previously accounted for Uniper as an associated company with three-month time lag (see Note 18 Participations in associated companies and joint ventures), Fortum's first quarter results included Fortum's share of Uniper results from 1 October 2019 to 31 March 2020 reported in Other Operations.
Reporting of both the Uniper segment, and the Generation segment are impacted by adjustments for the joint ownership in the Swedish nuclear company, OKG AB. See also Note 1.7 Summary of Uniper acquisition impact to consolidated financial statements.
6.2 Segment structure Fortum discloses segment information in a manner consistent with internal reporting to Fortum’s Board of Directors and Fortum Executive Management, led by the President and CEO. Fortum segments are based on the type of business operation, combined with one segment based on geographical area and one segment based on a separately listed sub group. Fortum’s reportable segments are the business divisions Generation, Russia, City Solutions, Consumer Solutions and Uniper.
6.3 Definitions for segment information Fortum’s segment information discloses the financial measurements used in financial target setting and forecasting, management’s follow up of financial performance and allocation of resources in the Group’s performance management process. See Note 1.4 Measures for performance.
Segment reporting is based on the same accounting policies as Fortum Group.
Description of reportable segments:
Repo
rtab
le s
egm
ents
Group
City Solutions is responsible for sustainable solutions for urban areas. The segment comprises heating, cooling, waste-to-energy, and other circular economy solutions, as well as solar power generation, services, and development of new biomass-based businesses. The business operations are located in the Nordics, the Baltic countries, Poland and India. The segment also includes Fortum’s 50% holding in Stockholm Exergi, which is a joint venture and is accounted for using the equity method. The segment does not include the operations of Fortum’s subsidiary Uniper.
City Solutions
Consumer Solutions is responsible for the electricity and gas retail businesses in the Nordics, Poland and Spain, including the customer service and invoicing businesses. Fortum is the largest electricity retail business in the Nordics, with approximately 2.4 million customers across different brands in Finland, Sweden, Norway, Poland and Spain. The business provides electricity as well as related value-added and digital services.
Consumer Solutions
Generation is responsible for Nordic power generation. The segment comprises nuclear, hydro, wind, and thermal power generation, as well as power portfolio optimisation, trading, industrial intelligence, and global nuclear services. The segment does not include the Nordic hydro and nuclear power generation or the trading activities of Uniper. As of 31 March 2020, the segment includes Generation’s proportionate share of OKG.
Generation
The Russia segment comprises power and heat generation and sales in Russia. The segment also includes Fortum’s joint ventures for building and operating approximately 2 GW of renewable power generation and for power and heat sales, as well as Fortum’s more than 29% holding in TGC 1. These joint ventures and associated company are accounted for using the equity method. The segment does not include Uniper’s Russian subsidiary Unipro.
Russia
The Uniper segment comprises Fortum’s majority ownership in Uniper, a subsidiary of Fortum. Uniper is a leading international energy company with activities in more than 40 countries. Its business is the secure provision of energy and related services. Its main activities include power generation in Europe and Russia as well as global energy trading and optimisation, which Uniper reports in three businesses – European Generation, Global Commodities and Russian Power Generation – in its financial statements. The segment includes Uniper’s proportionate share of OKG.
Uniper
1
2
3
4
5
6
7
8
9
10
11
12
13
14
15
16
17
18
19
20
21
22
23
24
25
26
27
28
29
30
31
32
33
34
35
36
37
38
39

OPERATING AND FINANCIAL
REVIEW
CONSOLIDATED FINANCIAL
STATEMENTS NOTES KEY
FIGURES
PARENT COMPANY FINANCIAL
STATEMENTS
SIGNATURES FOR THE OPERATING AND FINANCIAL REVIEW AND
FINANCIAL STATEMENTS AUDITOR’S
REPORT
KEY FIGURES
2011–2020
QUARTERLY FINANCIAL
INFORMATION INVESTOR
INFORMATION 6655
Basis of preparation Risks Income statement Balance sheet Off balance sheet items Group structure and related parties
6.4 Segment information
Consolidated income statement Generation 1) Russia City Solutions 1) Consumer Solutions Uniper 2) Other Operations 2) Total EUR million Note 2020 2019 2020 2019 2020 2019 2020 2019 2020 2019 2020 2019 2020 2019 Power sales 3) 1,878 2,006 791 924 121 153 1,057 1,630 16,994 - 0 - 20,841 4,714 Heat sales - - 134 145 516 615 - - 191 - - - 841 760 Gas sales 84 91 - - 1 3 139 132 22,176 - - - 22,400 226 Waste treatment sales - - - - 252 250 - - - - - - 252 250 Other sales 44 44 4 2 185 178 70 74 5,154 - 140 115 5,598 413 Sales 2,006 2,141 929 1,071 1,075 1,200 1,267 1,835 44,514 - 140 115 49,931 6,363 Internal eliminations -421 -259 -2 - -64 -45 -2 3 -0 - -110 -86 -598 -387 Netting of Nord Pool transactions 4) -317 -529 IS External sales 1,585 1,883 927 1,071 1,012 1,155 1,264 1,839 44,514 - 30 29 49,015 5,447 Comparable EBITDA 886 939 394 469 239 308 153 141 856 - -94 -91 2,434 1,766 IS Depreciation and amortisation -164 -145 -143 -153 -191 -188 -63 -62 -494 - -35 -28 -1,090 -575 IS Comparable operating profit 722 794 251 316 47 120 90 79 363 - -129 -118 1,344 1,191
Impairment charges and reversals 7 2 -3 - - - - - - -0 - - -6 2 -8 Capital gains and other related items 7 0 3 1 1 723 5 0 - -13 - 53 -2 765 7 Impact from acquisition accounting 7 - - 0 - - - - - - - -222 - -222 - Changes in fair values of derivatives hedging future cash flow 7 -12 -15 0 - 5 2 39 -59 -706 - - - -675 -72 Other 0 - - - - - - - 386 - - - 386 -
IS Items affecting comparability 5) 7 -11 -14 1 1 728 7 39 -59 -333 - -169 -8 255 -72 IS Operating profit 711 780 252 317 775 127 129 20 29 - -298 -126 1,599 1,118 IS Share of profit/loss of associates and joint ventures 18, 28 29 10 47 59 57 37 - - 54 - 470 638 656 744 IS Finance costs - net -56 -134 IS Income taxes -344 -221 IS Profit for the year 1,855 1,507 1) Sales, both internal and external, include effects from realised hedging contracts. Effect on sales can be negative or positive depending on the average contract price and the realised spot price. 2) Fortum consolidated Uniper into its balance sheet as of 31 March 2020 and, from the second quarter, Fortum consolidated Uniper as a subsidiary into its income statement. Fortum’s first-quarter share of Uniper’s results is reported in the share of profits of
associates and joint venture of ‘Other operations’; see Note 1. 3) Power sales in Fortum, excluding Uniper, contains realised result from commodity derivatives, which have not had hedge accounting status under IFRS 9, but have been considered operatively as hedges. 4) Sales and purchases with Nord Pool Spot are netted on Group level on an hourly basis and posted either as revenue or cost depending on whether Fortum is a net seller or net buyer during any particular hour. 5) In 2020, Nuclear fund adjustment was reclassified from Items affecting comparability to Other financial expenses, net. Comparatives have been reclassified accordingly. See Note 1.7 Summary of Uniper acquisition impact to consolidated financial
statements.
1
2
3
4
5
6
7
8
9
10
11
12
13
14
15
16
17
18
19
20
21
22
23
24
25
26
27
28
29
30
31
32
33
34
35
36
37
38
39

OPERATING AND FINANCIAL
REVIEW
CONSOLIDATED FINANCIAL
STATEMENTS NOTES KEY
FIGURES
PARENT COMPANY FINANCIAL
STATEMENTS
SIGNATURES FOR THE OPERATING AND FINANCIAL REVIEW AND
FINANCIAL STATEMENTS AUDITOR’S
REPORT
KEY FIGURES
2011–2020
QUARTERLY FINANCIAL
INFORMATION INVESTOR
INFORMATION 6666
Basis of preparation Risks Income statement Balance sheet Off balance sheet items Group structure and related parties
Segment assets and liabilities Generation Russia City Solutions Consumer Solutions Uniper Other Operations Total EUR million Note 2020 2019 2020 2019 2020 2019 2020 2019 2020 2019 2020 2019 2020 2019 Non-interest-bearing assets 5,780 5,461 2,020 2,637 3,512 3,780 780 939 20,646 - 270 237 33,009 13,054 BS Participations in associates and joint ventures 18, 28 961 838 577 681 612 584 - - 729 - 33 4,331 2,912 6,435 Eliminations -57 -107 Total segment assets 6,742 6,299 2,597 3,319 4,123 4,364 780 939 21,375 - 303 4,568 35,863 19,381 Interest-bearing receivables 20 3,000 1,035 BS Deferred tax assets 27 1,089 77 Other assets 15,550 1,437 BS Liquid funds 23 2,308 1,435 Total assets 57,810 23,364
Segment liabilities 508 279 166 107 445 419 215 302 13,943 - 167 168 15,443 1,274 Eliminations -57 -107 Total segment liabilities 15,386 1,168 BS Deferred tax liabilities 27 952 885 Other liabilities 15,233 1,382 Total liabilities included in capital employed 31,570 3,435 Interest-bearing liabilities 26 10,662 6,694 BS Total equity 15,577 13,235 Total equity and liabilities 57,810 23,364 Segment assets and liabilities at 31 December 2019 included assets held for sale. See Note 3 Acquisitions, disposals and assets held for sale.
Gross investments / divestments Generation Russia City Solutions Consumer Solutions Uniper Other Operations Total EUR million Note 2020 2019 2020 2019 2020 2019 2020 2019 2020 2019 2020 2019 2020 2019 Gross investments in shares 18, 3 70 13 48 66 114 9 0 - 3 - 3,572 18 3,807 106 Capital expenditure 16, 17 158 247 43 67 219 314 57 55 624 - 34 30 1,135 713 Gross divestments of shares 3 171 12 0 - 895 2 10 - 69 - 81 16 1,226 30
1
2
3
4
5
6
7
8
9
10
11
12
13
14
15
16
17
18
19
20
21
22
23
24
25
26
27
28
29
30
31
32
33
34
35
36
37
38
39

OPERATING AND FINANCIAL
REVIEW
CONSOLIDATED FINANCIAL
STATEMENTS NOTES KEY
FIGURES
PARENT COMPANY FINANCIAL
STATEMENTS
SIGNATURES FOR THE OPERATING AND FINANCIAL REVIEW AND
FINANCIAL STATEMENTS AUDITOR’S
REPORT
KEY FIGURES
2011–2020
QUARTERLY FINANCIAL
INFORMATION INVESTOR
INFORMATION 6677
Basis of preparation Risks Income statement Balance sheet Off balance sheet items Group structure and related parties
Comparable operating profit including share of profit of associates and joint ventures and Comparable return on net assets Generation Russia City Solutions Consumer Solutions Uniper 3) EUR million Note 2020 2019 2020 2019 2020 2019 2020 2019 2020 2019 Comparable operating profit 722 794 251 316 47 120 90 79 363 - Share of profit/loss of associates and joint ventures 18 29 10 47 59 57 37 - - 54 - Adjustment to share of profit/loss of associates and joint ventures 1) -45 -13 - - - 22 - - - - Comparable operating profit including share of profit of associates and joint ventures 706 791 298 375 104 179 90 79 417 - Segment assets at the end of the year 6,742 6,299 2,597 3,319 4,123 4,364 780 939 21,375 - Segment liabilities at the end of the year 508 279 166 107 445 419 215 302 13,943 - Comparable net assets 6,234 6,019 2,431 3,212 3,679 3,945 565 637 7,432 - Comparable net assets average 2) 6,006 5,959 2,693 3,048 3,679 3,865 569 595 N/A - Comparable return on net assets, % 11.8 13.3 11.1 12.3 2.8 4.6 15.9 13.3 N/A - 1) See Definitions of key figures. 2) Average net assets are calculated using the opening balance of the financial year and each quarter’s closing value. 3) The Uniper segment was acquired on 31 March 2020. Comparable net assets average and Comparable return on net assets for the Uniper segment will be presented once information for full 12 months is available.
Segment assets and liabilities at 31 December 2019 included assets held for sale. See Note 3 Acquisitions, disposals and assets held for sale.
Employees Generation Russia City Solutions Consumer Solutions Uniper Other Operations Total 2020 2019 2020 2019 2020 2019 2020 2019 2020 2019 2020 2019 2020 2019 Number of employees 31 December 1,143 1,109 2,935 2,955 2,093 1,970 1,048 1,327 11,751 - 963 830 19,933 8,191 Average number of employees 1,163 1,122 2,969 2,942 2,051 1,979 1,216 1,379 11,629 - 959 825 19,988 8,248
1
2
3
4
5
6
7
8
9
10
11
12
13
14
15
16
17
18
19
20
21
22
23
24
25
26
27
28
29
30
31
32
33
34
35
36
37
38
39

OPERATING AND FINANCIAL
REVIEW
CONSOLIDATED FINANCIAL
STATEMENTS NOTES KEY
FIGURES
PARENT COMPANY FINANCIAL
STATEMENTS
SIGNATURES FOR THE OPERATING AND FINANCIAL REVIEW AND
FINANCIAL STATEMENTS AUDITOR’S
REPORT
KEY FIGURES
2011–2020
QUARTERLY FINANCIAL
INFORMATION INVESTOR
INFORMATION 6688
Basis of preparation Risks Income statement Balance sheet Off balance sheet items Group structure and related parties
6.5 Group-wide disclosures The Group’s operating segments operate mainly in the Nordic countries, Germany, United Kingdom, Russia, the Netherlands and the Baltic Rim area.
The Group’s domicile is Finland. The table below presents sales by geographical area based on customer location. Assets, capital expenditure
and personnel are reported where assets and personnel are located. Participations in associates and joint ventures are not presented by location since these companies may have business in several geographical areas.
Due to the large number of customers and the variety of business activities, there is no individual customer whose business volume is material to Fortum’s total business volume.
Sales by geographical area based on customer location EUR million 2020 2019 Nordics 4,754 3,740 Germany 12,223 52 United Kingdom 9,618 26 Other central western Europe 17,790 51 Russia 1,610 1,071 Other 3,021 506 IS Total 49,015 5,447 Nordic power production is not presented by country since Nordic power production is mainly sold through Nord Pool.
Capital expenditure by country EUR million 2020 2019 Finland 160 199 Germany 279 0 Russia 158 67 Sweden 186 114 United Kingdom 89 11 Norway 71 115 Other countries 191 207 Total 1,135 713
Non-current assets by country EUR million 2020 2019 Finland 3,136 3,150 Germany 5,190 4,302 Russia 4,291 3,108 Sweden 8,003 4,508 United Kingdom 833 11 Other and eliminations 3,633 2,621 Total 25,086 17,700
Non-current assets include intangible assets, property, plant and equipment and right-of-use assets as well as participations in associates and joint ventures.
Number of employees on 31 December by country 2020 2019 Finland 2,370 2,234 Germany 4,947 68 Russia 7,466 2,955 Sweden 1,752 985 United Kingdom 1,047 75 Other 2,351 1,874 Total 19,933 8,191
1
2
3
4
5
6
7
8
9
10
11
12
13
14
15
16
17
18
19
20
21
22
23
24
25
26
27
28
29
30
31
32
33
34
35
36
37
38
39

OPERATING AND FINANCIAL
REVIEW
CONSOLIDATED FINANCIAL
STATEMENTS NOTES KEY
FIGURES
PARENT COMPANY FINANCIAL
STATEMENTS
SIGNATURES FOR THE OPERATING AND FINANCIAL REVIEW AND
FINANCIAL STATEMENTS AUDITOR’S
REPORT
KEY FIGURES
2011–2020
QUARTERLY FINANCIAL
INFORMATION INVESTOR
INFORMATION 6699
Basis of preparation Risks Income statement Balance sheet Off balance sheet items Group structure and related parties
7 Items affecting comparability EUR million 2020 2019 Impairment charges and reversals 2 -8 Capital gains and other related items 765 7 Impact from acquisition accounting -222 - Changes in fair values of derivatives hedging future cash flow -675 -72 Other 386 - IS Total 1) 255 -72 1) In 2020, Nuclear fund adjustment was reclassified from Items affecting comparability to Other financial expenses, net.
Comparatives have been reclassified accordingly. See Note 1.7 Summary of Uniper acquisition impact to consolidated financial statements.
Fortum uses Alternative performance measures (APMs) in the financial target setting and forecasting, management’s follow up of financial performance of segments and the Group as well as allocation of resources in the Group’s performance management process. The business performance of the operations cannot be compared from one period to another without adjusting for items affecting comparability and therefore they are excluded from Comparable operating profit and Comparable EBITDA. See Note 1.4 Measures for performance for changes made to Items affecting comparability in 2020. Definitions are presented in the section Definitions of key figures.
Capital gains and other related items Capital gains and other related items include capital gains and transaction costs from acquisitions, which are adjusted from other income and other expenses, respectively.
Capital gains and other related items in 2020 included EUR 72 million gain from the divestment of Fortum Recharge AS; EUR 431 million gain from the divestment of the district heating business in Joensuu, Finland; and EUR 291 million gain from divestment of the district heating business in Järvenpää, Finland; as well as Uniper acquisition-related costs of EUR 20 million. See Note 3 Acquisitions, disposals and assets held for sale.
Impact from acquisition accounting Consolidation of an associated company results includes recording a share of the associated company’s other comprehensive income (OCI). If an associated company is either divested or becomes a subsidiary, IFRS requires that these previously recorded OCI items are reclassified inside equity either via the consolidated income statement or directly to retained earnings, depending on the nature of the OCI item. Reclassification does not have an impact on total equity.
The above reclassification resulted in a one-time, non-cash income statement impact of EUR -222 million on 31 March 2020 when Uniper became Fortum’s subsidiary. This amount represented a part of Fortum's share of Uniper's OCI for the time when Uniper was an associated company, with no impact to Fortum’s total equity. The amount mainly related to exchange rate differences arising from translation of foreign operations recorded by Uniper. Fortum’s share of Uniper’s non-recyclable other comprehensive income, EUR -84 million, was reclassified to retained earnings. See Consolidated statement of changes in equity.
Changes in fair values of derivatives hedging future cash flow Unrealised changes in the fair values of financial derivative instruments hedging future cash flows that do not qualify for hedge accounting and physical contracts that are treated as derivatives are recognised in items affecting comparability. For additional information, see Note 14 Financial assets and liabilities by categories.
Impacts from settlement of physical contracts that have been treated as derivatives are adjusted to sales and materials and services to reflect the contract pricing as opposed to market pricing (“contract pricing adjustment”).
Adjustments are needed to improve the understanding of the financial performance when comparing results from one period to another.
Other Other includes restructuring expenses, adjustments to certain provisions, and reversals of temporary reductions in current assets.
1
2
3
4
5
6
7
8
9
10
11
12
13
14
15
16
17
18
19
20
21
22
23
24
25
26
27
28
29
30
31
32
33
34
35
36
37
38
39

OPERATING AND FINANCIAL
REVIEW
CONSOLIDATED FINANCIAL
STATEMENTS NOTES KEY
FIGURES
PARENT COMPANY FINANCIAL
STATEMENTS
SIGNATURES FOR THE OPERATING AND FINANCIAL REVIEW AND
FINANCIAL STATEMENTS AUDITOR’S
REPORT
KEY FIGURES
2011–2020
QUARTERLY FINANCIAL
INFORMATION INVESTOR
INFORMATION 7700
Basis of preparation Risks Income statement Balance sheet Off balance sheet items Group structure and related parties
Reconciliation of operating profit to comparable operating profit, 2020
Reconciliation of operating profit to comparable operating profit, 2019
8 Other income and other expenses ACCOUNTING POLICIES
In Uniper segment realised gains and losses on non-hedge accounted commodity derivatives are reported in gross within other operating income and expenses. These consist of gains and losses representing economic hedging result on derivative financial instruments for which hedge accounting according to IFRS 9 is not applied and to limited extent transactions conducted in connection with proprietary trading.
Income and loss from exchange rate differences reported within other operating income and expenses consist primarily of realised and unrealised gains and losses from the translation of foreign currency receivables and liabilities in Uniper segment.
8.1 Other income EUR million 2020 2019 Realised gains on non-hedge accounted derivatives 3,989 - Gains on exchange rate differences 636 - Other 177 110 IS Total 4,802 110
8.2 Other expenses EUR million 2020 2019 Realised losses on non-hedge accounted derivatives 4,339 - Losses on exchange rate differences 521 - IT and telecommunication costs 248 94 Other 781 497 IS Total 5,890 591
The major components recorded in other are the external operation and maintenance costs of power and heat plants, expenses relating to properties and other operative expenses.
EUR million Unadjusted
Impairment charges and
reversals
Capital gains and other
related items
Impact from acquisition accounting
Changes in fair values of
derivatives hedging
future cash flow Other Reported
Sales 42,517 6,499 49,015 Other income 10,517 0 -784 -4,679 -252 4,802 Materials and services -38,286 -5,805 -208 -44,298 Employee benefits -1,206 11 -1,195 Depreciation and amortisation -1,092 -1 3 -1,090 Other expenses -10,851 20 222 4,659 60 -5,890 IS Comparable operating profit - -2 -765 222 675 -386 1,344 IS Items affecting comparability - 2 765 -222 -675 386 255 IS Operating profit 1,599 1,599
EUR million Unadjusted
Impairment charges and
reversals
Capital gains and other
related items
Impact from acquisition accounting
Changes in fair values of
derivatives hedging
future cash flow Other Reported
Sales 5,418 29 5,447 Other income 122 -12 0 110 Materials and services -2,764 43 -2,721 Employee benefits -480 -480 Depreciation and amortisation -583 8 -575 Other expenses -596 6 -591 IS Comparable operating profit - 8 -7 - 72 - 1,191 IS Items affecting comparability - -8 7 -72 -72 IS Operating profit 1,118 1,118
1
2
3
4
5
6
7
8
9
10
11
12
13
14
15
16
17
18
19
20
21
22
23
24
25
26
27
28
29
30
31
32
33
34
35
36
37
38
39

OPERATING AND FINANCIAL
REVIEW
CONSOLIDATED FINANCIAL
STATEMENTS NOTES KEY
FIGURES
PARENT COMPANY FINANCIAL
STATEMENTS
SIGNATURES FOR THE OPERATING AND FINANCIAL REVIEW AND
FINANCIAL STATEMENTS AUDITOR’S
REPORT
KEY FIGURES
2011–2020
QUARTERLY FINANCIAL
INFORMATION INVESTOR
INFORMATION 7711
Basis of preparation Risks Income statement Balance sheet Off balance sheet items Group structure and related parties
Auditors’ fees EUR million 2020 2019 DDeellooiittttee
Audit fees 2.6 2.3 Audit-related assignments 0.3 0.3 Tax assignments 0.2 - Other assignments 0.2 0.8
Total 3.3 3.4 PPwwCC
Audit fees 11.3 - Audit-related assignments 0.5 - Tax assignments 0.1 - Other assignments 1.2 -
Total 11)) 13.1 - 1) PwC fees are presented for the period after consolidating Uniper as a subsidiary on 31 March 2020.
Deloitte Oy is the appointed auditor until the next Annual General Meeting in 2021. Audit fees include fees for the audit of the consolidated financial statements, review of interim reports, as well as fees for the audit of Fortum Corporation and its subsidiaries. Audit-related assignments include fees for assurance of sustainability reporting, and other assurance and associated services related to the audit. Tax assignments include fees for tax advice services. Other assignments consist of advisory services.
PricewaterhouseCoopers GmbH Wirtschaftsprüfingsgesellschaft (”PwC Germany”) is the appointed auditor of the subsidiary Uniper SE.
9 Materials and services EUR million 2020 2019 Materials 43,377 2,569 Transmission costs 532 42 External services 389 110 IS Total 44,298 2,721
Materials consists mainly of coal, gas and nuclear fuels.
Materials include EUR 624 million (2019: 259) purchased from associates and joint ventures consisting of nuclear and hydropower purchased at production cost (including interest costs and production taxes) and purchased steam. See Note 37 Related party transactions.
10 Employee benefits and Board remuneration EUR million 2020 2019 Wages and salaries 913 351 Pensions
Defined contribution plans 51 38 Defined benefit plans 64 5
Social security costs 133 51 Share-based incentives 9 12 Other employee costs 26 23 IS Total 1,195 480 The compensation package for Fortum employees consists of salaries, fringe benefits, short-term incentives, profit sharing paid to the Personnel Fund (in Finland) and share-based long-term incentives.
For further information on pensions see Note 30 Pension obligations.
10.1 Short-term incentives (STI) Fortum’s STI programme is designed to support the achievement of the Group’s financial and other relevant targets on an annual basis. As a main principle, all employees are covered by the programme or alternatively by a business specific or a comparable local variable pay arrangement.
The Board of Directors determines the performance criteria and award levels for the Fortum Executive Management. The awards are based on the achievement of Group financial performance, divisional targets and individual targets. The target incentive opportunity is 20% and the maximum incentive opportunity is 40% of the annual base salary. The Board of Directors assesses the performance of the President and CEO and the members of the Fortum Executive Management on a regular basis.
Awards for other employees are based on a combination of Group, divisional, functional and personal or team targets. The targets are set in annual performance discussions held at the beginning of the year. Awards under the STI programme are paid solely in cash.
10.2 Share-based long-term incentives (LTI) The purpose of Fortum’s share-based long-term incentive programme is to support the delivery of sustainable long-term performance, align the interests of management with those of shareholders and support in committing and retaining key individuals.
Fortum’s LTI programme provides participants with the opportunity to earn company shares. Under the LTI programme, and subject to the decision of the Board of Directors, a new LTI plan commences annually. The Board of Directors approves participation of the Fortum Executive Management members in each annually commencing LTI plan. Subject to a decision by the Board of Directors, the President and CEO is authorised to decide on individual participants and potential maximum awards for other participants than the Fortum Executive Management in accordance with the nomination guidelines approved by the Board of Directors. Participation in the LTI plan precludes the individual from being a member in the Fortum Personnel Fund.
Each LTI plan begins with a three-year earnings period, during which participants may earn share rights if the performance criteria set by the Board of Directors are fulfilled. If the minimum performance criteria are not met, no shares will be awarded. If performance is exceptionally good and the targets approved by the Board of Directors are achieved, the combined gross value of all variable compensation cannot exceed 120% of the person’s annual salary in any calendar year. After the earnings period has ended and the relevant taxes and other employment-related expenses have been deducted, participants are paid the net balance in the form of shares.
1
2
3
4
5
6
7
8
9
10
11
12
13
14
15
16
17
18
19
20
21
22
23
24
25
26
27
28
29
30
31
32
33
34
35
36
37
38
39

OPERATING AND FINANCIAL
REVIEW
CONSOLIDATED FINANCIAL
STATEMENTS NOTES KEY
FIGURES
PARENT COMPANY FINANCIAL
STATEMENTS
SIGNATURES FOR THE OPERATING AND FINANCIAL REVIEW AND
FINANCIAL STATEMENTS AUDITOR’S
REPORT
KEY FIGURES
2011–2020
QUARTERLY FINANCIAL
INFORMATION INVESTOR
INFORMATION 7722
Basis of preparation Risks Income statement Balance sheet Off balance sheet items Group structure and related parties
For LTI plans commencing in 2015 to 2016, any shares awarded to Fortum Executive Management members are subject to a three-year lock-up period. Subject to a decision by the Board of Directors, the lock-up period can be reduced to one year for those Fortum Executive Management members whose aggregate ownership of Fortum shares is greater than or equal to their annual salary. If the value of the shares decreases or increases during the lock-up or retention period, the participant will carry the potential loss or gain. For LTI plans commencing in 2017 and later, the share awards will not be subject to a minimum lock-up period. However, Fortum Executive Management members aggregate ownership of Fortum shares has to be greater than or equal to their annual salary. Those members, whose aggregate ownership of Fortum shares does not yet fulfil the shareholding requirement are required to retain at least 50% of the shares received until the required level of shareholding is met.
Board of Directors decided in December 2019 to establish a Restricted Share programme as of the beginning of 2020 to supplement the current LTI programme. The Restricted Share programme will follow the main terms and conditions of the general LTI programme with the exception that the allocated shares will be delivered after the three-year plan period independent of performance measures, subject to continued employment. The Restricted Share programme is designated for special purposes defined by the Board of Directors, such as retention.
The Board of Directors has the right to revise the targets set in the incentive plans, deviate from the payment based on achievement of the set earnings criteria, or to discontinue any ongoing incentive plan.
The share plans under the LTI arrangement are accounted for as partly equity- and partly cash-settled arrangements. The earned reward that the participants receive in shares is accounted for as an equity-settled transaction. For participants receiving cash only, the total arrangement is accounted for as cash-settled transaction. The reward is recognised as an expense during the earnings period with a corresponding increase in the liabilities for transactions settled in cash, and a corresponding increase in equity for the transactions settled in shares. The social charges related to the arrangement payable by the employer are accrued as a liability. The LTI liability including social charges at the end of the year 2020 was EUR 12 million (2019: 14), including EUR 8 million (2019: 7) recorded in equity.
At year end 2020 approximately 160 key employees are participants in at least one of the on-going LTI plans. Uniper has historically had cash-settled performance plans. At the year end 2020 Uniper did not have any
such plans ongoing.
Shares granted The following table presents the changes in number of share rewards during 2020 (for LTI plans 2017 onwards). 2020 2019 1 January 1,717,656 1,116,663 Granted 630,475 608,051 Settled -434,607 - Expired or forfeited -310,378 -7,058 31 December 1,603,146 1,717,656
At the year end 2020, for plans started before 2017, number of shares under lock-up was 64,465 shares.
10.3 Employee share savings programme (ESS) Fortum's employee share savings (ESS) programme was launched in 2020. The objective of the ESS programme is to motivate Fortum employees to invest and retain ownership in the company and to align the employees' interests with its shareholders.
The ESS programme includes annually commencing savings periods during which the employees can save a proportion of their salaries and purchase Fortum shares with the accrued savings.
For the 2020 savings period that commenced on 1 January 2020, participants will, as a gross reward, be granted one matching share for each two purchased savings shares after approximately three years from the beginning of the savings period. The prerequisites for receiving matching shares are that the participant holds the purchased savings shares until the end of the holding period, and that his or her employment has not ended before the end of the holding period.
Each plan consists of one-year savings period followed by two-year holding period. Shares are purchased with the accumulated savings at the market price quarterly after the release of Fortum’s interim reports. The programme is accounted for as an equity-settled transaction, and the cost related to matching shares is recognised as expense during the vesting period.
10.4 Uniper's Supervisory Board virtual shares Supervisory Board members of Uniper SE receive a component of 20% of their compensation in the form of variable compensation. That compensation is granted as a right to a future payment in the form of virtual shares. The virtual shares are used purely for calculation purposes and do not confer on the beneficiary any entitlements of shareholder rights - particularly voting rights or dividend rights. To determine the number of virtual shares, the variable compensation from the previous year is divided in January by the volume-weighted average share price of Uniper SE from the last 60 trading days prior to 1 January of the reporting year. After four calendar years, the virtual shares are multiplied by the average share price of Uniper SE from the last 60 trading days prior to 1 January of the fourth calendar year and increased by the amount of dividends paid to shareholders on each share of Uniper SE over the previous four years. The variable compensation is paid within the first month after the end of the four-year period and is limited to 200% of the allocation amount. The plan is settled in cash.
1
2
3
4
5
6
7
8
9
10
11
12
13
14
15
16
17
18
19
20
21
22
23
24
25
26
27
28
29
30
31
32
33
34
35
36
37
38
39

OPERATING AND FINANCIAL
REVIEW
CONSOLIDATED FINANCIAL
STATEMENTS NOTES KEY
FIGURES
PARENT COMPANY FINANCIAL
STATEMENTS
SIGNATURES FOR THE OPERATING AND FINANCIAL REVIEW AND
FINANCIAL STATEMENTS AUDITOR’S
REPORT
KEY FIGURES
2011–2020
QUARTERLY FINANCIAL
INFORMATION INVESTOR
INFORMATION 7733
Basis of preparation Risks Income statement Balance sheet Off balance sheet items Group structure and related parties
10.5 Fortum Personnel Fund The Fortum Personnel Fund (for employees in Finland only) has been in operation since 2000. The Board of Directors determines the criteria for the fund’s annual profit-sharing bonus. Members of the personnel fund are the permanent and fixed-term employees of the Group.
The profit-sharing received by the fund is distributed equally between the members. Each employee’s share is divided into a tied amount and an amount available for withdrawal. It is possible to transfer a maximum of 15% of capital from the tied amount to the amount available for withdrawal each year.
The fund’s latest financial year ended at 30 April 2020 and the fund then had a total of 2,379 members (2019: 2,280). At the end of April 2020 Fortum contributed EUR 1.7 million (2019: 2.4) to the personnel fund as an annual profit-sharing bonus based on the financial results of 2019. The combined amount of members’ shares in the fund was EUR 18 million (2019: 20).
The contribution to the personnel fund is expensed as it is earned.
10.6 The President and CEO and the Fortum Executive Management remuneration The Fortum Executive Management (FEM) consists of nine members, including the President and CEO. The following table presents the total remuneration of the President and CEO and the FEM and takes into account the changes in FEM during the year. The expenses are shown on accrual basis.
Management remuneration 2020 2019
EUR thousand
Markus Rauramo, President
and CEO from 1 July
2020 2)
Pekka Lundmark,
President and
CEO until 1 July
2020 Other FEM
members 2)
Pekka Lundmark,
President and
CEO Other FEM members
Salaries and fringe benefits 808 521 3,195 1,057 3,382 Performance bonuses 1) 82 - 472 200 661 Share-based incentives 1) 249 94 2,553 898 3,506 Pensions (statutory) 140 82 599 207 748 Pensions (voluntary) 158 132 593 265 647 Social security expenses 31 18 279 39 344 Total 1,467 848 7,691 2,666 9,287 1) Based on estimated amounts. 2) In addition to the information provided in the above table, the estimated compensation for the membership in the
Supervisory Board of Uniper SE for the President and CEO Markus Rauramo was EUR 101 thousands, and for other FEM members, EUR 181 thousand. This compensation is for the period that Uniper has been consolidated as subsidiary.
The annual contribution for the President and CEO Markus Rauramo's pension arrangement is 20% of the annual fixed compensation. The annual fixed compensation consists of base salary and fringe benefits. The President and CEO's retirement age is determined in accordance with the Finnish Employees’ Pension Act. In case his assignment is terminated before the retirement age, the President and CEO is entitled to retain the benefits accrued in the arrangement. The annual contribution for the President and CEO Pekka Lundmark’s pension arrangement was 25% of the annual salary. The annual salary consisted of base salary and fringe benefits.
For the other members of the FEM, the retirement age varies between 62 and 65. According to Group policy, all new supplementary pension arrangements are defined contribution plans. For the members of the FEM that have defined contribution arrangements, the maximum pension premium percentage can be 25% of the annual salary. For members joining the FEM after the end of the year 2016, as well as for those current members to whom the premium has been below 20% of the annual salary, the pension premium is 20% of the annual base salary as of 1 January 2017. Finnish FEM members, who have joined Fortum prior to 1 January 2009, are participating in defined benefit pension arrangements, where the benefit is 60–66% of the final pensionable salary with the pension provided by an insurance company or Fortum’s Pension Fund.
A pension liability of EUR 1,283 thousand (2019: 824) related to the defined benefit plans for FEM members has been recognised on the balance sheet. The additional pension arrangement for the President and CEO is a defined contribution pension plan and thus no liability has been recognised on the balance sheet.
In the event that Fortum decides to give notice of termination to the President and CEO, he is entitled to the salary for the notice period (6 months) and a severance pay equal to 6 months’ salary. For other FEM members, the notice period for both parties is six months, and in case the company terminates the contract, members are entitled to the salary for the notice period and a severance pay equal to 6 months’ salary, except for one member who is entitled to a payment of 18 months’ salary in case of notice by the company.
Number of shares delivered to the management The table below shows the number of shares delivered to the President and CEO and other FEM members under the LTI arrangements. FEM members whose aggregate ownership of Fortum shares does not yet fulfil the shareholding requirement are required to retain at least 50% of the shares received until the required level of shareholding is met. 2020 2) 2019 3) FEM members at 31 December 2020 Markus Rauramo, CEO from 1 July 2020 12,273 11,137 Arun Aggarwal 4,012 - Alexander Chuvaev 1) 36,417 33,522 Per Langer 5,656 5,057 Risto Penttinen 6,612 6,232 Arto Räty 5,392 4,931 Mikael Rönnblad 6,787 3,435 Sirpa-Helena Sormunen 6,230 6,012 Tiina Tuomela 7,239 7,206 Former FEM members Pekka Lundmark (CEO until 1 July 2020) 28,527 25,765 Total 119,145 103,297 1) Estimated number of shares after local tax and tax related deductions. Due to local legislation, share rights will be paid in
cash instead of shares. 2) Share delivery based on share plans 2017-2019. 3) Share delivery based on share plan 2016-2021.
1
2
3
4
5
6
7
8
9
10
11
12
13
14
15
16
17
18
19
20
21
22
23
24
25
26
27
28
29
30
31
32
33
34
35
36
37
38
39

OPERATING AND FINANCIAL
REVIEW
CONSOLIDATED FINANCIAL
STATEMENTS NOTES KEY
FIGURES
PARENT COMPANY FINANCIAL
STATEMENTS
SIGNATURES FOR THE OPERATING AND FINANCIAL REVIEW AND
FINANCIAL STATEMENTS AUDITOR’S
REPORT
KEY FIGURES
2011–2020
QUARTERLY FINANCIAL
INFORMATION INVESTOR
INFORMATION 7744
Basis of preparation Risks Income statement Balance sheet Off balance sheet items Group structure and related parties
10.7 Board of Directors and management shareholding On 31 December 2020, the members of the Board of Directors owned a total of 9,540 shares (2019: 8,540), which corresponds to 0.00% (2019: 0.00%) of the company’s shares and voting rights.
Number of shares held by members of the Board of Directors 2020 2019 Board members at 31 December 2020 Matti Lievonen, Chairman 4,500 1,500 Veli-Matti Reinikkala, Deputy Chairman 5,000 3,000 Eva Hamilton 40 40 Essimari Kairisto - - Klaus-Dieter Maubach - - Anja McAlister - - Teppo Paavola - N/A Philipp Rösler - - Annette Stube - N/A Former Board members Kim Ignatius N/A 4,000 Total 9,540 8,540
The President and CEO and other members of the FEM owned a total of 281,308 shares (2019: 263,002), which corresponds to approximately 0.03% (2019: 0.03%) of the company’s shares and voting rights.
Number of shares held by members of the Fortum Executive Management 2020 2019 FEM members at 31 December 2020 Markus Rauramo 72,949 45,272 Arun Aggarwal 4,461 - Alexander Chuvaev 54,602 22,053 Per Langer 44,155 38,248 Risto Penttinen 30,559 18,587 Arto Räty 10,592 4,931 Mikael Rönnblad 10,356 3,435 Sirpa-Helena Sormunen 21,195 12,668 Tiina Tuomela 32,439 24,877 Former FEM members Pekka Lundmark N/A 92,931 Total 281,308 263,002
10.8 Board remuneration The Board of Directors comprises five to ten members who are elected at the Annual General Meeting for a one-year term of office, which expires at the end of the first Annual General Meeting following the election. The Board of Directors consists of nine members at the end of 2020.
The Annual General meeting confirms the yearly compensation for the Board of Directors. Board members are not offered any long-term incentive benefits or participation in other incentive schemes. There are no pension arrangements for the Board members. Social security costs EUR 6 thousand (2019: 11) have been recorded for the fees in accordance with local legislation in respective countries.
Fees for the Board of Directors EUR thousand 2020 2019 Chairman 77.2 75.0 Deputy Chairman 57.5 57.0 Chairman of the Audit and Risk Committee 1) 57.5 57.0 Members 40.4 40.0
1) If not Chairman or Deputy Chairman simultaneously.
Every member of the Board of Directors receives a fixed yearly fee and additional fees for each meeting attended.
A meeting fee of EUR 600 is paid for Board and Committee meetings. For Board members living outside Finland in Europe, the meeting fee is EUR 1,200; for Board members living outside Europe, the meeting fee is EUR 1,800. For Board and Committee meetings held as a telephone conference, the meeting fee is paid as EUR 600 to all members. No fee is paid for decisions made without a separate meeting.
Board members are entitled to travel expense compensation in accordance with the company’s travel policy.
Compensation for the Board of Directors EUR thousand 2020 2019 Board members at 31 December 2020 Matti Lievonen, Chairman 101 89 Veli-Matti Reinikkala, Deputy Chairman from 23 April 2020 77 58 Eva Hamilton 55 54 Essimari Kairisto, Chairman of the Audit and Risk Committee from 23 April 2020 72 56 Klaus-Dieter Maubach, Deputy Chairman until 23 April 2020 1) 65 71 Anja McAlister 57 59 Teppo Paavola (member of the board from 23 April 2020) 45 N/A Philipp Rösler (member of the board from 26 March 2019) 57 44 Annette Stube (member of the board from 23 April 2020) 42 N/A Former Board members Heinz-Werner Binzel (member of the board until 26 March 2019) N/A 12 Kim Ignatius (Chairman of the Audit and Risk Committee and member of the board until 23 April 2020) 21 67 Marco Ryan (member of the board from 26 March 2019 to 1 August 2019) N/A 19 Total 593 529
1) In addition to the information provided in the above table, the estimated compensation for the membership in the Supervisory Board of Uniper SE for Klaus-Dieter Maubach was EUR 157 thousand. This compensation is for the period that Uniper has been consolidated as subsidiary.
1
2
3
4
5
6
7
8
9
10
11
12
13
14
15
16
17
18
19
20
21
22
23
24
25
26
27
28
29
30
31
32
33
34
35
36
37
38
39

OPERATING AND FINANCIAL
REVIEW
CONSOLIDATED FINANCIAL
STATEMENTS NOTES KEY
FIGURES
PARENT COMPANY FINANCIAL
STATEMENTS
SIGNATURES FOR THE OPERATING AND FINANCIAL REVIEW AND
FINANCIAL STATEMENTS AUDITOR’S
REPORT
KEY FIGURES
2011–2020
QUARTERLY FINANCIAL
INFORMATION INVESTOR
INFORMATION 7755
Basis of preparation Risks Income statement Balance sheet Off balance sheet items Group structure and related parties
11 Finance costs – net
EUR million Note 2020 2019 Interest expense
Borrowings -186 -171Leasing and other interest expenses -12 -4Capitalised borrowing costs 17 27 9
Total -170 -167
Interest income Loan receivables and deposits 96 25 Leasing and other interest income 16 3
Total 111 28
Other financial expenses - net Return from Nuclear Funds, Nuclear fund adjustment and unwinding of discounts on provisions 1) 28, 29, 30 -26 -4Fair value changes, impairments and reversals 20 29 8 Other financial expenses and income 0 1
Total 3 5 IS Finance costs - net -56 -1341) In 2020, Nuclear fund adjustment was reclassified from Items affecting comparability to Other financial expenses, net.
Comparatives have been reclassified accordingly. See Note 1.7 Summary of Uniper acquisition impact to consolidatedfinancial statements.
Interest expenses on borrowing in 2020 totalled EUR 186 million (2019: 171) including interest expenses on loans of EUR 160 million (2019: 134), and EUR 26 million (2019: 37) interest cost net from derivatives hedging the loan portfolio. Interest expenses from leases were EUR 9 million (2019: 3).
Interest income in 2020 of EUR 111 million (2019: 28) include EUR 88 million (2019: 12) interest income from shareholder loan receivables and other loan receivables, and EUR 8 million (2019: 11) from deposits. Interest income from leases were EUR 12 million (2019: 0).
Return from Nuclear Funds include fund adjustment, interest income from the Finnish Nuclear waste fund and changes in fair values in the Swedish Nuclear waste fund. Unwinding of discount on provisions relates to Nuclear waste related provisions, pensions and other provisions. For additional information see Note 28 Nuclear related assets and liabilities.
Interest rate and currency derivatives in finance costs – net
EUR million 2020 2019 Interest rate and cross currency swaps Interest expenses on borrowings 24 20 Exchange rate difference from derivatives 52 30 Rate difference in fair value gains and losses on financial instruments 1) -2 25 Total fair value change of interest rate derivatives in finance costs - net 74 75
Foreign exchange derivatives Interest expenses on borrowings -50 -57Exchange rate difference from derivatives 61 -120Rate difference in fair value gains and losses on financial instruments 0 -1Total fair value change of currency derivatives in finance costs - net 11 -178Total 85 -1031) Fair value gains and losses on financial instruments include fair value changes from interest rate swaps not getting hedge
accounting status amounting to EUR 0 million (2019: -2) and fair value change of hedging derivatives in fair value hedgerelationship to EUR -2 million (2019: 27).
1
2
3
4
5
6
7
8
9
10
11
12
13
14
15
16
17
18
19
20
21
22
23
24
25
26
27
28
29
30
31
32
33
34
35
36
37
38
39

OPERATING AND FINANCIAL
REVIEW
CONSOLIDATED FINANCIAL
STATEMENTS NOTES KEY
FIGURES
PARENT COMPANY FINANCIAL
STATEMENTS
SIGNATURES FOR THE OPERATING AND FINANCIAL REVIEW AND
FINANCIAL STATEMENTS AUDITOR’S
REPORT
KEY FIGURES
2011–2020
QUARTERLY FINANCIAL
INFORMATION INVESTOR
INFORMATION 7766
Basis of preparation Risks Income statement Balance sheet Off balance sheet items Group structure and related parties
12 Income tax expense 12.1 Profit before tax EUR million 2020 2019 Finnish companies 1,088 303 German companies 1) 269 592 Russian companies 403 312 Swedish companies -65 383 Other companies 504 138 IS Total 2,199 1,728 1) Includes share of profits from associates related to Uniper, EUR 469 million (2019: 632), and impact from acquisition
accounting, EUR -222 million (2019: 0).
Profit before tax by country represents the respective countries’ part of total profit before tax for Fortum Group according to IFRS, based on the same accounting principles as consolidated financial statements. This means that the respective country’s profits include such items as share of profits from associates, and effects of accounting for nuclear provisions, which are not included in taxable profits in the local subsidiaries.
12.2 Major components of income tax expense by major countries EUR million 2020 2019 Current taxes Finnish companies -35 -40 German companies -81 -2 Russian companies -84 -51 Swedish companies 30 -79 Other companies -52 -61 Total -222 -233 Deferred taxes Finnish companies -32 -15 German companies -23 - Russian companies -12 -6 Swedish companies -81 6 Other companies 25 30 Total -123 15 Adjustments recognised for current tax of prior periods Finnish companies 1 -2 German companies 1 - Russian companies - - Swedish companies -1 - Other companies 1 -1 Total 2 -3 IS Income tax expense -344 -221
12.3 Income tax rate The table below explains the difference between the theoretical enacted tax rate in Finland compared to the tax rate in the consolidated income statement.
EUR million 2020 % 2019 % Profit before tax 2,199 1,728 Tax calculated at nominal Finnish tax rate -440 20.0 -346 20.0 Differences in tax rates in other jurisdictions -52 2.4 -62 3.6 Tax rate changes 4 -0.2 -3 0.2 Tax exempt capital gains 167 -7.6 2 -0.1 Impact of acquisition accounting -70 3.2 - - Tax exempt income and other non-deductible expenses 24 -1.1 -8 0.4 Share of profit of associates and joint ventures 189 -8.6 220 -12.7 Taxes related to dividend distributions -24 1.1 -17 1.0 Tax effects of changes in value and non-recognition of deferred taxes -129 5.9 -3 0.3 Other items -16 0.7 -1 -0.1 Adjustments recognised for taxes of prior periods 3 -0.1 -3 0.2 IS Income tax expense -344 15.7 -221 12.8
Key tax indicators: • The weighted average applicable income tax rate for 2020 is 22.1% (2019: 23.6%) • The effective income tax rate in the income statement for 2020 is 15.7% (2019: 12.8%) • The comparable effective income tax rate (excluding the share of profits from associates and joint ventures,
as well as items affecting comparability, tax exempt capital gains, tax rate changes and other major one-time income tax effects) for 2020 is 23.8% (2019: 22.0%).
See Definitions of key figures.
1
2
3
4
5
6
7
8
9
10
11
12
13
14
15
16
17
18
19
20
21
22
23
24
25
26
27
28
29
30
31
32
33
34
35
36
37
38
39
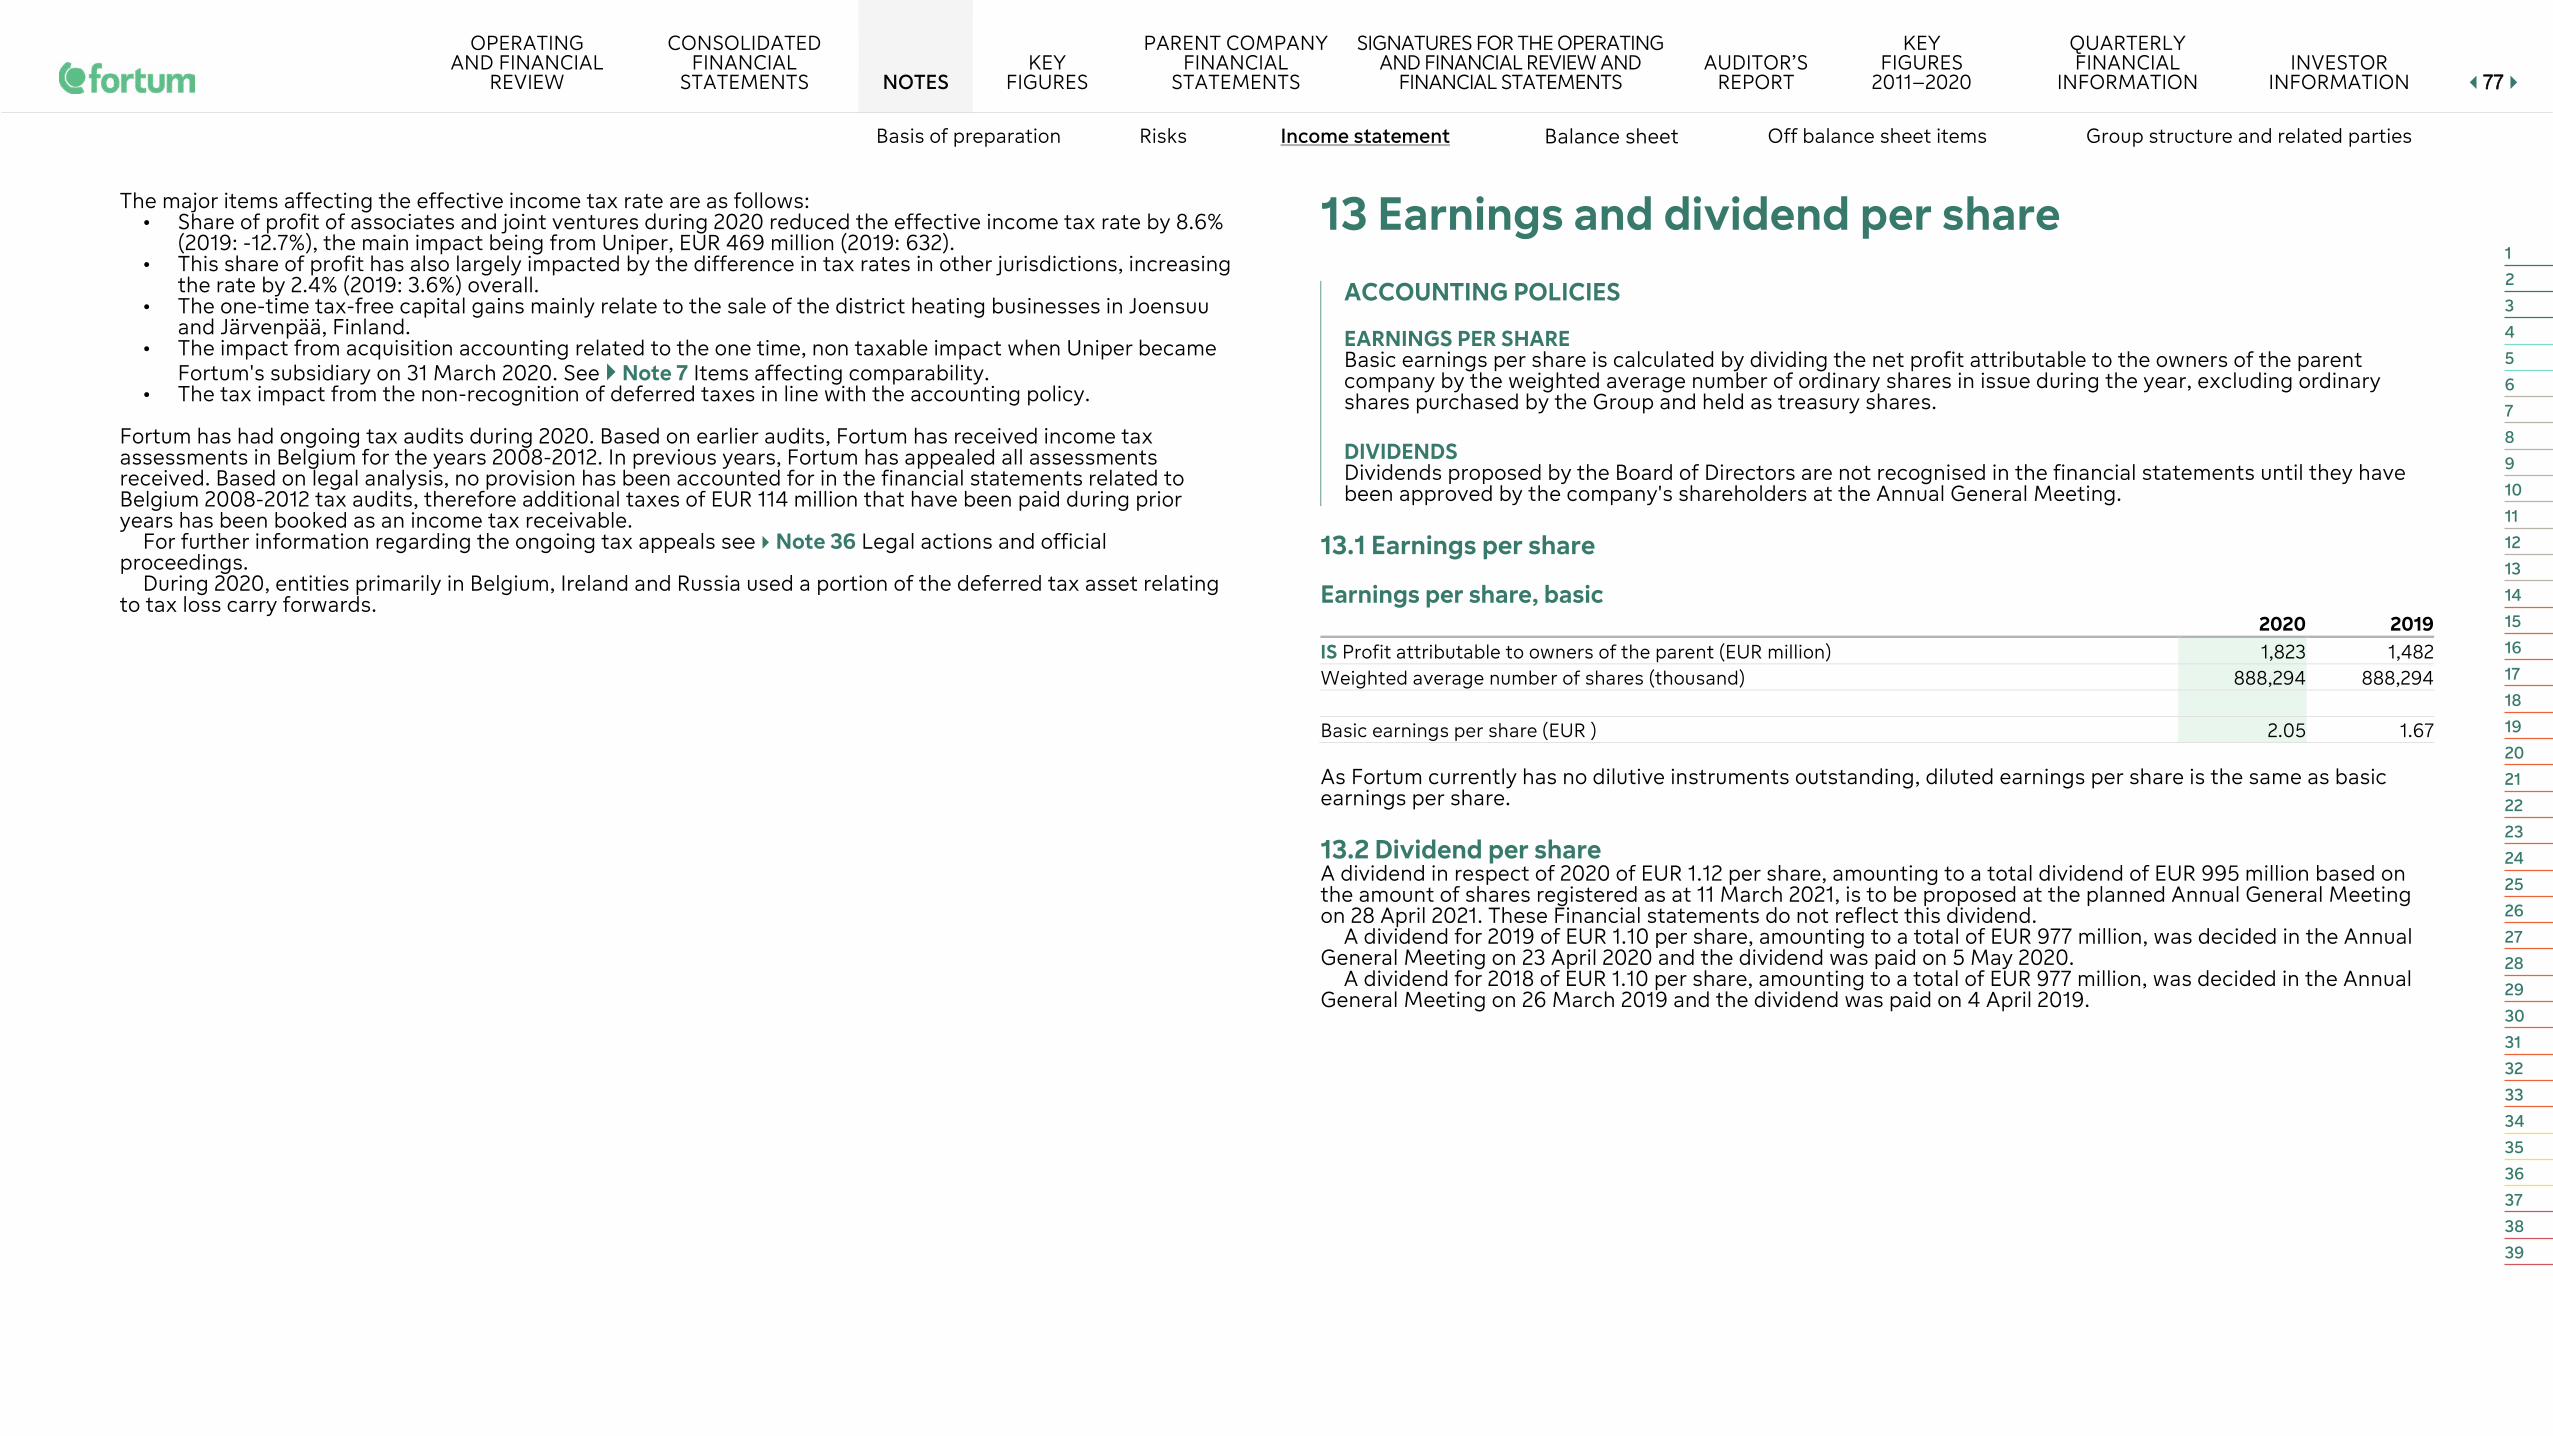
OPERATING AND FINANCIAL
REVIEW
CONSOLIDATED FINANCIAL
STATEMENTS NOTES KEY
FIGURES
PARENT COMPANY FINANCIAL
STATEMENTS
SIGNATURES FOR THE OPERATING AND FINANCIAL REVIEW AND
FINANCIAL STATEMENTS AUDITOR’S
REPORT
KEY FIGURES
2011–2020
QUARTERLY FINANCIAL
INFORMATION INVESTOR
INFORMATION 7777
Basis of preparation Risks Income statement Balance sheet Off balance sheet items Group structure and related parties
The major items affecting the effective income tax rate are as follows: • Share of profit of associates and joint ventures during 2020 reduced the effective income tax rate by 8.6%
(2019: -12.7%), the main impact being from Uniper, EUR 469 million (2019: 632). • This share of profit has also largely impacted by the difference in tax rates in other jurisdictions, increasing
the rate by 2.4% (2019: 3.6%) overall. • The one-time tax-free capital gains mainly relate to the sale of the district heating businesses in Joensuu
and Järvenpää, Finland. • The impact from acquisition accounting related to the one time, non taxable impact when Uniper became
Fortum's subsidiary on 31 March 2020. See Note 7 Items affecting comparability. • The tax impact from the non-recognition of deferred taxes in line with the accounting policy.
Fortum has had ongoing tax audits during 2020. Based on earlier audits, Fortum has received income tax assessments in Belgium for the years 2008-2012. In previous years, Fortum has appealed all assessments received. Based on legal analysis, no provision has been accounted for in the financial statements related to Belgium 2008-2012 tax audits, therefore additional taxes of EUR 114 million that have been paid during prior years has been booked as an income tax receivable.
For further information regarding the ongoing tax appeals see Note 36 Legal actions and official proceedings.
During 2020, entities primarily in Belgium, Ireland and Russia used a portion of the deferred tax asset relating to tax loss carry forwards.
13 Earnings and dividend per share ACCOUNTING POLICIES
EARNINGS PER SHARE Basic earnings per share is calculated by dividing the net profit attributable to the owners of the parent company by the weighted average number of ordinary shares in issue during the year, excluding ordinary shares purchased by the Group and held as treasury shares.
DIVIDENDS Dividends proposed by the Board of Directors are not recognised in the financial statements until they have been approved by the company's shareholders at the Annual General Meeting.
13.1 Earnings per share
Earnings per share, basic 2020 2019 IS Profit attributable to owners of the parent (EUR million) 1,823 1,482 Weighted average number of shares (thousand) 888,294 888,294 Basic earnings per share (EUR ) 2.05 1.67 As Fortum currently has no dilutive instruments outstanding, diluted earnings per share is the same as basic earnings per share.
13.2 Dividend per share A dividend in respect of 2020 of EUR 1.12 per share, amounting to a total dividend of EUR 995 million based on the amount of shares registered as at 11 March 2021, is to be proposed at the planned Annual General Meeting on 28 April 2021. These Financial statements do not reflect this dividend.
A dividend for 2019 of EUR 1.10 per share, amounting to a total of EUR 977 million, was decided in the Annual General Meeting on 23 April 2020 and the dividend was paid on 5 May 2020.
A dividend for 2018 of EUR 1.10 per share, amounting to a total of EUR 977 million, was decided in the Annual General Meeting on 26 March 2019 and the dividend was paid on 4 April 2019.
1
2
3
4
5
6
7
8
9
10
11
12
13
14
15
16
17
18
19
20
21
22
23
24
25
26
27
28
29
30
31
32
33
34
35
36
37
38
39
OPERATING AND FINANCIAL
REVIEW
CONSOLIDATED FINANCIAL
STATEMENTS NOTES KEY
FIGURES
PARENT COMPANY FINANCIAL
STATEMENTS
SIGNATURES FOR THE OPERATING AND FINANCIAL REVIEW AND
FINANCIAL STATEMENTS AUDITOR’S
REPORT
KEY FIGURES
2011–2020
QUARTERLY FINANCIAL
INFORMATION INVESTOR
INFORMATION 7788
Basis of preparation Risks Income statement Balance sheet Off balance sheet items Group structure and related parties
14 Financial assets and liabilities by categories
ACCOUNTING POLICIES
FINANCIAL ASSETS Fortum classifies its financial assets in the following categories according to IFRS 9: financial assets at amortised cost, financial assets at fair value through profit or loss and financial assets at fair value through other comprehensive income. The classification is made at initial recognition and depends on the financial asset's contractual cash flow characteristics and the Group's business model for managing them.
In order for the financial asset to be classified and measured at amortised cost or fair value through other comprehensive income, it needs to give rise to cash flows that are solely payments of the principal and interest on the principal amount outstanding. This assessment is referred to as the SPPI test and is performed at an instrument level. When the SPPI criteria is not met, financial assets are classified to fair value through profit or loss category.
Financial assets are presented as non-current assets unless they are held for trading, expected to be realised within 12 months at the closing date or they have a maturity of under 12 months at closing date. These are classified as current assets.
FINANCIAL ASSETS AT AMORTISED COST Fortum measures financial assets at amortised cost when the financial asset is included in the held-to-collect business model with fixed or determinable payments that are payments of amount outstanding or interest on it. They arise when the Group provides money, goods or services directly to a debtor. Financial assets at amortised cost include non-derivative financial assets with fixed or determinable payments that are not quoted in an active market.
Financial assets at amortised cost are subject to impairment using expected credit loss (ECL) model. Gains and losses from derecognition of the asset are recognised in profit and loss.
FINANCIAL ASSETS AT FAIR VALUE THROUGH PROFIT OR LOSS Financial assets at fair value through profit or loss include financial assets held for trading in the short term, financial assets designated upon initial recognition irrevocably as fair value through profit or loss and financial assets mandatorily recognised at fair value through profit or loss according to IFRS 9. Derivatives are classified as held for trading unless they are designated as effective hedging instruments.
Gains and losses arising from changes in the fair value are included in the income statement in the period in which they arise.
FINANCIAL ASSETS AT FAIR VALUE THROUGH OTHER COMPREHENSIVE INCOME Other equity investments designated at fair value through other comprehensive income are not subject to impairment assessment and accumulated reserves are not recycled to profit or loss upon derecognition. Dividends received are recognised in profit and loss.
Investments designated at fair value through other comprehensive income mainly consist of other equity investments coming from the acquisition of Uniper which the Group has elected to designate irrevocably at fair value through other comprehensive income.
DERECOGNITION Fortum derecognises financial assets when the rights to receive cash flows from the assets have expired or when it has substantially transferred the risks and rewards of the assets outside of the Group.
IMPAIRMENT Fortum recognises an allowance for expected credit losses (ECL) according to IFRS 9 for financial assets measured at amortised cost. See further information on ECL in Note 4.4.1 Credit quality of major financial assets and in Note 22 Trade and other receivables. Financial assets measured at fair value through profit or loss are not included in ECL assessment as they are already measured at fair value. A financial asset is written-off when there is no reasonable expectation of recovering the contractual cash flows.
FINANCIAL LIABILITIES All financial liabilities are recognised initially at fair value. In the case of loans and borrowings and payables, incurred transaction costs are deducted. In subsequent periods, all financial liabilities, except derivatives and financial liabilities which the Group has at initial recognition irrevocably designated at fair value through profit or loss, are stated at amortised cost; any difference between proceeds (net of transaction costs) and the redemption value is recognised as interest cost over the period of the borrowing using the effective interest rate method.
Derivative financial instruments entered into by the Group, that are not designated as hedging instruments are classified as liabilities at fair value through profit and loss. Amortisation of the effective interest rate and gains and losses of liabilities are recognised in the income statement.
Group’s financial liabilities include trade and other payables, loans and borrowings and derivative financial instruments. Borrowings or portion of borrowings being hedged with a fair value hedge are recognised at fair value through profit or loss. Derecognition of financial liabilities takes place when the Group has fulfilled the contractual obligations.
ACCOUNTING FOR DERIVATIVE FINANCIAL INSTRUMENTS AND HEDGING ACTIVITIES Within the ordinary course of business the Group routinely enters into sale and purchase transactions for commodities. Contracts that were entered into and continue to be held for the purpose of receipt or delivery of the commodity in accordance with the Group's expected sale, purchase or usage requirements are not within the scope of IFRS 9 ("own use exemption"). Physical contracts to buy or sell a non-financial item, which are fair valued using the fair value option to off-set accounting mismatch, or where own use exemption or hedge accounting cannot be applied are fair valued through the income statement.
Derivatives are initially recognised at fair value on the date a derivative contract is entered into and are subsequently remeasured at their fair value. Gains and losses resulting from the initial fair value measurement of a derivative (“day one” gains and losses) are eliminated against the corresponding derivative asset or liability, if the initial fair value is determined based on valuation model with input parameters that are unobservable from active markets. For derivatives whose initial fair value is evidenced by a quoted price in an active market for an identical contract or based on a valuation technique that uses only data from observable markets, gains and losses from the initial measurement are accounted for similarly to gains or losses on the subsequent measurement.
1
2
3
4
5
6
7
8
9
10
11
12
13
14
15
16
17
18
19
20
21
22
23
24
25
26
27
28
29
30
31
32
33
34
35
36
37
38
39
OPERATING AND FINANCIAL
REVIEW
CONSOLIDATED FINANCIAL
STATEMENTS NOTES KEY
FIGURES
PARENT COMPANY FINANCIAL
STATEMENTS
SIGNATURES FOR THE OPERATING AND FINANCIAL REVIEW AND
FINANCIAL STATEMENTS AUDITOR’S
REPORT
KEY FIGURES
2011–2020
QUARTERLY FINANCIAL
INFORMATION INVESTOR
INFORMATION 7799
Basis of preparation Risks Income statement Balance sheet Off balance sheet items Group structure and related parties
The method of recognising the resulting gain or loss on the subsequent measurement depends on whether the derivative is designated as a hedging instrument eligible for hedge accounting, and if so, the nature of the item being hedged. The Group designates certain derivatives as either: (1) hedges of highly probable forecast transactions (cash flow hedges); (2) hedges of the fair value of recognised assets or liabilities, or unrecognised firm commitments (fair value hedge); or (3) hedges of net investments in foreign operations.
The Group documents at the inception of the transaction the relationship between hedging instruments and hedged items, whether the hedged item is one or several risk components separately or in aggregation, as well as its risk management objective and strategy for undertaking various hedge transactions. When applying hedge accounting the Group also documents its assessment, of whether the derivatives that are used in hedging transactions are meeting the hedge accounting effectiveness criteria: (1) there is an economic relationship between the hedged item and the hedging instrument, (2) the effect of credit risk does not dominate the value changes that result from that economic relationship; and (3) the hedge ratio of the hedging relationship is the same as applied in the risk management. The Group also documents its assessment, both at hedge inception and on an ongoing basis, of whether the derivatives that are used in hedging transactions are highly effective by assessing the prospective capacity of the derivatives in offsetting changes in fair values or cash flows of hedged items. Hedge accounting is discontinued only when the hedging relationship ceases to meet the hedge effectiveness criteria.
CASH FLOW HEDGE The effective portion of changes in the fair value of derivatives that are designated and qualify as cash flow hedges are recognised in equity. Gain or loss relating to the ineffective portion is recognised immediately in the income statement. Amounts accumulated in equity are recycled in the income statement in the periods when the hedged item will affect profit and loss (e.g. when the forecasted sale that is hedged takes place). However, when the forecast transaction that is hedged results in the recognition of a non-financial asset (e.g. inventory) or a liability, the gains and losses previously deferred in equity are transferred from equity and included in the initial measurement of the cost of the asset or liability. When a hedge no longer meets the criteria for hedge accounting, any cumulative gain or loss existing in equity is recognised in the income statement when the forecast transaction is ultimately also recognised in the income statement. When a forecasted transaction is no longer expected to occur, the cumulative gain or loss that was reported in equity is immediately recognised in the income statement.
Fortum hedges its exposure to commodity market risks and applies hedge accounting by risk components. Hedge accounting is applied to Nordic electricity price risk, where the Nordic area priced physical electricity
delivery is commonly divided into three risk components: (1) system price risk, (2) electricity price area difference risk (EPAD) and (3) currency risk. For each of these separate risk components there are specific derivative contracts available, which each are being a highly effective hedge for the associated risk component.
FAIR VALUE HEDGE Changes in the fair value of derivatives that are designated and qualify as fair value hedges are recorded in the income statement, together with any changes in the fair value of the hedged asset or liability that are attributable to the hedged risk.
If the hedge no longer meets the criteria for hedge accounting, the adjustment to the carrying amount of a hedged item for which the effective interest method is used is amortised to profit or loss for the periods until maturity of the hedged item.
NET INVESTMENT HEDGING IN FOREIGN OPERATIONS Hedges of net investments in foreign operations are accounted for similarly to cash flow hedges. Any gain or loss on the hedging instrument relating to the effective portion of the hedge is recognised in equity; the gain or loss relating to the ineffective portion is recognised immediately in the income statement. Gains and losses accumulated in equity are included in the income statement when the foreign operation is disposed of.
DERIVATIVES THAT DO NOT QUALIFY FOR HEDGE ACCOUNTING Certain derivative instruments hedging future cash flows do not qualify for hedge accounting. Fair value changes of these commodity derivative instruments are recognised in items affecting comparability in the income statement, whereas fair value changes of interest rate and currency derivative instruments are recognised in finance costs - net.
Financial assets and liabilities in the tables below are split into categories in accordance with IFRS 9. The categories are further divided into classes which are the basis for valuing a respective asset or liability. Further information can be found in the Notes mentioned in the table.
1
2
3
4
5
6
7
8
9
10
11
12
13
14
15
16
17
18
19
20
21
22
23
24
25
26
27
28
29
30
31
32
33
34
35
36
37
38
39
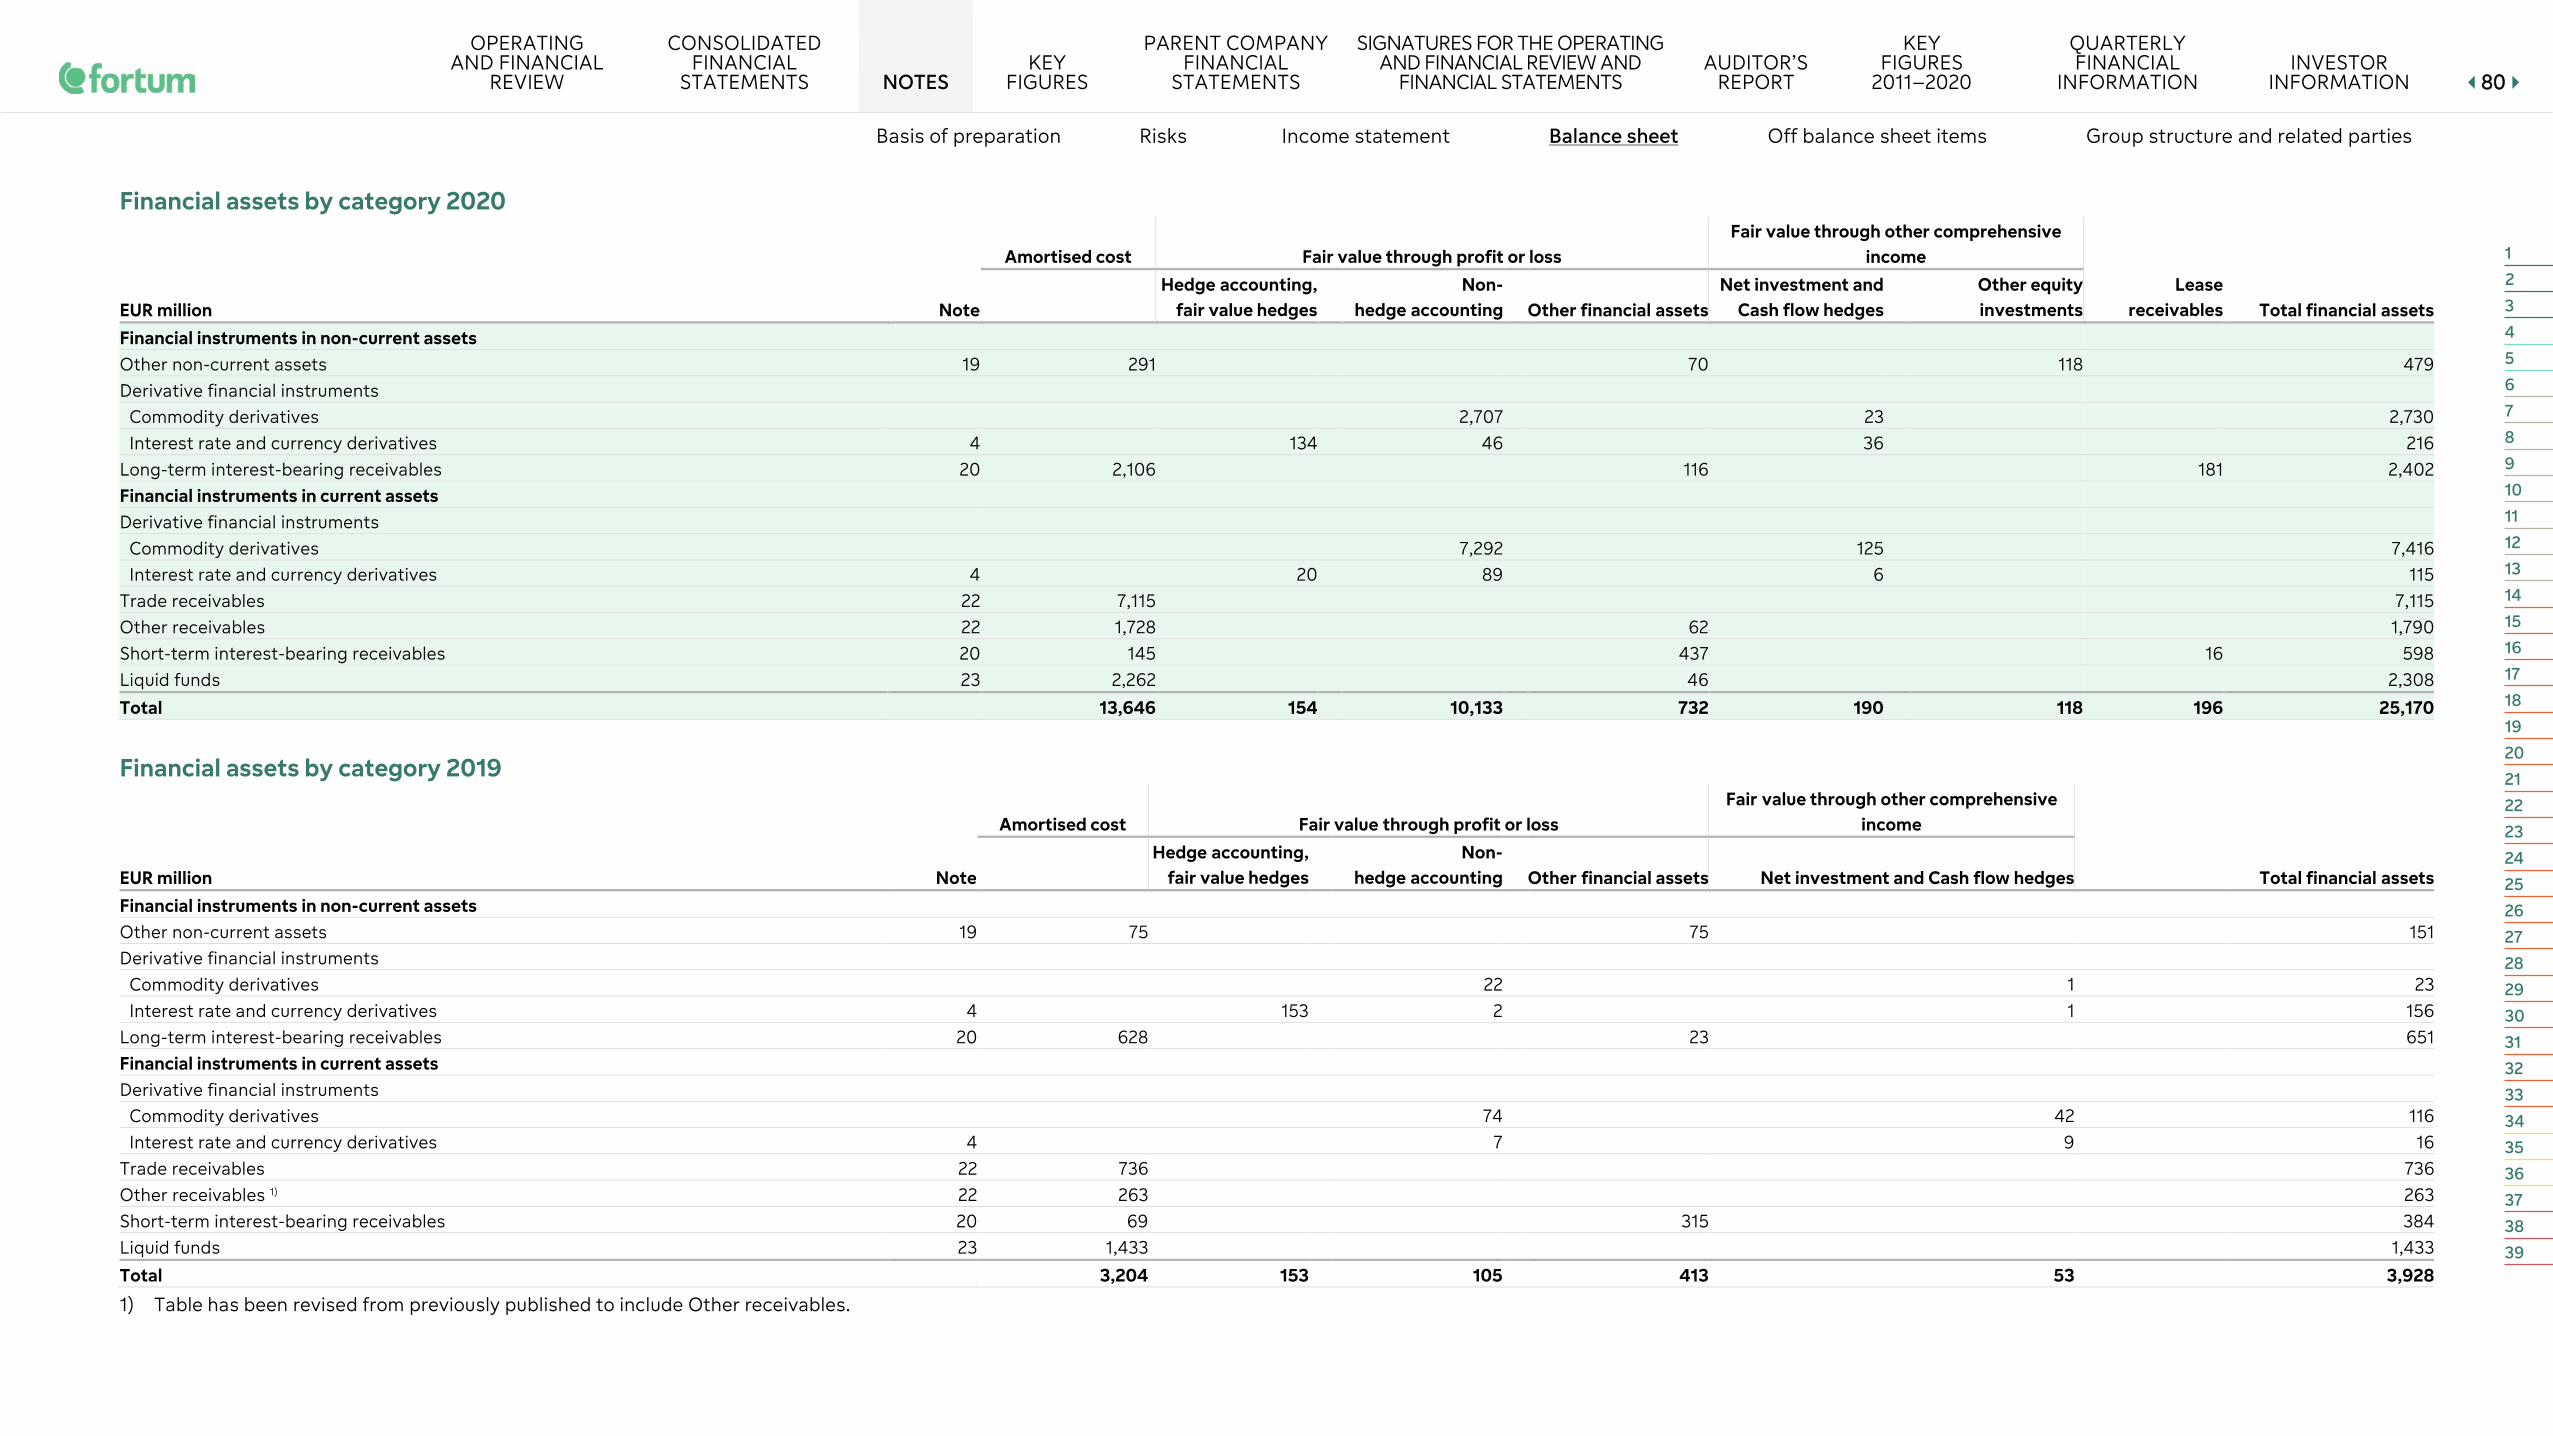
OPERATING AND FINANCIAL
REVIEW
CONSOLIDATED FINANCIAL
STATEMENTS NOTES KEY
FIGURES
PARENT COMPANY FINANCIAL
STATEMENTS
SIGNATURES FOR THE OPERATING AND FINANCIAL REVIEW AND
FINANCIAL STATEMENTS AUDITOR’S
REPORT
KEY FIGURES
2011–2020
QUARTERLY FINANCIAL
INFORMATION INVESTOR
INFORMATION 8800
Basis of preparation Risks Income statement Balance sheet Off balance sheet items Group structure and related parties
Financial assets by category 2020
Amortised cost Fair value through profit or loss Fair value through other comprehensive
income
EUR million Note Hedge accounting,
fair value hedges Non-
hedge accounting Other financial assets Net investment and
Cash flow hedges Other equity investments
Lease receivables Total financial assets
Financial instruments in non-current assets Other non-current assets 19 291 70 118 479 Derivative financial instruments
Commodity derivatives 2,707 23 2,730 Interest rate and currency derivatives 4 134 46 36 216
Long-term interest-bearing receivables 20 2,106 116 181 2,402 Financial instruments in current assets Derivative financial instruments
Commodity derivatives 7,292 125 7,416 Interest rate and currency derivatives 4 20 89 6 115
Trade receivables 22 7,115 7,115 Other receivables 22 1,728 62 1,790 Short-term interest-bearing receivables 20 145 437 16 598 Liquid funds 23 2,262 46 2,308 Total 13,646 154 10,133 732 190 118 196 25,170
Financial assets by category 2019
Amortised cost Fair value through profit or loss Fair value through other comprehensive
income
EUR million Note Hedge accounting,
fair value hedges Non-
hedge accounting Other financial assets Net investment and Cash flow hedges Total financial assets Financial instruments in non-current assets Other non-current assets 19 75 75 151 Derivative financial instruments
Commodity derivatives 22 1 23 Interest rate and currency derivatives 4 153 2 1 156
Long-term interest-bearing receivables 20 628 23 651 Financial instruments in current assets Derivative financial instruments
Commodity derivatives 74 42 116 Interest rate and currency derivatives 4 7 9 16
Trade receivables 22 736 736 Other receivables 1) 22 263 263 Short-term interest-bearing receivables 20 69 315 384 Liquid funds 23 1,433 1,433 Total 3,204 153 105 413 53 3,928 1) Table has been revised from previously published to include Other receivables.
1
2
3
4
5
6
7
8
9
10
11
12
13
14
15
16
17
18
19
20
21
22
23
24
25
26
27
28
29
30
31
32
33
34
35
36
37
38
39

OPERATING AND FINANCIAL
REVIEW
CONSOLIDATED FINANCIAL
STATEMENTS NOTES KEY
FIGURES
PARENT COMPANY FINANCIAL
STATEMENTS
SIGNATURES FOR THE OPERATING AND FINANCIAL REVIEW AND
FINANCIAL STATEMENTS AUDITOR’S
REPORT
KEY FIGURES
2011–2020
QUARTERLY FINANCIAL
INFORMATION INVESTOR
INFORMATION 8811
Basis of preparation Risks Income statement Balance sheet Off balance sheet items Group structure and related parties
Financial liabilities by category 2020
Amortised cost Fair value through profit or loss Fair value through other comprehensive
income
EUR million Note Hedge accounting,
fair value hedges Non-hedge accounting
Other financial liabilities Net investment and Cash flow hedges
Lease liabilities Total financial liabilities
Financial instruments in non-current liabilities Interest-bearing liabilities 26 5,746 2,145 1) 894 8,785 Derivative financial instruments
Commodity derivatives 2,462 77 2,539 Interest rate and currency derivatives 4 25 63 30 118
Financial instruments in current liabilities Interest-bearing liabilities 26 1,284 432 161 1,877 Derivative financial instruments
Commodity derivatives 7,512 244 7,756 Interest rate and currency derivatives 4 10 167 4 181
Trade payables 32 7,126 7,126 Other liabilities 32 972 972 Total 15,128 2,180 10,203 432 356 1,055 29,354 1) Fair valued part of bond in fair value hedge relationship.
Financial liabilities by category 2019
Amortised cost Fair value through profit or loss Fair value through other comprehensive
income
EUR million Note Hedge accounting,
fair value hedges Non-hedge accounting
Other financial liabilities Net investment and Cash flow hedges
Lease liabilities Total financial liabilities
Financial instruments in non-current liabilities Interest-bearing liabilities 26 3,736 2,293 1) 89 6,118 Derivative financial instruments
Commodity derivatives 33 30 63 Interest rate and currency derivatives 4 25 3 47 75
Financial instruments in current liabilities Interest-bearing liabilities 26 270 281 19 570 Derivative financial instruments
Commodity derivatives 114 85 199 Interest rate and currency derivatives 4 49 4 53
Trade payables 32 316 316 Other liabilities 32 168 168 TToottaall 4,490 2,318 199 281 166 108 7,562
1) Fair valued part of bond in fair value hedge relationship.
1
2
3
4
5
6
7
8
9
10
11
12
13
14
15
16
17
18
19
20
21
22
23
24
25
26
27
28
29
30
31
32
33
34
35
36
37
38
39

OPERATING AND FINANCIAL
REVIEW
CONSOLIDATED FINANCIAL
STATEMENTS NOTES KEY
FIGURES
PARENT COMPANY FINANCIAL
STATEMENTS
SIGNATURES FOR THE OPERATING AND FINANCIAL REVIEW AND
FINANCIAL STATEMENTS AUDITOR’S
REPORT
KEY FIGURES
2011–2020
QUARTERLY FINANCIAL
INFORMATION INVESTOR
INFORMATION 8822
Basis of preparation Risks Income statement Balance sheet Off balance sheet items Group structure and related parties
15 Financial assets and liabilities by fair value hierarchy
ACCOUNTING POLICIES Fair value measurements are classified using a fair value hierarchy i.e. Level 1, Level 2 and Level 3 that reflects the significance of the inputs used in making the measurements.
FAIR VALUES UNDER LEVEL 1 MEASUREMENT HIERARCHY The fair value of financial assets and liabilities classified as Level 1 is based on unadjusted quoted prices in active markets at the closing date. Level 1 consist e.g. commodity derivatives traded in active markets.
FAIR VALUES UNDER LEVEL 2 MEASUREMENT HIERARCHY The fair value of financial assets and liabilities classified as Level 2 is based on observable input parameters, which are other than quoted prices.
The fair value of financial instruments traded in active markets in Level 2 is calculated using prices derived from quoted market prices at the closing date. Known calculation techniques, such as estimated discounted cash flows, are used to determine fair value of interest rate and currency financial instruments. The fair value of interest-rate swaps is calculated as the present value of the estimated future cash flows. The fair value of forward foreign exchange contracts is determined using forward exchange market rates at the closing date. Fair values of options are determined by using option valuation models. The fair value of financial liabilities is estimated by discounting the future contractual cash flows at the current market interest rate that is available to the Group for similar financial instruments. The counterparty credit risk has been taken into account when determining fair value. The credit risk is determined based on a portfolio valuation in a bilateral approach covering both Fortum’s own credit risk (debt value adjustment) and the credit risk of the corresponding counterparty (credit value adjustment).
The Group bases the calculation on existing market conditions at each closing date. Financial instruments used in Fortum are standardised products that are either cleared via exchanges or widely traded in the market. Credit risk from trading commodity derivatives is mitigated by clearing trades through exchanges or by limiting trades to OTC counterparties considered to be creditworthy, or secured by credit worthy guarantees. Financial derivatives are traded with credit worthy financial institutions with investment grade ratings.
FAIR VALUES UNDER LEVEL 3 MEASUREMENT HIERARCHY The fair value of financial assets and liabilities classified as Level 3 is based on unobservable input parameters.
Level 3 consist mainly investments in unlisted shares classified as other investments for which the fair value can't be reliably measured and derivative financial instrument for which the fair value has been determined using valuation techniques with unobservable inputs. The input parameters of Level 3 of the fair value hierarchy for equity investments are specified taking into account economic developments and available industry and corporate data. The counterparty credit risk has been adjusted when determining the fair value.
1
2
3
4
5
6
7
8
9
10
11
12
13
14
15
16
17
18
19
20
21
22
23
24
25
26
27
28
29
30
31
32
33
34
35
36
37
38
39

OPERATING AND FINANCIAL
REVIEW
CONSOLIDATED FINANCIAL
STATEMENTS NOTES KEY
FIGURES
PARENT COMPANY FINANCIAL
STATEMENTS
SIGNATURES FOR THE OPERATING AND FINANCIAL REVIEW AND
FINANCIAL STATEMENTS AUDITOR’S
REPORT
KEY FIGURES
2011–2020
QUARTERLY FINANCIAL
INFORMATION INVESTOR
INFORMATION 8833
Basis of preparation Risks Income statement Balance sheet Off balance sheet items Group structure and related parties
Financial assets Level 1 Level 2 Level 3 Netting 1) Total EUR million Note 2020 2019 2020 2019 2020 2019 2020 2019 2020 2019 In non-current assets Other investments 19 75 0 43 70 75 188 75 Derivative financial instruments
Commodity derivatives Hedge accounting 4 52 9 -29 -8 23 1 Non-hedge accounting 1,030 10 1,563 27 138 -24 -16 2,707 21
Interest rate and currency derivatives 4 Hedge accounting 170 154 170 154 Non-hedge accounting 46 2 46 2
Interest-bearing receivables 98 17 23 116 23 In current assets Derivative financial instruments
Commodity derivatives Hedge accounting 4 185 101 -60 -59 125 42 Non-hedge accounting 2,851 315 5,090 306 6 -655 -547 7,292 74
Interest rate and currency derivatives 4 Hedge accounting 26 9 26 9 Non-hedge accounting 89 7 89 7
Other receivables 62 62 Interest-bearing receivables 432 281 46 5 34 483 315 Total 4,486 606 7,372 615 237 132 -768 -630 11,326 724
1) In Fortum, excluding Uniper, receivables and liabilities from electricity and other commodity exchanges arising against standard derivative contracts with same delivery period are netted.
1
2
3
4
5
6
7
8
9
10
11
12
13
14
15
16
17
18
19
20
21
22
23
24
25
26
27
28
29
30
31
32
33
34
35
36
37
38
39
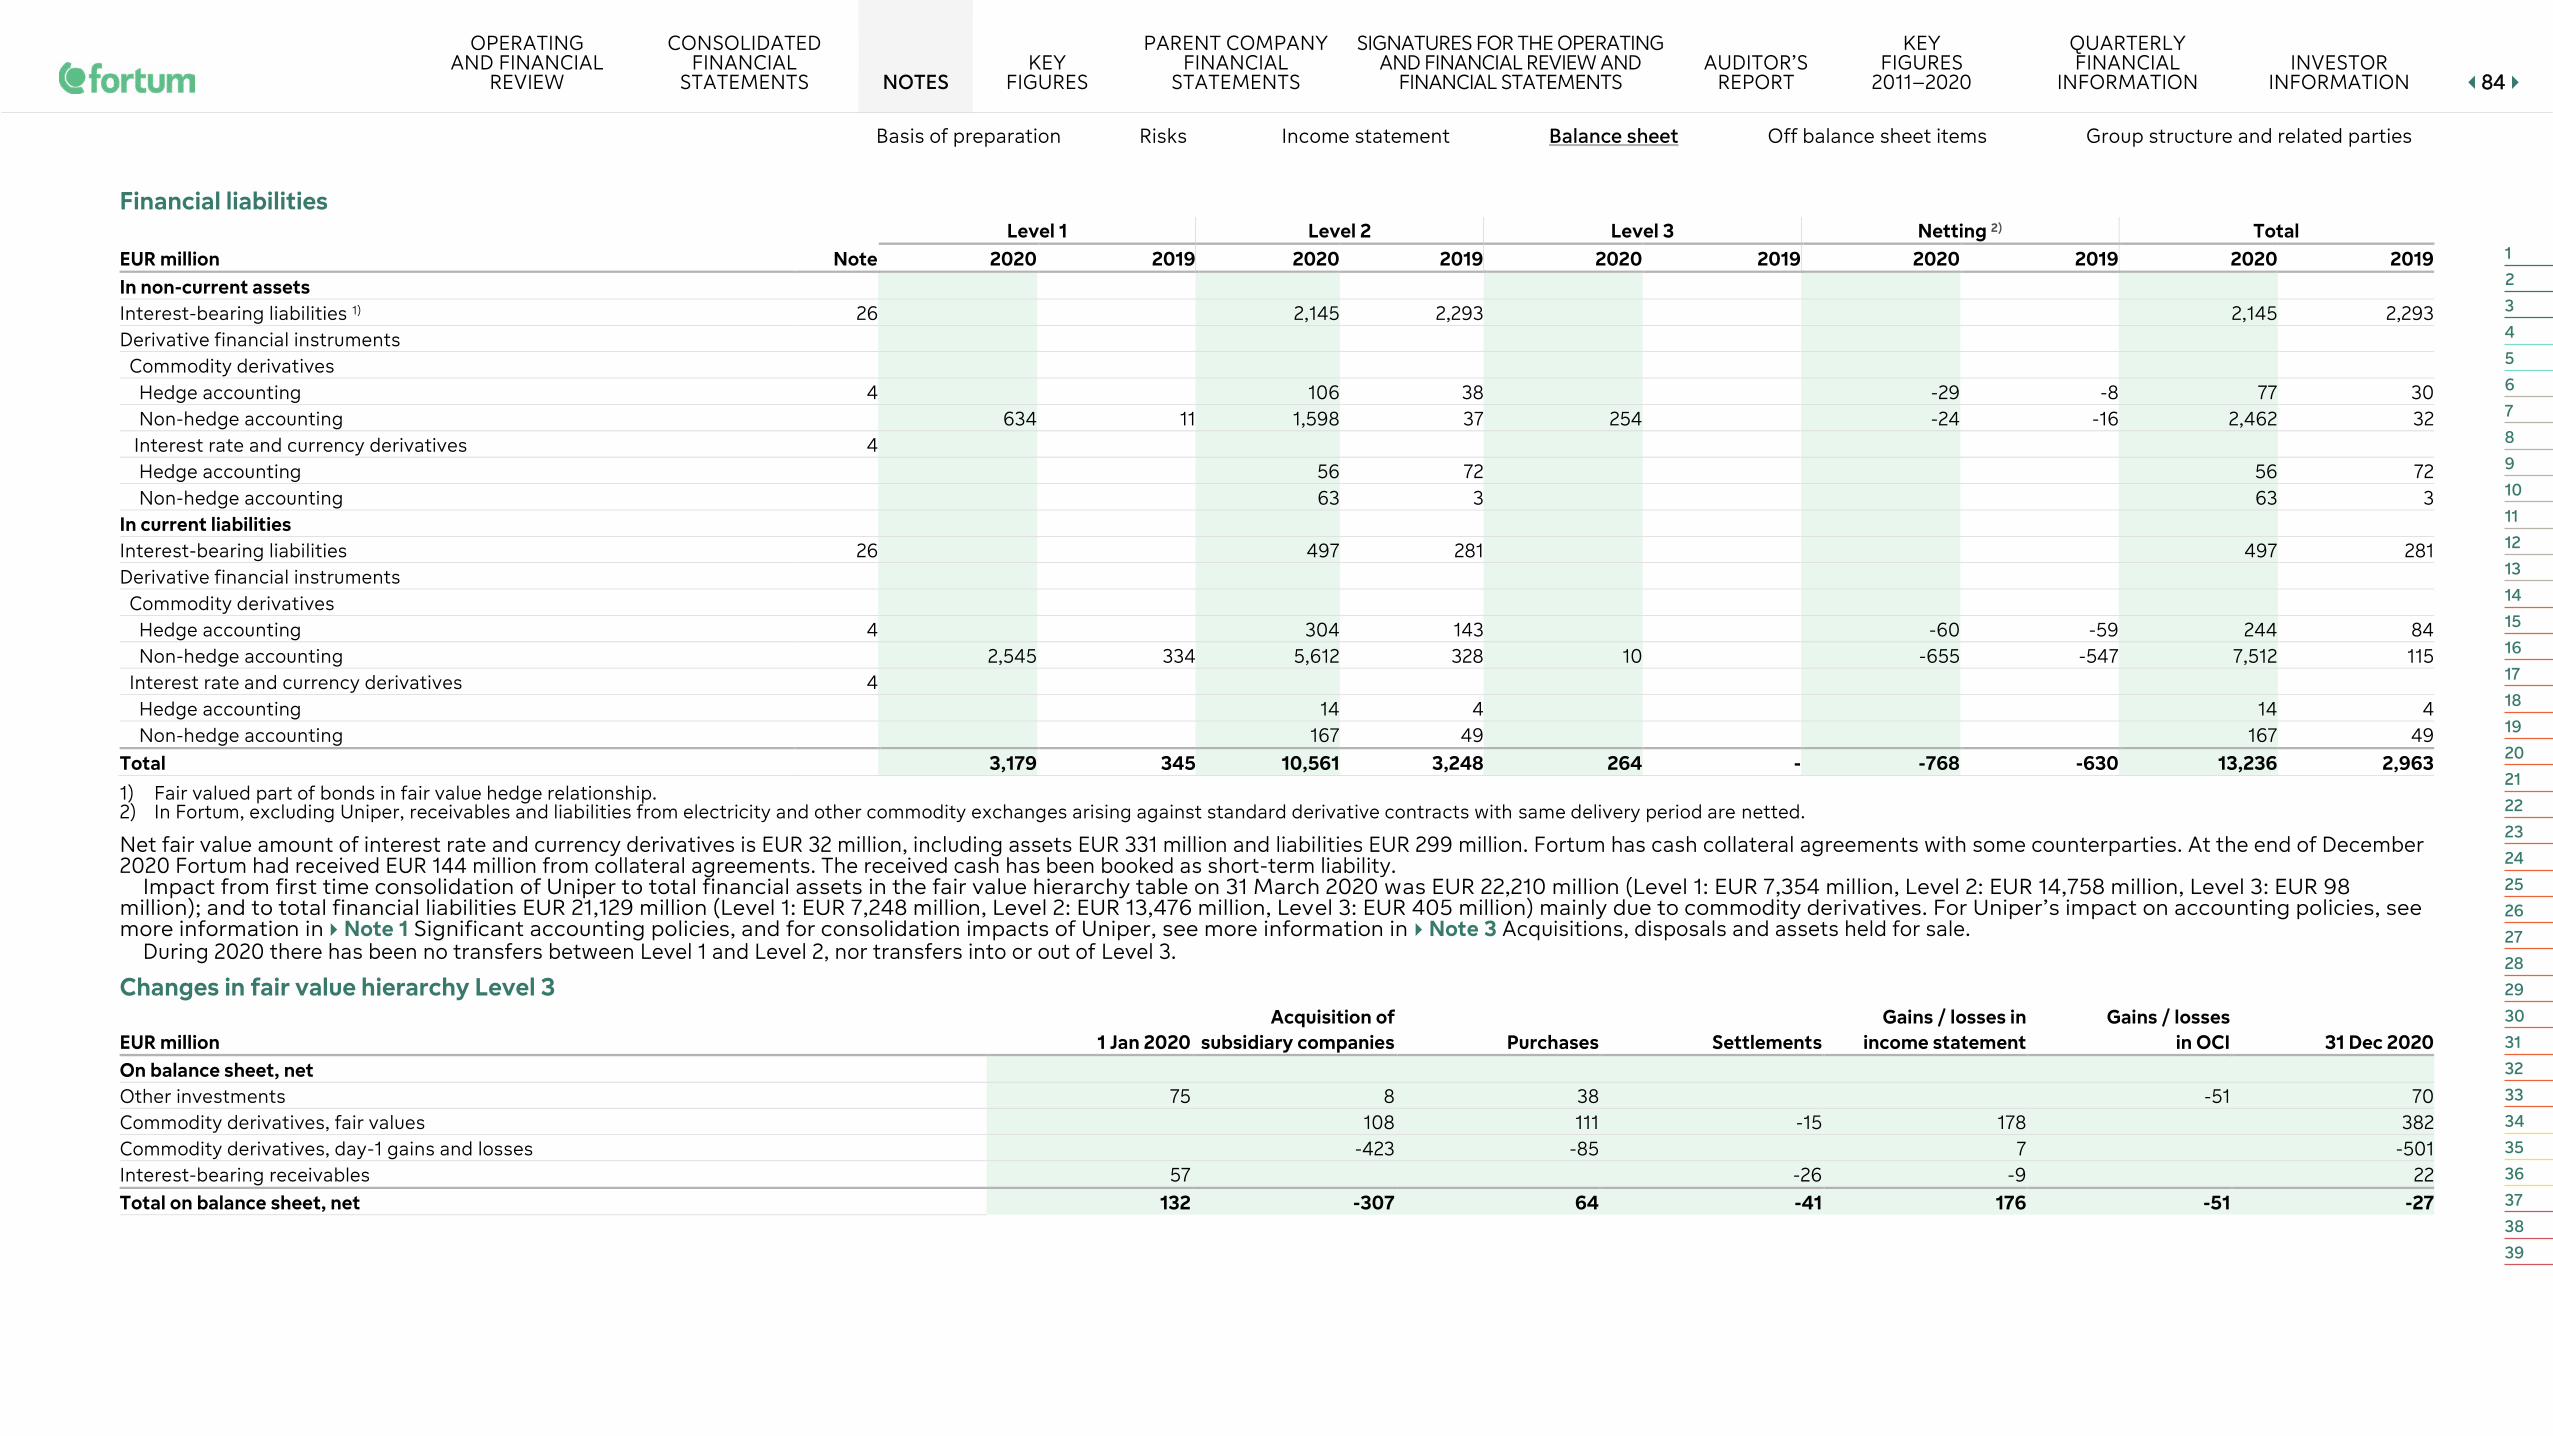
OPERATING AND FINANCIAL
REVIEW
CONSOLIDATED FINANCIAL
STATEMENTS NOTES KEY
FIGURES
PARENT COMPANY FINANCIAL
STATEMENTS
SIGNATURES FOR THE OPERATING AND FINANCIAL REVIEW AND
FINANCIAL STATEMENTS AUDITOR’S
REPORT
KEY FIGURES
2011–2020
QUARTERLY FINANCIAL
INFORMATION INVESTOR
INFORMATION 8844
Basis of preparation Risks Income statement Balance sheet Off balance sheet items Group structure and related parties
Financial liabilities Level 1 Level 2 Level 3 Netting 2) Total EUR million Note 2020 2019 2020 2019 2020 2019 2020 2019 2020 2019 In non-current assets Interest-bearing liabilities 1) 26 2,145 2,293 2,145 2,293 Derivative financial instruments
Commodity derivatives Hedge accounting 4 106 38 -29 -8 77 30 Non-hedge accounting 634 11 1,598 37 254 -24 -16 2,462 32
Interest rate and currency derivatives 4 Hedge accounting 56 72 56 72 Non-hedge accounting 63 3 63 3
In current liabilities Interest-bearing liabilities 26 497 281 497 281 Derivative financial instruments
Commodity derivatives Hedge accounting 4 304 143 -60 -59 244 84 Non-hedge accounting 2,545 334 5,612 328 10 -655 -547 7,512 115
Interest rate and currency derivatives 4 Hedge accounting 14 4 14 4 Non-hedge accounting 167 49 167 49
Total 3,179 345 10,561 3,248 264 - -768 -630 13,236 2,963 1) Fair valued part of bonds in fair value hedge relationship. 2) In Fortum, excluding Uniper, receivables and liabilities from electricity and other commodity exchanges arising against standard derivative contracts with same delivery period are netted.
Net fair value amount of interest rate and currency derivatives is EUR 32 million, including assets EUR 331 million and liabilities EUR 299 million. Fortum has cash collateral agreements with some counterparties. At the end of December 2020 Fortum had received EUR 144 million from collateral agreements. The received cash has been booked as short-term liability.
Impact from first time consolidation of Uniper to total financial assets in the fair value hierarchy table on 31 March 2020 was EUR 22,210 million (Level 1: EUR 7,354 million, Level 2: EUR 14,758 million, Level 3: EUR 98 million); and to total financial liabilities EUR 21,129 million (Level 1: EUR 7,248 million, Level 2: EUR 13,476 million, Level 3: EUR 405 million) mainly due to commodity derivatives. For Uniper’s impact on accounting policies, see more information in Note 1 Significant accounting policies, and for consolidation impacts of Uniper, see more information in Note 3 Acquisitions, disposals and assets held for sale.
During 2020 there has been no transfers between Level 1 and Level 2, nor transfers into or out of Level 3.
Changes in fair value hierarchy Level 3
EUR million 1 Jan 2020 Acquisition of
subsidiary companies Purchases Settlements Gains / losses in
income statement Gains / losses
in OCI 31 Dec 2020 On balance sheet, net Other investments 75 8 38 -51 70 Commodity derivatives, fair values 108 111 -15 178 382 Commodity derivatives, day-1 gains and losses -423 -85 7 -501 Interest-bearing receivables 57 -26 -9 22 Total on balance sheet, net 132 -307 64 -41 176 -51 -27
1
2
3
4
5
6
7
8
9
10
11
12
13
14
15
16
17
18
19
20
21
22
23
24
25
26
27
28
29
30
31
32
33
34
35
36
37
38
39
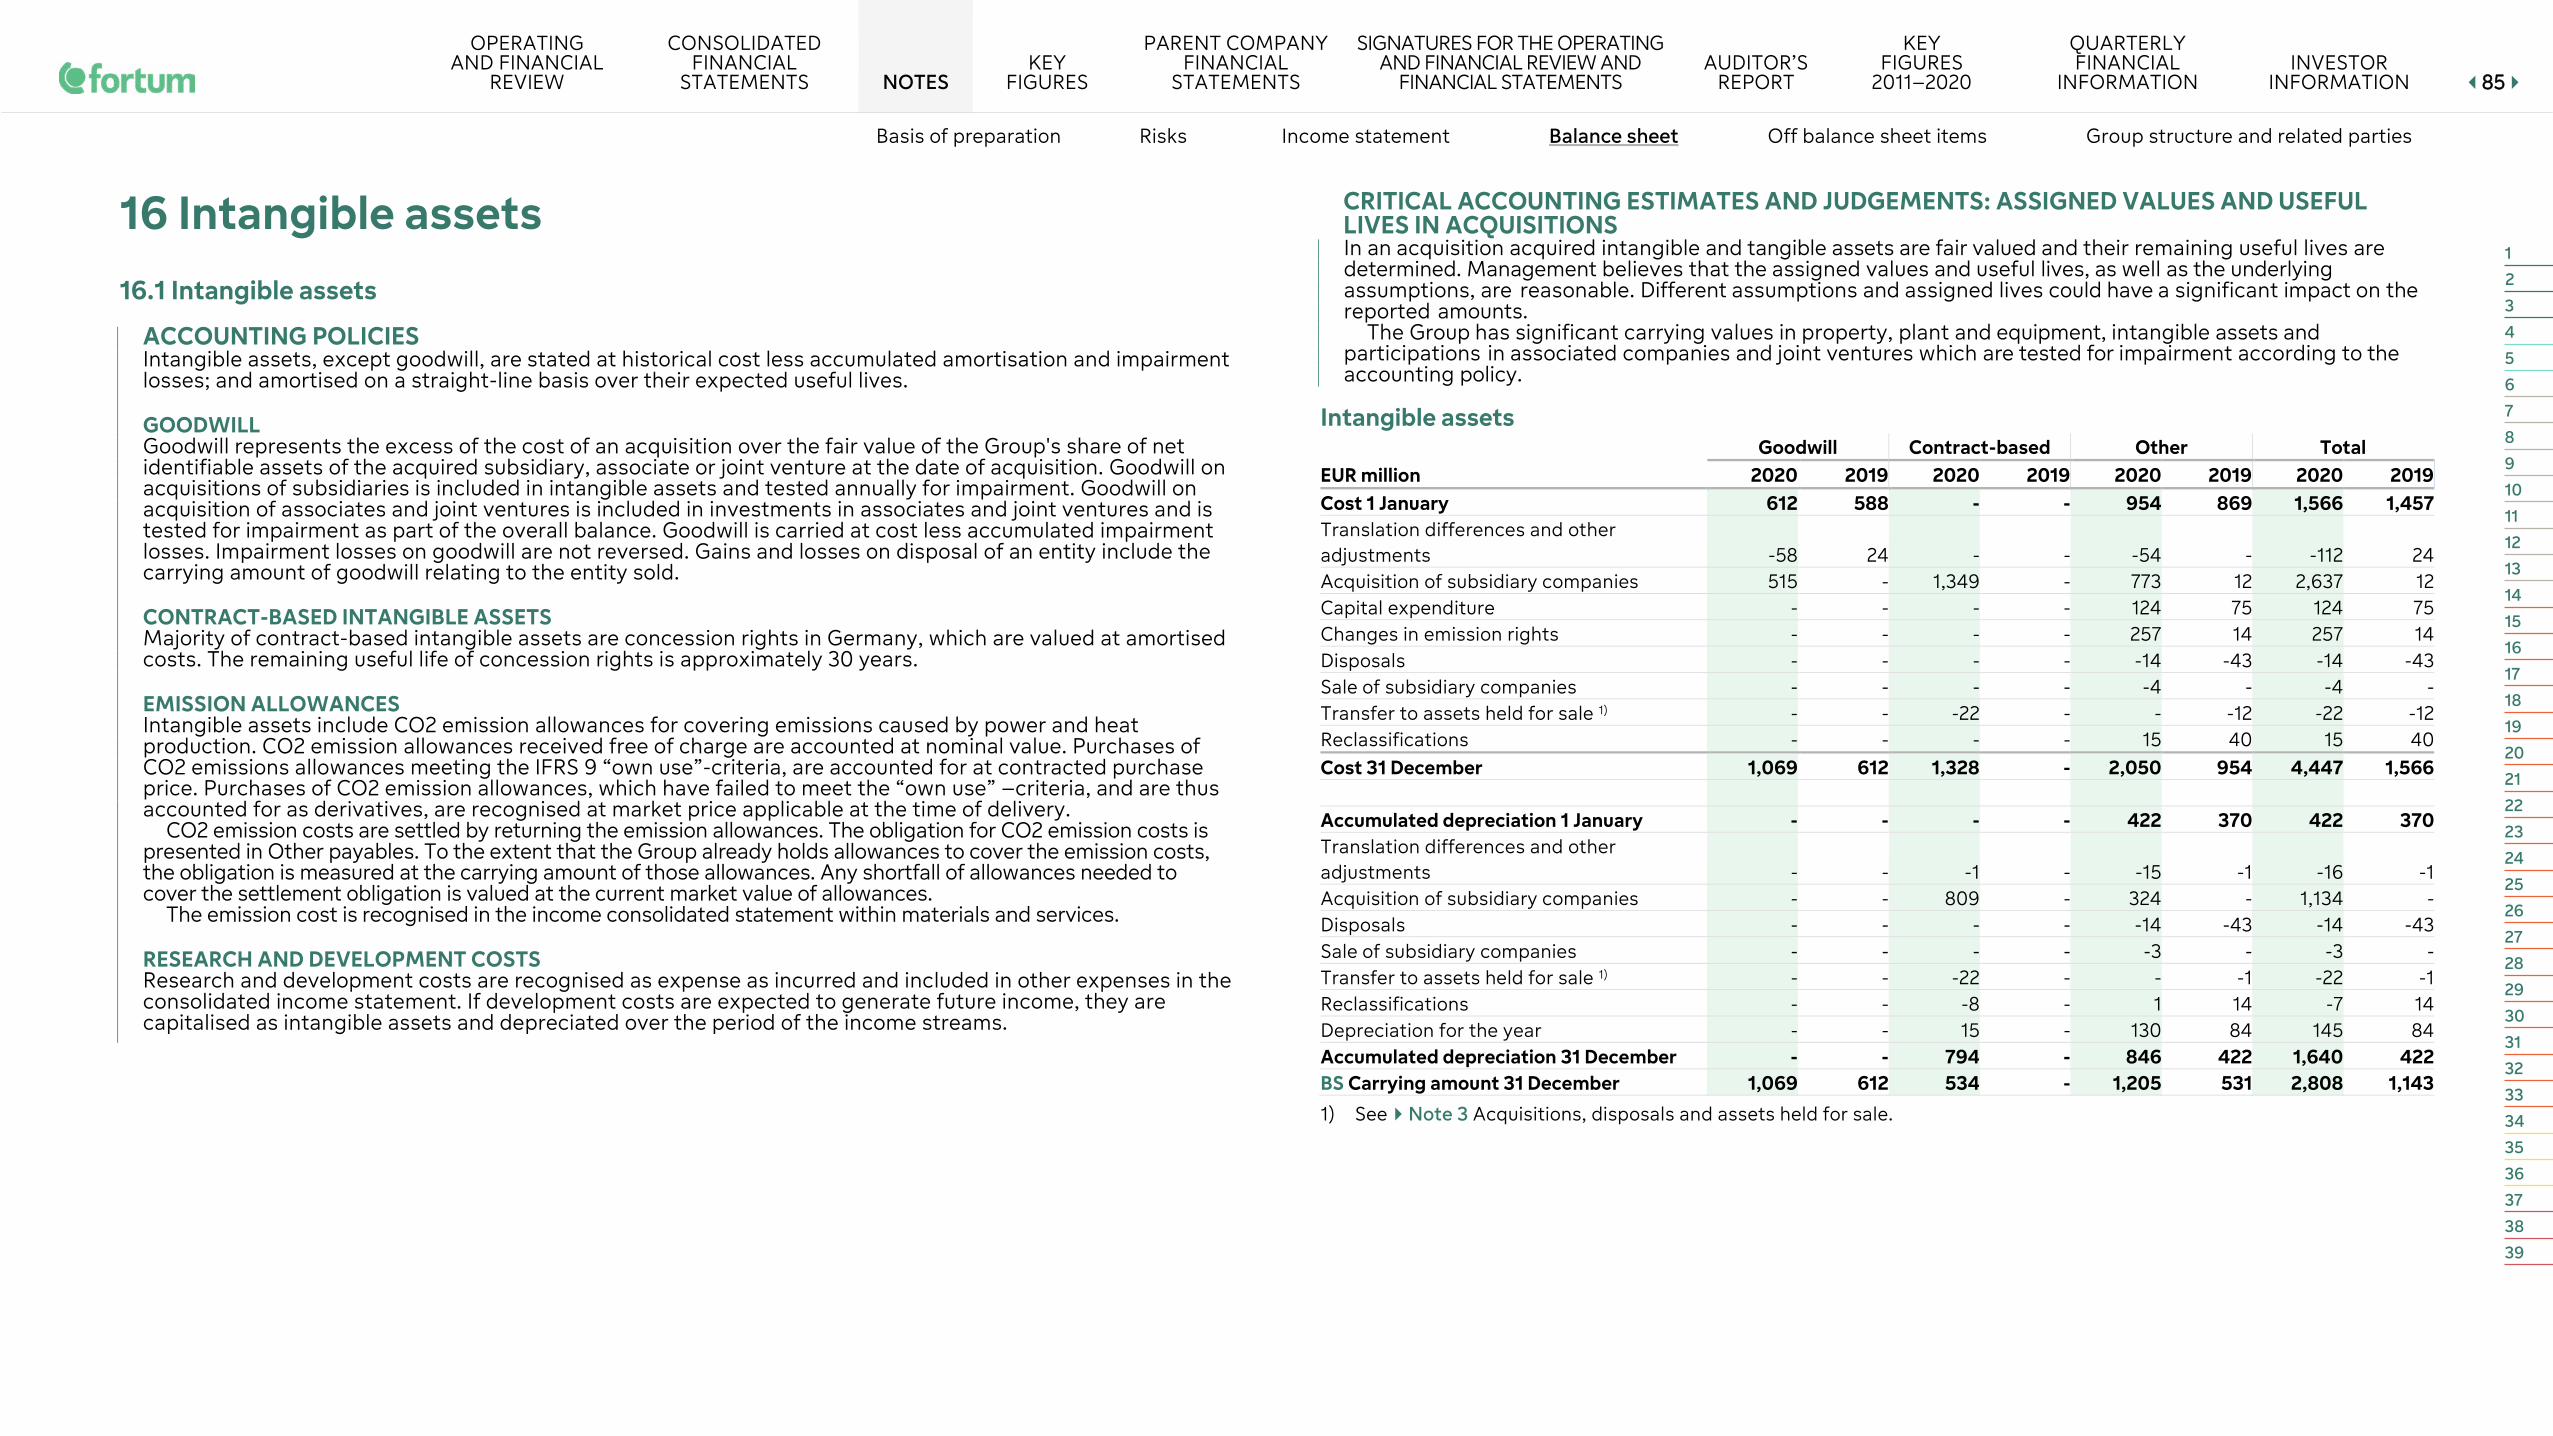
OPERATING AND FINANCIAL
REVIEW
CONSOLIDATED FINANCIAL
STATEMENTS NOTES KEY
FIGURES
PARENT COMPANY FINANCIAL
STATEMENTS
SIGNATURES FOR THE OPERATING AND FINANCIAL REVIEW AND
FINANCIAL STATEMENTS AUDITOR’S
REPORT
KEY FIGURES
2011–2020
QUARTERLY FINANCIAL
INFORMATION INVESTOR
INFORMATION 8855
Basis of preparation Risks Income statement Balance sheet Off balance sheet items Group structure and related parties
16 Intangible assets 16.1 Intangible assets
ACCOUNTING POLICIES Intangible assets, except goodwill, are stated at historical cost less accumulated amortisation and impairment losses; and amortised on a straight-line basis over their expected useful lives.
GOODWILL Goodwill represents the excess of the cost of an acquisition over the fair value of the Group's share of net identifiable assets of the acquired subsidiary, associate or joint venture at the date of acquisition. Goodwill on acquisitions of subsidiaries is included in intangible assets and tested annually for impairment. Goodwill on acquisition of associates and joint ventures is included in investments in associates and joint ventures and is tested for impairment as part of the overall balance. Goodwill is carried at cost less accumulated impairment losses. Impairment losses on goodwill are not reversed. Gains and losses on disposal of an entity include the carrying amount of goodwill relating to the entity sold.
CONTRACT-BASED INTANGIBLE ASSETS Majority of contract-based intangible assets are concession rights in Germany, which are valued at amortised costs. The remaining useful life of concession rights is approximately 30 years.
EMISSION ALLOWANCES Intangible assets include CO2 emission allowances for covering emissions caused by power and heat production. CO2 emission allowances received free of charge are accounted at nominal value. Purchases of CO2 emissions allowances meeting the IFRS 9 “own use”-criteria, are accounted for at contracted purchase price. Purchases of CO2 emission allowances, which have failed to meet the “own use” –criteria, and are thus accounted for as derivatives, are recognised at market price applicable at the time of delivery.
CO2 emission costs are settled by returning the emission allowances. The obligation for CO2 emission costs is presented in Other payables. To the extent that the Group already holds allowances to cover the emission costs, the obligation is measured at the carrying amount of those allowances. Any shortfall of allowances needed to cover the settlement obligation is valued at the current market value of allowances.
The emission cost is recognised in the income consolidated statement within materials and services.
RESEARCH AND DEVELOPMENT COSTS Research and development costs are recognised as expense as incurred and included in other expenses in the consolidated income statement. If development costs are expected to generate future income, they are capitalised as intangible assets and depreciated over the period of the income streams.
CRITICAL ACCOUNTING ESTIMATES AND JUDGEMENTS: ASSIGNED VALUES AND USEFUL LIVES IN ACQUISITIONS In an acquisition acquired intangible and tangible assets are fair valued and their remaining useful lives are determined. Management believes that the assigned values and useful lives, as well as the underlying assumptions, are reasonable. Different assumptions and assigned lives could have a significant impact on the reported amounts.
The Group has significant carrying values in property, plant and equipment, intangible assets and participations in associated companies and joint ventures which are tested for impairment according to the accounting policy.
Intangible assets Goodwill Contract-based Other Total EUR million 2020 2019 2020 2019 2020 2019 2020 2019 Cost 1 January 612 588 - - 954 869 1,566 1,457 Translation differences and other adjustments -58 24 - - -54 - -112 24 Acquisition of subsidiary companies 515 - 1,349 - 773 12 2,637 12 Capital expenditure - - - - 124 75 124 75 Changes in emission rights - - - - 257 14 257 14 Disposals - - - - -14 -43 -14 -43 Sale of subsidiary companies - - - - -4 - -4 - Transfer to assets held for sale 1) - - -22 - - -12 -22 -12 Reclassifications - - - - 15 40 15 40 Cost 31 December 1,069 612 1,328 - 2,050 954 4,447 1,566 Accumulated depreciation 1 January - - - - 422 370 422 370 Translation differences and other adjustments - - -1 - -15 -1 -16 -1 Acquisition of subsidiary companies - - 809 - 324 - 1,134 - Disposals - - - - -14 -43 -14 -43 Sale of subsidiary companies - - - - -3 - -3 - Transfer to assets held for sale 1) - - -22 - - -1 -22 -1 Reclassifications - - -8 - 1 14 -7 14 Depreciation for the year - - 15 - 130 84 145 84 Accumulated depreciation 31 December - - 794 - 846 422 1,640 422 BS Carrying amount 31 December 1,069 612 534 - 1,205 531 2,808 1,143
1) SeeNote 3 Acquisitions, disposals and assets held for sale.
1
2
3
4
5
6
7
8
9
10
11
12
13
14
15
16
17
18
19
20
21
22
23
24
25
26
27
28
29
30
31
32
33
34
35
36
37
38
39

OPERATING AND FINANCIAL
REVIEW
CONSOLIDATED FINANCIAL
STATEMENTS NOTES KEY
FIGURES
PARENT COMPANY FINANCIAL
STATEMENTS
SIGNATURES FOR THE OPERATING AND FINANCIAL REVIEW AND
FINANCIAL STATEMENTS AUDITOR’S
REPORT
KEY FIGURES
2011–2020
QUARTERLY FINANCIAL
INFORMATION INVESTOR
INFORMATION 8866
Basis of preparation Risks Income statement Balance sheet Off balance sheet items Group structure and related parties
Goodwill included EUR 515 million from the acquisition of Uniper at 31 March 2020 and excluded goodwill on Uniper’s balance sheet at 31 March 2020, EUR 1,779 million, that is not considered to be an identifiable asset according to IFRS. Other intangible assets included EUR 980 million from the acquisition of Uniper at 31 March 2020. See Note 3 Acquisitions, disposals and assets held for sale.
Goodwill in groups of cash-generating units Goodwill is allocated to operating segments corresponding to groups of cash-generating units that benefit from the synergies of the acquired goodwill.
EUR million 2020 2019 Uniper 515 - Consumer Solutions 214 228 City Solutions 205 208 Russia 134 176 Total 1,069 612
Other intangible assets Other intangible assets include emission allowances amounting to EUR 540 million (2019: 36), as well as customer contracts, and costs for software products and software licenses.
16.2 Impairment testing Uniper segment was not included in the annual impairment testing as at 31 December 2020 as the purchase price allocation of the Uniper acquisition is still ongoing, which means that the values assigned to identified assets and liabilities, as well as goodwill, at 31 December 2020 are still preliminary (see Note 3 Acquisitions, disposals and assets held for sale). Further, there have been no indication of impairment. Uniper segment is subject to regular impairment indication review, and will be tested for impairment in the 2021 annual impairment testing cycle.
ACCOUNTING POLICIES The carrying values of goodwill, other intangible assets, property, plant and equipment, right-of-use assets, and non-financial investments are reviewed regularly for indication of impairment.
Indications of impairment are business-specific and are thus analysed separately by each segment; and include risks, such as changes in electricity and fuel prices, regulatory/political risks relating to energy taxes, price regulations, and limitations to the life time of assets.
Impairment testing is performed if there is an indication of impairment; and the asset is written down to its recoverable amount if its carrying amount is greater than the estimated recoverable amount.
In addition, goodwill and other intangible assets that have an indefinite useful life, and as such are not subject to amortisation, are tested annually for impairment, even if there is no indication of impairment. Impairment testing is performed and documented annually in connection with the long-term forecasting process.
Annual impairment testing is performed on a cash-generating unit level. Fortum defines cash-generating unit as the smallest group of assets that generate cash flows that are independent of the cash flows generated by other assets.
Goodwill is allocated to groups of cash-generating units that benefit from the synergies of the acquired goodwill.
Fortum uses value in use to establish the recoverable amount of cash-generating units. Value in use is determined by discounting future cash flows expected to be derived from group of assets. The carrying amount of group of cash generating units comprises net operating assets, including goodwill and fair value adjustments arising from acquisitions.
Non-financial assets, other than goodwill, that have been impaired in the past are reviewed for possible reversal of impairment at each reporting date.
CRITICAL ACCOUNTING ESTIMATES AND JUDGEMENTS: ASSUMPTIONS RELATED TO IMPAIRMENT TESTING Impairment testing is forward-looking and requires management to make certain assumptions, as explained below.
The recoverable amounts of cash-generating units are determined by value in use calculations. These calculations are based on estimated discounted future cash flows in local currency from most recent, long-term forecast approved by management and the Board of Directors, covering an explicit forecast period of six years. The explicit forecast period is longer than five years as significant assets used by the business, such as power plants, have useful lives exceeding 20 years. Cash flow projections beyond the explicit forecast period are estimated by extrapolating projections using a steady or declining growth rate.
The period covered by cash flows is related to the useful lives of the assets being reviewed for impairment. The growth rate used to extrapolate the cash flow projections until the end of assets' useful lives is in line with the assumed inflation. Cash flows arising from future investments, such as new plants, are excluded; unless projects have been started, in which case the cash outflow needed to complete the started projects is included. In Russia, the generation capacity built after 2007 under the Russian Government's Capacity Supply Agreements receives guaranteed capacity payments for a period of 10 years after commissioning.
1
2
3
4
5
6
7
8
9
10
11
12
13
14
15
16
17
18
19
20
21
22
23
24
25
26
27
28
29
30
31
32
33
34
35
36
37
38
39

OPERATING AND FINANCIAL
REVIEW
CONSOLIDATED FINANCIAL
STATEMENTS NOTES KEY
FIGURES
PARENT COMPANY FINANCIAL
STATEMENTS
SIGNATURES FOR THE OPERATING AND FINANCIAL REVIEW AND
FINANCIAL STATEMENTS AUDITOR’S
REPORT
KEY FIGURES
2011–2020
QUARTERLY FINANCIAL
INFORMATION INVESTOR
INFORMATION 8877
Basis of preparation Risks Income statement Balance sheet Off balance sheet items Group structure and related parties
The discount rates reflect current assessments of the time value of money and relevant market risk premiums specific to each cash generating unit, reflecting risks and uncertainties for which the future cashflow estimates have not been adjusted.
Preparation of these cash flow estimates requires management to make assumptions relating to future expectations. Assumptions vary depending on the business the tested assets are in.
Key assumptions used in impairment testing are presented below, as well as the basis for determining the value of each assumption. Assumptions are based on internal and external data that are consistent with observable market information, when applicable.
Key assumptions Basis for determining the value for key assumptions Power market development, recycling and waste solutions
market development Historical analysis and prospective forecasting
Regulation framework Current market setup and prospective forecasting (e.g. CSA mechanism in Russia)
Utilisation of power plants and treatment facilities Past experience, technical assessment and forecasted market development
Forecasted maintenance investments Past experience, technical assessment and planned maintenance work
Discount rate Mostly market based information
Annual impairment testing Annual impairment testing was performed as at 31 December 2020. The table below presents long-term pre-tax discount rates used in impairment testing by cash generating units:
Discount rate % 2020 2019 Consumer Solutions 1) 5.1-6.3 5.2-7.0 City Solutions 4.8 7.3 Russia 11.8 11.4
1) Discount rate depends on location and type of business.
The change in discount rates is due to declining interest rates and a more detailed assessment of discount rate components by underlying business.
At 31 December 2020, the recoverable values were greater than their carrying values and therefore no impairments were booked.
The Group has considered the sensitivity of key assumptions as part of the impairment testing. When doing this, any consequential effect of the change on the other variables has also been considered. The calculations are most sensitive to changes in estimated future EBITDA levels, and changes in discount rate.
Management estimates that no reasonably possible change in the discount rate used, or in future earnings would cause the carrying amount to exceed its recoverable amount in any group of cash generating units.
17 Property, plant and equipment and right-of-use assets
ACCOUNTING POLICIES Property, plant and equipment mainly include power and heat production-related buildings, structures and machinery, waterfall rights, and other buildings and machinery.
Property, plant and equipment are stated at historical cost less accumulated depreciation and impairment losses on the consolidated balance sheet. Historical cost includes expenditure that is directly attributable to the acquisition of an item. Borrowing costs are included in the cost of qualified assets. Additionally the cost of an item of property, plant and equipment includes the estimated cost of its dismantlement, removal or restoration when there is a contractual obligation towards a third party, or a legal obligation.
Acquired assets on the acquisition of a new subsidiary are stated at their fair values at the date of acquisition.
See Note 29 Other provisions for information about asset retirement obligations, Note 28 Nuclear related assets and liabilities, for information about provisions for decommissioning nuclear power plants and Note 33 Leases, for information about right-of-use assets.
Land, water areas and waterfall rights are not depreciated since they have indefinite useful lives. Depreciation on other assets is calculated using the straight-line method to allocate their cost to their
residual values over their estimated useful lives, as follows: • Buildings and structures: 10-50 years • Machinery and equipment: 3-65 years Subsequent costs are included in the asset’s carrying amount or recognised as a separate asset, as
appropriate, only when it is probable that future economic benefits associated with the item will flow to the Group and the cost of the item can be measured reliably. All other repairs and maintenance expenses are charged to the income statement during the financial period in which they are incurred.
The assets’ residual values and useful lives are reviewed, and adjusted if appropriate, at each closing date. An asset’s carrying amount is written down to its recoverable amount if the asset’s carrying amount is greater than its estimated recoverable amount. See further information on the impairment testing in Note 16 Intangible assets.
GOVERNMENT GRANTS Government grants are recognised at their fair value when there is a reasonable assurance that the grant will be received and the Group will comply with all attached conditions. Government grants are either deferred and recognised in the income statement to match with the related costs, or deducted from the acquisition cost of the asset.
BORROWING COSTS Borrowing costs directly attributable to the construction of qualifying assets are added to the cost of those assets. Qualifying assets are assets that take a substantial time to get ready for their intended use or sale.
1
2
3
4
5
6
7
8
9
10
11
12
13
14
15
16
17
18
19
20
21
22
23
24
25
26
27
28
29
30
31
32
33
34
35
36
37
38
39

OPERATING AND FINANCIAL
REVIEW
CONSOLIDATED FINANCIAL
STATEMENTS NOTES KEY
FIGURES
PARENT COMPANY FINANCIAL
STATEMENTS
SIGNATURES FOR THE OPERATING AND FINANCIAL REVIEW AND
FINANCIAL STATEMENTS AUDITOR’S
REPORT
KEY FIGURES
2011–2020
QUARTERLY FINANCIAL
INFORMATION INVESTOR
INFORMATION 8888
Basis of preparation Risks Income statement Balance sheet Off balance sheet items Group structure and related parties
Land and waterfall rights Buildings and structures Machinery, equipment and other Advances paid and
construction in progress Total EUR million 2020 2019 2020 2019 2020 2019 2020 2019 2020 2019 Cost 1 January 2,578 2,617 4,103 3,908 8,667 8,162 419 631 15,768 15,319 Translation differences and other adjustments 219 -55 -259 114 -213 252 -41 6 -294 317 Acquisition of subsidiary companies 1,636 - 6,414 1 22,825 8 3,088 4 33,963 12 Capital expenditure 1) 6 12 35 8 335 184 668 435 1,045 638 Additions to right-of-use assets - 8 97 27 57 4 - - 154 38 Decreases in right-of-use assets - -4 -60 -2 -29 -1 - - -90 -7 Nuclear asset retirement cost - - - - 172 -14 - - 172 -14 Disposals -1 -1 -51 -29 -191 -89 -23 - -267 -118 Sale of subsidiary companies -1 -4 -89 -22 -117 -2 -2 - -209 -27 Transfer to assets held for sale 2) -3 -6 -126 -71 -1,375 -264 - -30 -1,504 -371 Reclassifications 4 11 336 170 2,154 428 -2,507 -627 -14 -18 Cost 31 December 4,436 2,578 10,400 4,103 32,285 8,667 1,602 419 48,723 15,768 Accumulated depreciation 1 January 1 - 1,765 1,678 3,877 3,562 - - 5,644 5,241 Translation differences and other adjustments 7 - -68 28 110 82 12 - 61 111 Acquisition of subsidiary companies 265 - 4,124 - 18,679 - 1,263 - 24,331 - Disposals -1 - -48 -27 -179 -57 -8 - -236 -84 Sale of subsidiary companies - - -39 -18 -53 -1 - - -92 -19 Decreases in right-of-use assets - - -3 - -29 - - - -32 - Transfer to assets held for sale 2) - - -118 -27 -1,156 -66 - - -1,274 -93 Depreciation for the year 7 2 164 130 774 359 1 - 946 491 Reclassifications - - 160 - 959 -3 -1,111 - 8 -3 Accumulated depreciation 31 December 280 1 5,936 1,765 22,983 3,877 157 - 29,357 5,644 BS Carrying amount 31 December 4,156 2,577 4,464 2,339 9,302 4,790 1,445 419 19,367 10,123 1) Includes EUR 39 million of other asset retirement costs. 2) See Note 3 Acquisitions, disposals and assets held for sale.
1
2
3
4
5
6
7
8
9
10
11
12
13
14
15
16
17
18
19
20
21
22
23
24
25
26
27
28
29
30
31
32
33
34
35
36
37
38
39

OPERATING AND FINANCIAL
REVIEW
CONSOLIDATED FINANCIAL
STATEMENTS NOTES KEY
FIGURES
PARENT COMPANY FINANCIAL
STATEMENTS
SIGNATURES FOR THE OPERATING AND FINANCIAL REVIEW AND
FINANCIAL STATEMENTS AUDITOR’S
REPORT
KEY FIGURES
2011–2020
QUARTERLY FINANCIAL
INFORMATION INVESTOR
INFORMATION 8899
Basis of preparation Risks Income statement Balance sheet Off balance sheet items Group structure and related parties
Property, plant and equipment, and right-of-use assets included EUR 9,268 million from the acquisition of Uniper at 31 March 2020, mainly relating to machinery and equipment; and buildings and structures. The balance from Uniper included EUR 645 million of right-of-use assets. See Note 3 Acquisitions, disposals and assets held for sale.
Property, plant and equipment that are subject to restrictions in the form of real estate mortgages amount to EUR 380 million (2019: 139). See Note 35 Pledged assets and contingent liabilities.
Borrowing costs of EUR 27 million were capitalised in 2020 (2019: 9). The interest rate used for capitalising borrowing costs varied from 2% to 5% (2019: 2%-7%). For constructions financed by the Group, a uniform rate may be used based on interest rates of financial liabilities, including leases.
Property, plant and equipment includes right-of-use assets from leases in which Fortum acts as the lessee. See Note 33 Leases.
18 Participations in associated companies and joint ventures
ACCOUNTING POLICIES The Group’s interests in associated companies and jointly controlled entities are accounted for using the equity method of accounting. Assets acquired and liabilities assumed in the investment in associates or joint ventures are measured initially at their fair values at the acquisition date. The excess of the cost of acquisition over the fair value of the Group’s share of the identifiable net assets acquired is recorded as goodwill.
The Group’s share of its associates or joint ventures post-acquisition profits or losses after tax, and the expenses related to the adjustments to the fair values of the assets and liabilities assumed are recognised in the income statement. The cumulative post-acquisition movements are adjusted against the carrying amount of the investment. The Group’s share of post-acquisition adjustments to associates or joint ventures equity that has not been recognised in the associate’s or joint venture’s income statement, is recognised directly in Group’s shareholder’s equity, and against the carrying amount of the investment.
When the Group’s share of losses in an associate or a joint venture equals or exceeds its interest in the associate or joint venture, including any other unsecured receivables, the Group does not recognise further losses, unless it has incurred obligations or made payments on behalf of the associate or joint venture.
Material unrealised gains on transactions between the Group and its associates or joint ventures are eliminated to the extent of the Group’s interest in the associate or joint venture. Material unrealised losses are also eliminated, unless the transaction provides evidence of an impairment of the asset transferred. Accounting policies of associates or joint ventures have been changed where necessary to ensure consistency with the policies adopted by the Group.
If more recent information is not available, the share of the profit of certain associated or joint venture companies is included in the consolidated accounts based on the latest available information.
CRITICAL ACCOUNTING ESTIMATES AND JUDGEMENTS Management is required to make significant judgements when assessing the nature of Fortum’s interest in its investees and when considering the classification of Fortum’s joint arrangements. In the classification, emphasis has been put on decision making, legal structure and financing of the arrangements.
Management judgement is required when testing the carrying amounts for participations in associated companies and joint ventures for impairment. See Note 16 Intangible assets for more information.
1
2
3
4
5
6
7
8
9
10
11
12
13
14
15
16
17
18
19
20
21
22
23
24
25
26
27
28
29
30
31
32
33
34
35
36
37
38
39
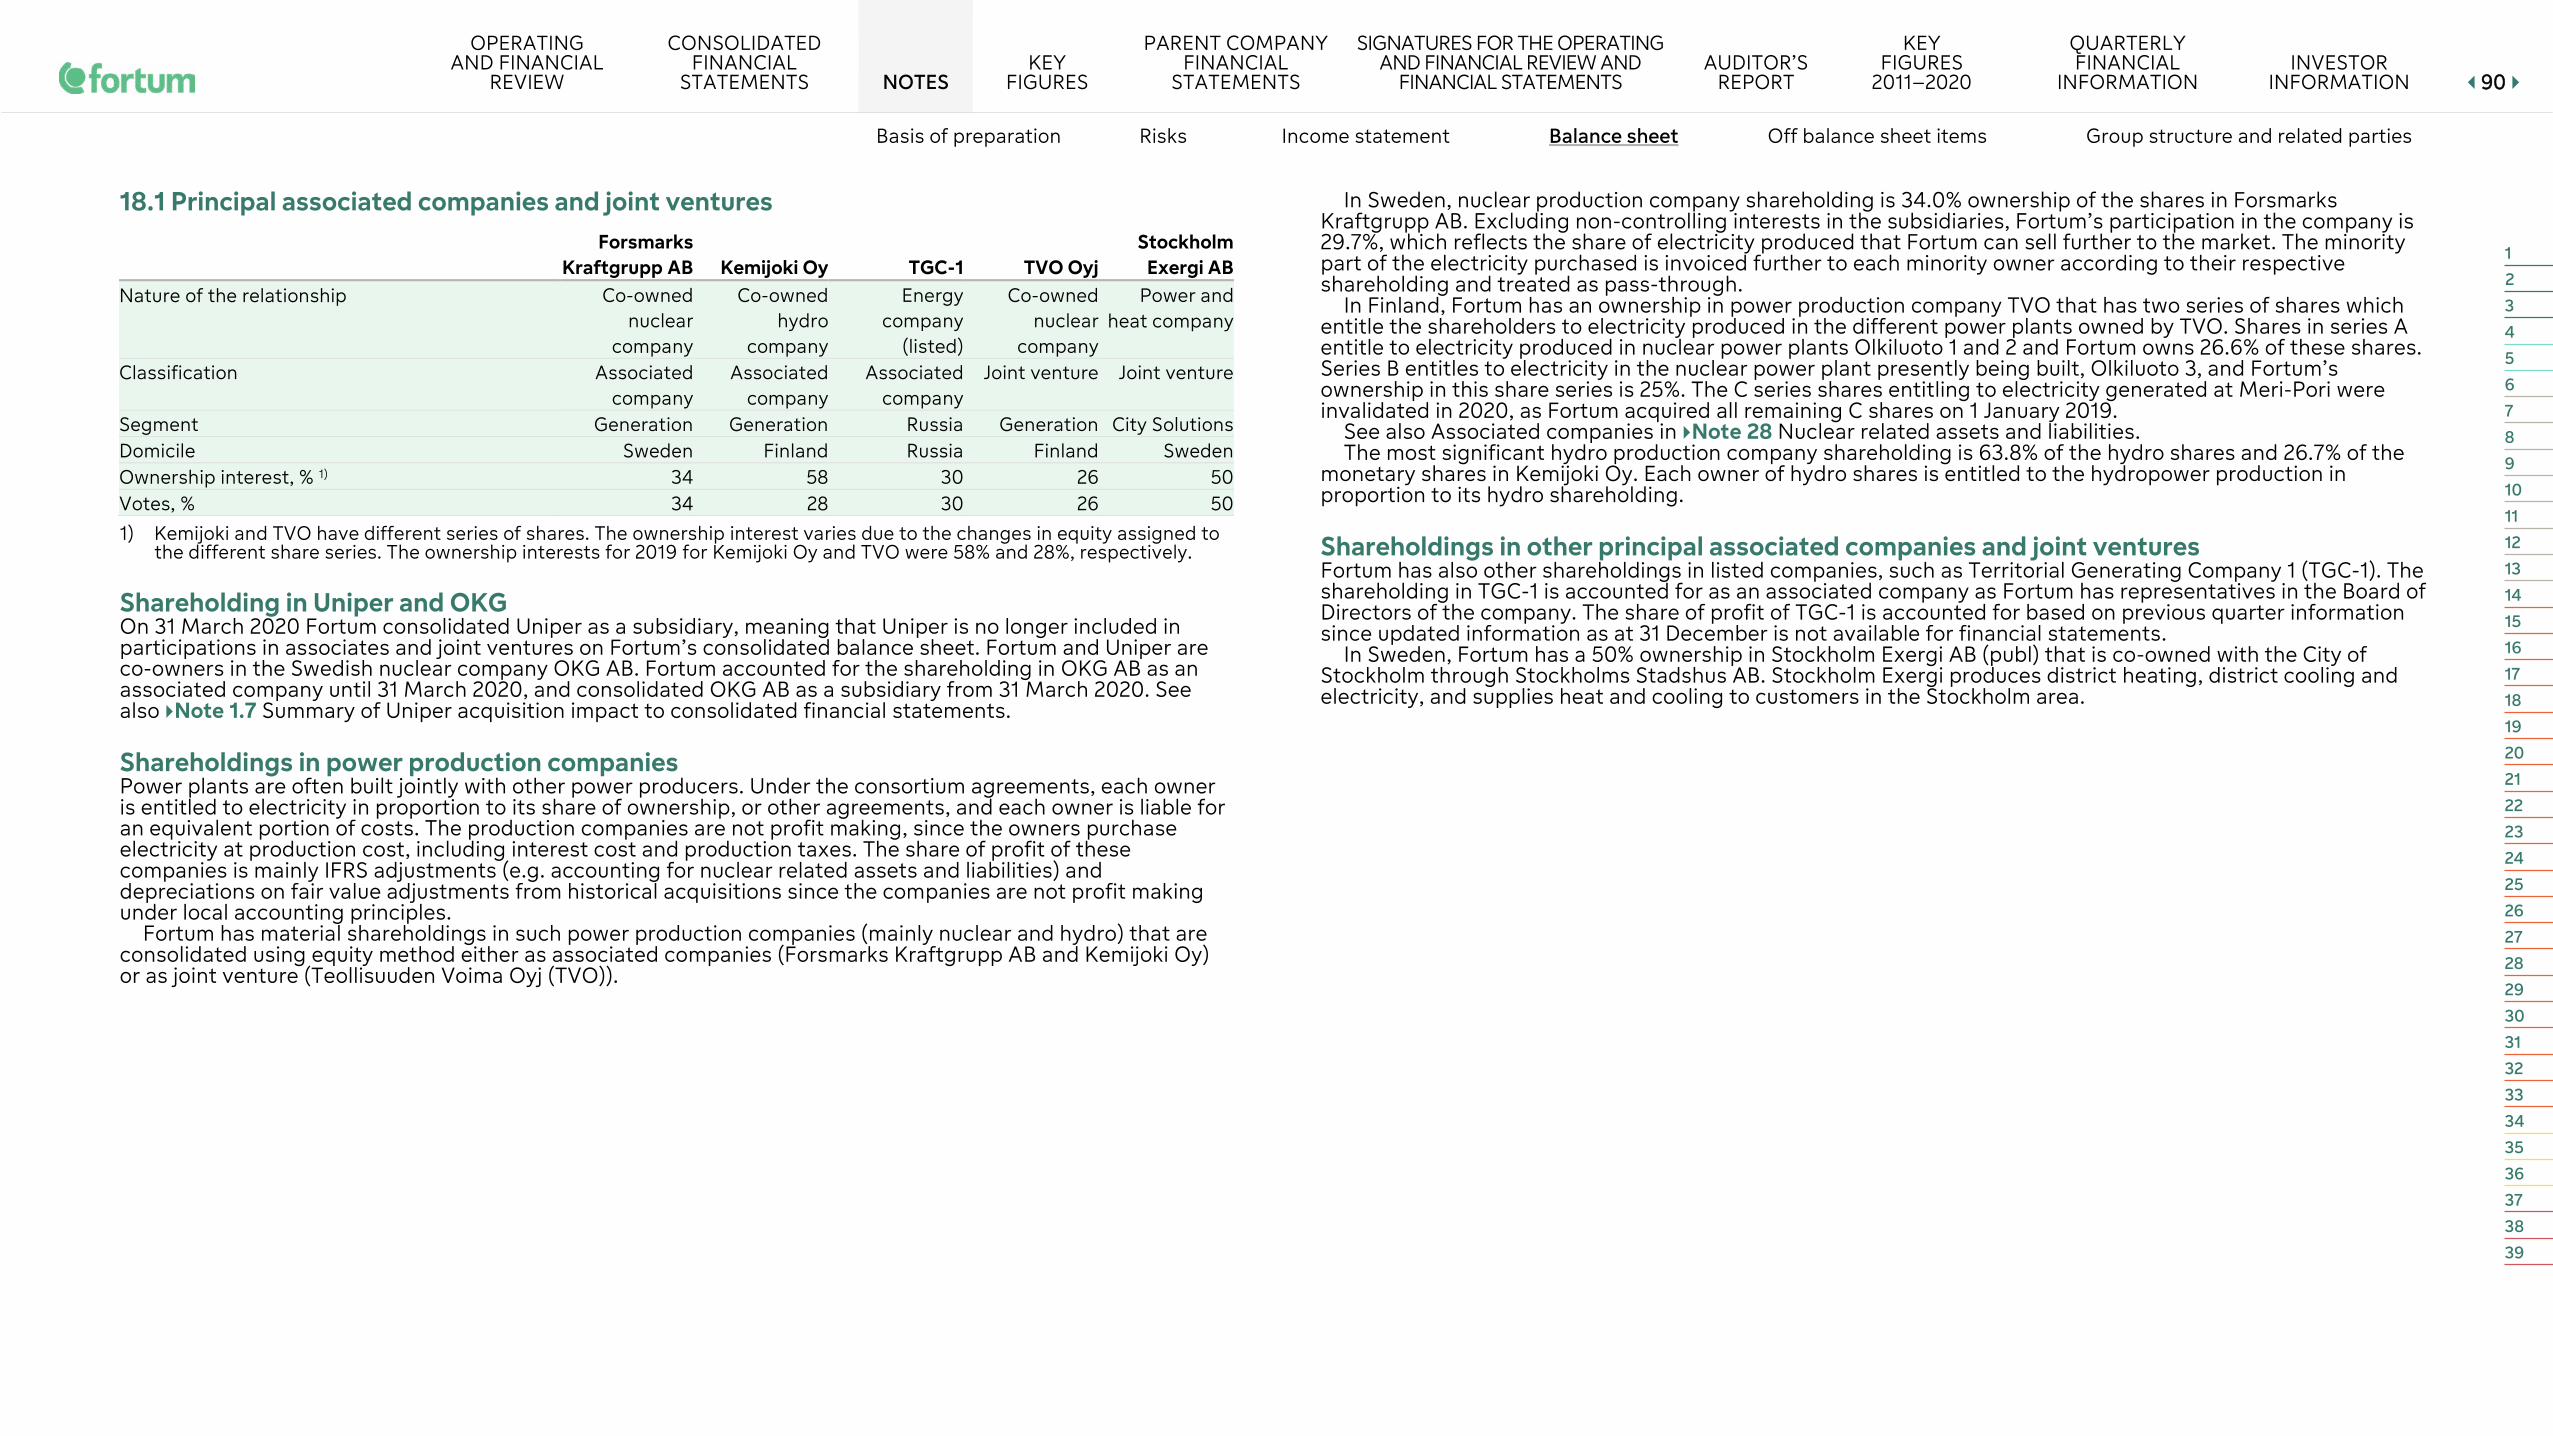
OPERATING AND FINANCIAL
REVIEW
CONSOLIDATED FINANCIAL
STATEMENTS NOTES KEY
FIGURES
PARENT COMPANY FINANCIAL
STATEMENTS
SIGNATURES FOR THE OPERATING AND FINANCIAL REVIEW AND
FINANCIAL STATEMENTS AUDITOR’S
REPORT
KEY FIGURES
2011–2020
QUARTERLY FINANCIAL
INFORMATION INVESTOR
INFORMATION 9900
Basis of preparation Risks Income statement Balance sheet Off balance sheet items Group structure and related parties
18.1 Principal associated companies and joint ventures
Forsmarks
Kraftgrupp AB Kemijoki Oy TGC-1 TVO Oyj Stockholm
Exergi AB Nature of the relationship Co-owned
nuclear company
Co-owned hydro
company
Energy company
(listed)
Co-owned nuclear
company
Power and heat company
Classification Associated company
Associated company
Associated company
Joint venture Joint venture
Segment Generation Generation Russia Generation City Solutions Domicile Sweden Finland Russia Finland Sweden Ownership interest, % 1) 34 58 30 26 50 Votes, % 34 28 30 26 50
1) Kemijoki and TVO have different series of shares. The ownership interest varies due to the changes in equity assigned to the different share series. The ownership interests for 2019 for Kemijoki Oy and TVO were 58% and 28%, respectively.
Shareholding in Uniper and OKG On 31 March 2020 Fortum consolidated Uniper as a subsidiary, meaning that Uniper is no longer included in participations in associates and joint ventures on Fortum’s consolidated balance sheet. Fortum and Uniper are co-owners in the Swedish nuclear company OKG AB. Fortum accounted for the shareholding in OKG AB as an associated company until 31 March 2020, and consolidated OKG AB as a subsidiary from 31 March 2020. See also Note 1.7 Summary of Uniper acquisition impact to consolidated financial statements.
Shareholdings in power production companies Power plants are often built jointly with other power producers. Under the consortium agreements, each owner is entitled to electricity in proportion to its share of ownership, or other agreements, and each owner is liable for an equivalent portion of costs. The production companies are not profit making, since the owners purchase electricity at production cost, including interest cost and production taxes. The share of profit of these companies is mainly IFRS adjustments (e.g. accounting for nuclear related assets and liabilities) and depreciations on fair value adjustments from historical acquisitions since the companies are not profit making under local accounting principles.
Fortum has material shareholdings in such power production companies (mainly nuclear and hydro) that are consolidated using equity method either as associated companies (Forsmarks Kraftgrupp AB and Kemijoki Oy) or as joint venture (Teollisuuden Voima Oyj (TVO)).
In Sweden, nuclear production company shareholding is 34.0% ownership of the shares in Forsmarks Kraftgrupp AB. Excluding non-controlling interests in the subsidiaries, Fortum’s participation in the company is 29.7%, which reflects the share of electricity produced that Fortum can sell further to the market. The minority part of the electricity purchased is invoiced further to each minority owner according to their respective shareholding and treated as pass-through.
In Finland, Fortum has an ownership in power production company TVO that has two series of shares which entitle the shareholders to electricity produced in the different power plants owned by TVO. Shares in series A entitle to electricity produced in nuclear power plants Olkiluoto 1 and 2 and Fortum owns 26.6% of these shares. Series B entitles to electricity in the nuclear power plant presently being built, Olkiluoto 3, and Fortum’s ownership in this share series is 25%. The C series shares entitling to electricity generated at Meri-Pori were invalidated in 2020, as Fortum acquired all remaining C shares on 1 January 2019.
See also Associated companies in Note 28 Nuclear related assets and liabilities. The most significant hydro production company shareholding is 63.8% of the hydro shares and 26.7% of the
monetary shares in Kemijoki Oy. Each owner of hydro shares is entitled to the hydropower production in proportion to its hydro shareholding.
Shareholdings in other principal associated companies and joint ventures Fortum has also other shareholdings in listed companies, such as Territorial Generating Company 1 (TGC-1). The shareholding in TGC-1 is accounted for as an associated company as Fortum has representatives in the Board of Directors of the company. The share of profit of TGC-1 is accounted for based on previous quarter information since updated information as at 31 December is not available for financial statements.
In Sweden, Fortum has a 50% ownership in Stockholm Exergi AB (publ) that is co-owned with the City of Stockholm through Stockholms Stadshus AB. Stockholm Exergi produces district heating, district cooling and electricity, and supplies heat and cooling to customers in the Stockholm area.
1
2
3
4
5
6
7
8
9
10
11
12
13
14
15
16
17
18
19
20
21
22
23
24
25
26
27
28
29
30
31
32
33
34
35
36
37
38
39

OPERATING AND FINANCIAL
REVIEW
CONSOLIDATED FINANCIAL
STATEMENTS NOTES KEY
FIGURES
PARENT COMPANY FINANCIAL
STATEMENTS
SIGNATURES FOR THE OPERATING AND FINANCIAL REVIEW AND
FINANCIAL STATEMENTS AUDITOR’S
REPORT
KEY FIGURES
2011–2020
QUARTERLY FINANCIAL
INFORMATION INVESTOR
INFORMATION 9911
Basis of preparation Risks Income statement Balance sheet Off balance sheet items Group structure and related parties
Summarised financial information of the principal associated companies in 2020
EUR million Forsmarks
Kraftgrupp AB Kemijoki Oy TGC-1 group Balance sheet 31 Dec 2019 31 Dec 2019 30 Sept 2020 Non-current assets 2,641 480 1,699 Current assets 423 6 211 Non-current liabilities 2,889 316 238 Current liabilities 141 118 1,725 Equity 34 52 1,498
Attributable to the owners of the parent 34 52 1,379 Attributable to NCI - - 120
Statement of comprehensive income
1 Jan 2019 - 31 Dec 2019
1 Jan 2019 - 31 Dec 2019
1 Oct 2019 - 30 Sept 2020
Sales 543 53 1,077 Profit or loss - 1 42
Attributable to the owners of the parent - 1 50 Attributable to NCI - - -8
Total comprehensive income - 1 40 Attributable to the owners of the parent - 1 48 Attributable to NCI - - -8
Reconciliation to carrying amount in Fortum Group Group's interest in the equity of the associate 1 January 8 30 523 Change in share of profit and OCI items - - 25 Dividends received - - -14 Translation differences and other adjustments 3 - -124 Group's interest in the equity of the associate 31 December 12 30 409 Fair values on acquisitions and different accounting principles 1) 444 151 -5 Carrying amount 31 December 456 181 404 Market value of listed shares 2) 141 1) Impact of different accounting principles include mainly IFRS adjustments for Nuclear liabilities and assets, capitalised
borrowing costs and fair value adjustment for the acquired assets and liabilities. Fortum records its share of nuclear related assets and liabilities in its nuclear associated companies according to equity method. The basis for recognition is similar as for Loviisa power plant, see accounting principles in Note 28 Nuclear related assets and liabilities.
2) The market quotation is impacted by the limited free float of TGC-1 share.
Summarised financial information of the principal associated companies in 2019
EUR million OKG AB Forsmarks
Kraftgrupp AB Kemijoki Oy Uniper SE
group TGC- 1 group Balance sheet 31 Dec 2018 31 Dec 2018 31 Dec 2018 30 Sept 2019 30 Sept 2019 Non-current assets 683 2,473 474 23,917 2,162 Current assets 230 388 4 16,728 312 Non-current liabilities 827 2,704 295 12,507 395 Current liabilities 73 124 131 16,012 152 Equity 13 33 52 12,125 1,926
Attributable to the owners of the parent 13 33 52 11,547 1,775 Attributable to NCI - - - 578 152
Statement of comprehensive income
1 Jan 2018 - 31 Dec 2018
1 Jan 2018 - 31 Dec 2018
1 Jan 2018 - 31 Dec 2018
1 Oct 2018 - 30 Sept 2019
1 Oct 2018 - 30 Sept 2019
Sales 289 536 48 77,895 1,357 Profit or loss 1 -1 -5 1,085 176
Attributable to the owners of the parent 1 -1 -5 1,107 173 Attributable to NCI - - - -22 3
Total comprehensive income 1 -1 -5 856 178 Attributable to the owners of the parent 1 -1 -5 850 175 Attributable to NCI - - - 6 3
Reconciliation to carrying amount in Fortum Group Group's interest in the equity of the associate 1 January 6 9 33 5,512 421 Change in share of profit and OCI items - - -3 473 54 Dividends received - - - -165 -10 Translation differences and other adjustments - - - - 56 Group's interest in the equity of the associate 31 December 6 8 30 5,820 523 Fair values on acquisitions and different accounting principles -6 77 153 -1,514 -18 Carrying amount 31 December - 86 182 4,306 505 Market value of listed shares 5,399 209
1
2
3
4
5
6
7
8
9
10
11
12
13
14
15
16
17
18
19
20
21
22
23
24
25
26
27
28
29
30
31
32
33
34
35
36
37
38
39

OPERATING AND FINANCIAL
REVIEW
CONSOLIDATED FINANCIAL
STATEMENTS NOTES KEY
FIGURES
PARENT COMPANY FINANCIAL
STATEMENTS
SIGNATURES FOR THE OPERATING AND FINANCIAL REVIEW AND
FINANCIAL STATEMENTS AUDITOR’S
REPORT
KEY FIGURES
2011–2020
QUARTERLY FINANCIAL
INFORMATION INVESTOR
INFORMATION 9922
Basis of preparation Risks Income statement Balance sheet Off balance sheet items Group structure and related parties
Summarised financial information of the principal joint ventures 2020 2019 EUR million TVO Oyj group Stockholm Exergi AB group TVO Oyj group Stockholm Exergi AB group Balance sheet 31 Dec 2020 31 Dec 2020 30 Sept 2019 31 Dec 2019 Non-current assets 7,691 2,663 7,200 2,541 Current assets 490 274 669 305
of which cash and cash equivalents 161 1 203 - Non-current liabilities 5,599 1,461 5,466 1,356
of which non-current interest-bearing liabilities 4,569 1,023 4,472 983 Current liabilities 539 316 636 365
of which current financial liabilities 429 173 514 223 Equity 2,043 1,161 1,767 1,126
Attributable to the shareholders of the company 2,043 1,160 1,767 1,125 Attributable to NCI - 1 - 1
Statement of comprehensive income
1 Jan 2020 - 31 Dec 2020
1 Jan 2020 - 31 Dec 2020
1 Oct 2018 - 30 Sept 2019
1 Jan 2019- 31 Dec 2019
Sales 275 589 287 658 Depreciation and amortisation -45 -144 -46 -199 Interest income 12 - 13 - Interest expense -40 -18 -36 -18 Income tax expense or income - -22 - -11 Profit or loss - 84 29 41 Other comprehensive income -22 -14 -18 -17 Total comprehensive income -22 70 10 24
Attributable to the shareholders of the company -22 70 10 24 Reconciliation to carrying amount in Fortum Group Group's interest in the equity of the joint venture at 1 January 462 563 448 602 Change in share of profit and OCI items - 35 1 12 Dividends received - -41 - -40 Investments 63 - - - Translation differences and other adjustments -6 24 2 -11 Group's interest in the equity of the joint venture 31 December 518 580 451 563 Fair values on acquisitions and different accounting principles 1) 3 -61 -9 -63 Carrying amount 31 December 521 519 442 500 1) Impact of different accounting principles include mainly IFRS adjustments for Nuclear liabilities and assets and capitalised borrowing costs. Fortum records its share of nuclear related assets and liabilities in its nuclear associated companies according to
equity method. The basis for recognition is similar as for Loviisa power plant, see accounting principles in Note 28 Nuclear related assets and liabilities.
1
2
3
4
5
6
7
8
9
10
11
12
13
14
15
16
17
18
19
20
21
22
23
24
25
26
27
28
29
30
31
32
33
34
35
36
37
38
39
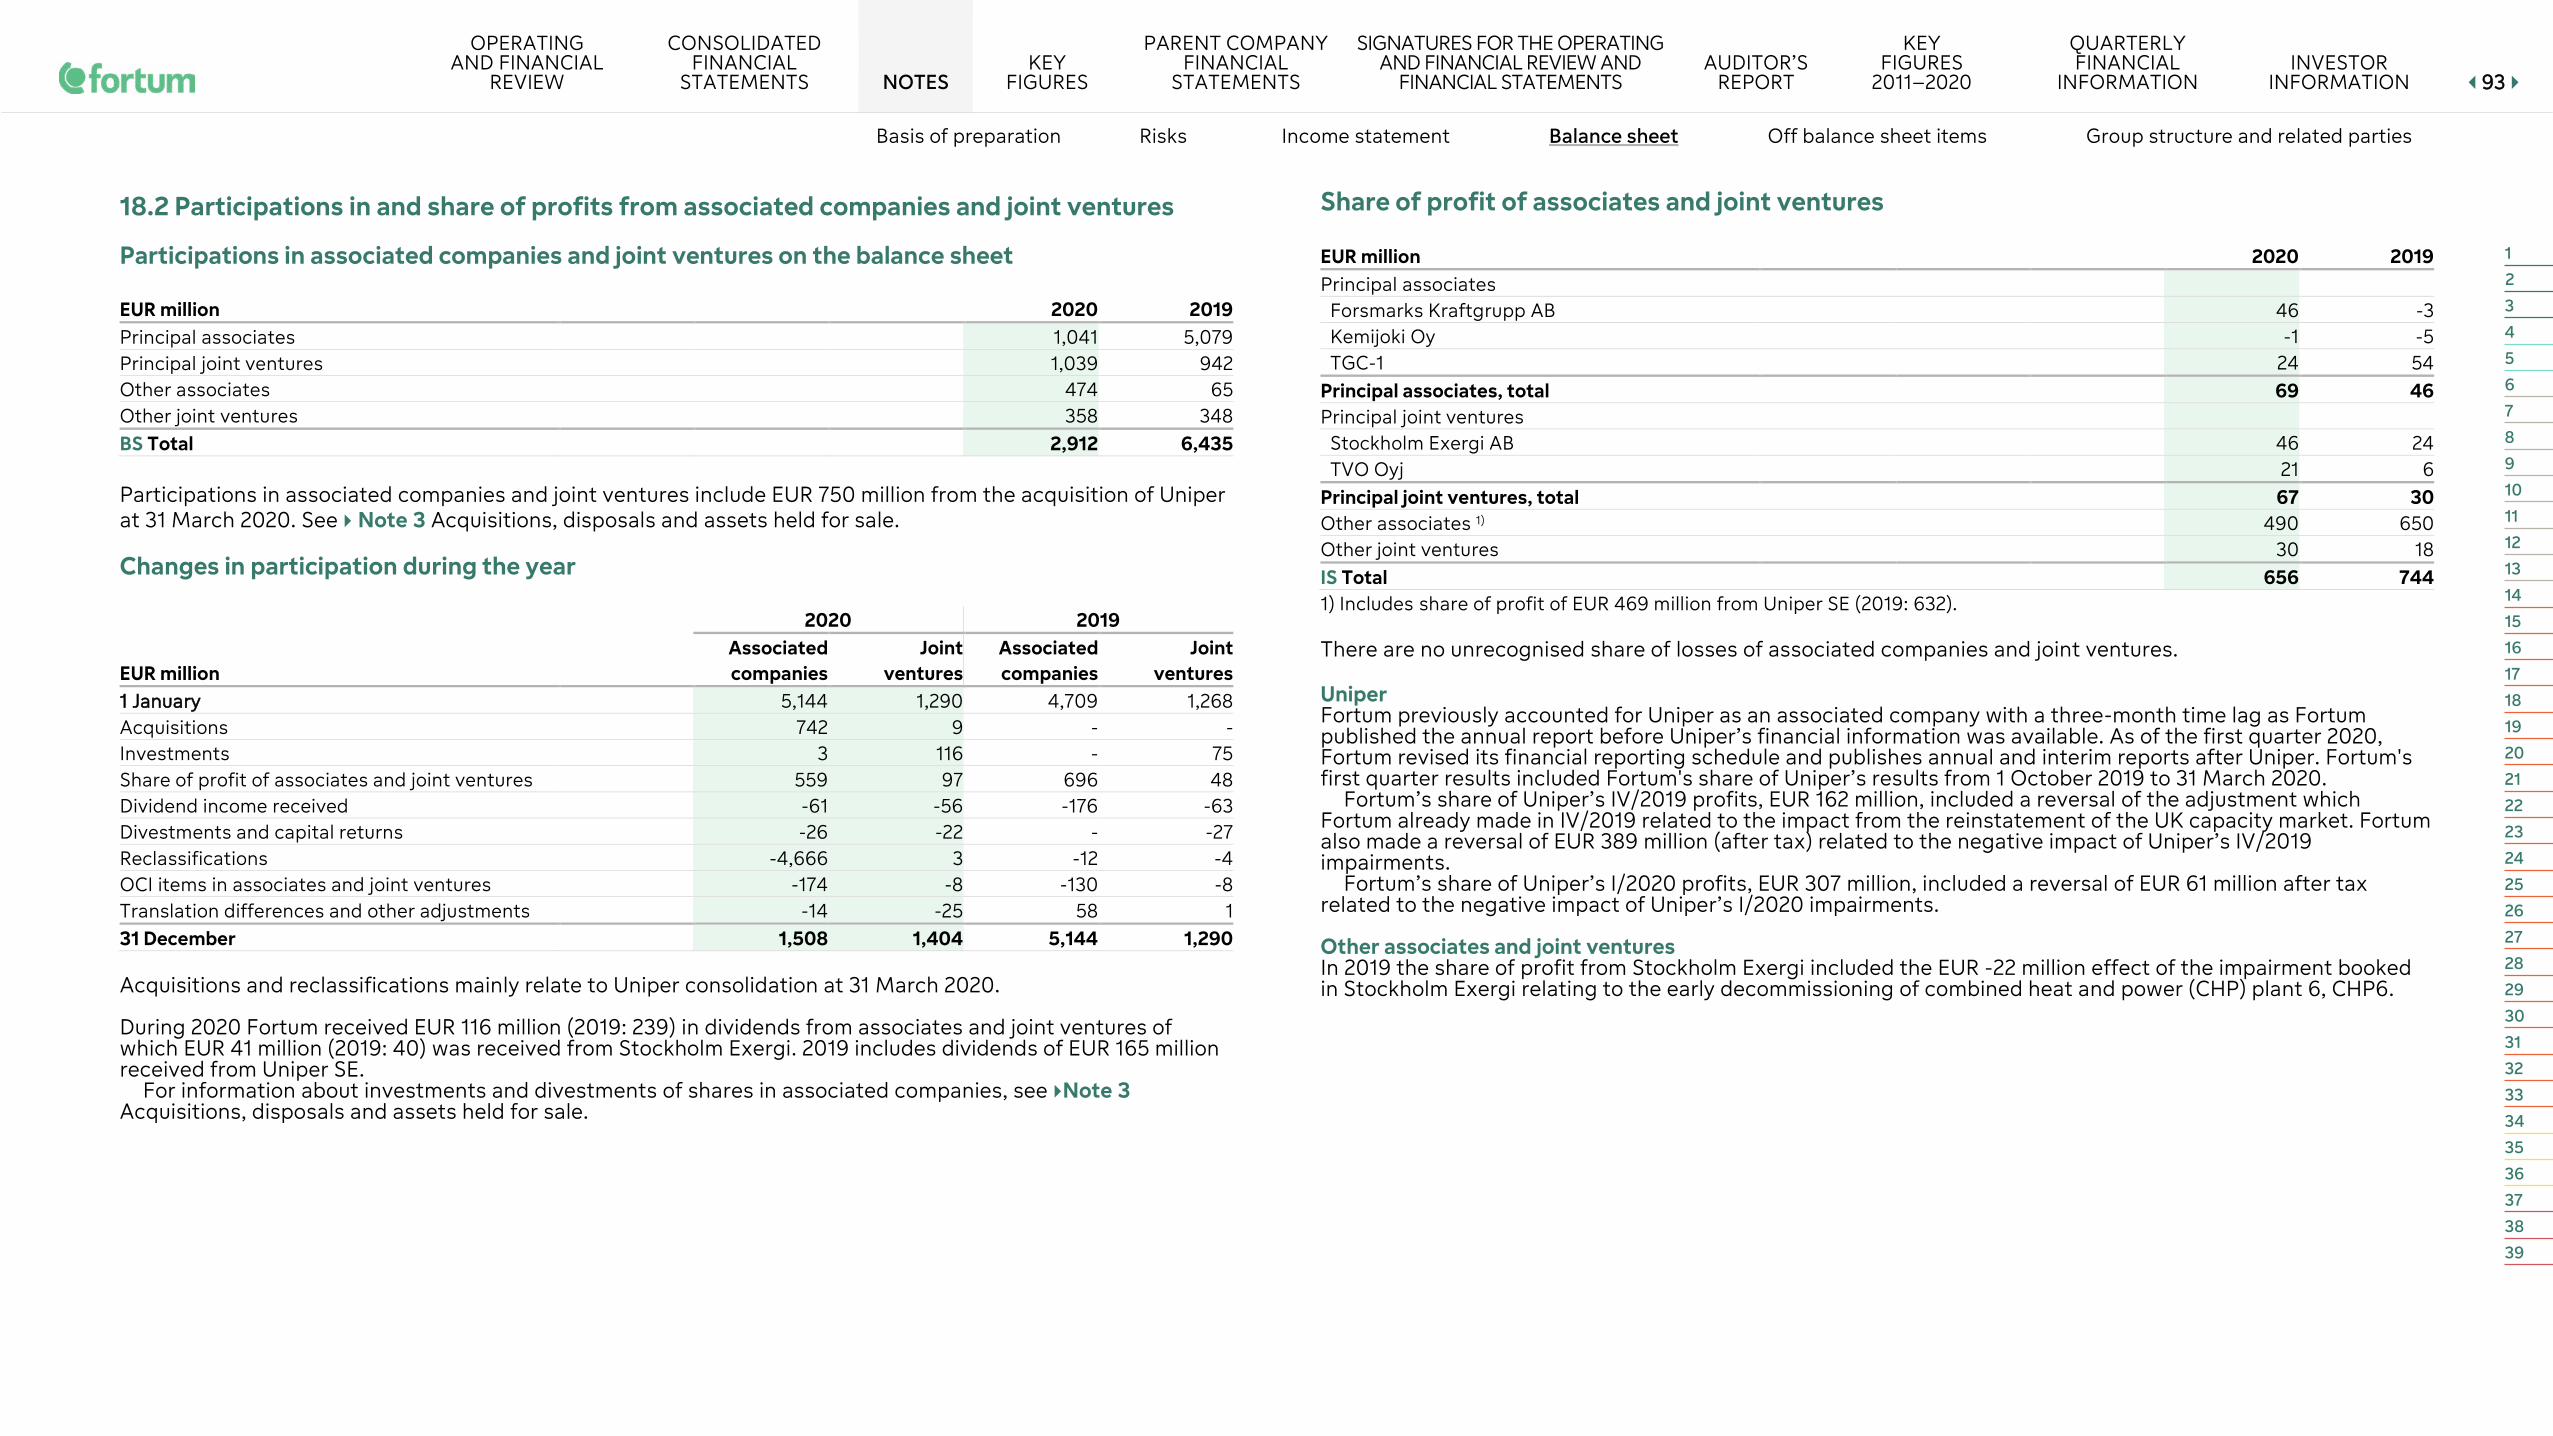
OPERATING AND FINANCIAL
REVIEW
CONSOLIDATED FINANCIAL
STATEMENTS NOTES KEY
FIGURES
PARENT COMPANY FINANCIAL
STATEMENTS
SIGNATURES FOR THE OPERATING AND FINANCIAL REVIEW AND
FINANCIAL STATEMENTS AUDITOR’S
REPORT
KEY FIGURES
2011–2020
QUARTERLY FINANCIAL
INFORMATION INVESTOR
INFORMATION 9933
Basis of preparation Risks Income statement Balance sheet Off balance sheet items Group structure and related parties
18.2 Participations in and share of profits from associated companies and joint ventures
Participations in associated companies and joint ventures on the balance sheet
EUR million 2020 2019 Principal associates 1,041 5,079 Principal joint ventures 1,039 942 Other associates 474 65 Other joint ventures 358 348 BS Total 2,912 6,435 Participations in associated companies and joint ventures include EUR 750 million from the acquisition of Uniper at 31 March 2020. See Note 3 Acquisitions, disposals and assets held for sale.
Changes in participation during the year
2020 2019
EUR million Associated companies
Joint ventures
Associated companies
Joint ventures
11 JJaannuuaarryy 5,144 1,290 4,709 1,268 Acquisitions 742 9 - - Investments 3 116 - 75 Share of profit of associates and joint ventures 559 97 696 48 Dividend income received -61 -56 -176 -63 Divestments and capital returns -26 -22 - -27 Reclassifications -4,666 3 -12 -4 OCI items in associates and joint ventures -174 -8 -130 -8 Translation differences and other adjustments -14 -25 58 1 31 December 1,508 1,404 5,144 1,290 Acquisitions and reclassifications mainly relate to Uniper consolidation at 31 March 2020. During 2020 Fortum received EUR 116 million (2019: 239) in dividends from associates and joint ventures of which EUR 41 million (2019: 40) was received from Stockholm Exergi. 2019 includes dividends of EUR 165 million received from Uniper SE.
For information about investments and divestments of shares in associated companies, see Note 3 Acquisitions, disposals and assets held for sale.
Share of profit of associates and joint ventures
EUR million 2020 2019 Principal associates
Forsmarks Kraftgrupp AB 46 -3 Kemijoki Oy -1 -5 TGC-1 24 54
Principal associates, total 69 46 Principal joint ventures
Stockholm Exergi AB 46 24 TVO Oyj 21 6
Principal joint ventures, total 67 30 Other associates 1) 490 650 Other joint ventures 30 18 IS Total 656 744 1) Includes share of profit of EUR 469 million from Uniper SE (2019: 632).
There are no unrecognised share of losses of associated companies and joint ventures.
Uniper Fortum previously accounted for Uniper as an associated company with a three-month time lag as Fortum published the annual report before Uniper’s financial information was available. As of the first quarter 2020, Fortum revised its financial reporting schedule and publishes annual and interim reports after Uniper. Fortum's first quarter results included Fortum's share of Uniper’s results from 1 October 2019 to 31 March 2020.
Fortum’s share of Uniper’s IV/2019 profits, EUR 162 million, included a reversal of the adjustment which Fortum already made in IV/2019 related to the impact from the reinstatement of the UK capacity market. Fortum also made a reversal of EUR 389 million (after tax) related to the negative impact of Uniper’s IV/2019 impairments.
Fortum’s share of Uniper’s I/2020 profits, EUR 307 million, included a reversal of EUR 61 million after tax related to the negative impact of Uniper’s I/2020 impairments.
Other associates and joint ventures In 2019 the share of profit from Stockholm Exergi included the EUR -22 million effect of the impairment booked in Stockholm Exergi relating to the early decommissioning of combined heat and power (CHP) plant 6, CHP6.
1
2
3
4
5
6
7
8
9
10
11
12
13
14
15
16
17
18
19
20
21
22
23
24
25
26
27
28
29
30
31
32
33
34
35
36
37
38
39

OPERATING AND FINANCIAL
REVIEW
CONSOLIDATED FINANCIAL
STATEMENTS NOTES KEY
FIGURES
PARENT COMPANY FINANCIAL
STATEMENTS
SIGNATURES FOR THE OPERATING AND FINANCIAL REVIEW AND
FINANCIAL STATEMENTS AUDITOR’S
REPORT
KEY FIGURES
2011–2020
QUARTERLY FINANCIAL
INFORMATION INVESTOR
INFORMATION 9944
Basis of preparation Risks Income statement Balance sheet Off balance sheet items Group structure and related parties
19 Other non-current assets EUR million 2020 2019 Other investments 224 75 Interest-free receivables 255 75 BS Total 479 151 Other investments mainly include certain subsidiaries that are not included in the consolidated financial statements on materiality grounds, accounted for outside the scope of IFRS 9 and measured at cost (see Note 39 Group companies by segment); as well as shares in unlisted companies.
Interest-free receivables mainly include prepaid expenses. Other investments included EUR 152 million, and interest-free receivables EUR 190 million from the acquisition
of Uniper at 31 March 2020. See Note 3 Acquisitions, disposals and assets held for sale.
20 Interest-bearing receivables EUR million 2020 2019 Interest-bearing receivables 2,804 1,035 Finance lease receivables 196 - Total 3,000 1,035
2020 2019
EUR million Carrying
amount Fair
value Carrying
amount Fair
value Long-term loan receivables from associates and joint ventures 1,113 1,161 625 668 Non-current securities 98 98 - - Other long-term interest-bearing receivables 1,010 1,010 26 27 Total long-term interest-bearing receivables 2,221 2,270 651 695 Collateral arrangement securities 432 432 281 281 Other short-term interest-bearing receivables 151 151 103 103 Total short-term interest-bearing receivables 582 582 384 384 Total 2,804 2,852 1,035 1,079
Long-term interest-bearing receivables include receivables from associated companies and joint ventures of EUR 1,113 million (2019: 625). These receivables include EUR 964 million from Swedish nuclear companies, Forsmarks Kraftgrupp AB and Ringhals AB (2019: 558 from Swedish nuclear companies, OKG AB and Forsmarks Kraftgrupp AB), which are mainly funded with shareholder loans, pro rata each shareholder’s ownership.
Interest-bearing receivables included interest-bearing receivables of EUR 1,634 million and finance lease receivables of EUR 206 million from the acquisition of Uniper at 31 March 2020. See Note 3 Acquisitions, disposals and assets held for sale.
1
2
3
4
5
6
7
8
9
10
11
12
13
14
15
16
17
18
19
20
21
22
23
24
25
26
27
28
29
30
31
32
33
34
35
36
37
38
39

OPERATING AND FINANCIAL
REVIEW
CONSOLIDATED FINANCIAL
STATEMENTS NOTES KEY
FIGURES
PARENT COMPANY FINANCIAL
STATEMENTS
SIGNATURES FOR THE OPERATING AND FINANCIAL REVIEW AND
FINANCIAL STATEMENTS AUDITOR’S
REPORT
KEY FIGURES
2011–2020
QUARTERLY FINANCIAL
INFORMATION INVESTOR
INFORMATION 9955
Basis of preparation Risks Income statement Balance sheet Off balance sheet items Group structure and related parties
21 Inventories ACCOUNTING POLICIES Inventories are stated at the lower of cost and net realisable value being the estimated selling price for the end product, less applicable variable selling expenses and other production costs. Cost is generally determined using the weighted average cost method.
Inventories which are acquired for the purpose of buying and selling commodities in the near future, generating profit from the fluctuation in market price, are stated at fair value less cost to sell.
EUR million 2020 2019 Raw materials and supplies 671 180 Goods purchased for resale 583 - Other 141 50 BS Total 1,396 230 Raw materials and supplies mainly consist of fuels consumed in the production process, or in the rendering of services; and include, in particular, coal, uranium and nuclear fuel rods. Goods purchased for resale include gas and coal inventories. Other mainly consists of work in progress and finished goods.
Inventories stated at fair value less costs to sell total EUR 45 million. Inventories included EUR 1,565 million from the acquisition of Uniper on 31 March 2020. See Note 3
Acquisitions, disposals and assets held for sale.
22 Trade and other receivables ACCOUNTING POLICIES Trade receivables include revenue based on an estimate of electricity, gas, heat and cooling already delivered but not yet measured and not yet invoiced.
Impairment losses for trade receivables are calculated according to the expected credit loss (ECL) model. Loss allowances on trade receivables are measured at an amount equal to lifetime expected credit losses.
An allowance is made on the balance sheet for the expected future credit losses and remains on the balance sheet until it is written off as a credit loss or reversed. Allowances may remain on the balance sheet for several years pending the outcome of collection processes and court proceedings. Write-off policies differ by country depending on local legislation and assessment of recovery possibilities. For large trade receivables, ECL is calculated for the individual customer based on the estimated probability of default and expected recovery rate for the customer. These estimates are derived from available market data when possible, or based on the customer’s rating. Adjustments are made if there are indications of decreased creditworthiness, e.g. based on payment behaviour. ECL for trade receivables from small customers are calculated on portfolio basis by country and business segment. The credit loss allowances are based on historical analysis of losses when possible, or on average default rates for customers based on externally available information. These rates are adjusted if there are any forward-looking indicators showing changes in expected credit losses. Trade receivables overdue more than 180 days are generally considered to be credit-impaired and allowances are made for the full amount, adjusted for expected recovery rates.
EUR million 2020 2019 Trade receivables 7,115 736 Other 1,790 263 BS Total 8,906 999 Other category includes other operating assets, accrued income and prepaid expenses.
Trade and other receivables included EUR 7,236 million from the acquisition of Uniper at 31 March 2020. See Note 3 Acquisitions, disposals and assets held for sale.
1
2
3
4
5
6
7
8
9
10
11
12
13
14
15
16
17
18
19
20
21
22
23
24
25
26
27
28
29
30
31
32
33
34
35
36
37
38
39

OPERATING AND FINANCIAL
REVIEW
CONSOLIDATED FINANCIAL
STATEMENTS NOTES KEY
FIGURES
PARENT COMPANY FINANCIAL
STATEMENTS
SIGNATURES FOR THE OPERATING AND FINANCIAL REVIEW AND
FINANCIAL STATEMENTS AUDITOR’S
REPORT
KEY FIGURES
2011–2020
QUARTERLY FINANCIAL
INFORMATION INVESTOR
INFORMATION 9966
Basis of preparation Risks Income statement Balance sheet Off balance sheet items Group structure and related parties
Trade receivables
Ageing analysis of trade receivables
2020 2019
EUR million Gross
Expected credit
loss allowance
Expected credit
loss rate, % Gross
Expected credit
loss allowance
Expected credit
loss rate, %
Not past due 6,988 6 0 653 3 0 Past due 1-30 days 60 3 4 58 2 3 Past due 31-90 days 21 7 31 18 5 28 Past due 91-180 days 18 4 20 11 5 45 Past due more than 181 days 206 159 77 95 84 88 Total 7,293 178 2 836 99 12
Changes in expected credit loss allowance
EUR million 2020 2019 1 January 99 85 Expected credit loss allowance recognised during the year 17 7 Write-offs -51 -2 Acquisition of subsidiary companies 127 - Translation differences and other changes -14 9 31 December 178 99
The majority of impaired trade receivables relate to the Russia and Uniper segments.
Trade receivables by currency (Gross) EUR million 2020 2019 EUR 5,867 219 GBP 433 - USD 377 - RUB 274 204 SEK 126 118 PLN 102 95 NOK 86 175 Other 28 25 Total 7,293 836 Trade receivables are arising from a large number of customers mainly in EUR, GBP, USD and RUB mitigating the concentration of risk.
For further information regarding credit risk management and credit risks, see Counterparty and credit risks in the Operating and financial review and Note 4.4 Credit risk.
23 Liquid funds ACCOUNTING POLICIES Cash and cash equivalents in Liquid funds include cash in hand, deposits held at call with banks and other short-term, highly liquid investments with original maturities of three months or less. Cash and cash equivalents, deposits and commercial papers are measured at amortised cost. Fixed-term securities are measured at fair value through profit and loss.
Drawn amount of bank overdrafts are shown within borrowings in current liabilities on the balance sheet. Trading-related cash collaterals are included in margin receivables and otherwise restricted cash is treated as short-term interest-bearing receivables.
EUR million 2020 2019 Cash at bank and in hand 834 118 Deposits and securities with maturity under 3 months 1,063 1,239 Cash and cash equivalents 1,898 1,356 Deposits and commercial papers with maturity more than 3 months 363 76 Securities, fixed-term with maturity more than 3 months 46 - Deposits and securities, maturity over 3 months but less than 12 months 410 76 BS Total 1) 2,308 1,433 1) Excluded cash balances of EUR 2 million relating to assets held for sale at 31 December 2019. See Note 3 Acquisitions,
disposals and assets held for sale.
At the end of the reporting period, the Group’s liquid funds totalled EUR 2,308 million (2019: 1,433). Liquid funds include EUR 289 million held by Uniper. Russian subsidiaries held EUR 244 million (2019: 201) of liquid funds in the form of cash and bank deposits.
Liquid funds included EUR 1,328 million from the acquisition of Uniper at 31 March 2020. See Note 3 Acquisitions, disposals and assets held for sale.
Liquid funds totalling EUR 2,107 million (2019: 1,099) are placed with counterparties that have an investment grade credit rating.
At the end of the reporting period, Fortum had undrawn committed credit facilities amounting to EUR 5,000 million. The undrawn facilities include EUR 1,450 million revolving credit facility, maturing in November 2021 (with an option to extend the maturity by one year), EUR 1,750 million revolving credit facility maturing in June 2023, and Uniper’s revolving credit facility of EUR 1,800 million, which matures in September 2025. In addition to the revolving credit facilities, Fortum has EUR 100 million of committed overdraft limits that are valid until further notice.
In January 2020 Fortum cancelled EUR 3,000 million, in June 2020 EUR 1,200 million and in August 350 million of facilities and the revolving credit facility maturing in November 2021. The facilities were for purchase of Uniper shares and liquidity purposes.
For further information regarding credit risk management and credit risks, see Note 4.4 Credit risk.
1
2
3
4
5
6
7
8
9
10
11
12
13
14
15
16
17
18
19
20
21
22
23
24
25
26
27
28
29
30
31
32
33
34
35
36
37
38
39

OPERATING AND FINANCIAL
REVIEW
CONSOLIDATED FINANCIAL
STATEMENTS NOTES KEY
FIGURES
PARENT COMPANY FINANCIAL
STATEMENTS
SIGNATURES FOR THE OPERATING AND FINANCIAL REVIEW AND
FINANCIAL STATEMENTS AUDITOR’S
REPORT
KEY FIGURES
2011–2020
QUARTERLY FINANCIAL
INFORMATION INVESTOR
INFORMATION 9977
Basis of preparation Risks Income statement Balance sheet Off balance sheet items Group structure and related parties
24 Share capital 2020 2019 Number of registered shares 1 January and 31 December 888,294,465 888,294,465 Share capital, EUR million, 1 January and 31 December 3,046 3,046 Fortum Corporation has one class of shares. By the end of 2020, a total of 888,294,465 shares had been issued. Each share entitles the holder to one vote at the Annual General Meeting. All shares entitle holders to an equal dividend. At the end of 2020 Fortum Corporation’s share capital, paid in its entirety and entered in the trade register, was EUR 3,046,185,953.00.
Fortum Corporation’s shares are listed on Nasdaq Helsinki. The trading code is FORTUM (FUM1V until 25 January 2017). Fortum Corporation’s shares are in the Finnish book entry system maintained by Euroclear Finland Ltd.
Details on the President and CEO and other members of the Fortum Executive Management Team’s shareholdings and interest in the equity incentive schemes is presented in Note 10 Employee benefits and Board remuneration.
24.1 Authorisations from the Annual General Meeting 2020 On 23 April 2020, the Annual General Meeting decided to authorise the Board of Directors to decide on the repurchase and disposal of the company’s own shares up to a maximum of 20,000,000 shares, which corresponds to approximately 2.25% of all the shares in the company. The authorisation cancelled the authorisation resolved by the Annual General Meeting of 2019. The authorisation is effective until the next Annual General Meeting and, in any event, for a period no longer than 18 months. The authorisation had not been used by the end of 2020.
24.2 Convertible bond loans and bonds with warrants Fortum Corporation has not issued any convertible bonds or bonds with attached warrants, which would entitle the bearer to subscribe for Fortum shares. The Board of Directors of Fortum Corporation has no unused authorisations from the General Meeting of shareholders to issue convertible bond loans or bonds with warrants or increase the company’s share capital.
25 Non-controlling interests Principal non-controlling interests EUR million 2020 2019 Uniper Germany 2,430 - Fortum Oslo Varme AS Group Norway 147 166 Other 48 87 BS Total 2,624 252 Uniper EUR million 20201) Sales 44,514 Profit for the period 4
Dividends paid to non-controlling interests -139 Total cash flows -1,032 Current assets 17,919 Current liabilities 17,781 Current net assets 138 Non-current assets 12,224 Non-current liabilities 10,729 Non-current net assets 1,495 Net assets 1,633
of which attributable to non-controlling interests 2,430 Ownership interests held by non-controlling interests (%) 23.9
1) Uniper’s income statement and cash flow information are included from 1 April 2020.
1
2
3
4
5
6
7
8
9
10
11
12
13
14
15
16
17
18
19
20
21
22
23
24
25
26
27
28
29
30
31
32
33
34
35
36
37
38
39

OPERATING AND FINANCIAL
REVIEW
CONSOLIDATED FINANCIAL
STATEMENTS NOTES KEY
FIGURES
PARENT COMPANY FINANCIAL
STATEMENTS
SIGNATURES FOR THE OPERATING AND FINANCIAL REVIEW AND
FINANCIAL STATEMENTS AUDITOR’S
REPORT
KEY FIGURES
2011–2020
QUARTERLY FINANCIAL
INFORMATION INVESTOR
INFORMATION 9988
Basis of preparation Risks Income statement Balance sheet Off balance sheet items Group structure and related parties
26 Interest-bearing liabilities Financial net debt and adjusted net debt EUR million 2020 2019 + Interest-bearing liabilities 10,662 6,694 - Liquid funds 2,308 1,435
- Non-current securities 98 - - Collateral arrangement securities 432 281
- Securities in interest-bearing receivables 530 281 - Margin receivables 1,132 177 + Margin liabilities 331 32
+ Net margin liabilities -801 -145 Financial net debt 7,023 4,833 + Pension obligations 1,520 125 + Other asset retirement obligations 821 20
- Share of Finnish and Swedish Nuclear Waste Funds 3,445 813 + Nuclear provisions 3,866 813
+ Nuclear provisions net of assets in Nuclear Waste Funds 421 - + Total provisions net of assets in Nuclear Waste Funds 2,762 145 Adjusted net debt 9,784 4,978
Net debt
EUR million
Net debt 2019
Classified as assets
held for sale 1)
BS Total 2019
Interest-bearing liabilities 6,694 -6 6,688 Liquid funds 1,435 -2 1,433 Net debt 5,260 -4 5,256
1) See Note 3 Acquisitions, disposals and assets held for sale.
In 2020, Fortum updated the definition of net debt and started to use financial net debt and adjusted net debt when following indebtedness of the Group. The previously used net debt included interest-bearing loans, lease liabilities and liquid funds.
Margin receivables and liabilities (settlement of futures) are included in Financial net debt. Prior to change of definition, fluctuations in commodity prices have caused an asymmetric impact to net debt as the funds received or paid from future settlements have been recognised as a change in working capital.
Fortum has a collateral arrangement to release cash from the Nordic Power Exchange. This arrangement is presented with equal amounts as a short-term interest-bearing liability and an interest-bearing receivable. Previously only the liability of the arrangement was included in net debt, but now collateral arrangement securities in interest-bearing receivables are also included in financial net debt calculations.
Underfunded pension obligations and asset retirement obligations, net of share in nuclear waste funds, are included in adjusted net debt.
Interest-bearing liabilities
EUR million 2020 2019 Loans 9,607 6,580 Lease liabilities 1,055 108 Total 10,662 6,688
EUR million 2020 2019 Bonds 3,758 4,251 Loans from financial institutions 2,556 329 Reborrowing from the Finnish State Nuclear Waste Management Fund 1,145 1,145 Lease liabilities 894 89 Other long-term interest-bearing liabilities 433 304 BS Total long-term interest-bearing liabilities 8,785 6,118 Current portion of long-term bonds 500 - Current portion of loans from financial institutions 20 33 Current portion of other long-term interest-bearing liabilities 14 40 Commercial paper liabilities 260 10 Current portion of lease liabilities 161 19 Collateral arrangement liability 432 281 Other short-term interest-bearing liabilities 490 187 BS Total short-term interest-bearing liabilities 1,877 570 Total 10,662 6,688
1
2
3
4
5
6
7
8
9
10
11
12
13
14
15
16
17
18
19
20
21
22
23
24
25
26
27
28
29
30
31
32
33
34
35
36
37
38
39
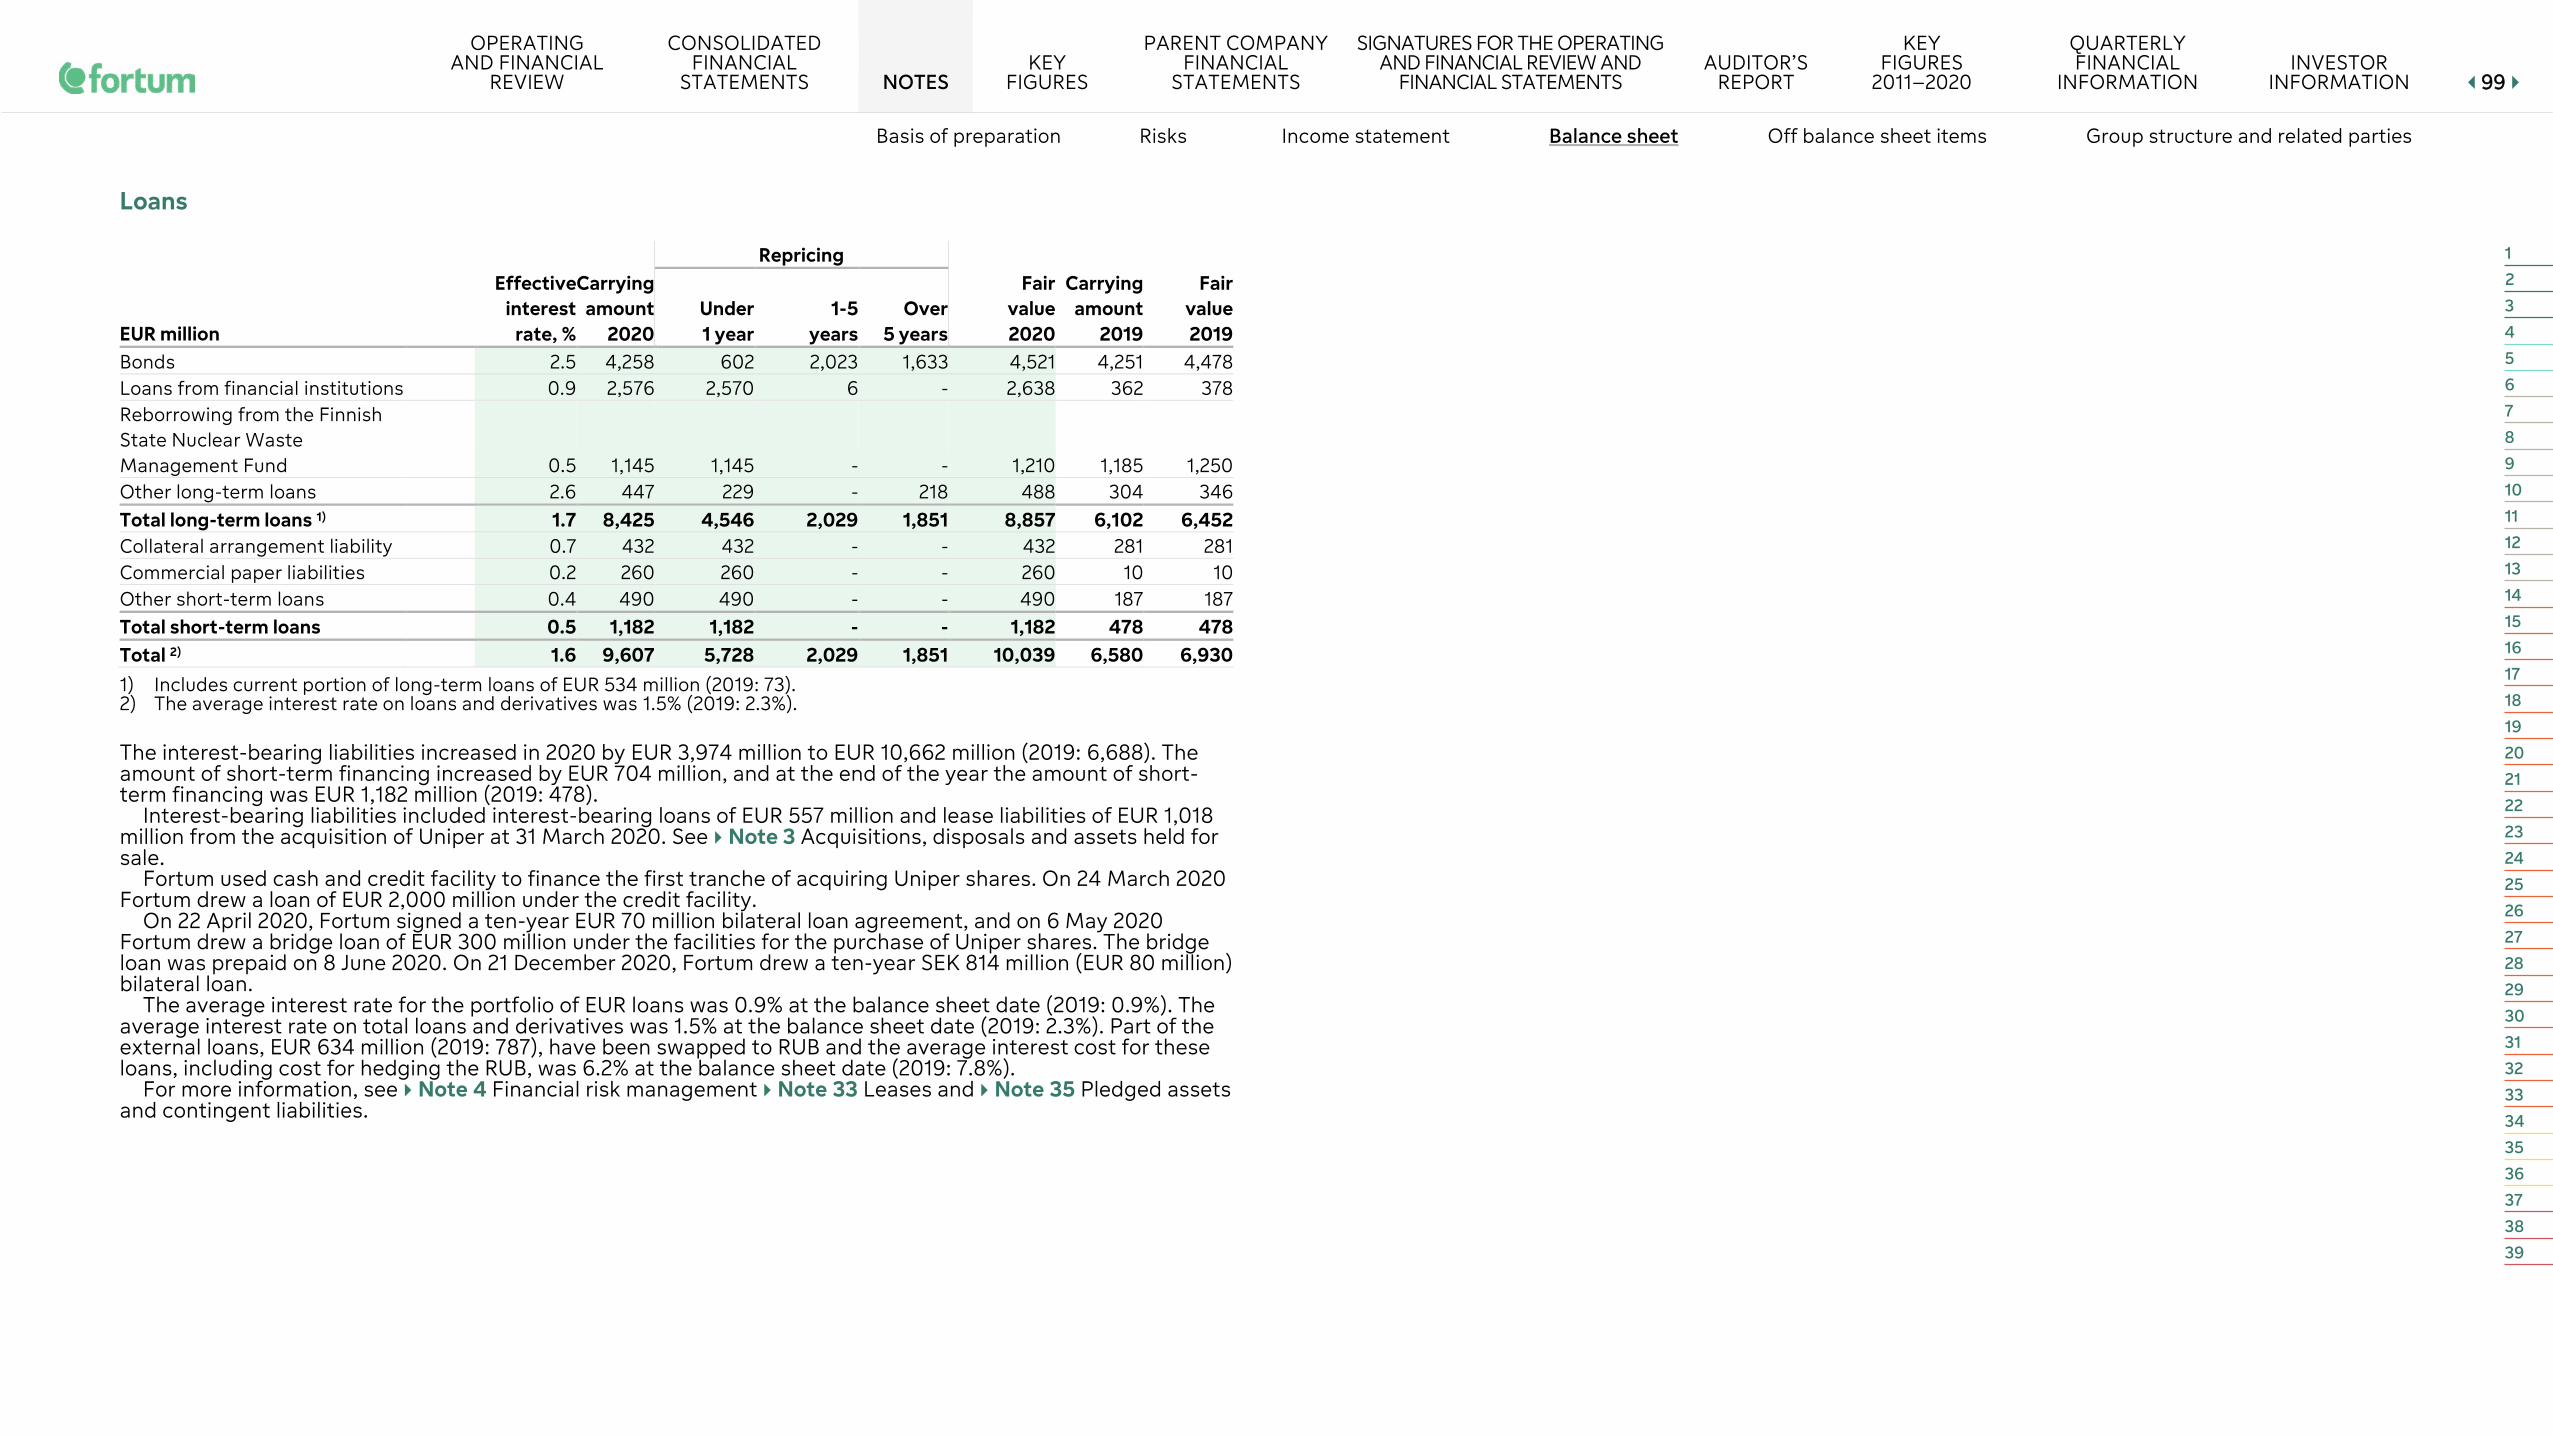
OPERATING AND FINANCIAL
REVIEW
CONSOLIDATED FINANCIAL
STATEMENTS NOTES KEY
FIGURES
PARENT COMPANY FINANCIAL
STATEMENTS
SIGNATURES FOR THE OPERATING AND FINANCIAL REVIEW AND
FINANCIAL STATEMENTS AUDITOR’S
REPORT
KEY FIGURES
2011–2020
QUARTERLY FINANCIAL
INFORMATION INVESTOR
INFORMATION 9999
Basis of preparation Risks Income statement Balance sheet Off balance sheet items Group structure and related parties
Loans
Repricing
EUR million
Effective interest rate, %
Carrying amount
2020 Under 1 year
1-5 years
Over 5 years
Fair value 2020
Carrying amount
2019
Fair value 2019
Bonds 2.5 4,258 602 2,023 1,633 4,521 4,251 4,478 Loans from financial institutions 0.9 2,576 2,570 6 - 2,638 362 378 Reborrowing from the Finnish State Nuclear Waste Management Fund 0.5 1,145 1,145 - - 1,210 1,185 1,250 Other long-term loans 2.6 447 229 - 218 488 304 346 Total long-term loans 1) 1.7 8,425 4,546 2,029 1,851 8,857 6,102 6,452 Collateral arrangement liability 0.7 432 432 - - 432 281 281 Commercial paper liabilities 0.2 260 260 - - 260 10 10 Other short-term loans 0.4 490 490 - - 490 187 187 Total short-term loans 0.5 1,182 1,182 - - 1,182 478 478 Total 2) 1.6 9,607 5,728 2,029 1,851 10,039 6,580 6,930 1) Includes current portion of long-term loans of EUR 534 million (2019: 73). 2) The average interest rate on loans and derivatives was 1.5% (2019: 2.3%).
The interest-bearing liabilities increased in 2020 by EUR 3,974 million to EUR 10,662 million (2019: 6,688). The amount of short-term financing increased by EUR 704 million, and at the end of the year the amount of short-term financing was EUR 1,182 million (2019: 478).
Interest-bearing liabilities included interest-bearing loans of EUR 557 million and lease liabilities of EUR 1,018 million from the acquisition of Uniper at 31 March 2020. See Note 3 Acquisitions, disposals and assets held for sale.
Fortum used cash and credit facility to finance the first tranche of acquiring Uniper shares. On 24 March 2020 Fortum drew a loan of EUR 2,000 million under the credit facility.
On 22 April 2020, Fortum signed a ten-year EUR 70 million bilateral loan agreement, and on 6 May 2020 Fortum drew a bridge loan of EUR 300 million under the facilities for the purchase of Uniper shares. The bridge loan was prepaid on 8 June 2020. On 21 December 2020, Fortum drew a ten-year SEK 814 million (EUR 80 million) bilateral loan.
The average interest rate for the portfolio of EUR loans was 0.9% at the balance sheet date (2019: 0.9%). The average interest rate on total loans and derivatives was 1.5% at the balance sheet date (2019: 2.3%). Part of the external loans, EUR 634 million (2019: 787), have been swapped to RUB and the average interest cost for these loans, including cost for hedging the RUB, was 6.2% at the balance sheet date (2019: 7.8%).
For more information, see Note 4 Financial risk management Note 33 Leases and Note 35 Pledged assets and contingent liabilities.
1
2
3
4
5
6
7
8
9
10
11
12
13
14
15
16
17
18
19
20
21
22
23
24
25
26
27
28
29
30
31
32
33
34
35
36
37
38
39

OPERATING AND FINANCIAL
REVIEW
CONSOLIDATED FINANCIAL
STATEMENTS NOTES KEY
FIGURES
PARENT COMPANY FINANCIAL
STATEMENTS
SIGNATURES FOR THE OPERATING AND FINANCIAL REVIEW AND
FINANCIAL STATEMENTS AUDITOR’S
REPORT
KEY FIGURES
2011–2020
QUARTERLY FINANCIAL
INFORMATION INVESTOR
INFORMATION 110000
Basis of preparation Risks Income statement Balance sheet Off balance sheet items Group structure and related parties
Reconciliation of interest-bearing liabilities
Non-cash changes
EUR million 1 Jan 2020 Acquisition of subsidiary
companies Cash flow from financing
activities 2) Non-cash collateral
arrangement Valuation differences/
Change in consolidation Lease liabilities 3) 31 Dec 2020 Bonds 4,251 7 4,258 Reborrowing from the Finnish State Nuclear Waste Management Fund 1,185 -40 1,145 Financial and other interest-bearing liabilities 1,144 557 2,414 151 -61 4,204 Lease liabilities 108 1,018 -105 -5 38 1,055 Total 6,688 1,575 2,269 151 -60 38 10,662
Non-cash changes
EUR million 31 Dec 2018
Impact from change in
accounting policy (IFRS 16) 1) 1 Jan 2019
Cash flow from financing activities 2)
Non-cash collateral arrangement
Valuation differences/ Change in consolidation Lease liabilities 3) 31 Dec 2019
Bonds 2,496 2,496 1,729 26 4,251 Reborrowing from the Finnish State Nuclear Waste Management Fund 1,158 1,158 27 1,185 Financial and other interest-bearing liabilities 2,440 2,440 -1,585 281 8 1,144 Lease liabilities - 99 99 -15 25 108 Total 6,093 99 6,192 156 281 34 25 6,688 1) See Note 1 Significant accounting policies and Note 33 Leases. 2) Repayments and borrowings. 3) Excluded lease liabilities of EUR 6 million relating to assets held for sale at 31 December 2019. See Note 3 Acquisitions, disposals and assets held for sale.
Bond issues
Issued/Maturity Interest
basis Interest
rate, % Effective
interest, % Currency
Nominal value
million
Carrying amount
EUR million
Fortum Corporation EUR 8,000 million EMTN Programme 11)) 2011/2021 Fixed 4.000 4.123 EUR 500 502 2012/2022 Fixed 2.250 2.344 EUR 1,000 1,024 2019/2023 Fixed 0.875 0.996 EUR 1,000 999 2019/2026 Fixed 1.625 1.638 EUR 750 765 2019/2029 Fixed 2.125 2.247 EUR 750 770 2013/2023 Floating Stibor 3M+1.13 SEK 1,000 100 2013/2043 Fixed 3.500 3.719 EUR 100 97 Total outstanding carrying amount 31 December 2020 4,258 1) EMTN = Euro Medium Term Note
1
2
3
4
5
6
7
8
9
10
11
12
13
14
15
16
17
18
19
20
21
22
23
24
25
26
27
28
29
30
31
32
33
34
35
36
37
38
39

OPERATING AND FINANCIAL
REVIEW
CONSOLIDATED FINANCIAL
STATEMENTS NOTES KEY
FIGURES
PARENT COMPANY FINANCIAL
STATEMENTS
SIGNATURES FOR THE OPERATING AND FINANCIAL REVIEW AND
FINANCIAL STATEMENTS AUDITOR’S
REPORT
KEY FIGURES
2011–2020
QUARTERLY FINANCIAL
INFORMATION INVESTOR
INFORMATION 110011
Basis of preparation Risks Income statement Balance sheet Off balance sheet items Group structure and related parties
27 Income taxes on the balance sheet ACCOUNTING POLICIES The tax currently payable is based on taxable profit for the year. Taxable profit differs from profit as reported in the consolidated income statement, because of items of income or expense that are taxable or deductible in other years and items that are never taxable or deductible. The Group’s liability for current tax is calculated using tax rates that have been enacted or substantively enacted by the end of the reporting period.
Deferred tax is provided in full, using the balance sheet approach on temporary differences arising between the tax bases of assets and liabilities and their carrying amounts in the consolidated financial statements. However, if the deferred tax arises from initial recognition of an asset or liability in a transaction other than a business combination that at the time of the transaction affects neither accounting nor taxable profit or loss, it is not accounted for. Deferred tax is determined using tax rates (and laws) that have been enacted or substantially enacted by the closing date and are expected to apply when the related deferred tax asset is realised or the deferred tax liability is settled.
Deferred tax assets are recognised to the extent that it is probable that future taxable profit will be available against which the temporary differences can be utilised. Deferred tax assets are set off against deferred tax liabilities if they relate to income taxes levied by the same taxation authority.
Deferred tax is provided on temporary differences arising from investments in subsidiaries, associates and joint ventures, except where the timing of the reversal of the temporary difference is controlled by the Group, and it is probable that the temporary difference will not be reversed in the foreseeable future.
The Group recognises liabilities for anticipated tax dispute issues based on estimates of whether additional taxes will be due. No provision will be recognised in the financial statements if Fortum considers the claims unjustifiable. Therefore, if taxes regarding ongoing tax disputes have to be paid before final court decisions, they will be booked as a receivable. Where the final outcome of these matters is different from the amounts that were initially recorded, such differences will impact the income tax and deferred tax provisions in the period in which such determination is made.
CRITICAL ACCOUNTING ESTIMATES AND JUDGEMENTS: ASSUMPTIONS AND ESTIMATES REGARDING FUTURE TAX CONSEQUENCES Fortum has deferred tax assets and liabilities which are expected to be realised through the income statement over the extended periods of time in the future. In calculating the deferred tax items, Fortum is required to make certain assumptions and estimates regarding the future tax consequences attributable to differences between the carrying amounts of assets and liabilities as recorded in the financial statements and their tax basis.
Assumptions made include the expectation that future operating performance for subsidiaries will be consistent with historical levels of operating results, recoverability periods for tax loss carry-forwards will not change, and that existing tax laws and rates will remain unchanged into foreseeable future. Fortum believes that it has prudent assumptions in developing its deferred tax balances.
Assumptions and estimates regarding uncertain tax positions are supported by external legal counsel or expert opinion.
If the actual final outcome (regarding tax disputes) would differ negatively from management’s estimates with 10%, the Group would need to increase the income tax liability by EUR 11 million at 31 December 2020. For additional information regarding tax disputes, see Note 36 Legal actions and official proceedings.
27.1 Deferred income taxes on the balance sheet 2020 2019 EUR million 1 Jan Change 31 Dec 1 Jan Change 31 Dec BS Deferred tax assets 77 1,013 1,089 70 7 77 BS Deferred tax liabilities -865 -87 -952 -720 -144 -865 Net deferred taxes -788 926 138 -651 -137 -788
Deferred income tax assets and liabilities are offset when there is a legally enforceable right to offset current tax assets against current tax liabilities and when the deferred income taxes relate to the same fiscal authority.
1
2
3
4
5
6
7
8
9
10
11
12
13
14
15
16
17
18
19
20
21
22
23
24
25
26
27
28
29
30
31
32
33
34
35
36
37
38
39
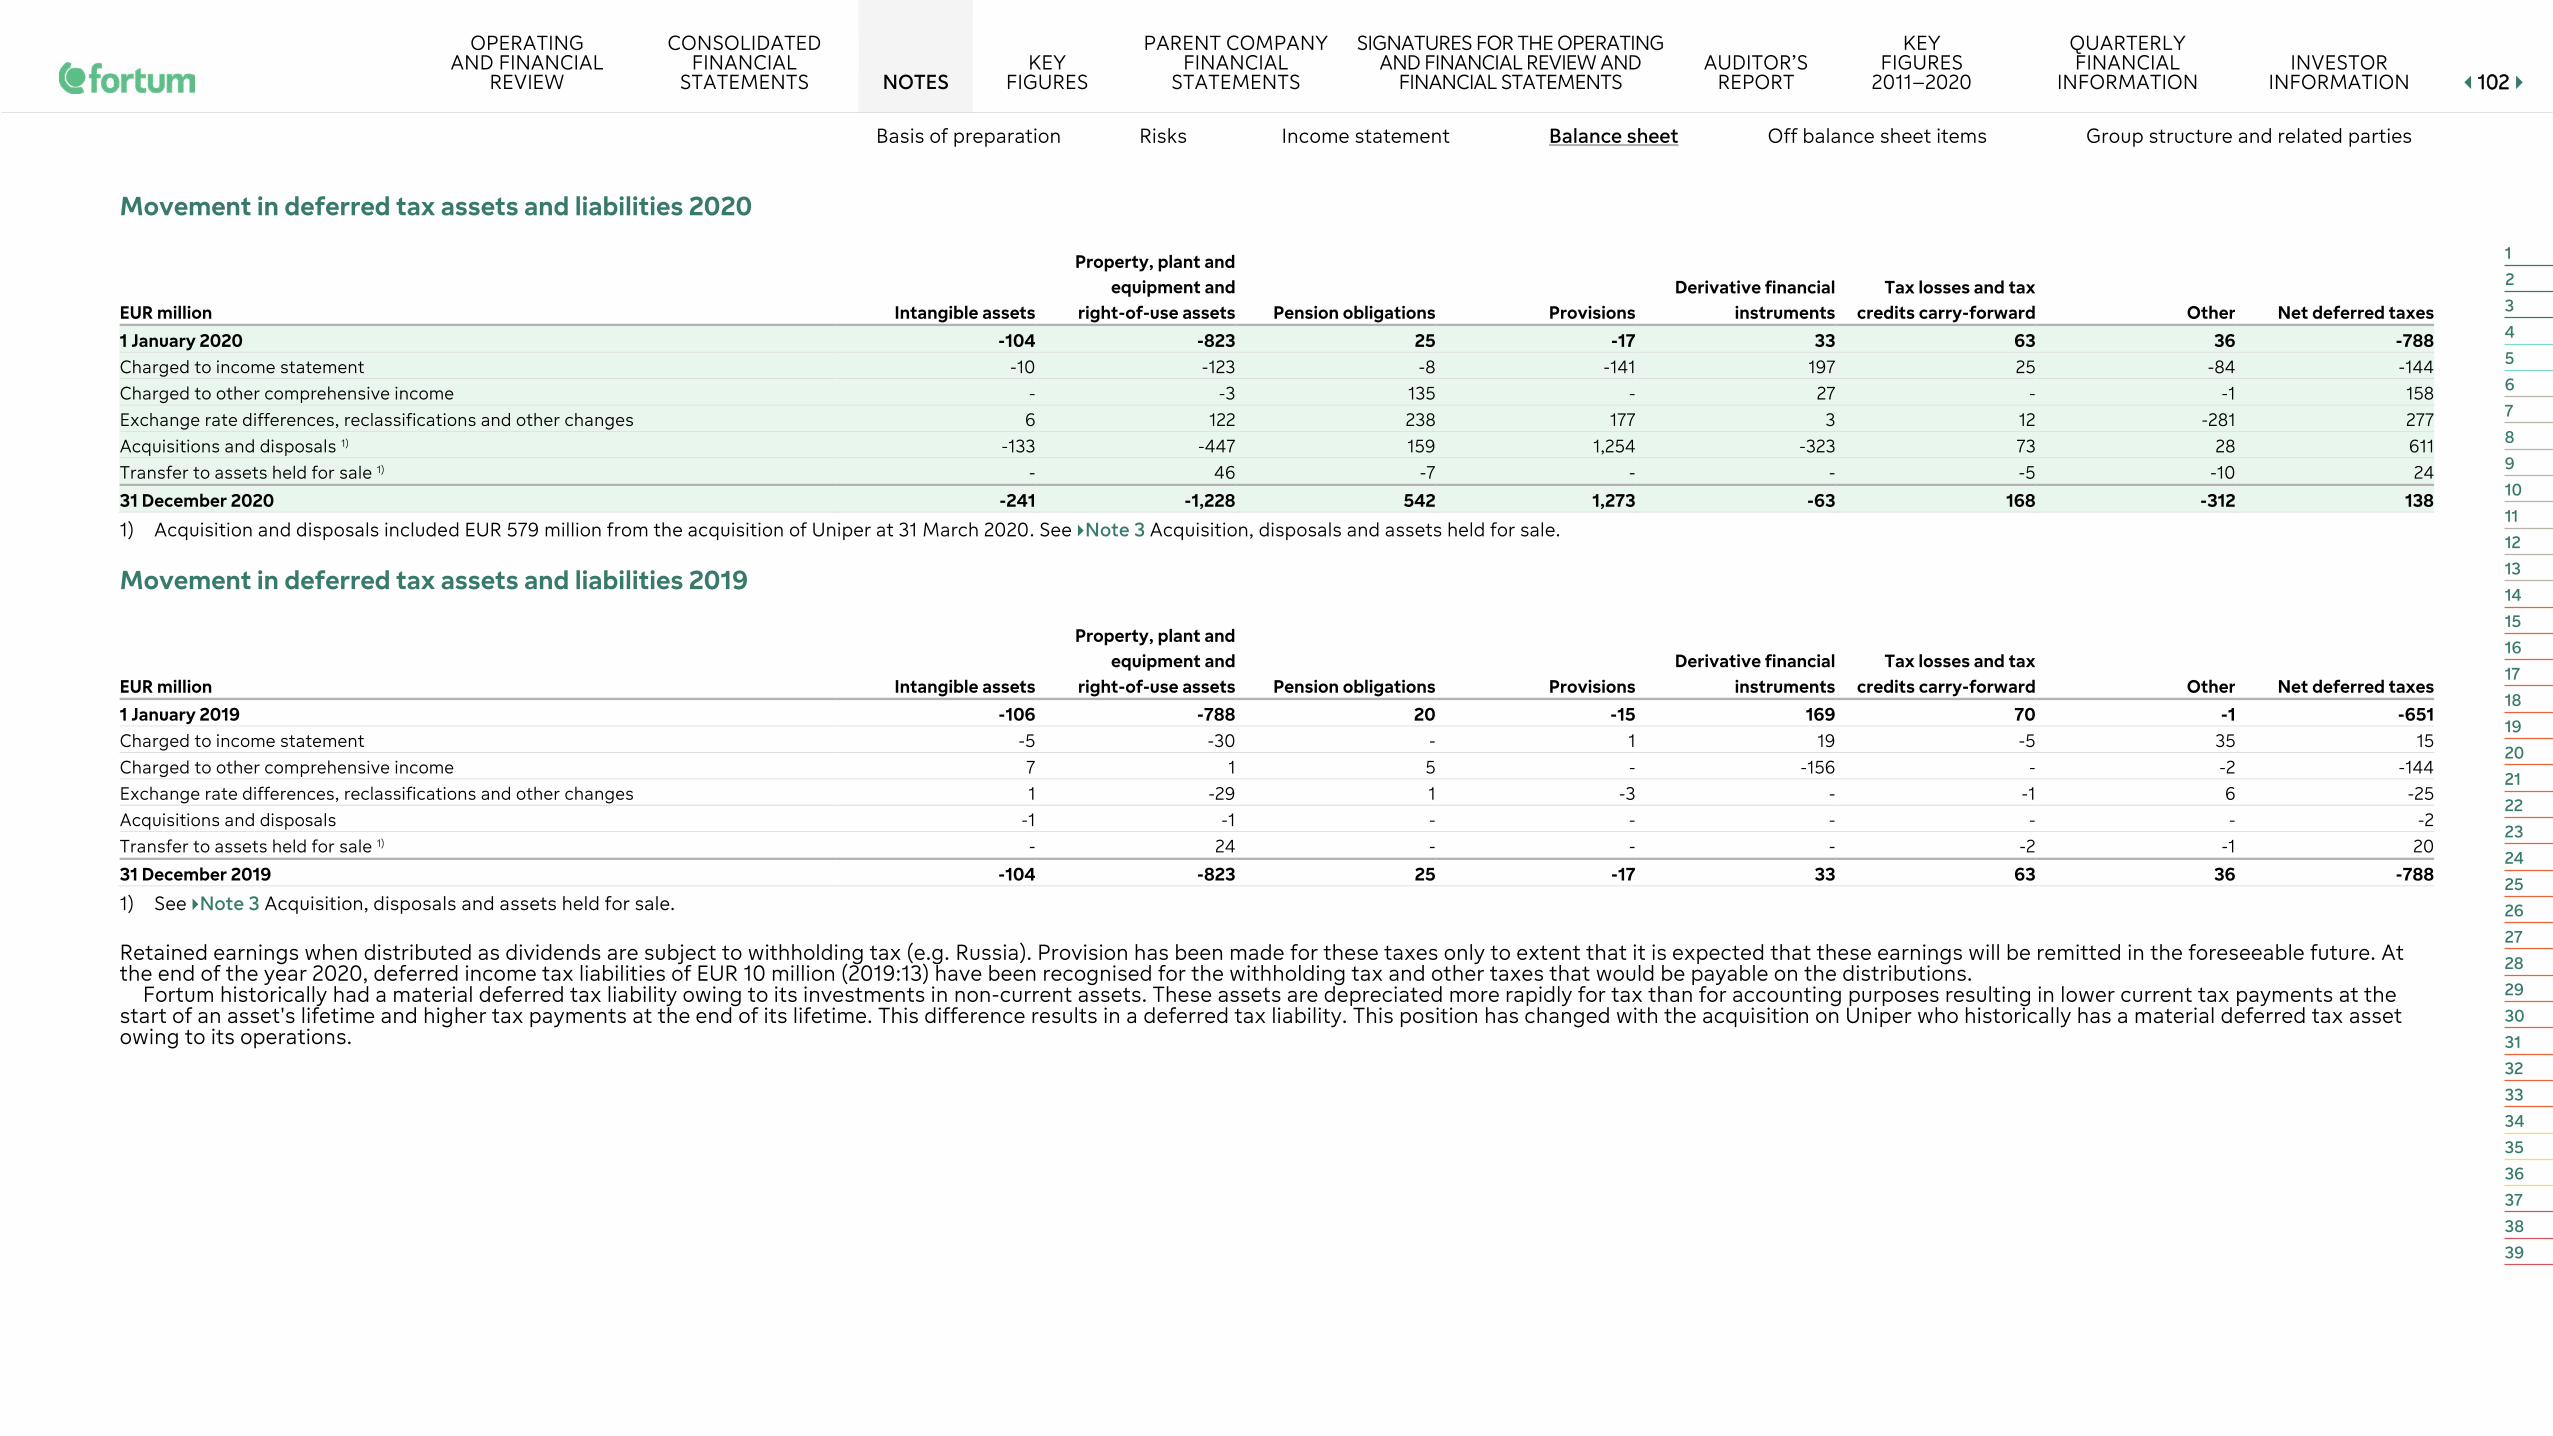
OPERATING AND FINANCIAL
REVIEW
CONSOLIDATED FINANCIAL
STATEMENTS NOTES KEY
FIGURES
PARENT COMPANY FINANCIAL
STATEMENTS
SIGNATURES FOR THE OPERATING AND FINANCIAL REVIEW AND
FINANCIAL STATEMENTS AUDITOR’S
REPORT
KEY FIGURES
2011–2020
QUARTERLY FINANCIAL
INFORMATION INVESTOR
INFORMATION 110022
Basis of preparation Risks Income statement Balance sheet Off balance sheet items Group structure and related parties
Movement in deferred tax assets and liabilities 2020
EUR million Intangible assets
Property, plant and equipment and
right-of-use assets Pension obligations Provisions Derivative financial
instruments Tax losses and tax
credits carry-forward Other Net deferred taxes 1 January 2020 -104 -823 25 -17 33 63 36 -788 Charged to income statement -10 -123 -8 -141 197 25 -84 -144 Charged to other comprehensive income - -3 135 - 27 - -1 158 Exchange rate differences, reclassifications and other changes 6 122 238 177 3 12 -281 277 Acquisitions and disposals 1) -133 -447 159 1,254 -323 73 28 611 Transfer to assets held for sale 1) - 46 -7 - - -5 -10 24 31 December 2020 -241 -1,228 542 1,273 -63 168 -312 138 1) Acquisition and disposals included EUR 579 million from the acquisition of Uniper at 31 March 2020. See Note 3 Acquisition, disposals and assets held for sale.
Movement in deferred tax assets and liabilities 2019
EUR million Intangible assets
Property, plant and equipment and
right-of-use assets Pension obligations Provisions Derivative financial
instruments Tax losses and tax
credits carry-forward Other Net deferred taxes 1 January 2019 -106 -788 20 -15 169 70 -1 -651 Charged to income statement -5 -30 - 1 19 -5 35 15 Charged to other comprehensive income 7 1 5 - -156 - -2 -144 Exchange rate differences, reclassifications and other changes 1 -29 1 -3 - -1 6 -25 Acquisitions and disposals -1 -1 - - - - - -2 Transfer to assets held for sale 1) - 24 - - - -2 -1 20 31 December 2019 -104 -823 25 -17 33 63 36 -788 1) See Note 3 Acquisition, disposals and assets held for sale.
Retained earnings when distributed as dividends are subject to withholding tax (e.g. Russia). Provision has been made for these taxes only to extent that it is expected that these earnings will be remitted in the foreseeable future. At the end of the year 2020, deferred income tax liabilities of EUR 10 million (2019:13) have been recognised for the withholding tax and other taxes that would be payable on the distributions.
Fortum historically had a material deferred tax liability owing to its investments in non-current assets. These assets are depreciated more rapidly for tax than for accounting purposes resulting in lower current tax payments at the start of an asset's lifetime and higher tax payments at the end of its lifetime. This difference results in a deferred tax liability. This position has changed with the acquisition on Uniper who historically has a material deferred tax asset owing to its operations.
1
2
3
4
5
6
7
8
9
10
11
12
13
14
15
16
17
18
19
20
21
22
23
24
25
26
27
28
29
30
31
32
33
34
35
36
37
38
39

OPERATING AND FINANCIAL
REVIEW
CONSOLIDATED FINANCIAL
STATEMENTS NOTES KEY
FIGURES
PARENT COMPANY FINANCIAL
STATEMENTS
SIGNATURES FOR THE OPERATING AND FINANCIAL REVIEW AND
FINANCIAL STATEMENTS AUDITOR’S
REPORT
KEY FIGURES
2011–2020
QUARTERLY FINANCIAL
INFORMATION INVESTOR
INFORMATION 110033
Basis of preparation Risks Income statement Balance sheet Off balance sheet items Group structure and related parties
Deferred income tax assets recognised for tax loss carry-forwards Deferred income tax assets are recognised for tax loss carry-forward to the extent that realisation of the related tax benefit through future profits is probable. The recognised tax assets relate to losses carry-forward with no expiration date and partly with expiry date as described below.
2020 2019
EUR million Tax
losses
Deferred tax
asset Tax
losses
Deferred tax
asset Losses without expiration date 1) 789 137 171 36 Losses with expiration date 166 31 170 29 Total 955 168 340 65 1) In 2020, includes tax losses of EUR 588 million and deferred tax asset of EUR 94 million from the acquisition of Uniper on
31 March 2020.
Unrecognised deferred tax Deferred tax assets are not recognised on the balance sheet for loss carry-forwards of EUR 468 million (2019: 65) because the realisation is not probable. The deferred tax impact of these losses would be EUR 78 million (2019: 16). The major part of the unrecognised tax asset relates to loss carry-forwards that are unlikely to be used in the foreseeable future. The increase is mainly due to Uniper acquisition on 31 March 2020.
No deferred tax assets are recognised in respect of temporary differences of EUR 2,437 million (2019: 39). The increase is mainly due to Uniper becoming Fortum's subsidiary on 31 March 2020.
No deferred tax liabilities were recognised on temporary differences of EUR 374 million (2019: 344) for investments in subsidiaries, branches, and associates and joint arrangements to the extent that Fortum can control the reversal effect, and it is probable that temporary differences will not be reversed in the foreseeable future.
27.2 Income tax receivables
EUR million 2020 2019 Belgium 113 114 Other 43 19 BS Total 156 133 Income tax receivables reflect payments of corporate income tax in relation to the year 2020, as well as payments according to received tax audit assessments in relation to previous years.
In Belgium, Fortum has received income tax assessments for the years 2008–2012. Additional taxes of EUR 114 million have been paid during prior years, and based on a supporting legal opinion, booked as an income tax receivable.
See Note 36 Legal actions and official proceedings.
28 Nuclear related assets and liabilities ACCOUNTING POLICIES Fortum owns Loviisa nuclear power plant in Finland, and through the acquisition of Uniper, OKG Aktiebolag (OKG) and Barsebäck Kraft AB (Barsebäck) nuclear power companies in Sweden. Fortum and Uniper are co-owners in the Swedish nuclear company OKG AB. In Fortum's consolidated balance sheet, Shares in Nuclear Waste Funds and the Nuclear provisions relate to Loviisa, OKG and Barsebäck nuclear power plants. Fortum's nuclear related provisions and the related part of the Nuclear Waste Funds are both presented separately on the balance sheet.
Fortum’s shares in the Nuclear Waste Funds are accounted for according to IFRIC 5, Rights to interests arising from decommissioning, restoration and environmental rehabilitation funds which states that the fund assets are measured at the lower of fair value or the value of the related liabilities since Fortum does not have control or joint control over the Nuclear Waste Funds. The Nuclear Waste Funds are managed by governmental authorities. The related provisions are the provision for decommissioning and the provision for disposal of spent fuel.
The fair values of the provisions are calculated according to IAS 37 by discounting the separate future cash flows, which are based on estimated future costs and actions already taken. The initial net present value of the provision for decommissioning (at the time of commissioning the nuclear power plant) has been included in the investment cost and is depreciated over the estimated operating time of the nuclear power plant. Changes in the technical plans etc., which have an impact on the future cash flow of the estimated costs for decommissioning, are accounted for by discounting the additional costs to the current point in time. The increased asset retirement cost due to the increased provision for decommissioning is added to property, plant and equipment and depreciated over the remaining estimated operating time of the nuclear power plant. For power plant units taken from use the increase is recognised immediately in the income statement.
The provision for spent fuel covers the future disposal costs for fuel used until the end of the accounting period. Costs for disposal of spent fuel are expensed during the operating time based on fuel usage. The impact of the possible changes in the estimated future cash flow for related costs is recognised immediately in the income statement based on the accumulated amount of fuel used until the end of the accounting period. The related interest costs due to unwinding of the provision is recognised in other financial expenses, net.
The interest income and possible fair valuation effects on the Nuclear Waste Funds assets are presented in other financial expenses, net.
Fortum's actual share of the Nuclear Waste Funds can be higher than the carrying value of the Fund in the balance sheet. The legal nuclear liability should be fully covered by payments and guarantees to the Nuclear Waste Fund in Finland. The same applies in Sweden for the nuclear power plants that are taken out of operation. For Swedish nuclear power plants in operation the nuclear liability should be fully covered at the end of the plants operating lifetimes. The difference between the legal liability and provisions can be material per power plant, as the legal liability in Finland is not discounted while the provisions are and in Sweden the legal liability is based on different assumptions than the provisions.
The annual fees to the Fund are based on changes in the legal liability, the return generated in the Nuclear Waste Fund and incurred costs of taken actions.
Fortum also has minority interests in nuclear power companies, including Teollisuuden Voima Oyj (TVO) in Finland and Forsmarks Kraftgrupp AB (Forsmark) in Sweden. The minority shareholdings are classified as associated companies and joint ventures and are consolidated with equity method. Both the Finnish and the Swedish companies are non-profit making, i.e. electricity production is invoiced to the owners at cost according to local GAAP. Accounting policies of the associates regarding nuclear assets and liabilities have been changed where necessary to ensure consistency with the policies adopted by the Group.
1
2
3
4
5
6
7
8
9
10
11
12
13
14
15
16
17
18
19
20
21
22
23
24
25
26
27
28
29
30
31
32
33
34
35
36
37
38
39

OPERATING AND FINANCIAL
REVIEW
CONSOLIDATED FINANCIAL
STATEMENTS NOTES KEY
FIGURES
PARENT COMPANY FINANCIAL
STATEMENTS
SIGNATURES FOR THE OPERATING AND FINANCIAL REVIEW AND
FINANCIAL STATEMENTS AUDITOR’S
REPORT
KEY FIGURES
2011–2020
QUARTERLY FINANCIAL
INFORMATION INVESTOR
INFORMATION 110044
Basis of preparation Risks Income statement Balance sheet Off balance sheet items Group structure and related parties
CRITICAL ACCOUNTING ESTIMATES AND JUDGEMENTS: ASSUMPTIONS MADE WHEN ESTIMATING PROVISIONS RELATED TO NUCLEAR PRODUCTION The provision for future obligations for nuclear waste management including decommissioning of Fortum's nuclear power plants and related spent fuel is based on long-term cash flow forecasts of estimated future costs. The main assumptions are technical plans, timing, cost estimates and discount rate. The technical plans, timing and cost estimates are approved by governmental authorities.
Any changes in the assumed discount rate would affect the provision. If the discount rate used would be lowered, the provision would increase. For the power plants where the actual Share of the Nuclear Waste Fund is higher than the provision an increase in provisions would be offset by an increase in the recorded share of Fortum's part of the Nuclear Waste Funds on the balance sheet. The total effect on the income statement would be positive since the decommissioning part of the provision is treated as an asset retirement obligation. This situation will prevail as long as the actual Share of the Nuclear Waste Fund is higher than recognised in the balance sheet and IFRS is limiting the carrying value of the assets to the amount of the provision since Fortum does not have control or joint control over the fund.
Based on Finnish and Swedish laws, Fortum has legal obligations to fully fund the legal liabilities decided by the governmental authorities, for decommissioning of the power plants and disposal of spent fuel through the Nuclear Waste Funds.
Both in Finland and in Sweden nuclear operators are legally obligated for the decommissioning of the plants and the disposal of spent fuel (nuclear waste management). In both countries the nuclear operators are obligated to secure the funding of nuclear waste management by paying to government operated nuclear waste funds. The nuclear operators also have to give securities to guarantee that sufficient funds exist to cover future expenses of decommissioning of the power plant and the disposal of spent fuel.
Fortum has aligned accounting policies and assumptions used for nuclear related assets and liabilities as of 31 December 2020. The alignment resulted in an increase in nuclear provisions. The increase in the nuclear provisions for Loviisa and Barsebäck nuclear power plants leads to recognition of an additional share of the Nuclear funds. As of 31 December 2020, Fortum still has EUR 441 million in unrecognised nuclear waste fund assets for Loviisa and Barsebäck. In the Income statement the alignment resulted in a positive net impact in other financial expenses of EUR 12 million.
The accounting policies and assumptions have also been aligned for the respective balances of the co-owned nuclear companies. The total impact of the alignment to share of profits from associated companies and joint ventures was EUR 47 million, net of tax.
28.1 Nuclear related assets and liabilities for consolidated nuclear power plants
EUR million 2020 2019 Carrying values on the balance sheet BS Nuclear provisions 3,866 813 BS Fortum's share of the Nuclear Waste Funds 3,445 813 Fortum's share of the fair value of the net assets in the Nuclear Waste Funds in Finland and Sweden 3,886 1,180 Share of fund not recognised on the balance sheet 441 316 Short-term receivable from the Nuclear Waste Fund - 51
Nuclear provision and fund accounted according to IFRS Nuclear provisions include the provision for decommissioning and the provision for disposal of spent fuel. The carrying value of the nuclear provisions, calculated according to IAS 37, increased by EUR 3,053 million compared to 31 December 2019, totalling EUR 3,866 million at 31 December 2020. The increase is mainly driven by the acquisition of Uniper and changes in assumptions.
Fortum's share of the Nuclear Waste Funds are from an IFRS perspective overfunded by EUR 441 million, since Fortum's share of the Funds on 31 December 2020 was EUR 3,886 million and the carrying value on the balance sheet was EUR 3,445 million. The Fund on Fortum's balance sheet can at maximum be equal to the amount of the provisions according to IFRS. As long as the Fund is overfunded from an IFRS perspective, the other financial expenses, net, is adjusted positively if the provisions increase more than the Fund, and negatively if the provision decreases below the actual value of the fund.
During 2020 Nuclear fund adjustment in the consolidated income statement was reclassified from Items affecting comparability to Other financial expenses, net. This change does not impact Comparable operating profit. Further, in the consolidate cash flow statement, nuclear fund-related payments and repayments have been reclassified from cash flow from operating activities to cash flow from investment activities. Comparatives have been reclassified accordingly.
Legal liability for Loviisa nuclear power plant The legal liability on 31 December 2020, decided by the Ministry of Economic Affairs and Employment in November 2020, was EUR 1,208 million.
The legal liability is based on a cost estimate, which is updated every year; and a technical plan, which is updated every three years. The legal liability is determined by assuming that the decommissioning would start at the beginning of the year following the assessment year and discounting is not applied in determining the amount.
1
2
3
4
5
6
7
8
9
10
11
12
13
14
15
16
17
18
19
20
21
22
23
24
25
26
27
28
29
30
31
32
33
34
35
36
37
38
39
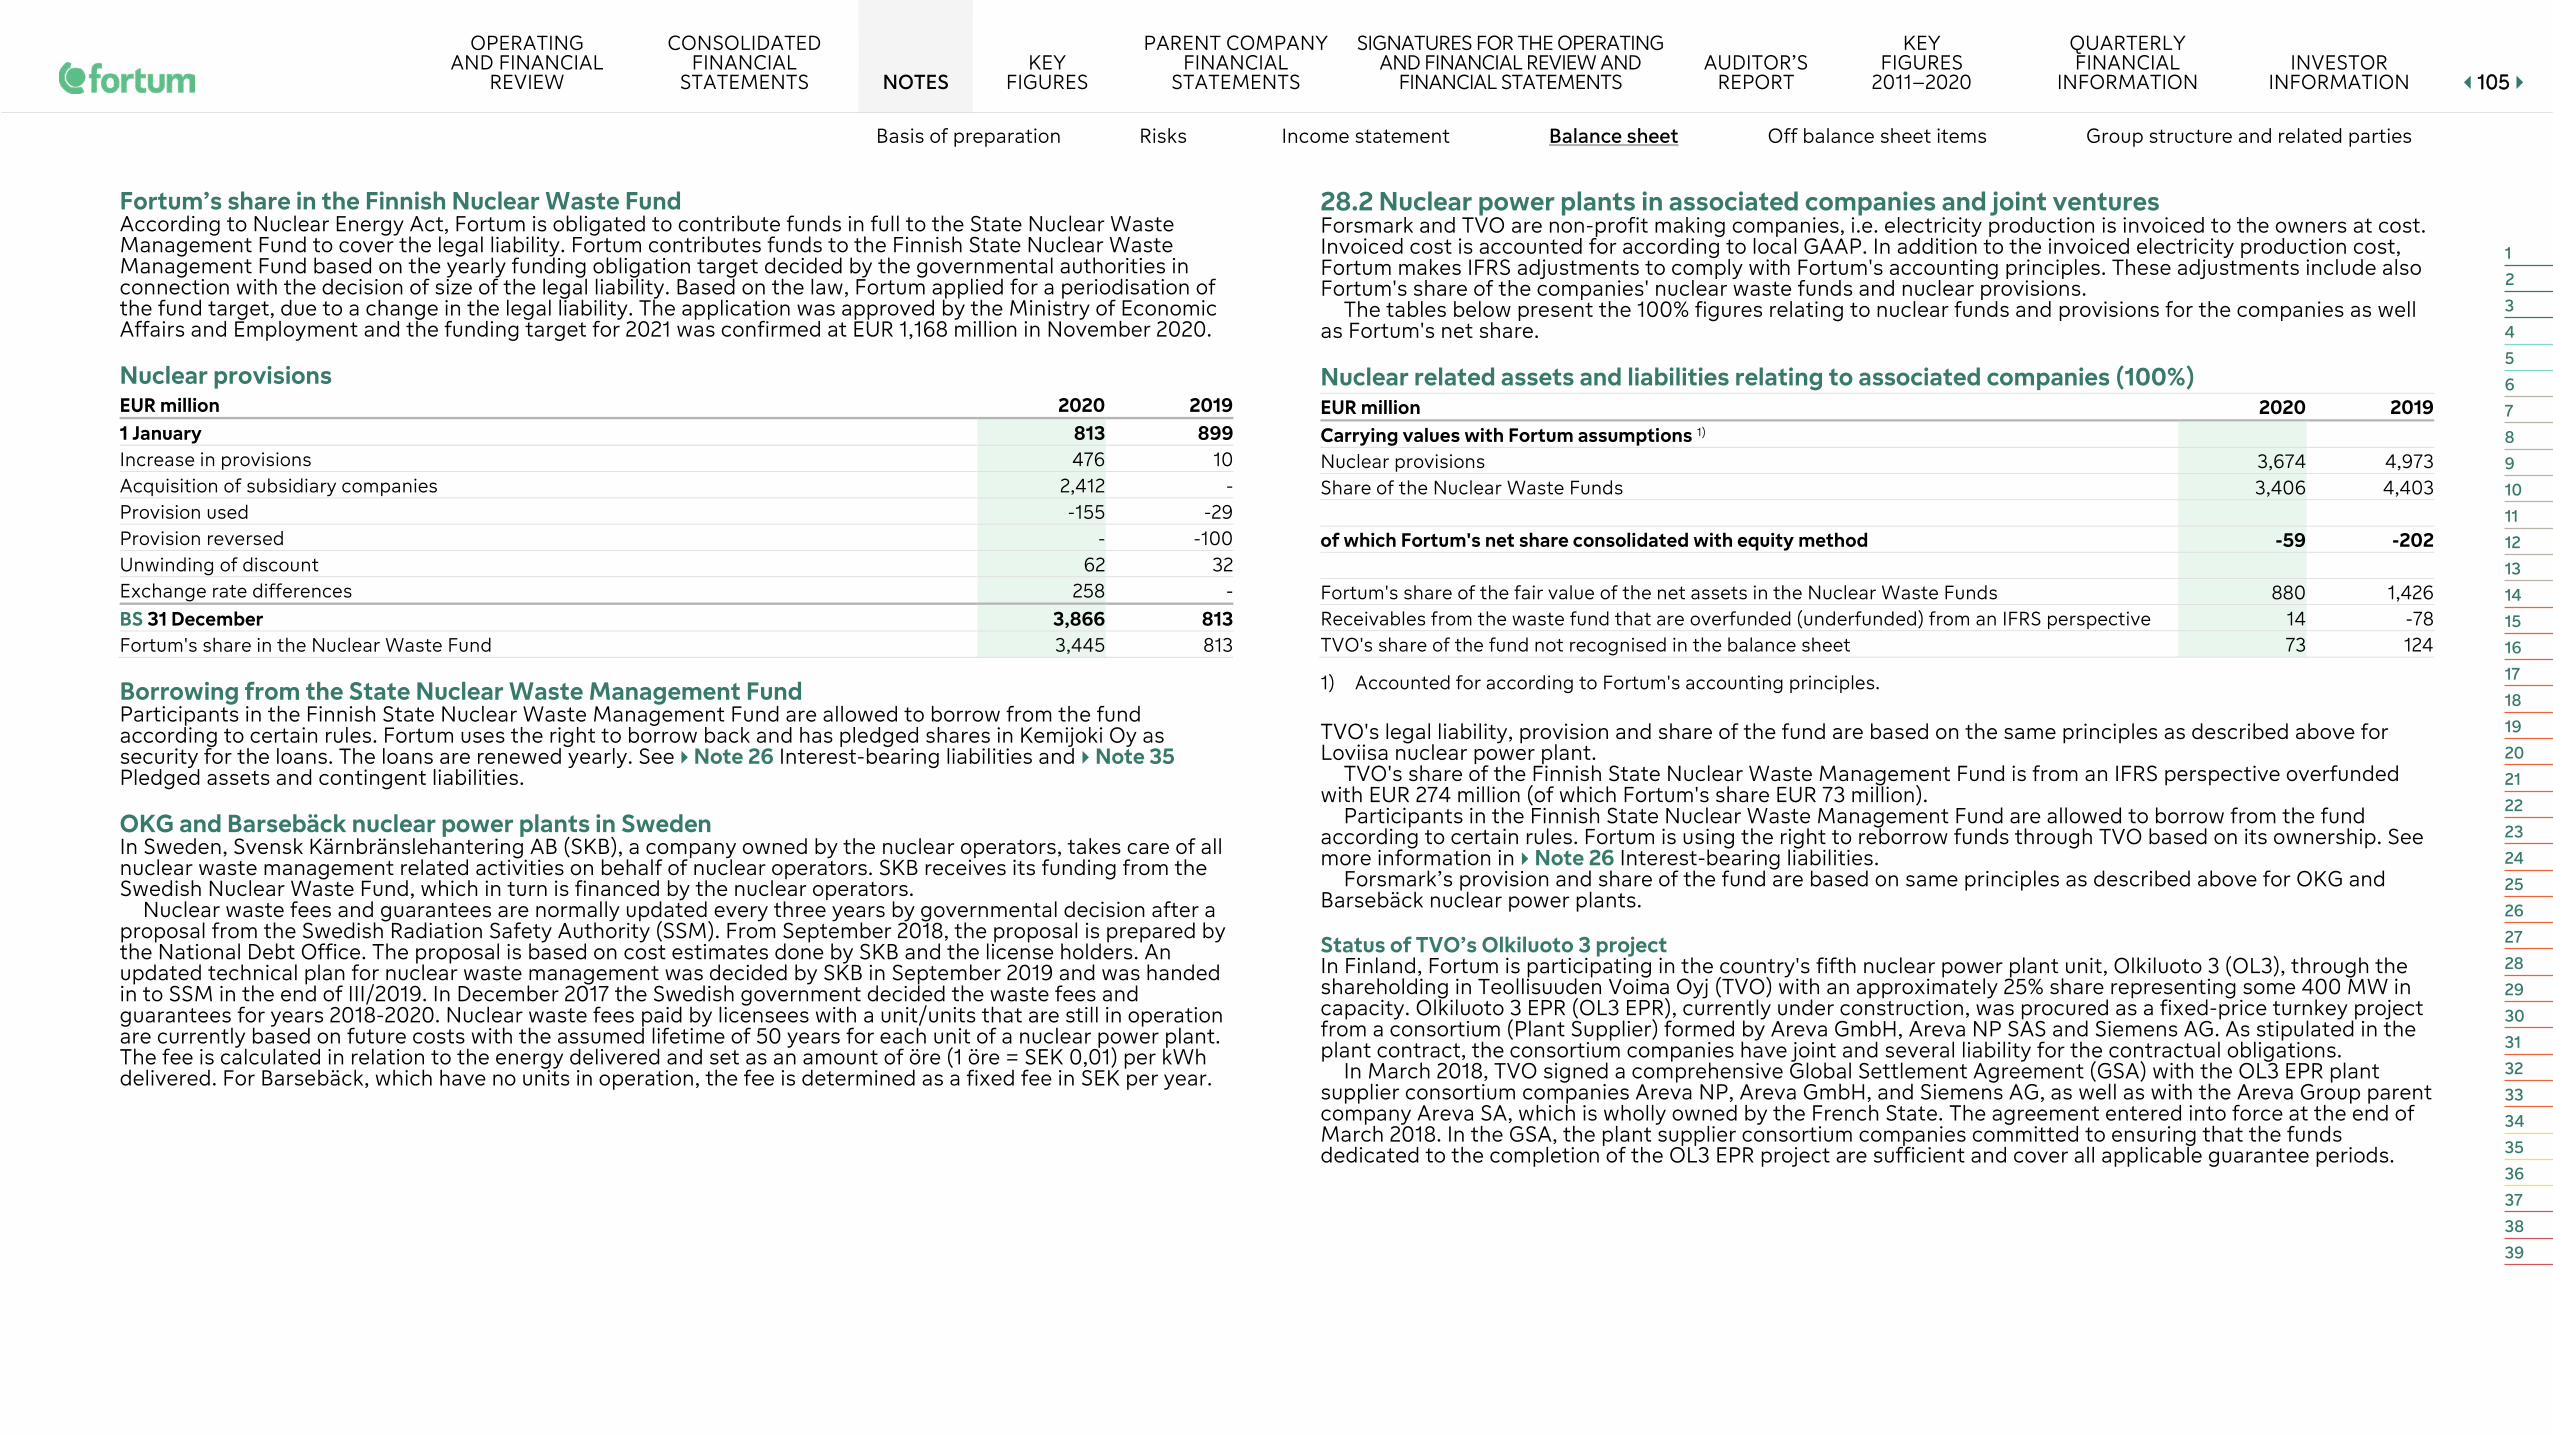
OPERATING AND FINANCIAL
REVIEW
CONSOLIDATED FINANCIAL
STATEMENTS NOTES KEY
FIGURES
PARENT COMPANY FINANCIAL
STATEMENTS
SIGNATURES FOR THE OPERATING AND FINANCIAL REVIEW AND
FINANCIAL STATEMENTS AUDITOR’S
REPORT
KEY FIGURES
2011–2020
QUARTERLY FINANCIAL
INFORMATION INVESTOR
INFORMATION 110055
Basis of preparation Risks Income statement Balance sheet Off balance sheet items Group structure and related parties
Fortum’s share in the Finnish Nuclear Waste Fund According to Nuclear Energy Act, Fortum is obligated to contribute funds in full to the State Nuclear Waste Management Fund to cover the legal liability. Fortum contributes funds to the Finnish State Nuclear Waste Management Fund based on the yearly funding obligation target decided by the governmental authorities in connection with the decision of size of the legal liability. Based on the law, Fortum applied for a periodisation of the fund target, due to a change in the legal liability. The application was approved by the Ministry of Economic Affairs and Employment and the funding target for 2021 was confirmed at EUR 1,168 million in November 2020.
Nuclear provisions EUR million 2020 2019 1 January 813 899 Increase in provisions 476 10 Acquisition of subsidiary companies 2,412 - Provision used -155 -29 Provision reversed - -100 Unwinding of discount 62 32 Exchange rate differences 258 - BS 31 December 3,866 813 Fortum's share in the Nuclear Waste Fund 3,445 813
Borrowing from the State Nuclear Waste Management Fund Participants in the Finnish State Nuclear Waste Management Fund are allowed to borrow from the fund according to certain rules. Fortum uses the right to borrow back and has pledged shares in Kemijoki Oy as security for the loans. The loans are renewed yearly. See Note 26 Interest-bearing liabilities and Note 35 Pledged assets and contingent liabilities.
OKG and Barsebäck nuclear power plants in Sweden In Sweden, Svensk Kärnbränslehantering AB (SKB), a company owned by the nuclear operators, takes care of all nuclear waste management related activities on behalf of nuclear operators. SKB receives its funding from the Swedish Nuclear Waste Fund, which in turn is financed by the nuclear operators.
Nuclear waste fees and guarantees are normally updated every three years by governmental decision after a proposal from the Swedish Radiation Safety Authority (SSM). From September 2018, the proposal is prepared by the National Debt Office. The proposal is based on cost estimates done by SKB and the license holders. An updated technical plan for nuclear waste management was decided by SKB in September 2019 and was handed in to SSM in the end of III/2019. In December 2017 the Swedish government decided the waste fees and guarantees for years 2018-2020. Nuclear waste fees paid by licensees with a unit/units that are still in operation are currently based on future costs with the assumed lifetime of 50 years for each unit of a nuclear power plant. The fee is calculated in relation to the energy delivered and set as an amount of öre (1 öre = SEK 0,01) per kWh delivered. For Barsebäck, which have no units in operation, the fee is determined as a fixed fee in SEK per year.
28.2 Nuclear power plants in associated companies and joint ventures Forsmark and TVO are non-profit making companies, i.e. electricity production is invoiced to the owners at cost. Invoiced cost is accounted for according to local GAAP. In addition to the invoiced electricity production cost, Fortum makes IFRS adjustments to comply with Fortum's accounting principles. These adjustments include also Fortum's share of the companies' nuclear waste funds and nuclear provisions.
The tables below present the 100% figures relating to nuclear funds and provisions for the companies as well as Fortum's net share.
Nuclear related assets and liabilities relating to associated companies (100%) EUR million 2020 2019 Carrying values with Fortum assumptions 1) Nuclear provisions 3,674 4,973 Share of the Nuclear Waste Funds 3,406 4,403 of which Fortum's net share consolidated with equity method -59 -202 Fortum's share of the fair value of the net assets in the Nuclear Waste Funds 880 1,426 Receivables from the waste fund that are overfunded (underfunded) from an IFRS perspective 14 -78 TVO's share of the fund not recognised in the balance sheet 73 124
1) Accounted for according to Fortum's accounting principles.
TVO's legal liability, provision and share of the fund are based on the same principles as described above for Loviisa nuclear power plant.
TVO's share of the Finnish State Nuclear Waste Management Fund is from an IFRS perspective overfunded with EUR 274 million (of which Fortum's share EUR 73 million).
Participants in the Finnish State Nuclear Waste Management Fund are allowed to borrow from the fund according to certain rules. Fortum is using the right to reborrow funds through TVO based on its ownership. See more information in Note 26 Interest-bearing liabilities.
Forsmark’s provision and share of the fund are based on same principles as described above for OKG and Barsebäck nuclear power plants.
Status of TVO’s Olkiluoto 3 project In Finland, Fortum is participating in the country's fifth nuclear power plant unit, Olkiluoto 3 (OL3), through the shareholding in Teollisuuden Voima Oyj (TVO) with an approximately 25% share representing some 400 MW in capacity. Olkiluoto 3 EPR (OL3 EPR), currently under construction, was procured as a fixed-price turnkey project from a consortium (Plant Supplier) formed by Areva GmbH, Areva NP SAS and Siemens AG. As stipulated in the plant contract, the consortium companies have joint and several liability for the contractual obligations.
In March 2018, TVO signed a comprehensive Global Settlement Agreement (GSA) with the OL3 EPR plant supplier consortium companies Areva NP, Areva GmbH, and Siemens AG, as well as with the Areva Group parent company Areva SA, which is wholly owned by the French State. The agreement entered into force at the end of March 2018. In the GSA, the plant supplier consortium companies committed to ensuring that the funds dedicated to the completion of the OL3 EPR project are sufficient and cover all applicable guarantee periods.
1
2
3
4
5
6
7
8
9
10
11
12
13
14
15
16
17
18
19
20
21
22
23
24
25
26
27
28
29
30
31
32
33
34
35
36
37
38
39

OPERATING AND FINANCIAL
REVIEW
CONSOLIDATED FINANCIAL
STATEMENTS NOTES KEY
FIGURES
PARENT COMPANY FINANCIAL
STATEMENTS
SIGNATURES FOR THE OPERATING AND FINANCIAL REVIEW AND
FINANCIAL STATEMENTS AUDITOR’S
REPORT
KEY FIGURES
2011–2020
QUARTERLY FINANCIAL
INFORMATION INVESTOR
INFORMATION 110066
Basis of preparation Risks Income statement Balance sheet Off balance sheet items Group structure and related parties
Consequently, a trust mechanism was set up funded by Areva companies to secure the funds required to cover Areva's costs for the completion of the OL3 EPR project. During the period under review the trust has been replenished in accordance with the terms of the agreement. During the accounting period, TVO has recognised receivables from the Plant Supplier amounted to the accumulated compensation until the end of the accounting period in accordance with the GSA. The EUR 240 million compensation decreases the historical costs of property, plant, and equipment on the balance sheet.
The Finnish Government granted an operating license for the plant unit in March 2019. TVO submitted on 8 April 2020 a permission application to STUK for nuclear fuel loading of the OL3 EPR nuclear power plant unit.
TVO issued on 28 August 2020 a stock exchange release stating that TVO has received an updated re-baseline schedule on the commissioning of the OL3 EPR plant unit from the supplier Areva–Siemens consortium. According to the schedule, fuel will be loaded into the reactor in March 2021, the unit will be connected to the grid in October of the same year, and regular electricity production starts in February 2022. The new Areva management, appointed in the summer of 2020, is preparing a financial solution to finalise the project until the end of the guarantee period. TVO continues negotiations with the Areva–Siemens consortium on the terms for project completion. Nuclear related guarantees In addition to nuclear waste fees nuclear power companies provide guarantees for any uncovered liability and unexpected events.
For more information regarding Fortum's guarantees given on behalf of nuclear companies, see Note 35 Pledged assets and contingent liabilities.
29 Other provisions ACCOUNTING POLICIES Provisions are recognised when the Group has a present legal or constructive obligation as a result of past events to a third party, it is probable that an outflow of resources will be required to settle the obligation and the amount can be reliably estimated.
Provisions are measured at the present value of the expenditures expected to be required to settle the obligation at the reporting date using a discount rate that reflects current market assessment of the time value of money. When risk is not covered in the estimated cash flows, the discount rate also includes the risks specific to the obligation.
Increase in the provision due to the passage of time, and changes in provisions due to changes discount rates are recognised as interest expense in the consolidated income statement. Changes in provisions, except for changes in asset retirement obligations, are recognised in the consolidated income statement.
ASSET RETIREMENT OBLIGATIONS Asset retirement obligations for the decommissioning or dismantling of property, plant and equipment are recognised either when there is a contractual obligation towards a third party, or a legal obligation. The obligation is generally based on detailed cost estimates validated by external experts.
The asset retirement obligation is recognised as part of the cost of an item of property, plant and equipment when the asset is put in service. Costs are depreciated over the remainder of the asset's useful life. Changes in asset retirement obligations are recognised in property, plant and equipment on the consolidated balance sheet; unless the item of property, plant and equipment has already been fully depreciated when changes are recognised in the consolidated income statement.
ONEROUS CONTRACT PROVISIONS An onerous contract provision is recognised for a contract under which the unavoidable costs of meeting the obligations under the contract exceed the economic benefits expected to be received under it. Unavoidable costs is the lower of the excess obligation from the performance under the contract, and any potential penalties or compensation arising in the event of non-performance.
ENVIRONMENTAL PROVISIONS Environmental provisions are recognised based on the current interpretation of environmental laws and regulations when it is probable that a present obligation has arisen, and the amount of such liability can be reliably estimated. The obligation is generally based on detailed cost estimates validated by external experts.
1
2
3
4
5
6
7
8
9
10
11
12
13
14
15
16
17
18
19
20
21
22
23
24
25
26
27
28
29
30
31
32
33
34
35
36
37
38
39

OPERATING AND FINANCIAL
REVIEW
CONSOLIDATED FINANCIAL
STATEMENTS NOTES KEY
FIGURES
PARENT COMPANY FINANCIAL
STATEMENTS
SIGNATURES FOR THE OPERATING AND FINANCIAL REVIEW AND
FINANCIAL STATEMENTS AUDITOR’S
REPORT
KEY FIGURES
2011–2020
QUARTERLY FINANCIAL
INFORMATION INVESTOR
INFORMATION 110077
Basis of preparation Risks Income statement Balance sheet Off balance sheet items Group structure and related parties
CRITICAL ACCOUNTING ESTIMATES AND JUDGEMENTS: ASSUMPTIONS MADE WHEN ESTIMATING PROVISIONS Provisions for present obligations require management judgment in determining whether it is probable that an outflow of economic benefits will be required to settle the obligation. Estimation is required in determining the value of the obligation as the amount recognised as a provision is based on the best estimate of unavoidable costs required to settle the obligation at the end of the reporting period. When estimating unavoidable costs, management may be required to consider a range of possible outcomes and their associated probabilities, risks and uncertainties surrounding the events and circumstances as well as making assumptions of the timing of payment. Estimation is also required in determining the rate used to discount provisions to present value. Changes in estimates of timing or amounts of costs required to settle the obligation may become necessary as time passes and/or more accurate information becomes available.
EUR million
Supplier- and customer-
related Asset
retirement Power production-
related Gas distribution-
related Environmental
remediation and similar Personnel-related Other Total 1 January 2020 - 20 - - 49 - 32 101 Acquisition of subsidiary companies 861 757 630 402 207 298 780 3,935 Increase in provisions 300 44 14 14 23 22 176 593 Provisions used -178 - - -3 -10 -6 -57 -254 Unused provisions reversed -34 - - -37 -8 -66 -33 -178 Exchange rate differences and other changes -1 -3 -1 2 - -1 13 10 Unwinding of discounting - 3 - - - - 22 25 31 December 2020 948 821 643 378 261 247 933 4,232 BS Of which current provisions 322 26 - 81 13 70 268 780 BS Of which non-current provisions 626 795 643 297 248 177 665 3,452
Provisions for asset retirement obligations consist of obligations for conventional and renewable energy power plants, including the conventional plant components in the nuclear power segment, that are based on legally binding civil agreements and public regulations; as well as provisions for environmental improvements at gas storage facilities. The majority of the provision is estimated to be used within 46 years.
Provisions for supplier- and customer-related obligations include EUR 0.5 billion (2019: 0) of onerous contract provisions for long-term infrastructure purchase contracts used in the gas storage business. See Note 34 Capital and other commitments.
Power production-related provisions consist mainly of provisions from the hydroelectric power business. The majority of the provision is estimated to be used within 62 years. Gas distribution-related provisions consist mainly of onerous contract provisions for gas transportation and regasification. The majority of the provision is estimated to be used within 6 years. Environmental provisions mainly include provisions for redevelopment and water protection measures, the rehabilitation of contaminated sites, and other environmental improvement measures. The majority of the provision is
estimated to be used within 23 years. Personnel-related provisions mainly include provisions for performance-based compensation components, long-service bonus obligations, in-kind obligations, restructuring and other deferred personnel costs. The majority of the
provision is estimated to be used within 42 years. Other includes EUR 0.3 billion (2019: 0) provisions for risk-related contingencies, as well as a number of individually immaterial items. Other provisions included EUR 3,935 million from the acquisition of Uniper on 31 March 2020. See Note 3 Acquisitions, disposals and assets held for sale. For provisions for decommissioning, and provision for disposal of spent fuel for nuclear production, see Note 28 Nuclear related assets and liabilities.
1
2
3
4
5
6
7
8
9
10
11
12
13
14
15
16
17
18
19
20
21
22
23
24
25
26
27
28
29
30
31
32
33
34
35
36
37
38
39

OPERATING AND FINANCIAL
REVIEW
CONSOLIDATED FINANCIAL
STATEMENTS NOTES KEY
FIGURES
PARENT COMPANY FINANCIAL
STATEMENTS
SIGNATURES FOR THE OPERATING AND FINANCIAL REVIEW AND
FINANCIAL STATEMENTS AUDITOR’S
REPORT
KEY FIGURES
2011–2020
QUARTERLY FINANCIAL
INFORMATION INVESTOR
INFORMATION 110088
Basis of preparation Risks Income statement Balance sheet Off balance sheet items Group structure and related parties
30 Pension obligations ACCOUNTING POLICIES The Group companies have various pension schemes in accordance with the local conditions and practices in the countries in which they operate. The schemes are generally funded through various pension vehicles including payments to insurance companies, Group’s pension funds and other separate arrangements. The Group has both defined benefit and defined contribution plans.
For defined benefit plans, pension costs are assessed using the projected unit credit method. The cost of providing pensions is charged to the income statement as to spread the service cost over the service lives of employees. Current and past service cost, as well as gains or losses from settlements are reported under personnel costs. The net interest is reported in financial items.
The defined benefit obligation is calculated annually on the balance sheet date and is measured as the present value of the estimated future cash flows using interest rates of high-quality corporate bonds, or similar, that have terms to maturity approximating to the terms of the related pension liability. The plan assets for pensions are valued at market value. The net liability recognised on the balance sheet is the defined benefit obligation at the closing date less the fair value of plan assets.
Any net asset position that might arise from offsetting the present value of the defined benefit obligations against the corresponding fair value of plan assets is recognised taking into account the applicable asset restrictions. Such an asset position is reported in Other non-current assets on the balance sheet.
In the case of a plan amendment, curtailment or settlement (each a "plan event") occurring in a defined benefit plan during an annual reporting period, the current service cost and the net interest on the net liability or asset are remeasured for the remainder of the reporting period after the plan event. The actuarial assumptions applicable as of the date of the plan event is be used as the basis for such remeasurement. When the benefits of a plan are changed, or when a plan is curtailed, the resulting change in the present value of the defined benefit obligation that relates to past service, or the gain or loss related to a curtailment is recognised immediately in profit or loss. Gains or losses on settlements of defined benefit plans are recognised when the settlement occurs. Remeasurements of the net defined benefit liability or asset include actuarial gains and losses that may arise especially from differences between estimated and actual variations in underlying assumptions about demographic and financial variables; and, additionally, from developments in these assumptions as of each reporting date. Additionally included is the difference between the actual return on plan assets and the interest income on plan assets contained in the net interest result, as well as any change in the effect of the asset ceiling, excluding amounts already included in net interest. Remeasurement results and related deferred taxes are recognised in full in the period in which they occur and are reported in the statement of comprehensive income.
The Group's contributions to defined contribution plans are charged to the income statement in the period to which the contributions relate.
CRITICAL ACCOUNTING ESTIMATES AND JUDGEMENTS: ASSUMPTIONS USED TO DETERMINE FUTURE PENSION OBLIGATIONS The present value of the pension obligations is based on actuarial calculations that use several assumptions. Any changes in these assumptions will impact the carrying amount of pension obligations.
Fortum’s pension arrangements
Finland The statutory pension benefits (as determined in Employee’s Pension Act /TyEL) in Finland provide the employees pension coverage for old age, disability and death of a family provider. The benefits are insured with an insurance company, and determined to be defined contribution plans.
In addition the Group has historical old-age and survivor pension benefits with the Fortum Pension Fund covering a limited number of people. The Fortum Pension Fund is a closed fund managed by a Board, consisting of both employers' and employees' representatives. The promised benefit is defined in the rules of the Fund, mostly at a maximum of 66% of the salary basis. The salary basis is an average of the ten last years' salaries, which are indexed by a common salary index to the accounting year. After retirement the benefits payable are indexed yearly with the TyEL-index.
The Fund is operating under the regulation from the Financial Supervisory Authority (FSA). The liability has to be fully covered according to the regulations. The national benefit obligation related to the defined benefit plans is calculated so that the promised benefit is fully funded until retirement.
Germany The majority of active and former employees are covered by occupational benefit plans in addition to the state retirement benefits. The benefits offered under these plans primarily include retirement, disability and survivor benefits.
The majority of the reported pension obligation for the active employees arises from the ”BAS Plan” and from the ”Zukunftssicherung” plan, that have been closed to the new hires since 2008. The only plan open to new hires is a defined contribution-oriented benefit plan, which is based on “units of capital”.
The benefit expense for all these plans is dependent on compensation, and is determined at different percentage rates based on the ratio between compensation and the contribution limit in the statutory retirement pension system. The plans contain different interest rate assumptions. Up to, and including 31 December 2018, fixed interest rate assumptions had applied for both the “BAS-Plan” and the “Zukunftssicherung” plan. From 1 January 2019, the pension units established have earned interest at a rate that is linked to market rates and hedged by applying guaranteed minimum interest rates and a maximum of 6.0% per year. Pension units granted through 31 December 2018 remain unchanged by this adjusted interest calculation. The units of capital established under the open defined contribution-oriented benefit plan earn interest at the average yield of long-term government bonds of the Federal Republic of Germany observed in the fiscal year.
Future pension increases at a rate of 1% per year are guaranteed for certain individuals including a large number of active employees. For the remaining eligible individuals, pensions are adjusted mostly in line with the rate of inflation, usually in a three-year cycle.
Pension plans are funded through designated pension vehicles that are legally distinct from the company. In addition, plan assets are funded in form of “Pensionskassen” and a Group-wide pension fund as well as in the form of a Contractual Trust Arrangement (CTA).
United Kingdom The Group operates three pension plans in the United Kingdom, one defined contribution plan and two defined benefit plans. The defined benefit plans were closed for new hires from 2005 and 2008, respectively. Since the closure of these plans, new hires have been joining the open defined contribution plan.
Benefit payments under the existing defined benefit pension plans are adjusted for inflation as measured by the United Kingdom Retail Price Index (“RPI”) through specified increases (limited to a fixed maximum amount).
Plan assets are administered by a trust which is independent from the group.
1
2
3
4
5
6
7
8
9
10
11
12
13
14
15
16
17
18
19
20
21
22
23
24
25
26
27
28
29
30
31
32
33
34
35
36
37
38
39

OPERATING AND FINANCIAL
REVIEW
CONSOLIDATED FINANCIAL
STATEMENTS NOTES KEY
FIGURES
PARENT COMPANY FINANCIAL
STATEMENTS
SIGNATURES FOR THE OPERATING AND FINANCIAL REVIEW AND
FINANCIAL STATEMENTS AUDITOR’S
REPORT
KEY FIGURES
2011–2020
QUARTERLY FINANCIAL
INFORMATION INVESTOR
INFORMATION 110099
Basis of preparation Risks Income statement Balance sheet Off balance sheet items Group structure and related parties
The Pension Regulator in the United Kingdom requires a valuation of the funding of pension plans in the United Kingdom to be performed at least once every three years. The last valuation on 31 March 2019 showed a technical funding deficit of GBP 26 million (EUR 30 million) for which a deficit repair plan has been agreed.
Main risks relating to defined benefit plans Typical risk factors for defined benefit plans are changes in discount rates, risks related to other actuarial assumptions, as well as investment and volatility risks. Change in discount rate The discount rate used to calculate the defined benefit obligation (according to IFRS) depends on the value of corporate bond yields as at the reporting date. A decrease in yields increases the benefit obligation that is often only partially offset by an increase in the value of fixed income holdings.
Risk related to other actuarial assumptions Assumptions for future inflation, salary levels and mortality are used for actuarial calculations. Should the actual outcome differ from these assumptions, the liability may increase.
Investment and volatility risk Pension plan assets are allocated to different asset classes based on the statutory legislation or investment strategy of the corresponding pension plan. Depending on the pension plan, underlying investment management plans are updated on a regular basis. If the return of the fund’s assets is not enough to cover the raise in liability and benefit payments over the financial year, then, in certain legislations, the employer has to fund the deficit with contributions, unless the fund has sufficient covering.
Movement in the net defined benefit liability
Defined benefit
obligation Fair value
of plan assets Net defined benefit asset(-)/liability(+)
EUR million 2020 2019 2020 2019 2020 2019 1 January 529 483 -406 -386 123 97 Included in consolidated income statement Current service cost 52 6 - - 53 6 Past service cost 11 -1 - - 11 -1 Net interest 1) 50 10 -36 -7 14 2 112 14 -35 -6 77 7 Included in OCI Remeasurement gains(-)/losses(+) 820 50 -366 -26 454 25 Actuarial gains/losses arising from changes in financial assumptions 835 52 - - 835 52 Actuarial gains/losses arising from experience adjustments -16 -2 - - -16 -2 Return on plan assets (excluding amounts included in net interest expense) - - -366 -26 -366 -26 Exchange rate differences -9 -2 8 1 -1 - 811 49 -358 -24 453 24 Other Contributions paid by the employer - - -59 -2 -59 -2 Benefits paid -66 -17 61 13 -5 -4 Acquisitions of subsidiary companies 3,288 - -2,343 - 944 - Transfer to assets held for sale -38 - 22 - -15 - 31 December 4,636 529 -3,117 -406 1,518 123 Present value of funded defined obligation 4,600 524 Fair value of plan assets -3,117 -406 Funded status 1,483 119 Present value of unfunded obligation 2) 35 5 Net liability arising from defined benefit obligation 1,518 123 Pension assets included in other non-current assets on the balance sheet 2 2 BS Pension obligations on the balance sheet 1,520 125
1) Net interest is presented in financial items in the income statement, the rest of costs related to defined benefit plans are included in staff costs (row defined benefits plans in the staff cost specification in Note 10 Employee benefits and Board remuneration).
2) The unfunded obligation mainly relates to Germany.
Pension obligations included EUR 953 million from the acquisition of Uniper at 31 March 2020, mainly relating to pension obligations in Germany.
Contributions expected to be paid during 2021 total EUR 59 million.
1
2
3
4
5
6
7
8
9
10
11
12
13
14
15
16
17
18
19
20
21
22
23
24
25
26
27
28
29
30
31
32
33
34
35
36
37
38
39

OPERATING AND FINANCIAL
REVIEW
CONSOLIDATED FINANCIAL
STATEMENTS NOTES KEY
FIGURES
PARENT COMPANY FINANCIAL
STATEMENTS
SIGNATURES FOR THE OPERATING AND FINANCIAL REVIEW AND
FINANCIAL STATEMENTS AUDITOR’S
REPORT
KEY FIGURES
2011–2020
QUARTERLY FINANCIAL
INFORMATION INVESTOR
INFORMATION 111100
Basis of preparation Risks Income statement Balance sheet Off balance sheet items Group structure and related parties
Fair value of plan assets 2020 2019 EUR million Quoted Unquoted Total Quoted Unquoted Total Equity instruments 972 177 1,149 145 8 152 Debt instruments 947 174 1,120 69 105 174 Cash and cash equivalents - 156 156 - 47 47 Real estate - 228 228 - 14 14 Investment funds 105 - 105 2 - 2 Other assets - 359 359 - 16 16 Total 22,,002233 11,,009944 33,,111177 216 190 406 A specification of plan assets has not been available for pension plans financed through an insurance company. In these cases, the fair value of plan assets has been included in other assets.
Plan assets in the United Kingdom are invested in investment funds ("pooled funds") that are not listed in an active market.
Derivatives used to hedge the risks have been allocated to the respective asset classes. The actual return on plan assets totalled EUR 405 million (2019: 32).
Amounts recognised on the balance sheet by country 2020
EUR million
Finland Germany United
Kingdom Other
countries Total Present value of funded obligations 294 3,396 655 256 4,600 Fair value of plan assets -242 -2,074 -642 -159 -3,117 Deficit(+)/surplus(-) 51 1,322 12 98 1,483 Present value of unfunded obligations - 28 - 7 35 Net asset(-)/liability(+) on the balance sheet 51 1,350 12 105 1,518 Pension asset included in non-current assets - - - 2 2 BS Pension obligations on the balance sheet 51 1,350 12 106 1,520
Amounts recognised on the balance sheet by country 2019
EUR million Finland Germany United
Kingdom Other
countries Total Present value of funded obligations 283 - - 241 524 Fair value of plan assets -244 - - -162 -406 Deficit(+)/surplus(-) 39 - - 80 119 Present value of unfunded obligations - - - 5 5 Net asset(-)/liability(+) on the balance sheet 39 - - 84 123 Pension asset included in non-current assets - - - 2 2 BS Pension obligations on the balance sheet 39 - - 85 125
The principal actuarial assumptions used 2020 2019
% Finland Germany United
Kingdom Finland Germany United
Kingdom Discount rate 0.30 0.80 1.50 0.80 - - Future salary increases 1.50 2.30 2.60 1.60 - - Future pension increases 1.60 1.80 2.70 1.60 - - Rate of inflation 1.30 1.80 2.80 1.30 - - The discount rate in Finland is based on high quality European corporate bonds with maturity that best reflects the estimated term of the defined benefit pension plans. The discount rate in Germany is based on the returns on high-quality EURO corporate bonds available at the end of the respective fiscal year, and take into account the average duration of the respective underlying benefit obligations. The United Kingdom discount rate is based on currency-specific returns on high-quality corporate bonds available at the end of the respective fiscal year and takes into account the average duration of the respective underlying obligations.
The discount, inflation, salary growth and pension growth rates, as well as mortality are the key assumptions when calculating defined benefit obligations. Changes in the key actuarial assumptions would lead to the following changes in the present value of the defined benefit obligations:
Sensitivity of defined benefit obligation to changes in assumptions
Impact to the pension obligation
increase(+)/decrease(-) Change in the assumption 0.5% increase in discount rate -9.6% 0.5% decrease in discount rate 11.2% 0.5% increase in benefit 3.2% 0.5% decrease in benefit -2.8% 0.5% increase in salary growth rate 1.0% 0.5% decrease in salary growth rate -0.9% 10% increase in mortality -3.0% 10% decrease in mortality 3.3% A 10% decrease in mortality would result in higher life expectancy of beneficiaries, depending of the age of each individual beneficiary. At the end of 2020, the life expectancy of a 63-year-old male retiree would increase by approximately one year, if mortality were to decrease by 10%.
1
2
3
4
5
6
7
8
9
10
11
12
13
14
15
16
17
18
19
20
21
22
23
24
25
26
27
28
29
30
31
32
33
34
35
36
37
38
39

OPERATING AND FINANCIAL
REVIEW
CONSOLIDATED FINANCIAL
STATEMENTS NOTES KEY
FIGURES
PARENT COMPANY FINANCIAL
STATEMENTS
SIGNATURES FOR THE OPERATING AND FINANCIAL REVIEW AND
FINANCIAL STATEMENTS AUDITOR’S
REPORT
KEY FIGURES
2011–2020
QUARTERLY FINANCIAL
INFORMATION INVESTOR
INFORMATION 111111
Basis of preparation Risks Income statement Balance sheet Off balance sheet items Group structure and related parties
The sensitivities indicated are computed based on the same methods and assumptions used to determine the present value of the defined benefit obligations. If one of the actuarial assumptions is changed for the purpose of computing the sensitivity of results to changes in that assumption, all other actuarial assumptions are included in the computation unchanged. Potential correlation effects between the individual actuarial assumptions are not taken into account when computing sensitivities. When considering sensitivities, it must be noted that the change in the present value of the defined benefit obligations resulting from changing multiple actuarial assumptions simultaneously is not necessarily equivalent to the cumulative effect of the individual sensitivities.
Maturity profile of the undiscounted defined benefit obligation on 31 December 2020
EUR million Future benefit
payments Maturity under 1 year 92 Maturity between 1 and 5 years 405 Maturity between 5 and 10 years 621 Maturity between 10 and 20 years 1,490 Maturity between 20 and 30 years 1,397 Maturity over 30 years 1,571 The weighted average duration of defined benefit obligation at 31 December 2020 is 22 years.
31 Other non-current liabilities EUR million 2020 2019 Contract liabilities 101 - Connection fees 71 85 Other 172 82 BS Total 344 167
Connection fees include refundable fees paid by the customer when connected to district heating network in Finland. Connection fees were refundable until 2013. Other non-current liabilities included EUR 267 million from the acquisition of Uniper on 31 March 2020. See Note 3 Acquisitions, disposals and assets held for sale.
32 Trade and other payables EUR million 2020 2019 Trade payables 7,126 316 Accrued expenses and deferred income
Accrued personnel expenses 218 97 Accrued interest expenses 85 80 Contract liabilities 557 31 Other accrued expenses and deferred income 215 42
Other liabilities VAT liability 32 54 Current tax liability 307 64 Advances received 13 46 Other 972 168
BS Total 9,525 898
Contract liabilities comprise mainly of project and waste management services that are invoiced but not delivered at the reporting date. Other accrued expenses and deferred income includes the liability of EUR 27 million related to the periodisation of the Finnish nuclear waste management fund target. For additional information see Note 28 Nuclear related assets and liabilities. Trade and other payables included EUR 7,852 million from the acquisition of Uniper on 31 March 2020. See Note 3 Acquisitions, disposals and assets held for sale.
The management considers that the amount of trade and other payables approximates fair value.
1
2
3
4
5
6
7
8
9
10
11
12
13
14
15
16
17
18
19
20
21
22
23
24
25
26
27
28
29
30
31
32
33
34
35
36
37
38
39

OPERATING AND FINANCIAL
REVIEW
CONSOLIDATED FINANCIAL
STATEMENTS NOTES KEY
FIGURES
PARENT COMPANY FINANCIAL
STATEMENTS
SIGNATURES FOR THE OPERATING AND FINANCIAL REVIEW AND
FINANCIAL STATEMENTS AUDITOR’S
REPORT
KEY FIGURES
2011–2020
QUARTERLY FINANCIAL
INFORMATION INVESTOR
INFORMATION 111122
Basis of preparation Risks Income statement Balance sheet Off balance sheet items Group structure and related parties
33 Leases ACCOUNTING POLICIES
LESSEE ACCOUNTING The Group leases mainly gas storage facilities, office buildings and land areas. The Group recognises all leases, with the exception of short-term (i.e. lease term less than 12 months) and low value leases as right-of-use assets with a corresponding lease liability at the date at which the leased asset is available for use by the Group.
Right-of-use assets and lease liabilities are initially recognised on the consolidated balance sheet at future fixed lease payments over the lease term. Lease payments are discounted to present value. Right-of-use assets are depreciated on a straight-line basis over the lease term, or the useful life of the leased asset if shorter; and reviewed periodically for indication of impairment.
When the future lease payments are revised due to changes in index-linked considerations or the lease term changes, the right-of-use asset and the corresponding lease liability is remeasured. Any differences arising on reassessments are recognised in the consolidated income statement.
Interest expense on lease liabilities is presented within Interest expense in the consolidated income statement. In the consolidated cash flow statement, the principal portion of the lease payment is presented under Payments of long-term liabilities, and the interest portion as Interest paid under Funds from operations. Variable lease payments, as well as costs for leases not capitalised due to exemptions in the standard, are expensed to consolidated income statement.
CRITICAL ACCOUNTING ESTIMATES AND JUDGEMENTS: ESTIMATES TO DETERMINE LEASE LIABILITY Calculation of the lease liability requires certain assumption based input factors. The main estimates are related to the lease term, the discount rate, as well as the determination whether a contract contains a lease.
In determining the lease term, management considers all facts and circumstances that create an economic incentive to exercise an extension option, or not to exercise a termination option. Extension options are only included in the lease term if the lease is reasonably certain to be extended. The lease term is reassessed if underlying circumstances are significantly changing.
Lease payments are discounted to present value using an incremental borrowing rate. The incremental borrowing rate is determined based on reasonable third party financing conditions considering the length of the lease term and the currency of cash flows.
A contract is or contains a lease if the Group has the right to control the use of an identified asset for a period of time in exchange for a consideration. A capacity portion of an asset is an identified asset if it is physically distinct, or if the Group has the right to use substantially all the capacity of the asset during the lease term.
LESSOR ACCOUNTING Leases in which the Group acts as the lessor and substantially all the risks and rewards arising from the use of the leased asset are transferred to the lessee are classified as finance leases. Finance lease receivables mainly relate to certain electricity delivery contracts.
In this type of lease, the present value of the minimum lease payments is recorded as a receivable. Interest income from such arrangements is recognised over the lease term, using the effective interest method.
1
2
3
4
5
6
7
8
9
10
11
12
13
14
15
16
17
18
19
20
21
22
23
24
25
26
27
28
29
30
31
32
33
34
35
36
37
38
39
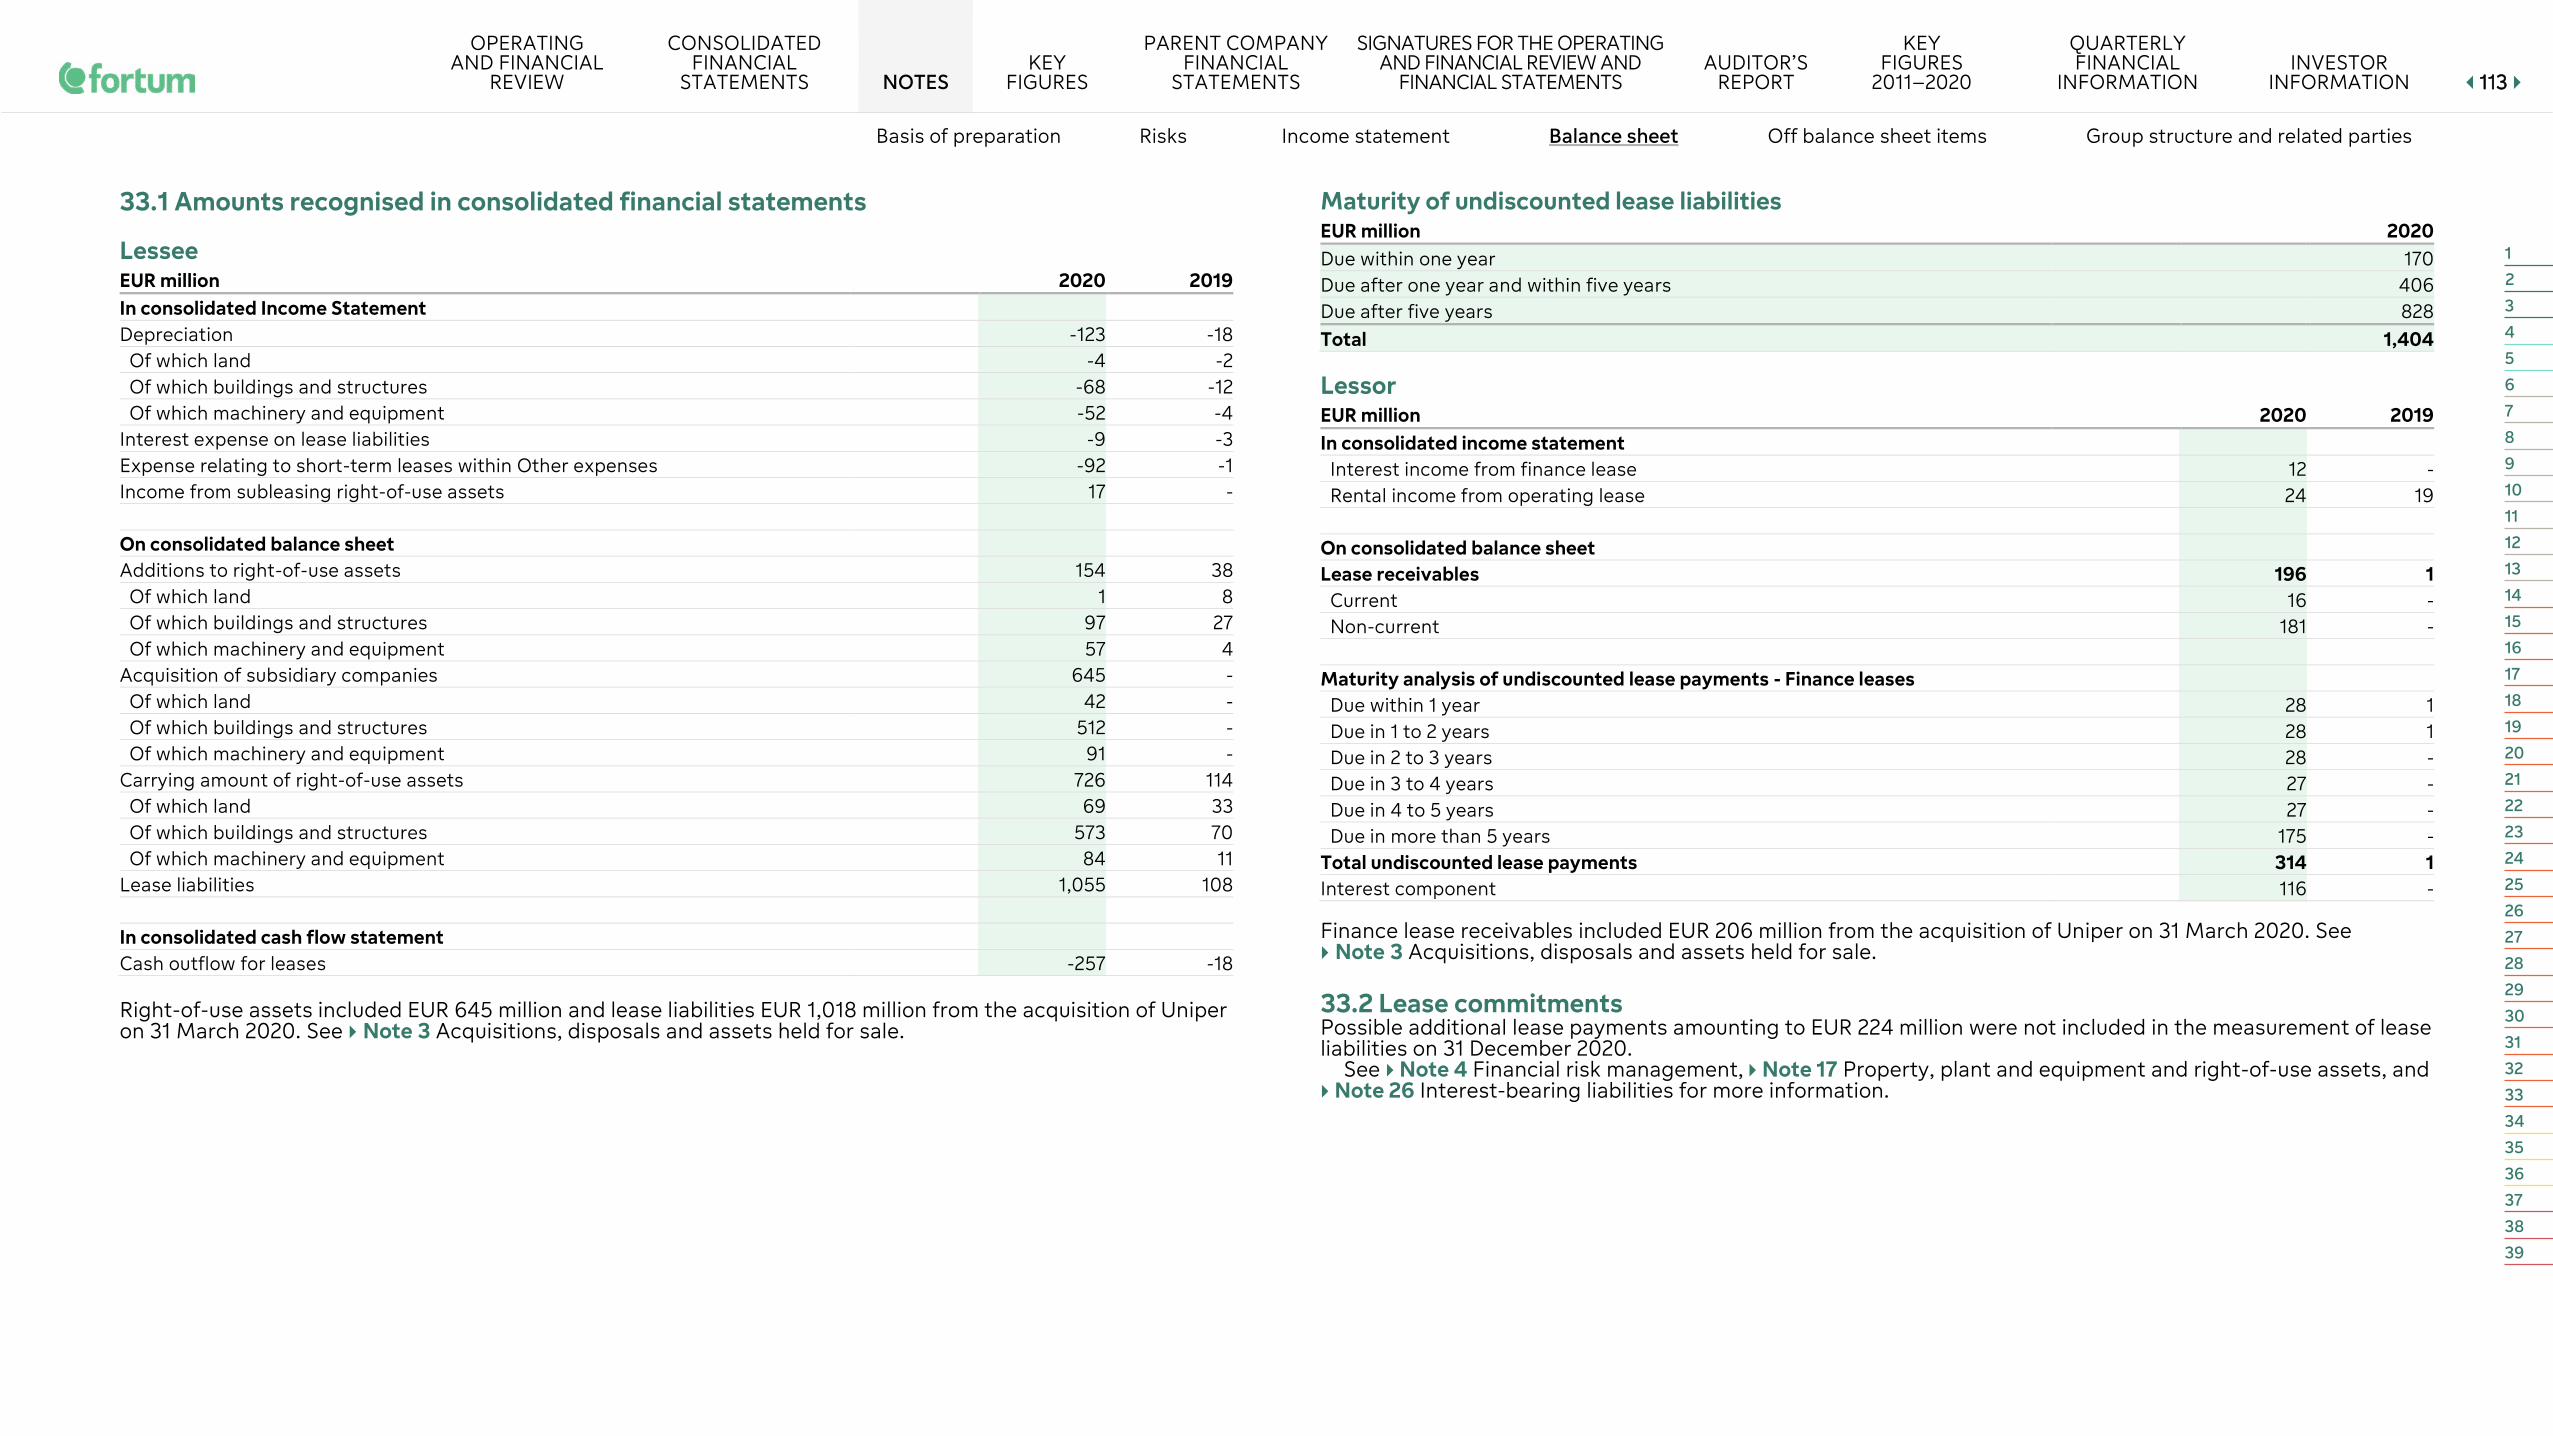
OPERATING AND FINANCIAL
REVIEW
CONSOLIDATED FINANCIAL
STATEMENTS NOTES KEY
FIGURES
PARENT COMPANY FINANCIAL
STATEMENTS
SIGNATURES FOR THE OPERATING AND FINANCIAL REVIEW AND
FINANCIAL STATEMENTS AUDITOR’S
REPORT
KEY FIGURES
2011–2020
QUARTERLY FINANCIAL
INFORMATION INVESTOR
INFORMATION 111133
Basis of preparation Risks Income statement Balance sheet Off balance sheet items Group structure and related parties
33.1 Amounts recognised in consolidated financial statements
Lessee EUR million 2020 2019 In consolidated Income Statement Depreciation -123 -18
Of which land -4 -2 Of which buildings and structures -68 -12 Of which machinery and equipment -52 -4
Interest expense on lease liabilities -9 -3 Expense relating to short-term leases within Other expenses -92 -1 Income from subleasing right-of-use assets 17 - On consolidated balance sheet Additions to right-of-use assets 154 38
Of which land 1 8 Of which buildings and structures 97 27 Of which machinery and equipment 57 4
Acquisition of subsidiary companies 645 - Of which land 42 - Of which buildings and structures 512 - Of which machinery and equipment 91 -
Carrying amount of right-of-use assets 726 114 Of which land 69 33 Of which buildings and structures 573 70 Of which machinery and equipment 84 11
Lease liabilities 1,055 108 In consolidated cash flow statement Cash outflow for leases -257 -18 Right-of-use assets included EUR 645 million and lease liabilities EUR 1,018 million from the acquisition of Uniper on 31 March 2020. See Note 3 Acquisitions, disposals and assets held for sale.
Maturity of undiscounted lease liabilities EUR million 2020 Due within one year 170 Due after one year and within five years 406 Due after five years 828 Total 1,404
Lessor EUR million 2020 2019 In consolidated income statement
Interest income from finance lease 12 - Rental income from operating lease 24 19
On consolidated balance sheet Lease receivables 196 1
Current 16 - Non-current 181 -
Maturity analysis of undiscounted lease payments - Finance leases Due within 1 year 28 1 Due in 1 to 2 years 28 1 Due in 2 to 3 years 28 - Due in 3 to 4 years 27 - Due in 4 to 5 years 27 - Due in more than 5 years 175 -
Total undiscounted lease payments 314 1 Interest component 116 - Finance lease receivables included EUR 206 million from the acquisition of Uniper on 31 March 2020. See Note 3 Acquisitions, disposals and assets held for sale.
33.2 Lease commitments Possible additional lease payments amounting to EUR 224 million were not included in the measurement of lease liabilities on 31 December 2020.
See Note 4 Financial risk management, Note 17 Property, plant and equipment and right-of-use assets, and Note 26 Interest-bearing liabilities for more information.
1
2
3
4
5
6
7
8
9
10
11
12
13
14
15
16
17
18
19
20
21
22
23
24
25
26
27
28
29
30
31
32
33
34
35
36
37
38
39

OPERATING AND FINANCIAL
REVIEW
CONSOLIDATED FINANCIAL
STATEMENTS NOTES KEY
FIGURES
PARENT COMPANY FINANCIAL
STATEMENTS
SIGNATURES FOR THE OPERATING AND FINANCIAL REVIEW AND
FINANCIAL STATEMENTS AUDITOR’S
REPORT
KEY FIGURES
2011–2020
QUARTERLY FINANCIAL
INFORMATION INVESTOR
INFORMATION 111144
Basis of preparation Risks Income statement Balance sheet Off balance sheet items Group structure and related parties
34 Capital and other commitments Capital and other commitments are contractual or regulatory obligations that are not recognised as liabilities on the consolidated balance sheet, or disclosed as contingent liabilities.
34.1 Capital commitments
EUR billion 2020 2019 Property, plant and equipment and intangible assets 0.8 0.3
Increase in capital commitments is mainly from the acquisition of Uniper (EUR 0.7 billion on 31 March 2020). Capital commitments at 31 December 2020 include Uniper segment’s commitments of EUR 0.6 billion, mainly related to outstanding investments in connection with new power plant construction projects and the expansion and modernisation of existing generation assets.
34.2 Long-term purchase commitments
EUR billion Due within
one year Due after one year Total
Gas 5.3 100.5 105.7 Electricity 0.1 0.1 0.2 Transportation and storage 0.7 5.6 6.3 Other 0.2 0.6 0.8
Increase in long-term purchase commitments is mainly from the acquisition of Uniper (EUR 110.0 billion on 31 March 2020).
Gas Gas for supplying industrial customers is usually procured by means of long-term purchase contracts with major international producers of natural gas. Such contracts are generally take-or-pay in nature. The prices paid for natural gas are normally tied to market reference prices, as dictated by market conditions and the procurement behaviour of wholesale market customers. The conditions of these long-term contracts are reviewed at certain specific intervals (usually every three years) as part of contract negotiations and may change accordingly. In the absence of agreement on a pricing review, a neutral board of arbitration makes the final binding decision. Financial obligations arising from these contracts are calculated based on the same principles that govern internal budgeting. Further, the take-or-pay conditions in the individual contracts are also considered in the calculations.
Electricity Contractual obligations for the purchase of electricity relate in part to purchases from resellers and energy utilities, especially those under procurement contracts for the wholesale portfolio.
Transportation and storage Purchase commitments for transportation and storage are for long-term commitments for contracts that are not capitalised on the balance sheet as they do not meet the definition of a lease. Purchase commitments exclude any onerous part of the commitment that is included in provisions. See Note 29 Other provisions.
34.3 Other commitments to associates and joint ventures Teollisuuden Voima Oyj (TVO) is building Olkiluoto 3, the nuclear power plant, which is funded through external loans, share issues and shareholder loans according to shareholders' agreement between the owners of TVO. At end of December 2020, Fortum had EUR 232 million (2019: 170) outstanding receivables regarding Olkiluoto 3 and is additionally committed to providing at maximum EUR 100 million. TVO shareholder loan is classified as participation in joint ventures. For more information, see Note 28 Nuclear related assets and liabilities.
34.4 Other commitments Fortum has committed to providing financing to Voimaosakeyhtiö SF for its participation in the Fennovoima nuclear power project in Finland. Remaining commitment, EUR 76 million, is to be paid within 9 years.
In June 2018, the Swedish Government approved the legislation regarding Sweden’s national strategy for implementation of the EU’s Water Framework Directive. The largest hydro industry companies will create a common hydro-power fund to finance large parts of the environmental actions needed. The fund will have a total financial cap of SEK 10 billion to be paid over a 20-year period, and the largest operators will contribute to the fund proportionately based on their respective market share of hydro-power production. Fortum's share is 31% of the funds' total financing.
1
2
3
4
5
6
7
8
9
10
11
12
13
14
15
16
17
18
19
20
21
22
23
24
25
26
27
28
29
30
31
32
33
34
35
36
37
38
39

OPERATING AND FINANCIAL
REVIEW
CONSOLIDATED FINANCIAL
STATEMENTS NOTES KEY
FIGURES
PARENT COMPANY FINANCIAL
STATEMENTS
SIGNATURES FOR THE OPERATING AND FINANCIAL REVIEW AND
FINANCIAL STATEMENTS AUDITOR’S
REPORT
KEY FIGURES
2011–2020
QUARTERLY FINANCIAL
INFORMATION INVESTOR
INFORMATION 111155
Basis of preparation Risks Income statement Balance sheet Off balance sheet items Group structure and related parties
35 Pledged assets and contingent liabilities ACCOUNTING POLICIES
PLEDGED ASSETS Pledged assets are given to a lender as security for a loan, trading or other commitment. If the borrower or trading party is unable to make the agreed payments, the lender can use the pledged assets to mitigate its losses. Pledged assets at Fortum mostly consist of securities and real estate mortgages.
CONTINGENT LIABILITIES A contingent liability is disclosed when there is a possible obligation that arises from past events and whose existence is only confirmed by one or more doubtful future events; or when there is an obligation that is not recognised as a liability or provision because it is not probable that an outflow of resources will be required, or the amount of the obligation cannot be reliably estimated.
35.1 Pledged assets
EUR million 2020 2019 For debt
Pledges 291 288 Real estate mortgages 275 137
For other commitments Pledges 498 309 Real estate mortgages 105 2
Pledged assets on behalf of others 42 33
For debt Participants in the Finnish State Nuclear Waste Management Fund are allowed to borrow from the Fund. Fortum has pledged shares in Kemijoki Oy as a security. The value of the pledged shares amounts to EUR 269 million (2019: 269).
Real estate mortgages include mainly mortgages given for Solar operations in India amounting to EUR 139 million (2019: 0) and mortgages given for Fortum Tartu in Estonia amounting to EUR 96 million (2019: 96). See Note 26 Interest-bearing liabilities for related interest-bearing liabilities.
For other commitments Pledges include securities and cash of EUR 495 million (2019: 281) for trading mainly in Nasdaq Commodities. See Note 20 Interest-bearing receivables.
Real estate mortgages include EUR 105 million (2019: 2) of real estate mortgages for the liability to the Finnish State Nuclear Waste Management Fund. These are given as a security for the uncovered part of the legal liability and unexpected events relating to future costs for decommissioning and disposal of spent fuel in Loviisa nuclear power plant. According to the Nuclear Energy Act, Fortum is obligated to contribute the funds in full to the State
Nuclear Waste Management Fund to cover the legal liability. Any uncovered legal liability relates to periodising of the payments to the fund. The size of the securities given is updated yearly in the second quarter based on the decisions regarding the legal liabilities and the funding target which are determined at the end of the previous year. See Note 28 Nuclear related assets and liabilities.
35.2 Contingent liabilities In relation to divestment of shareholdings, Fortum has entered into indemnification agreements, which cover the customary representations and warranties, as well as environmental damage and tax contingencies. Any obligations that may exist are covered in the first instance by provisions of the companies sold before Fortum itself is required to make any payments. Moreover, the Fortum Group has commitments under which it assumes joint and several liability arising from its interests in civil-law companies, non-corporate commercial partnerships and consortia in which it participates.
Fortum's 100% owned subsidiary Fortum Heat and Gas Oy has a contingent liability, based on the Finnish Companies Act's (734/1978) Chapter 14a Paragraph 6, with Neste Oyj following the demerger of Fortum Oil and Gas Oy in 2004.
35.3 Guarantees relating to Nuclear operations With respect to the activities of the Swedish nuclear power plants, the companies of the Swedish nuclear units have issued guarantees for OKG, Forsmark and Barsebäck to governmental authorities in accordance with the Swedish law. There are two types of guarantees given. The Financing Amount is given to cover Fortum's share of the uncovered part in the Nuclear Waste Fund, assuming no further production and that no further nuclear waste fees are paid in. The uncovered amount is calculated by the authorities and is based on the difference between the expected costs and the funds to cover these costs at the time of the calculation. The Supplementary Amount constitutes a guarantee for deficits that can arise as a result of unplanned events. The amounts for the guarantees are updated every third year by governmental decision. In addition, the licensee are responsible for all costs related to the disposal of low-level radioactive waste.
Owners of nuclear facilities in Finland and Sweden have statutory liabilities for damages resulting from accidents occurring in those nuclear facilities and for accidents involving any radioactive substance connected to the operation of those facilities. Third-party liability relating to nuclear accidents is strictly the plant operator’s responsibility and must be covered by insurances.
In Finland, as the operator of the Loviisa power plant, Fortum has a statutory liability insurance policy of SDR 600 million, approximately EUR 700 million (Special Drawing Right).
In Sweden, the Swedish Parliament passed a law on 1 July 2010 that requires the operator of a nuclear power plant in operation to have a liability insurance or other financial cover in the amount equivalent to EUR 1.2 billion per incident. The conditions enabling this new law to take effect were not yet in place at 31 December 2020. Nevertheless, the Swedish government decided to increase the insured amount from 1 January 2019 by amending the existing legislation. Accordingly, the liability per incident at 31 December 2020 is henceforth limited to SDR 1,000 million, approximately EUR 1.2 billion.
The necessary insurance for the affected nuclear power plants have been purchased. Same type of insurance policies are in place also for the operators where Fortum has minority interest.
The guarantee given on behalf of Teollisuuden Voima Oyj to the Finnish State Nuclear Waste Management Fund amounts to EUR 26 million (2019: 21). The guarantee covers the unpaid legal liability due to periodisation as well as risks for unexpected future costs.
For information regarding nuclear related assets and liabilities see Note 28 Nuclear related assets and liabilities.
1
2
3
4
5
6
7
8
9
10
11
12
13
14
15
16
17
18
19
20
21
22
23
24
25
26
27
28
29
30
31
32
33
34
35
36
37
38
39

OPERATING AND FINANCIAL
REVIEW
CONSOLIDATED FINANCIAL
STATEMENTS NOTES KEY
FIGURES
PARENT COMPANY FINANCIAL
STATEMENTS
SIGNATURES FOR THE OPERATING AND FINANCIAL REVIEW AND
FINANCIAL STATEMENTS AUDITOR’S
REPORT
KEY FIGURES
2011–2020
QUARTERLY FINANCIAL
INFORMATION INVESTOR
INFORMATION 111166
Basis of preparation Risks Income statement Balance sheet Off balance sheet items Group structure and related parties
36 Legal actions and official proceedings Various routine court actions, arbitration proceedings, tax and regulatory investigations and proceedings are currently pending against entities of the Group, and further actions or proceedings may be instituted or asserted in the future. Through the acquisition of Uniper, the Group is facing wider exposure, in addition to dispute under public law, this in particular includes legal actions and proceedings on contract amendments and price adjustments initiated in response to market upheavals and the changed economic situation in the gas and electricity sectors (also as a consequence of the energy transition) and concerning anticompetitive and fraudulent practices, as well as general commercial contract disputes.
The aforementioned proceedings include several court and arbitration proceedings with major customers and major suppliers, also initiated in some instances by the Group, concerning contract amendments and price adjustments in long-term supply contracts and procurement options for electricity and gas, as well as long- term contracts for storage capacity in response to the altered situation brought about by market upheavals, and also reimbursements of costs. In some of these cases, the validity of the price-adjustment clauses applied, and of the contracts in their entirety is in dispute. Long-term LNG and gas procurement contracts generally include the option for producers and importers to adjust the terms in line with changed market conditions. On this basis, the Group is currently involved in court and arbitration proceedings and continuously conducts extensive negotiations with producers. The possibility of further legal disputes cannot be excluded. Applying the provisions of IAS 37.92, Fortum is making no additional disclosures on the proceedings presented or on the associated risks or measures taken, particularly because such disclosure could prejudice their outcome.
Furthermore, proceedings are pending concerning the clarification of regulatory requirements. Applying the provisions of IAS 37.92, Fortum is making no additional disclosures on the proceedings presented or on the associated risks or measures taken, particularly because such disclosure could prejudice their outcome.
Public-law disputes are pending, in particular, in connection with the operating license for the hard-coal power plant in Datteln. Applying the provisions of IAS 37.92, Fortum is making no additional disclosures on the proceedings presented or on the associated risks or measures taken, particularly because such disclosure could prejudice their outcome.
Tax cases Tax cases in Belgium On 16 June 2020, the Court of Appeal of Ghent, Belgium, ruled in favour of Fortum on Fortum's income tax assessments in Belgium for the year 2008. The decision concerns Fortum's Belgian financing company, Fortum EIF NV, which granted internal financing to a Swedish group company for financing of an acquisition in Russia. The Belgian tax authorities argued that Fortum EIF should not benefit from the notional interest deduction regime in Belgium and disagreed with the Court of Appeal ruling. In September 2020, the Belgian tax authorities filed an appeal to the Supreme Court.
The additional taxes claimed for 2008 amount to EUR 36 million. Fortum has similar tax cases pending for the years 2009-2012 and expects the remaining years to follow the decisions for 2008. The disputed amount for years 2008-2012 totals EUR 114 million. All taxes have been paid and recognised as income tax receivables. Should the decision from the Court of Appeal of Ghent become final, the possible repayment of the disputed amounts of EUR 114 million would have a positive cash flow effect for Fortum.
For critical accounting estimates regarding uncertain tax positions,Note 27 Income taxes on the balance sheet. See alsoNote 12 Income tax expense.
37 Related party transactions 37.1 The Finnish State and companies owned by the Finnish State At the end of 2020, the Finnish State owned 50.76% of the company’s shares (2019: 50.76%). The Finnish Parliament has authorised the Government to reduce the Finnish State’s holding in Fortum Corporation to no less than 50.1% of the share capital and voting rights.
All transactions between Fortum and other companies owned by the Finnish State are on arm’s length basis.
37.2 Board of Directors and Fortum Executive Management The key management personnel of the Fortum Group are the members of Fortum Executive Management and the Board of Directors.
Fortum has not been involved in any material transactions with members of the Board of Directors or Fortum Executive Management. No loans exist to any member of the Board of Directors or Fortum Executive Management at 31 December 2020.
The total compensation (including pension benefits and social costs) for the key management personnel for 2020 was EUR 11 million (2019: 12). SeeNote 10 Employee benefits and Board remuneration for further information on the Board of Directors and Fortum Executive Management remuneration and shareholdings.
37.3 Associated companies and joint ventures In the ordinary course of business, Fortum engages in transactions with associated companies, joint ventures, and other related parties. These transactions are on the same commercial terms as they would be with third parties, except for some associates and joint ventures, as noted below.
Fortum owns shareholdings in associated companies and joint ventures which own hydro and nuclear power plants. Under consortium agreements, each owner is entitled to electricity in proportion to its share of ownership, or based on other agreement. In turn, each owner is liable for an equivalent portion of costs, regardless of output. These associated companies and joint ventures are not profit making since the owners purchase electricity at production cost, including interest costs and production taxes. SeeNote 18 Participations in associated companies and joint ventures.
On 31 March 2020, Uniper SE was reclassified from an associated company to a subsidiary. Transactions with Uniper Group companies are presented until 31 March 2020, but balances with Uniper Group companies were excluded from 31 March 2020 since Uniper was consolidated as a subsidiary. In addition, balances with any Uniper Group's related parties that have become Fortum Group's related parties through the acquisition are disclosed from 31 March 2020. SeeNote 3 Acquisitions, disposals and assets held for sale.
During 2020, Fortum’s joint venture, the Fortum-Rusnano Wind Investment Fund, sold the 50-MW Ulyanovsk 2 and the 300-MW Rostov wind farms to a new joint venture recently established with Russian Direct Investment Fund (RDIF) aimed at the operation of renewable power plants in Russia.
1
2
3
4
5
6
7
8
9
10
11
12
13
14
15
16
17
18
19
20
21
22
23
24
25
26
27
28
29
30
31
32
33
34
35
36
37
38
39

OPERATING AND FINANCIAL
REVIEW
CONSOLIDATED FINANCIAL
STATEMENTS NOTES KEY
FIGURES
PARENT COMPANY FINANCIAL
STATEMENTS
SIGNATURES FOR THE OPERATING AND FINANCIAL REVIEW AND
FINANCIAL STATEMENTS AUDITOR’S
REPORT
KEY FIGURES
2011–2020
QUARTERLY FINANCIAL
INFORMATION INVESTOR
INFORMATION 111177
Basis of preparation Risks Income statement Balance sheet Off balance sheet items Group structure and related parties
Transactions with associates and joint ventures
Associated Companies Joint Ventures Other related parties Total EUR million 2020 2019 2020 2019 2020 2019 2020 2019 Sales 147 1 51 23 3 - 201 24 Interest income on loan receivables and other income 92 12 3 - 9 - 104 12 Purchases 443 260 130 113 51 - 624 373
Balances with associates and joint ventures
Associated Companies Joint Ventures Other related parties Total EUR million 2020 2019 2020 2019 2020 2019 2020 2019 Receivables Long-term interest-bearing loan receivables 874 564 82 61 157 - 1,113 625 Trade and other receivables 98 - 183 86 26 - 307 86 Liabilities Long-term loan payables - 1 293 293 - - 293 294 Trade and other payables 94 - 150 24 96 - 340 24
In addition, Fortum has long-term purchase commitments of approximately EUR 2.0 billion at 31 December 2020 from associates and joint ventures.
See also Note 28 Nuclear related assets and liabilities andNote 35 Pledged assets and contingent liabilities for details on commitments related to associates and joint ventures.
37.4 Pension funds The Fortum pension funds in Finland, Germany, Russia, Sweden, the United Kingdom and Norway are stand-alone legal entities which manage pension assets related to part of the pension coverage in these countries. In 2020, Fortum paid a total of EUR 59 million (2019: 2) direct contribution to these pension plans. See Note 30 Pension obligations.
The assets in the pension fund in Finland include Fortum shares representing 0.04% (2019: 0.04%) of the company’s outstanding shares. Real estate mortgages have been given for a loan from Fortum’s Finnish pension fund for EUR 41 million (2019: 41).
38 Events after the balance sheet date There have been no material events after the balance sheet date.
1
2
3
4
5
6
7
8
9
10
11
12
13
14
15
16
17
18
19
20
21
22
23
24
25
26
27
28
29
30
31
32
33
34
35
36
37
38
39
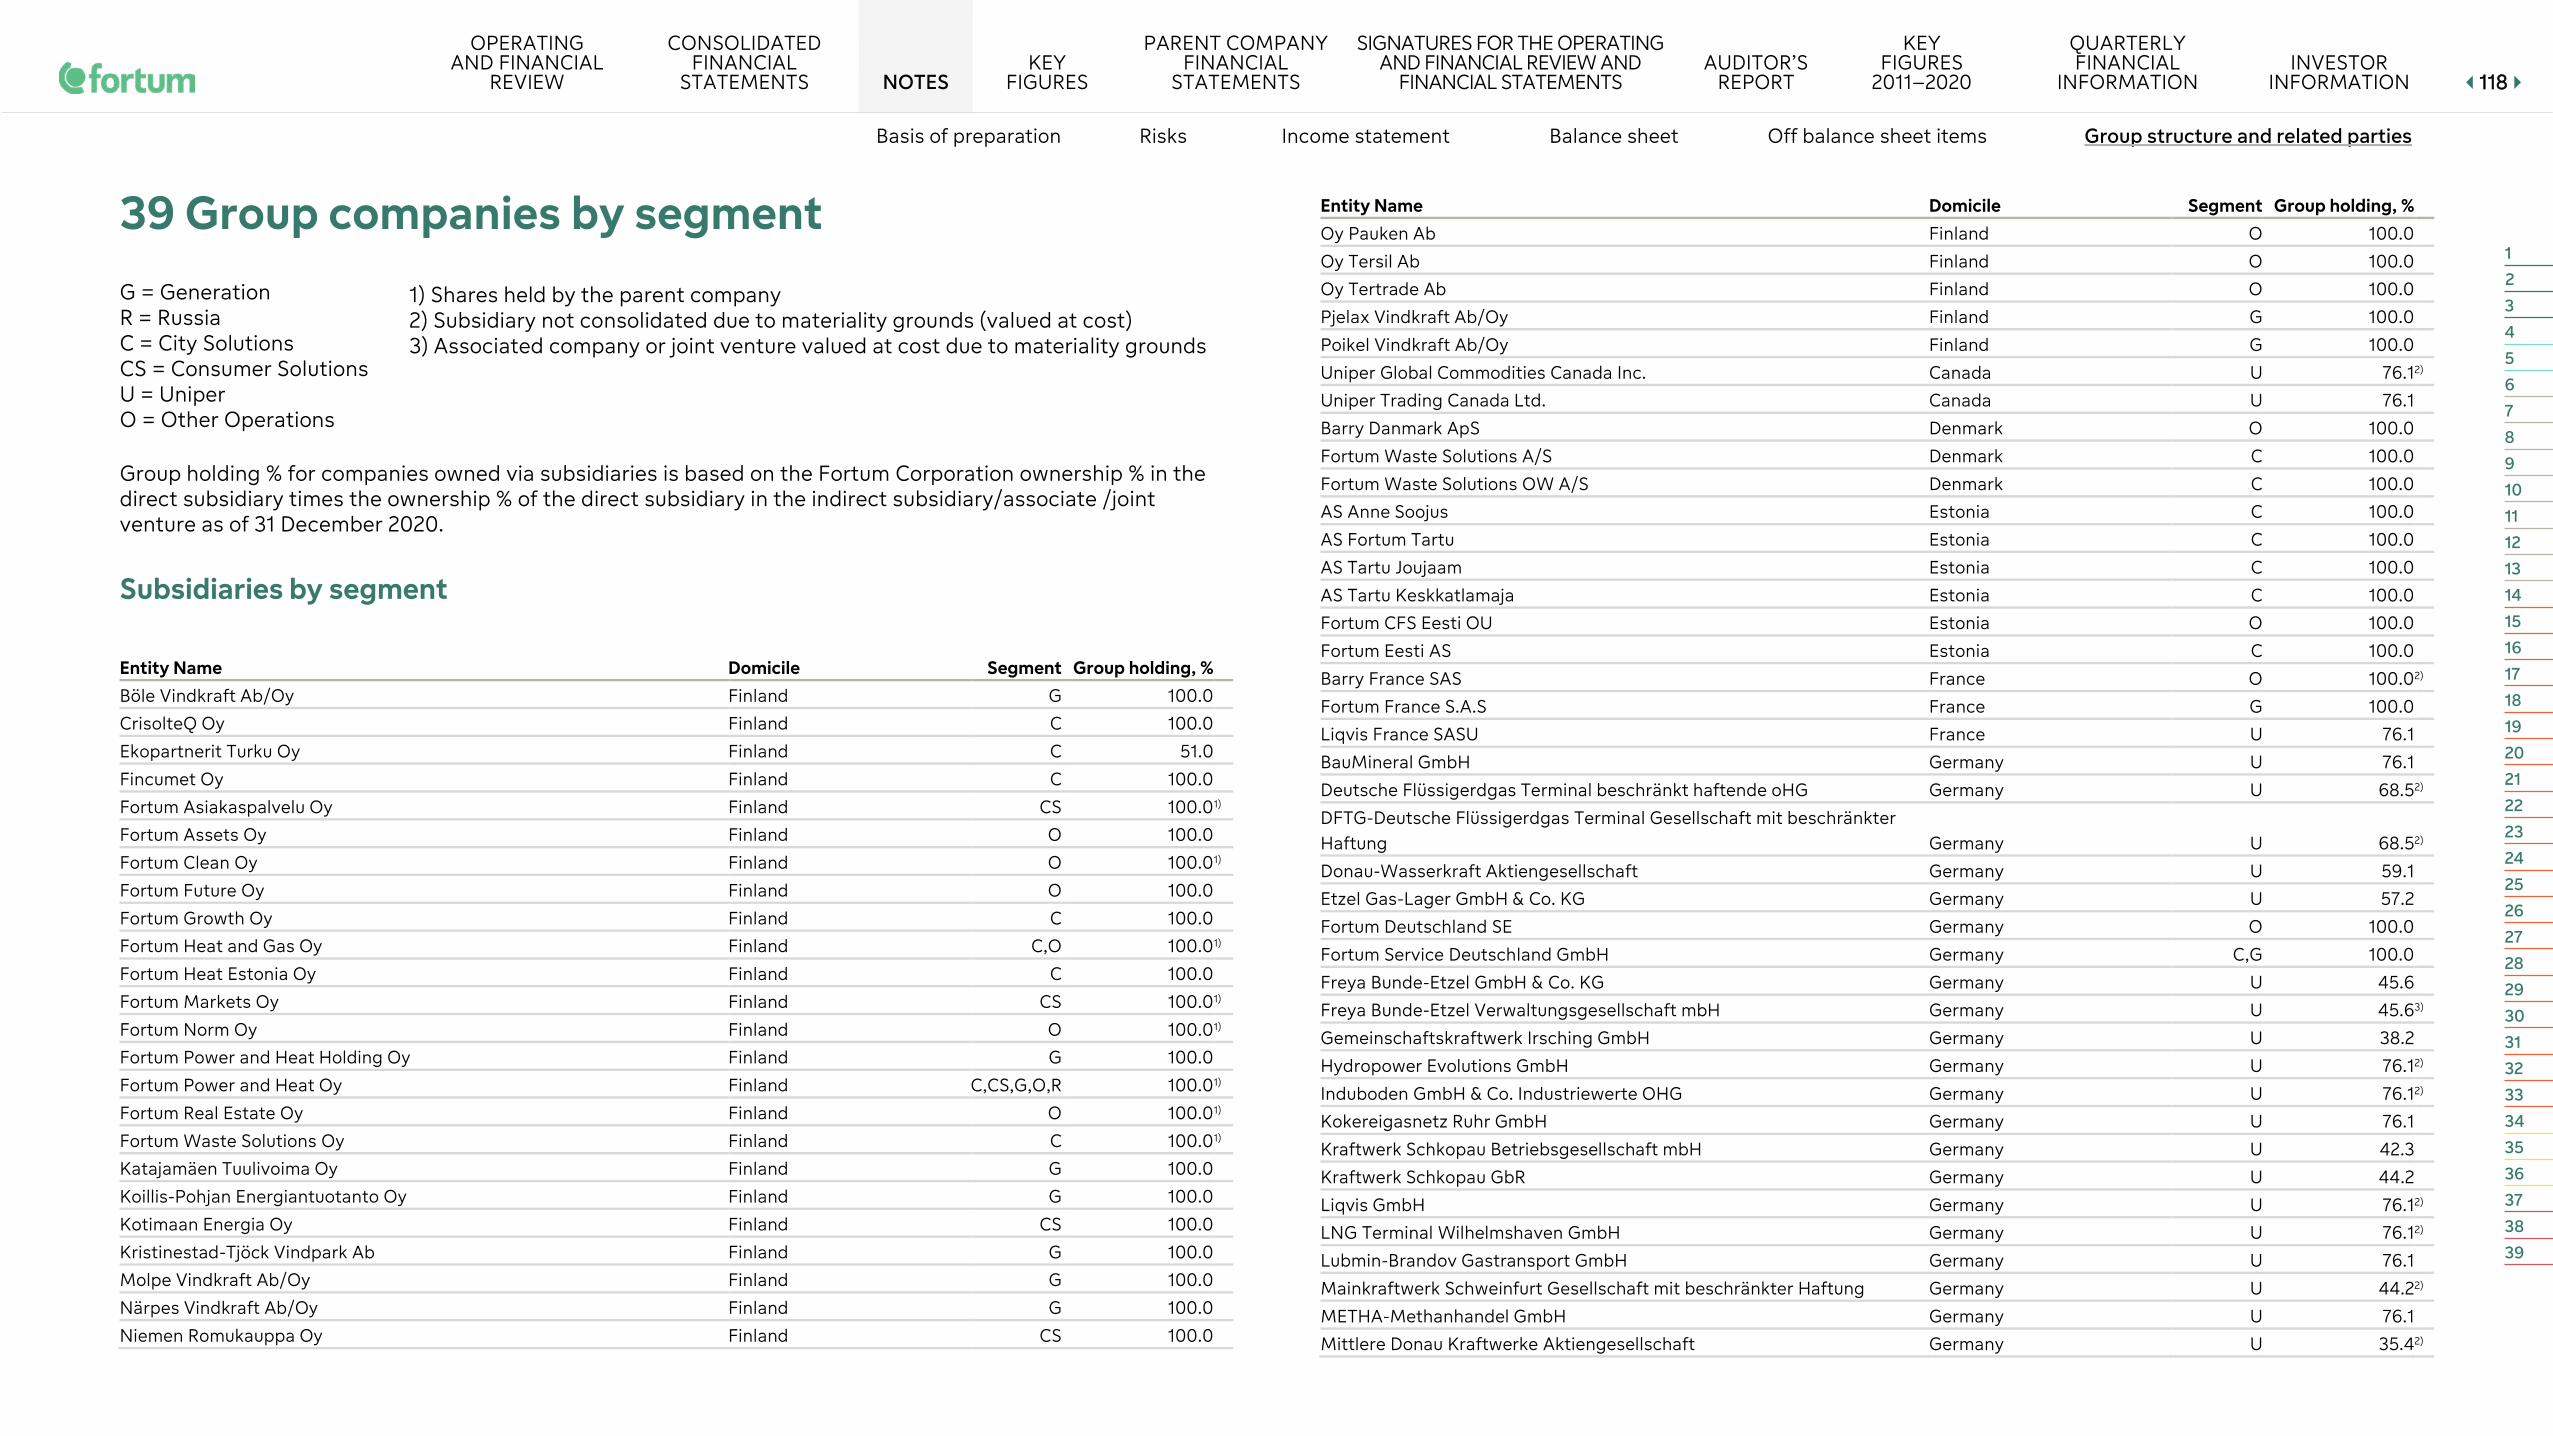
OPERATING AND FINANCIAL
REVIEW
CONSOLIDATED FINANCIAL
STATEMENTS NOTES KEY
FIGURES
PARENT COMPANY FINANCIAL
STATEMENTS
SIGNATURES FOR THE OPERATING AND FINANCIAL REVIEW AND
FINANCIAL STATEMENTS AUDITOR’S
REPORT
KEY FIGURES
2011–2020
QUARTERLY FINANCIAL
INFORMATION INVESTOR
INFORMATION 111188
Basis of preparation Risks Income statement Balance sheet Off balance sheet items Group structure and related parties
39 Group companies by segment G = Generation 1) Shares held by the parent company R = Russia 2) Subsidiary not consolidated due to materiality grounds (valued at cost) C = City Solutions 3) Associated company or joint venture valued at cost due to materiality grounds CS = Consumer Solutions U = Uniper O = Other Operations Group holding % for companies owned via subsidiaries is based on the Fortum Corporation ownership % in the direct subsidiary times the ownership % of the direct subsidiary in the indirect subsidiary/associate /joint venture as of 31 December 2020.
Subsidiaries by segment
Entity Name Domicile Segment Group holding, % Böle Vindkraft Ab/Oy Finland G 100.0
CrisolteQ Oy Finland C 100.0
Ekopartnerit Turku Oy Finland C 51.0
Fincumet Oy Finland C 100.0
Fortum Asiakaspalvelu Oy Finland CS 100.0 1)
Fortum Assets Oy Finland O 100.0
Fortum Clean Oy Finland O 100.0 1)
Fortum Future Oy Finland O 100.0
Fortum Growth Oy Finland C 100.0
Fortum Heat and Gas Oy Finland C,O 100.0 1)
Fortum Heat Estonia Oy Finland C 100.0
Fortum Markets Oy Finland CS 100.0 1)
Fortum Norm Oy Finland O 100.0 1)
Fortum Power and Heat Holding Oy Finland G 100.0
Fortum Power and Heat Oy Finland C,CS,G,O,R 100.0 1)
Fortum Real Estate Oy Finland O 100.0 1)
Fortum Waste Solutions Oy Finland C 100.0 1)
Katajamäen Tuulivoima Oy Finland G 100.0
Koillis-Pohjan Energiantuotanto Oy Finland G 100.0
Kotimaan Energia Oy Finland CS 100.0
Kristinestad-Tjöck Vindpark Ab Finland G 100.0
Molpe Vindkraft Ab/Oy Finland G 100.0
Närpes Vindkraft Ab/Oy Finland G 100.0
Niemen Romukauppa Oy Finland CS 100.0
Entity Name Domicile Segment Group holding, % Oy Pauken Ab Finland O 100.0
Oy Tersil Ab Finland O 100.0
Oy Tertrade Ab Finland O 100.0
Pjelax Vindkraft Ab/Oy Finland G 100.0
Poikel Vindkraft Ab/Oy Finland G 100.0
Uniper Global Commodities Canada Inc. Canada U 76.1 2)
Uniper Trading Canada Ltd. Canada U 76.1
Barry Danmark ApS Denmark O 100.0
Fortum Waste Solutions A/S Denmark C 100.0
Fortum Waste Solutions OW A/S Denmark C 100.0
AS Anne Soojus Estonia C 100.0
AS Fortum Tartu Estonia C 100.0
AS Tartu Joujaam Estonia C 100.0
AS Tartu Keskkatlamaja Estonia C 100.0
Fortum CFS Eesti OU Estonia O 100.0
Fortum Eesti AS Estonia C 100.0
Barry France SAS France O 100.0 2)
Fortum France S.A.S France G 100.0
Liqvis France SASU France U 76.1
BauMineral GmbH Germany U 76.1
Deutsche Flüssigerdgas Terminal beschränkt haftende oHG Germany U 68.5 2)
DFTG-Deutsche Flüssigerdgas Terminal Gesellschaft mit beschränkter Haftung Germany U 68.5 2)
Donau-Wasserkraft Aktiengesellschaft Germany U 59.1
Etzel Gas-Lager GmbH & Co. KG Germany U 57.2
Fortum Deutschland SE Germany O 100.0
Fortum Service Deutschland GmbH Germany C,G 100.0
Freya Bunde-Etzel GmbH & Co. KG Germany U 45.6
Freya Bunde-Etzel Verwaltungsgesellschaft mbH Germany U 45.6 3)
Gemeinschaftskraftwerk Irsching GmbH Germany U 38.2
Hydropower Evolutions GmbH Germany U 76.1 2)
Induboden GmbH & Co. Industriewerte OHG Germany U 76.1 2)
Kokereigasnetz Ruhr GmbH Germany U 76.1
Kraftwerk Schkopau Betriebsgesellschaft mbH Germany U 42.3
Kraftwerk Schkopau GbR Germany U 44.2
Liqvis GmbH Germany U 76.1 2)
LNG Terminal Wilhelmshaven GmbH Germany U 76.1 2)
Lubmin-Brandov Gastransport GmbH Germany U 76.1
Mainkraftwerk Schweinfurt Gesellschaft mit beschränkter Haftung Germany U 44.2 2)
METHA-Methanhandel GmbH Germany U 76.1
Mittlere Donau Kraftwerke Aktiengesellschaft Germany U 35.4 2)
1
2
3
4
5
6
7
8
9
10
11
12
13
14
15
16
17
18
19
20
21
22
23
24
25
26
27
28
29
30
31
32
33
34
35
36
37
38
39

OPERATING AND FINANCIAL
REVIEW
CONSOLIDATED FINANCIAL
STATEMENTS NOTES KEY
FIGURES
PARENT COMPANY FINANCIAL
STATEMENTS
SIGNATURES FOR THE OPERATING AND FINANCIAL REVIEW AND
FINANCIAL STATEMENTS AUDITOR’S
REPORT
KEY FIGURES
2011–2020
QUARTERLY FINANCIAL
INFORMATION INVESTOR
INFORMATION 111199
Basis of preparation Risks Income statement Balance sheet Off balance sheet items Group structure and related parties
Entity Name Domicile Segment Group holding, % Obere Donau Kraftwerke Aktiengesellschaft Germany U 35.4 2)
Plugsurfing GmbH Germany O 100.0
RGE Holding GmbH Germany U 76.1
Rhein-Main-Donau GmbH Germany U 58.9
RMD-Consult GmbH Germany U 76.1
RuhrEnergie GmbH, EVR Germany U 76.1
Uniper Anlagenservice GmbH Germany U 76.1
Uniper Beteiligungs GmbH Germany U 76.1
Uniper Energy Sales GmbH Germany U 76.1
Uniper Energy Storage GmbH Germany U 76.1
Uniper Exploration & Production GmbH Germany U 76.1
Uniper Financial Services GmbH Germany U 76.1
Uniper Global Commodities SE Germany U 76.1
Uniper Holding GmbH Germany U 76.1
Uniper HR Services Hannover GmbH Germany U 76.1
Uniper Hydrogen GmbH Germany U 76.1 2)
Uniper International Holding GmbH Germany U 76.1
Uniper IT GmbH Germany U 76.1
Uniper Kraftwerke GmbH Germany U 76.1
Uniper Market Solutions GmbH Germany U 76.1 2)
Uniper Renewables GmbH Germany U 76.1 2)
Uniper Risk Consulting GmbH Germany U 76.1
Uniper Ruhrgas International GmbH Germany U 76.1
Uniper SE Germany U 76.1
Uniper Solar 1 WHV GmbH Germany U 76.1 2)
Uniper Systemstabilität GmbH Germany U 76.1
Uniper Technologies GmbH Germany U 76.1
Uniper Wärme GmbH Germany U 76.1 2)
Untere Iller AG Germany U 45.6
Fortum Insurance Ltd Guernsey O 100.0
Uniper Hungary Energetikai Kft. Hungary U 76.1
Fortum Charge & Drive India Private Limited India O 100.0
Fortum India Private Limited India C 100.0 1)
Fortum Solar India Private Limited India C 100.0
Fortum Solar Plus Private Limited India C 100.0
Uniper India Private Ltd. India U 76.1 2)
PT Fortum Energy Solution Indonesia C 95.0
Fortum eNext Ireland Ltd Ireland C 100.0
Fortum Finance Ireland Designated Activity Company Ireland O 100.0 1)
Fortum Global Finance Designated Activity Company Ireland O 100.0
Fortum P&H Ireland Limited Ireland O 100.0
Entity Name Domicile Segment Group holding, % Fortum Participation Ltd Ireland C,O 100.0
Fortum Jelgava, SIA Latvia C 100.0
Fortum Latvia SIA Latvia C 100.0
SIA Fortum Daugavpils Latvia C 100.0
SIA Lake Development Latvia C 100.0
UAB Fortum Heat Lietuva Lithuania C 100.0
UAB Fortum Klaipeda Lithuania C 96.0
UAB Joniskio energija Lithuania C 66.2
UAB Svencioniu energija Lithuania C 50.0
UPT Global Alternatives S.C.S. SICAV-SIF Luxembourg U 72.5
Ergon Holdings Ltd Malta U 76.1
Ergon Insurance Ltd Malta U 76.1
E.ON Benelux Geothermie B.V. (in liquidation) Netherlands U 76.1 2)
Fortum 2 B.V. Netherlands O 100.0
Fortum 3 B.V. Netherlands G 100.0
Fortum Charge & Drive B.V. Netherlands O 100.0
Fortum Finance B.V. Netherlands O 100.0
Fortum H&C 1 B.V. Netherlands O 100.0
Fortum H&C B.V. Netherlands O 100.0
Fortum Holding B.V. Netherlands C,CS,G,O 100.0 1)
Fortum Hydro B.V. Netherlands O 100.0
Fortum India B.V. Netherlands C 100.0
Fortum Power Holding B.V. Netherlands O 100.0
Fortum Russia B.V. Netherlands R 100.0
Fortum SAR B.V. Netherlands C 100.0
Fortum Star B.V. Netherlands O 100.0
PolarSolar B.V. Netherlands C 100.0
Uniper Benelux CCS Project B.V. Netherlands U 76.1 2)
Uniper Benelux Holding B.V. Netherlands U 76.1
Uniper Benelux N.V. Netherlands U 76.1
Uniper Energy Trading NL Staff Company B.V. Netherlands U 76.1 2)
Uniper Gas Transportation and Finance B.V. Netherlands U 76.1
Uniper Infrastructure Asset Management B.V. Netherlands U 76.1
Uniper Ruhrgas BBL B.V. Netherlands U 76.1
Uniper Technologies B.V. Netherlands U 76.1 2)
E.ON Ruhrgas Nigeria Limited Nigeria U 76.1 2)
Fortum Consumer Solutions AS Norway CS 100.0
Fortum Fiber AS Norway C 30.0
Fortum Forvaltning AS Norway CS,G,O 100.0
Fortum Hedging AS Norway G 100.0
Fortum Kundesenter AS Norway CS 100.0
1
2
3
4
5
6
7
8
9
10
11
12
13
14
15
16
17
18
19
20
21
22
23
24
25
26
27
28
29
30
31
32
33
34
35
36
37
38
39
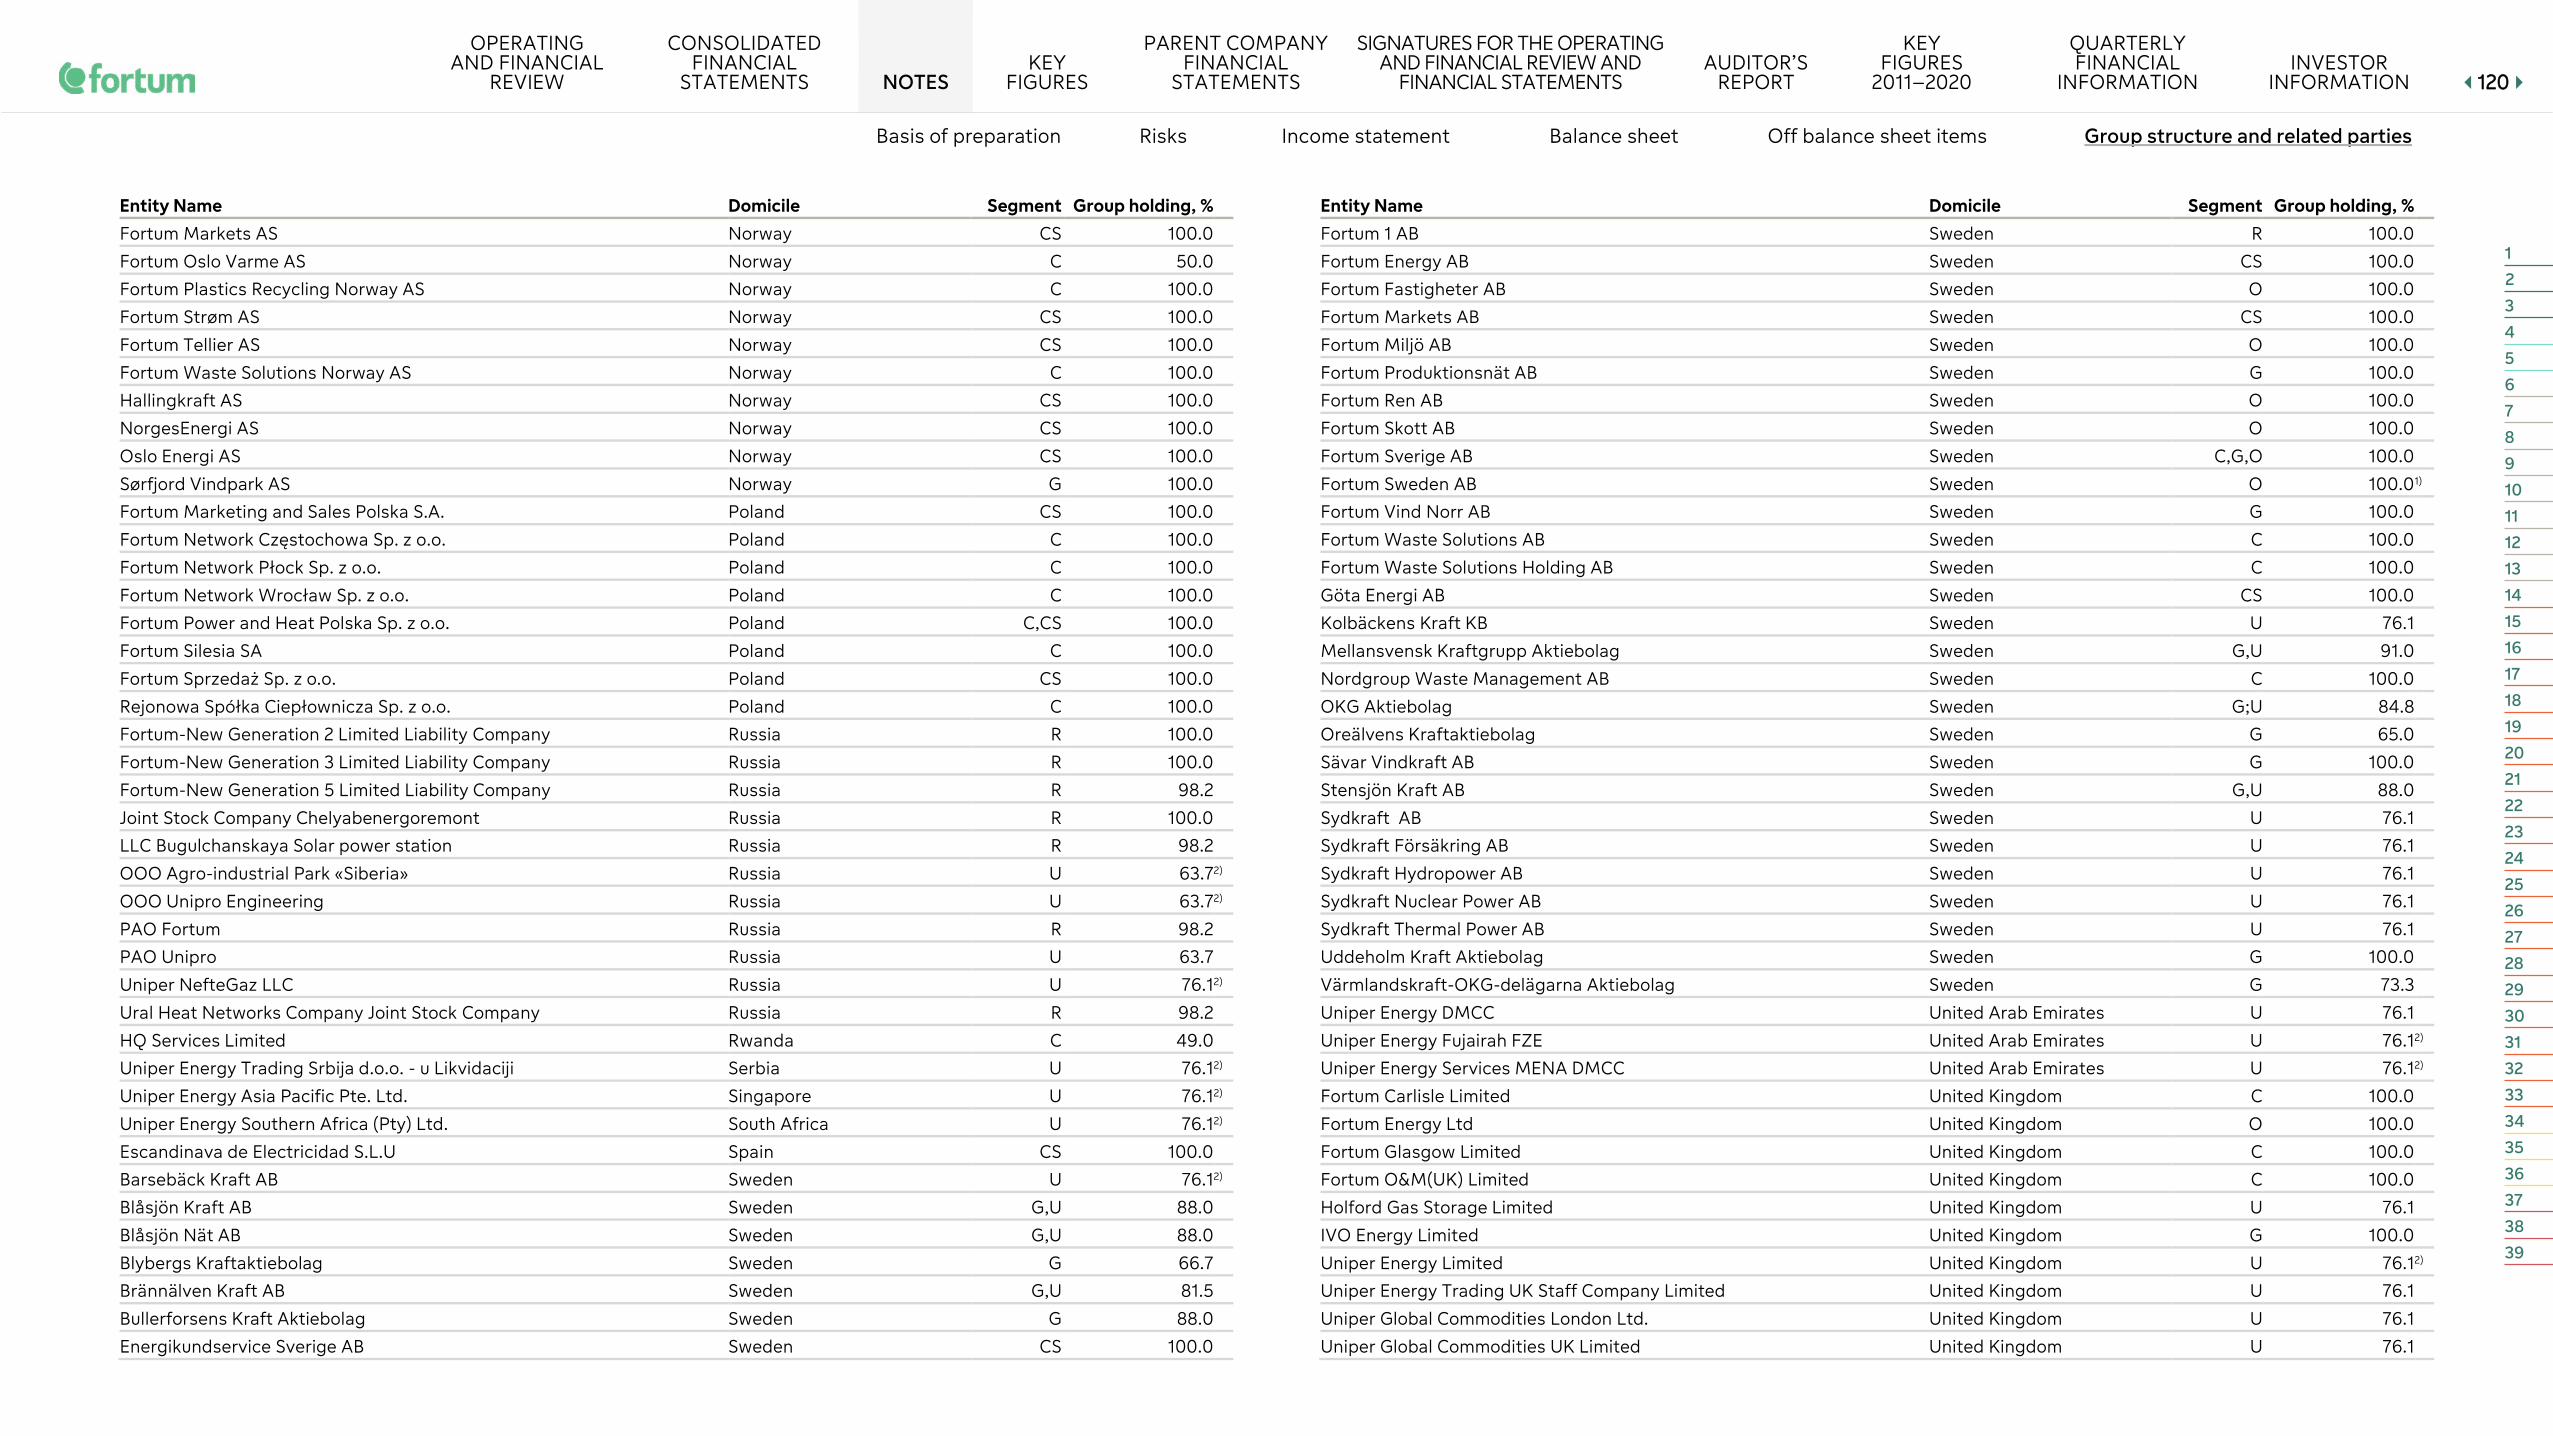
OPERATING AND FINANCIAL
REVIEW
CONSOLIDATED FINANCIAL
STATEMENTS NOTES KEY
FIGURES
PARENT COMPANY FINANCIAL
STATEMENTS
SIGNATURES FOR THE OPERATING AND FINANCIAL REVIEW AND
FINANCIAL STATEMENTS AUDITOR’S
REPORT
KEY FIGURES
2011–2020
QUARTERLY FINANCIAL
INFORMATION INVESTOR
INFORMATION 112200
Basis of preparation Risks Income statement Balance sheet Off balance sheet items Group structure and related parties
Entity Name Domicile Segment Group holding, % Fortum Markets AS Norway CS 100.0
Fortum Oslo Varme AS Norway C 50.0
Fortum Plastics Recycling Norway AS Norway C 100.0
Fortum Strøm AS Norway CS 100.0
Fortum Tellier AS Norway CS 100.0
Fortum Waste Solutions Norway AS Norway C 100.0
Hallingkraft AS Norway CS 100.0
NorgesEnergi AS Norway CS 100.0
Oslo Energi AS Norway CS 100.0
Sørfjord Vindpark AS Norway G 100.0
Fortum Marketing and Sales Polska S.A. Poland CS 100.0
Fortum Network Częstochowa Sp. z o.o. Poland C 100.0
Fortum Network Płock Sp. z o.o. Poland C 100.0
Fortum Network Wrocław Sp. z o.o. Poland C 100.0
Fortum Power and Heat Polska Sp. z o.o. Poland C,CS 100.0
Fortum Silesia SA Poland C 100.0
Fortum Sprzedaż Sp. z o.o. Poland CS 100.0
Rejonowa Spółka Ciepłownicza Sp. z o.o. Poland C 100.0
Fortum-New Generation 2 Limited Liability Company Russia R 100.0
Fortum-New Generation 3 Limited Liability Company Russia R 100.0
Fortum-New Generation 5 Limited Liability Company Russia R 98.2
Joint Stock Company Chelyabenergoremont Russia R 100.0
LLC Bugulchanskaya Solar power station Russia R 98.2
OOO Agro-industrial Park «Siberia» Russia U 63.7 2)
OOO Unipro Engineering Russia U 63.7 2)
PAO Fortum Russia R 98.2
PAO Unipro Russia U 63.7
Uniper NefteGaz LLC Russia U 76.1 2)
Ural Heat Networks Company Joint Stock Company Russia R 98.2
HQ Services Limited Rwanda C 49.0
Uniper Energy Trading Srbija d.o.o. - u Likvidaciji Serbia U 76.1 2)
Uniper Energy Asia Pacific Pte. Ltd. Singapore U 76.1 2)
Uniper Energy Southern Africa (Pty) Ltd. South Africa U 76.1 2)
Escandinava de Electricidad S.L.U Spain CS 100.0
Barsebäck Kraft AB Sweden U 76.1 2)
Blåsjön Kraft AB Sweden G,U 88.0
Blåsjön Nät AB Sweden G,U 88.0
Blybergs Kraftaktiebolag Sweden G 66.7
Brännälven Kraft AB Sweden G,U 81.5
Bullerforsens Kraft Aktiebolag Sweden G 88.0
Energikundservice Sverige AB Sweden CS 100.0
Entity Name Domicile Segment Group holding, % Fortum 1 AB Sweden R 100.0
Fortum Energy AB Sweden CS 100.0
Fortum Fastigheter AB Sweden O 100.0
Fortum Markets AB Sweden CS 100.0
Fortum Miljö AB Sweden O 100.0
Fortum Produktionsnät AB Sweden G 100.0
Fortum Ren AB Sweden O 100.0
Fortum Skott AB Sweden O 100.0
Fortum Sverige AB Sweden C,G,O 100.0
Fortum Sweden AB Sweden O 100.0 1)
Fortum Vind Norr AB Sweden G 100.0
Fortum Waste Solutions AB Sweden C 100.0
Fortum Waste Solutions Holding AB Sweden C 100.0
Göta Energi AB Sweden CS 100.0
Kolbäckens Kraft KB Sweden U 76.1
Mellansvensk Kraftgrupp Aktiebolag Sweden G,U 91.0
Nordgroup Waste Management AB Sweden C 100.0
OKG Aktiebolag Sweden G;U 84.8
Oreälvens Kraftaktiebolag Sweden G 65.0
Sävar Vindkraft AB Sweden G 100.0
Stensjön Kraft AB Sweden G,U 88.0
Sydkraft AB Sweden U 76.1
Sydkraft Försäkring AB Sweden U 76.1
Sydkraft Hydropower AB Sweden U 76.1
Sydkraft Nuclear Power AB Sweden U 76.1
Sydkraft Thermal Power AB Sweden U 76.1
Uddeholm Kraft Aktiebolag Sweden G 100.0
Värmlandskraft-OKG-delägarna Aktiebolag Sweden G 73.3
Uniper Energy DMCC United Arab Emirates U 76.1
Uniper Energy Fujairah FZE United Arab Emirates U 76.1 2)
Uniper Energy Services MENA DMCC United Arab Emirates U 76.1 2)
Fortum Carlisle Limited United Kingdom C 100.0
Fortum Energy Ltd United Kingdom O 100.0
Fortum Glasgow Limited United Kingdom C 100.0
Fortum O&M(UK) Limited United Kingdom C 100.0
Holford Gas Storage Limited United Kingdom U 76.1
IVO Energy Limited United Kingdom G 100.0
Uniper Energy Limited United Kingdom U 76.1 2)
Uniper Energy Trading UK Staff Company Limited United Kingdom U 76.1
Uniper Global Commodities London Ltd. United Kingdom U 76.1
Uniper Global Commodities UK Limited United Kingdom U 76.1
1
2
3
4
5
6
7
8
9
10
11
12
13
14
15
16
17
18
19
20
21
22
23
24
25
26
27
28
29
30
31
32
33
34
35
36
37
38
39

OPERATING AND FINANCIAL
REVIEW
CONSOLIDATED FINANCIAL
STATEMENTS NOTES KEY
FIGURES
PARENT COMPANY FINANCIAL
STATEMENTS
SIGNATURES FOR THE OPERATING AND FINANCIAL REVIEW AND
FINANCIAL STATEMENTS AUDITOR’S
REPORT
KEY FIGURES
2011–2020
QUARTERLY FINANCIAL
INFORMATION INVESTOR
INFORMATION 112211
Basis of preparation Risks Income statement Balance sheet Off balance sheet items Group structure and related parties
Entity Name Domicile Segment Group holding, % Uniper Holdings Limited United Kingdom U 76.1 2)
Uniper Technologies Limited United Kingdom U 76.1
Uniper UK Corby Limited United Kingdom U 76.1
Uniper UK Cottam Limited United Kingdom U 76.1 2)
Uniper UK Gas Limited United Kingdom U 76.1
Uniper UK Ironbridge Limited United Kingdom U 76.1
Uniper UK Limited United Kingdom U 76.1
Uniper UK Trustees Limited United Kingdom U 76.1 2)
Greanex LLC USA U 38.8 2)
Uniper Global Commodities North America LLC USA U 76.1
Valo Ventures I LP Fund USA O 99.0
Associated companies and joint ventures by segment
Entity Name Country Segment Group holding % Chempolis Oy Finland C 33.9
Kemijoki Oy Finland G 28.3
Keuruun Sähkö Oy Finland O 35.1
Posiva Oy Finland G 40.0
Sallila Energia Oy Finland O 46.0
Teollisuuden Voima Oyj Finland G 25.8
Turun Seudun Energiantuotanto Oy Finland C 53.5
Turun Seudun Kaukolämpö Oy Finland C 30.0
Wello Oy Finland O 18.6 1)
RAG-Beteiligungs-Aktiengesellschaft Austria U 22.8
SOCAR-UNIPER LLC Azerbaijan U 32.3 3)
BIOPLYN Třeboň spol. s r.o. Czech Republic U 18.8 3)
Solar Energy s.r.o. Czech Republic U 19.0 3)
E.ON Perspekt GmbH Germany U 22.8 3)
Energie-Pensions-Management GmbH Germany U 22.8 3)
Gemeinschaftskraftwerk Kiel Gesellschaft mit beschränkter Haftung Germany U 38.0 3)
Grüne Quartiere GmbH Germany U 38.0 3)
Kraftwerk Buer GbR Germany U 38.0 3)
Assam Bio Refinery Private Limited India C 49.6
India Uniper Power Services Private Limited India U 38.0 3)
PT Jakarta Solusi Lestari Indonesia C 56.0
AS Jelgavas Situmtiklu uznemums Latvia C 27.6
AB Klaipedos energija Lithuania C 19.6
UAB Kauno Kogeneracine Jegaine Lithuania C 49.0
Entity Name Country Segment Group holding % B.V. NEA Netherlands U 19.0 3)
BBL Company V.O.F. Netherlands U 15.2
India Sun B.V. Netherlands C 43.8
Nordic Wind B.V. Netherlands G 20.0
Yustek Holding B.V. Netherlands R 50.0
Fortum Nordkraft Vind DA Norway G 50.0
Linnvasselv Kraftlag SA Norway G 40.8
OF Energi AS Norway C 25.0
Recharge AS Norway O 36.5
Fortum-New Generation 4 Limited Liability Company Russia R 48.1
Kurgan Plant of Energy Technologies Limited Liability Russia R 50.0
OOO E.ON Connecting Energies Russia U 31.8 3)
TGC1 Territorial Generating Company 1 Russia R 30.0
Ural energy retail LLC Russia R 49.1
Wind Power Assets Management LLC Russia R 49.1
AB Svafo Sweden G,U 38.4 3)
Ångefallen Kraft AB Sweden G 50.0
Bergeforsens Kraftaktiebolag Sweden U 30.4
Forsmarks Kraftgrupp Aktiebolag Sweden G,U 29.7
Horrmundsvalla Kraftaktiebolag Sweden G 50.0
Kärnkraftsäkerhet & Utbildning AB Sweden G,U 45,4 3)
Klåvbens AB Sweden U 38.0 3)
Ringhals AB Sweden U 22.5
SQC Swedish Qualification Centre AB Sweden G,U 45,7 3)
Stockholm Exergi Holding AB (publ) Sweden C 50.0
Svensk Kärnbränslehantering AB Sweden G,U 36.7 3)
Tåsans Kraftaktiebolag Sweden G 40.0
Väsa Kraftaktiebolag Sweden G 50.0
Vattenkraftens Miljöfond Sverige AB Sweden G,U 31.3
Vaultige AB Sweden U 38.0
Javelin Global Commodities Holdings LLP United Kingdom U 21.3
Exporting Commodities International LLC USA U 37.3
1
2
3
4
5
6
7
8
9
10
11
12
13
14
15
16
17
18
19
20
21
22
23
24
25
26
27
28
29
30
31
32
33
34
35
36
37
38
39

OPERATING AND FINANCIAL
REVIEW
CONSOLIDATED FINANCIAL
STATEMENTS NOTES KEY
FIGURES
PARENT COMPANY FINANCIAL
STATEMENTS
SIGNATURES FOR THE OPERATING AND FINANCIAL REVIEW AND
FINANCIAL STATEMENTS AUDITOR’S
REPORT
KEY FIGURES
2011–2020
QUARTERLY FINANCIAL
INFORMATION INVESTOR
INFORMATION 112222
Financial key figures Share key figures Segment key figures Definitions of key figures
Financial key figures For information of Alternative Performance Measures used by Fortum, seeDefinitions of key figures and Note 1 Significant accounting policies.
EUR million or as indicated 2020 2019 Change 20/19 %
Income statement Sales 49,015 5,447 800 EBITDA 2,688 1,693 59 Comparable EBITDA 2,434 1,766 38 Operating profit 1,599 1,118 43 - of sales % 3.3 20.5 Comparable operating profit 1,344 1,191 13 Share of profit/loss of associates and joint ventures 656 744 -12 Profit before income tax 2,199 1,728 27 - of sales % 4.5 31.7 Profit for the period 1,855 1,507 23 - of which attributable to owners of the parent 1,823 1,482 23 Financial position and cash flow Capital employed 26,239 19,929 Financial net debt 1) 7,023 4,833 45 Adjusted net debt 1) 9,784 4,978 97 Interest-bearing net debt 1) N/A 5,260 Capital expenditure and gross investments in shares 4,941 819 503 - of sales % 10.1 15.0 Capital expenditure 1,135 713 59 Net cash from operating activities 2,555 1,575 62
EUR million or as indicated 2020 2019 Change 20/19 %
Key ratios Return on shareholders' equity, % 12.9 11.9 Interest coverage 27.3 8.0 Interest coverage including capitalised borrowing costs 18.6 7.5 Funds from operations/interest-bearing net debt, % N/A 32.2 Gearing, % 1) 45 40 Equity-to-assets ratio, % 27 57 Financial net debt/comparable EBITDA 2) 2.9 Comparable net debt/EBITDA 2) N/A 3.0 Return on capital employed, % 2) N/A 10.0 Other data Dividends 995 3) 977 2 Research and development expenditure 56 67 -16 - of sales % 0.1 1.2 Average number of employees 19,988 8,248 1) Following the consolidation of Uniper, Fortum has updated its definition of net debt and uses financial net debt and
adjusted net debt. As a consequence, the definition of gearing has been updated. 2) Comparable EBITDA is defined as an alternative performance measure and used as a component in the capital structure
target 'Financial net debt-to-Comparable EBITDA'. In 2020 Comparable EBITDA includes contribution from Uniper for the period of 1 April to 31 December 2020 since Uniper was consolidated as a subsidiary from 31 March 2020. Until 31 of March 2020 Uniper's contribution to the income statement was recognised in the Share of profit/loss of associates and joint ventures.
3) Board of Directors’ proposal for the planned Annual General Meeting on 28 April 2021.
SeeDefinitions of key figures.
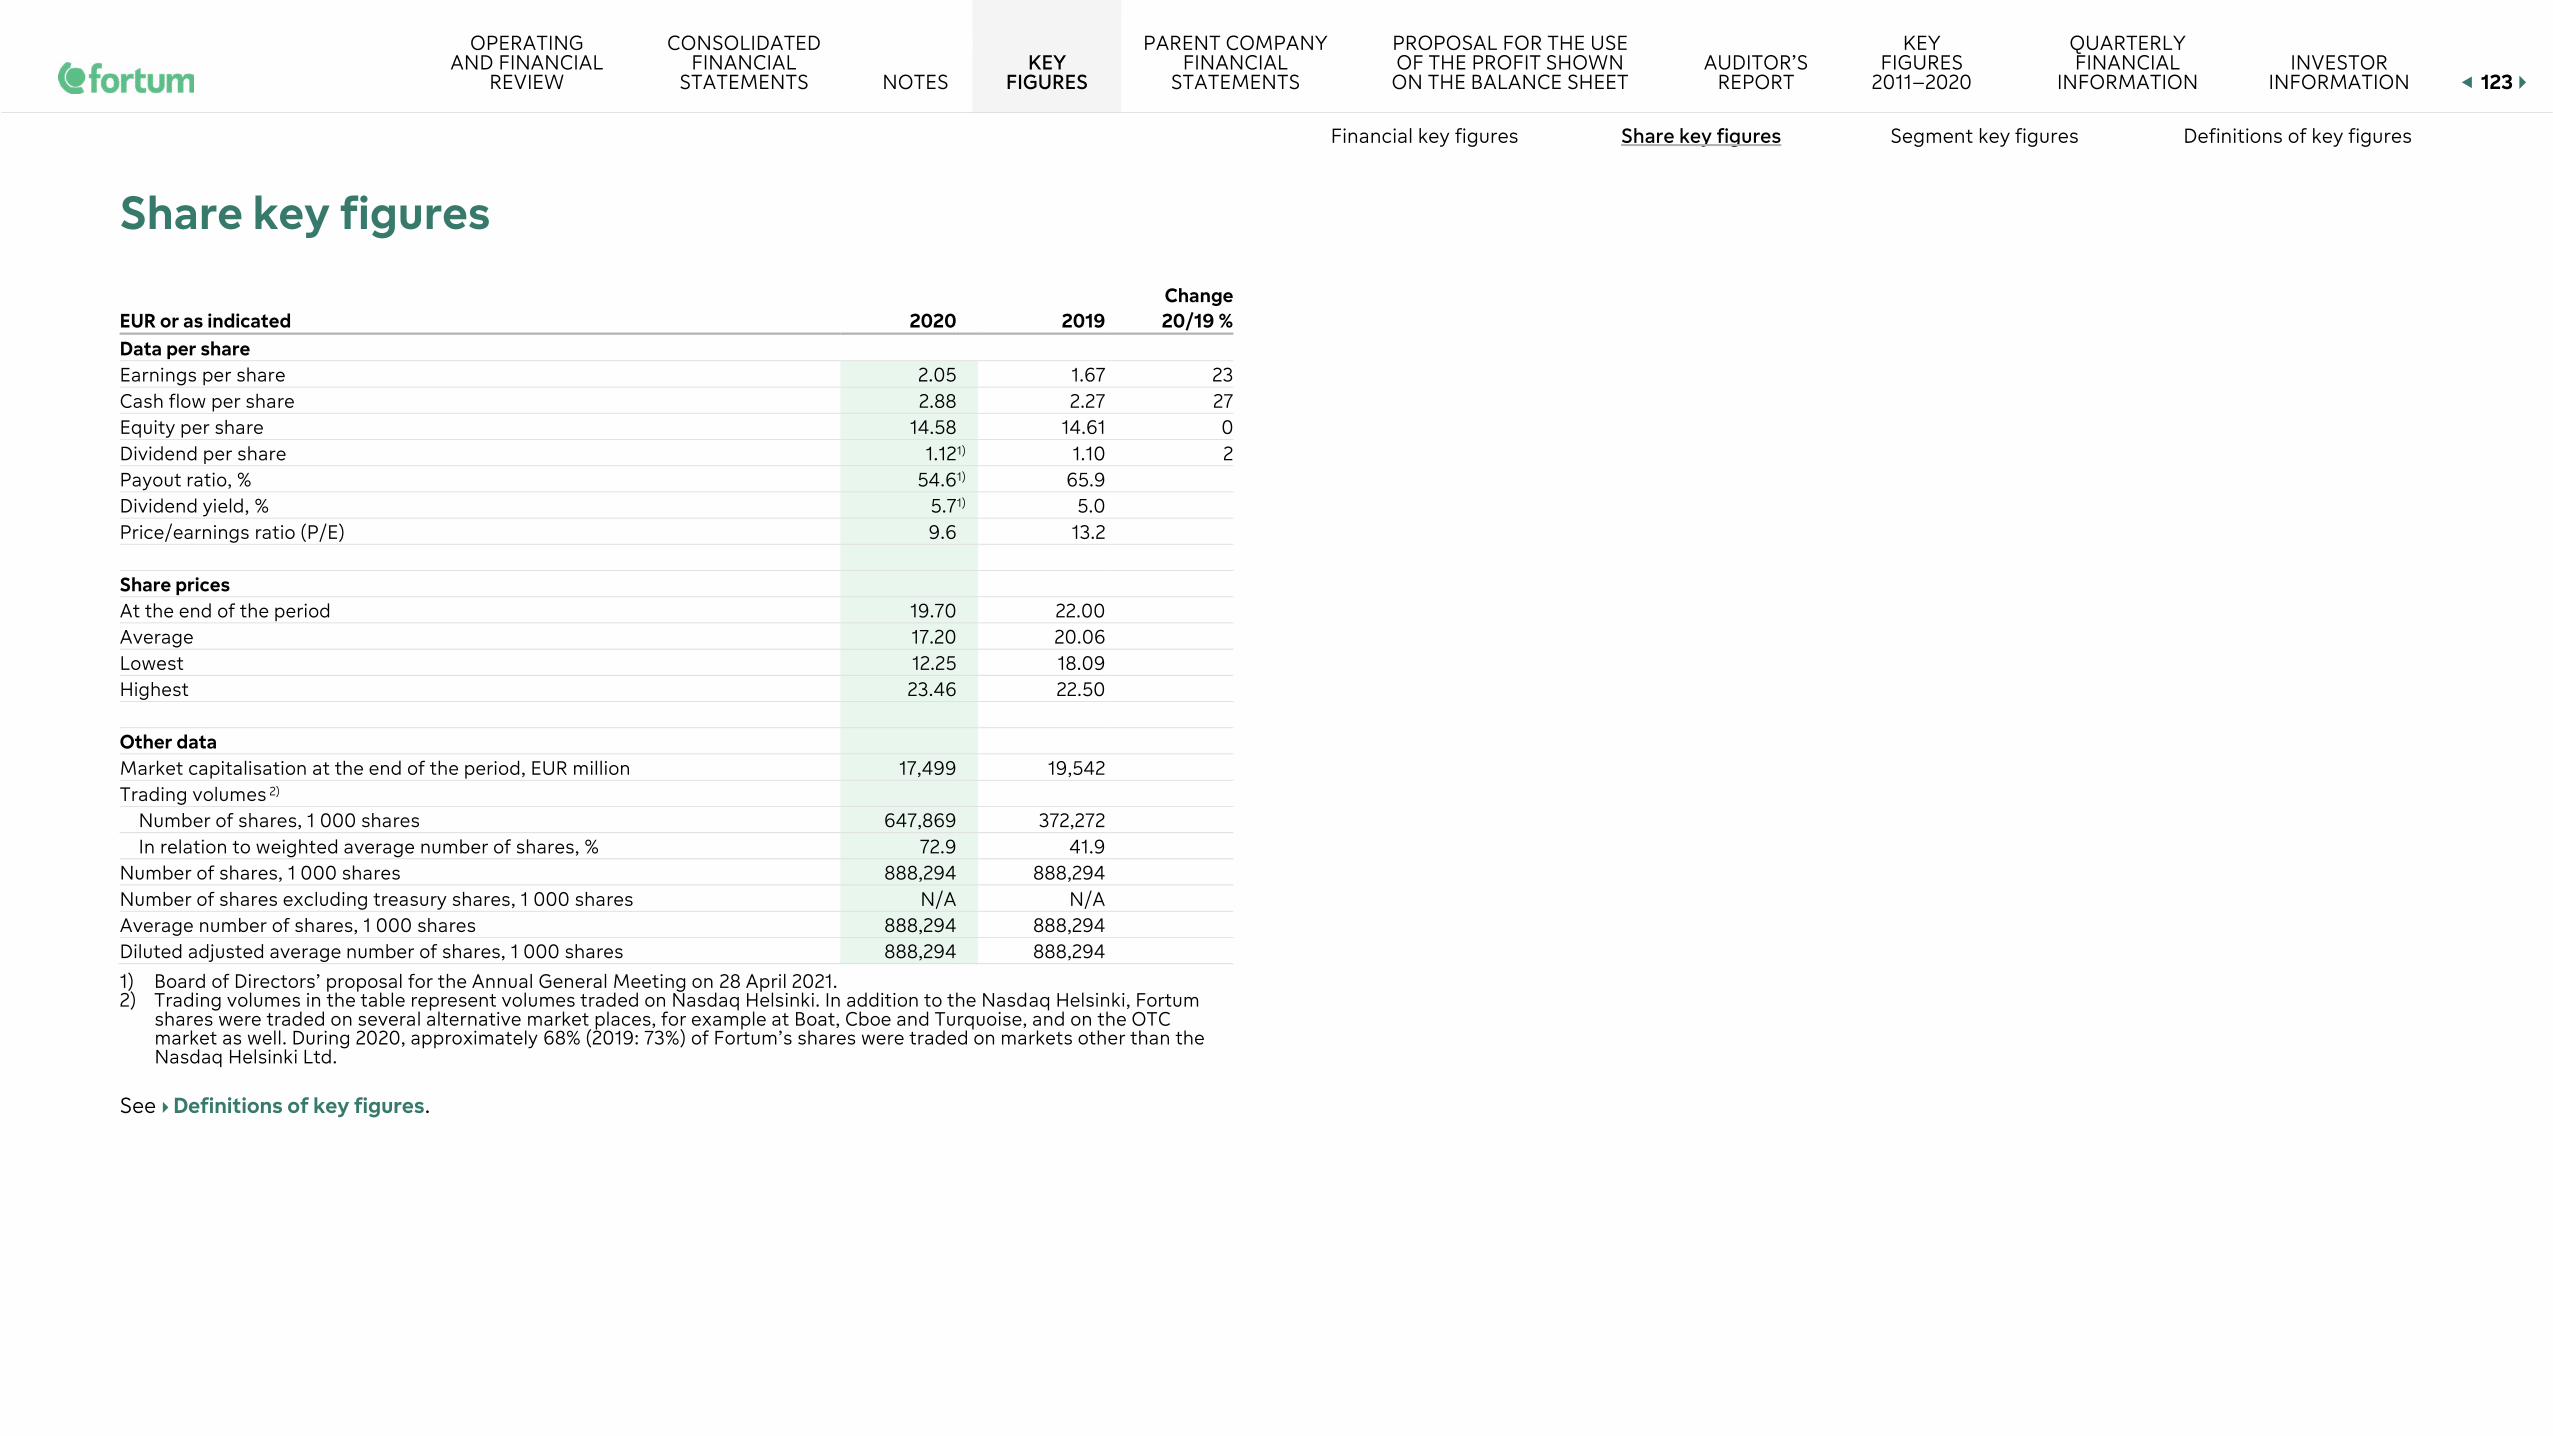
OPERATING AND FINANCIAL
REVIEW
CONSOLIDATED FINANCIAL
STATEMENTS NOTES KEY
FIGURES
PARENT COMPANY FINANCIAL
STATEMENTS
PROPOSAL FOR THE USE OF THE PROFIT SHOWN ON THE BALANCE SHEET
AUDITOR’S REPORT
KEY FIGURES
2011–2020
QUARTERLY FINANCIAL
INFORMATION INVESTOR
INFORMATION 123
Financial key figures Share key figures Segment key figures Definitions of key figures
Share key figures
EUR or as indicated 2020 2019 Change 20/19 %
Data per share Earnings per share 2.05 1.67 23 Cash flow per share 2.88 2.27 27 Equity per share 14.58 14.61 0 Dividend per share 1.12 1) 1.10 2 Payout ratio, % 54.6 1) 65.9 Dividend yield, % 5.7 1) 5.0 Price/earnings ratio (P/E) 9.6 13.2 Share prices At the end of the period 19.70 22.00 Average 17.20 20.06 Lowest 12.25 18.09 Highest 23.46 22.50
Other data Market capitalisation at the end of the period, EUR million 17,499 19,542 Trading volumes 2)
Number of shares, 1 000 shares 647,869 372,272 In relation to weighted average number of shares, % 72.9 41.9
Number of shares, 1 000 shares 888,294 888,294 Number of shares excluding treasury shares, 1 000 shares N/A N/A Average number of shares, 1 000 shares 888,294 888,294 Diluted adjusted average number of shares, 1 000 shares 888,294 888,294
1) Board of Directors’ proposal for the Annual General Meeting on 28 April 2021. 2) Trading volumes in the table represent volumes traded on Nasdaq Helsinki. In addition to the Nasdaq Helsinki, Fortum
shares were traded on several alternative market places, for example at Boat, Cboe and Turquoise, and on the OTC market as well. During 2020, approximately 68% (2019: 73%) of Fortum’s shares were traded on markets other than the Nasdaq Helsinki Ltd.
SeeDefinitions of key figures.

OPERATING AND FINANCIAL
REVIEW
CONSOLIDATED FINANCIAL
STATEMENTS NOTES KEY
FIGURES
PARENT COMPANY FINANCIAL
STATEMENTS
SIGNATURES FOR THE OPERATING AND FINANCIAL REVIEW AND
FINANCIAL STATEMENTS AUDITOR’S
REPORT
KEY FIGURES
2011–2020
QUARTERLY FINANCIAL
INFORMATION INVESTOR
INFORMATION 112244
Financial key figures Share key figures Segment key figures Definitions of key figures
Segment key figures
Sales by segment, EUR million 2020 2019 Generation 2,006 2,141 - of which internal 421 259 Russia 929 1,071 - of which internal 2 - City Solutions 1,075 1,200 - of which internal 64 45 Consumer Solutions 1,267 1,835 - of which internal 2 -3 Uniper 44,514 - - of which internal 0 - Other Operations 140 115 - of which internal 110 86 Eliminations and Netting of Nord Pool transactions -916 -916 Total 49,015 5,447 Comparable operating profit by segment, EUR million 2020 2019 Generation 722 794 Russia 251 316 City Solutions 47 120 Consumer Solutions 90 79 Uniper 363 - Other Operations -129 -118 Comparable operating profit 1,344 1,191 Impairment charges and reversals 2 -8 Capital gains and other related items 765 7 Impact from acquisition accounting -222 - Changes in fair values of derivatives hedging future cash flow -675 -72 Other 386 - Operating profit 1,599 1,118
Comparable EBITDA by segment, EUR million 2020 2019 Generation 886 939 Russia 394 469 City Solutions 239 308 Consumer Solutions 153 141 Uniper 856 - Other Operations -94 -91 Total 2,434 1,766 Depreciation and amortisation, EUR million 2020 2019 Generation 164 145 Russia 143 153 City Solutions 191 188 Consumer Solutions 63 62 Uniper 494 - Other Operations 35 28 Total 1,090 575 Share of profit of associates and joint ventures by segment, EUR million 2020 2019 Generation 29 10 Russia 47 59 City Solutions 57 37 Uniper 54 - Other Operations 470 638 Total 656 744 Capital expenditure by segment, EUR million 2020 2019 Generation 158 247 Russia 43 67 City Solutions 219 313 Consumer Solutions 57 55 Uniper 624 - Other Operations 34 31 Total 1,135 713

OPERATING AND FINANCIAL
REVIEW
CONSOLIDATED FINANCIAL
STATEMENTS NOTES KEY
FIGURES
PARENT COMPANY FINANCIAL
STATEMENTS
SIGNATURES FOR THE OPERATING AND FINANCIAL REVIEW AND
FINANCIAL STATEMENTS AUDITOR’S
REPORT
KEY FIGURES
2011–2020
QUARTERLY FINANCIAL
INFORMATION INVESTOR
INFORMATION 112255
Financial key figures Share key figures Segment key figures Definitions of key figures
Gross investments in shares by segment, EUR million 2020 2019 Generation 70 13 Russia 48 66 City Solutions 114 9 Consumer Solutions - - Uniper 3 - Other Operations 3,572 18 Total 3,807 106 Gross divestments of shares by segment, EUR million 2020 2019 Generation 171 12 Russia - - City Solutions 895 2 Consumer Solutions 10 - Uniper 69 - Other Operations 81 16 Total 1,226 30 Comparable net assets by segment, EUR million 2020 2019 Generation 6,234 6,019 Russia 2,431 3,212 City Solutions 3,679 3,945 Consumer Solutions 565 637 Uniper 7,432 - Other Operations 136 4,400 Total 20,477 18,214
Comparable return on net assets by segment, % 2020 2019 Generation 11.8 13.3 Russia 11.1 12.3 City Solutions 2.8 4.6 Consumer Solutions 15.9 13.3 Uniper 1) N/A -
1) 2020 for Uniper segment is calculated based on cumulative figures from 1 April 2020. Comparable return on net assets for the Uniper segment will be presented once information for full 12 months is available.
Average number of employees 2020 2019 Generation 1,163 1,122 Russia 2,969 2,942 City Solutions 2,051 1,979 Consumer Solutions 1,216 1,379 Uniper 11,629 - Other Operations 959 825 Total 19,988 8,248

OPERATING AND FINANCIAL
REVIEW
CONSOLIDATED FINANCIAL
STATEMENTS NOTES KEY
FIGURES
PARENT COMPANY FINANCIAL
STATEMENTS
SIGNATURES FOR THE OPERATING AND FINANCIAL REVIEW AND
FINANCIAL STATEMENTS AUDITOR’S
REPORT
KEY FIGURES
2011–2020
QUARTERLY FINANCIAL
INFORMATION INVESTOR
INFORMATION 112266
Financial key figures Share key figures Segment key figures Definitions of key figures
Definitions of key figures
Alternative performance measures
Business performance Definition Reason to use the measure
Reference to reconciliation
Comparable EBITDA
Operating profit + depreciations and amortisations - items affecting comparability
Comparable EBITDA is representing the underlying cash flow generated by the total Group and segments. Used as a component in the capital structure target of Financial net debt to Comparable EBITDA.
Note 5 Capital risk management
Comparable operating profit
Operating profit - items affecting comparability
Comparable operating profit is used in financial target setting and forecasting, management's follow up of financial performance and allocation of resources in the group's performance management process.
Income statement
Items affecting comparability
Impairment charges and reversals + capital gains and other related items + impact from acquisition accounting + changes in fair values of derivatives hedging future cash flow + other
Component used in calculating comparable operating profit and comparable EBITDA.
Income statement
Impairment charges and reversals
Impairment charges and related provisions (mainly dismantling), as well as the reversal of previously recorded impairment charges. Impairment charges are adjusted from depreciation and amortization, and reversals from other income.
Component used in calculating comparable operating profit and comparable EBITDA.
Income statement
Capital gains and other related items
Capital gains and transaction costs from acquisitions, which are adjusted from other income and other expenses respectively. Profits from the capital recycling business model are presented in comparable operating profit because the business results are realised through divesting the shareholding, either partially or totally.
Component used in calculating comparable operating profit and comparable EBITDA.
Income statement
Business performance Definition Reason to use the measure
Reference to reconciliation
Impact from acquisition accounting
Non-cash accounting impact resulting from reclassifying part of Uniper's other comprehensive income to the income statement when Uniper was consolidated as a subsidiary.
Component used in calculating comparable operating profit and comparable EBITDA.
Income statement
Changes in fair values of derivatives hedging future cash flow
Effects from financial derivatives hedging future cash-flows where hedge accounting is not applied or own use exemption cannot be used according to IFRS 9, which are adjusted from other income or to sales and materials and services respectively when calculating Fortum's alternative performance measures.
Component used in calculating comparable operating profit and comparable EBITDA.
Income statement
Other
Restructuring and cost management expenses, and other miscellaneous non-operating items, which are adjusted mainly from materials and services or employee benefits.
Component used in calculating comparable operating profit and comparable EBITDA.
Income statement
Comparable return on net assets, %
Comparable operating profit + share of profit/loss in associates and joint ventures + adjustment for share of profit/loss in associates and joint ventures x 100
Comparable return on net assets is used in financial target setting and forecasting, management's follow up of financial performance and allocation of resources in the group's performance management process.
Note 6 Segment reporting
Comparable net assets average Adjustment for Share of profit/loss in associates and joint ventures
Adjustment for material items affecting comparability.
Share of profit/loss in associates and joint ventures is included in profit component in the comparable return on net assets calculation and the adjustments are done based on similar components as in Items affecting comparability.
Note 6 Segment reporting

OPERATING AND FINANCIAL
REVIEW
CONSOLIDATED FINANCIAL
STATEMENTS NOTES KEY
FIGURES
PARENT COMPANY FINANCIAL
STATEMENTS
SIGNATURES FOR THE OPERATING AND FINANCIAL REVIEW AND
FINANCIAL STATEMENTS AUDITOR’S
REPORT
KEY FIGURES
2011–2020
QUARTERLY FINANCIAL
INFORMATION INVESTOR
INFORMATION 112277
Financial key figures Share key figures Segment key figures Definitions of key figures
Capital structure Definition Reason to use the measure Reconciliation Comparable net assets
Non-interest-bearing assets - non-interest-bearing liabilities - provisions (non-interest-bearing assets and liabilities do not include finance related items, tax and deferred tax and assets and liabilities from fair valuations of derivatives used for hedging future cash flows).
Comparable net assets is a component in Comparable return on net assets calculation where return on capital allocated directly to the businesses is measured.
Note 6 Segment reporting
Financial net debt / comparable EBITDA Financial net debt
Financial net debt to comparable EBITDA is Fortum's long-term financial target for capital structure since December 2020.
Note 5 Capital risk management
Comparable EBITDA
Comparable net debt / EBITDA Interest-bearing net debt
Comparable net debt to EBITDA was the capital structure target of the Group until Q1 2020. N/A
Comparable EBITDA Financial net debt
Interest-bearing liabilities - liquid funds - securities in interest-bearing receivables + net margin liabilities
In Q1 2020 Fortum updated the definition of net debt. Financial net debt is used in the follow-up of the indebtedness of the group and it is a component in the capital structure target of Financial net debt to Comparable EBITDA since December 2020.
Note 26 Interest-bearing liabilities
Capital structure Definition Reason to use the measure Reconciliation Adjusted net debt
Financial net debt + underfunded pension obligations and asset retirement obligations, net of share in nuclear waste funds
In Q1 2020 Fortum updated the definition of net debt. Adjusted net debt is used in the follow-up of the indebtedness of the group.
Note 26 Interest-bearing liabilities
Interest-bearing net debt
Interest-bearing liabilities - liquid funds Until Q1 2020 interest-bearing net debt was used in the follow-up of the indebtedness of the group i.e. capital structure especially as a component in the long-term over-the-cycle financial target of Comparable net debt / EBITDA in the Group.
Note 26 Interest-bearing liabilities
Return on capital employed (ROCE), %
Profit before taxes + interest and other financial expenses x 100
Until Q1 2020 return on capital employed (ROCE) was a long-term over the cycle financial ratio target measuring the profitability and how efficiently invested capital was used. N/A
Capital employed average Capital employed
Total assets - total non-interest-bearing liabilities
Capital employed is the book value of the invested capital and it was used as a component when calculating the Return of capital employed in the group.
N/A
See Note 1.4 Measures for performance and Note 7 Items affecting comparability

OPERATING AND FINANCIAL
REVIEW
CONSOLIDATED FINANCIAL
STATEMENTS NOTES KEY
FIGURES
PARENT COMPANY FINANCIAL
STATEMENTS
SIGNATURES FOR THE OPERATING AND FINANCIAL REVIEW AND
FINANCIAL STATEMENTS AUDITOR’S
REPORT
KEY FIGURES
2011–2020
QUARTERLY FINANCIAL
INFORMATION INVESTOR
INFORMATION 112288
Financial key figures Share key figures Segment key figures Definitions of key figures
Other key figures
Share based key figures
Earnings per share (EPS)
Profit for the period - non-controlling interests
Average number of shares during the period Cash flow per share Net cash from operating activities Average number of shares during the period Equity per share Shareholders' equity Number of shares at the end of the period Payout ratio, % Dividend per share x 100 Earnings per share Dividend yield, % Dividend per share x 100 Share price at the end of the period Price/earnings (P/E) ratio Share price at the end of the period Earnings per share
Average share price Amount traded in euros during the period Number of shares traded during the period Market capitalisation
Number of shares at the end of the period x share price at the end of the period
Trading volumes
Number of shares traded during the period in relation to the weighted average number of shares during the period
Funds from operations (FFO)
Net cash from operating activities before change in working capital
Capital expenditure
Capitalised investments in property, plant and equipment and intangible assets including maintenance, productivity, growth and investments required by legislation including borrowing costs capitalised during the construction period. Maintenance investments expand the lifetime of an existing asset, maintain usage/availability and/or maintains reliability. Productivity investments improve productivity in an existing asset. Growth investments' purpose is to build new assets and/or to increase customer base within existing businesses. Legislation investments are done at certain point of time due to legal requirements.

OPERATING AND FINANCIAL
REVIEW
CONSOLIDATED FINANCIAL
STATEMENTS NOTES KEY
FIGURES
PARENT COMPANY FINANCIAL
STATEMENTS
SIGNATURES FOR THE OPERATING AND FINANCIAL REVIEW AND
FINANCIAL STATEMENTS AUDITOR’S
REPORT
KEY FIGURES
2011–2020
QUARTERLY FINANCIAL
INFORMATION INVESTOR
INFORMATION 112299
Financial key figures Share key figures Segment key figures Definitions of key figures
Other key figures EBITDA
Operating profit + depreciations and amortisations
Gross investments in shares
Investments in subsidiary shares, shares in associated companies and joint ventures and other investments. Investments in subsidiary shares are net of liquid funds and grossed with interest-bearing liabilities and other items included in financial net debt in the acquired company.
Return on shareholders' equity (ROE), % Profit for the year x 100 Total equity average
Gearing, % Financial net debt (until 2019 interest-bearing net debt) x 100
Total equity including non-controlling interests Equity-to-assets ratio, % Total equity including non-controlling interests x 100 Total assets Interest coverage Operating profit Net interest expenses Interest coverage including capitalised borrowing costs Operating profit Net interest expenses - capitalised borrowing costs Average number of employees
Based on monthly average for the whole period
Definitions for tax figures
Effective income tax rate,% Income tax expense x 100 Profit before income tax Comparable effective income tax rate, %
Income tax expense – effects from tax rate changes - taxes on items affecting comparability - other major onetime tax effects x 100
Profit before income tax - share on profits from associated companies and joint ventures - items affecting comparability
Weighted average applicable income tax rate
Sum of the proportionately weighted share of profits before taxes of each group operating country multiplied with an applicable nominal tax rate of the respective countries.
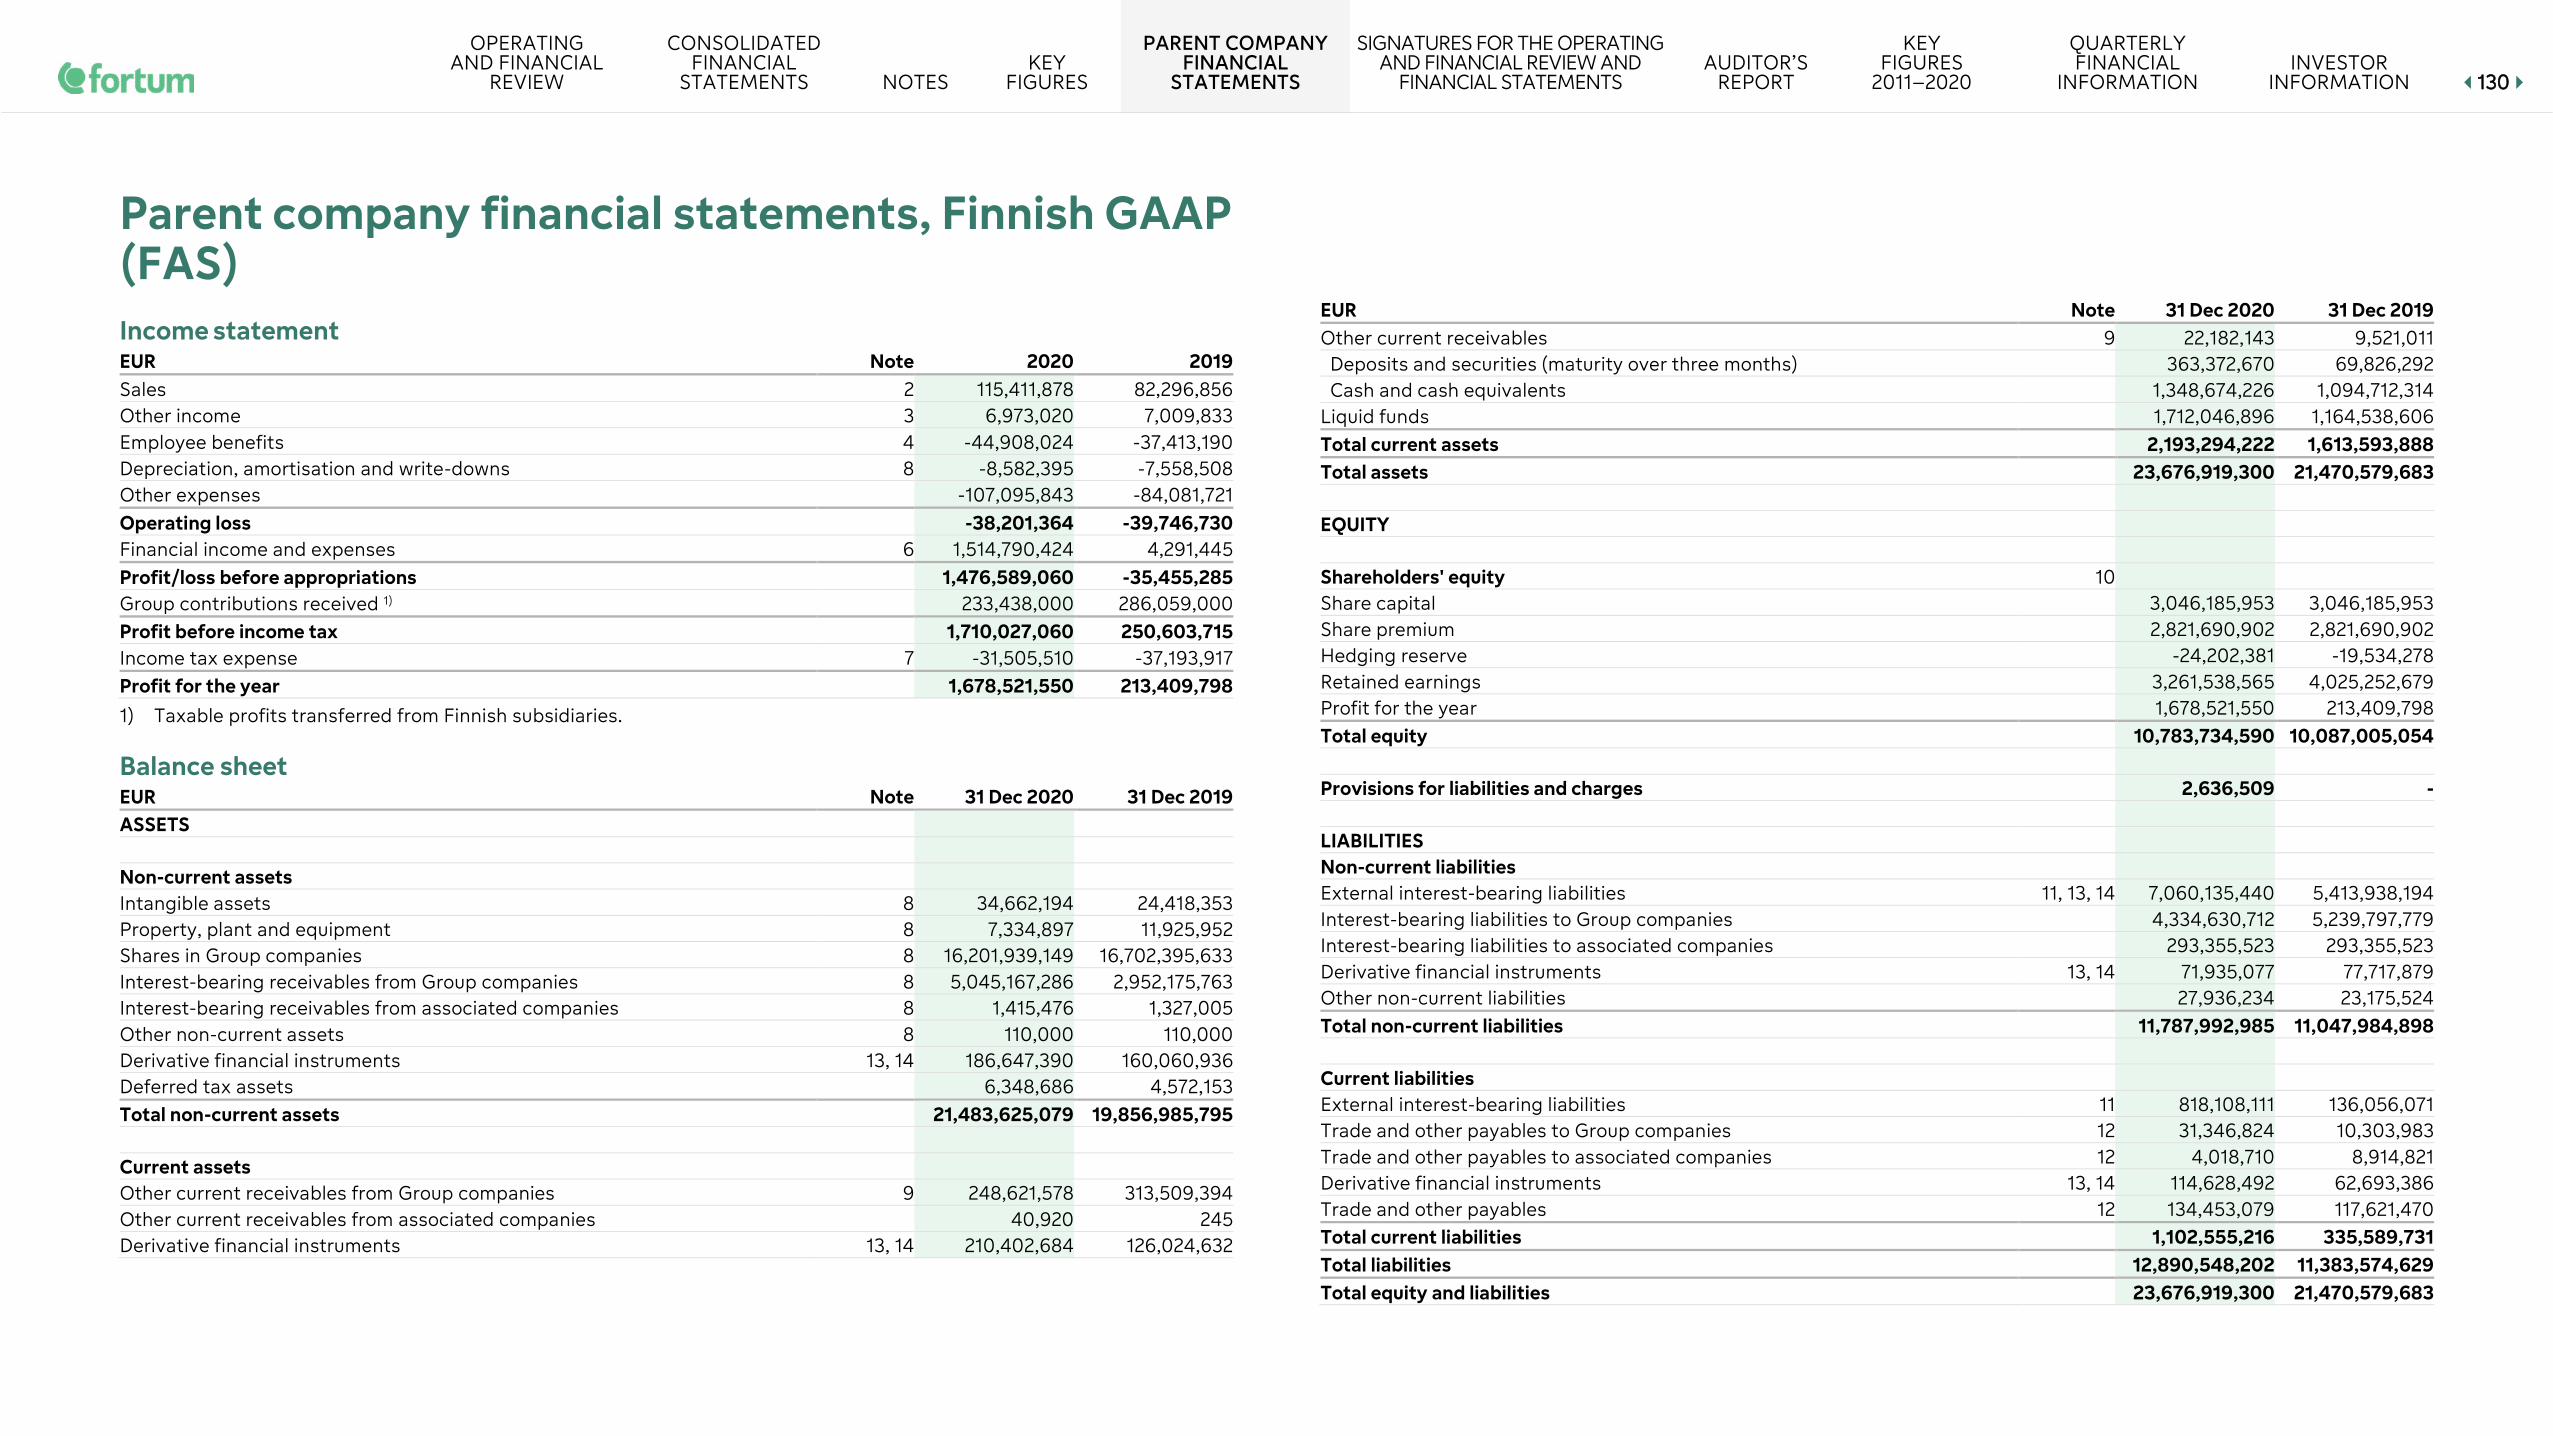
OPERATING AND FINANCIAL
REVIEW
CONSOLIDATED FINANCIAL
STATEMENTS NOTES KEY
FIGURES
PARENT COMPANY FINANCIAL
STATEMENTS
SIGNATURES FOR THE OPERATING AND FINANCIAL REVIEW AND
FINANCIAL STATEMENTS AUDITOR’S
REPORT
KEY FIGURES
2011–2020
QUARTERLY FINANCIAL
INFORMATION INVESTOR
INFORMATION 113300
Parent company financial statements, Finnish GAAP (FAS) Income statement EUR Note 2020 2019 Sales 2 115,411,878 82,296,856 Other income 3 6,973,020 7,009,833 Employee benefits 4 -44,908,024 -37,413,190Depreciation, amortisation and write-downs 8 -8,582,395 -7,558,508Other expenses -107,095,843 -84,081,721Operating loss -38,201,364 -39,746,730Financial income and expenses 6 1,514,790,424 4,291,445 Profit/loss before appropriations 1,476,589,060 -35,455,285Group contributions received 1) 233,438,000 286,059,000 Profit before income tax 1,710,027,060 250,603,715 Income tax expense 7 -31,505,510 -37,193,917Profit for the year 1,678,521,550 213,409,798 1) Taxable profits transferred from Finnish subsidiaries.
Balance sheet EUR Note 31 Dec 2020 31 Dec 2019 ASSETS
Non-current assets Intangible assets 8 34,662,194 24,418,353 Property, plant and equipment 8 7,334,897 11,925,952 Shares in Group companies 8 16,201,939,149 16,702,395,633 Interest-bearing receivables from Group companies 8 5,045,167,286 2,952,175,763 Interest-bearing receivables from associated companies 8 1,415,476 1,327,005 Other non-current assets 8 110,000 110,000 Derivative financial instruments 13, 14 186,647,390 160,060,936 Deferred tax assets 6,348,686 4,572,153 Total non-current assets 21,483,625,079 19,856,985,795
Current assets Other current receivables from Group companies 9 248,621,578 313,509,394 Other current receivables from associated companies 40,920 245 Derivative financial instruments 13, 14 210,402,684 126,024,632
EUR Note 31 Dec 2020 31 Dec 2019 Other current receivables 9 22,182,143 9,521,011
Deposits and securities (maturity over three months) 363,372,670 69,826,292 Cash and cash equivalents 1,348,674,226 1,094,712,314
Liquid funds 1,712,046,896 1,164,538,606 Total current assets 2,193,294,222 1,613,593,888 Total assets 23,676,919,300 21,470,579,683
EQUITY
Shareholders' equity 10 Share capital 3,046,185,953 3,046,185,953 Share premium 2,821,690,902 2,821,690,902 Hedging reserve -24,202,381 -19,534,278Retained earnings 3,261,538,565 4,025,252,679 Profit for the year 1,678,521,550 213,409,798 Total equity 10,783,734,590 10,087,005,054
Provisions for liabilities and charges 2,636,509 -
LIABILITIES Non-current liabilities External interest-bearing liabilities 11, 13, 14 7,060,135,440 5,413,938,194 Interest-bearing liabilities to Group companies 4,334,630,712 5,239,797,779 Interest-bearing liabilities to associated companies 293,355,523 293,355,523 Derivative financial instruments 13, 14 71,935,077 77,717,879 Other non-current liabilities 27,936,234 23,175,524 Total non-current liabilities 11,787,992,985 11,047,984,898
Current liabilities External interest-bearing liabilities 11 818,108,111 136,056,071 Trade and other payables to Group companies 12 31,346,824 10,303,983 Trade and other payables to associated companies 12 4,018,710 8,914,821 Derivative financial instruments 13, 14 114,628,492 62,693,386 Trade and other payables 12 134,453,079 117,621,470 Total current liabilities 1,102,555,216 335,589,731 Total liabilities 12,890,548,202 11,383,574,629 Total equity and liabilities 23,676,919,300 21,470,579,683

OPERATING AND FINANCIAL
REVIEW
CONSOLIDATED FINANCIAL
STATEMENTS NOTES KEY
FIGURES
PARENT COMPANY FINANCIAL
STATEMENTS
SIGNATURES FOR THE OPERATING AND FINANCIAL REVIEW AND
FINANCIAL STATEMENTS AUDITOR’S
REPORT
KEY FIGURES
2011–2020
QUARTERLY FINANCIAL
INFORMATION INVESTOR
INFORMATION 113311
Cash flow statement EUR 1,000 2020 2019 Cash flow from operating activities Profit for the year 1,678,522 213,410 Adjustments: Income tax expense 31,506 37,194 Group contributions -233,438 -286,059 Finance costs - net -1,514,790 -4,291 Depreciation, amortisation and write-downs 8,582 7,559 Operating profit before depreciation (EBITDA) -29,619 -32,187 Non-cash flow items 2,623 -73 Interest and other financial income received 34,970 25,604 Interest and other financial expenses paid -51,724 -96,577 Dividends received 1,129,720 87,000 Group contributions received 286,059 84,518 Realised foreign exchange gains and losses -75,092 36,924 Income taxes paid -35,403 -2,720 Funds from operations 1,261,534 102,489 Other short-term receivables increase(-)/decrease(+) -915 -11,908 Other short-term payables increase(+)/decrease(-) 19,729 -1,038 Change in working capital 18,814 -12,946 Net cash from operating activities 1,280,348 89,543 Cash flow from investing activities Capital expenditures -13,215 -8,448 Acquisition of shares and capital contributions in subsidiaries -8 -8 Proceeds from sales of shares 921,162 - Proceeds from sales of property, plant and equipment 148 21 Change in interest-bearing receivables and other non-current assets -2,092,580 -2,287 Net cash used in investing activities -1,184,492 -10,722 Cash flow before financing activities 95,856 78,821
EUR 1,000 2020 2019 Cash flow from financing activities Proceeds from long-term liabilities 2,455,419 2,807,623 Payment of long-term liabilities -366,156 -2,539,992 Change in cash pool liabilities -882,562 1,837,657 Change in short-term liabilities 222,360 -201,171 Dividends paid -977,408 -977,070 Net cash from financing activities 451,653 927,047 Net increase(+)/decrease(-) in liquid funds 547,508 1,005,868 Liquid funds 1 January 1,164,539 158,674 Liquid funds 31 December 1,712,047 1,164,539

OPERATING AND FINANCIAL
REVIEW
CONSOLIDATED FINANCIAL
STATEMENTS NOTES KEY
FIGURES
PARENT COMPANY FINANCIAL
STATEMENTS
SIGNATURES FOR THE OPERATING AND FINANCIAL REVIEW AND
FINANCIAL STATEMENTS AUDITOR’S
REPORT
KEY FIGURES
2011–2020
QUARTERLY FINANCIAL
INFORMATION INVESTOR
INFORMATION 113322
Notes to the Parent Company Financial Statements, FAS
1 Accounting policies and principles
The financial statements of Fortum Oyj for the year ended 31 December 2020 are prepared in accordance with Finnish Accounting Standards (FAS).
1.1 Sales Sales include sales revenue from actual operations and exchange rate differences on trade receivables, less discounts and indirect taxes such as value added tax.
1.2 Other income Other income includes gains on the sales of property, plant and equipment and shareholdings, as well as all other operating income not related to the sales of products or services, such as rents.
1.3 Foreign currency items and derivative instruments Transactions denominated in foreign currencies have been valued using the exchange rate at the date of the transaction. Receivables and liabilities denominated in foreign currencies outstanding on the balance sheet date have been valued using the exchange rate quoted on the balance sheet date. Exchange rate differences have been entered in the financial net in the income statement.
Fortum Oyj enters into derivative contracts mainly for hedging foreign exchange and interest rate exposures in Fortum Group.
Fortum Oyj applies IFRS 9 Financial Instruments standard for derivative instruments and hedge accounting in statutory financial statements. Accounting principles on financial derivatives, see Note 4 Financial risk management, Note 14 Financial assets and liabilities by categories and Note 15 Financial assets and liabilities by fair value hierarchy in the Consolidated financial statements.
1.4 Income taxes Income taxes presented in the income statement consist of accrued taxes for the financial year and tax adjustments for prior years.
1.5 Shares in group companies The balance sheet value of shares in group companies consists of historical costs less write-downs. If the estimated future cash flows generated by a non-current asset are expected to be permanently lower than the carrying amount, an adjustment to the value is made to write-down the difference as an expense. If the basis for the write-down can no longer be justified at the balance sheet date, it is reversed.
1.6 Intangible assets and Property, plant and equipment The balance sheet value of intangible assets and property, plant and equipment consists of historical costs less depreciation and possible write-downs. Intangible assets and Property, plant and equipment are depreciated using straight-line depreciation based on the expected useful life of the asset.
The depreciation is based on the following expected useful lives: Machinery and equipment 3 – 15 years Intangible assets 5 – 10 years
1.7 Pension expenses Statutory pension obligations are covered through a compulsory pension insurance policy or Group's own pension fund. Costs for pension fund are recorded in the income statement based on contributions paid pursuant to the Finnish pension laws and regulations.
1.8 Long-term incentive schemes Costs related to the Fortum long-term incentive plans are accrued over the earnings period and the related liability is booked to the balance sheet.
1.9 Provisions Foreseeable future expenses and losses that have no corresponding revenue to which Fortum is committed or obliged to settle, and whose monetary value can be reasonably assessed, are entered as expenses in the income statement and included as provisions on the balance sheet.
2 Sales by market area
EUR 1,000 2020 2019 Finland 56,758 53,442 Other countries 58,654 28,855 Total 115,412 82,297
3 Other income
EUR 1,000 2020 2019 Rental and other income 6,973 7,010 Total 6,973 7,010

OPERATING AND FINANCIAL
REVIEW
CONSOLIDATED FINANCIAL
STATEMENTS NOTES KEY
FIGURES
PARENT COMPANY FINANCIAL
STATEMENTS
SIGNATURES FOR THE OPERATING AND FINANCIAL REVIEW AND
FINANCIAL STATEMENTS AUDITOR’S
REPORT
KEY FIGURES
2011–2020
QUARTERLY FINANCIAL
INFORMATION INVESTOR
INFORMATION 113333
4 Employee benefits
EUR 1,000 2020 2019 Personnel expenses
Wages, salaries and remunerations 35,938 28,940 Indirect employee costs
Pension costs 5,129 4,812 Other indirect employee costs 1,188 920 Other personnel expenses 2,654 2,741
Total 44,908 37,413 2020 2019
EUR 1,000
Markus Rauramo, President
and CEO from 1 July
2020
Pekka Lundmark,
President and CEO until
1 July 2020
Pekka Lundmark,
President and CEO
Compensation for the President and CEO Salaries and fringe benefits 808 521 1,057 Performance bonuses 1) 82 - 200 Share-based incentives 1) 249 94 898 Pensions (statutory) 140 82 207 Pensions (voluntary) 158 132 265 Social security expenses 31 18 39 Total 1,467 848 2,666
1) Based on estimated amounts.
EUR 1,000 2020 2019 Compensation for the Board of Directors 593 529 The compensation above is presented on accrual basis. Paid salaries and remunerations for the President and CEO Markus Rauramo were EUR 808 thousand, and for the former President and CEO Pekka Lundmark EUR 1,899 thousand (2019: 2,213).
For the President and CEO Markus Rauramo the retirement age is determined in accordance with the Finnish Employees’ Pension Act. The pension obligations are covered through insurance company.
Board members are not in an employment relationship or service contract with Fortum, and they are not given the opportunity to participate in Fortum’s STI or LTI programme, nor does Fortum have a pension plan that they can opt to take part in. The compensation of the board members is not tied to the sustainability performance of the Group.
See Note 10 Employee benefits and Board remuneration and Note 30 Pension obligations in the Consolidated financial statements. 2020 2019 Average number of employees 329 268
5 Auditor's fees
EUR 1,000 2020 2019 Audit fees 687 614 Audit-related assignments 20 73 Tax assignments 30 3 Total 738 690 Deloitte Oy is the appointed auditor until the next Annual General Meeting, to be held in 2021. Audit fees include fees for the audit of the consolidated financial statements, review of the interim reports as well as the fees for the audit of Fortum Oyj. Audit related assignments include fees for assurance of sustainability reporting and other assurance and associated services related to the audit. Tax assignments include fees for tax advice services.
6 Financial income and expenses
EUR 1,000 2020 2019 Dividend income from group companies 1,129,720 87,000 Interest and other financial income from group companies 39,768 31,531 Interest and other financial income from associated companies 10 11 Gains on sale of shares 420,701 - Write-downs of participations in group companies - -22,184 Interest and other financial income 1,065 309 Exchange rate differences 1,763 667 Changes in fair values of derivatives -4,439 -7,098 Interest and other financial expenses to group companies -2,699 -6,122 Interest and other financial expenses -71,099 -79,823 Total 1,514,790 4,291 Interest income 35,612 26,888 Interest expenses -68,213 -75,277 Interest costs - net -32,601 -48,389
7 Income tax expense
EUR 1,000 2020 2019 Taxes on regular business operations -15,182 -20,018 Taxes on group contributions 46,688 57,212 Total 31,506 37,194 Current taxes for the period 32,116 36,437 Current taxes for prior periods -1 -159 Changes in deferred tax -610 916 Total 31,506 37,194

OPERATING AND FINANCIAL
REVIEW
CONSOLIDATED FINANCIAL
STATEMENTS NOTES KEY
FIGURES
PARENT COMPANY FINANCIAL
STATEMENTS
SIGNATURES FOR THE OPERATING AND FINANCIAL REVIEW AND
FINANCIAL STATEMENTS AUDITOR’S
REPORT
KEY FIGURES
2011–2020
QUARTERLY FINANCIAL
INFORMATION INVESTOR
INFORMATION 113344
8 Non-current assets
Intangible assets EUR 1,000 Total Cost 1 January 2020 48,465 Additions 16,725 Disposals -16 Cost 31 December 2020 65,174 Accumulated depreciation 1 January 2020 24,047 Disposals -8 Depreciation for the year 6,473 Accumulated depreciation 31 December 2020 30,512 Carrying amount 31 December 2020 34,662 Carrying amount 31 December 2019 24,418
Property, plant and equipment
EUR 1,000
Machinery and
equipment
Advances paid and
construction in progress Total
Cost 1 January 2020 9,593 6,897 16,490 Additions and transfers between categories 1,205 - 1,205 Disposals -296 -3,562 -3,858 Cost 31 December 2020 10,502 3,335 13,837 Accumulated depreciation 1 January 2020 4,564 - 4,564 Disposals -155 -155 Depreciation for the year 2,092 2,092 Accumulated depreciation 31 December 2020 6,502 - 6,502 Carrying amount 31 December 2020 4,000 3,335 7,335 Carrying amount 31 December 2019 5,029 6,897 11,926
Investments
EUR 1,000
Shares in Group
companies
Participation in associated
companies
Receivables from Group
companies
Receivables from
associated companies
Other non-current
assets Total Cost 1 January 2020 17,847,406 5,656 2,952,176 16,603 8,092 20,829,933 Additions 1) 5 2,092,992 88 2,093,085 Disposals -500,461 -500,461 Cost 31 December 2020 17,346,950 5,656 5,045,168 16,691 8,092 22,422,557 Accumulated write-downs 1 January 2020 1,145,010 5,656 - 15,276 7,982 1,173,925 Accumulated write-downs 31 December 2020 1,145,010 5,656 - 15,276 7,982 1,173,925 Carrying amount 31 December 2020 16,201,940 - 5,045,168 1,415 110 21,248,632 Carrying amount 31 December 2019 16,702,396 - 2,952,176 1,327 110 19,656,008
1) Additions regarding shares comprise acquisitions of shares and capital contributions and reclassification between other non-current assets and shares in Group companies.

OPERATING AND FINANCIAL
REVIEW
CONSOLIDATED FINANCIAL
STATEMENTS NOTES KEY
FIGURES
PARENT COMPANY FINANCIAL
STATEMENTS
SIGNATURES FOR THE OPERATING AND FINANCIAL REVIEW AND
FINANCIAL STATEMENTS AUDITOR’S
REPORT
KEY FIGURES
2011–2020
QUARTERLY FINANCIAL
INFORMATION INVESTOR
INFORMATION 113355
9 Other current receivables
EUR 1,000 2020 2019 Other current receivables from group companies Trade receivables 12,209 9,285 Group contribution and other receivables 233,438 286,059 Accrued income and prepaid expenses 2,974 18,165 Total 248,621 313,509 Other current receivables Trade receivables 79 38 Other receivables 3,289 3,845 Accrued income and prepaid expenses 18,814 5,638 Total 22,182 9,521 See Note 4.2 Liquidity and refinancing risk in the Consolidated financial statements.
10 Changes in shareholders' equity
EUR 1,000 Share
capital Share
premium Hedging reserve
Retained earnings Total
1 January 2020 3,046,186 2,821,691 -19,534 4,238,662 10,087,004 Cash dividend -977,124 -977,124 Change in hedging reserve -4,668 -4,668 Profit for the year 1,678,522 1,678,522 31 December 2020 3,046,186 2,821,691 -24,202 4,940,060 10,783,734 1 January 2019 3,046,186 2,821,691 -10,987 5,002,377 10,859,265 Cash dividend -977,124 -977,124 Change in hedging reserve -8,547 -8,547 Profit for the year 213,410 213,410 31 December 2019 3,046,186 2,821,691 -19,534 4,238,662 10,087,004 EUR 1,000 2020 2019 Distributable funds Retained earnings 31 December 4,940,060 4,238,662 Hedging reserve -24,202 -19,534 Total 4,915,858 4,219,128
11 Interest-bearing liabilities
EUR 1,000 2020 2019 External interest-bearing loans Bonds 3,758,061 4,250,899 Loans from financial institutions 2,450,263 311,240 Other long-term interest-bearing loans 851,812 851,799 Total long-term interest-bearing loans 7,060,135 5,413,938 Current portion of long-term bonds 499,689 - Current portion of loans from financial institutions 13,695 26,308 Current portion of other long-term interest-bearing loans - 33,525 Other short-term interest-bearing loans 304,725 76,223 Total short-term interest-bearing loans 818,108 136,056 Total 1) 7,878,244 5,549,994
Maturity of external interest-bearing loans EUR 1,000 2020 2021 818,108 2022 3,039,310 2023 1,116,692 2024 317,747 2025 17,782 2026 and later 2,568,604 Total 1) 7,878,244 See Note 4.2 Liquidity and refinancing risk and Note 26 Interest-bearing liabilities in the Consolidated financial statements. EUR 1,000 2020 2019 External interest-bearing loans due after five years Bonds 1,631,999 1,615,738 Other long-term loans 936,606 851,799 Total 1) 2,568,604 2,467,538 EUR 1,000 2020 2019 Other interest-bearing loans due after five years Interest-bearing loans to associated companies 293,356 293,356 Total 293,356 293,356 1) Excludes loans to Group and associated companies.
Non-discounted cash flows of interest-bearing loans and their maturities, see Note 13 Financial derivatives.
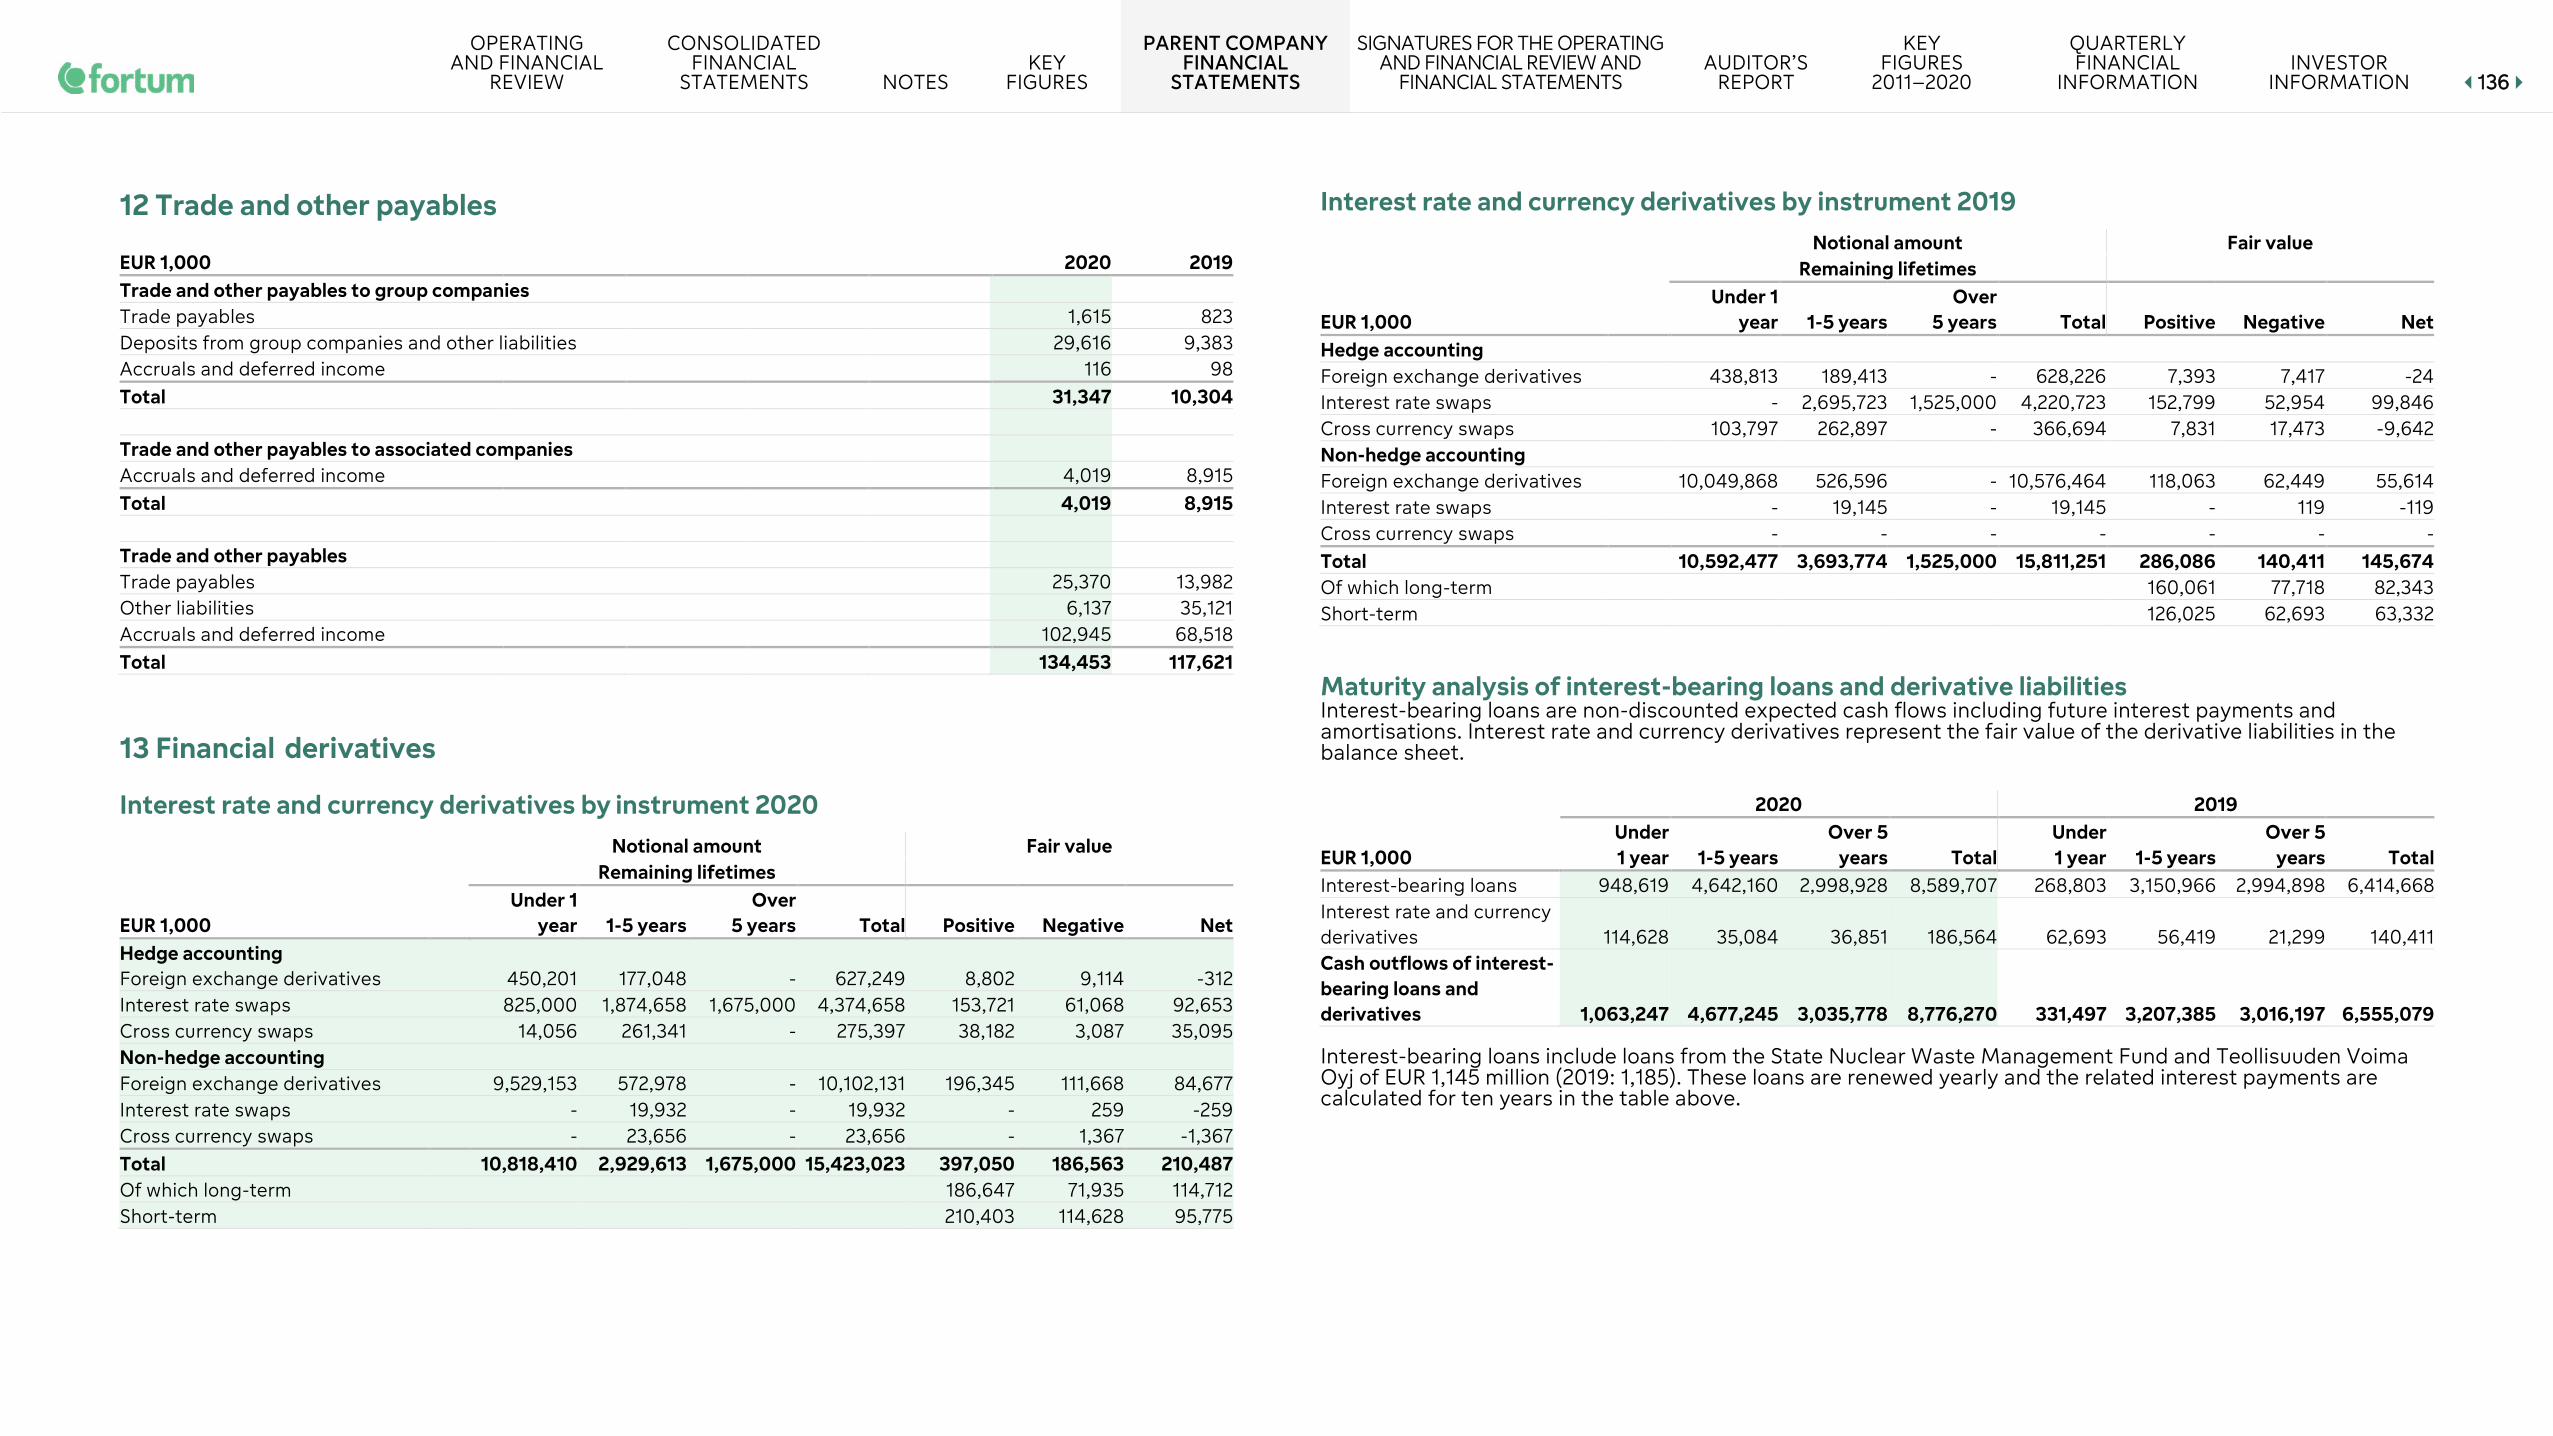
OPERATING AND FINANCIAL
REVIEW
CONSOLIDATED FINANCIAL
STATEMENTS NOTES KEY
FIGURES
PARENT COMPANY FINANCIAL
STATEMENTS
SIGNATURES FOR THE OPERATING AND FINANCIAL REVIEW AND
FINANCIAL STATEMENTS AUDITOR’S
REPORT
KEY FIGURES
2011–2020
QUARTERLY FINANCIAL
INFORMATION INVESTOR
INFORMATION 113366
12 Trade and other payables
EUR 1,000 2020 2019 Trade and other payables to group companies Trade payables 1,615 823 Deposits from group companies and other liabilities 29,616 9,383 Accruals and deferred income 116 98 Total 31,347 10,304 Trade and other payables to associated companies Accruals and deferred income 4,019 8,915 Total 4,019 8,915 Trade and other payables Trade payables 25,370 13,982 Other liabilities 6,137 35,121 Accruals and deferred income 102,945 68,518 Total 134,453 117,621
13 Financial derivatives
Interest rate and currency derivatives by instrument 2020 Notional amount Fair value Remaining lifetimes
EUR 1,000 Under 1
year 1-5 years Over
5 years Total Positive Negative Net Hedge accounting Foreign exchange derivatives 450,201 177,048 - 627,249 8,802 9,114 -312 Interest rate swaps 825,000 1,874,658 1,675,000 4,374,658 153,721 61,068 92,653 Cross currency swaps 14,056 261,341 - 275,397 38,182 3,087 35,095 Non-hedge accounting Foreign exchange derivatives 9,529,153 572,978 - 10,102,131 196,345 111,668 84,677 Interest rate swaps - 19,932 - 19,932 - 259 -259 Cross currency swaps - 23,656 - 23,656 - 1,367 -1,367 Total 10,818,410 2,929,613 1,675,000 15,423,023 397,050 186,563 210,487 Of which long-term 186,647 71,935 114,712 Short-term 210,403 114,628 95,775
Interest rate and currency derivatives by instrument 2019 Notional amount Fair value Remaining lifetimes
EUR 1,000 Under 1
year 1-5 years Over
5 years Total Positive Negative Net Hedge accounting Foreign exchange derivatives 438,813 189,413 - 628,226 7,393 7,417 -24 Interest rate swaps - 2,695,723 1,525,000 4,220,723 152,799 52,954 99,846 Cross currency swaps 103,797 262,897 - 366,694 7,831 17,473 -9,642 Non-hedge accounting Foreign exchange derivatives 10,049,868 526,596 - 10,576,464 118,063 62,449 55,614 Interest rate swaps - 19,145 - 19,145 - 119 -119 Cross currency swaps - - - - - - - Total 10,592,477 3,693,774 1,525,000 15,811,251 286,086 140,411 145,674 Of which long-term 160,061 77,718 82,343 Short-term 126,025 62,693 63,332
Maturity analysis of interest-bearing loans and derivative liabilities Interest-bearing loans are non-discounted expected cash flows including future interest payments and amortisations. Interest rate and currency derivatives represent the fair value of the derivative liabilities in the balance sheet.
2020 2019
EUR 1,000 Under 1 year 1-5 years
Over 5 years Total
Under 1 year 1-5 years
Over 5 years Total
Interest-bearing loans 948,619 4,642,160 2,998,928 8,589,707 268,803 3,150,966 2,994,898 6,414,668 Interest rate and currency derivatives 114,628 35,084 36,851 186,564 62,693 56,419 21,299 140,411 Cash outflows of interest-bearing loans and derivatives 1,063,247 4,677,245 3,035,778 8,776,270 331,497 3,207,385 3,016,197 6,555,079 Interest-bearing loans include loans from the State Nuclear Waste Management Fund and Teollisuuden Voima Oyj of EUR 1,145 million (2019: 1,185). These loans are renewed yearly and the related interest payments are calculated for ten years in the table above.
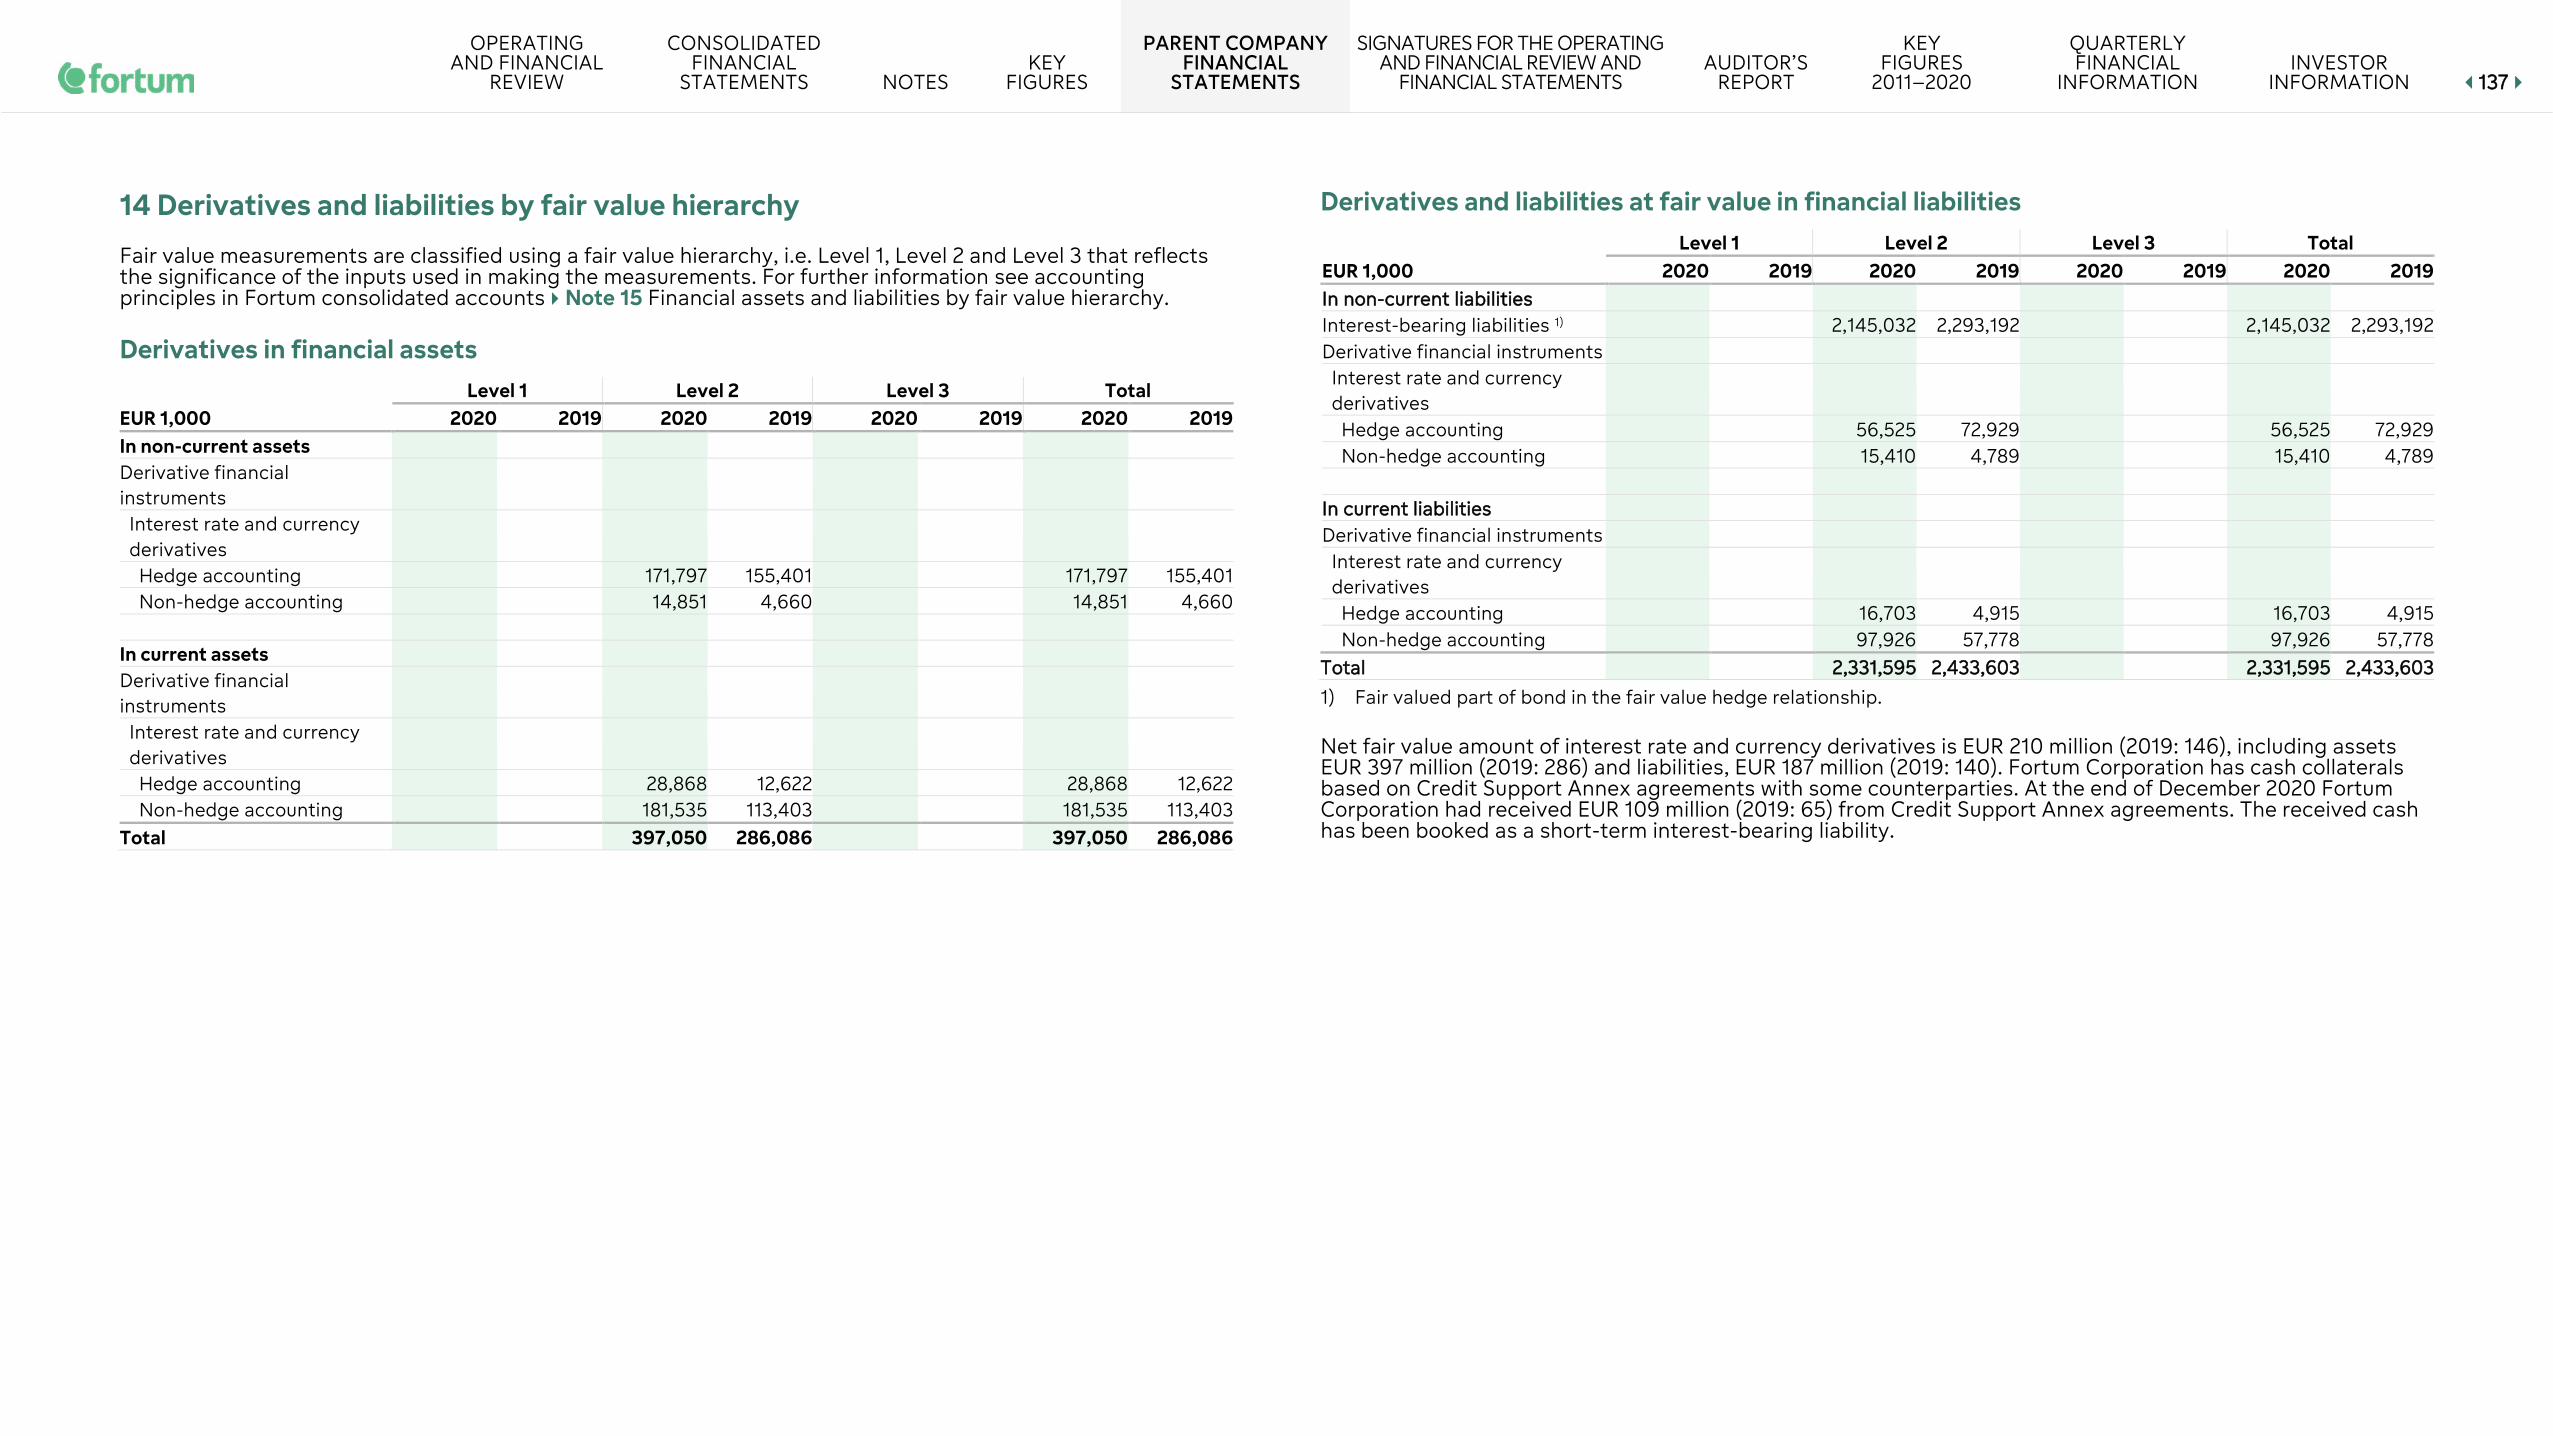
OPERATING AND FINANCIAL
REVIEW
CONSOLIDATED FINANCIAL
STATEMENTS NOTES KEY
FIGURES
PARENT COMPANY FINANCIAL
STATEMENTS
SIGNATURES FOR THE OPERATING AND FINANCIAL REVIEW AND
FINANCIAL STATEMENTS AUDITOR’S
REPORT
KEY FIGURES
2011–2020
QUARTERLY FINANCIAL
INFORMATION INVESTOR
INFORMATION 113377
14 Derivatives and liabilities by fair value hierarchy
Fair value measurements are classified using a fair value hierarchy, i.e. Level 1, Level 2 and Level 3 that reflects the significance of the inputs used in making the measurements. For further information see accounting principles in Fortum consolidated accounts Note 15 Financial assets and liabilities by fair value hierarchy.
Derivatives in financial assets Level 1 Level 2 Level 3 Total EUR 1,000 2020 2019 2020 2019 2020 2019 2020 2019 In non-current assets Derivative financial instruments
Interest rate and currency derivatives
Hedge accounting 171,797 155,401 171,797 155,401 Non-hedge accounting 14,851 4,660 14,851 4,660
In current assets Derivative financial instruments
Interest rate and currency derivatives
Hedge accounting 28,868 12,622 28,868 12,622 Non-hedge accounting 181,535 113,403 181,535 113,403
Total 397,050 286,086 397,050 286,086
Derivatives and liabilities at fair value in financial liabilities Level 1 Level 2 Level 3 Total EUR 1,000 2020 2019 2020 2019 2020 2019 2020 2019 IInn nnoonn--ccuurrrreenntt lliiaabbiilliittiieess Interest-bearing liabilities 1) 2,145,032 2,293,192 2,145,032 2,293,192 Derivative financial instruments
Interest rate and currency derivatives
Hedge accounting 56,525 72,929 56,525 72,929 Non-hedge accounting 15,410 4,789 15,410 4,789 IInn ccuurrrreenntt lliiaabbiilliittiieess Derivative financial instruments
Interest rate and currency derivatives
Hedge accounting 16,703 4,915 16,703 4,915 Non-hedge accounting 97,926 57,778 97,926 57,778 TToottaall 22,,333311,,559955 22,,443333,,660033 22,,333311,,559955 22,,443333,,660033
1) Fair valued part of bond in the fair value hedge relationship.
Net fair value amount of interest rate and currency derivatives is EUR 210 million (2019: 146), including assets EUR 397 million (2019: 286) and liabilities, EUR 187 million (2019: 140). Fortum Corporation has cash collaterals based on Credit Support Annex agreements with some counterparties. At the end of December 2020 Fortum Corporation had received EUR 109 million (2019: 65) from Credit Support Annex agreements. The received cash has been booked as a short-term interest-bearing liability.
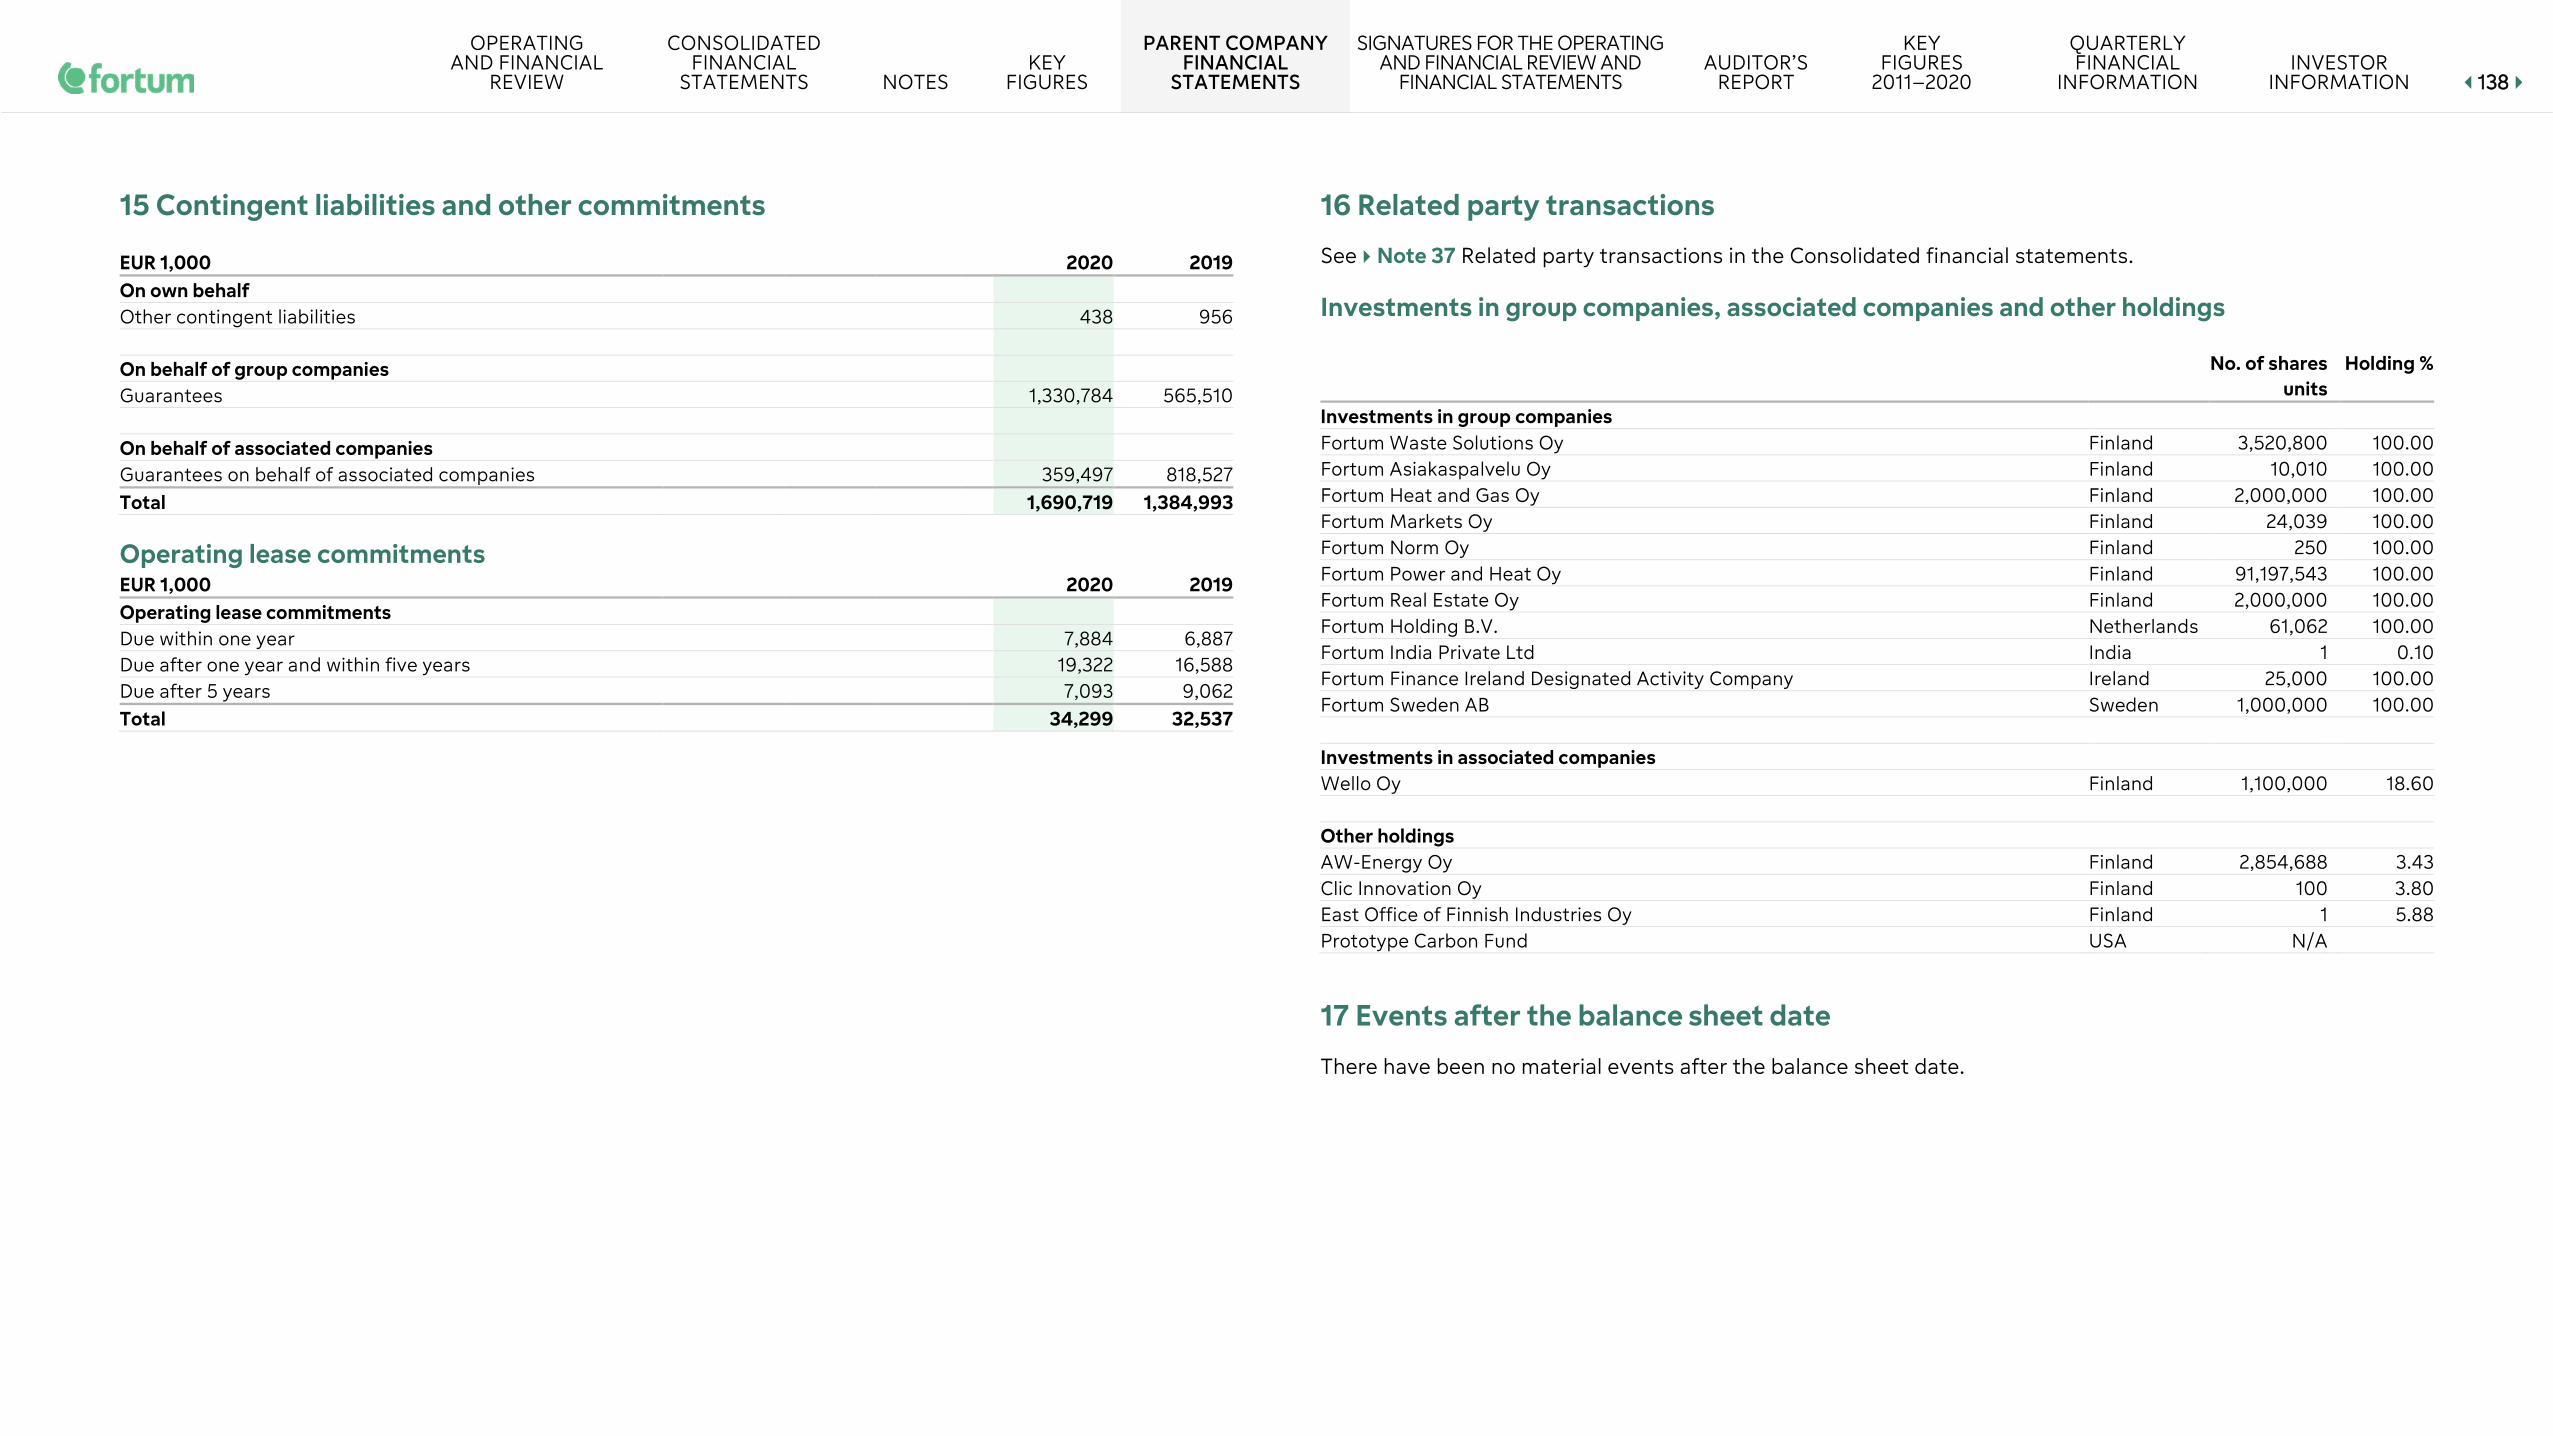
OPERATING AND FINANCIAL
REVIEW
CONSOLIDATED FINANCIAL
STATEMENTS NOTES KEY
FIGURES
PARENT COMPANY FINANCIAL
STATEMENTS
SIGNATURES FOR THE OPERATING AND FINANCIAL REVIEW AND
FINANCIAL STATEMENTS AUDITOR’S
REPORT
KEY FIGURES
2011–2020
QUARTERLY FINANCIAL
INFORMATION INVESTOR
INFORMATION 113388
15 Contingent liabilities and other commitments
EUR 1,000 2020 2019 On own behalf Other contingent liabilities 438 956 On behalf of group companies Guarantees 1,330,784 565,510 On behalf of associated companies Guarantees on behalf of associated companies 359,497 818,527 Total 1,690,719 1,384,993
Operating lease commitments EUR 1,000 2020 2019 Operating lease commitments Due within one year 7,884 6,887 Due after one year and within five years 19,322 16,588 Due after 5 years 7,093 9,062 Total 34,299 32,537
16 Related party transactions
See Note 37 Related party transactions in the Consolidated financial statements.
Investments in group companies, associated companies and other holdings
No. of shares Holding % units Investments in group companies Fortum Waste Solutions Oy Finland 3,520,800 100.00 Fortum Asiakaspalvelu Oy Finland 10,010 100.00 Fortum Heat and Gas Oy Finland 2,000,000 100.00 Fortum Markets Oy Finland 24,039 100.00 Fortum Norm Oy Finland 250 100.00 Fortum Power and Heat Oy Finland 91,197,543 100.00 Fortum Real Estate Oy Finland 2,000,000 100.00 Fortum Holding B.V. Netherlands 61,062 100.00 Fortum India Private Ltd India 1 0.10 Fortum Finance Ireland Designated Activity Company Ireland 25,000 100.00 Fortum Sweden AB Sweden 1,000,000 100.00 Investments in associated companies Wello Oy Finland 1,100,000 18.60 Other holdings AW-Energy Oy Finland 2,854,688 3.43 Clic Innovation Oy Finland 100 3.80 East Office of Finnish Industries Oy Finland 1 5.88 Prototype Carbon Fund USA N/A 17 Events after the balance sheet date There have been no material events after the balance sheet date.

OPERATING AND FINANCIAL
REVIEW
CONSOLIDATED FINANCIAL
STATEMENTS NOTES KEY
FIGURES
PARENT COMPANY FINANCIAL
STATEMENTS
SIGNATURES FOR THE OPERATING AND FINANCIAL REVIEW AND
FINANCIAL STATEMENTS AUDITOR’S
REPORT
KEY FIGURES
2011–2020
QUARTERLY FINANCIAL
INFORMATION INVESTOR
INFORMATION 113399
Signatures for the operating and financial review and financial statements
Espoo, 11 March 2021
Matti Lievonen Veli-Matti Reinikkala Eva Hamilton Teppo Paavola
Essimari Kairisto Anja McAlister Klaus-Dieter Maubach Philipp Rösler Annette Stube Markus Rauramo President and CEO

OPERATING AND FINANCIAL
REVIEW
CONSOLIDATED FINANCIAL
STATEMENTS NOTES KEY
FIGURES
PARENT COMPANY FINANCIAL
STATEMENTS
SIGNATURES FOR THE OPERATING AND FINANCIAL REVIEW AND
FINANCIAL STATEMENTS AUDITOR’S
REPORT
KEY FIGURES
2011–2020
QUARTERLY FINANCIAL
INFORMATION INVESTOR
INFORMATION 114400
Auditor’s report To the Annual General Meeting of Fortum Oyj
Report on the Audit of the Financial Statements
Opinion We have audited the financial statements of Fortum Oyj (business identity code 1463611-4) for the year ended 31 December, 2020. The financial statements comprise the consolidated income statement, consolidated statement of comprehensive income, consolidated balance sheet, consolidated statement of changes in total equity, consolidated cash flow statement and notes to the consolidated financial statements, including a summary of significant accounting policies, as well as the parent company’s, income statement, balance sheet, cash flow statement and notes to the financial statements.
In our opinion • the consolidated financial statements give a true and fair view of the group’s financial position, financial
performance and cash flows in accordance with International Financial Reporting Standards (IFRS) as adopted by the EU,
• the financial statements give a true and fair view of the parent company’s financial performance and financial position in accordance with the laws and regulations governing the preparation of financial statements in Finland and comply with statutory requirements.
Our opinion is consistent with the additional report submitted to the Audit Committee.
Basis for Opinion We conducted our audit in accordance with good auditing practice in Finland. Our responsibilities under good auditing practice are further described in the Auditor’s Responsibilities for the Audit of the Financial Statements section of our report.
We are independent of the parent company and of the group companies in accordance with the ethical requirements that are applicable in Finland and are relevant to our audit, and we have fulfilled our other ethical responsibilities in accordance with these requirements.
In our best knowledge and understanding, the non-audit services that we have provided to the parent company and group companies are in compliance with laws and regulations applicable in Finland regarding these services, and we have not provided any prohibited non-audit services referred to in Article 5(1) of regulation (EU) 537/2014. The non-audit services that we have provided have been disclosed in note 8 to the consolidated financial statements.
We believe that the audit evidence we have obtained is sufficient and appropriate to provide a basis for our opinion.
Key Audit Matters Key audit matters are those matters that, in our professional judgment, were of most significance in our audit of the financial statements of the current period. These matters were addressed in the context of our audit of the financial statements as a whole, and in forming our opinion thereon, and we do not provide a separate opinion on these matters.
We have also addressed the risk of management override of internal controls. This includes consideration of whether there was evidence of management bias that represented a risk of material misstatement due to fraud.

OPERATING AND FINANCIAL
REVIEW
CONSOLIDATED FINANCIAL
STATEMENTS NOTES KEY
FIGURES
PARENT COMPANY FINANCIAL
STATEMENTS
SIGNATURES FOR THE OPERATING AND FINANCIAL REVIEW AND
FINANCIAL STATEMENTS AUDITOR’S
REPORT
KEY FIGURES
2011–2020
QUARTERLY FINANCIAL
INFORMATION INVESTOR
INFORMATION 114411
Key audit matter How our audit addressed the key audit matter
Provisional acquisition accounting for Uniper Refer to notes 1, 2 and 3.
• At the beginning of the financial year 2020 Fortum held 49,99% of Uniper’s shares, and Uniper was consolidated as an associated company in Fortum Group.
• As part of our audit procedures we obtained understanding on the approach adopted by the management, when considering the provisional purchase price allocation in the financial
• Fortum acquired all Uniper shares held by the funds managed by Elliott Management Corporation and Knight Vinke Energy Advisors Limited, and their affiliates, and on 31 March 2020, Uniper was consolidated as a subsidiary. After the transaction, Fortum’s consolidated stake in Uniper was 73.4%, and the total investment in Uniper EUR 6.5 billion. See Note 1.7.
accounting in accordance with IFRS 3. Furthermore, we evaluated the significant estimates, assumptions and judgment applied by management.
• Our audit procedures involved e.g.: • We have read through the relevant
contracts and the minutes of the meetings of the Board of Directors, in order to identify the contractual terms, which would
• In the consolidated financial statements 2020, Fortum presents the preliminary purchase price allocation for the Uniper acquisition, which has resulted in adjustments to Uniper’s 31 March 2020 opening balance sheet. The Fair value adjustments were mainly related to property, plant and equipment and right-of-use assets, participations in associates and joint ventures, lease liabilities, other provisions, and deferred taxes. Excess of the acquisition value over the fair value of Uniper’s net assets, EUR 515 million, is preliminary goodwill. See Note 1.7.2 and 3.
potentially have an impact on accounting of the transaction;
• We have audited the purchase consideration to supporting documentation;
• We have evaluated, utilizing Deloitte’s valuation experts, if management’s approach and the valuation methods used by Fortum’s advisors are adequate and in compliance with the requirements as set by IFRS-standards: and
• Benchmarking the key market parameters used by the management to external data,
• The preliminary Uniper purchase price allocation is being finalized and will be completed within the one-year window from the acquisition date, by 31 March 2021.
such as comparing the applied discount rate to comparable discount rates applied in the industry.
Key audit matter How our audit addressed the key audit matter • Preparing a purchase price allocation requires
management judgement when determining the fair values of the assets acquired and liabilities assumed. The preliminary purchase price allocation may change when analyses are conducted, and further information becomes available. Any adjustments to the fair values of
• With our IFRS specialists we have evaluated the accounting treatment and accounting principles of the purchase price allocation in accordance with IFRS.
• We have assessed the appropriateness of financial statement disclosures related to preliminary purchase price allocation.
the assets acquired and liabilities assumed will impact the preliminary estimate of goodwill. These adjustments may be material. Fortum expects to conduct further analysis to assess the fair values of items such as property, plant and equipment, provisions, contingent liabilities and long-term purchase obligations.
• We consider acquisition as a key audit area due to its size and required judgement both from the accounting and the auditing perspective. Identification and valuation of the assets and liabilities are included in judgmental areas. Values of assets are determined by using the future cash flows and estimated profit before tax.

OPERATING AND FINANCIAL
REVIEW
CONSOLIDATED FINANCIAL
STATEMENTS NOTES KEY
FIGURES
PARENT COMPANY FINANCIAL
STATEMENTS
SIGNATURES FOR THE OPERATING AND FINANCIAL REVIEW AND
FINANCIAL STATEMENTS AUDITOR’S
REPORT
KEY FIGURES
2011–2020
QUARTERLY FINANCIAL
INFORMATION INVESTOR
INFORMATION 114422
Key audit matter How our audit addressed the key audit matter
Valuation of property, plant and equipment and goodwill Refer to Notes 2, 16 and 17.
• The consolidated balance sheet includes property, plant and equipment amounting to EUR 18 641 million (EUR 10 009 million) and goodwill amounting to EUR 1 069 million (EUR 612 million).
• We have evaluated the process how management has assessed the indicators for potential impairment. We have performed audit procedures on impairment models relating to material cash generating units.
• At the end of each reporting period management has to assesses whether there is any indication that asset may be impaired. If any such indication exists, the recoverable amount of the asset is estimated. Goodwill is subject to annual impairment test.
• We have obtained entity’s impairment testing documentation for goodwill and energy production assets and tested and evaluated the rationale of key assumptions applied by management on a sample basis, including commodity price forecasts, profit and cash flow
• The main assumptions used in the valuation of energy and heat production property, plant and equipment and goodwill relate to the estimated future operating cash flows and the discount rates that are used in calculating the present value.
• The potential indicators for impairment are among other things changes in electricity and fuel prices, regulatory/political changes relating to energy taxes and price regulations.
forecasts, terminal values, foreign exchange rates and the selection of discount rates.
• We have compared, that the forecasts used in the impairment testing calculations are based on forecasts approved by management.
• We challenged management’s assumptions and judgments with reference to historical data and, where applicable, external benchmarks.
• We assessed the models used in the impairment testing and carried out our testing for the
• The assumptions used in the valuation of the balances in question require management judgment.
• Estimates are also made in an acquisition when determining the fair values and remaining useful lives of acquired intangible and tangible assets.
• This matter is a significant risk of material misstatement referred to in EU Regulation No 537/241, point (c) of Article 10(2).
sensitivity calculations. • We assessed the adequacy of related
disclosures in the financial statements.
Key audit matter How our audit addressed the key audit matter
Fair value measurement of derivative financial instruments and hedge accounting Refer to Notes 4, 7, 14 and 15
• Assets related to derivative financial instruments in Fortum’s consolidated balance sheet amount to EUR 10,477 million (EUR 311 million) and liabilities to EUR 10,594 million (EUR 389 million). Changes in the fair value of derivatives hedging future cash flows in items affecting the comparability of the income statement amount to EUR -675 million (EUR -72 million) and cash flow hedges in other equity components to EUR -158 million (EUR -70 million).
• Our audit procedures included the assessment of Fortum's internal controls related to derivative transactions, hedging activities and the determination of fair values.
• We have assessed the appropriateness of the valuation models used by Fortum, including the assumptions used in the models. We have validated model input data with observable external information.
• We have conducted audit procedures regarding the existence and completeness of open
• The fair values of derivatives and their changes may have a material effect on Fortum's financial statements. Fortum’s business is exposed to fluctuations in prices and availability of commodities used in the production, transmission and sales of energy products. The main exposure is toward electricity prices and volumes, gas prices and volumes, prices of emissions and prices and availability of fuels. Fortum hedges its exposure to commodity market risks in order to reduce volatility in cash flow and to increase the predictability of future results.
derivative contracts. • We have assessed the appropriateness of
hedge accounting application according to the requirements of IFRS 9.
• We have assessed the appropriate presentation of derivatives in the consolidated financial statements.

OPERATING AND FINANCIAL
REVIEW
CONSOLIDATED FINANCIAL
STATEMENTS NOTES KEY
FIGURES
PARENT COMPANY FINANCIAL
STATEMENTS
SIGNATURES FOR THE OPERATING AND FINANCIAL REVIEW AND
FINANCIAL STATEMENTS AUDITOR’S
REPORT
KEY FIGURES
2011–2020
QUARTERLY FINANCIAL
INFORMATION INVESTOR
INFORMATION 114433
Key audit matter How our audit addressed the key audit matter
Shares in Nuclear Waste Funds and Nuclear provisions Refer to Notes 2 and 28.
• Fortum’s balance sheet includes Nuclear related provisions amounting to EUR 3 866 million (EUR 813 million) and Fortum’s share of the Nuclear Waste Management Fund amounting to EUR 3 445 million (EUR 813 million).
• Fortum's nuclear related provisions and the related part of the Nuclear Waste Management Fund are both presented separately in the balance sheet as disclosed in note 28.
• We have assessed Fortum’s accounting manual and principles for Nuclear Decommissioning Accounting, whether they are in line with IFRS accounting principles.
• We have assessed the assumptions and judgments made and adopted by the management in the accounting for the nuclear waste provisions and share in nuclear waste management fund which have been based on
• Fortum's share in the Nuclear Waste Management Funds is accounted for according to IFRIC 5 which states that the fund assets are measured at the lower of fair value or the value of the related liabilities.
• Due to complexity and materiality, the accounting treatment for nuclear decommissioning is complex and requires application of special accounting practice and management judgment when forming estimates for the basis of accounting such as technical plans, timing, cost estimates and discount rate.
current legislation and submitted by authorities. • We assessed the adequacy of related
disclosures in the financial statements.
Responsibilities of the Board of Directors and the President and CEO for the Financial Statements The Board of Directors and the President and CEO are responsible for the preparation of consolidated financial statements that give a true and fair view in accordance with International Financial Reporting Standards (IFRS) as adopted by the EU, and of financial statements that give a true and fair view in accordance with the laws and regulations governing the preparation of financial statements in Finland and comply with statutory requirements. The Board of Directors and the President and CEO are also responsible for such internal control as they determine is necessary to enable the preparation of financial statements that are free from material misstatement, whether due to fraud or error.
In preparing the financial statements, the Board of Directors and the President and CEO are responsible for assessing the parent company’s and the group’s ability to continue as a going concern, disclosing, as applicable, matters relating to going concern and using the going concern basis of accounting. The financial statements are prepared using the going concern basis of accounting unless there is an intention to liquidate the parent company or the group or cease operations, or there is no realistic alternative but to do so.
Auditor’s responsibilities for the Audit of the Financial Statements Our objectives are to obtain reasonable assurance about whether the financial statements as a whole are free from material misstatement, whether due to fraud or error, and to issue an auditor’s report that includes our opinion. Reasonable assurance is a high level of assurance, but is not a guarantee that an audit conducted in accordance with good auditing practice will always detect a material misstatement when it exists. Misstatements can arise from fraud or error and are considered material if, individually or in the aggregate, they could reasonably be expected to influence the economic decisions of users taken on the basis of the financial statements.
As part of an audit in accordance with good auditing practice, we exercise professional judgment and maintain professional scepticism throughout the audit. We also:
• Identify and assess the risks of material misstatement of the financial statements, whether due to fraud or error, design and perform audit procedures responsive to those risks, and obtain audit evidence that is sufficient and appropriate to provide a basis for our opinion. The risk of not detecting a material misstatement resulting from fraud is higher than for one resulting from error, as fraud may involve collusion, forgery, intentional omissions, misrepresentations, or the override of internal control.
• Obtain an understanding of internal control relevant to the audit in order to design audit procedures that are appropriate in the circumstances, but not for the purpose of expressing an opinion on the effectiveness of the parent company’s or the group’s internal control.
• Evaluate the appropriateness of accounting policies used and the reasonableness of accounting estimates and related disclosures made by management.
• Conclude on the appropriateness of the Board of Directors’ and the President and CEO use of the going concern basis of accounting and based on the audit evidence obtained, whether a material uncertainty exists related to events or conditions that may cast significant doubt on the parent company’s or the group’s ability to continue as a going concern. If we conclude that a material uncertainty exists, we are required to draw attention in our auditor’s report to the related disclosures in the financial statements or, if such disclosures are inadequate, to modify our opinion. Our conclusions are based on the audit evidence obtained up to the date of our auditor’s report. However, future events or conditions may cause the parent company or the group to cease to continue as a going concern.
OPERATING AND FINANCIAL
REVIEW
CONSOLIDATED FINANCIAL
STATEMENTS NOTES KEY
FIGURES
PARENT COMPANY FINANCIAL
STATEMENTS
SIGNATURES FOR THE OPERATING AND FINANCIAL REVIEW AND
FINANCIAL STATEMENTS AUDITOR’S
REPORT
KEY FIGURES
2011–2020
QUARTERLY FINANCIAL
INFORMATION INVESTOR
INFORMATION 114444
• Evaluate the overall presentation, structure and content of the financial statements, including the disclosures, and whether the financial statements represent the underlying transactions and events so that the financial statements give a true and fair view.
• Obtain sufficient appropriate audit evidence regarding the financial information of the entities or business activities within the group to express an opinion on the consolidated financial statements. We are responsible for the direction, supervision and performance of the group audit. We remain solely responsible for our audit opinion.
We communicate with those charged with governance regarding, among other matters, the planned scope and timing of the audit and significant audit findings, including any significant deficiencies in internal control that we identify during our audit.
We also provide those charged with governance with a statement that we have complied with relevant ethical requirements regarding independence, and communicate with them all relationships and other matters that may reasonably be thought to bear on our independence, and where applicable, related safeguards.
From the matters communicated with those charged with governance, we determine those matters that were of most significance in the audit of the financial statements of the current period and are therefore the key audit matters. We describe these matters in our auditor’s report unless law or regulation precludes public disclosure about the matter or when, in extremely rare circumstances, we determine that a matter should not be communicated in our report because the adverse consequences of doing so would reasonably be expected to outweigh the public interest benefits of such communication.
Other Reporting Requirements
Information on our audit engagement We were first appointed as auditors by the Annual General Meeting on 16.3.2006, and our appointment represents a total period of uninterrupted engagement of 15 years.
Other information The Board of Directors and the President and CEO are responsible for the other information. The other information comprises the Operating and Financial Review and the information included in the Financials, but does not include the financial statements and our auditor´s report thereon. We have obtained the Operating and Financial Review prior to the date of this auditor’s report, and the Financials is expected to be made available to us after that date.
Our opinion on the financial statements does not cover the other information. In connection with our audit of the financial statements, our responsibility is to read the other information
identified above and, in doing so, consider whether the other information is materially inconsistent with the financial statements or our knowledge obtained in the audit, or otherwise appears to be materially misstated. With respect to Operating and Financial Review, our responsibility also includes considering whether the Operating and Financial Review has been prepared in accordance with the applicable laws and regulations.
In our opinion, the information in the Operating and Financial Review is consistent with the information in the financial statements and the Operating and Financial Review has been prepared in accordance with the applicable laws and regulations.
If, based on the work we have performed on the other information that we obtained prior to the date of this auditor´s report, we conclude that there is a material misstatement of this other information, we are required to report that fact. We have nothing to report in this regard.
Other opinions We support that the financial statements should be adopted. The proposal by the Board of Directors regarding the use of the profit shown on the balance sheet is in compliance with the Limited Liability Companies Act. We support that the Board of Directors of the parent company and the President and CEO should be discharged from liability for the financial period audited by us.
Espoo, 11 March 2021
Deloitte Oy Audit Firm Jukka Vattulainen Authorised Public Accountant (KHT)

OPERATING AND FINANCIAL
REVIEW
CONSOLIDATED FINANCIAL
STATEMENTS NOTES KEY
FIGURES
PARENT COMPANY FINANCIAL
STATEMENTS
SIGNATURES FOR THE OPERATING AND FINANCIAL REVIEW AND
FINANCIAL STATEMENTS AUDITOR’S
REPORT
KEY FIGURES
2011–2020
QUARTERLY FINANCIAL
INFORMATION INVESTOR
INFORMATION 114455
Financial key figures Share key figures Segment key figures Capital expenditure Operational key figures
Financial key figures Comparability of information presented in tables Fortum consolidated Uniper into its balance sheet as of 31 March 2020 and, from 1 April 2020, consolidated Uniper’s results into its income statement. In 2019 and in the first quarter of 2020, Uniper was consolidated as an associated company into Fortum’s income statement.
Following the consolidation of Uniper, Fortum’s business profile changed and the previous long-term financial targets did not appropriately reflect the Group’s new business profile. In May 2020, Fortum’s Board of Directors consequently decided to remove the financial targets (return on capital employed of at least 10% and comparable net debt-to-EBITDA of around 2.5x) as of the first quarter of 2020. In December 2020 in connection with the strategy update, Fortum updated its long-term financial target to be Financial net debt/comparable EBITDA below 2x. For more information, see Note 5 Capital risk management.
Fortum announced the sale of Swedish Distribution business in March 2015. After the divestment of the Swedish Distribution business Fortum has no electricity distribution operations and therefore Distribution segment was treated as discontinued operations in 2015, with restatement of year 2014, according to IFRS 5 Non-current Assets Held for Sale and Discontinued Operations.
Information in the tables and graphs presented for year 2012 or earlier is not restated due to the adoption of IFRS 10 and IFRS 11. Adoption of standards influences treatment of Fortum’s holding in Stockholm Exergi AB (Exergi), (previously AB Fortum Värme samägt med Stockholms stad), in the consolidated financial statements. From 1 January 2014 onwards Exergi is treated as a joint venture and thus consolidated with equity method. Before the change the company was consolidated as a subsidiary with 50% minority interest.
Fortum adopted IFRS 16 on 1 January 2019, and IFRS 9 and IFRS 15 on 1 January 2018. Fortum applied the transition relief for not restating the comparatives of 2018 and 2017, respectively. In 2019, Fortum classified certain assets as held for sale. These assets and the related liabilities are included in segment assets and liabilities at 31 December 2019. For information of Alternative Performance Measures used by Fortum, see Definitions of key figures and Note 1 Significant accounting policies.
EUR million or as indicated 2011 2012 2013 2014 2015 2016 2017 2018 2019 2020 Change 20/19 % Income statement Sales total Fortum 6,161 6,159 5,309 4,751 3,702 3,632 4,520 5,242 5,447 49,015 800 Sales continuing operations 4,088 3,459 3,632 4,520 5,242 5,447 49,015 800 EBITDA total Fortum 3,008 2,538 2,129 3,954 4,640 1,006 1,623 1,674 1,693 2,688 59 EBITDA continuing operations 1,673 196 1,006 1,623 1,674 1,693 2,688 59 Comparable EBITDA total Fortum 2,374 2,416 1,975 1,873 1,265 1,015 1,275 1,523 1,766 2,434 38 Comparable EBITDA continuing operations 1,457 1,102 1,015 1,275 1,523 1,766 2,434 38 Operating profit total Fortum 2,402 1,874 1,508 3,428 4,245 633 1,158 1,138 1,118 1,599 43 - of sales% 39.0 30.4 28.4 72.2 114.7 17.4 25.6 21.7 20.5 3.3 Operating profit continuing operations 1,296 -150 633 1,158 1,138 1,118 1,599 43 - of sales% 31.7 -4.3 17.4 25.6 21.7 20.5 3.3 Comparable operating profit total Fortum 1,802 1,752 1,403 1,351 922 644 811 987 1,191 1,344 13 Comparable operating profit continuing operations 1,085 808 644 811 987 1,191 1,344 13 Share of profit/loss of associates and joint ventures total Fortum 91 23 178 149 20 131 148 38 744 656 -12 Profit before income tax total Fortum 2,228 1,586 1,398 3,360 4,088 595 1,111 1,040 1,728 2,199 27 - of sales% 36.2 25.8 26.3 70.7 110.4 16.4 24.6 19.8 31.7 4.5 Profit before income tax continuing operations 1,232 -305 595 1,111 1,040 1,728 2,199 27 - of sales% 30.1 -8.8 16.4 24.6 19.8 31.7 4.5 Profit for the period total Fortum 1,862 1,512 1,212 3,161 4,142 504 882 858 1,507 1,855 23 - of which attributable to owners of the parent 1,769 1,416 1,204 3,154 4,138 496 866 843 1,482 1,823 23 Profit for the period continuing operations 1,089 -228 504 882 858 1,507 1,855 23 - of which attributable to owners of the parent 1,081 -231 496 866 843 1,482 1,823 23
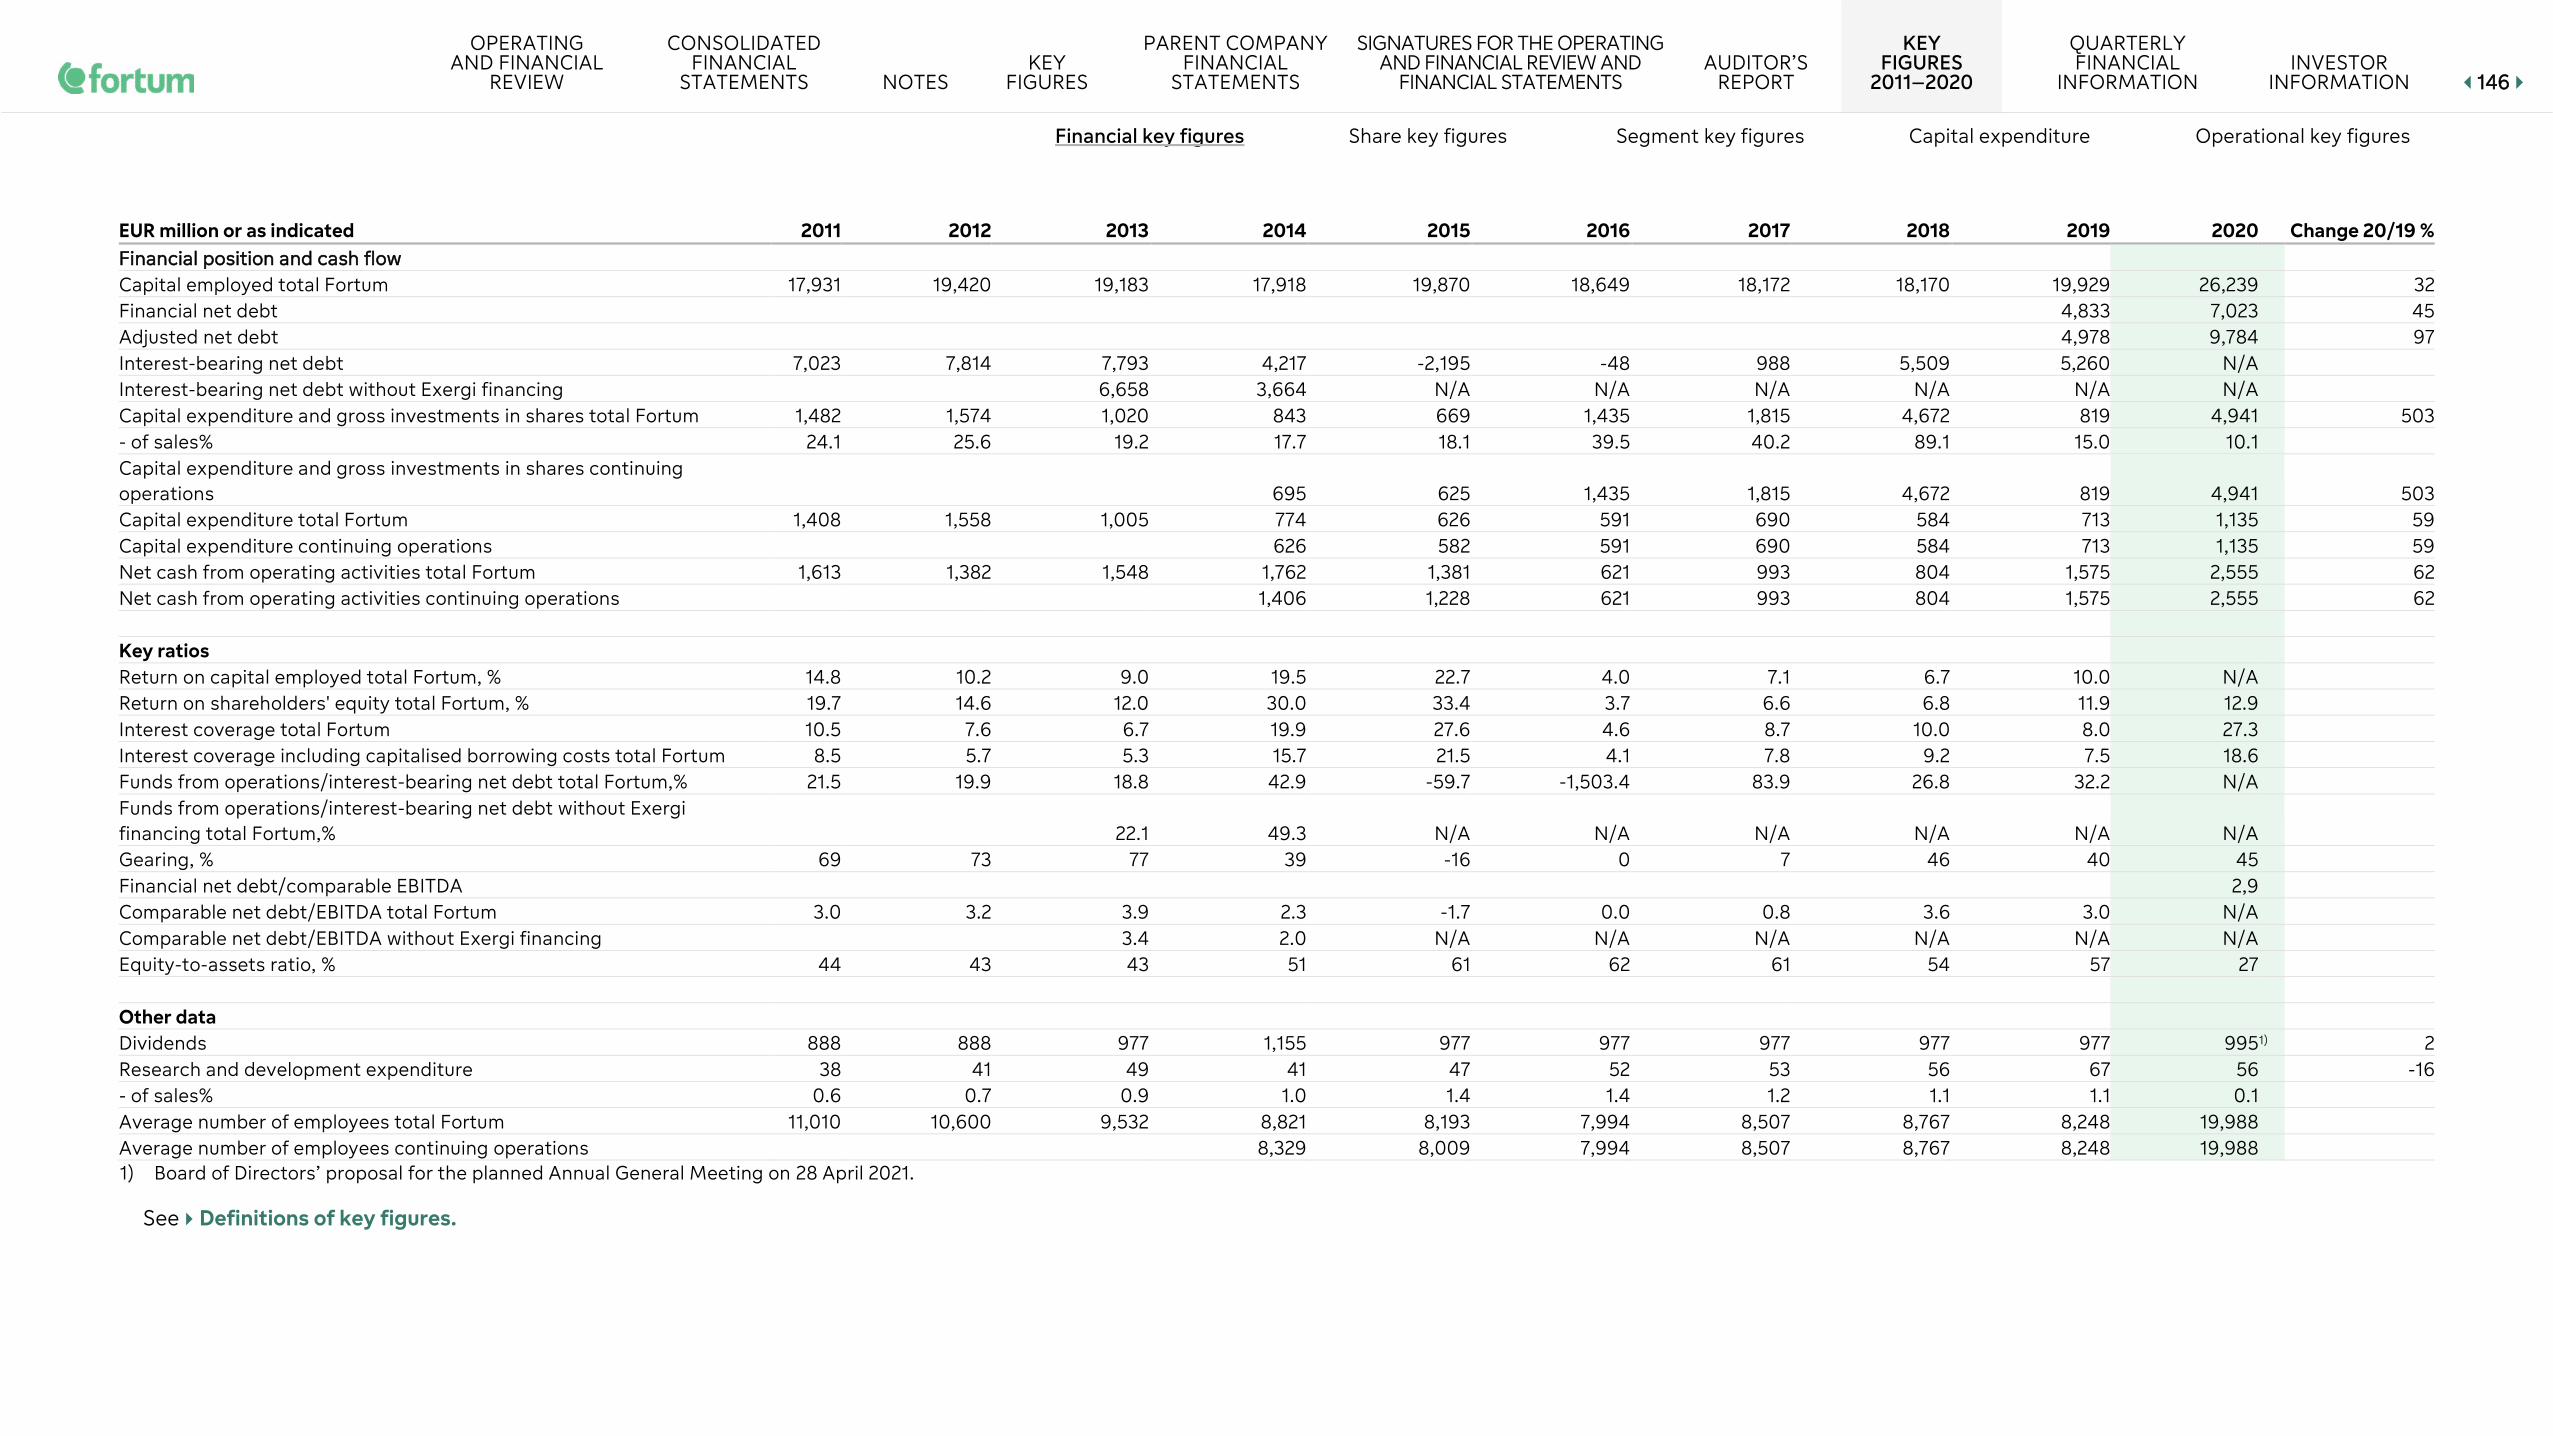
OPERATING AND FINANCIAL
REVIEW
CONSOLIDATED FINANCIAL
STATEMENTS NOTES KEY
FIGURES
PARENT COMPANY FINANCIAL
STATEMENTS
SIGNATURES FOR THE OPERATING AND FINANCIAL REVIEW AND
FINANCIAL STATEMENTS AUDITOR’S
REPORT
KEY FIGURES
2011–2020
QUARTERLY FINANCIAL
INFORMATION INVESTOR
INFORMATION 114466
Financial key figures Share key figures Segment key figures Capital expenditure Operational key figures
EUR million or as indicated 2011 2012 2013 2014 2015 2016 2017 2018 2019 2020 Change 20/19 % FFiinnaanncciiaall ppoossiittiioonn aanndd ccaasshh ffllooww Capital employed total Fortum 17,931 19,420 19,183 17,918 19,870 18,649 18,172 18,170 19,929 26,239 32 Financial net debt 4,833 7,023 45 Adjusted net debt 4,978 9,784 97 Interest-bearing net debt 7,023 7,814 7,793 4,217 -2,195 -48 988 5,509 5,260 N/A Interest-bearing net debt without Exergi financing 6,658 3,664 N/A N/A N/A N/A N/A N/A Capital expenditure and gross investments in shares total Fortum 1,482 1,574 1,020 843 669 1,435 1,815 4,672 819 4,941 503 - of sales% 24.1 25.6 19.2 17.7 18.1 39.5 40.2 89.1 15.0 10.1 Capital expenditure and gross investments in shares continuing operations 695 625 1,435 1,815 4,672 819 4,941 503 Capital expenditure total Fortum 1,408 1,558 1,005 774 626 591 690 584 713 1,135 59 Capital expenditure continuing operations 626 582 591 690 584 713 1,135 59 Net cash from operating activities total Fortum 1,613 1,382 1,548 1,762 1,381 621 993 804 1,575 2,555 62 Net cash from operating activities continuing operations 1,406 1,228 621 993 804 1,575 2,555 62 Key ratios Return on capital employed total Fortum, % 14.8 10.2 9.0 19.5 22.7 4.0 7.1 6.7 10.0 N/A Return on shareholders' equity total Fortum, % 19.7 14.6 12.0 30.0 33.4 3.7 6.6 6.8 11.9 12.9 Interest coverage total Fortum 10.5 7.6 6.7 19.9 27.6 4.6 8.7 10.0 8.0 27.3 Interest coverage including capitalised borrowing costs total Fortum 8.5 5.7 5.3 15.7 21.5 4.1 7.8 9.2 7.5 18.6 Funds from operations/interest-bearing net debt total Fortum,% 21.5 19.9 18.8 42.9 -59.7 -1,503.4 83.9 26.8 32.2 N/A Funds from operations/interest-bearing net debt without Exergi financing total Fortum,% 22.1 49.3 N/A N/A N/A N/A N/A N/A Gearing, % 69 73 77 39 -16 0 7 46 40 45 Financial net debt/comparable EBITDA 2,9 Comparable net debt/EBITDA total Fortum 3.0 3.2 3.9 2.3 -1.7 0.0 0.8 3.6 3.0 N/A Comparable net debt/EBITDA without Exergi financing 3.4 2.0 N/A N/A N/A N/A N/A N/A Equity-to-assets ratio, % 44 43 43 51 61 62 61 54 57 27 Other data Dividends 888 888 977 1,155 977 977 977 977 977 995 1) 2 Research and development expenditure 38 41 49 41 47 52 53 56 67 56 -16 - of sales% 0.6 0.7 0.9 1.0 1.4 1.4 1.2 1.1 1.1 0.1 Average number of employees total Fortum 11,010 10,600 9,532 8,821 8,193 7,994 8,507 8,767 8,248 19,988 Average number of employees continuing operations 8,329 8,009 7,994 8,507 8,767 8,248 19,988
1) Board of Directors’ proposal for the planned Annual General Meeting on 28 April 2021.
See Definitions of key figures.
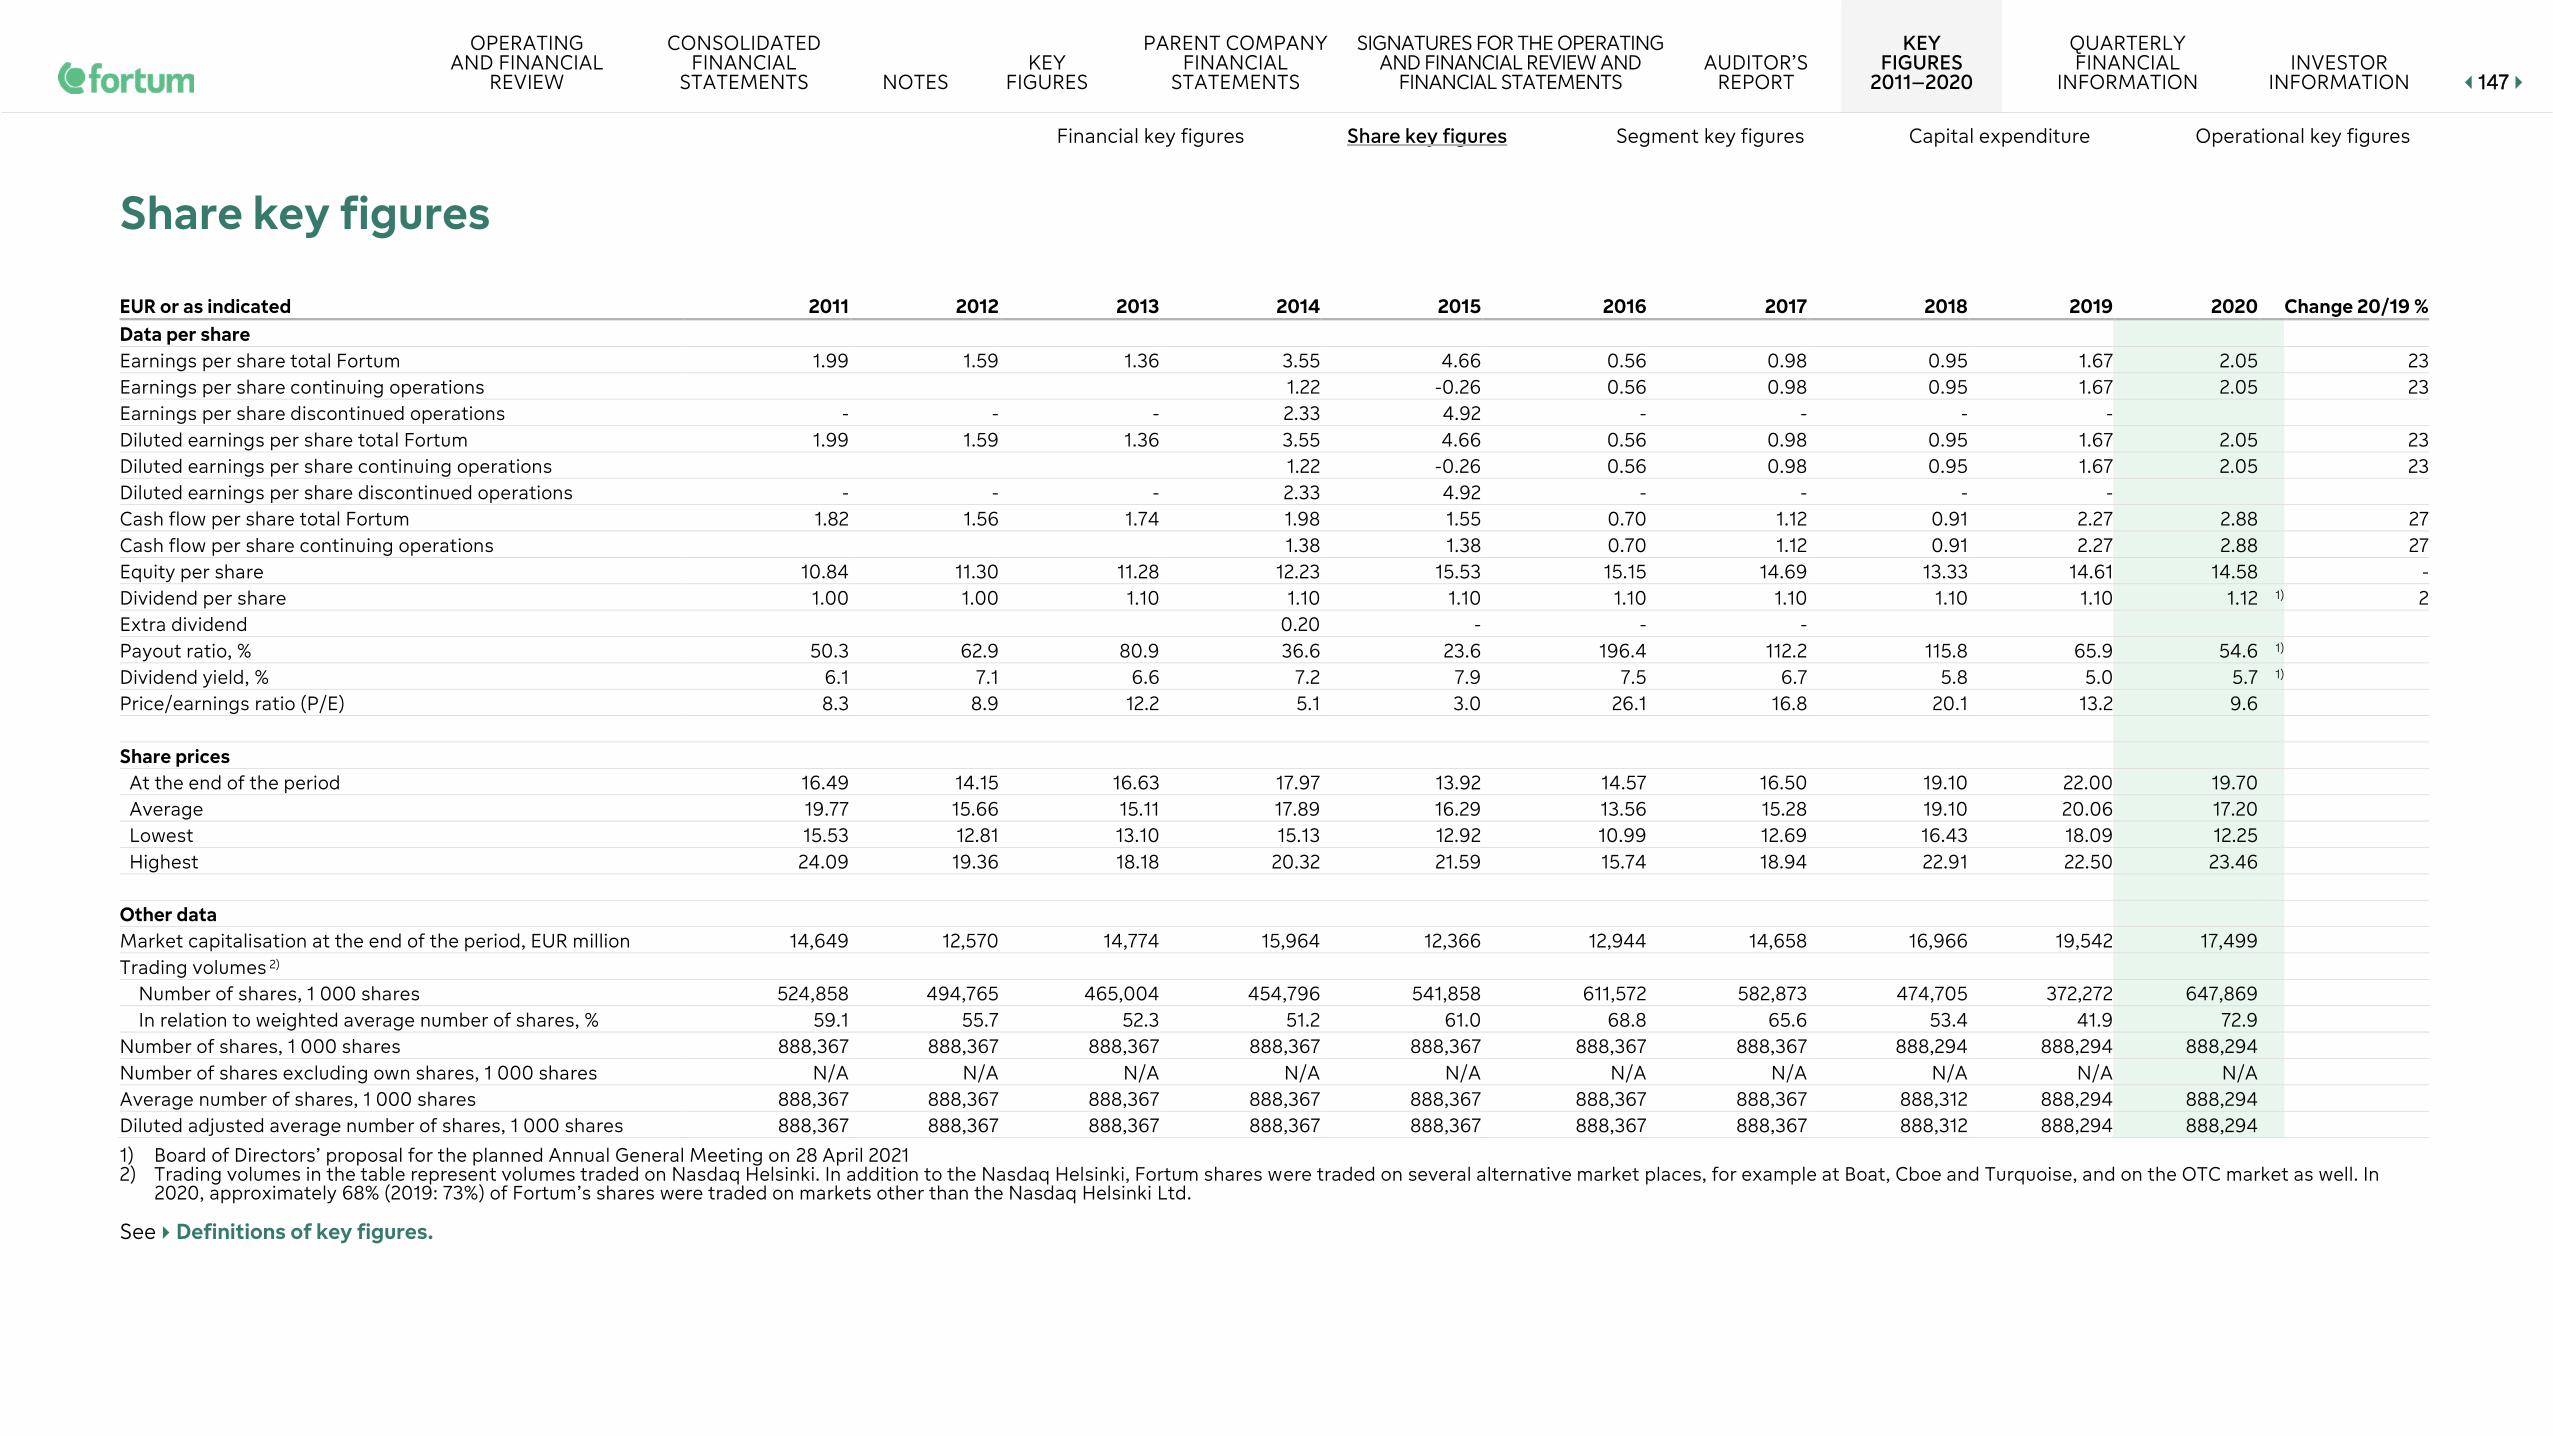
OPERATING AND FINANCIAL
REVIEW
CONSOLIDATED FINANCIAL
STATEMENTS NOTES KEY
FIGURES
PARENT COMPANY FINANCIAL
STATEMENTS
SIGNATURES FOR THE OPERATING AND FINANCIAL REVIEW AND
FINANCIAL STATEMENTS AUDITOR’S
REPORT
KEY FIGURES
2011–2020
QUARTERLY FINANCIAL
INFORMATION INVESTOR
INFORMATION 114477
Financial key figures Share key figures Segment key figures Capital expenditure Operational key figures
Share key figures
EUR or as indicated
2011
2012 2013 2014 2015 2016 2017 2018 2019 2020 Change 20/19 % Data per share Earnings per share total Fortum 1.99 1.59 1.36 3.55 4.66 0.56 0.98 0.95 1.67 2.05 23 Earnings per share continuing operations 1.22 -0.26 0.56 0.98 0.95 1.67 2.05 23 Earnings per share discontinued operations - - - 2.33 4.92 - - - - Diluted earnings per share total Fortum 1.99 1.59 1.36 3.55 4.66 0.56 0.98 0.95 1.67 2.05 23 Diluted earnings per share continuing operations 1.22 -0.26 0.56 0.98 0.95 1.67 2.05 23 Diluted earnings per share discontinued operations - - - 2.33 4.92 - - - - Cash flow per share total Fortum 1.82 1.56 1.74 1.98 1.55 0.70 1.12 0.91 2.27 2.88 27 Cash flow per share continuing operations 1.38 1.38 0.70 1.12 0.91 2.27 2.88 27 Equity per share 10.84 11.30 11.28 12.23 15.53 15.15 14.69 13.33 14.61 14.58 - Dividend per share 1.00 1.00 1.10 1.10 1.10 1.10 1.10 1.10 1.10 1.12 1) 2 Extra dividend 0.20 - - - Payout ratio, % 50.3 62.9 80.9 36.6 23.6 196.4 112.2 115.8 65.9 54.6 1) Dividend yield, % 6.1 7.1 6.6 7.2 7.9 7.5 6.7 5.8 5.0 5.7 1) Price/earnings ratio (P/E) 8.3 8.9 12.2 5.1 3.0 26.1 16.8 20.1 13.2 9.6 Share prices
At the end of the period 16.49 14.15 16.63 17.97 13.92 14.57 16.50 19.10 22.00 19.70 Average 19.77 15.66 15.11 17.89 16.29 13.56 15.28 19.10 20.06 17.20 Lowest 15.53 12.81 13.10 15.13 12.92 10.99 12.69 16.43 18.09 12.25 Highest 24.09 19.36 18.18 20.32 21.59 15.74 18.94 22.91 22.50 23.46
Other data Market capitalisation at the end of the period, EUR million 14,649 12,570 14,774 15,964 12,366 12,944 14,658 16,966 19,542 17,499 Trading volumes 2)
Number of shares, 1 000 shares 524,858 494,765 465,004 454,796 541,858 611,572 582,873 474,705 372,272 647,869 In relation to weighted average number of shares, % 59.1 55.7 52.3 51.2 61.0 68.8 65.6 53.4 41.9 72.9
Number of shares, 1 000 shares 888,367 888,367 888,367 888,367 888,367 888,367 888,367 888,294 888,294 888,294 Number of shares excluding own shares, 1 000 shares N/A N/A N/A N/A N/A N/A N/A N/A N/A N/A Average number of shares, 1 000 shares 888,367 888,367 888,367 888,367 888,367 888,367 888,367 888,312 888,294 888,294 Diluted adjusted average number of shares, 1 000 shares 888,367 888,367 888,367 888,367 888,367 888,367 888,367 888,312 888,294 888,294
1) Board of Directors’ proposal for the planned Annual General Meeting on 28 April 2021 2) Trading volumes in the table represent volumes traded on Nasdaq Helsinki. In addition to the Nasdaq Helsinki, Fortum shares were traded on several alternative market places, for example at Boat, Cboe and Turquoise, and on the OTC market as well. In
2020, approximately 68% (2019: 73%) of Fortum’s shares were traded on markets other than the Nasdaq Helsinki Ltd. See Definitions of key figures.
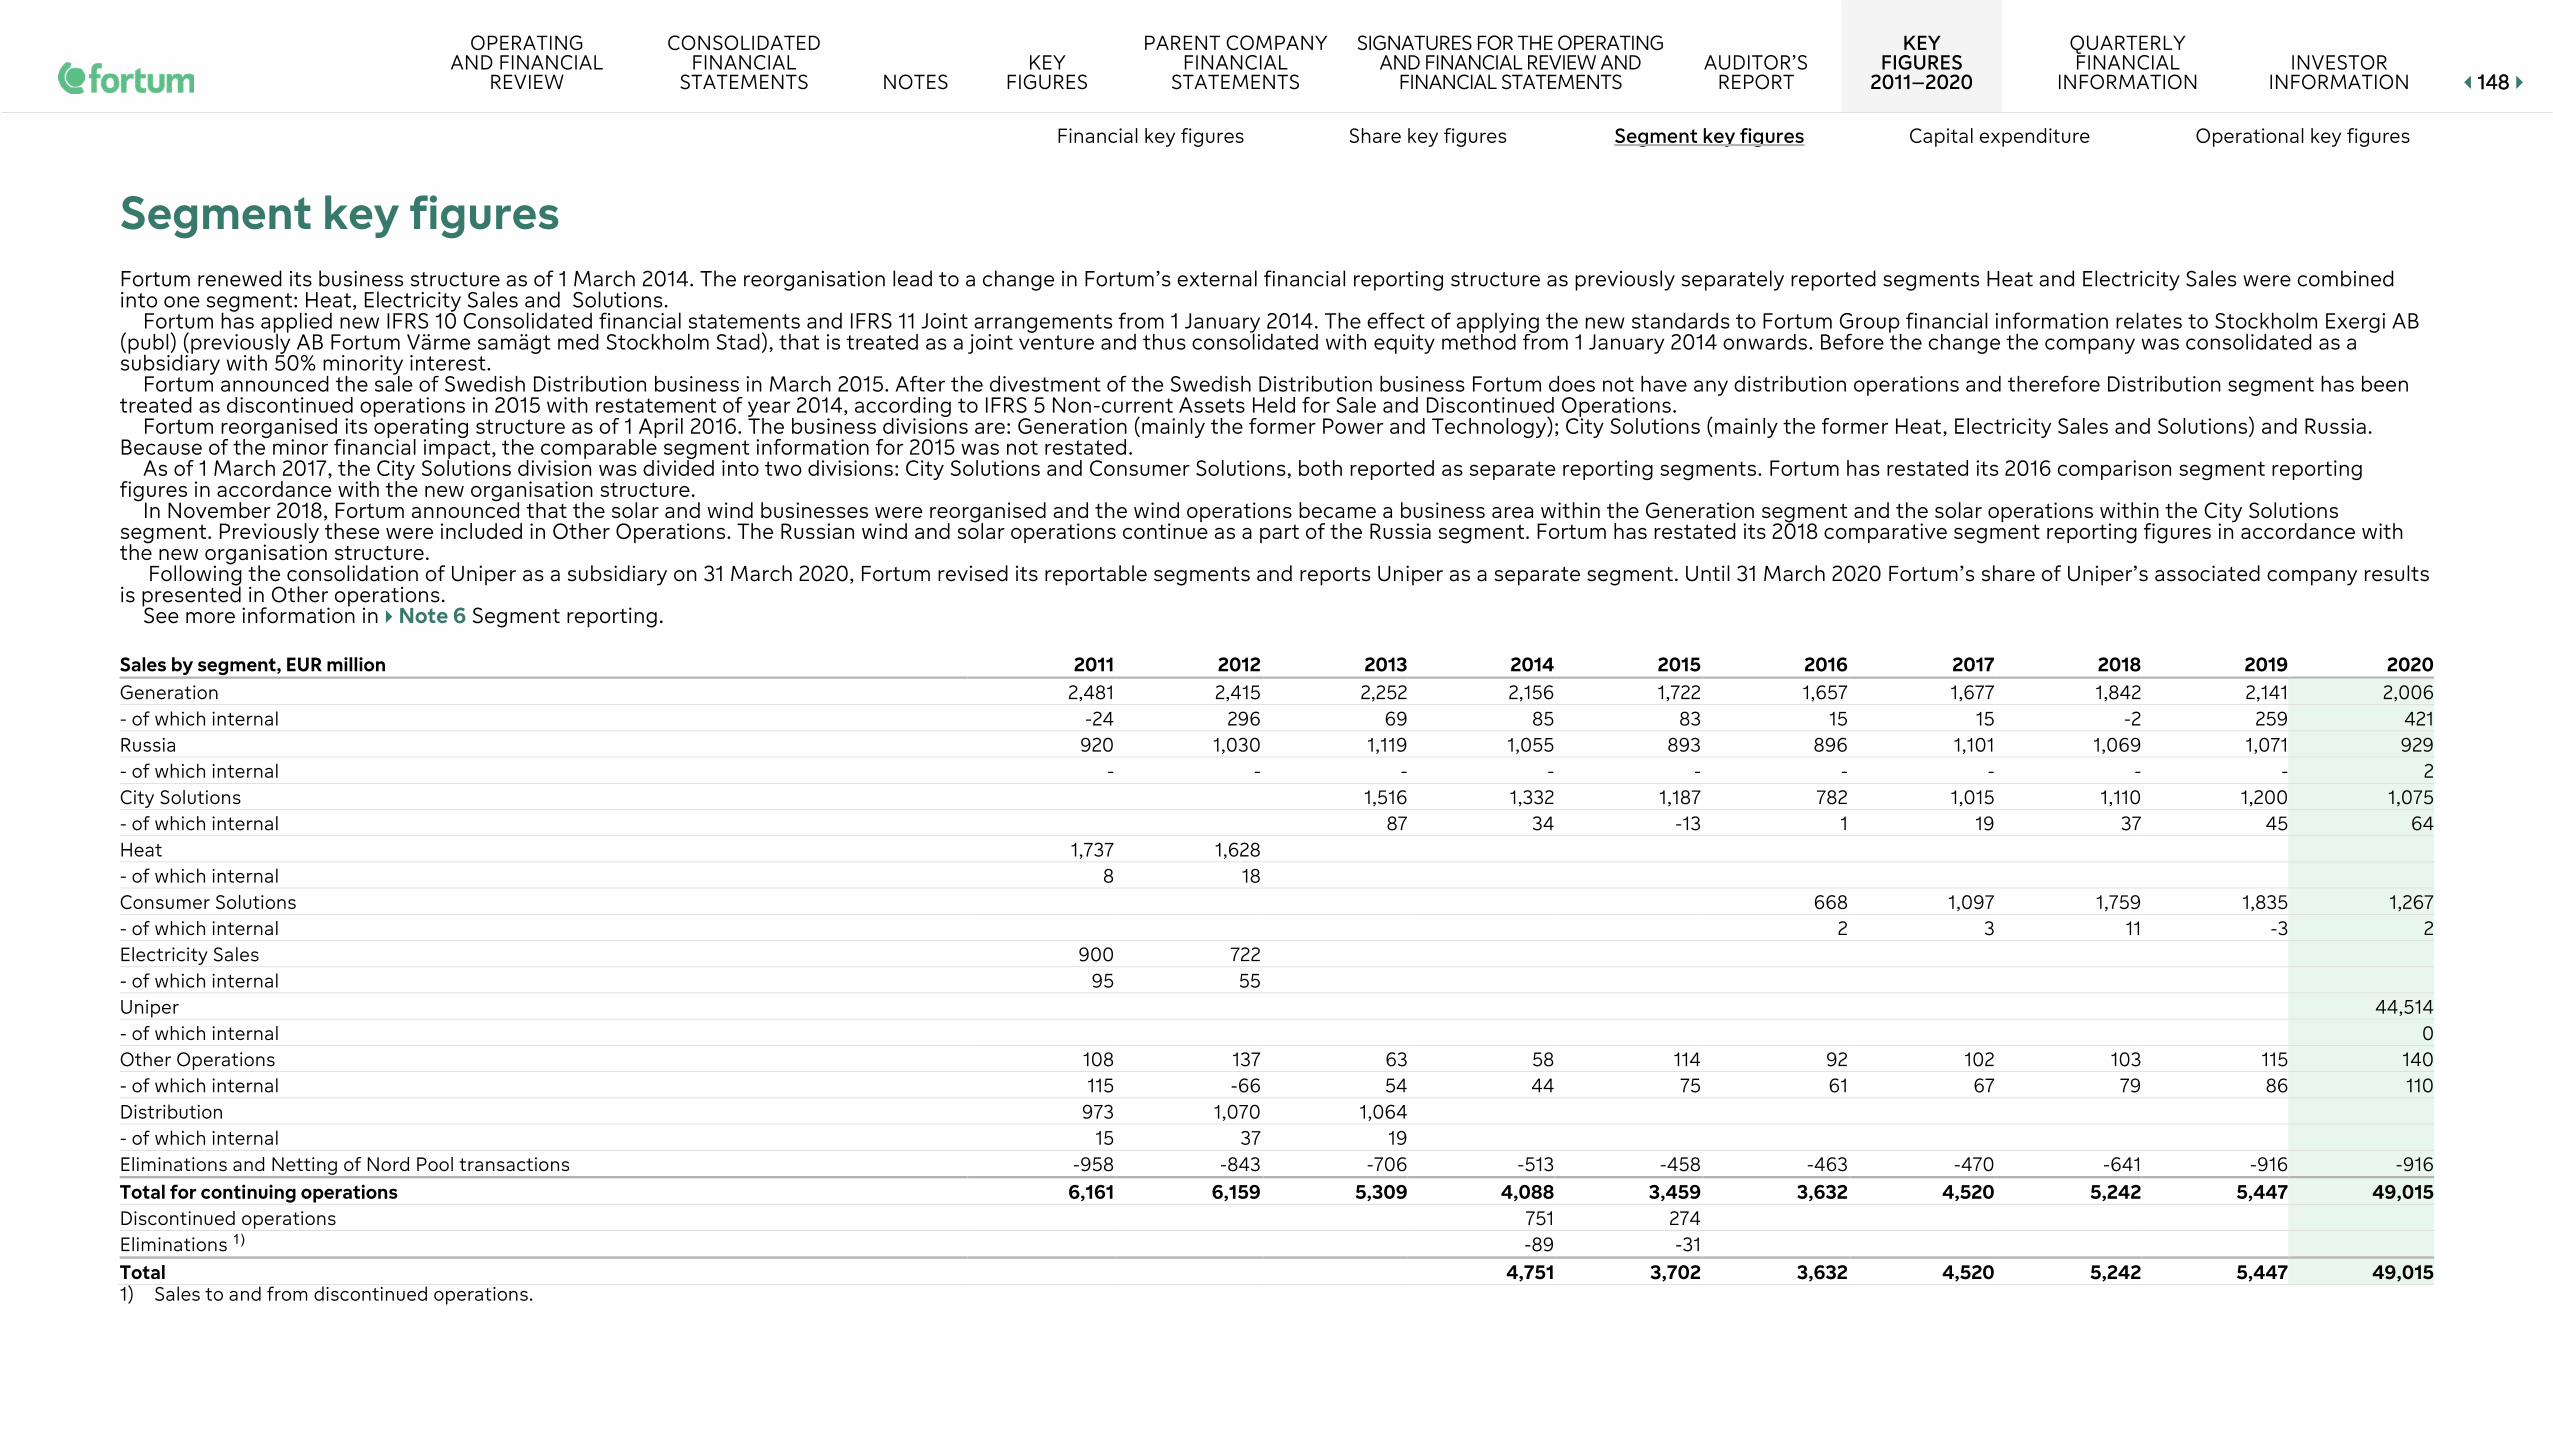
OPERATING AND FINANCIAL
REVIEW
CONSOLIDATED FINANCIAL
STATEMENTS NOTES KEY
FIGURES
PARENT COMPANY FINANCIAL
STATEMENTS
SIGNATURES FOR THE OPERATING AND FINANCIAL REVIEW AND
FINANCIAL STATEMENTS AUDITOR’S
REPORT
KEY FIGURES
2011–2020
QUARTERLY FINANCIAL
INFORMATION INVESTOR
INFORMATION 114488
Financial key figures Share key figures Segment key figures Capital expenditure Operational key figures
Segment key figures Fortum renewed its business structure as of 1 March 2014. The reorganisation lead to a change in Fortum’s external financial reporting structure as previously separately reported segments Heat and Electricity Sales were combined into one segment: Heat, Electricity Sales and Solutions.
Fortum has applied new IFRS 10 Consolidated financial statements and IFRS 11 Joint arrangements from 1 January 2014. The effect of applying the new standards to Fortum Group financial information relates to Stockholm Exergi AB (publ) (previously AB Fortum Värme samägt med Stockholm Stad), that is treated as a joint venture and thus consolidated with equity method from 1 January 2014 onwards. Before the change the company was consolidated as a subsidiary with 50% minority interest.
Fortum announced the sale of Swedish Distribution business in March 2015. After the divestment of the Swedish Distribution business Fortum does not have any distribution operations and therefore Distribution segment has been treated as discontinued operations in 2015 with restatement of year 2014, according to IFRS 5 Non-current Assets Held for Sale and Discontinued Operations.
Fortum reorganised its operating structure as of 1 April 2016. The business divisions are: Generation (mainly the former Power and Technology); City Solutions (mainly the former Heat, Electricity Sales and Solutions) and Russia. Because of the minor financial impact, the comparable segment information for 2015 was not restated.
As of 1 March 2017, the City Solutions division was divided into two divisions: City Solutions and Consumer Solutions, both reported as separate reporting segments. Fortum has restated its 2016 comparison segment reporting figures in accordance with the new organisation structure.
In November 2018, Fortum announced that the solar and wind businesses were reorganised and the wind operations became a business area within the Generation segment and the solar operations within the City Solutions segment. Previously these were included in Other Operations. The Russian wind and solar operations continue as a part of the Russia segment. Fortum has restated its 2018 comparative segment reporting figures in accordance with the new organisation structure.
Following the consolidation of Uniper as a subsidiary on 31 March 2020, Fortum revised its reportable segments and reports Uniper as a separate segment. Until 31 March 2020 Fortum’s share of Uniper’s associated company results is presented in Other operations.
See more information in Note 6 Segment reporting.
Sales by segment, EUR million 2011 2012 2013 2014 2015 2016 2017 2018 2019 2020 Generation 2,481 2,415 2,252 2,156 1,722 1,657 1,677 1,842 2,141 2,006 - of which internal -24 296 69 85 83 15 15 -2 259 421 Russia 920 1,030 1,119 1,055 893 896 1,101 1,069 1,071 929 - of which internal - - - - - - - - - 2 City Solutions 1,516 1,332 1,187 782 1,015 1,110 1,200 1,075 - of which internal 87 34 -13 1 19 37 45 64 Heat 1,737 1,628 - of which internal 8 18 Consumer Solutions 668 1,097 1,759 1,835 1,267 - of which internal 2 3 11 -3 2 Electricity Sales 900 722 - of which internal 95 55 Uniper 44,514 - of which internal 0 Other Operations 108 137 63 58 114 92 102 103 115 140 - of which internal 115 -66 54 44 75 61 67 79 86 110 Distribution 973 1,070 1,064 - of which internal 15 37 19 Eliminations and Netting of Nord Pool transactions -958 -843 -706 -513 -458 -463 -470 -641 -916 -916 Total for continuing operations 6,161 6,159 5,309 4,088 3,459 3,632 4,520 5,242 5,447 49,015 Discontinued operations 751 274 Eliminations 1) -89 -31 Total 4,751 3,702 3,632 4,520 5,242 5,447 49,015
1) Sales to and from discontinued operations.

OPERATING AND FINANCIAL
REVIEW
CONSOLIDATED FINANCIAL
STATEMENTS NOTES KEY
FIGURES
PARENT COMPANY FINANCIAL
STATEMENTS
SIGNATURES FOR THE OPERATING AND FINANCIAL REVIEW AND
FINANCIAL STATEMENTS AUDITOR’S
REPORT
KEY FIGURES
2011–2020
QUARTERLY FINANCIAL
INFORMATION INVESTOR
INFORMATION 114499
Financial key figures Share key figures Segment key figures Capital expenditure Operational key figures
Comparable operating profit by segment, EUR million 2011 2012 2013 2014 2015 2016 2017 2018 2019 2020 Generation 1,201 1,146 859 877 561 417 478 628 794 722 Russia 74 68 156 161 201 191 296 271 316 251 City Solutions 109 104 108 64 98 135 120 47 Heat 278 271 Consumer Solutions 48 41 53 79 90 Electricity Sales 27 39 Uniper 363 Other Operations -73 -92 -54 -57 -63 -77 -102 -99 -118 -129 Distribution 295 320 332 Comparable operating profit 1,802 1,752 1,403 1,085 808 644 811 987 1,191 1,344 Impairment charges and reversals -918 27 6 -4 -8 2 Capital gains and other related items 284 155 61 305 22 38 326 102 7 765 Impact from acquisition accounting -222 Changes in fair values of derivatives hedging future cash flow -65 14 98 -72 -675 Nuclear fund adjustment 1) -11 1 -45 Other 386 Other items affecting comparability 2) 316 -33 45 -94 -62 Operating profit, continuing operations 2,402 1,874 1,508 1,296 -150 633 1,158 1,138 1,118 1,599 Discontinued operations 2,132 4,395 Operating profit 3,428 4,245 633 1,158 1,138 1,118 1,599 1) In 2020, Nuclear fund adjustment was reclassified from Items affecting comparability to Other financial expenses, net. Comparatives for 2019 have been reclassified accordingly. See Note 1.7 Summary of Uniper acquisition impact to consolidated financial
statements. 2) Other items affecting comparability comprise Changes in fair values of derivatives hedging future cash flow and Nuclear fund adjustment.
Comparable EBITDA by segment, EUR million 2011 2012 2013 2014 2015 2016 2017 2018 2019 2020 Generation 1,310 1,260 1,007 998 680 527 603 763 939 886 Russia 148 189 258 304 267 312 438 417 469 394 City Solutions 211 204 209 186 262 310 308 239 Heat 471 481 Consumer Solutions 55 57 110 141 153 Electricity Sales 29 40 Uniper 856 Other Operations -66 -83 -49 -49 -53 -64 -83 -78 -91 -94 Distribution 482 529 548 Total for continuing operations 2,374 2,416 1,975 1,457 1,102 1,015 1,275 1,523 1,766 2,434 Discontinued operations 416 163 Total 1,873 1,265 1,015 1,275 1,523 1,766 2,434

OPERATING AND FINANCIAL
REVIEW
CONSOLIDATED FINANCIAL
STATEMENTS NOTES KEY
FIGURES
PARENT COMPANY FINANCIAL
STATEMENTS
SIGNATURES FOR THE OPERATING AND FINANCIAL REVIEW AND
FINANCIAL STATEMENTS AUDITOR’S
REPORT
KEY FIGURES
2011–2020
QUARTERLY FINANCIAL
INFORMATION INVESTOR
INFORMATION 115500
Financial key figures Share key figures Segment key figures Capital expenditure Operational key figures
Depreciation and amortisation, EUR million 2011 2012 2013 2014 2015 2016 2017 2018 2019 2020 Generation 109 114 148 121 118 110 125 135 145 164 Russia 108 121 150 147 117 123 142 147 153 143 City Solutions 102 100 101 121 163 175 188 191 Heat 193 210 Consumer Solutions 7 16 57 62 63 Electricity Sales 2 1 Uniper 494 Other Operations 7 9 5 8 10 13 18 22 28 35 Distribution 187 209 216 Total for continuing operations 606 664 621 377 346 373 464 536 575 1,090 Discontinued operations 150 50 Total 526 395 373 464 536 575 1,090 Share of profit of associates and joint ventures by segment, EUR million 2011 2012 2013 2014 2015 2016 2017 2018 2019 2020 Generation 3 -12 4 -14 -111 -34 -1 -72 10 29 Russia 30 27 46 35 32 38 31 36 59 47 City Solutions 91 88 59 76 80 74 37 57 Heat 19 20 Electricity Sales 2 - Uniper 54 Other Operations 23 -20 32 37 40 51 38 0 638 470 Distribution 14 8 4 Total for continuing operations 91 23 178 146 20 131 148 38 744 656 Discontinued operations 3 0 Total 149 20 131 148 38 744 656
Capital expenditure by segment, EUR million 2011 2012 2013 2014 2015 2016 2017 2018 2019 2020 Generation 131 190 179 197 187 196 174 248 247 158 Russia 670 568 435 340 285 201 152 54 67 43 City Solutions 123 86 105 109 170 209 314 219 Heat 297 464 Consumer Solutions 3 7 47 55 57 Electricity Sales 5 1 Uniper 624 Other Operations 16 11 12 3 6 83 187 26 30 34 Distribution 289 324 255 Total for continuing operations 1,408 1,558 1,005 626 582 591 690 584 713 1,135 Discontinued operations 147 44 Total 774 626 591 690 584 713 1,135

OPERATING AND FINANCIAL
REVIEW
CONSOLIDATED FINANCIAL
STATEMENTS NOTES KEY
FIGURES
PARENT COMPANY FINANCIAL
STATEMENTS
SIGNATURES FOR THE OPERATING AND FINANCIAL REVIEW AND
FINANCIAL STATEMENTS AUDITOR’S
REPORT
KEY FIGURES
2011–2020
QUARTERLY FINANCIAL
INFORMATION INVESTOR
INFORMATION 115511
Financial key figures Share key figures Segment key figures Capital expenditure Operational key figures
Gross investments in shares by segment, EUR million 2011 2012 2013 2014 2015 2016 2017 2018 2019 2020 Generation 17 - 2 2 16 7 90 14 13 70 Russia 24 - 0 27 0 0 125 63 66 48 City Solutions 11 37 23 698 386 33 9 114 Heat 32 10 Consumer Solutions 117 486 0 - 0 Uniper 3 Other Operations 1 6 2 4 4 22 39 3,977 18 3,572 Distribution - - 0 Total for continuing operations 74 16 15 69 43 844 1,125 4,088 106 3,807 Discontinued operations - - Total 69 43 844 1,125 4,088 106 3,807 Gross divestments of shares by segment, EUR million 2011 2012 2013 2014 2015 2016 2017 2018 2019 2020 Generation 3 102 79 67 0 0 0 160 12 171 Russia 23 - - 0 0 127 0 0 - 0 City Solutions 11 446 27 33 0 147 2 895 Heat 203 269 Consumer Solutions 1 55 0 - 10 Electricity Sales 16 2 Uniper 69 Other Operations 0 0 - 2 - 0 687 0 16 81 Distribution 323 37 52 Total for continuing operations 568 410 142 515 27 161 742 306 30 1,226 Discontinued operations 2,681 6,369 Total 3,196 6,395 161 742 306 30 1,226 Comparable net assets by segment, EUR million 2015 2016 2017 2018 2019 2020 Generation 5,931 5,815 5,672 6,485 6,019 6,234 Russia 2,561 3,284 3,161 2,789 3,212 2,431 City Solutions 2,182 2,873 3,728 3,794 3,945 3,679 Consumer Solutions 154 638 648 637 565 Uniper 7,432 Other Operations 258 514 276 4,023 4,400 136 Total for continuing operations 10,932 12,641 13,474 17,739 18,214 20,477 Fortum is disclosing Comparable net assets instead of Net assets from 2016 onwards. Net assets until 2015 are disclosed below.
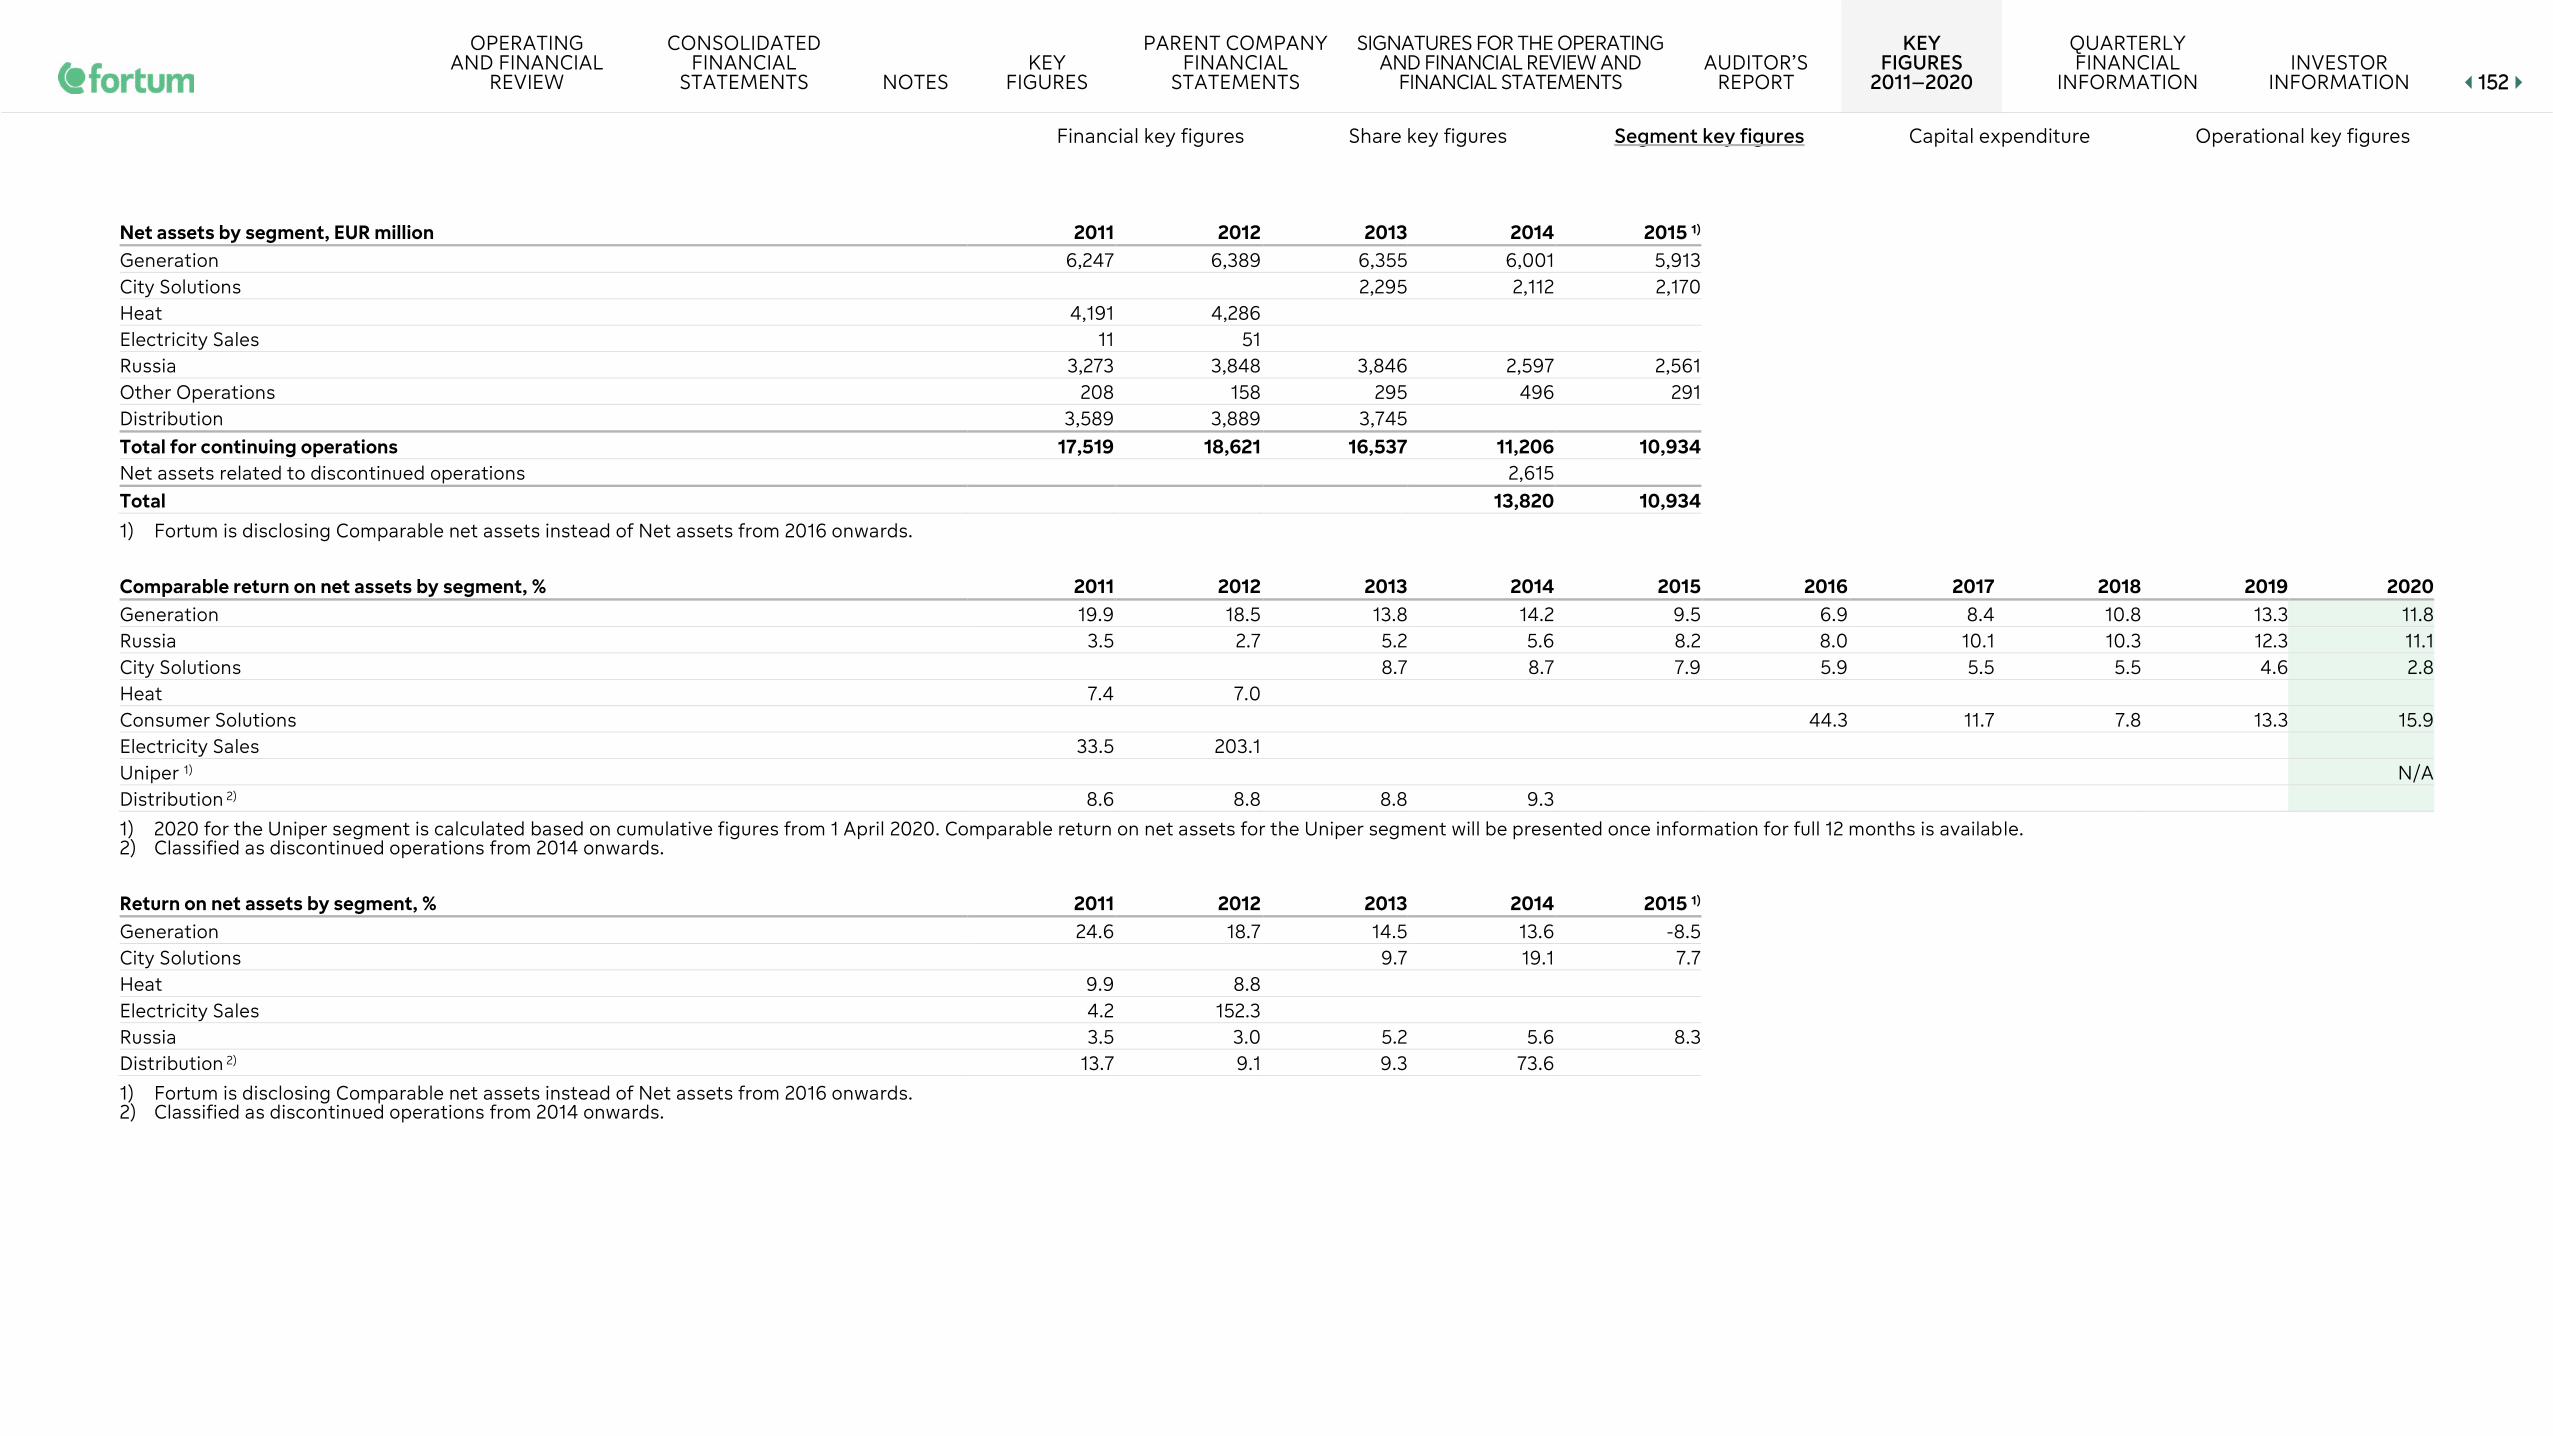
OPERATING AND FINANCIAL
REVIEW
CONSOLIDATED FINANCIAL
STATEMENTS NOTES KEY
FIGURES
PARENT COMPANY FINANCIAL
STATEMENTS
SIGNATURES FOR THE OPERATING AND FINANCIAL REVIEW AND
FINANCIAL STATEMENTS AUDITOR’S
REPORT
KEY FIGURES
2011–2020
QUARTERLY FINANCIAL
INFORMATION INVESTOR
INFORMATION 115522
Financial key figures Share key figures Segment key figures Capital expenditure Operational key figures
Net assets by segment, EUR million 2011 2012 2013 2014 2015 1) Generation 6,247 6,389 6,355 6,001 5,913 City Solutions 2,295 2,112 2,170 Heat 4,191 4,286 Electricity Sales 11 51 Russia 3,273 3,848 3,846 2,597 2,561 Other Operations 208 158 295 496 291 Distribution 3,589 3,889 3,745 Total for continuing operations 17,519 18,621 16,537 11,206 10,934 Net assets related to discontinued operations 2,615 Total 13,820 10,934 1) Fortum is disclosing Comparable net assets instead of Net assets from 2016 onwards.
Comparable return on net assets by segment, % 2011 2012 2013 2014 2015 2016 2017 2018 2019 2020 Generation 19.9 18.5 13.8 14.2 9.5 6.9 8.4 10.8 13.3 11.8 Russia 3.5 2.7 5.2 5.6 8.2 8.0 10.1 10.3 12.3 11.1 City Solutions 8.7 8.7 7.9 5.9 5.5 5.5 4.6 2.8 Heat 7.4 7.0 Consumer Solutions 44.3 11.7 7.8 13.3 15.9 Electricity Sales 33.5 203.1 Uniper 1) N/A Distribution 2) 8.6 8.8 8.8 9.3
1) 2020 for the Uniper segment is calculated based on cumulative figures from 1 April 2020. Comparable return on net assets for the Uniper segment will be presented once information for full 12 months is available. 2) Classified as discontinued operations from 2014 onwards.
Return on net assets by segment, % 2011 2012 2013 2014 2015 1) Generation 24.6 18.7 14.5 13.6 -8.5 City Solutions 9.7 19.1 7.7 Heat 9.9 8.8 Electricity Sales 4.2 152.3 Russia 3.5 3.0 5.2 5.6 8.3 Distribution 2) 13.7 9.1 9.3 73.6
1) Fortum is disclosing Comparable net assets instead of Net assets from 2016 onwards. 2) Classified as discontinued operations from 2014 onwards.

OPERATING AND FINANCIAL
REVIEW
CONSOLIDATED FINANCIAL
STATEMENTS NOTES KEY
FIGURES
PARENT COMPANY FINANCIAL
STATEMENTS
SIGNATURES FOR THE OPERATING AND FINANCIAL REVIEW AND
FINANCIAL STATEMENTS AUDITOR’S
REPORT
KEY FIGURES
2011–2020
QUARTERLY FINANCIAL
INFORMATION INVESTOR
INFORMATION 115533
Financial key figures Share key figures Segment key figures Capital expenditure Operational key figures
Average number of employees 2011 2012 2013 2014 2015 2016 2017 2018 2019 2020 Generation 1,873 1,896 1,900 1,685 1,389 1,064 1,036 1,107 1,122 1,163 Russia 4,436 4,301 4,245 4,196 4,180 3,814 3,710 3,378 2,942 2,969 City Solutions 2,051 1,913 1,458 1,529 1,807 1,994 1,979 2,051 Heat 2,682 2,354 Consumer Solutions 877 1,180 1,473 1,379 1,216 Electricity Sales 510 515 Uniper 11,629 Other Operations 607 661 550 536 983 711 774 814 825 959 Distribution 902 873 786 Total for continuing operations 11,010 10,600 9,532 8,329 8,009 7,994 8,507 8,767 8,248 19,988 Discontinued operations 492 Total 8,821

OPERATING AND FINANCIAL
REVIEW
CONSOLIDATED FINANCIAL
STATEMENTS NOTES KEY
FIGURES
PARENT COMPANY FINANCIAL
STATEMENTS
SIGNATURES FOR THE OPERATING AND FINANCIAL REVIEW AND
FINANCIAL STATEMENTS AUDITOR’S
REPORT
KEY FIGURES
2011–2020
QUARTERLY FINANCIAL
INFORMATION INVESTOR
INFORMATION 115544
Financial key figures Share key figures Segment key figures Capital expenditure Operational key figures
Capital expenditure
Capital expenditure by type and segment 1)
Finland Sweden Norway Russia Germany United Kingdom Other countries Total EUR million 2020 2019 2020 2019 2020 2019 2020 2019 2020 2019 2020 2019 2020 2019 2020 2019 Generation Hydropower 16 12 54 56 69 68 Nuclear power 49 57 49 57 Renewable-based electricity, wind 3 22 32 27 56 30 111 Fossil-based electricity 7 7 Other 3 4 7 1 0 0 9 5 Total 70 102 61 89 27 56 158 247 Russia Fossil-based electricity 25 49 25 49 Fossil-based heat 14 18 14 18 Renewable-based electricity, wind 4 4 Total 43 67 43 67 City Solutions Fossil-based heat 2 0 7 5 8 7 Fossil-based electricity Renewable, of which 36 39 7 7 5 9 1 11 107 166 156 231
waste 20 19 7 7 5 9 1 11 7 21 40 66 biofuels 9 20 2 2 10 21 solar 98 143 98 143 other 8 1 8 1
District heat network 10 17 19 27 17 19 46 63 Other 4 3 2 2 1 0 0 0 3 6 9 12 Total 49 62 9 9 24 36 0 0 1 11 134 195 219 313 Consumer Solutions Other 16 15 14 14 19 17 8 9 57 55 Total 16 15 14 14 19 17 8 9 57 55 Uniper Hydropower 34 19 53 Nuclear power 50 50 Fossil-based electricity 13 115 214 86 44 472 Fossil-based heat 4 4 Global commodities investments 23 1 25 Other 19 1 1 21 Total 97 115 279 88 45 624 Other Other 23 20 6 2 2 5 3 3 34 31 Total 23 20 6 2 2 5 3 3 34 31 Segments total 160 199 186 114 71 115 159 67 279 0 89 11 191 207 1,135 713 Of which investments in CO2 free production 84 112 138 88 27 56 4 0 19 0 0 0 100 145 372 401 1) Includes capital expenditure to both intangible assets and property, plant and equipment.

OPERATING AND FINANCIAL
REVIEW
CONSOLIDATED FINANCIAL
STATEMENTS NOTES KEY
FIGURES
PARENT COMPANY FINANCIAL
STATEMENTS
SIGNATURES FOR THE OPERATING AND FINANCIAL REVIEW AND
FINANCIAL STATEMENTS AUDITOR’S
REPORT
KEY FIGURES
2011–2020
QUARTERLY FINANCIAL
INFORMATION INVESTOR
INFORMATION 115555
Financial key figures Share key figures Segment key figures Capital expenditure Operational key figures
Generation Fortum invested EUR 30 million (2019: 111) into wind power production in the Nordics. The largest wind power investment was EUR 27 million to the Sørfjord wind park in Norway. In Finland, Fortum invested EUR 49 million (2019: 57) into the Loviisa nuclear power plant. Fortum additionally invested EUR 69 million (2019: 68) into hydro production, mainly maintenance, legislation and productivity investments. Investments in CO2 free production were EUR 149 million (2019: 236).
Russia Investments to the Russia division were EUR 43 million (2019: 67). They consisted mainly of maintenance, legislation and productivity projects. Investments in CO2 free production were EUR 4 million (2019: 0).
City Solutions The largest investment project in 2020 was EUR 98 million to the Jaisalmer solar plant in India. Maintenance, legislation and productivity investments totalled EUR 112 million (2019: 157). This amount consists mainly of investments in district heat networks and plants as well as the maintenance of existing CHP plants and measures defined by legal requirements. Investments in CO2 free production were EUR 116 million (2019: 165).
Consumer Solutions Investments in Consumer solutions totalled EUR 57 million (2019: 55). The amount consists mainly of sales commissions for customer acquisition that are capitalised starting from the implementation of IFRS 15 and new product development costs.
Uniper Investments by Uniper totalled EUR 624 million. Maintenance, legislation and productivity investments totalled EUR 378 million. Investments in CO2 free production were EUR 103 million.
Other Investments in Other segment were EUR 34 million (2019: 31). They consisted mainly of IT investments and investments into internal ventures.
050
100150200250300350400450500
393
215
64
463
284230
55
144
20192020
Fortum classifies investments in four main categories, EUR million
Maintenance investments
Investments required by legislation
Investments increasing
productivity
Growth investments
1

OPERATING AND FINANCIAL
REVIEW
CONSOLIDATED FINANCIAL
STATEMENTS NOTES KEY
FIGURES
PARENT COMPANY FINANCIAL
STATEMENTS
SIGNATURES FOR THE OPERATING AND FINANCIAL REVIEW AND
FINANCIAL STATEMENTS AUDITOR’S
REPORT
KEY FIGURES
2011–2020
QUARTERLY FINANCIAL
INFORMATION INVESTOR
INFORMATION 115566
Financial key figures Share key figures Segment key figures Capital expenditure Operational key figures
Operational key figures Note: Operational key figures are unaudited
Comparability of information presented in tables and graphs Information in the tables and graphs presented for year 2012 or earlier is not restated due to the adoption of IFRS 10 and IFRS 11. Adoption of standards influences treatment of Fortum’s holding in Stockholm Exergi AB (Exergi), (previously AB Fortum Värme samägt med Stockholms stad), in the consolidated financial statements. From 1 January 2014 onwards Exergi is treated as a joint venture and thus consolidated with equity method. Before the change the company was consolidated as a subsidiary with 50% minority interest. Uniper sales and production volumes are disclosed from 1 April 2020 onwards.
Production Fortum's total power and heat production in Nordics, TWh 2011 2012 2013 2014 2015 2016 2017 2018 2019 2020 Power generation 45.5 59.2 Heat production 6.3 5.1 Fortum is disclosing total power and heat production in Nordics instead of EU and Norway from 2019 onwards. Power and heat production in EU and Norway until 2018 are disclosed below. Fortum's total power and heat production in EU and Norway, TWh 2011 2012 2013 2014 2015 2016 2017 2018 1) Power generation 55.3 53.9 47.4 50.1 50.2 47.5 46.6 44.7 Heat production 22.0 18.5 10.4 8.2 6.4 7.1 8.6 9.4 1) Fortum is disclosing total power and heat production in Nordics instead of EU and Norway from 2019 onwards.
Fortum's total power and heat production in other European countries, TWh 2011 2012 2013 2014 2015 2016 2017 2018 2019 1) 2020 Power generation 1.3 26.7 Heat production 2.8 7.1
1) Disclosed from 2019 onwards.
Fortum's total power and heat production in Russia, TWh 2011 2012 2013 2014 2015 2016 2017 2018 2019 2020 Power generation 17.4 19.2 20.0 23.3 25.7 25.5 26.3 29.6 29.3 55.6 Heat production 25.4 24.8 24.2 26.4 25.8 20.7 20.0 20.4 17.3 17.4 Fortum's power generation by source, total in the Nordic area, TWh 2011 2012 2013 2014 2015 2016 2017 2018 2019 2020 Hydro and wind power 21.0 25.2 18.1 22.4 25.1 20.8 20.9 19.4 20.7 29.6 Nuclear power 24.9 23.4 23.7 23.8 22.7 24.1 23.0 22.8 23.5 28.6 Thermal power 7.2 3.0 3.4 1.8 1.0 1.4 1.6 1.3 1.4 1.0 Total 53.1 51.6 45.2 48.0 48.8 46.2 45.4 43.5 45.5 59.2 Fortum's power generation by source, total in the Nordic area, % 2011 2012 2013 2014 2015 2016 2017 2018 2019 2020 Hydro and wind power 40 49 40 46 51 45 46 45 45 50 Nuclear power 47 45 52 50 47 52 51 52 52 48 Thermal power 13 6 8 4 2 3 3 3 3 2 Total 100 100 100 100 100 100 100 100 100 100

OPERATING AND FINANCIAL
REVIEW
CONSOLIDATED FINANCIAL
STATEMENTS NOTES KEY
FIGURES
PARENT COMPANY FINANCIAL
STATEMENTS
SIGNATURES FOR THE OPERATING AND FINANCIAL REVIEW AND
FINANCIAL STATEMENTS AUDITOR’S
REPORT
KEY FIGURES
2011–2020
QUARTERLY FINANCIAL
INFORMATION INVESTOR
INFORMATION 115577
Financial key figures Share key figures Segment key figures Capital expenditure Operational key figures
Fortum's power generation by source, total in other European countries, TWh 2011 2012 2013 2014 2015 2016 2017 2018 2019 1) 2020 Hydro and wind power - 3.3 Thermal power 1.3 23.4 Total 1.3 26.7 1) Disclosed from 2019 onwards.
Fortum's power generation by source, total in other European countries, % 2011 2012 2013 2014 2015 2016 2017 2018 2019 1) 2020 Hydro and wind power - 12 Thermal power 100 88 Total 100 100
1) Disclosed from 2019 onwards.
Power generation capacity by segment, MW 2011 2012 2013 2014 2015 2016 2017 2018 2019 2020 Generation 9,752 9,702 9,475 9,063 8,046 8,039 7,862 7,867 8,220 8,163 Heat 1,670 1,569 City Solutions 793 803 743 760 775 788 1,082 988 Russia 3,404 3,404 4,250 4,758 4,903 4,482 4,794 4,912 4,928 4,928 Uniper - 36,218 Other Operations 53 292 157 - - Total 14,826 14,675 14,518 14,624 13,692 13,334 13,722 13,724 14,230 50,297 Heat production capacity by segment, MW 2011 2012 2013 2014 2015 2016 2017 2018 2019 2020 Generation 250 250 250 - - - - - - - Heat 10,375 8,785 City Solutions 4,317 3,936 3,915 3,818 4,671 4,780 4,812 4,057 Russia 14,107 13,396 13,466 13,466 12,696 9,920 10,094 10,229 8,437 8,437 Uniper - 7,017 Total 24,732 22,431 18,033 17,402 16,611 13,738 14,765 15,009 13,249 19,511 Finland Sweden Russia Germany United Kingdom Netherlands Other Total Fortum's power generation capacity by type and area, MW 2020 2019 2020 2019 2020 2019 2020 2019 2020 2019 2020 2019 2020 2019 2020 2019 Hydropower 1,553 1,553 4,895 3,124 - - 1,991 - - - - - - - 8,439 4,677 Nuclear power 1,487 1,487 3,361 1,334 - - - - - - - - - - 4,848 2,821 Combined heat and power 375 452 455 9 3,497 4,858 3,222 - - - 525 - 355 370 8,429 5,689 Condensing power 565 565 1,162 - 12,151 - 6,383 - 6,401 - 1,070 - 428 - 28,160 565 Wind power - - - 75 35 35 - - - - - - 101 84 136 194 Solar power - - - - 35 35 - - - - - - 250 250 285 285 TToottaall 33,,998800 44,,005577 99,,887733 44,,554422 1155,,771188 44,,992288 1111,,559966 -- 66,,440011 -- 11,,559955 -- 11,,113344 770044 5500,,229977 1144,,223300 Finland Norway Russia Germany Poland Netherlands Other Total Fortum's heat production capacity by area, MW 2020 2019 2020 2019 2020 2019 2020 2019 2020 2019 2020 2019 2020 2019 2020 2019 Heat 1,417 2,002 888 1,032 11,010 8,437 3,061 - 941 941 1,133 - 1,061 837 19,511 13,249

OPERATING AND FINANCIAL
REVIEW
CONSOLIDATED FINANCIAL
STATEMENTS NOTES KEY
FIGURES
PARENT COMPANY FINANCIAL
STATEMENTS
SIGNATURES FOR THE OPERATING AND FINANCIAL REVIEW AND
FINANCIAL STATEMENTS AUDITOR’S
REPORT
KEY FIGURES
2011–2020
QUARTERLY FINANCIAL
INFORMATION INVESTOR
INFORMATION 115588
Financial key figures Share key figures Segment key figures Capital expenditure Operational key figures
Sales
Fortum's total power and heat sales in Nordics, EUR million 2011 2012 2013 2014 2015 2016 2017 2018 2019 2020 Power sales 2,877 2,494 Heat sales 390 271 Fortum is disclosing total power and heat sales in Nordics instead of EU and Norway from 2019 onwards. Power and heat production in EU and Norway until 2018 are disclosed below. Fortum's total power and heat sales in EU and Norway, EUR million 2011 2012 2013 2014 2015 2016 2017 2018 1) Power sales 2,868 2,700 2,462 2,344 1,921 1,893 2,244 2,922 Heat sales 1,278 1,201 538 468 423 449 524 615 1) Fortum is disclosing total power and heat sales in Nordics instead of EU and Norway from 2019 onwards.
Fortum's total power and heat sales in other European countries, EUR million 2011 2012 2013 2014 2015 2016 2017 2018 2019 1) 2020 Power sales 2) 130 16,226 Heat sales 228 410
1) Disclosed from 2019 onwards. 2) Including commodity trading.
Fortum's total power and heat sales in Russia, EUR million 2011 2012 2013 2014 2015 2016 2017 2018 2019 2020 Power sales 590 713 822 758 661 691 837 872 924 1,411 Heat sales 324 300 290 285 228 199 258 193 145 145
Fortum's total power sales by area, TWh 2011 2012 2013 2014 2015 2016 2017 2018 2019 2020 Finland 24.6 21.6 23.4 21.6 22.3 22.8 22.5 23.1 23.1 23.1 Sweden 29.4 30.1 23.3 28.2 29.8 28.8 30.8 29.7 31.5 44.7 Norway 1.5 7.2 15.3 15.0 13.8 Russia 20.2 23.3 25.6 26.5 29.4 29.5 30.5 34.1 33.8 68.3 Germany 1) - 338.8 United Kingdom - 13.0 Netherlands - 6.3 Other countries 3.6 3.8 4.3 3.8 2.8 2.1 2.9 1.8 2.5 8.1 Total 77.8 78.8 76.6 80.1 84.3 84.7 93.9 104.0 105.8 516.0 1) Including commodity trading.
NordPool transactions are calculated as a net amount of hourly sales and purchases at the Group level.

OPERATING AND FINANCIAL
REVIEW
CONSOLIDATED FINANCIAL
STATEMENTS NOTES KEY
FIGURES
PARENT COMPANY FINANCIAL
STATEMENTS
SIGNATURES FOR THE OPERATING AND FINANCIAL REVIEW AND
FINANCIAL STATEMENTS AUDITOR’S
REPORT
KEY FIGURES
2011–2020
QUARTERLY FINANCIAL
INFORMATION INVESTOR
INFORMATION 115599
Financial key figures Share key figures Segment key figures Capital expenditure Operational key figures
Fortum's total heat sales by area, TWh 2011 2012 2013 2014 2015 2016 2017 2018 2019 2020 Finland 8.5 5.8 5.5 3.2 3.1 3.6 3.9 3.8 3.8 2.9 Russia 26.7 26.4 24.1 26.0 25.4 20.7 19.8 20.7 16.9 17.4 Norway 1.7 1.5 Sweden 8.5 8.5 - - - 0.1 0.3 0.3 0.3 0.3 Poland 4.3 4.3 4.1 3.4 3.4 3.6 3.7 3.5 3.3 3.4 Germany - 2.4 United Kingdom - 0.0 Netherlands - 2.3 Other countries 3.4 2.9 3.1 2.8 1.2 1.4 2.2 3.2 1.6 1.6 Total 51.4 47.9 36.8 35.4 33.2 29.4 29.9 31.5 27.6 31.7
Volume of distributed electricity in distribution networks, TWh 2011 2012 2013 2014 2015 Finland 9.5 9.8 9.5 2.8 Sweden 14.2 14.4 14.1 13.7 6.4 Norway 2.3 2.4 2.5 1.1 Estonia 0.1 - Total 26.1 26.6 26.1 17.6 6.4

OPERATING AND FINANCIAL
REVIEW
CONSOLIDATED FINANCIAL
STATEMENTS NOTES KEY
FIGURES
PARENT COMPANY FINANCIAL
STATEMENTS
SIGNATURES FOR THE OPERATING AND FINANCIAL REVIEW AND
FINANCIAL STATEMENTS AUDITOR’S
REPORT
KEY FIGURES
2011–2020
QUARTERLY FINANCIAL
INFORMATION INVESTOR
INFORMATION 116600
Quarterly financial information Note: Quarterly financial information is unaudited.
Selected data based on quarterly consolidated income statement EUR million I/2019 II/2019 III/2019 IV/2019 2019 I/2020 II/2020 III/2020 IV/2020 2020 IS Sales 1,690 1,144 1,060 1,553 5,447 1,357 12,330 14,049 21,279 49,015 Comparable EBITDA 545 372 295 552 1,766 543 512 132 1,247 2,434 IS Comparable operating profit 408 232 153 398 1,191 393 203 -179 928 1,344 IS Operating profit 1) 363 230 124 401 1,118 603 539 -1 458 1,599 IS Share of profit/loss of associates and joint ventures 111 461 106 65 744 479 39 25 113 656 IS Finance costs - net 1) -51 -39 -32 -12 -134 -67 3 27 -18 -56 IS Profit before income tax 424 652 198 454 1,728 1,014 581 51 554 2,199 IS Income tax expense -65 -45 -25 -88 -221 -76 -178 51 -142 -344 IS Profit for the period 359 607 173 367 1,507 938 403 103 411 1,855 IS Non-controlling interests -19 0 5 -10 -25 -9 -63 71 -31 -32 IS Profit for the period, owners of the parent 341 607 178 356 1,482 930 340 174 379 1,823 Earnings per share for profit attributable to the equity owners of the company (EUR per share) Basic 0.38 0.69 0.20 0.40 1.67 1.05 0.38 0.19 0.43 2.05
1) In 2020, Nuclear fund adjustment was reclassified from Items affecting comparability to Other financial expenses, net. Comparatives have been reclassified accordingly. See Note 1.7 Summary of Uniper acquisition impact to consolidated financial statements.
Quarterly sales by segment EUR million I/2019 II/2019 III/2019 IV/2019 2019 I/2020 II/2020 III/2020 IV/2020 2020 Generation 1) 601 500 458 583 2,141 574 450 441 541 2,006 Russia 298 239 229 306 1,071 317 202 172 238 929 City Solutions 1) 405 228 200 366 1,200 342 212 184 337 1,075 Consumer Solutions 669 346 311 510 1,835 424 237 235 370 1,267 Uniper - - - - - - 11,365 13,159 19,990 44,514 Other Operations 1) 26 28 29 32 115 34 34 34 38 140 Netting of Nord Pool transactions 2) -192 -99 -100 -1,369 -529 -83 -54 -74 -105 -317 Eliminations -117 -98 -68 -105 -387 -250 -115 -102 -130 -598 IS Total 1,690 1,144 1,060 1,553 5,447 1,357 12,330 14,049 21,279 49,015 1) Sales, both internal and external, includes effects from realised hedging contracts. Effect on sales can be negative or positive depending on the average contract price and realised spot price. 2) Sales and purchases with Nord Pool Spot is netted on Group level on an hourly basis and posted either as revenue or cost depending on if Fortum is a net seller or net buyer during any particular hour.
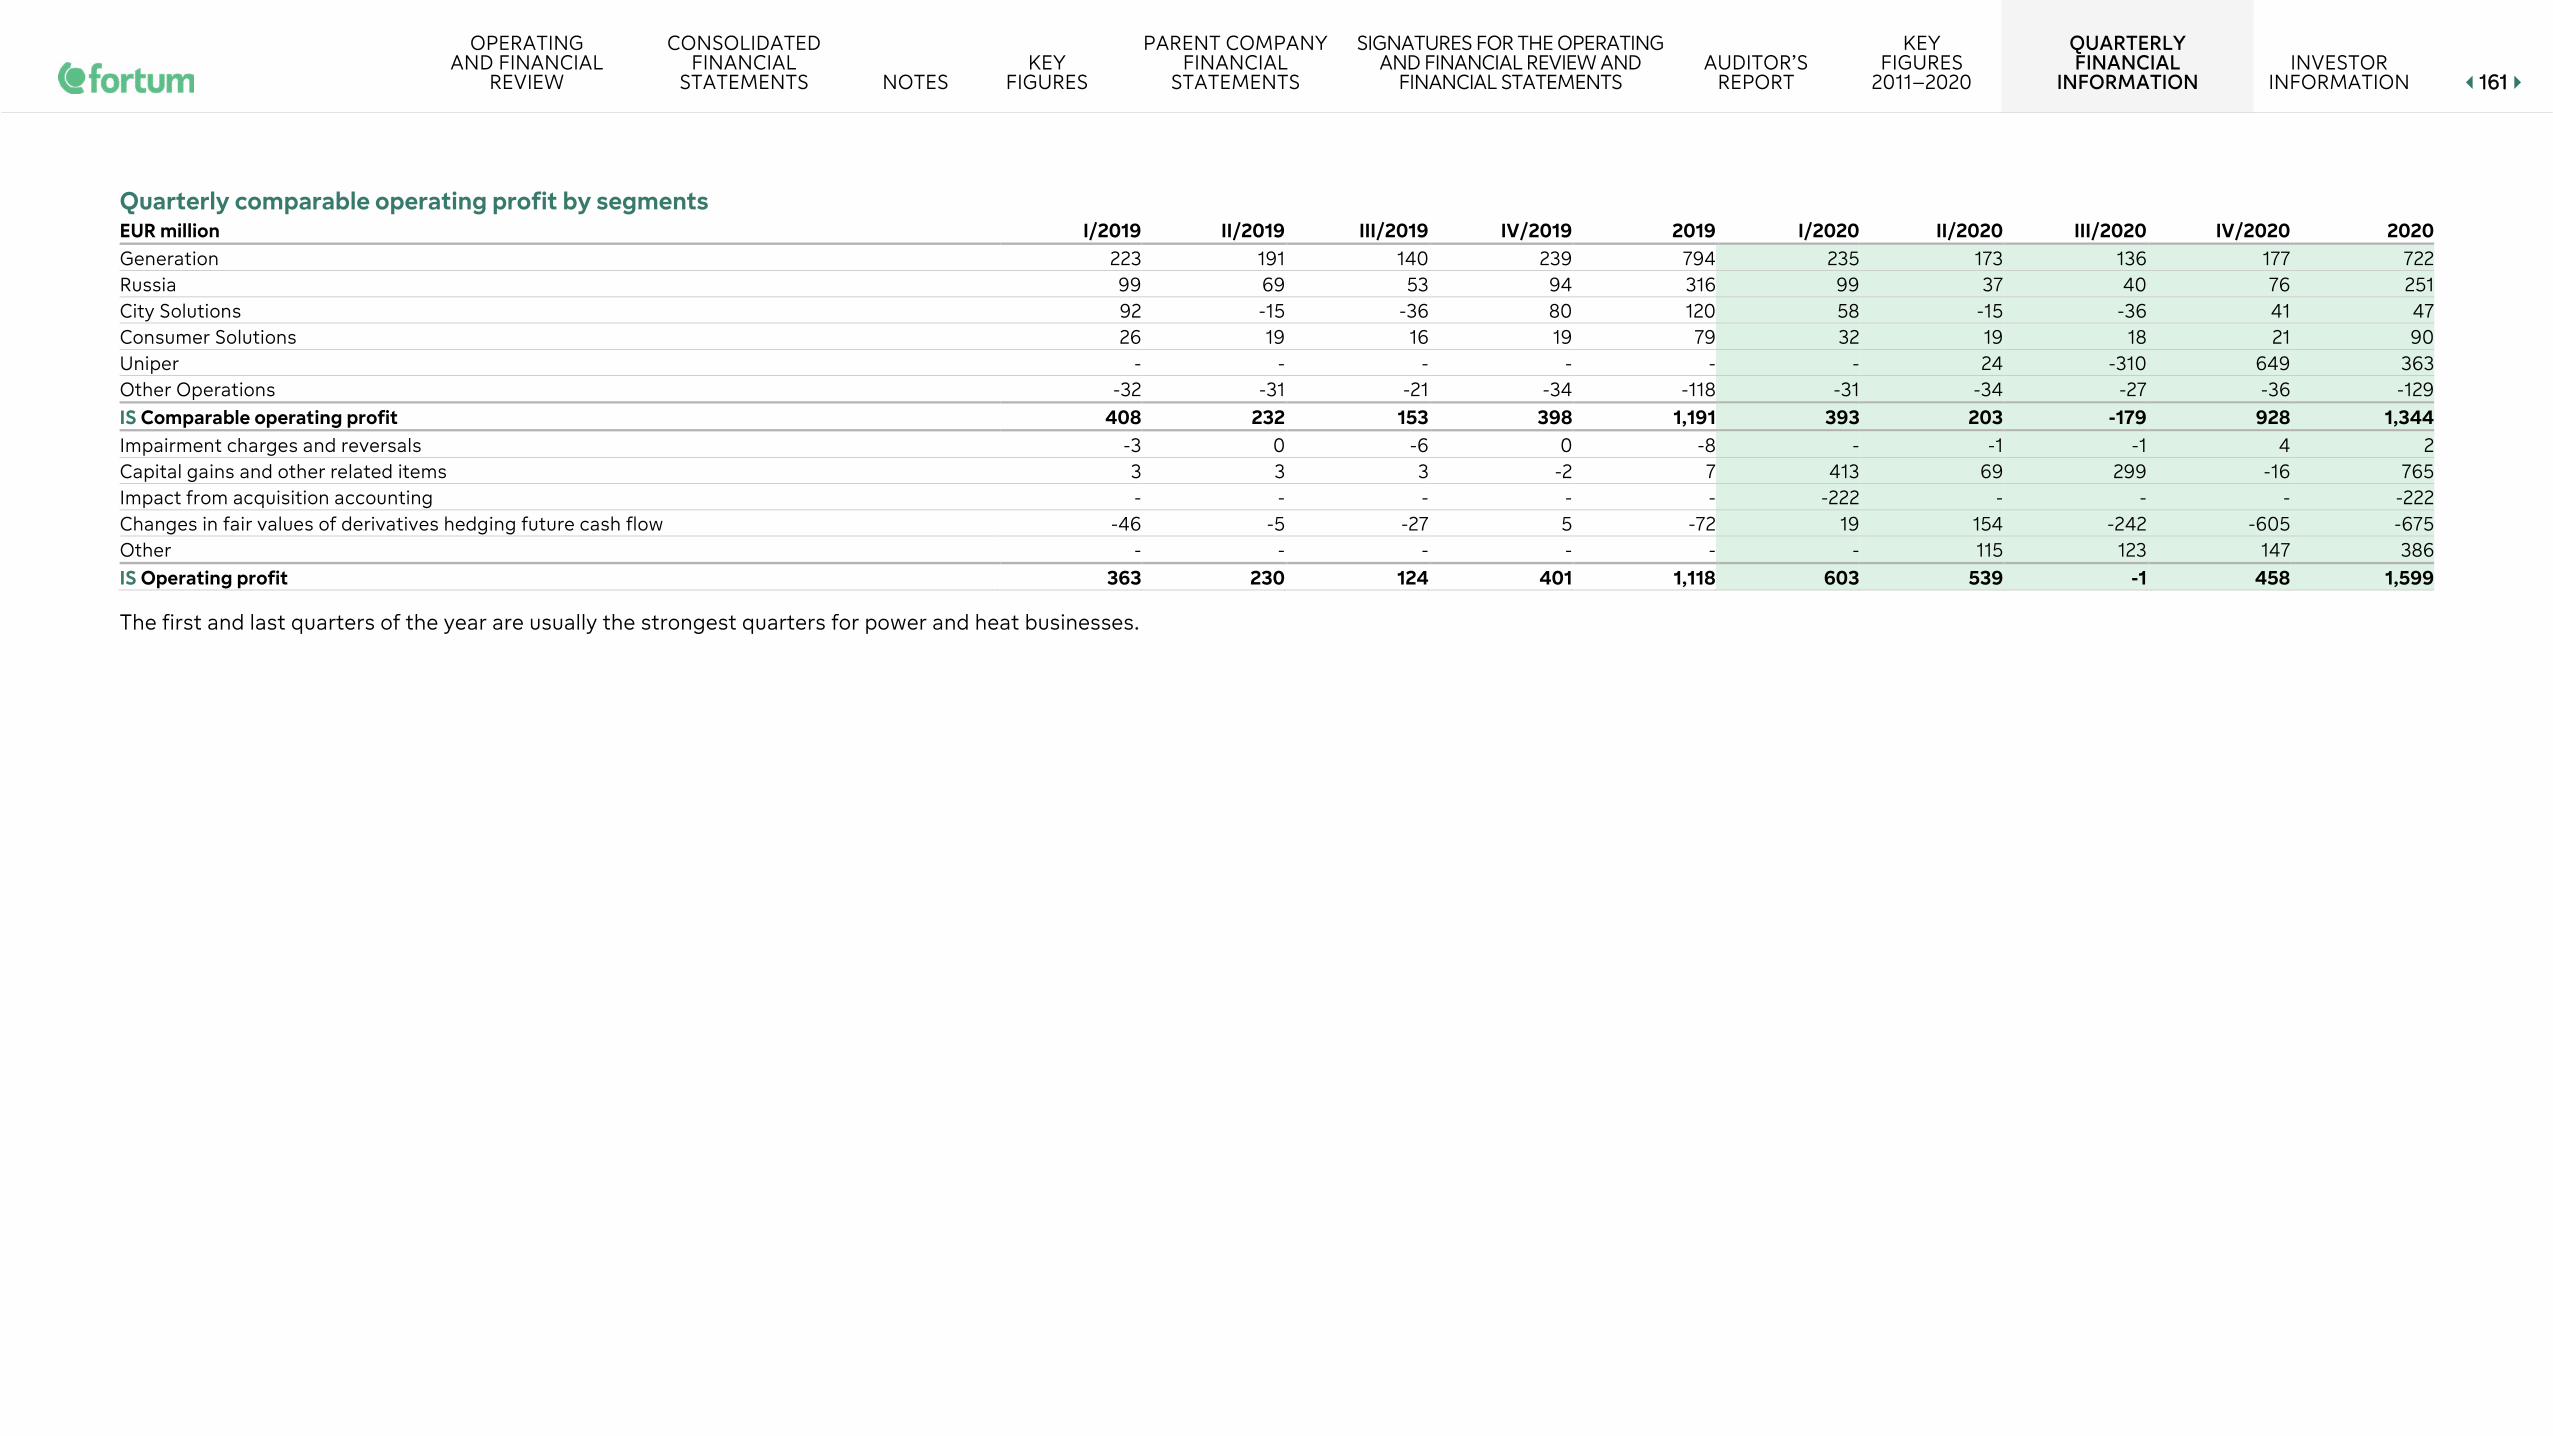
OPERATING AND FINANCIAL
REVIEW
CONSOLIDATED FINANCIAL
STATEMENTS NOTES KEY
FIGURES
PARENT COMPANY FINANCIAL
STATEMENTS
SIGNATURES FOR THE OPERATING AND FINANCIAL REVIEW AND
FINANCIAL STATEMENTS AUDITOR’S
REPORT
KEY FIGURES
2011–2020
QUARTERLY FINANCIAL
INFORMATION INVESTOR
INFORMATION 116611
Quarterly comparable operating profit by segments EUR million I/2019 II/2019 III/2019 IV/2019 2019 I/2020 II/2020 III/2020 IV/2020 2020 Generation 223 191 140 239 794 235 173 136 177 722 Russia 99 69 53 94 316 99 37 40 76 251 City Solutions 92 -15 -36 80 120 58 -15 -36 41 47 Consumer Solutions 26 19 16 19 79 32 19 18 21 90 Uniper - - - - - - 24 -310 649 363 Other Operations -32 -31 -21 -34 -118 -31 -34 -27 -36 -129 IS Comparable operating profit 408 232 153 398 1,191 393 203 -179 928 1,344 Impairment charges and reversals -3 0 -6 0 -8 - -1 -1 4 2 Capital gains and other related items 3 3 3 -2 7 413 69 299 -16 765 Impact from acquisition accounting - - - - - -222 - - - -222 Changes in fair values of derivatives hedging future cash flow -46 -5 -27 5 -72 19 154 -242 -605 -675 Other - - - - - - 115 123 147 386 IS Operating profit 363 230 124 401 1,118 603 539 -1 458 1,599 The first and last quarters of the year are usually the strongest quarters for power and heat businesses.

OPERATING AND FINANCIAL
REVIEW
CONSOLIDATED FINANCIAL
STATEMENTS NOTES KEY
FIGURES
PARENT COMPANY FINANCIAL
STATEMENTS
SIGNATURES FOR THE OPERATING AND FINANCIAL REVIEW AND
FINANCIAL STATEMENTS AUDITOR’S
REPORT
KEY FIGURES
2011–2020
QUARTERLY FINANCIAL
INFORMATION INVESTOR
INFORMATION 116622
Investor information Fortum 2020 reporting entity comprises CEO’s Business Review, Financials, Corporate Governance Statement and Remuneration Report, Tax footprint as well as Sustainability.
Annual General Meeting 2021
The Annual General Meeting 2021 of Fortum Corporation will be held on Wednesday, 28 April 2021, starting at 14:00 EET.
Payment of dividends
The Board of Directors proposes to the Annual General Meeting that Fortum Corporation pays a dividend of EUR 1.12 per share for 2020, totalling approximately EUR 995 million based on the registered shares as of 11 March 2021. The possible dividend related dates planned for 2021 are:
• the ex-dividend date 29 April 2021, • the record date for dividend payment 30 April 2021 and • the dividend payment date 7 May 2021.
Financial information in 2021
Fortum will publish three interim reports in 2021: • January–March Interim Report on 12 May • January–June Half-year Financial Report on 17 August, and • January–September Interim Report on 12 November.
The reports are published at approximately 9:00 EET in Finnish and English, and are available on Fortum’s website at www.fortum.com/investors
Fortum’s management hosts regular press conferences, targeted at analysts and the media. Webcasts of these conferences are available online at www.fortum.com/investors. Management also gives interviews on a one-on-one and group basis. Fortum observes silent period of 30 days prior to publishing its results.
Fortum share basics
Listed on Nasdaq Helsinki Trading ticker: FORTUM Number of shares, 11 March 2021: 888,294,465 Sector: Utilities
Fortum’s activities in capital markets during 2020
Fortum’s Investor Relations activities cover equity and fixed-income markets to ensure full and fair valuation of the company’s shares, access to funding sources and stable bond pricing. The key task of Investor Relations is to provide correct, adequate and up-to-date information regularly and equally to all market participants. By doing this, Investor Relations aims to minimise the investor’s risk and reduce the share’s volatility. Investors and analysts primarily are met on a regular basis in Europe and North America.
In 2020, Fortum met approximately 550 professional equity investors individually or in group meetings and at investor conferences, mostly virtually, and maintained regular contact with equity research analysts at investment banks and brokerage firms.
Financial Statements Bulletin 2020, 12 MarchFinancial Statements 2020, Latest week 11
Annual General Meeting, 28 AprilInterim Report January–March 2021, 12 May
January–June Half-year Financial Report 2021, 17 August
Interim Report January–September 2021, 12 November
2021
Q1Q4Q
3 Q2