financialindustry? - repository civitas ugm · peluang pad a peningkatan permintaan kredit...
TRANSCRIPT

FinancialIndustry?~
,/./ "'" .
( MoneyMarket'j CapitalMarket~!ank_/ I ~ Securities
InsuranceMarket I MultiFinanceMarket
~ Life and NonLife.I I ~ Leasing&Credit .Insurance// . Card ~. //
.-- \\ ~.. . _.-' ~ '..".- -- 2
28/12/2012
1

I
III
28}12/2012
Sektor Perbankan
19.19 -<>-Suku Bunga Kredit Modal Kerja'j(,'
Penurunan suku bunga
kredit yang berlangsung
sejak tahun 2008
menunjukkan bahwa
fungsi intermediasiperbankan berjalansemakin efisien.
Penurunan suku bungakredit memberikan
peluang pad a peningkatanpermintaan kredit
perbankan untuk
pembiayaan sektor-sektorekonomi.
Suku Bunga Kredit Perbankan21
19
17
lS
13
11
Kurs RupiahjUSD tetap stabil di Kisaran 9300
Faktor internal: tingginya permintaan valuta asing untuk kebutuhan ill)por,Faktor eksternal:
kondisi perekonomian global yang belum stabilketidakpastian prospek penanganan krisis utang dan fiskal di Eropa,belum mantapnya pemulihan ekonomi AS, perlambatan perekonomian China,melemahnya harga-harga komoditas ekspor Indonesia
2
9
0 ... N '" .,. '" oJ) " 00 en 0 ... II ::::0 0 0 0 0 0 0 0 0 '" ... ... N0 0 0 0 0 0 0 '" '" co 0 co ... 0N N N N N N N N N N N N coN N
BOOO I 12123 12000't.c:an12000
11000
10000
9000
8000
7000
6000
2000 2001 2002 2003 2004 2005 2006 2007 2008 2009 2010 2011 2012e 2013'
Kurs Rp.USO Kurs Rp.Yen IRp/l00Yenl

Pertumbuhan Kredit Perbankan
35.00
30.00
25.00
20.00
15.00
10.00
5.00
0.00
24,54 25.00
20.00 21.00
4.82
2002 2003 2004 :ZOOS 2006 2007 2008 2009 2010 2011 2012e 20131
~Pertumbuh.n Oanl Pih.kKetill (%) ~Pertumbuh.n Kredit(%)
· Pertumbuhan Terbesar 2012 (berturut-turut) pada sektor:Pertanian (35,39%); kostruksi(32,15%); dan perdagangan, hotel &restoran (30,84%)
"~ ~~.IDX
In(~(:r'!""~I., 51\)(..:... f.:«."': P'!~
3._f ~,~ :~cs. Irc,-"'n(~si..i
..-
Indonesia Stock Exchange PerformanceLatest Updates
Source: HI" Purnlma. lOX 21 Ole 2012
i
iIIII
28/12/2012
3

Indonesia Stock Exchange
Equity Trading Activities21 December 2012
I Jakarta Mari<etComposite Capitalization
Index 13,lIionRp~
Average Daily Trading
2005
2006
2007
2008
2009
2010
2011
2012'
28/12/2012
4
AS June 082012Description Mutual Organization owned by members
Number of Shareholders 119
Ownership by Local: 94Ownership by Foreign Joint Venture: 2S
Market Hours Pre-Opening (09:10 - 09:2S)Morning Session (09:30 - 12:00)
Afternoon Session (13:30 -16:00)Friday Morning Session (09:30 - 11:30)
Friday Afternoon Session (14:00 - 16:00)
Number of Issuers 444
Market Capitalization IDR 3,603.4 Trillion (USD 382.0 Billion)
Market Cap Growth2001.2011 30.91% per annum over the last 10 years
Market Depth 2012 IDR4.47 Trillion per day (USD491.3 Million)
Market Depth Growth2001-2011 28.73% per annum over the last 10 years
Top 4 Sectors in lOX Finance (26.2%)(by Market Cap): Consumer Goods (21.6%)
Mining & Energy (14.1%)Infrastructures (10.0%)
1,654 1,670,808 16,510 1,162.635 801,253
1,806 1,841,769 19,880 1,805.523 1,249,074
4,226 4,268,920 48,216 2,745.826 1,988,326
3,283 4,435,531 55,905 1,355.408 1,076,491
6,090 4,046,202 87,040 2,534.356 2,019,375
5,432 4,800,969 105,790 3,703.512 3,247,097
4,873 4,953,200 113,464 3,821.992 3,537,294
4,230 4,537,585 121,982 4,250.214 4,061,677
-121 Dcmbe" 2012
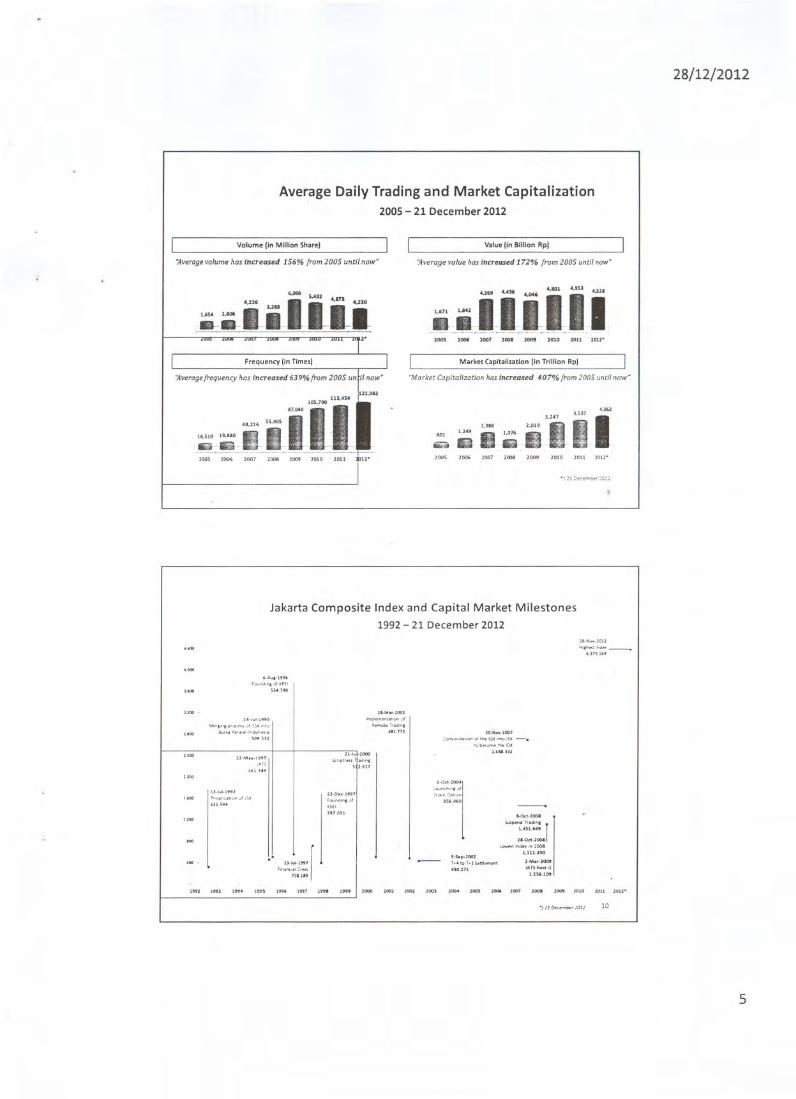
Average Daily Trading and Market Capitalization2005 -21 December 2012
':Iverog""olume has Increased 156% from ZOOSuncil naw'
Volume (In Million Shore)
1..- un .....
I-i-I-I-II
Frequency (In Times)
':Iveroge frequency has Increased 639% from ZOOS un
16.510 19.810
s-8
., '
IOS""'
I"....
iil'..-2005 2006 J007 2001 2009 1010 1011
-"-- ._, '_..-.-------
....
....
,...
Value (In Billion Rpl
':Iverage value has Increased 172% fram ZOOSuntil now'
, ,- I I~...
I I~..'
11.1"
I.....
8JI-=__-=-_ _: _:_ ::.100s 1* 1007 2008 lOOt 1010 :2011 1011"
Market Copltonzatlon (In Trillion Rp)
"Markee Capitalization has Increased 407% from zoos until now"
.)21C~Cf""De':012
Jakarta Composite Indexand Capital Market Milestones1992 - 21 December 2012
, ,,,~:IU".:I of IePf)
SSot.ltO
' lOOlI..bor>Jl
1t00000..r,....."'1.71S
.n.'
!:....
!i.e"",,", ".SUt7
1).0.,.1"', ","'"197.011
.' -f
U.lul-lnlF, ".....
11Un
lWtow.lau
"'1"'...1_-,,))'-1"
~JOO7~.o.._oIlt>tom_ISII -.
tODft_:toto1Oll
U...'U
'.Cd.lOU'-'-'-"'"101SI~..JDI'_
IW06O, -
- '.Sep.lOCdh<lto'.J s.nI__'JO.l71
......-~T,,,,,,
L<l5I.'"IlloOd.lOOl
lowftllrld<ro '" 2008
1.1U.JtO
I.M lOOJiATSN...,G
Ln6.1Ot
.
I'" 1'" I"J 1M. 1'" I 1000 1001 lOOI lOOJ 10001 lOGS .. looJ 1008 lOOt 1010 IOU IOU.
., 110«--." lOll 10
28/12/2012
5
""J"'Il"'S
\I"'I""lI"x.",;AiS;C,ntO),... 8ur....P......."'_""""
su
,... lJ.M....-199S"us
.lUll!"..
1)-1.....1"'.....
I ....u..."..JU.s.at
.....
...
... .
.... ,... ....
.....
1.911 2.019
lill10'8-11. .....oos .... .00' 'DOI '009 1010 1011 20U.

JakartaComposite Index2002 - 21 December 2012
4,400
¥f4,000
3,&00
3,200
2,800
2,000
1,&00
1,200
800 n1.8t1 ._ A /' 1.1A.6JS l.USAOI
.,~.rr/'~~t-"'("~'Mh,- //",- ~I /' //",- /',- ~8.39'1. 62.82% "'.56% 16.24%. 55.30% ~~ 7-
2002 2003 ;;:;-~T 2006-~-2;;;--;;;;;;--~~;;;:-
400
.'21 Oecemoer:c~: 11
Proportions of Stocks Ownerships.Based on Investors' Nationality - 2008 to November 2012
oreil" Investor
2.12"-'
70.69"-'
27.19"-'
Individual 31.072
1.034.377
23.704
907,916
1.89"-'
72.5:ZO'
3,062
875.199
0.26%
73.90"-'
1.773 0.20"-'
44D,248 57.00"-'Instnution
Others
OTAL
Institutions: 'nsurance.Mutual Fund.PensionFund,Fln.neiliinstitutlon,Corporate.Securities Company, Foundation
SourceO~II IndoneSiaCentral~,.tl" OePO$Itof'y
'J S,nptless Stocks
12
28/12/2012
6
Typeof Investors' Nationality I Noy..2012 I 2011 I 2010 I 2009
(Equity Only) %
ocallnvestor 32.90"-'
Individual 13.80"-' 150.951 17.98"-' 124,143 17.70"-' 81.916 21.60"-'....-....-.
Institution 880,"9 86.06% 687,203 aLar'" 575,943 82.10"-' 295,989 78.10-".,.
Others 1.413 0.14% 1.166 0.14% 1.433 0.20"-' 877 0.20"-'

Foreign Investor ActivitiesAt Indonesia StockExchange: 2006 - 21 December 2012
1%,101
U,ZIO.zo,m
17,27111,11I
17,51511,111
1~210
9,069 9356
.587
.8..1491 " ':::1'1
13
Market Capitalization and Trading Value By Industry
21 December 2012
Market
Capitalization..Rnanc.(74)
. Tride,Services&Investment 11011
. Agricu~ure 1181
Intrastructure,UliI~i.. & . Mining(37)
..Property And RealEstate IU)
\0 Basic IndustryAndChemicals 1"1
'The Biggest Trading Va/4e and Market Capitalization Is Finance Industry"
14
28/12/2012
7

28/12/2012
-~~IDX
Indonesia Stock ExchangeBursa r.~k Indonesia
l,
IndonesiaBond MarketTrading Activities
8
Bond Trading Activities2003 - November 2012
Corporate Bond Government BondOutstanding Daily Average Transactions Outstanding Daily Average Transactions
Year Listed & Traded Volume Frequency Year Listed & Traded Volume Frequency(PAiIi.rRp. IMiliarRp) (X) (MiliarRp) (MiliarRp) IX)
2003 45,465 58,86 12 2003 390,482 1,395,31 51
2004 61,300 71,98 21 2004 399,304 2,128,58 112
2005 62,891 98,55 21 2005 399,859 2,144,05 100
2006 67,806 138,18 11 2006 418,751 1,216,22 134
2007 84,553 282,98 63 2007 475,578 5,062,87 227
2008 73,979 219,30 50 2008 525,695 3,833.48 206
2009 88,330 162,89 41 2009 574,659 3,224,12 218
2010 115,348 364,02 70 2010 641,215 6,794,50 381
2011 146,969 511,69 73 2011 723,606 7,950.45 433
2012" 178,928 630,62 102 2012" 834,551 8,120,56 551
-) November 2012
16

28/12/2012
Bond OwnershipNovember 2012
Corporate Bond Ownership (In Billion RpJ Government Bond Ownership fin Trll Rp)
"Insurance major the corporate bond ownership" "Bank major the government bond ownership'.
Foundation Others SecuritiesIndividual 2.178 3.<t08 Company
3.729 1.26% 1.97% 1.026
2.16%~ I__0.59%Corporate_
Pension fund
Oth~rs 35.29
"';:2 4"~Mutualfund ~
45,816".......
81 Securitiu4,73 Com~nv0,6% 0.33
1_0.04"
5.80%
SOI,l"~ l"rJO"~stO CrMrol Securities DeposItory (K5EIJ Source. lr1oJofle$lonCetJt ManQl}emlmrOjficeiCJPUj
17
Mutual FundTotal Net Asset Value (NAV)October 2012 : Rp178.16 Trillion
Inde..Fiu'd Income. 1439'
ETF. fiMed Income
~ utual Fund 0.250-'sn
.am 11.179' 11.36.:)______
IS04OI~ " .7~2,83% _______ ErF.Equity1075)0,04%
"The highest Mutual Fundallocation is Equity
35,08%
Source: Bopepom - LK 18
9

.-~~IDX
Indonesia Stock f.xchangeBursa tfek Indonesia
STOCKMARKET OUTLOOK 2013
-lOX
If.l'!cnc~tc1 StO<x E:.xc.:~imge
Bl.rs.1 Uek Indonesia
Performance of IDXvs
Regional Stock Exchange
28/12/2012
10

Change of Regional Indices2005 . 21 December 2012
150.00'/.
125.00'/.
100.00%
75.00'/.
50,00'/.
25.00%
.0.00'/.
-25.00'/.
-50.00'/.
-75.00%2005
16.2.4'/.
53.96%
~.76"',
13.37%
40.24'/.
5.73'1.
..o.&I8f.16.71%
4.33%
42.33%
2006
SS.30%
3.99"/.
21.7"'/.
27.47%
6.92%
32. &9'/.
16.29"'/.10.71%
130.43'1.
.46.70-/.
.Indonesia
. Korea
.MalaysiaSingaporeJ.pang (Mkkei 225)
";f HongKong.USA (Dow Jones)
.Inggris (FT100)
.Shlnghai-India (Mumbai)
28/12/2012
11
JCt in Comparison to Regionaltndices Performance2010 - 21 December 2012------
IDX 3,703.512 3,821.992 3.20% 4,250.214 11.20%
KRX 2,051.000 1,825.740 -10.98% 1,980.420 8.47% IDX : Indonesia Stock Exchange
SET 1,032.760 1,025.320 .0.72"'" 1,373.380 33.95'/0 KRX : Korea Exchange.SET : Stock Exchange or Thailand8M 1,518.910 1,530.730 0.78% 1,658.850 8.37"10BM : Bursa Malaysia
SGX 3,190.040 2,6046..:150 -17.04% 3,163.560 19.5-4% SGX : Singapore ExchangesTSE 10,228.920 8,455.350 .17.34% 9,940.060 17.56% TSE : TokyoStock Exchange
HKeX 23,03U50 18,434.390 -19.97"'" 22,505.290 22.09% HKeX : Hong Kong E:u:h.ngesDJI : CowJonel
SSE 2,808.080 2,199,420 .21.68% 2,153.310 -2.10%SSE : Shanghai Stock Exchange
SSE 20,509.090 15,45-4.920 .24.64% 19,228.640 24.4rt, BSE : Bombay Stock Exchange
OJI 11,577.510 12,217.560 5.53% 13,311.720 8.96'/. FT100 : UK
FT100 5,899.900 5,572.300 .5.55% 5,902.020 5.92%
.'11Drnb,,101l
I
2007 200852.08'/. -50.64%
32.25% -40.73'/.31.ar/. -39.33'1_16.07% ..41.17-'_
..".U-I_ "'2.12-;_
39.31-1. 8.27'10
8.43% 3.U-'_
3.80-;_ 1.33-'_
96.66% 45.39-1.
47.15-;_ -52.45%
2009 2010 2011 21..oec.1286.98-'_ .46.1)-1_ 3.20-1_ 11.20-/_49.65_ 21.8"'_ ..10.98-/_ "'7%.5.17-/_ 19.3.t-,_ 0.78-/_ 8.37%64..9-/_ 10.09'k ..17.0.4-/_ 19.54"1_19.04-/_ -3.01% ..17.34-1. 17.56'k52.0r/_ S.3rt_ ..19.97-/_ 22.09'k
18.82-/_ 1'.0rt_ 5.53% 8.96-;_22.07% 9.0001, ..5.55-1_ 5.9r/,
79.98-1_ ..1.4.31-;_ ..21.68% ..2.10"'1_
81.03% 17.43% ..24.64Y_ 24..r/,
22

28/12/2012
Performance of Regional Indices2005 -21 December 2012
"50'/0
"00'10
350'10
50%
-+-IOX
300% .-+- KRX
250%__8M
SGX (Stt.l1ts Times)
TS! (NI""" 2251
150%HKaX IHang Seng)
100% Dow Jones
_ FT100-+- SSE
0% --- BSE.50'/.
-100%2005 2006 2007 I 2008 2009 2010 2011 21-Dec-12
23
Market Capitalization Asia Pacific Region (TrilRp)
October 2012
31_877
12433
LL'D5.5
LlO...
L6:6 '281 397' 3.056
, .., I'LlLa2031~
TSE HK(X SSE ASX 8SE XOX sox 8M lOX SET PSE
"Relatively small Market Capitalization among others'Sourc~: World Fed~rotio" 01 Exc"o"g~$
24
12
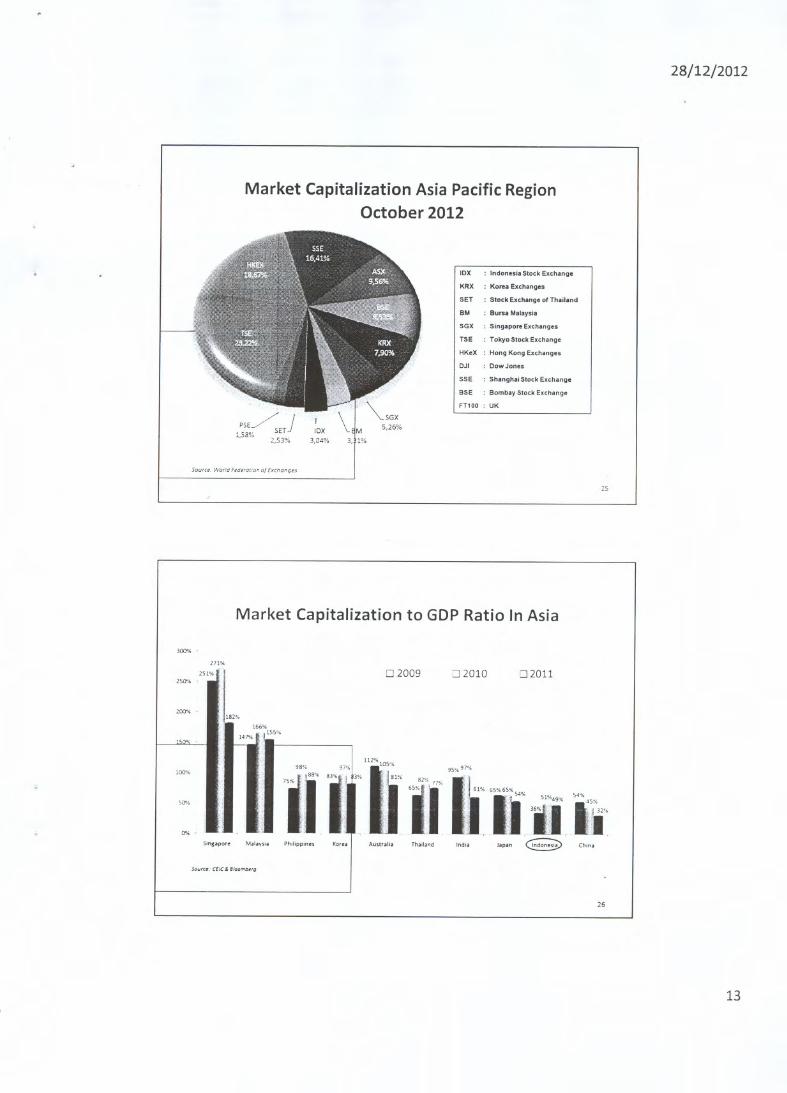
Market Capitalization AsiaPacificRegionOctober 2012
Sou'c~: World F~d~'a!lo1! oj [xchortgeS
25
28/12/2012
13
IDX : Indonesia StockExchange
KRX : Kore. Exchange.
SET : StockExchange of Thailand
BM : Bursa MalaysiaSGX : Singapore Exchanges
TSE : TokyoStockExchange
HKeX : Hong KongExchanges
DJI : DowJones
SSE : Shlngh.' StockExchange
BSE : BombayStockExchange
FT100 : UK
Market Capitalization to GDP Ratio In Asia
300% .
271%251% o 2009 02010 02011
250%
100".182'
166%141%
155%"""' . -
98% 9'
N')l'ffb]i'uIi100".
illSO-.
0% .
Sinlapo' Malaysi. Pilippins Korel Austuli. Thailand India Jip.n G" Chlnl
SQurt:: etlC& 8loombrg
26

-~~IDX
Indonesl.t SrOC:.K£.xch.\nge8" Ef..k Indon..'1.1
KekuatanEkonomiDomestik &
Faktor Pendorong KinerjaPasarSaham di Indonesia
RealEconomicGrowth of 1% ClubEmerging Market leads in economic growth
I Rank I Growth1 China
(inpercent)
201~ Averag~9.2 10.9
~11.3
200~ 200al14.2 9.6
2009\ 201~9.2 10.4
~12.7
(Source: Bloombera, IMF World Economic Outlook O~t~base 2011)
28
28/12/2012
14
2 ndia 9.2 9. 9.5 7.5 8. 7.S 8.5
3 ndonesia 5. 5.5 6. 6.C 4.6 6. 6.5 S.!4 Iran 6. 9. 6.4 4.C 3.5 3.2 2.5 5.25 urkey 8. 6. 4. O. -4. 8. 6.6 4.56 aiwan 4. 5.4 6.C O. -1.8 10. 4.0 4.7 IIrazil 3. 4.0 6. S. -0.3 7.6 3.8 428 Rusla 6. 8. 8. 5.2 -7.8 4. 4.3 4.29 outh Korea 4.( 5.2 s. 2.3 0.3 6.2 3.6 3.810 Australia 3. 2.6 4. 2.6 1.4 2. 1.8 2.811 Mexico 3.2 5.2 33 1.2 .6. 5.5 3.9 2.312 anada 3.( 2.8 2.2 O. -2. 3.2 2. 1.613 Germany O. 3. 3.3 1. -5. 3. 3.( 1.14 pain 3.! 4. 3. 0.9 -3. .0. O. . 1.315 U5 3. 2. I.! -0.3 -3.! 3.( 1. 1.216 France U 2. 2. -0.1 -2. 1. U 1.017 UK 2. 2.6 3. -1.1 -4. 2. 1.1 0.818 apan 1. 1. 2.18 -1.0 -S.! 4. -0.5 O.19 taly O. 2.2 1. -1.2 -5. 1.5 0.64 O.

Faktor Pendorong Kinerja PasarSurat Berharga di Indonesia
· membaiknya prospek ekonomi domestik tahun depan· ekspektasi positif membaiknya ekonomi global
terutama ASdan China,
· BIrate yang (diperkirakan) tetap stabil,
· inflasi yang (diperkirakan) tetap terjaga pada levelsasaran,
· (perkiraaan) membaiknya neraca pembayaranIndonesia ??7?,
· meningkatnya peringkat Indonesia ke levellayakinvestasi
.
12/28/2012 30
28/12/2012
15
i UI I
Kekuatan EkonomiDomestiki I,
i II
I,, I
Kuatnya ekonomi domestik didukung oleh:·inflasi yang cederung stabil pada level kisaran sasaran
4,5% :t 1%,
· konsumsi domestik yang tinggi,
· menurunnya angka pengangguran,
· aliran investasi asing yang meningkat,
· kinerja perdagangan yang membaik 177,
· kurs yang bergerak pada level fundamentalnya, dan
· stabilnya sistem keuangan dan fungsi intermediasiperbankan
29

EmergingAsia&World Consumer Spending...and there goes the need for financinggrowth
According to an OECD estimate, the middle class in Asia will make up the majority of 2030consumer spending. Share of global middle-class spending by region, in USD Trillions (PPPMethod)
2009
$21.3 $';'(:$5.5 $8.1 I $4.9
2030
$55.7projected
$5.6 $11.1, . 0.6
NorthAmerica
Asia Pacific ~~~~ra~iS~~~th~~-~~~'~.~ - 1"1
Middle East/North Africa --:.JSub-Saharan Africa
Europe
(Source: OECD and PriceWaterhouseCoopers. 2011)
A Steady Improvement on Credit Rating...while the world drowned in rating downgrades
BB8+
Moody', uPlrade 10 Bu)
ilS of Jilnuilry 18. 2012 8aal
so
c.
BBB
BBB.
Fitch uPlfade ~o eBs.AS of December 15. lOll
8aa2
_8!,a3
B.l
B.2
B.l
Bl
B2
B3
Investment Grade------BB+
BB
BB.
B+
B.
ecc+ S& P uPi' .de t~ 68.
u of .A.puI8. ~Olleail!
Cu2ccc
CCC.
CC
Cod
28/12/2012
31
16
!R 8! 8! s: m § 8 8 8 8 8'"
§ 8'" Q
8 8 C; Q... ... ... N N N N N N N N N
-Moody. -S&P -Fitch
32

Financial Depth and Financial GapWhere's Indonesia? and where's China?
9.0,'JFOI'1!Igncapital
required .A1J1ppines. IhaIand
5.0
.t.5 c£~=:>.Vietnam; .t.0
g 3.5.b _~y. 3.0-=-.
..5 ~ 2.5c'6Q.; 2.0"'"Cj.. 1.5
Brazil
TUIXey .Pal<lstan .~ . IndiaEgjpt .RussIa.ArgeoI!r1a~
Cclcrnool1tJ
. MexicoPEro
. M~s:a
1.0
Swlh AfncaFundingcan be la~elysourced
cr.i~dom9StlcailyI IJI8I ! t
~&: 2CfJ 2.20 2.:1.[)260 26C ~;(( 320 ~O 360
.Cn!e
0.5 "RcmanJa ,-j (;Erta ,S1cJv'.J<ja Mcrocco
o " ~ . .,.i-~d: ~rw1ia,,0 40J aJ '!O 'ro .~. ,. ,.:0 1.!0 :6J
Financial depth." ''>,
:..;! ;~ j.:\J ~:; .J":':~.J~} t.:.ti::,:o t{~.J~~t:;.!.:> ::~n.d .:.~ \ -::i IjDP. ~.I>:,,:,
11L,.~j: j-.F..~.":.t3. ~ml.i~_ .mJ t"lt:!~; .~_, :' (iI'T '::'>,>:..
1.:,,.. ~'.:':k:.:),: G\,b.,li [:~dit'll..
IHSG2 Jan - 26 Des 2012
je;C" 2-.))12 - DioJ,ch.Jr1
O~4252.tt4275.lo.4245.CI:4275 .SMA(S):4285 .SMA(20i4303 ClBoIIro)el'jHigh 27 Nov: 4382
~IOO
4000
3'))()
»)1)
JiOO
[ Open 2 Jan : 3822
OVIJI:9.611B
3600
:>50015B
lOB$umber: www.danareksa-research.c+m
5B
Dee 11 Jo. 12 FobOB"'." "pr M>v s.p 0:1.m J~ .'0<) r.Jov De<
28/12/2012
33
17

IHSG 1 Bulan Terakhir
jclD,d7,2012-OoIvchar'
C (Jp:42S2,tl:427S, lM24S. Ct4275 . SMA(S~4285 . SMA{20~4303 iii BoInQer{20,2~4249- 4358
-""""
D Vol: 9.6116
Oct 12 Nov D~
Sumber: www.danareksa-research.com
IHSG 1 bulan terakhir: Support di 4250 dan Resistance di 4340
IHSG 1 Bulan Terakhiric'
e_ ~7 _")12. ( ,."""'"5C;-~-ZSTH..2~~~75 ::;M;:,~"'a!; . :;,-.,20).IX/3 ci(\.)WoGO:\ 4.Z~'"t-=-~':i...;-
[f.~~-'7~
~
"'"
~ - ~"I~-9!i" ,''''
).., )
r~
,"~."""qul''''''
'':~''<:::'7~:~'.;~_:<:: -:::~:~.~-.-~='-:->-"-~'~'---<_~>"-~~C",-'::::- ;:
Indikator Chaikin Money Flow menunjukkan adanya tekanan beli yang cukup tinggi semnggakedepan masih ada potensi penguatan IHSG.
IHSGjuga sudah menyentuh lower Bollingersehingga ada potensi untuk menguat ke arah4300
Indikator Average Directional Movement Index (ADX)menunjukkan indeks masih cenderungbergerak mendatar (sideways). Hal ini didukung dengan volume dan value transaksi yangcenderung berkurang seiring libur Natal dan Tahun Baru
4400
<!XX)156
106
56
06
28/12/2012
18

JakartaCompositeIndex2002 -21 December 2012
4,400
4,000 IHSG ~ ~f"-'f
'v~3,600 2012 ditutup :t4300
2013 optimis tembus 55003,200
2,800
2,000
1,600
1,200
800
400
2002 2003 2004 2005 2006 2007 2008 2009 2010 2011 20120
.,~: :t~tmatr :01: 37
~-4J~--IDX
1[~dCr,~':;id $ce)('< [Xc.;~d:.~'_
3U:;.1 ::'ff"1( In(~Otj(,Sld
Thank You
28/12/2012
19