financial managements3.amazonaws.com/caclubindia/cdn/forum/files/41_170... · web viewonce the risk...
TRANSCRIPT

Cost Academy Financial Management-1
10F, Shyama Prasad Mukherjee Rd.Kolkata: 700025.
For Information :Office : (033)- 2486-4919 & 2419-1631 Mobile : 98307- 16788 (Ranjan)
98740- 42374 (Biplab)Website : www.costacademy.co.in
www.costmanagement.net.inE-mail : [email protected]
SMS to Alok Chakraborty: 98301- 05664

Cost Academy Financial Management-2
FINANCIAL MANAGEMENT

Cost Academy Financial Management-3
Page No. Class1. Syllabus 042. Basic of Financial Management 05 13. Leverage & Gearing 10 14. Ratio Analysis 14 45. Fund flow & Cash flow 28 46. Cost of Capital & Capital Structure 37 57. Capital Budgeting 48 68. Working Capital Management 58 49. Short Notes 6710. Tables 70
Total 25
Group II Paper 4: Cost Accounting and Financial Management (One paper – Three hours — 100 Marks)

Cost Academy Financial Management-4
Level of Knowledge: Working knowledge
Part I: Cost Accounting (50 Marks) Part II: Financial Management (50 Marks)
Objectives:(a) To develop ability to analyse and interpret various tools of financial analysis and planning,(b) To gain knowledge of management and financing of working capital,(c) To understand concepts relating to financing and investment decisions, and(d) To be able to solve simple cases.
Contents:1. Scope and Objectives of Financial Management
(a) Meaning, Importance and Objectives(b) Conflicts in profit versus value maximization principle(c) Role of Chief Financial Officer.
2. Time Value of Money: Compounding and Discounting techniques— Concepts of Annuity and Perpetuity.
3. Financial Analysis and Planning: (a) Ratio Analysis for performance evaluation and financial health(b) Application of Ratio Analysis in decision making(c) Analysis of Cash Flow Statement.
4. Financing Decisions (a) Cost of Capital — Weighted average cost of capital and Marginal cost of capital.(b) Capital Structure decisions — Capital structure patterns, Designing optimum capital
structure, Constraints, Various capital structure theories(c) Business Risk and Financial Risk-Operating & financial leverage, Trading on Equity.
5. Types of Financing: (a) Different sources of finance(b) Project financing—Intermediate and long term financing.(c) Negotiating term loans with banks and financial institutions and appraisal thereof(d) Introduction to lease financing (e) Venture capital finance.
6. Investment Decisions: (a) Purpose, Objective, Process(b) Understanding different types of projects.
(c) Techniques of Decision making: Non-discounted and Discounted Cash flow Approaches— Payback Period method, Accounting Rate of Return, Net Present Value, Internal Rate of Return, Modified Internal Rate of Return, Discounted Payback Period and Profitability Index.
(d) Ranking of competing projects, Ranking of projects with unequal lives.
7. Management of Working Capital: (a) Working capital policies (b) Funds flow analysis(c) Inventory management (d) Receivables management(e) Payables management (f) Management of cash & (g) Financing of working capital. marketable securities
Basic of Financial Management

Cost Academy Financial Management-5
Financial management is broadly concerned with the acquisition and use of funds by a business firm. Its scope may be defined in terms of the following questions:
1. How large should the firm be and how fast should it grow?2. What should be the composition of the firm’s assets?3. What should be the mix of the firm’s financing?4. How should the firm analyse, plan, and control its financial affairs?
1. EVOLUTION OF FINANCIAL MANAGEMENT Financial management emerged as a distinct field of study at the turn of this century. Its evolution may be divided into three broad phases (though the demarcating lines between these phases are some what arbitrary): the traditional phase, the transitional phase, & the modern phase
The traditional phase lasted for about four decades: 1. The focus of financial management was mainly on certain episodic events like formation,
issuance of capital, major expansion, merger, reorganization, and liquidation in the life cycle of the firm.
2. The approach was mainly descriptive and institutional. The instruments of financing, the institutions and procedures used in capital markets, and the legal aspects of financial events formed the core of financial management.
3. The outsider’s point of view was dominant. Financial management was viewed mainly from the point of the investment bankers, lenders, and other outside interests.
2. Decisions, Return, Risk, and Market Value Risk is present in virtually every decision. When a production manager selects equipment, or a marketing manager an advertising campaign, of a finance manager a portfolio of securities all of them face uncertain cash flows. Assessing risks and incorporating the same in the final decision is an integral part of financial analysis.
The objective in decision making is not to eliminate or avoid risk - often it may be neither feasible nor necessary to do so - but to properly assess it and determine whether it is worth bearing. Once the risk characterizing future cash flows is properly measured, an appropriate risk-adjusted discount rate should be applied to convert future cash flows into their present values.
It is organized into four sections as follows:
1. Risk and return of a single asset 2. Risk and return of a portfolio3. Measurement of market risk 4. Relationship between risk and return
3. Business risk and financial risk:
Business Risk: It is an unavoidable risk because of the environment in which the firm has to operate and the business risk is represented by the variability of earnings before interest and tax (EBIT). The variability in turn is influenced by revenues and expenses. Revenues and expenses are affected by demand of firm’s products, variations in prices and proportion of fixed cost in total cost.
Financial Risk: It is the risk borne by a shareholder when a firm uses debt in addition to equity financing in its capital structure. Generally, a firm should neither be exposed to high degree of business risk and low degree of financial risk or vice-versa, so that shareholders do not bear a higher risk.
4. Two Basic functions of Financial Management:

Cost Academy Financial Management-6
(i) Procurement of funds: Funds can be procured from different sources; their procurement is a complex problem for business concerns. Funds procured from different sources have different characteristics in terms of risk, cost and control.
(1) The fund raised by issuing equity share poses no risk to the company. The funds raised are quite expensive. The issue of new shares may dilute the control of existing shareholders.
(2) Debenture is relatively cheaper source of funds, but involves high risk as they are to be repaid in accordance with the terms of agreement. Also interest payment has to be made under any circumstances. Thus there are risk, cost and control considerations, which must be taken into account before raising funds.
(3) Funds can also be procured from banks and financial institutions subject to certain restrictions.
(4) Instruments like commercial paper; deep discount bonds etc also enable to raise funds.
(5) Foreign direct investment (FDI) & Foreign Institutional Investors (FII) are two major routes for raising funds from international sources, besides ADR’s & GRD’s.
(ii) Effective utilisation of funds: Since all the funds are procured at a certain cost, therefore it is necessary for the finance manager, to take appropriate and timely actions so that the funds do not remain idle. If these funds are not utilised in the manner so that they generate an income higher than the cost of procuring them, there is no point in running the business.
5. Functions of a Chief Financial Officer. -- Estimating requirement of funds-- Decision regarding capital structure-- Investment decisions
-- Dividend decision-- Evaluating financial performance-- Financial negotiation
-- Keeping touch with stock exchange quotations & behaviour of share prices.
6. Social cost benefit analysis.
Analysis of public projects has to be done with reference to social costs & benefits. Since they cannot be expected to yield an adequate commercial return on the funds employed, at least during the short run.
Social cost benefit analysis is important for the private corporations also who have a moral responsibility to undertake socially desirable projects.
The need for social cost benefit analysis arises due to the following:
(i) The market prices used to measure costs & benefits in project analysis, may not represent social values due to market imperfections.
(ii) Monetary cost benefit analysis fails to consider the external +ve & -ve effects of a project.(iii) Taxes & subsidies are transfer payments & hence irrelevant in national economic
profitability analysis.(iv) The redistribution benefits because of project needs to be captured.(v) The merit wants are important appraisal criteria for social cost benefit analysis.
7. Risk – Return considerations in financing of current assets

Cost Academy Financial Management-7
The financing of current assets involves a trade off between risk & return. A firm can choose from short or long term sources of finance. Short term finance is less expensive than long term financing but at the same time, short term financing involves greater risk than long term financing.
Depending on the mix of short term and long term financing, the approach followed by a Co. may be referred as matching approach, conservative approach & aggregative approach.
8. “Decision three analysis is helpful in managerial decisions.” Explain
It is generally observed that the present investment decision may have several implications for future investments decisions. Such complex investment decisions involve a sequence of decisions over time. It is also argued that since present choices modify future alternatives, industrial activity cannot be reduced to a single decision and must be viewed as a sequence of decisions extending from the present time into the future. The sequential decisions are taken on the bases of decision three analyses. While constructing and using decision tree, some important steps to be considered are as follows:
(i) Investment proposal should be properly defined.(ii) Decision alternatives should be clearly clarified.
(iii) The decision tree should be properly graphed indicating the decision points chances, events and other data.
(iv) The results should be analyzed and the best alternative should be selected.
9. Export Financing by Banks :
Exports being given a top priority in the country’s economic programme, commercial banks render lot of assistance to exporting business houses and industries. Export financing by banks is principally divided into two categories, viz., (i) Pre-shipment finance & (ii) Post-shipment finance.Advance before shipment of goods or pre-shipment finance takes the form of packing credit made available for buying, manufacturing, processing, packing and shipping goods. The interest rates and margin requirements are concessional. Each advance take is required to be liquidated generally within 180 days.
Post-shipment finance takes the following forms:1. Purchase/discounting export bills;2. Advance against export bills for collection; and3. Advance against duty drawback/cash compensatory support claims.
Normally, facilities granted by banks for export are exempt from many conditions that are attached to other forms of bank finance.
10. Margin Money: Bankers keep a cushion to safeguard against changes in value of securities while expending loans are given to customer. This cushion represents the Margin Money.The quantum of margin money depends upon the credit worthiness of the borrowers and the nature of security.In project cost financing, Margin Money has to come from Promoters’ contribution.In the case of borrowing for working capital Margin Money has to be provided as per norms that are prescribed from time to time by RBI. In the case of new projects Margin Money required for working capital is included in the Project Cost.

Cost Academy Financial Management-8
11. Bridge Finance: Bridge finance refers, normally, to loans taken by a business, usually from commercial banks for a short period, pending disbursement of terms loans by financial institutions. Normally, it takes time for the financial institution to finalise procedures of a creation of security, tie-up participation with other institutions etc., even though a positive appraisal of the project has been made. However, once the loans are approved in principle, in order not to lose further time in starting their projects, arrange for bridge finance. Such temporary loan is normally repaid out of the proceeds of the principal term loans. Generally the rate of interest on bridge finance is 1% or 2% higher than on normal term loans
12. Promoters contribution in new venture.
(a) Share capital to be subscribed by the promoters in the form of equity share capital and/or preference share capital.
(b) Equity shares issued as rights shares to the existing shareholders.(c) Convertible debentures issued as “rights” to existing shareholders.(d) Unsecured loans. (e) Seed capital assistance.(f) Venture capital. (g) Internal cash accruals.
13. Role of merchant bankers in public issues:
1. Drafting of prospectus and getting approved by the appropriate authorities. 2. Appointing, assisting in appointing Bankers, underwriters, brokers, advertisers printers etc.
3. Obtaining the consent of all agencies involved in public issues. 4. Holding Brokers’ conference/ Issuers’ conference.
5. Deciding pattern of advertisement.6. Deciding the branches where application money should be collected.
7. Deciding the dates of opening and closing of the issues.8. Obtaining daily report of money collected.
9. To get the consent of stock exchange for deciding basis of allotment.10. To take full responsibility for all administrative matters.
(i) It lacks transparency. (ii) The scope for misuse is available.
14. Ploughing back of profits: Retained earnings means retention of profit and reinvesting it in the company as long term funds. Such funds belong to the ordinary shareholders and increase the net worth of the company. A public limited company must plough back a reasonable amount of profit every year keeping in view the legal requirements in this regard and its own expansion plans. Such funds also entail almost no risk. Further, control of present owners is also not diluted by retaining profits.
15. Packing credit.
Any exporter, having at hand a firm export order placed with him by his foreign buyer or an irrevocable letter of credit opened in his favour, can approach a bank for availing of packing credit. An advance so taken by an exporter is required to be liquidated within 180 days from the date of its commencement by negotiation of export bills or receipt of export proceeds in an approved manner. Thus Packing Credit is essentially a short-term advance.

Cost Academy Financial Management-9
Packing credit may be of the following types: (a) Clean packing credit: This is an advance made available to an exporter only on production of
a firm export order or a letter of credit without exercising any charge or control over raw material or finished goods. Also, Export Credit Guarantee Corporation (ECGC) cover should be obtained by the bank.
(b) Packing credit against hypothecation of goods: Export finance is made available on certain terms and conditions where the exporter has pledgeable interest and the goods are hypothecated to the bank as security with stipulated margin. At the time of utilizing the advance, the exporter is required to submit, along with the firm export order or letter of credit, relative stock statements and thereafter continue submitting them every fortnight and whenever there is any movement is stocks.
(c) Packing credit against pledge of goods: Export finance is made available on certain terms and conditions where the exportable finished goods are pledged to the banks with approved clearing agents who will ship the same from time to time as required by the exporter. The possession of the goods so pledged lies with the bank and are kept under its lock and key.
16. Differentiation between Financial Management and Financial Accounting
Though financial management and financial accounting are closely related, still they differ in the treatment of funds and also with regards to decision - making.
Treatment of Funds: In accounting, the measurement of funds is based on the accrual principle. The accrual based accounting data do not reflect fully the financial conditions of the organisation. An organization which has earned profit (sales less expenses) may said to be profitable in the accounting sense but it may not be able to meet its current obligations due to shortage of liquidity as a result of say, uncollectible receivables. Whereas, the treatment of funds, in financial management is based on cash flows. The revenues are recognised only when cash is actually received (i.e. cash inflow) and expenses are recognised on actual payment (i.e. cash outflow). Thus, cash flow based returns help financial managers to avoid insolvency and achieve desired financial goals.
Decision-making: The chief focus of an accountant is to collect data and present the data while the financial manager’s primary responsibility relates to financial planning, controlling and decision-making. Thus, in a way it can be stated that financial management begins where financial accounting ends.

Cost Academy Financial Management-10
LEVERAGE
Introduction:For selecting a target debt-equity mix the firm analyses a number of factors. One such factor is leverage. Capital structure decision involves a choice between risk and expected returns. Use of more and more debt capital raises the Riskiness of the firm’s earning stream but it tends to provide a higher expected rate of return to the shareholders. In this chapter, we consider the various aspects of leverage and risks in planning the capital structure of a firm.
Type of Leverage:
The term leverage in general refers to a relationship between two interrelated variables. In financial analysis it represents the influence of one financial variable over some other related financial variable. These financial variables may be costs, output, sales revenue, Earnings before interest and tax (EBIT), Earning per share (EPS) etc.
There are three commonly used measures of leverage in financial analysis. These are:i) Operating Leverageii) Financial Leverageiii) Combined Leverage
Operating Leverage
Operating leverage results when fluctuations in sales are accompanied by disproportionate fluctuations in operating profit. This is due to existence of fixed costs in the cost structure of a firm. The absence of fixed cost in the total cost structure of a firm will not lead to disproportionate change in profit due to a given change in sales. So, no fixed costs no operating leverage.
Measurement of Operating leverage:
Operating Leverage or Degree of Operating Leverage
= Contribution. ÷ Operating Profit or EBIT = % change in operating profit ÷ % Change in sales volume
Financial Leverage:
Financial leverage indicates the effect on earning created by the use of fixed-charge securities in the capitalization plan. In other words, financial leverage results when fluctuation in EBIT is accompanied by disproportionate fluctuation in the firm’s earning per shares. This is due to existence of fixed financial charges that arise out of use of fixed interest bearing securities in the capitalization plan. If a firm does accompanied by a similar change in EPS. So, no fixed financial charges no financial leverage.
Measure: Financial Leverage or Degree of Financial Leverage= EBIT÷ (EBIT – Interest) = (% change in EPS) ÷ (% change in EBIT)
Combined LeverageMeasuring Total Risk i.e. combined leverageCombined Leverage = Contribution × EBIT= Contribution = FL× OL
EBIT EBT EBT

Cost Academy Financial Management-11
A few combinations of DOL, DFL & DCL are stated below:
DOL DFL Combined impact or Combined Leverage
Low i.e. low fixed Cost structure
Low i.e. low level of Debt capital
It indicates that the management is taking a very cautious approach towards debt financing. It is difficult to maximise the return of the shareholders in this case. It should be avoidable.
High i.e. high fixed cost structure
High i.e. high level of debt financing
This is a very risky combination & known as high-geared combination due to high leverage. The chance of accident in this case is also very high due to much dependency on loan capital. Hence, this situation should be avoided
High Low In this case the high-risk situation is partly diluted as low interest of debt capital will offset the burden of fixed cost or low DFL adjust the high DOL. But aggressive debt policy cannot be adopted in this case & as a result the return to the shareholder is not maximized.
Low High This situation is ideal for return maximisation. As fixed cost is low, but high interest has maximise the return to share holders at a minimum risk.
Problems:
1. Calculate the Degree of Operating Leverage, Degree of Financial Leverage and the Degree of Combined Leverage for the following firms and interpret the result:-
B Q R
Output (units) 3,00,000 75,000 5,00,000Fixed costs (Rs.) 3,50,000 7,00,000 75,000Unit variable cost (Rs.) 1.00 7.50 0.10Interest Expenses (Rs.) 25,000 40,000 NilUnit Selling Price (Rs.) 3.00 25.00 0.50
2. Calculate the operating leverage, financial leverage and combined leverage from the following data under Situation I and II and Financial Plan A and B:
Installed Capacity 4,000 UnitsActual Production and Sales 75% of the CapacitySelling Price Rs. 30 per Unit.Variable Cost Rs 15 per Unit.
Fixed Cost:Under Situation I Rs. 15,000Under Situation II Rs. 20,000
Financial Plan: A (Rs.) B (Rs.)Equity 10,000 15,000

Cost Academy Financial Management-12
Debt (Rate of Interest at 20%) 10,000 5,0003. From the following prepare Income Statement of Company A, B and C. Briefly comment on each
company’s performance:
Company A B C
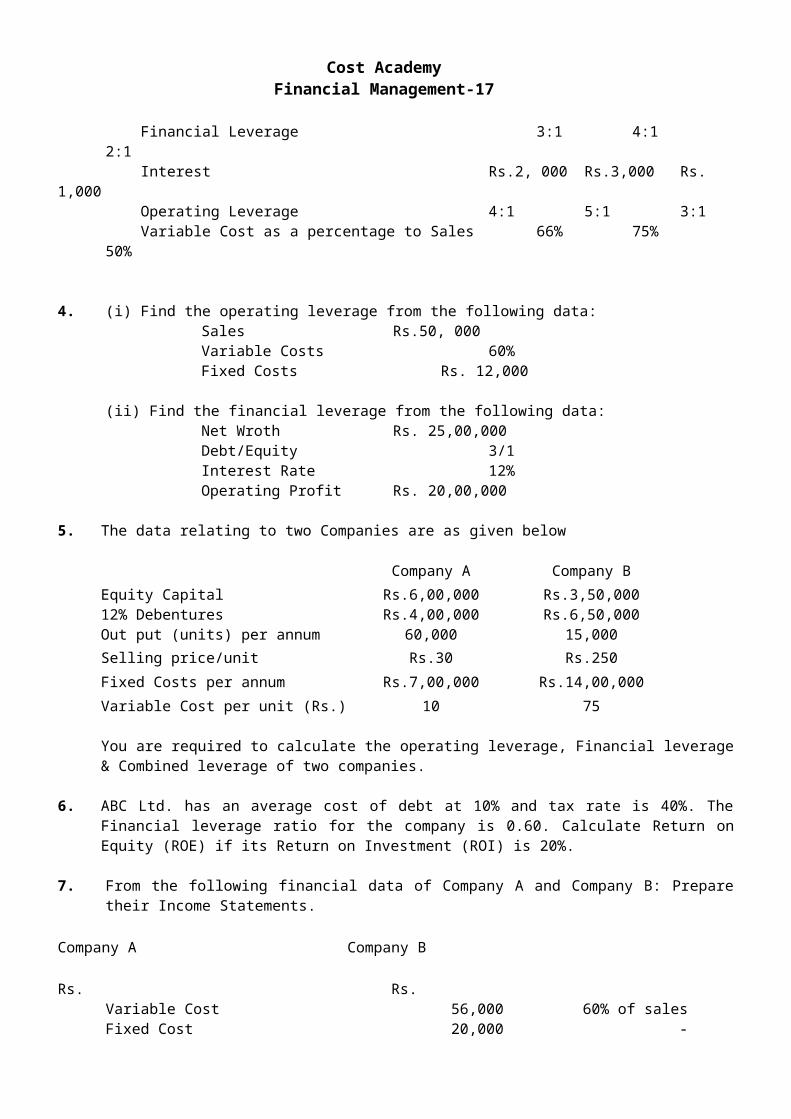
Financial Leverage 3:1 4:1 2:1 Interest Rs.2, 000 Rs.3,000 Rs. 1,000 Operating Leverage 4:1 5:1 3:1 Variable Cost as a percentage to Sales 66% 75% 50%
4. (i) Find the operating leverage from the following data:Sales Rs.50, 000Variable Costs 60%Fixed Costs Rs. 12,000
(ii) Find the financial leverage from the following data:Net Wroth Rs. 25,00,000Debt/Equity 3/1Interest Rate 12%Operating Profit Rs. 20,00,000
5. The data relating to two Companies are as given below
Company A Company B
Equity Capital Rs.6,00,000 Rs.3,50,00012% Debentures Rs.4,00,000 Rs.6,50,000Out put (units) per annum 60,000 15,000Selling price/unit Rs.30 Rs.250
Fixed Costs per annum Rs.7,00,000 Rs.14,00,000
Variable Cost per unit (Rs.) 10 75
You are required to calculate the operating leverage, Financial leverage & Combined leverage of two companies.
6. ABC Ltd. has an average cost of debt at 10% and tax rate is 40%. The Financial leverage ratio for the company is 0.60. Calculate Return on Equity (ROE) if its Return on Investment (ROI) is 20%.
7. From the following financial data of Company A and Company B: Prepare their Income Statements. Company A Company B
Rs. Rs.Variable Cost 56,000 60% of salesFixed Cost 20,000 -Interest Expenses 12,000 9,000Financial Leverage 5 : 1 -Operating Leverage - 4 : 1Income Tax Rate 30% 30%Sales - 1,05,000

Cost Academy Financial Management-13
8. The following details of RST Ltd. for the year ended 31st March, 2010 are given below:
Operating leverage 1.4Combined leverage 2.8Fixed cost (Excluding interest) Rs. 2.04 lakhsSales Rs. 30.00 lakhs12% Debentures of Rs. 100 each Rs. 21.25 lakhsEquity Share Capital of Rs. 10 each Rs. 17.00 lakhsIncome Tax rate 30%
Required:i) Calculate Financial leverageii) Calculate P/V ratio and Earning per Share (EPS)iii) If the company belongs to an industry, whose assets turnover is 1.5, does it have a high or
low assets leverage?iv) At what level of sales the Earning Before Tax (EBT) of the company will be equal to zero?

Cost Academy Financial Management-14
RATIO ANALYSIS
Ratio analysis is an important tool of management as it revels the true position of the business. It is generally calculated on the basis comparison of two items taken from its financial statement. Then it is compared with the standard norms as specified for the industry.
Classification of Ratios:(i) Revenue Ratios: When two variables are taken from revenue statement the ratio so
computed is known as Revenue ratio, for example;
Net profitSales ×100; Material Consumed Cost of goods sold100
(ii) Balance Sheet Ratio: When two variables are taken from the Balance Sheet the ratio so computed is known a Balance Sheet ratio, for example,
Current Ratio = Current Assets Current Liabilities; Net Worth Total Liabilities(iii) Mixed Ratio: When one variable is taken from the Revenue Statement and other is taken
from the Balance Sheet the ratios so computed are known as mixed ratios; for example,
Net profit Capital Employed 100; Sales Average Total Assets
According to usage: The following seven categories of financial ratios have been advocated by George Foster of Standford University and these seem to cover exhaustively different aspects of a business organization, these categories have been listed as below:
1. Cash position 2. Liquidity3. Working capital/Cash flow 4. Capital structure5. Profitability 6. Debt Services Coverage7. Turnover
Large number of financial ratios are used within each category and some of these may carry same information rather than focusing on any new light. Therefore, it is necessary to avoid duplication of information. The analyst should be selective with regard to the use of financial ratios.
Broadly speaking, the operations and financial position of a firm can be described by studying its short term and long term liquidity position, profitability and its operational activities. Therefore, ratios can be classified into following five broad categories:
a. Liquidity Ratio b. Capital Structure/ Leverage ratios.c. Activity Ratios d. Profitability Ratios.
Liquidity Ratio(i) Current Ratio = Current Assets Current Liabilities; (ii) Quick Ratio = Quick Assets Current Liabilities(iii) Quick Ratio = Quick Liquid Assets Quick Liabilities
Meaning of the terms used:Current Assets = Inventories +Sundry Debtors +Cash & Bank Balance +
Receivables/ Accruals+ Loans & Advances+ Disposable Investment.

Cost Academy Financial Management-15
Current Liabilities = Creditors for goods & Services +Short-term Loans+ Bank Overdraft+ Cash Credit +Outstanding Expenses+ Provision for
Taxation+ Proposed Dividend +Unclaimed Dividend.
Quick Assets = Current Assets –InventoriesQuick Liabilities = Current Liabilities –Bank Overdraft –Cash Credit
Significance of the Current and Quick Ratios: Current Ratio is a business concern indicates the availability of current assets to meet its current liabilities. Higher the ratio better is the coverage. Traditionally, it is also called 2:1 ratio, i.e. 2 is the standard for current assets for each unit of current liabilities. But this is only a conservative outlook about the coverage of current liabilities. Generally the level of current ratio vary from industry to industry depending on the specific industry characterizes. Also a firm differs from the industry ratio because of its policy.
Quick Assets consist of only cash and near cash assets. Inventories are deducted from current assets on the belief that these are not ‘near cash assets’. But in a seller’s market inventories are also near cash assets. Moreover, just like lag in collection of debtors, there is a lag in conversion of inventories into Finished Goods and Sundry Debtors. Obviously slow moving inventories are not near cash assets. However, while calculating the quick ratio we have followed the conservatism convention. Quick liabilities are that portion of current liabilities which fall due immediately. Since bank overdraft and cash credit can be used as a source of finance as and when required, it is not included in the calculation of quick liabilities.
Cash Ratio: The cash ratio measures the absolute liquidity of the business. This ratio considers only the absolute liquidity available with the firm. This ratio is calculated as:
Cash +Marketable Securities Current Liabilities
Interval Measure: This ratio measures the firm’s ability to meet its regular cash expenses. This ratio is calculated as: {(Current Assets- Inventory)Average Daily Operating Expenses}
The average daily operating expenses is equal to cost of goods sold plus selling, administrative and general expenses less depreciation (and other non-cash expenditures) dividend by number of days in a year. Say 360 days.
Equity means paid up share capital including preference share capital and reserves.Two popularly used capital structure ratios are:
Owner’s Equity Total EquityThis ratio indicates proportion of owners’ fund to total fund invested in the business. Traditionally it is believed that higher the proportion of owners’ fund lower is the degree of risk.
Debt Equity Ratio = Debt Equity
This ratio indicates the proportion of debt fund in relation to equity. This ratio is very often referred in capital structure decision as well as in the legislation dealing with the capital structure decisions (i.e. issue of shares and debentures). Lenders are also very keen to know this ratio since it shows relative weights of debt and equity.
There is no norm for maximum debt-equity ratio. Lending institutions generally set their won norms considering the capital intensity and other factors.
Coverage Ratios: The coverage ratios measure the firm’s ability to service the fixed liabilities. These ratios establishes the relationship between fixed claims and what is normally available out of which these claims are to be paid. The fixed claims consist of
(i) Interest on loans

Cost Academy Financial Management-16
(ii) Preference dividend(iii) Amortization of principal or repayment of the installment of loans or redemption
of preference capital on maturity.
The following are important coverage ratios:
(i) Debt Service coverage ratio: Lenders are interested in debt service coverage to judge the firm’ ability to pay off current interest and installments.
Earning for debt service = Net profit+ Non-cash operating expenses like depreciation and other amortizations+ non-operating adjustments like loss on sales of +Fixed assets+ interest on Debt fund.
Proprietary Fund = Equity as calculated above+ Capital Reserve +Capital Redemption Reserve
Debt Service coverage = {Earning available for debt service (Interest +installments)}
It indicates that earnings available for debt-service are 1.07 times of the interest and installment.
Interest Coverage ratio: This ratio also known as “times interest earned ratio”. It indicates the firm’s ability to meet interest (and other fixed-charges) obligations. This ratio is computed as:
Interest Coverage Ratio = EBIT InterestEarning before interest and taxes are used in the numerator of this ratio because the ability to pay interest is not affected by tax burden as interest on debt funds is deductible expense. This ratio indicates the extent to which earnings may fall without causing any embarrassment to the firm regarding the payment of interest charges. A high interest coverage ratio means that an enterprise can easily meet its interest obligations even if earnings before interest and taxes suffer a considerable decline. A lower ratio indicates excessive use of debt or inefficient operations.
(iii) Preference Dividend Coverage ratio = EAT Preference dividend liability
Earning after tax is considered because unlike debt on which interest is charged on the profit of the firm, the preference dividend is treated as appropriation on profit. This ratio indicates margin of safety available to the preference shareholders. A higher ratio is desirable from preference shareholders point of view.
Capital Gearing Ratio: In addition to debt-equity ratio sometimes capital –gearing ratio is also calculated to show the proportion of fixed interest (dividend) bearing capital to funds belonging to equity shareholders.
Capital Gearing Ratio = (Preference share capital+ Debentures +Long term loan Equity share capital + Reserve & surplus –Losses)
For judging long term solvency position, in addition to debt-equity ratio and capital gearing ratio, the following ratios are also used.
(i) Fixed Assets Long term FundIt is expected that fixed assets and core working capital are to be covered by long term fund. In various industries the proportion of fixed assets and current assets are different. So there is no uniform standard of this ratio too. But it should be less than one. If it is more than one, it means short-term fund has been used to finance fixed assets. Very often many companies resort to such practice during expansion. This may be a temporary arrangement but not a long term remedy.
Cost Academy Financial Management-17
(ii) Proprietary Ratio = Proprietary Fund Total Assets
Proprietary fund includes equity share capital +Preference share capital+ Reserve & surplus –and fictitious asset.
Total assets exclude fictitious assets and losses.
If one follows standard current ratio 2:1 and standard debt-equity ratio 2:1, what should be the standard proprietary ratio? Let Rs. 100 be the total assets of which Rs. 20 be the current assets. Then following standard current ratio Rs. 10 are financed by current liabilities, remaining Rs. 90 are financed by debt & equity. Since following standard debt-equity ratio equity component is 1/3 it is expected that out of Rs. 90, Rs. 30 should come from proprietary fund. If the current assets component increases equity commitment will be reduced and vice-versa.
Proprietary Fund = Equity as calculated above+ Capital Reserve+ Capital Redemption Reserve
Activity Ratios or turnover ratios or performance ratios.
These ratios are employed to evaluate the efficiency with which the firm manages and utilizes its assets. These ratios usually indicates the frequency of sales with respect to its assets. These assets may be capital assets or working capital or average inventory. These ratios are usually calculated with reference to sales/cost of goods sold and are expressed in terms of rate or times. Several activity ratios are as follows:
(i) Capital Turnover Ratio = Sales Capital Employed
This ratio indicates the firms ability of generating sales per Re. Of long term investment. The higher the ratio, the more efficient the utilization of owner’s and long-term creditors’ funds.
(ii) Fixed Assets turnover ratio = Sales Capital Assets
A higher fixed assets turnover ratio indicates efficient utilization of fixed assets in generating sales. A firm whose plant and machinery are old may show a higher fixed assets turnover ratio than the firm which has purchased them recently.
(iii) Working Capital Turnover = Sales Working Capital
Working capital turnover is further segregated into inventory turnover, Debtors Turnover, Creditors Turnover.
Inventory Turnover Ratio: This ratio also known as stock turnover ratio establishes the relationship between the cost of goods sold.
Inventory Turnover Ratio = Sales Average InventoryAverage Inventory = {(Opening Stock+ Closing stock) 2}
Very often inventory turnover is calculated with reference to cost of sales instead of sales. In that case inventory turnover will be calculated as: Cost of sales average stock
Students are advised to follow this formula for calculating inventory turnover ratio. In the case of inventory of raw material the inventory turnover ratio is calculated using the following formula:
Raw Material Consumed Average Raw Material StockDebtors’ turnover ratio = Sales Average Accounts Receivable

Cost Academy Financial Management-18
As Account receivables pertains only to credit sales, it is often recommended to compute the debtors’ turnover with reference to credit sales instead of total sales. Then the debtors turnover would be: Credit Sales Average Accounts Receivable.
Creditors turnover ratio = Annual Net Credit PurchaseAverage Accounts Payable
A low creditor’s turnover ratio reflects liberal credit terms granted by supplies. While a high ratio shows that accounts are settled rapidly. Credit Purchase Average Accounts Payable.Debtors’ turnover ratio indicates the average collection period. However, the average collection period can be directly calculated as follows:
Average Accounts Receivable Average Daily Credit Sales
Average Daily Credit Sales = Credit Sales 365Similarly, Average payment period can be calculated using:
Average Accounts Payable Average Daily Credit Purchase. Inventory Turnover Ratio = Cost of Goods sold Average Inventory
Profitability Ratio: The profitability ratios measure the profitability or the operational efficiency of the firm. These ratios reflects the final results of business operations. The results of the firm can be evaluated in terms of its earnings with reference to a given level of assets or sales or owners interests etc. Therefore, the profitability ratios are broadly classified in three categories:
1. Profitability ratios required for analysis from owners point of view.2. Profitability ratios base do Assets/Investments.
3. Profitability ratios based on sales of the firm.
Return on Equity (ROE): Return on Equity measures the profitability of equity funds invested in the firm. This ratio reveals how profitability of the owners’ funds have been utilized by the firm. This ratio is computed as: ROE = Profit After Taxes Net Worth
Earnings per share: The profitability of a firm from the point of view of ordinary shareholders can be measured in terms in terms of number of equity shares. This is know as Earning per share. It is calculated as follows:
Earning per share (EPS) = Net Profit Equity Holders No. of Ordinary Shares Outstanding.
Dividend per share: Earning per share as stated above reflects the profitability of a firm per share; it does not reflect how much profit is paid as dividend and how much is retained by the business. Dividend per share ratio indicates the amount of profit distributed to shareholders per share. It is calculated as:Dividend per share = Total Profit Distributed to Equity Shareholders No. of Equity Shares
Price Earning Ratio: The price earnings ratio indicates the expectation of equity investors about the earnings of the firm. It relates earnings to market price and is generally taken as a summary measure of growth potential of an investment, risk characteristics, shareholders orientation, corporate image and degree of liquidity. It is calculated as:
PE Ratio = Market Price per share Earnings per shareReturn on Capital Employed/ Return on investment.
Return on Capital Employed = {(Return Capital Employed)100}
Return = Net profit+ Non-trading adjustments (but not accrual adjustments for amortization of preliminary

Cost Academy Financial Management-19
expenses goodwill, etc.) + Interest on long term debts+ Provision for tax –interest/Dividend from non-trade investments
Capital Employed = Equity Share capital+Reserve & Surplus + Preference Share capital +Debenture and other long term loan –Non Trade investments.
Return on Investment (ROI):
ROI = {(Return Capital Employed) 100}= {(Return Sales) (Sales Capital Employed)100}= {(Return Sales) 100} = Profitability Ratio= (Sales Capital Employed) = Capital Turnover Ratio
ROI can be improved either by improving operating profit ratio or capital turnover or by both.
Return on Assets (ROA):The profitability ratio is measured in terms of relationship between net profit and assets employed to earn that profit. This ratio measures the profitability of the firm in terms of assets employed in the firm. The ROA may be measured as follows:
ROA = (Net profit after taxes Average total assets)= Net profit after taxes Average tangible assets= Net profit after taxes Average fixed assets
Book value per share =Equity Capital+ Reserve & surplus (Excluding Revaluation Reserve) No. of Equity SharesEPS = Net Profit-Preference Dividend No. of Equity Shares.
Gross Margin = Profit before depreciation but after interest before tax.
Capital Employed = Aggregate of the fixed assets, Capital WIP, Investments & current assets excluding accumulated deficit.
Cash generating efficiency: It is the ability of a company to generate cash from its current or continuing operations. Following three ratios are used for the purpose.
i) Cash flow yield = Net Cash flow from Operating activities Net Income
ii) Cash flow to sales: It is the ratio of net cash flows from operating activities to sales, it is computed as follows:
Cash flow to sales = Net cash flow from operating activities Net sales
iii) Cash flows to assets: It is the ratio of net cash flow from operating activities to average total assets. It is computed as follows:
Cash flow to assets = Net Cash flow from operating activities Average total assets.
Du Pont Chart
There are three components in the calculation of return on equity using the traditional Du Pont Model- the net profit margin, assets turnover, and the equity multiplier. By examining each input

Cost Academy Financial Management-20
individually, the sources of a company’s return on equity can be discovered and compared to its competitors.
Return on Equity = (Net profit Margin) (Asset turnover) (Equity Multiplier)
1. Limitations.
1. The trend of the result, rather than the actual ratios and percentages, is more important. Structural relationships, taken from the financial statements of one year only, are of limited value and the trends of these structural relationships established from statements over a number of years may be more significant than absolute ratios.
2. Financial results of all businesses are affected by general economic conditions, by competition, by local factors and by the policy adopted by management and thus any ratios or percentages must be considered with these factors in mind.
3. It is particularly emphasized that one particular ratio used without reference to other ratios may be very misleading. In other words, the combined effect of the various ratios must be considered in arriving at a correct diagnosis which will be of assistance in interpreting the financial condition and earning performance of the firm. Each ratio plays its part in this interpretation.
4. Predictive analysis, budgeting and standard ratios are often more useful to management than ratios obtained by the analysis of past results. However, in analyzing financial statement, the accountant is often forced to use historical statements because they supply the only material available.
Return on Equity (ROE) = PAT ÷NW
Return on Net Assets(RONA) = EBIT÷NA
Financial Leverage (income) = PAT÷EBIT
Financial Leverage (Balance Sheet) = NA
÷NW
Profit Margin = EBIT ÷Sales
Assets turnover= Sales÷ NA

Cost Academy Financial Management-21
5. Unless the accounts have been prepared on uniform basis, inter-firm comparison through accounting ratios becomes misleading. Similarly, even in the same unit same ratios over a number of periods may not mean same thing, unless the accounts have been prepared on consistent basis over the periods.
6. It should be realised that ratios are only a preliminary step in interpretation and must be supplemented by rigorous investigation before safe conclusions can be drawn from them. They may be useful, however, in drawing attention to aspects of the business which require further analysis and investigation.
2. Which accounting ratio will be useful in indicating the following symptoms : 1) Low capacity utilisation. 2) Falling demand for the product in the market. 3) Inability to pay interest.
4) Borrowing for short-term and investing in long-term assets. 5) Large inventory accumulation in anticipation of price rise in future. 6) Inefficient collection of debtors.
7) Inability to pay dues to financial institutions. 8) Return of shareholders’ finds being much higher than the overall return on investment. 9) Liquidity crisis. 10) Increase in average credit period to maintain sales in view of falling demand.
Answer(a) The following ratio(s) will be useful in indicating the symptoms mentioned against each:
(1) Actual hours/Budgeted hours or Fixed Assets Turnover Ratio - Low capacity utilisation.
(2) Finished Goods Turnover Ratio - Falling demand for the product in the market.
(3) Interest Coverage Ratio-Inability to pay interest.[Int. payable/EBIT(excluding the interest )]
(4) Current Ratio or Fixed Assets to Long Term Loans Ratio - Borrowing for short term and Investing in long-term assets.
(5) Inventory Turnover Ratio - Large inventory accumulation in anticipation of Price rise in future.
(6) Debtors Turnover Ratio -Inefficient collection of debtors
(7) Debt Service Coverage Ratio -Inability to pay dues to financial institutions.
(8) Debt-Equity Ratio, Return on Investment and Return on -Return of shareholders’ funds being much higher than Equity compared the overall return on investment.
(9) Current Ratio, Quick Assets or Acid Test Ratio - Liquidity crisis,
(10) Average Collection period or Debtors Turnover Ratio - Increase in average credit period to maintain sales in view of falling demand.
3. Discuss any three ratios computed for investment analysis.
Three ratios computed for investment analysis are as follows:
(i) Earning per share= Profit after tax no. of equity share.
Cost Academy Financial Management-22
(ii) Dividend yield ratio = Equity dividend per share Market price per share100
(iii) Return on capital employed = Net profit before interest and tax Capital employed
PROBLEMS
1. Following is the Balance Sheet of M/s Weldone Ltd. as on 30.6.2010
LIABILITIES Rs. ASSETS Rs. Equity Share Capital 3,00,000 Land 50,000Preference Share Capital 4,00,000 Building 3,00,000Reserves 50,000 Plant & Machinery 3,00,000Profit & Loss A/c 50,000 Furniture 40,00012% Debentures 2,00,000 Debtors 2,00,000Trade Creditors 60,000 Stock 1,50,000Outstanding Expenses 15,000 Cash 40,000Provision for Taxation 20,000 Prepaid Expenses 10,000Proposed Dividends 30,000 Preliminary Expenses 35,000
11,25,000 11,25,000
From the above particulars, you are required to calculate :- (1) Current Ratio (2) Debts to Equity Ratio(3) Capital Gearing Ratio (4) Liquid Ratio.
2. JKL Ltd. has the following Balance Sheets as on March 31, 2010 and March 31, 2009: Balance Sheet (Rs. in Lakhs) March 31, 2010 March 31, 2009Sources of Funds:
Shareholders Funds 2,377 1,472Loan Funds 3,570 3,083
5,947 4,555
Applications of Funds:Fixed Assets 3,466 2,900Cash & Bank 489 470Debtors 1,495 1,168Stock 1,567 1,404
Less: Current Liabilities (3,937) (3,794)__5,947 __4,555
The income statement of the JKL Ltd. for the year ended is as follows: Rs. in lakhs 31.03.2010 31.03.2009
Sales 22,165 13,882Less: Cost of goods sold 20,860 12,544
Gross profit 1,305 1,338Less: Selling, General & Administration expenses 1,135 ___752Earning before interest and tax (EBIT) 170 586

Cost Academy Financial Management-23
Interest expenses 113 105Profit before tax 57 481Tax __23 __192Profit after tax (PAT 34 289
Required: 1. Calculate for the year 2009-10:
a) Inventory turnover ratio b) Financial Leveragec) Return on investment (ROI) d) Return on Equity (ROE)e) Average collection period Give ur comment
3. From the following information, prepare the Balance sheet of XYZ Co. Ltd. showing the details of working :-
Paid-up-capital Rs. 50,000Plant and machinery Rs. 1,25,000Total sales (annual) Rs. 5,00,000Gross profit margin 25%Annual credit sales 80% of net salesCurrent ratio 2Inventory turnover 4Fixed Assets turnover 2Sales returns 20% of salesAverage collection period 73 daysBank credit to trade credit 2Cash to inventory 1 : 15Total debt to current liabilities 3
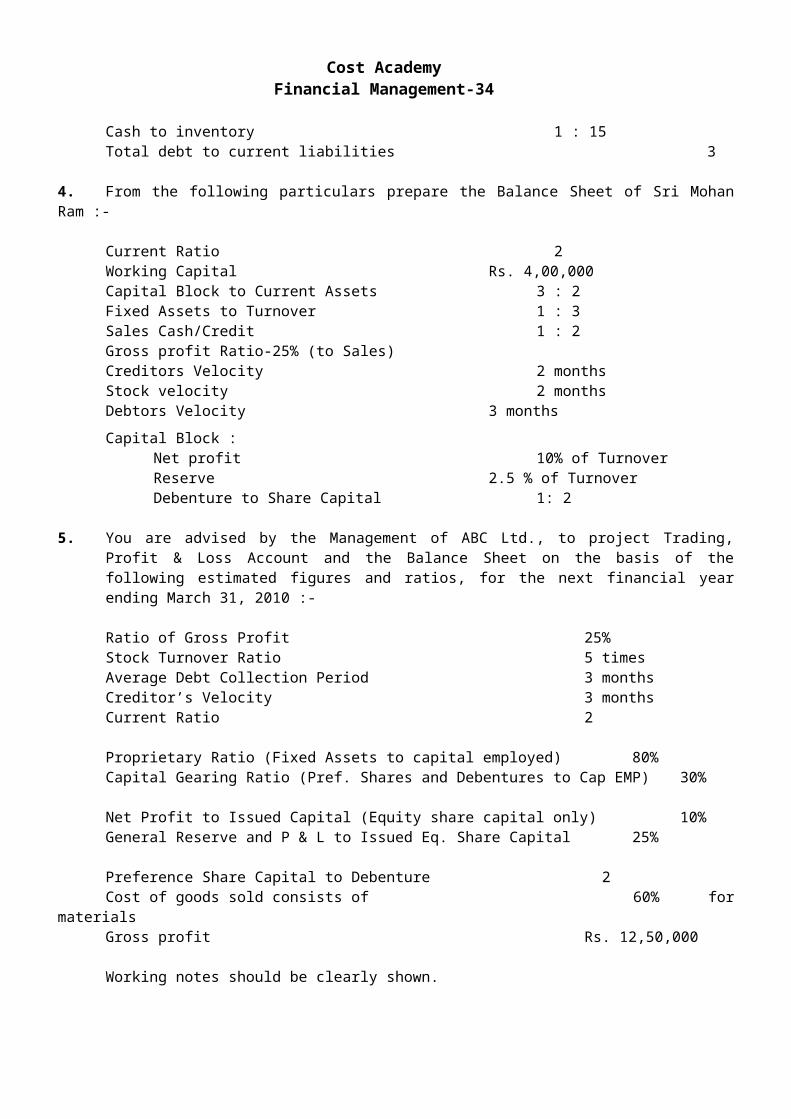
4. From the following particulars prepare the Balance Sheet of Sri Mohan Ram :-
Current Ratio 2Working Capital Rs. 4,00,000Capital Block to Current Assets 3 : 2Fixed Assets to Turnover 1 : 3Sales Cash/Credit 1 : 2Gross profit Ratio-25% (to Sales)Creditors Velocity 2 monthsStock velocity 2 monthsDebtors Velocity 3 monthsCapital Block :
Net profit 10% of TurnoverReserve 2.5 % of TurnoverDebenture to Share Capital 1: 2
5. You are advised by the Management of ABC Ltd., to project Trading, Profit & Loss Account and the Balance Sheet on the basis of the following estimated figures and ratios, for the next financial year ending March 31, 2010 :-
Ratio of Gross Profit 25%Stock Turnover Ratio 5 timesAverage Debt Collection Period 3 monthsCreditor’s Velocity 3 monthsCurrent Ratio 2
Proprietary Ratio (Fixed Assets to capital employed) 80%

Cost Academy Financial Management-24
Capital Gearing Ratio (Pref. Shares and Debentures to Cap EMP) 30%
Net Profit to Issued Capital (Equity share capital only) 10%General Reserve and P & L to Issued Eq. Share Capital 25%
Preference Share Capital to Debenture 2Cost of goods sold consists of 60% for materialsGross profit Rs. 12,50,000
Working notes should be clearly shown.
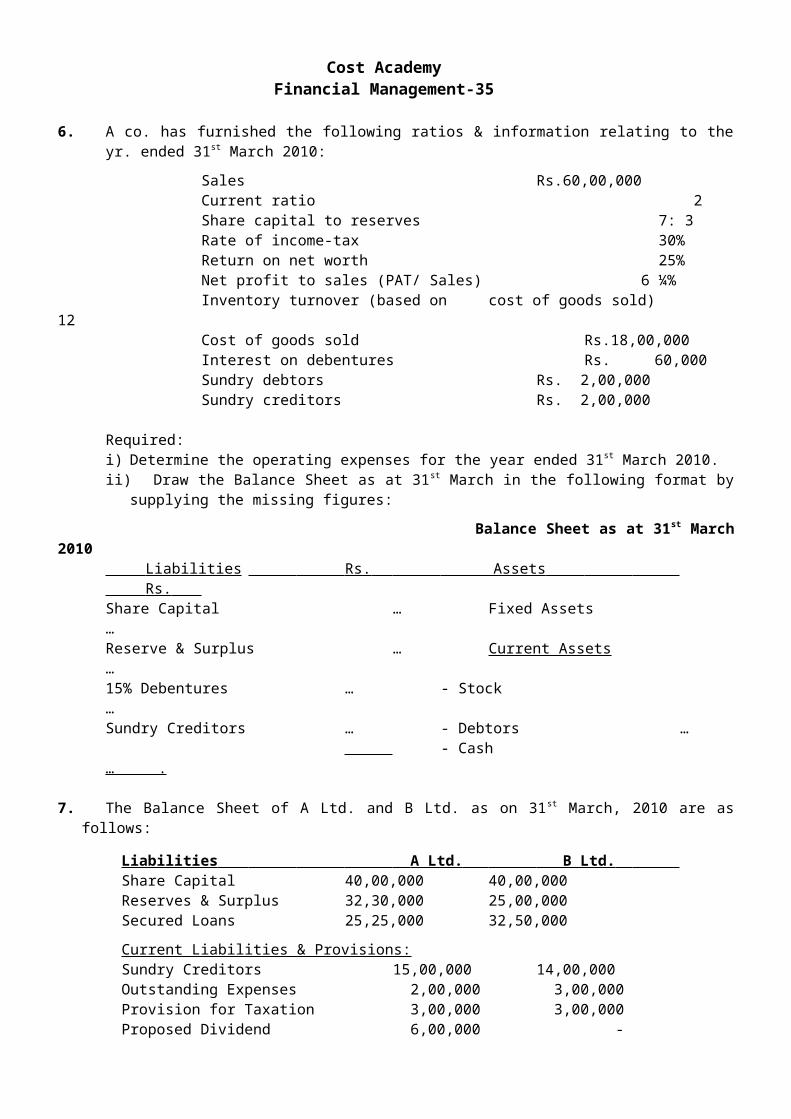
6. A co. has furnished the following ratios & information relating to the yr. ended 31st March 2010:
Sales Rs.60,00,000Current ratio 2 Share capital to reserves 7: 3Rate of income-tax 30%Return on net worth 25%Net profit to sales (PAT/ Sales) 6 ¼%Inventory turnover (based on cost of goods sold) 12Cost of goods sold Rs.18,00,000Interest on debentures Rs. 60,000Sundry debtors Rs. 2,00,000Sundry creditors Rs. 2,00,000
Required:i) Determine the operating expenses for the year ended 31st March 2010.ii) Draw the Balance Sheet as at 31st March in the following format by supplying the missing
figures:
Balance Sheet as at 31st March 2010 Liabilities Rs. Assets Rs. Share Capital … Fixed Assets …Reserve & Surplus … Current Assets …15% Debentures … - Stock …Sundry Creditors … - Debtors …
- Cash … .
7. The Balance Sheet of A Ltd. and B Ltd. as on 31st March, 2010 are as follows:
Liabilities A Ltd. B Ltd. Share Capital 40,00,000 40,00,000Reserves & Surplus 32,30,000 25,00,000Secured Loans 25,25,000 32,50,000
Current Liabilities & Provisions:Sundry Creditors 15,00,000 14,00,000Outstanding Expenses 2,00,000 3,00,000Provision for Taxation 3,00,000 3,00,000Proposed Dividend 6,00,000 -Unclaimed Dividend 15,000 - __
1,23,70,000 1,17,50,000Assets Fixed Assets - Depreciation 80,00,000 50,00,000Investments 15,00,000 - Inventory at Cost 23,00,000 45,00,000Sundry Debtors - 17,00,000

Cost Academy Financial Management-25
Cash and Bank 5,70,000 5,50,000 1,23,70,000 1,17,50,000
Additional information available:(i) 75% of the Inventory in A Ltd. is readily salable at cost plus 20%.(ii) 50% of Sundry Debtors of B Ltd. is due from C Ltd. Which is not in a position to repay the
amount. B Ltd. agreed to accept 15% debentures of C Ltd. (iii) B Ltd. had also proposed 15% dividend but that was not shown in the Accounts. (iv) At the year end, B Ltd. sold investments amounting to Rs. 1,20,000 & repaid Sunday
Creditors.On the basis of the given Balance Sheets and the additional information, you are required to evaluate the liquidity of the companies. All workings should form part of the answer.
8. MICOM Ltd, manufacturer of Mini Computers, commenced business on 1.4.09 with a paid up capital of Rs. 5,00,000. On the same date it also obtained a specific term loan at 20% interest towards 100% of the cost of a special machine from the State Financial Corporation. The loan is to be repaid over five years in equal annual installments excluding interest, the first installment being due on 31.3.10.
For the first year ended 31.3.10 the Company’s final accounts were prepared and stored in a Personal Computer. The Company had retained and transferred to reserve a sum of Rs. 2,00,000 after providing for taxes (tax rate 40%) and proposed a dividend of 20%. The Company had invested the entire reserve amount of Rs. 2,00,000 on 31.3.10 in Government Securities. It had also paid the first installment of the loan.
Unfortunately due to a computer virus, the data has been lost. However, the chief accountant is able to provide the following information.
Debt Service Coverage Ratio 2.5 timesInterest Coverage Ratio 6 timesCreditors Turnover Ratio 1 monthStock Turnover Ratio (Based on Closing Stock) 5 timesDebtors Turnover Ratio 2 monthsCurrent Ratio 2 monthsGross profit Ratio to Sales 33.1/3%Selling and Administration Expenses Rs. 3,00,000
You are required to prepare the Profit and Loss Account and Balance Sheet of MICOM Ltd. for the year ended 31.03.10.
Note: Working should form part of your answer.
9. The following information has been extracted from the Balance sheet of ABC Ltd. as at 30th June, 2007: Liabilities Rs. Assets Rs.
Equity share capital 20,00,000 Fixed Assets :7 & 1/2% pref. share capital 10,00,000 Cost 50,00,000General reserves 4,00,000 Depr. written off 16,00,0006% Debentures 6,00,000 34,00,000Sundry Creditors 10,00,000 Stock of FG 6,00,000
Sundry debtors 8,00,000 Cash 2,00,00050,00,000 50,00,000

Cost Academy Financial Management-26
On further enquiry the following additional information relating to 07-08 was also furnished:
(a) Fixed Assets costing Rs. 10,000 would be acquired and installed on 01.07.07 but the payment therefore would be made on 30.6.08.
(b) Fixes Assets- turnover ratio on the cost of the fixed assets would be 1.5 ;
(c) The stock-turnover ratio would be 14.4 calculated on the basis of the average of the opening and closing stocks;
(d) The break-up of cost-profit was expected as follows: Per cent
Material 40Labour 25Manufacturing expenses 10Office & selling expenses 10Depreciation 5Profit BT 10Sales 100
(e) The profit is also to be charged with interest on debentures & tax assumed @ 35%.(f) Debtors are expected to be 1/9 of turnover and creditors 1/5 of materials consumed;
(g) In June 2008 a dividend of 10% on equity share capital would be paid; and
(h) 6% of debentures of the value of Rs. 5,00,000 would be issued on 1.7.07.
From the above information you are required to prepare a forecast Balance-Sheet as at 30th
June, 2008.
10. Certain items of the annual accounts of ABC Ltd. are missing as shown below :
Trading and Profit & Loss Account for the year ended 31st March, 2010 Rs. Rs. To Opening Stock 3,50,000 By Sales -To Purchase - By Closing Stock - To Other Expenses 87,500To Gross Profit -
------------ ---------- - ------------- -----------
To Office and other Expenses 3,70,000 By Gross Profit -To Interest on Debentures 30,000 By Commission 50,000To Provision for Taxation -To Net Profit for the year -
------------ ---------- - ------------- ----------
To Proposed Dividends - By Balance b/d 70,000To Transfer to General Reserves - By Net Profit forTo Balance transferred to B. S. - the year -
------------ ----------- - ------------- -----------
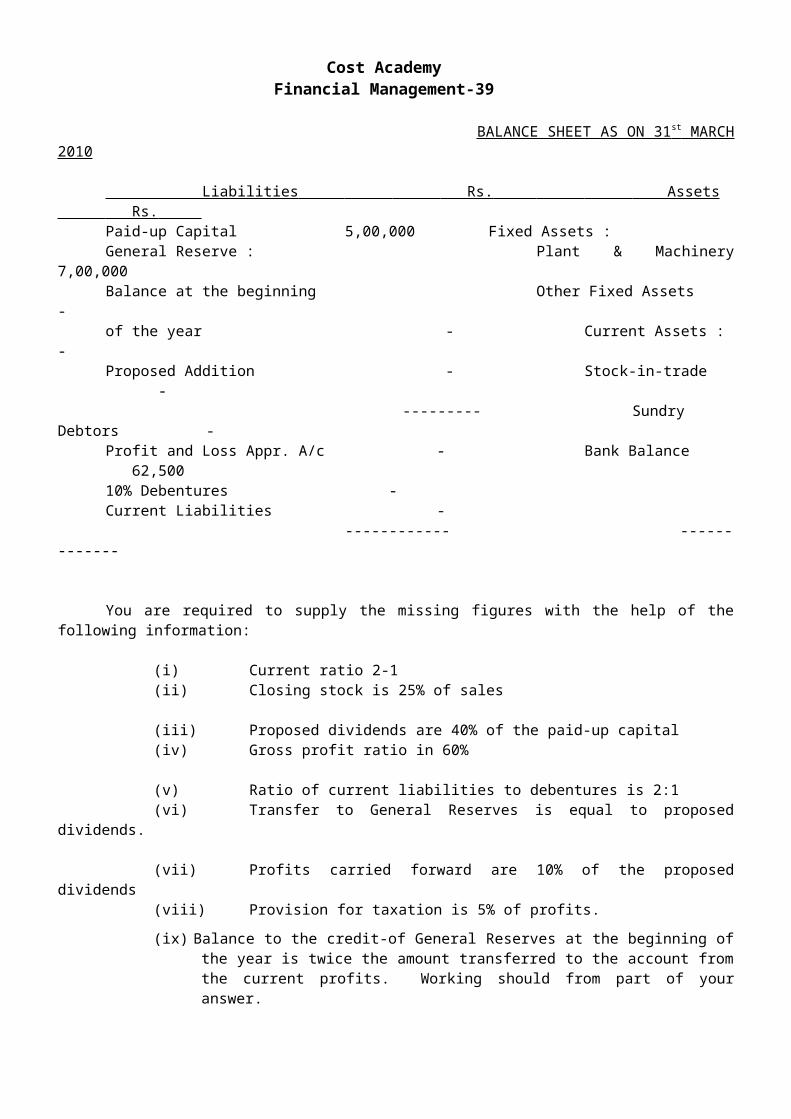
BALANCE SHEET AS ON 31 st MARCH 2010

Cost Academy Financial Management-27
Liabilities Rs. Assets Rs. Paid-up Capital 5,00,000 Fixed Assets :General Reserve : Plant & Machinery 7,00,000Balance at the beginning Other Fixed Assets -of the year - Current Assets : -Proposed Addition - Stock-in-trade -
--------- Sundry Debtors -Profit and Loss Appr. A/c - Bank Balance 62,50010% Debentures -Current Liabilities -
------------ -------------
You are required to supply the missing figures with the help of the following information:
(i) Current ratio 2-1(ii) Closing stock is 25% of sales
(iii) Proposed dividends are 40% of the paid-up capital(iv) Gross profit ratio in 60%
(v) Ratio of current liabilities to debentures is 2:1(vi) Transfer to General Reserves is equal to proposed dividends.
(vii) Profits carried forward are 10% of the proposed dividends(viii) Provision for taxation is 5% of profits.
(ix) Balance to the credit-of General Reserves at the beginning of the year is twice the amount transferred to the account from the current profits. Working should from part of your answer.
11. The Balance Sheet of X Ltd. As on 31st March 2010 is as follows:
Liabilities Rs. (‘000) Assets Rs.(‘000) Equity Share Capital 6,000 Fixed Assets (at cost) 16,2508% Preference Share capital 3,250 Less: Depre. Written off __5,200 11,050Reserve & Surplus 1,400 Stock 1,95010% Debentures 1,950 Sundry Debtors 2,600Sundry Creditors __3,250 Cash ___250
15,850 15,850
The following additional information is available:(i) The stock turnover ratio based on cost of goods sold would be 6 times.(ii) The cost of fixed assets to sales ratio would be 1.4.
(iii) Fixed assets costing Rs. 30,00,000 to be installed on 1st April 2010, payment would be made on March 31, 2011.
(iv) In March 2011, a dividend of 7% on equity capital would be paid.
(v) Rs. 5,50,000, 11% Debentures would be issued on 1st April, 2010.(vi) Rs. 30,00,000, Equity shares would be issued on 31st March 2011.
(vii) Creditors would be 25% of materials consumed.(viii) Debtors would be 10% of sales.

Cost Academy Financial Management-28
(xi) The cost of goods sold would be 90% of sales include material 40% and depreciation 5% of sales.
(x) The profit is subject to debenture interest and taxation @ 30%.
Required:i) Prepare the projected Balance Sheet as on 31st March 2011.ii) Prepare projected Cash Flow Statement in accordance with AS-3.
Fund & Cash flow 1. Distinguish between Cash Flow and Fund Flow statement (Nov.’02:Q-8b)
Answer: The points of distinction between cash flow and funds flow statement are as below:
Cash flow statement Funds flow statementIt ascertains the changes in balance of It ascertains the changes in financial positioncash in hand and bank. between two accounting periodsIt analyses the reasons for changes in It analyses the reasons for change in financial.Balance of cash in hand and bank position between two balance sheetsIt shows the inflows and outflows of cash. It reveals the sources and application of finds.It is an important tool for short-term analysis. It helps to test whether working capital has
been effectively used or not.The two significant areas of analysis arecash generating efficiency and free cash flow
NOTE: 1 M/S ----------- & CO. Ltd. Funds Flow Statement For the year ended.. Sources Amount (Rs.) Applications Amount (Rs.) 1. Trading Profit or funds from operation x 1. Trading Loss/Funds depleted by open. x2. Issue of Share Capital(including premium) x 2. Redemption of preference shares x3. Long--term loan(issue during the year) x 3. Repayment of loan x4. Sale of fixed assets, investments etc. x 4. Acquisition of F. assets, inv. etc. x5. Non--Trading income, e.g. dividend x 5. Non-trading Exps. (div. paid, tax) x6. Decrease in Working Capital x 6. Increase in Working Capital x -- -
NOTE : 2 Statement showing Increase/Decrease in Working Capital during year 2
Particulars Year-1 Amount (Rs.) Year-2 Amount (Rs.) Current Assets:
Stock x xSundry Debtors x xBills Receivable x xAdvances (Dr.) x xCash & Bank x xPrepaid Expenses x xTotal (A) xx xx

Cost Academy Financial Management-29
Current Liabilities:Sundry Creditors x xBills Payable x xAdvances (Cr.) x xOutstanding Expenses x xCurrent Provisions x x
(if not treated as appropriations)Bank Overdraft x x Total (B) xx xx Working Capital (A--B) xx xxIncrease /Decrease in working capital xx 1: Provision for tax, bad debt, and depreciation: If there is no adjustments, show it in the
above statement. In case of adjustments, prepare separate account for it.2: Proposed dividend: If there is no adjustment, pay last year proposed dividend & provide the
current year dividend. In case of adjustments given in the problems, show separate account for it.
3: When accumulated depreciation given in the problem, prepare asset accounts at cost. NOTE: 3 General Statement of Profit to identify the position of Fund From Operation
Rs. Rs.Net Sales xx Less: 1. Direct Expenses xx 2. Overhead excluding depreciation xx3. Other trading expenses (Ref. NOTE 5) xx
xx * Trading Profit or Fund from Operation xxLess: Non trading Expenses
1. Depreciation xx 2. Loss on Sale of Fixed Assets & Investment xx 3. G/W Written off xx 4. Preliminary Expense Written off xx 5. Patent “ xx 6. Ad. Suspense “ xx 7.Disc. on issue of share & debenture written off xx
xxAdd: Non trading Income xx
1. Dividend Received xx 2. Profit on Sale of Fixed Assets & Investment xx 3. Tax refund (not income tax) xx
xx
PROFIT BEFORE TAX (PBT) XX Less: PROVISION FOR TAX xx
PROFIT AFTER TAX (PAT) xx Add: Profit b/ f from previous year xx Less:1. Transfer to Reserves xx
2. Dividend Paid xx 3. Amount Provided on Bonus issue or Redemption of Pref. Share xx xx
Add : Income Tax refund ×× Profit C/F (Current year P/L A/c balance as in Balance Sheet ) ××
NOTE : 4
Cost Academy Financial Management-30
Adjusted Profit and Loss Account To Depreciation xx By Balance b/d(as per p/l a/c) xxTo Write Offs: By Profits on Sale of fixed assets,
Goodwill investments etc. xx Preliminary exp.Adv. Suspense etc. xx
To loss on Sale of fixed assets, inv, xx By Dividend (received) xxTo Premium on Redemption of Debentures xx By Trading Profit xxTo Debenture Discount A/c xx balancing figureTo Reserve for Contingencies(transfer) xxTo General Reserve (transfer xxTo Provision for tax (if any) xxTo Proposed dividend (if any) xxTo Interim Dividend xxTo Balance C/d (as per P/L a/c) xx ___ xx xx
NOTE: 5: CALCULATION OF CASH FROM OPERATION
S tatement showing how Cash Trading Profit is to be arrived at is given below:
Rs. Rs.Funds from Operations or Trading Profit (on operation) xx
Add:(a) Decrease in Current Assets (other than Cash and Bank balances) xx(b) Increase in Current Liabilities xx xx
Less:(a) Increase in Current Assets (other than Cash and Bank balances) xx(b) Decrease in Current Liabilities xx xxCash Trading Profits (or Cash from Operation) XX
___________________________________________________________________________________
Note: 6

Cost Academy Financial Management-31
Direct Method Cash Flow Statement (Paragraph 18a)
Cash Flows from operating activitiesCash receipt from customers Cash paid to suppliers and employees Cash generated from operations Interest paid Income taxes paid Cash flow before extraordinary item
Proceeds from earthquake disaster settlement ___(a)Net cash from operating activities
Cash flows from investing activities.Acquisition of subsidiary X, net of cash acquired Purchase of property, plant and equipment Proceeds from sale of equipment Interest received Dividend received (b)Net cash used in investing activities
Cash flows from financing activitiesProceeds from issuance of share capital Proceeds from long-term borrowings Payment of finance lease liabilities Dividends paid * ©Net cash used in financing activities x
Net increase in cash and cash equivalents [ (a)+(b)+(c)]
(+)Cash and cash equivalents at beginning of period
Cash and cash equivalents at end of period * This could also be shown as an operating cash flow.
Note: 7

Cost Academy Financial Management-32
Indirect Method Cash Flow Statement (Paragraph 18b)
Cash flows from operating activitiesNet profit before taxation, and extraordinary item(PBT) Adjustments for :Depreciation Foreign exchange loss Investment income Interest expense Operating profit before working capital changes
Increase in trade and other receivables
Decrease in inventories/Debtors Decrease in trade payables
Cash generated from operations Interest paid Income taxes paid Cash flow before extraordinary item Proceeds from earthquake disaster settlement
Net cash from operating activities
Cash flows from investing activitiesAcquisition of subsidiary X net of cash acquired
Purchase of property, plant and equipment Proceeds from sales of equipment
Interest received Dividend received Net cash used in investing activities
Cash flows from financing activities Proceeds from issuance of share capital
Payment of finance lease liabilities Dividends paid *(it can be shown above) Net cash used in financing activities Net increase in cash and cash equivalents
Cash and cash equivalents at beginning of period
Cash and cash equivalents at end of period
Problems:

Cost Academy Financial Management-33
1. CKC Ltd. have Balance sheets at 31st March, 2007 and 2008 as follows:2007 2008 2007 2008
Rs. Rs. Rs. Rs.
Share capital 5,000 10,000 Fixed Assets - (Rs. 10 shares) Cost 20,000 39,800Share Premium -- 15,000 Depreciation 7,700 11,000Revenue reserves 22,000 31,500 --------- --------15% Loan -- 10,000 12,300 28,800Creditors 8,000 9,000 Investment -- 10,000Overdraft 2,500 -- Stock 16,000 23,000
Debtors 9,200 10,200 Bank -- 3,500
37,500 75,500 37,500 75,500
(a) The profit for 2008 was Rs. 15,000 and an interim dividend of Rs. 5,500 was paid. There will be no final dividend and you can ignore taxation.
(b) Fixed assets which had cost Rs. 5,000 and which had been depreciated by Rs. 2,000 were sold for Rs. 2,700.
(c) Loan was taken on 01/10/07. Interest paid.
You are required to prepare a source and application of funds statement for 2008 & Cash Flow Statement (indirect method)
2. The summarised balance sheets at the end of the last two completed financial years of NPC Ltd. are as follows :
Balance Sheets as at March , 31st …….2007 2008 2007 2008
Rs. Rs. Rs. Rs.
Issued capital 7,00,000 8,10,000 Land and buildings 3,32,000 3,20,600General reserve 1,12,000 1,12,000 Machinery and plant 3,45,000 4,36,000Profit and loss a/c 18,500 18,500 Stock in hand 79,800 1,01,260Net profit for year -- 91,500 Work-in-progress 1,30,000 1,30,400Proposed dividend 70,000 -- Debtors 1,67,200 2,31,54014% Debentures 1,00,000 75,000 Cash at bank 85,000 --Creditors 1,38,500 2,05,000Bank Overdraft -- 7,800 11,39,000 12,09,800 11,39,000 12,09,800
The cost price of the fixed assets at the balance sheet dates was as follows :2007 2008
Land and buildings : Rs. 3,60,000 Rs. 3,80,000Machinery and plant : Rs. 3,83,000 Rs. 5,23,000
A building costs Rs. 80,000, (book value of Rs. 72,000) was sold for Rs. 42,800. There was a Rs. 10,000 issue of equity shares. A dividend of 12.5 % is proposed for the year ended 31.03.2008. Debenture were redeemed on 30/09/06. Tax paid Rs. 34,000.
Compile a source and application of funds statement for the year ended 31st March, 2008.
3. From the following Balance Sheets of Joymatara Ltd., make out Fund Flow Statement:
Cost Academy Financial Management-34
Balance Sheet as on 2007 & 2008 Rs. Rs. Rs. Rs. Equity Share Cap. 40,000 60,000 Goodwill 10,000 8,0007% Redeemable Land and Buildings 20,000 15,000Preference Shares 20,000 10,000 Plant 18,000 38,200General Reserve 4,000 6,000 Trade Investments 2,000 7,000Capital Reserve -- 5,000 Stock 17,000 15,600Profit and Loss A/c 3,600 5,400 Sundry Debtors 12,000 18,000Proposed Dividend 5,600 7,800 Bills Receivable 3,000 3,600Sundry Creditors 5,000 9,400 Cash in hand
& at bank 3,400 5,600Bills Payable 2,000 1,200 Preliminary Exp. 2,000 1,400Liabilities for Exp. 1,600 1,200 Prov. for Taxation 5600 6400
87,400 1,12,400 87,400 1,12,400 Information:(1) In 2008 Rs. 3,600 depreciation has been written off plant. No depreciation has been charged
on land and building.
(2) A piece of land has been sold out and the balance has been revalued; the profits on revaluation & sale has been transferred to Capital Reserve. There is no other capital profit.
(3) A plant has been sold for Rs. 2,400 (W.D.V -- Rs. 3,000)(4) Rs. 400 dividend has been received and credited to Profit and Loss A/c.
(5) An interim dividend of Rs. 2,000 has been paid during 2008. (6) Pref. Shares were redempt on 31st September ‘08 with proportionate dividend.
4. Balance sheets of RST Ltd. As on March 31, 2008 and March 31, 2009 are as under:
Liabilities 31.03.08 31.03.09 Assets 31.03.08 31.03.09 Rs. Rs. Rs. Rs.Equity share Capital (Rs. 10 face value per share) 10,00,000 12,00,000 Land & Building 6,00,000 7,00,000
General Reserve 3,50,000 2,00,000 Plant & Machinery 9,00,000 11,00,000
9% Preference Investment (long term) 2,50,000 2,50,000share capital 3,00,000 5,00,000 Stock 3,60,000 3,50,000
Share premium A/c 25,000 4,000 Debtors 3,00,000 3,90,000
Profit & Loss A/c 2,00,000 3,00,000 Cash & Bank 1,00,000 95,000
8% Debenture 3,00,000 1,00,000 Prepaid expenses 15,000 20,000
Creditors 2,05,000 3,00,000 Advanced tax payment 80,000 1,05,000
Bills payable 45,000 81,000 Preliminary Expenses 40,000 35,000
Provision for tax 70,000 1,00,000
Proposed dividend 1,50,000 2,60,000________ ________ ________ _________26,45,000 30,45,000 26,45,000 30,45,000
Additional information:
Cost Academy Financial Management-35
(i) Depreciation charged on building and plant and machinery during the year 2008-09 were Rs. 50,000 and Rs. 1,20,000 respectively.
(ii) During the year an old machinery costing Rs. 1,50,000 was sold for Rs. 32,000. its written down value was Rs. 40,000 on date of sale.
(iii) During the year, income tax for the year 2007-08 was assessed at Rs. 76,000. A cheque of Rs. 4,000 was received along with the assessment order towards refund of income tax paid in excess, by way of advance tax in earlier years.
(iv) Proposed dividend for 2007-08 was paid during the year 2008-09.
(v) 9% Preference shares of Rs. 3,00,000, which were due for redemption, were redeemed during the year 2008-0 at a premium of 5%, out of the proceeds of fresh issue of 9% Preference shares.
(vi) Bonus shares were issued to the existing equity shareholders at the rate of one share for every five shares held on 31.03.2008 out of general reserves.
(iii) Debentures were redeemed at the beginning of the year at a premium of 3%.(iv) Interim dividend paid during the year 2008-09 was Rs. 50,000.
Required:(a) Schedule of changes in Working Capital; and(b) Fund Flow statement for the year ended March 31, 2009.
5. A company finds on 1st January, 2008, that it is short of funds with which to implement its programme of expansion. On 1st January 2008 it had a credit balance of Rs. 1,80,000. From the following information prepare a statement for the Board of Directors to show how the overdraft of Rs. 68,750 as at 31st December, 2007 has arisen.
Figures as per Balance Sheet as at 31 st December
2007 (Rs.) 2008 (Rs.)Fixed assets 7,50,000 11,20,000Stock and stores 1,90,000 3,30,000
Debtors 3,80,000 3,35,000Bank balance 1,80,000 (Dr) 68,750 (O/D)
Trade creditors 2,70,000 3,50,000Share capital (in shares of Rs. 10 each) 2,50,000 3,00,000Bills receivable 87,500 95,000
The profit for the year ended 31st December, 2007 before charging depreciation and taxation amounted to Rs. 2,40,000. The 5,000 shares were issued on 1st January, 2008 at a premium of Rs. 5 per share. Dividend was paid during the year as follows :
For 2007 on the capital on 31-12-07 at 10% & for 2007 (interim) 5%. Rs. 1,31,250 was paid in March 2008 by way of income tax.

Cost Academy Financial Management-36
6. XYZ Ltd. Company’s Comparative Balance Sheet for 2007 and the Company’s Income Statement for the year follow:
XYZ Ltd.Comparative Balance Sheet
December 31st , 2007 and 2008 (Rs. in crores) 2007 2006
Sources of funds: Shareholder’s funds
Share Capital 140 140Retained earnings 110 250 92 232Loan funds Bonus payable 135 40
385 272
Application of fundsFixed AssetsPlant and Equipment 430 309Less accumulated depn (218) 212 (194) 115Investments 60 75Current Assets
Inventory 205 160Accounts receivable 180 270Pre-paid expenses 17 20Cash 26 428 10 460
Less: current liabilities and provisionsAccounts payable 230 310Accrued liabilities 70 60Deferred income-tax pron. 15 315 113 8 378 82 385 272
Income Statement for the year ended December 31 st , 2008 (Rs. in crores)
Sales 1,000Less cost of goods sold 530Gross margin 470Less operating expenses 352Net operating income 118Non-operating items: Loss on sale of equipment (4)Income before taxes 114Less income-taxes 48
Net income 66
Additional information:(i) Dividends of Rs.48 crores were paid in 2008.
(ii) The loss on sale of equipment of Rs.4 crore reflects a transaction in which equipment with an original cost of Rs.12 crore and accumulated depreciation of Rs.5 crore were sold foe Rs.3 crore in cash.
Using the indirect method, determine the net cash provided by operating activities for 2008 and construct a statement of cash flows.

Cost Academy Financial Management-37
7. The Balance Sheets of a Company as on 31st March, 2008 and 2009 are given below:
Liabilities 31.3.08 31.3.09 Assets 31.3.08 31.3.09Rs. Rs. Rs. Rs.
Equity share capital 14,40,000 19,20,000 Fixed assets 38,40,000 45,60,000Capital reserve - 48,000 Less: depreciation 11,04,000 13,92,000General reserve 8,16,000 9,60,000 27,36,000 31,68,000
Profit & Loss A/c 2,88,000 3,60,000 Investment 4,80,000 3,84,0009% debentures 9,60,000 6,72,000 Sundry debtors 12,00,000 14,00,000Sundry creditors 5,50,000 5,90,000 Stock 1,40,000 1,84,000Bills payables 26,000 34,000 Cash in hand 4,000 -Proposed dividend 1,44,000 1,72,800 Preliminary
Expenses 96,000 48,000Provision for tax 4,32,000 4,08,000Unpaid dividend - 19,200
46,56,000 51,84,000 46,56,000 51,84,000
Additional information:During the year ended 31st March, 2009 the company:
(i) Sold a machine for Rs.1,20,000; the cost of machine was Rs. 2,40,000 and depreciation provided on it was Rs. 84,000.
(ii) Provided Rs. 4,20,000 as depreciation on fixed assets.(iii) Sold some investment and profit credited to capital reserve.(iv) Redeemed 30% of the debentures @ 105.
(v) Decided to write off fixed assets costing Rs. 60,000 on which depreciation amounting to Rs. 48,000 has been provided.
You are required to prepare Cash Flow Statement as per AS 3.

Cost Academy Financial Management-38
Cost of Capital and Capital Structure Capital of a company consists of: 1. Equity share capital + reserves & surpluses
2. Preference share capital3. Loan capital i.e. Debenture & Bond.
To decide about the best capital structure the following 2 points are consider
1. Higher amount of profit for Shareholders, &
2. Higher Earning Per Share (EPS) = Profits available to equity. Share holders ÷ number of equity shares = [ (PBIT - I ) (1-t) – Pref. Dividend] ÷ No. of Equity Share.
At point of Indifference: (EPS)1 = (EPS ) 2
Financial BEP = Required PBIT to pay the fixed charges on capital.
Calculation of costs for each ElementsCosts of Capitals are of two types 1. One Time Cost Or Flotation Cost
2. Annual Costs e.g. Interest, Div.
Cost of Debt Capital (Cd)
a. When date of redemption is not given in the problem. Cost of Debt. (after tax ) or Cd = ( 1- t ) x I i = Effective rate of Interest,
t = Tax rate. Effective rate of interest = Interest amount p.a.÷ Net Proceeds × 100
Net proceeds = Face value - discount + premium -flotation cost.
b. Cost of redeemable debt i.e. date of redemption is given : i. When Redemption is made at the end of its life or project.
Cost of debt (after tax) = Cd = I x ( 1-t) + ( RV - NP ) ÷ n (RV + NP) 2
Where, I = Fixed Interest charges p.a. or interest per debenture. RV = Redeemable value i.e. face value + premium NP = Net proceeds or Cash Inflow. n = Life of the debt.
ii. With DCFPresent purchase price on open market operation= ∑ cost save x discounting factor
iii. When redeemed during its life:
Apply the principle of EXPLICIT COST i.e. the rate of return at which the initial cash inflow equates the discounted future cash outflows . This method is opposite to I.R.R.
Cost Academy Financial Management-39
Cost of Preference Share Capital (Cp )
a. Cost of irredeemable preference Share .
Cp = Preference Dividend ÷ Net Proceeds (NP) or Market Value (MP)
b. Cost of redeemable preference Share
i. Redemption at the end
Cp = D + ( RV - NP ) ÷ n (RV + NP) 2
ii. Pref. share Redeemed intermittently -- Apply Explicit Cost principle as before.
Cost of Equity Share Capital (Ce)
a. Dividend Price Approach ( D/P )Ce = Dividend ÷ Net Proceeds or Market value 100
b. Dividend Price Approach ( D/P ) with growth model Ce = Dividend ÷ Net Proceeds or Market value 100 + g
Where, g = growth rate or expected growth in dividend from coming year.
c. Earning/ Price Approach ( E / P ): Ce = Current Earning per Share ÷ Current Market Price per share 100
d. Earning/ Price Approach ( E / P ) with growth model: Ce = Current Earning per Share ÷ Current Market Price per share 100 + g
e. Realised yield Approach (Apply MIRR) :- It is that rate of return where investor’s initial investment = Total discounted cash Inflow in form of dividend and sales realisation at the end of the period.
Estimating growth rate (g )
1. Dn = Do (1+ g)n ; Dn = Div per share in current year;N = no of yearsDo = Div per share in first year;G = Growth rate
2. GORDON’S MODEL: g = br. g = growth rate;b = constant proportion of net profit retained each year; r = average return of the firm .
b = (Net profit - dividends) ÷ Net profit r = Net profits ÷ Book value of capital employed
THIS METHOD IS ONLY APPLICABLE Net profit TO FIRMS WHICH HAVE ALL EQUITY CAPITAL STRUCTURE (un-levered)

Cost Academy Financial Management-40
Cost of Retained Earnings ( Cr )
Cr = Ce (1- b) (1 - t)
Whereb = rate of brokerage;t = marginal tax rate applicable to share holder.
If rate brokerage is not given, Cr = Ce
Overall Cost of Capital or Weighted Average of Capital
Cost of Cap. or cut off rate ( Cw or Co ) = Capital mix ratio x cost of each ingredients
Alternatively, Cw or Co = Total cost ÷ total capital x 100
MIX are taken on 4 different 1. Book value Basis 3. Marginal Basis 2. Market value Basis 4. Expected Cap. Structure basis
Market Value Of The Firm1. Traditional Approach
Value of the firm = interest Cd + Dividend Ce as there is no tax.2. Net Income Approach :
Value = { ( EBIT - I ) ( 1-t ) } market Capitalisation rate + value of debt
3. Net Operating Income Approach :Value of equity = {(EBIT market Capitalisation rate) - value of debt} (1- t)Value of Firm = Value of Equity + Value of Debt
4. MODIGLIANI MILLER APPROACH: In case of un-lever firm & No Tax a. Value of the firm = EBIT (1 t ) Ce
Assumptions of Modigliani- Miller Theory
a) Capital markets are perfect. All information is freely available and there is no transaction cost.
b) All investors are rational.c) No existence of corporate taxes.d) Firms can be grouped into “Equivalent risk classes” on the basis of their business risk.
Rules of CAPM : E ( Rp ) = Rf + p [E ( Rm ) - Rf ]
Where,E (Rp) = Expected return of the portfolioRf = Risk free rate of Returnp = Portfolio Beta i.e. market sensitivity index
= change in expected rate of return change in market rate of returnE(Rm) = Expected Return on market portfolio
[E (Rm) – Rf] = Market risk premium.

Cost Academy Financial Management-41
Portfolio Beta (p) = (Rsm) (S.D. s ) S.D.m
Where,Rsm = Correlation Coefficient with market.S.D.s = Standard deviation of an asset .S.D.m = Market Standard deviation.E(Rm) = ( DIV + Cap. Gain ) Total Investment
Capital Gain = Market Value - Value of Original Investment .
Weighted average β =∑weight x individual β
Theory:
1. Advantages of Raising Funds by Issue of Equity Shares
(i) It is a permanent source of finance. Since such shares are not redeemable, the company has no liability for cash outflows associated with its redemption.
(ii) Equity capital increases the company’s financial base and thus helps further the borrowing powers of the company.
(iii) The company is not obliged legally to pay dividends. Hence in times of uncertainties or when the company is not performing well, dividend payments can be reduced or even suspended.
(iv) The company can make further issue of share capital by making a right issue.
2. Advantages of Issue of Preference Shares are: (i) No dilution in EPS on enlarged capital base.(ii) There is no risk of takeover as the preference shareholders do not have voting rights.
(i) There is leveraging advantage as it bears a fixed charge.
(iv) The preference dividends are fixed and pre-decided. Preference shareholders do not participate in surplus profit as the ordinary shareholders
(ii) Preference capital can be redeemed after a specified period.
3. The term trading on equity means debts are contracted and loans are raised mainly on the basis of equity capital. Those who provide debt have a limited share in the firm’s earning and hence want to be protected in terms of earnings and values represented by equity capital. Since fixed charges do not vary with firms earning before interest and tax, a magnified effect is produced on earning per share. Whether the leverage is favourable, in the sense, increase in earning per share more proportionately to the increased earning before interest and tax, depends on the profitability of investment proposal. If the rate of returns on investment exceeds their explicit cost, financial leverage is said to be positive.
4. Assumptions of Modigliani and Miller.
Assumptions of Modigliani and Miller approach to cost of capital are as follows:
(i) The capital markets are assumed to be perfect. This means that investors are free to buy and sell securities and are well informed about the risk and return involved in them
(ii) The firms can be classified into’ homogeneous risk class’.

Cost Academy Financial Management-42
(iii) All investors have the same expectations from a firm’s net operating income (EBIT) which is necessary to evaluate the value of a firm.
(iv) The dividend payment ratio is 100% i.e. there are no retained earnings.5. Optimum Capital Structure: The optimum capital structure is that capital structure or
combination of debt and equity that leads to the maximisation of the value of the firm. The capital structure decision is important to the firm as the optimum capital structure minimises the firm’s overall cost of capital and maximises the value of the firm. The use of debt funds in capital structure increases the earnings per share as the interest on debt is tax deductible, which leads to increase in share price. But higher levels of debt funds in capital structure result in greater financial risk and it leads to higher cost of capital and depresses the market price of company’s share. Therefore, the firm should try to achieve and maintain the optimum capital structure keeping in view value maximisation objective of the firm.
Problems on Selection of best capital structure
1. X Ltd., a widely held company is considering a major expansion of its production facilities and the following alternatives are available:
Alternatives (Rs. In lakhs) A B C
Shares Capital 50 20 1014% Debentures -- 20 15Loan from a Financial Institution@ 18% p.a. Rate of Interest -- 10 25
Expected rate of return before tax is 25%. The rate of dividend of the company is not less than 20%. The company at present has low debt. Corporate taxation 35%. Which of the alternatives you would choose?
2. EXE Limited is considering three financing plans. The key information is as follows:- Total investment to be raised Rs. 2,00,000.
Plans of Financing Proportion Plans Equity Debt Preference Shares A 100% - - B 50% 50% - C 50% - 50%
Cost of debt 8%Cost of preference shares 8%
Tax rate 35%
Equity shares of the face value of Rs. 10 each will be issued at a premium of Rs. 10 per share.Expected PBIT is Rs. 80,000.
Determine for each plan:-
1) Earnings per share (EPS); and 2) The financial break even point. 3) Indicate if any of the plans dominate and compute the PBIT range among the plans for indifference.
3. A B Limited provides you with following figures:- Profit Rs. 3,00,000 Less Interest on Debentures @ 12% 60,000 2,40,000 Income tax @ 50% 1,20,000 1,20,000

Cost Academy Financial Management-43
Number of Equity Shares (Rs. 10 each 40,000 E.P.S (Earning Per Share) 3 Rulings price in market 30 PE ratio (Price/EPS) 10
The company has undistributed reserves of Rs. 6 lakhs. The company needs Rs. 20 lakhs for expansion. This amount will earn at the same rate as funds already employed. You are informed that a debt equity ratio (Debt/Debt +Equity) higher than 35% will push the P/E ratio down to 8 and raise the interest rate on additional amount borrowed to 14%. You are required to ascertain the probable price of the share
(1) If the additional funds are raised as debt; and; (2) If the amt is raised by issuing equity shares.
4. Aries Limited wishes to raise additional Finance of Rs. 10 lakhs for meeting its investment plans. It has Rs. 2,10,000 in the from of retained earnings available for investment purposes. The following are the further details:
1) Debt/equity mix 30%: 70% 2) Cost of debt Up to Rs. 1,80,000 10% (before tax) Beyond Rs. 1,80,000 16% (before tax)
3) Earnings per share Rs.4 4) Dividend pay out 50% of earnings 5) Expected growth rate in dividend 10% 6) Current market price per share Rs. 44 7) Tax rate 35%
You are required: a) To determine the pattern for raising the additional finance. b) To determine the post-tax average cost of additional debt. c) To determine to cost of retained earnings and cost of equity, and d) Compute the overall weighted average after tax cost of additional Finance.
5. A co. needs Rs. 31,25,000 for the construction of new plant. The following 3 plans are feasible:(i) The company may issue 3,12,500 equity shares at Rs. 10 per share.
(ii) The company may issue 1,56,250 ordinary equity shares at Rs. 10 per share and 15,625 debentures of Rs. 100 denomination bearing a 8% rate of interest.
(iii) The company may issue 1,56,250 equity shares at Rs. 10 per share and 15,625 preference shares at Rs. 100 per share bearing a 8% rate of dividend.
If the Co.’s earnings before interest & taxes are Rs. 62,500, Rs.1,25,000, Rs. 2,50,000, Rs. 3,75,000 and Rs. 6,25,000, what are the earnings per share under each of three financial plans? Assume a Corporate Income-tax rate of 40%.
Computation of cost of capital elements
6. Y Ltd. retains Rs. 7,50,000 out of its current earnings. The expected rate of return to the shareholders, if they had invested the funds elsewhere is 10%. The brokerage is 3% and the shareholders come in 30% tax bracket. Calculate the cost of retained earnings. 11/09/5
7. The capital structure of Swan & Co. comprising of 12% debentures, 9% preference shares and equity shares of Rs.100 each is in the proportion of 3: 2: 5.
The company is contemplating to introduce further capital to meet the expansion needs by seeking 14% term loan from financial institutions. As a result of this proposal, the proportions of debentures, preference shares and equity would get reduced by 1/10. 1/15 and 1/6 respectively.
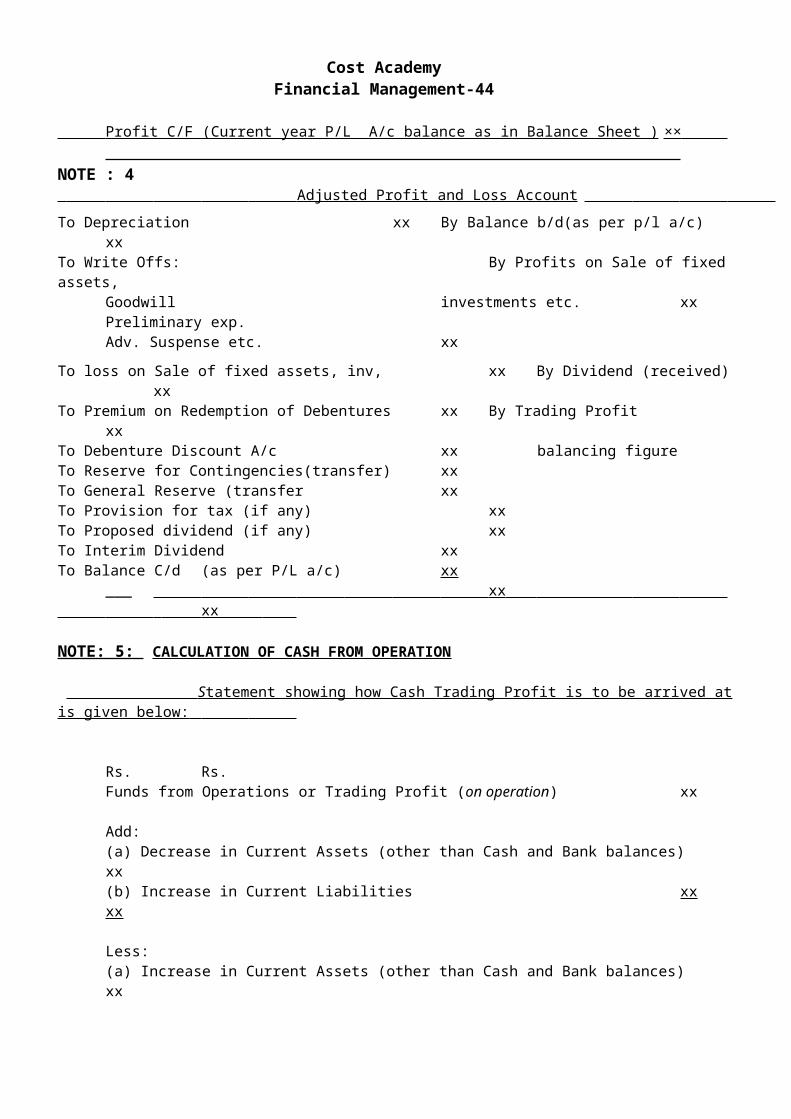
Cost Academy Financial Management-44
In the light of above proposal calculate the impact on weighted average cost of capital assuming 35% tax rate, expected dividend of Rs. 9 per share at the end of the year and growth rate of dividends 5% No change in the dividend, growth rate and market price of share is expected after availing the proposed term loan.
8. The following items have been extracted from the of the Balance Sheet of XYZ Company as at 31st March, 2010:-
Paid up Capital: Rs. 4,00,000 Equity Shares of Rs. 10 each 40,00,000 Reserves and Surplus 60,00,000Loans: 15% Non convertible Debentures 20,00,000 14% Institutional Loans 60,00,000
Other information about the company as relevant is given below:
Year ended Dividend Earning Average Market 31st Mar. Per Share Per Share Price per Share Rs. Rs. Rs. 2006 4.00 7.50 50.00 2007 3.00 6.00 40.00 2008 4.00 4.50 30.00
You are required to calculate weighted average cost of capital, using book values as weights and Earning/Price (E/P) ratio as the basis of cost of equity. Tax rate is consider as 35 %. Also calculate weighted Average cost of capital on the basis of the market value.
9. M/s. Albert & Co: has the following capital structure as on 31st December, 2009
10% Debentures Rs. 3,00,0009% Preference shares Rs. 2,00,000Equity-5,000 shares of Rs. 100 each. Rs. 5,00,000Total Rs. 10,00,000
The equity shares of the company are quoted at Rs. 102/- and the company is expected to declare a dividend of Rs. 9 per share for 2007. The company has registered a dividend growth rate of 5% which is expected to be maintained.
i) Assuming the tax rate applicable to the company at 40% calculate the weighted average cost of capital. State your assumptions, if any.
ii) Assuming, in he above exercise, that the company can raise additional term loan at 12% for Rs. 5,00,000 to finance an expansion, calculate the revised weighted cost of capital. The company’s statement is that it will be in a position to increase the dividend from Rs. 9 per share to Rs. 10 per share, but the business risk associated with new financing may bring down the market price from Rs. 102 to Rs. 96 per share.
10. In considering the most desirable capital structure for a company, the following estimates of the cost of debt and equity capital (after tax) have been made at various levels of debt-equity mix:
Debt as percentage of Cost of debt. Cost of equity total capital employed, % %
0 7.0 15.0 10 7.0 15.0 20 7.0 15.5 30 7.5 16.0 40 8.0 17.0

Cost Academy Financial Management-45
50 8.5 19.0 60 9.5 20.0
You are required to determine the optimal debt-equity mix for the company by calculating composite cost of capital.
11. Given below is the summary of the Balance Sheet of a Company as at 31st December,2009:
Liabilities Rs. Assets Rs. Equity Share Capital 20,000 Fixed Assets 4,00,000shares of Rs. 10 each 2,00,000 Investments 50,000Reserves & Surplus 1,30,000 Current Assets 2,00,0008% Debentures Redeemableat par in 2010) 1,70,000Current Liabilities :Short-term loan 1,00,000Trade creditors 50,000
6,50,000 6,50,000
You are required to calculate Company’s weighted average cost of capital using balance sheet valuations. The following additional information are also available:
i) 8% Debentures were issued at par.ii) All interest payments are up-to-date and equity dividend is currently 12%.
iii) Short-term loan carries interest at 18% p.a.iv) The Shares and Debenture of the Co. are all quoted on the Stock Exchange and current
market prices are as: Equity Shares: Rs. 14 each; 8% Debentures: Rs. 98 each v) The rate of tax for the Company may be taken at 35%.
12. A company has the following capital structure. Rs.Ordinary Shares of Rs. 10 each fully paid 40,00,0007.5% cumulative preference shares of Rs.100 each fully paid 2,00,000Reserves and retained profits 45,00,00011% Long Term Loan 6,00,000 Total 93,00,000
In addition, the company has a bank overdraft for working capital and this average to Rs. 10 lakhs. Interest thereon is 15%. You are required to calculate the company’s overall rate of return on capital employed in order to ensure:
i) Payment of all interests ii) Dividend pays out ratio of 60% iii) Payment of preference Dividend iv) Ordinary shareholder’s dividend is 12%. Assume the tax rate to be 35%
13. JKL Ltd. Has the following book- value capital structure as on March 31, 2010. Rs.
Equity share capital (2,00,000 shares) 40,00,00011.5% preference shares 10,00,00010% debentures 30,00,000
80,00,000
The equity share of the company sells for Rs.20. It is expected that the company will pay next year a dividend of Rs.2 per equity share, which is expected to grow at 5% p.a. forever. Assume a 35% corporate tax rate.Required:

Cost Academy Financial Management-46
(i) Compute weighted average cost of capital (WACC) of the company based on the existing capital structure.
(ii) Compute the new WACC, if the company raises an additional Rs.20 lakhs debt by issuing 12% debentures. This would result in increasing the expected equity dividend to Rs.2.40 & leave the growth rate unchanged but the price of equity share will fall to Rs.16 per share.
(iii) Comment on the use of weights in the computation of weighted average cost of capital.14. The R & G Company has following capital structure at 31st March 2008 which is considered to be
optimum:Rs.
13% debenture 3,60,00011% preference share capital 1,20,000Equity share capital (2,00,000 shares) 19,20,000
The company’s share has a current market price of Rs. 27.75 per share. The expected dividend per share in next year is 50% of the 2008 EPS. The EPS of last 10 years is as follows. The past trends are expected to continue:
Year 1998 1999 2000 2001 2002 2003 2004 2005 2006 2007EPS (Rs.) 1.00 1.120 1.254 1.405 1.574 1.762 1.974 2.211 2.476 2.773
The company can issue 14% new debenture. The company’s debenture is currently selling at Rs. 98. The new preference issue can be sold at a net price of Rs. 9.80, paying a dividend of Rs. 1.20 per share. The company’s marginal tax rate is 50%.
(i) Calculate the after tax cost.
(a) of new debts and new preference share capital, (b) of ordinary equity, assuming new equity comes form retained earnings.
(ii) Calculate the marginal cost of capital.
(iii) How much can be spent for capital investment before new ordinary share must be sold?
Assuming that retained earning available for next year’s investment are 50% of 2007 earnings.
(iv) What will be marginal cost of capital (cost of fund raised in excess of the amount calculated in part (iii) if the company can sell new ordinary shares to net Rs. 20 per share? The cost of debt and of preference capital is constant.
15. D Ltd. Is foreseeing a growth rate of 12% per annum is the next two years. The growth rate is likely to be 10% for the third for the third and fourth year. After that the growth rate is expected to stabilize at 8% per annum. If the last dividend was Rs. 1.50 per share and the inventor’s required rate of return is 16% determine the current value of equity share of the company.
The P.V. factors at 16%Year 1 2 3 4P.V. factor 0.862 0.743 0.641 0.552
Computation of value of the firm by MM Model “For un-levered for levered
Vu = VE = Vu + DT
16. There are two firms P and Q which are identical except P does not use any debt in its capital structure while Q has Rs. 8,00,000, 9% debentures in its capital structure. Both the firms have earning before interest and tax of Rs. 2,60,000 p.a. and the capitalization rate is 10%. Assuming the corporate tax of 30%, calculate the value of these firms according to MM Hypothesis.
Computation of value of the share:

Cost Academy Financial Management-47
(a) Po = (D1 + P1 ) ÷ (1 + Ce)
Where, Po = Market price per share of time 0 D1 = Dividend per share at that time. P1 = Market price per share at time 1.Ce = Market capitalisation rate or cost of Equity capital.
(b) In case of new financing: Mp1 = I - (NP - nD1)
Where,m = no. of share to be issued, at time 1.I = new investment. P = Price.NP = Net profit.D1 = Dividend per share at time 1.
17. ABC Ltd. has a capital of Rs. 10 lakhs in equity shares of Rs. 100 each. The shares are currently quoted at par. The company proposes declaration of a dividend of Rs.10 per share at the end of the current financial year. The capitalization rate of the risk class to which the Co belongs is 12%.
What will be the market price of the share at the end of the year if
1) A dividend is not declared?
2) A dividend is declared?
Assuming that the Co. pays the dividend and has net profits of Rs. 5,00,000 & makes new investments of Rs. 10 lakhs during the period, how many new shares must be issued? Use the M.M. model.
Capital Asset Pricing Model (CAPM)
18. From the following information, calculate the expected rate of return of a portfolio:
Risk free rate of interest 12%Expected return of market Portfolio 18%Standard deviation of an asset 2.8%Market Standard deviation 2.3%Co-relation Co-efficient of portfolio with market 0.8%
19. The Beta Coefficient of Target Ltd. is 1.4. The company has been maintaining 8% rate of growth in dividends and earnings. The last dividend paid was Rs.4 per share. Return on Government securities is 10%. Return on market portfolio is 15%. The current market price of one share of Target Ltd. is Rs. 36.
i) What will be the equilibrium price per share of Target Ltd.? ii) Would you advise purchasing the share?
20. As an investment manager you are given the following information:
Investment in equity shares of Initial price Dividends Market price at the end of the year Beta risk factor
, Rs Rs. Rs.

Cost Academy Financial Management-48
A. Cement Ltd. 25 2 50 0.8 Steel Ltd. 35 2 60 0.7 Liquor Ltd. 45 2 135 0.5 B. Government of India Bonds 1,000 140 1,005 0.99
Risk free return may be taken at 14%. You are required to calculate: i. Expected rate of returns of portfolio in each using Capital Asset Pricing Model (CAPM).
ii. Average return of portfolio.
21. ABC Limited has the following book value capital structure:
Equity share capital (150 million shares, Rs. 10 par) Rs. 1,500 millionReserves and surplus Rs. 2,250 million
10.5% Preference Share Capital (1million shares, Rs. 100 par) Rs. 100 million9.5% Debentures (1.5 million debentures, Rs, 1,000 par) Rs. 1,500 million8.5% Term Loans from Financial Institutions Rs. 500 million
The debentures of ABC Limited are redeemable after three years and are quoting at Rs. 981.05 per debenture. The applicable income tax rate for the company is 35%.
The current market price per equity share is Rs. 60. The prevailing default -risk free interest rate on 10– year GOI Treasury Bonds is 5.5%. The average market risk premium is 8%. The beta of the company is 1.1875. The preferred stock of the company is redeemable after 5 years is currently selling at Rs. 98.15 per preference share.
Required:(i) Calculate weighted average cost of capital of the company using market value weights.
(ii) Define the marginal cost of capital schedule for the firm if it raises Rs. 750 million for a new project. The firm plans to have a target debt to value ratio of 20%. The beta of new project is 1.4375. The debt capital will be raised through term loans. It will carry interest rate of 9.5% for the first 100 million and 10% for the next Rs. 50 million.
22. You are analyzing the beta ABC computers Ltd. and have dividend the Company into four board business groups, with market values and betas for each group.
Business group (SBU) Market value of Equity Un leveraged beta
Main frames Rs. 100 billion 1.10Personal Computers Rs. 100 billion 1.50Software Rs. 50 billion 2.00Printers Rs. 150 billion 1.00Debt outstanding Rs. 50 billion --
Required:(i) Estimate the beta for ABC Computers Ltd. as a Company. Is this beta going to be equal
to the beta estimated by regressing past returns on ABC Computers stock against a market index. Why or why not?
(ii) If the treasury bond rate is 7.5%, estimate the cost of equity for ABC computers Ltd. Estimate the cost of equity for each division. Which cost of equity would you use to value the printer division? The average market risk premium is 8.5%.
23. The following summarizes the percentage changes in operating income, percentage changes in revenues, and betas for four pharmaceutical firms.
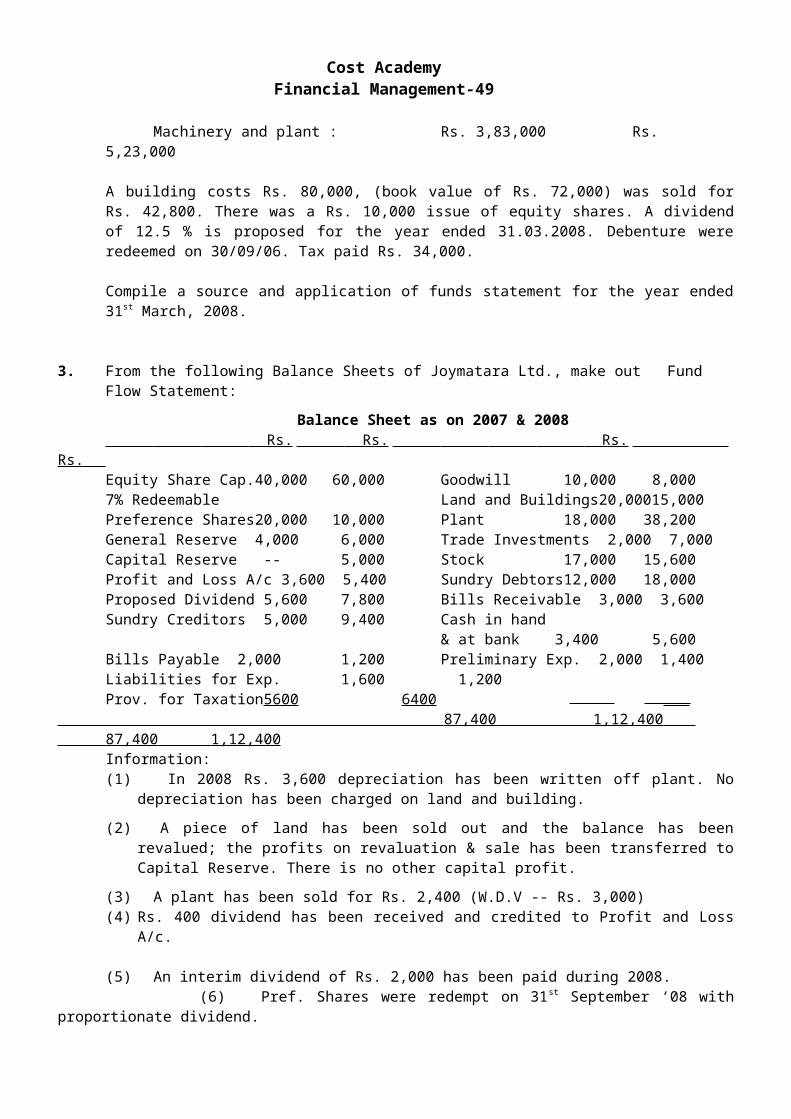
Cost Academy Financial Management-49
Firm Change in Change in Beta Revenue operating income
PQR Ltd. 27% 25% 1.00RST Ltd. 25% 32% 1.15TUV Ltd. 23% 36% 1.30WXY Ltd. 21% 40% 1.40
Required:(i) Calculate the degree of operating leverage for each of these firms. Comment also. (ii) Use the operating leverage to explain why these firms have different beta.
CAPITAL BUDGETING Time value of money means that worth of a rupee received today is different from the worth of a rupee to be received in future. The preference of money now as compared to future money is known as time preference for money.
A rupee today is more valuable than rupee after a year due to several reasons:
Risk there is uncertainty about the receipt of money in future.
Preference for present consumption most of the persons and companies in general, prefer current consumption over future consumption.
Inflation In an inflationary period a rupee today represents a greater real purchasing power than a rupee a year hence.
Investment opportunities Most of the persons and companies have a preference for present money because of availabilities of opportunities of investment for earning additional cash flow.
Many financial problem involve cash flow accruing at different points of time for evaluating such cash flow an explicit consideration of time value of money is required.
Capital budgeting is a complex process which may be divided into the following phases :
Future value of an annuity:An annuity is a series of periodic cash flows (payments or receipts) of equal amount. The premium payments of a life insurance policy, for example are an annuity. In general terms the future value of an annuity is given as:
FVAn = A -----------------Where,
FVAn = Future value of an annuity which has duration of n years.A = Constant periodic flow.r = Interest rate per period.n = Duration of the annuity
Some Important Definitions
1. Cash outflow of Capital nature
2. Cash inflow = Profit After Tax (PAT) + Depreciation.
(1+r)n-1r

Cost Academy Financial Management-50
Calculation of cash inflow Rs.
PBDT × Less: Depreciation ×PBT × Less: Tax @ -- % ×PAT ×Add: Depreciation × Cash Inflow ×
3. Cash inflow at the end of the project: I Working capital recovery 2 Sale of machinery at the end of the project:
Different techniques for Project Appraisal A. Traditional Approach.
B. Time Value of Money Approach (TVM) or (DCF). i.e. Discounting approach
A. Traditional Approach :
1. Pay Back Period: it measures the time required to pay the initial investment back.
(a) When cash inflows are uniform throughout the project life- Pay Back Period = Original Investment ÷ Cash Inflow p.a.
Lower the Pay Back period higher the acceptability. (b) When cash Inflows are not uniform through out the project life:
Apply the method of simple interpolation for pay back period calculation.
REQUIRED TIME - LOWER LIMIT = REQUIRED INVESTMENT - LOWER LIMIT UPPER LIMIT - LOWER LIMIT UPPER LIMIT - LOWER LIMIT
2. Average or Accounting rate of return ( ARR): ARR = Average PAT ÷ Investment or average investment × 100. It should be more than cost of finance.
B. DISCOUNTED CASH FLOW TECHNIQUE :
1. Net Present Value Method :
NPV = Total Disc. Cash Inflow - Total Disc. Cash outflow
2. Internal Rate of Return (IRR): I s that rate at which the sum total of cash inflows after discounting equals to the discounted cash outflows. The internal rate of return of a project is the discount rate, which makes net present value of the project equal to zero.
3. Profitability Index (PI) or Desirability Factor: = Total Disc cash Inflow Total Discounted Cash Outflow
NOTE : In a problems where the results are different following different methods, then select that project according to the following priority list :
(i) Profitability index (ii) NPV (iii) IRR

Cost Academy Financial Management-51
NOTE :- P.I. = DCIF DCOFAgain , NPV = DCIF - DCOF
Or, DCIF = NPV + DCOFOr, NPV = (PI - 1) x DCOF
4. DISCOUNTED PAY BACK = TOTAL DISCOUNTED CASH OUT-FLOW
DISCOUNTED CASH IN-FLOW p.a.
If discounted cash inflows are not uniform, apply method of simple interpolation. 5. Discounted Pay Back Profitability
= DISC. CASH INFLOW AFTER PAY BACK PERIOD = NPV6. Equivalent PV of Annual Cash outflow = total discounted cash out flow total of
discounting factor. Apply this rule when the assets have different life.
1. Internal Rate of Return:
Internal rate of return is that rate at which the sum total of cash inflows after discounting equals to the discounted cash outflows. The internal rate of return of a project is the discount rate which makes net present value of the project equal to zero.
The use of IRR, as a criterion to accept capital investment decision involves a comparison of IRR with the required rate of return known as cut-off-rate. If IRR is greater than cut-off-rate, the project should be accepted. If IRR is less than the cut-offrate, the project is rejected. In case, the IRR is equal to the cut-off-rate, the firm is indifferent.
2. Modified Internal Rate of Return (MIRR ):
There are several limitations attached with the concept of the conventional internal rate of return. The MIRR address some of these deficiencies. For example, it eliminates multiple IRR rates; it addresses the reinvestment rate issue and produces results, which are consistent with the Net present value method.
Under this method, all cash flows, apart from the initial investment, are brought to the terminal value using an appropriate discount rate (usually the cost of capital). This results in a single stream of cash inflow in the terminal year. The MIRR is obtained by assuming a single outflow in the zeroth year and the terminal cash in flow as mentioned above. The discount rate which equates the present value of the terminal cash in flow to the zeroth year outflow is called the MIRR.
3. Multiple Internal Rate of Return (MIRR) In cases where project cash flows change signs or reverse during the life of a project for example, an initial cash outflow is followed by cash inflows and subsequently followed by a major cash outflow, there may be more than one internal rate of return (IRR).
The following graph of discount rate versus net present value (NPV) may be used as an illustration:
NPV
IRR1
IRR2

Cost Academy Financial Management-52
Discount Rates
In such situations if the cost of capital is less than the two IRRs, a decision can be made easily, however, otherwise the IRR decision rule may turn out to be misleading as the project should only be invested if the cost of capital is between IRR1 and IRR2. To understand the concept of multiple IRRs it is necessary to understand the implicit reinvestment assumption in both NPV and IRR techniques.
4. Capital Rationing : Generally, firms fix up maximum amount that can be invested in capital projects during a given period of time, say a year. The firm then attempts to select a combination of investment proposals, that will be within the specific limits providing maximum profitability, and rank them in descending order according to their rate of return, such a situation is of capital rationing.
A firm should accept all investment projects with positive NPV, with an objective to maximize the wealth of shareholders. However, there may be resource constraint due to which a firm may have to select from among various projects. Thus, capital rationing situation may arises when there may be internal or external constraints on procurement of necessary funds to invest in all investment proposals with positive NPVs.
Ways of implementing Capital Rationing:(i) It may be implemented through budgets.
(ii) It can be done by putting up a ceiling when it has been financing investment proposals only by way of retained earnings.
(iii) It can also be done by ‘Responsibility Accounting’, whereby management may authorize a particular department to make investment only up to a specified limit, beyond which the investment decisions are to be taken by higher-ups.
PROBLEMS:
1. A Limited is considering investing in a project requiring a fixed capital outlay of Rs. 2,00,000. Forecasted annual income after depreciation but before tax is as follows:
Year: 1 2 3 4 5Rs. 1,00,000 1,00,000 80,000 80,000 40,000
Depreciation may be taken as 20% on original cost of the asset and taxation at 40% of net income. Working capital to invest at start is Rs. 80,000, it is expected to recover fully at the end of the project.
You are required to evaluate the project according to each of the following methods :(a) Payback method.(b) Rate of return on original investment method.
(c) Rate of return on average investment method.(d) Discounted cash flow method taking cost of capital at 10%
(e) Net present value index method(f) Internal rate of return method.
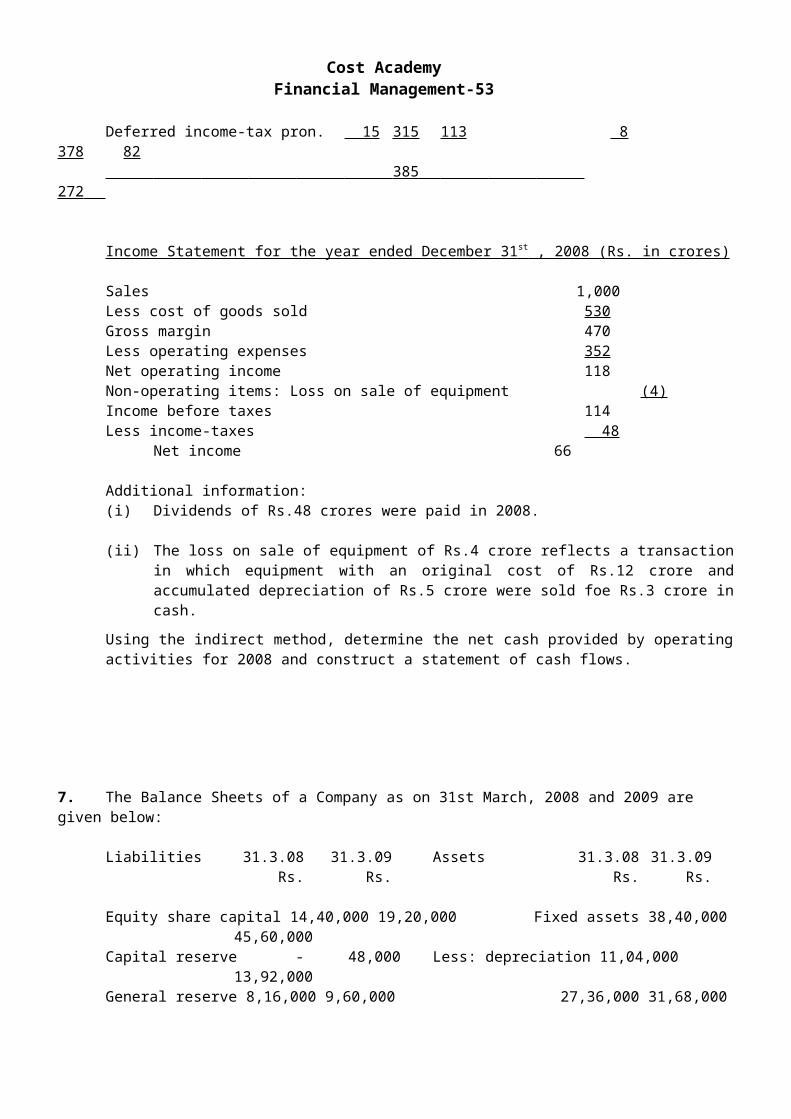
Cost Academy Financial Management-53
2. C Ltd. is considering investing in a project. The expected original investment in the project will be Rs. 2,00,000, the life of project will be 5 year with no salvage value. The expected net cash inflows after depreciation but before tax during the life of the project will be as following:
Year 1 2 3 4 5Rs. 85,000 1,00,000 80,000 80,000 40,000The project will be depreciated at the rate of 20% on original cost. The company is subjected to 30% tax rate.
Required:(i) Calculate pay back period and average rate of return (ARR)(ii) Calculate net present value and net present value index, if cost of capital is 10%.(iii) Calculate internal rate of return.
Note: The PV factors are:Year PV at 10% PV at 37% PV at 38% PV at 40%
12345
0.9090.8260.7510.6830.621
0.7300.5330.3890.2840.207
0.7250.5250.3810.2760.200
0.7140.5100.3640.2600.186
3. A company wants to invest in a machinery that would cost Rs. 50,000 at the beginning of year 1. it is estimated that the net cash inflows from operations will be Rs. 18,000 per annum for 3 years, if the company opts to service a part of the machine at the end of year 1 at Rs. 10,000 and the scrap value at the end of year 3 will be Rs. 12,500. However, of the company decides not to services the part, it will have to be replaced at the end of year 2 at Rs. 15,400. But in this case, the machine will work for the 4th year also and get operational cash inflow of Rs. 18,000 for the 4th year. It will have to be scrapped at the end of year 4 at Rs. 9,000. Assuming cost of capital at 10% and ignoring taxes, will you recommend the purchase of this machine based on the net present value of its cash flows?
If the supplier gives a discount of Rs. 5,000 for purchase, what would be your decision? (The present value factors at the end of years 0, 1, 2, 3, 4, 5 and 6 are respectively 1, 0.9091, 0.8264, 0.7513, 0.6830, 0.6209 and 0.5644).
4. A person is required to pay four equal annual payment of Rs. 4,000 each in his Deposit account that pays 10% interest per year. Find out the future value of annuity at the end of 4 years.
5. The cash flows of two mutually exclusive projects are as under:_____________________________________________________________________________
t0 t1 t2 t3 t4 t5 t6 Project ‘P’ (40,000) 13,000 8,000 14,000 12,000 11,000 15,000(Rs.)Project ‘J’ (20,000) 7,000 13,000 12,000 -- -- --(Rs.)_____________________________________________________________________________
Required:(i) Estimate the net present value (NPV) of the Project ‘p’ and ‘J’ using 15% as the hurdle rate.(ii) Estimate the internal rate of return (IRR) of the project ‘P’ and ‘J’.

Cost Academy Financial Management-54
(iii) Why there is a conflict in the project choice by using NPV and IRR criterion?
(iv) Which criteria you will use in such a situation? Estimate the value at that criterion. Make a project choice.
The present value interest factor values at different rates of discount are as under.Rate of t0 t1 t2 t3 t4 t5 t6 Discount
0.15 1.00 0.8696 0.7561 0.6575 0.5718 0.4972 0.43230.18 1.00 0.8475 0.7182 0.6086 0.5158 0.4371 0.37040.20 1.00 0.8333 0.6944 0.5787 0.4823 0.4019 0.33490.24 1.00 0.8065 0.6504 0.5245 0.4230 0.3411 0.27510.26 1.00 0.7937 0.6299 0.4999 0.3968 0.3149 0.2499
6. A hospital is considering to purchase a diagnostic machine costing Rs. 80,000. The projected life of the machine is 8 years and has an expected salvage value of Rs. 6,000 at the end of 8 years. The annual operating cost of the machine is Rs. 7,500. It is expected to generate revenues of Rs. 40,000 per year for eight years. Presently, the hospital is outsourcing the diagnostic work and is earning commission income of Rs.12,000 per annum; net of taxes.
Required:Whether it would be profitable for the hospital to purchase the machine? Give your recommendation under:(i) Net Present Value method; (ii) Profitability Index method.
PV factors at 10% are given below:Year 1 Year 2 Year 3 Year 4 Year 5 Year 6 Year 7 Year 8 0.909 0.826 0.751 0.683 0.621 0.564 0.513 0.467
11/09/77. The cash flows of projects C and D are reproduced below:
Cash Flow NPV Project C 0 C 1 C 2 C 3 at 10% IRR C -Rs.10,000 +2,000 +4,000 +12,000 + Rs.4,139 26.5%D -Rs.10,000 + 10,000 + 3,000 + 3,000 + Rs.3,823 37.5%
(i) Why there is a conflict of rankings?(ii) Why should you recommend project C in spite of lower internal rate of return ?
Time Period 1 2 3 PVIF0.10, t 0.9090 0.8264 0.7513PVIF0.14, t 0.8772 0.7695 0.6750PVIF0.15, t 0.8696 0.7561 0.6575PVIF0..30, t 0.7692 0.5917 0.4552PVIF0.40, t 0.7143 0.5102 0.3644
( 5/03:Q-6a)
8. The capital budgeting committee of the board of directors of Khalifa Ltd. is considering the acquisition of a unit of equipment costing Rs. 76,000. Shipping & installation costs are estimated at an additional Rs. 4,000. The equipment is expected to have a useful life of 5 years with salvage, value of Rs. 5,000 at the end of 5 years. Before considering the effect of depre. the annual cash flow returns after I. tax from the use of this equipment are estimated at Rs. 20,000.
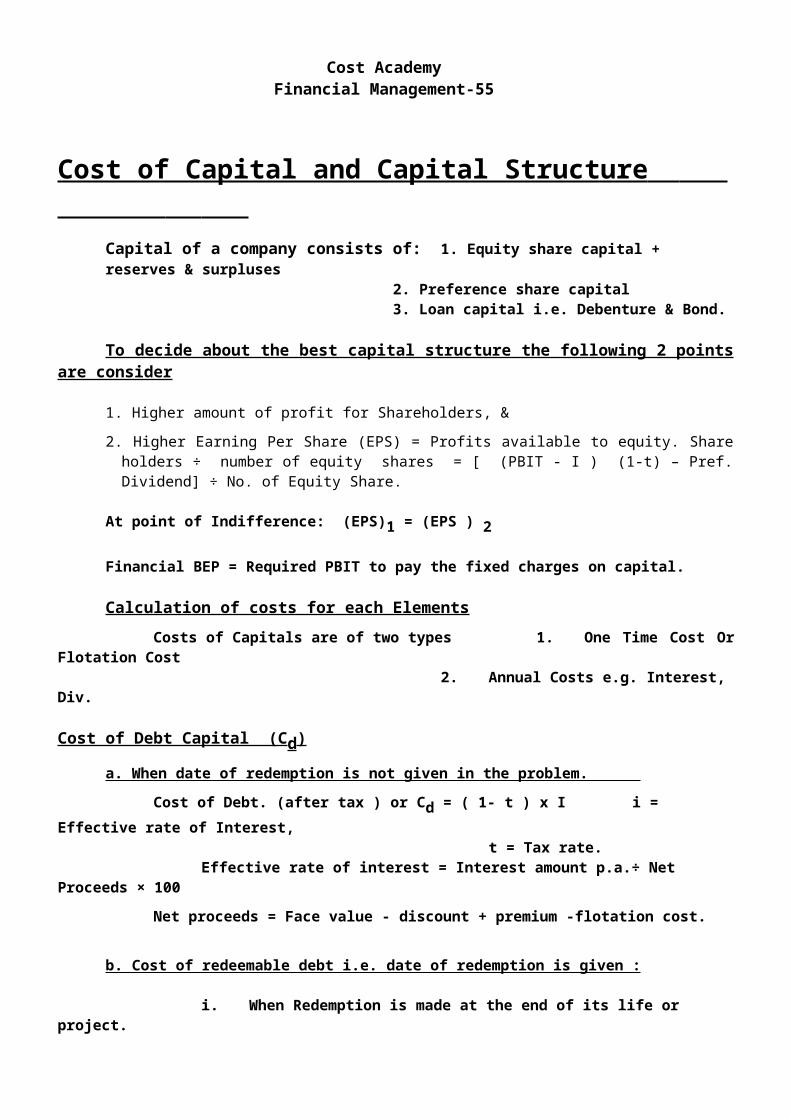
Cost Academy Financial Management-55
One member of the committee believes that the equipment now in service of this production can be used for another year. A new and improved model is expected in another year that can be acquired at a cost of Rs. 91,000. Shipping and installation costs are also estimated at Rs. 4,000, & the estimated salvage value at the end of the expected 5-year life is Rs. 5,000. Annual cash flow returns after income-tax but before considering the effect of depreciation are estimated at Rs. 23,000. The company has set a minimum rate of return objective of 18%. Depreciation is to be deducted by the sum of the year’s digits method. The income tax rate is 40%.Does it appear that the equipment should be purchased now, or should the company wait for a year for the new model. Use the net present value method and show computations.
9. A computer is available at a cash purchase price of Rs. 4,40,000. if taken on hire, the charges would be Rs. 15,400 per month for a minimum period of 36 months, and thereafter the rate would be reduced to Rs. 7,500 per month. The rentals fall due for payment at the end of each month.
A company, planning to acquire the above computer, wants advice whether it would be more economical to purchase the machine or take it on hire. What would be your advice if the cost of the capital is to be taken as 10% p.a. the present values of Re.1 and Re. 1/12 paid monthly at the end of n years both at 1-% are as follows:
After year (n) present value of Re. 1/12 present Paid monthly value of Re. 1
1 0.950 0.9092 0.864 0.8263 0.785 0.7514 0.714 0.6835 0.649 0.6216 0.591 0.564
10. XYZ Ltd. Is planning to introduce a new product with a project life of 8 years. The project is to be setup in special Economic Zone (SEZ), Qualifies for one time (at starting) tax free subsidy from the Statement Government of Rs. 25,00,000 on Capital Investment. Initial equipment cost will be Rs. 1.75 crores. Additional equipment cost Rs. 12,50,000 will be purchased at the end of the third year from the cash inflow of this year. At the end of 8 years, the original equipment will have no resale value, but additional equipment can be sold for Rs. 1,25,000. A working Capital of Rs. 20,00,000 will be needed and it will be released at the end of eight year. The project will be financed with sufficient amount of Equity Capital.
The sales volumes over eight years have been estimated as follows:
Year: 1 2 3 4-5 6-8Units 72,000 1,08,000 2,60,000 2,70,000 1,80,000
A Sales price of Rs. 120 per unit is expected and variable expenses will amount to 60% of sales revenue. Fixed Cash operating costs will amount Rs. 18,00,000 per year. The loss of any year will be set off from the profits of subsequent two years. The company is subject to 30% tax rate and consider 12% to be an appropriate after tax cost of Capital for this project. The company follows straight line method of depreciation.
Required: calculate the net present value of the project and advise the management to take appropriate decision.
11. A theater, with some surplus accommodation, proposes to extend its catering facilities to provide light meals to its patrons. The management is prepared to make the initial funds available to

Cost Academy Financial Management-56
cover the capital costs. It requires that these be repaid over a period of five years at a rate of interest of 14% per annum.
The capital costs are estimated at Rs. 60,000 for equipment that will have a life of 5 years and no residual value. Running costs of staff etc. will be Rs. 20,000 in the first year, increasing by Rs. 2,000 in each subsequent year. The management proposes to charge Rs. 5,000 per annum for electricity and other expenses and wants a nominal Rs. 2,500 per annum to cover any unforeseen contingencies.
Apart from this, the management is not looking for any profit as such from the extension of these facilities because it believes that these will enable more tickets to be sold for the cinema shows at the theaters. It is proposed that costs should be recovered by setting prices for the food at double the direct cost.
It is not expected that the full sales level will be reached until year 3. The proportion of that level reached in year 1 and 2 are 35% and 65% respectively.
You are required to calculate the sales that need to be achieved in each of the five years to meet the management’s targets. Ignore inflation and taxation.
12. Company UVW has to make a choice between two identical machines, in terms of capacity, ‘A’ and ‘B’. They have been designed differently, but do exactly the same job. Machine ‘A’ costs Rs. 7,50,000 and will last for three years. It costs Rs. 2,00,000 per year to run.
Machine ‘B’ is an economy model costing only Rs. 5,00,000, but will last for only two years. It costs Rs. 3,00,000 per year to run the cash flows of Machine ‘A’ and ‘B’ are real cash flows. The costs are forecasted in Rs. of constant purchasing power. Ignore taxes. The opportunity cost of capital is 9%.
Required: Which machine the company UVW should buy?
The present value (PV) factors at 9% areYear t1 t2 t3
PVIF 0.09,t 0.9174 0.8417 0.7722 Replacement of Assets
13. A job which is presently done entirely by manual methods has a labour cost of Rs. 46,000 a year. It is proposed to install a machine to do the job which involves an investment of Rs. 80,000 and an annual operating cost of Rs. 10,000. Assume the machine can be written off in 5 years on straight-line depreciation basis for tax purposes. Salvage value at the end of its economic life is zero. The tax rate is 35%. Analyse the economic implications of the proposal by the Rate of Return Method. Also calculate NPV at 10%.
14. A manufacturing unit engaged in the production of automobile parts, has a ten-year-old plant which has been depreciated according to the straight line method. The estimated total life of the plant is 20 years. The original cost including installation was Rs. 24 lakhs and the residual after 20 years is estimated to be Rs. 4 lakhs. The output of the factory per minute is 200 units.
It is proposed to install a new plant with a purchase price of Rs. 38 lakhs with a part exchange provision of Rs. 8 lakhs in respect of the existing plant. The new plant has an estimated life of 15 years and a residual value of Rs. 4 lakhs. The output of the new plant is 400 unit per minute and its installation cost is 2 lakhs.
The annual cost of the Two plants are to be taken as follows:–
Existing New

Cost Academy Financial Management-57
Running hours p. a. cost 2,500 2,500 Rs. Rs. Wages 100,000 140,000Sundry indirect materials 480,000 600,000Repairs and maintenance 80,000 100,000Power and Steam 240,000 280,000Proportion of general fixed costs 60,000 80,000
Will it be advantageous to buy the new plant or not? Substantiate you answer with the help of comparative unit cost with both the plants. Assume interest for capital as 10%. Make other relevant assumptions.
15. MNP Ltd. is thinking of replacing its existing machine by a new machine, which would cost Rs. 60 lakhs. The company’s current production is 80,000 units, and is expected to increase to 1,00,000 units, if the new machine is bought. The selling price of the product would remain unchanged at Rs. 200 per unit. The following is the cost of producing one unit of product using both the existing and new machine.
Existing New Unit cost Machine Machine Difference (80,000 units) (1,00,000 units) Rs.
Materials 75.0 63.75Wages & salaries 51.25 37.50 (11.25)Supervision 20.0 25.0 5.0Repairs & maintenance 11.25 7.50 (3.75)Power & Fuel 15.50 14.25 (1.25)Depreciation 0.25 5.0 4.75Allocated corporate overheads ____10.0 ____12.5 _____2.5
__183.25 __165.50 __17.75
The existing machine has an accounting book value of Rs. 1,00,000, and it has been fully depreciated for tax purpose. It is estimated that machine will be useful for 5 years. The supplier of the new machine has offered to accept the old machine for Rs. 2,50,000.
However, the market price of old machine today is Rs. 1,50,000 & it is expected to be Rs. 35,000 after 5 year. The new machine has a life of 5 years & a salvage value of Rs. 2,50,000 at the end of its economic life. Assume corporate income-tax rate at 40%, & depreciation is charged on straight-line basis for income-tax purposes. Further assume that book profit is treated as ordinary income for tax purpose. The opportunity cost of capital of the company is 15%.
Required:(i) Estimate net present value of the replacement decision.(ii) Estimate the internal rate of return of the replacement decision.
(iii) Should company go ahead with the replacement decision? Suggest.
16. Beta Company Ltd. Is considering replacement of its existing machine by a new machine, which is expected to cost Rs. 2,64,000. The new machine will have a life of five years and will yield annual cash revenues of Rs. 5,68,750 and incur annual cash expenses of Rs. 2,95,750. the estimated salvage value of the new machine is Rs. 18,200. The existing machine has a book value of Rs. 91,000 and can be sold for Rs. 45,500 today.

Cost Academy Financial Management-58
The existing machine has a remaining useful life of five years. The cash revenues will be Rs. 4,55,000 and associated cash expenses will be Rs. 3,18,500. The existing machine will have a salvage value of Rs. 4,550 at the end of five years.
The Beta Company is in 35% tax-bracket, and written off depreciation at 25% on written–down value method.
The Beta Company has a target debt to net worth ratio of 15%. The Company in the past has raised debt at 11% and it can raise fresh debt at 10.5%.Beta Company plans to follow dividend discount model to estimate the cost of equity capital. The company plans to pay a dividend of Rs. 2 per share in the next year. The current market price of Company’s equity share is Rs. 20 per equity share. The dividend per equity share of the company is expected to grow at 8% p.a.
Required:(i) Compute the incremental cash flows of the replacement decision.(ii) Compute the weighted average cost of Capital of the company.
(iv) Find out the net present value of the replacement decision.
(iv) Estimate the discounted payback period of the replacement decision.(v) Should the Company replace the existing machine? Advise.
Missing Figure Problem17. Following are the data on a capital project being evaluated by the management of X Ltd.:
Project M Annual cost saving Rs. 40,000Useful life 4 yearsI. R. R. 15%Profitability Index (PI) 1.064NPV ?Cost of capital ?Cost of project ?Payback ?Salvage value 0
Find the missing values considering the following table of discount factor only:
Discount factor 15% 14% 13% 12% 1 year 0.869 0.877 0.885 0.8932 years 0.756 0.769 0.783 0.7973 years 0.658 0.675 0.693 0.7124 years 0.572 0.592 0.613 0.636 Total 2.855 2.913 2.974 3.038
Lease 18. PQR Limited has decided to go in for a new model of Mercedes car. The cost of the vehicle is
Rs. 40 lakhs. The company has two alternatives:
(i) Taking the car on finance lease; or (ii) Borrowing and purchasing the car
LMN Limited is willing to provide the car on finance lease of PQR Ltd. for five years at an annual rental of Rs. 8.75 lakhs, payable at the end of the year.
The vehicle is expected to have useful life of 5 years, and it will fetch a net salvage value of Rs. 10 lakhs at the end of year five. The depreciation rate for tax purpose is 40% on written – down value basis. The applicable tax rate for the company is 35%. The applicable before tax borrowing rate for the company is 13.8462%. What is the net advantage of leasing for the PQR Ltd.? The values of present value interest factor at different rates of discount are as under:

Cost Academy Financial Management-59
Rate of Disc. t1 t2 t3 t4 t5 0.138462 0.8784 0.7715 0.6777 0.5953 0.52290.09 0.9174 0.8417 0.7722 0.7084 0.6499
Capital Rationing19. Alpha Limited is considering five capital projects for the years 2007 and 2008. The company is
financed by equity entirely and its cost of capital is 12%. The expected cash flows of the projects are as below: Year and Cash flows (Rs. ‘000)
Project 2009 2010 2011 2012 A (70) 35 35 20B (40) (30) 45 55C (50) (60) 70 80D - (90) 55 65E (60) 20 40 50
Note: Figures in brackets represent cash outflows.All projects are divisible i.e. size of investment can be reduced, if necessary in relation to availability of funds. None of the projects can be delayed or undertaken more than once.Calculate which project Alpha Limited should undertake if the capital available for investment is limited to Rs. 1,10,000 in 2008 and with no limitation in subsequent years . For your analysis, use the following present value factors:
Working Capital Management Working capital = Current assets - Current liabilities
Current assets includes:1. Stock of raw material 2. Stock of work-in-progress 3. Stock of finished goods 4. Sundry debtors and bills receivables. 5. Prepaid expenses 6. Accrued incomes 7. Cash at bank.
Current liabilities includes:1. Creditors for materials 2. Creditors for wages and other expenses 3. Bills payable 4. Bank overdraft etc.
Working capital requirement : 4 Steps :
1. Calculate production or sale for a particular period e.g. weekly or monthly as the case may be. 2. Prepare a cost sheet following a particular activity or capacity level. If there is a change in the capacity level, variable cost p. u. does not change but fixed cost p. u. will change. 3. Value of current assets or current liability = Corresponding Cost per item× credit period ×production per time period.4. Prepare a formal statement of working capital.
1. Factors to be taken into consideration while determining the requirement of working capital:
(i) Production Policies (ii) Nature of the business(iii) Credit policy iv) Inventory policy(v) Abnormal factors (vi) Market conditions(vii) Conditions of supply (viii) Business cycle(ix) Growth and expansion (x) Level of taxes(xi) Dividend policy (xii) Price level changes
Cost Academy Financial Management-60
(xiii) Operating efficiency.
2. Operating Cycle Analysis : The operating cycle of a firm begins with the acquisition of raw materials and ends with the collection of receivables. There are four aspects of the operating cycle which involve commitment of resources: raw material stage; work-in-process stage; finished goods stage; and accounts receivable stage. There is one aspect of the operating cycle which provides resources: accounts payable stage (this is the period for which credit is provided by the suppliers of raw materials.)
The duration of the operating cycle may be defined asDoc = Drm + Dwip + Dfg + Dar - Dap
Where Doc = duration of the operating cycleDrm = duration of the raw materials and stores stageDwip = duration of the work-in-process stageDfg = duration of the finished goods stageDar = duration of the accounts receivable stageDap = duration of the accounts payable stage.
Debtors Management
1. Credit Rating of Customers : When a firm wants to give credit to a new customer or increase credit to existing customers, it ought to steady the risk of customer defaulting and the customer’s ability to stand such credit. Such study is referred to as “credit rating”.
Credit rating of a customer involves finding answers to two broad questions regarding the customer, viz., (I) can he pay and (ii) Will he pay?
2. Sources of information before granting credit to a party.
Trade references: Bank references: Credit bureau reports: Past experience: Published financial statements: Salesmen’s interview and reports:
3. Credit cards : Credit cards are primarily seen as a means of convenience in meeting ones expenses. A person who holds a credit card need not pay in cash at the time of every expenditure. Instead he can deposit a lump sum in the bank or the agencies of which he holds the credit card, to meet the expenditures. Some banks offer even flexible payment options under which a card holder may be requires paying as low as 10% of the amount due to the month.
4. Concentration Banking : Concentration Banking is one of the methods for speeding up the process of collecting receivables. The helps in reducing the size of the float ( lead time ). In this method, a number of strategic collection centres in different regions are established instead of a single collection point. The system reduces the time period between the time a customer mails his remittances and the time when the funds become available for spending with the company. Payments received by the different collection centres are deposited with their respective local banks which in turn transfer all surplus funds to the concentration bank of the head office. The bank with which the company has its major bank account is normally located at the Head office.

Cost Academy Financial Management-61
5. Commercial paper : It is a sort term unsecured promissory note sold by large business firms to raise cash. These are sold either directly or through dealers. Companies with high credit rating can sell commercial papers directly to investors. In India the introduction of sort-term commercial papers was recommended by a working Group on the money market, appointed by the Reserve Bank of India in 1986.
6. Bills discounting as a means of finance :
Bills discounting is a sort term source of finance. It can be either supplier bill (purchase) or for sale of goods. These can be discounted with financial institutions, Banks and non banking finance companies. The Reserve Bank of India and the Central Government has been placing emphasis on developing bills discounting culture.
Advantages:(i) It is highly useful to small or medium sized Co.(ii) The cost of raising funds is low.(iii) Timely availability of funds is ensured.(iv) Premiums can be decided between the Co. and purchaser without going to SEBI.
Disadvantages:(ii) It lacks transparency.(ii) The scope for misuse is available.
7. Factoring services: The Business of Factoring involves the purchase of the accounts receivable of an operating business by a third party, who is described as the Factor. It is the Factor who provides credit analysis and the mechanical activities involved in collecting the receivable, to the Client.
8. Differentiation between Factoring and Bills Discounting
The differences between Factoring and Bills discounting are:(a) Factoring is called as “Invoice Factoring’ whereas Bills discounting is known as ‘Invoice
discounting.”
(b) In Factoring, the parties are known as the client, factor and debtor whereas in Bills discounting, they are known as drawer, drawee and payee.
(c) Factoring is a sort of management of book debts whereas bills discounting is a sort of borrowing from commercial banks.
(d) For factoring there is no specific Act, whereas in the case of bills discounting, the Negotiable Instruments Act is applicable.
9. Debt Securitization: It is a method of recycling of funds. It is especially beneficial to financial intermediaries to support the lending volumes. Assets generating steady cash flows are packaged together and against this assets pool, market securities can be issued, e.g., housing finance, auto loans, and credit card receivables.
`Benefits to the Originator of Debt SecuritizationThe benefits to the originator of debt securitization are as follows:
(a) The assets are shifted off the balance sheet, thus giving the originator recourse to off balance sheet funding.
(b) It converts illiquid assets to liquid portfolio.

Cost Academy Financial Management-62
(c) It facilitates better balance sheet management as assets are transferred off balance sheet facilitating satisfaction of capital adequacy norms.
(d) The originator's credit rating enhances.
10. Float The term float is used to refer to the periods that affect cash as it makes through the different stages of the collection process. Four types of float can be identified as:
(i) Billing float :An invoice is the formal document that a seller prepare and sends to the purchaser as the payment request for the goods sold or services provided The time between the sales & the mailing of the invoice is the billing float.
(ii) Mail float : This is the time when a cheque is being processed by post office, messenger service or other means of delivery.
(iii) Cheque processing float : This is the time required for the seller to sort, record and deposit the cheque after it has been received by the company.
(iv) Bank processing float : This is the time from the deposit of the cheque to the crediting of funds in the seller account.
11. Treasury Management
(i) Cash management: Treasury management in a business organisation is concerned about the efficient collection and repayment of cash to both insiders and to third parties.
(ii) Currency management: It manages the foreign currency risk, exchange rate risks etc. It may advise on the currency to be used when invoicing overseas sales.
(iii) Funding management: Responsible for planning and sourcing firm’s short, medium and long term cash needs. It participates in capital structure, forecasting of future interest and foreign currency rates decision-making process.
(iv) Banking: Maintains good relations with bankers and carry out initial negotiations with them for any short- term loan.
(v) Corporate finance: It advises on aspects of corporate finance including capital structure, mergers and acquisitions.
12. Miller- Orr Cash Management Model
According to this model the net cash flow is completely stochastic. When changes in cash balance occur randomly, the application of control theory serves a useful purpose. The Miller-Orr model is one of such control limits models. This model is designed to determine the time and size of transfers between an investment account and cash account. In this model control limits are set for cash balances. These limits may consists of ‘h’ as upper limit, ‘z’ as the return point and zero as the lower limit.
hUpper Control Limit
NReturn point
O Time Lower control Limit
Cas
h B
alan
ce R
s.
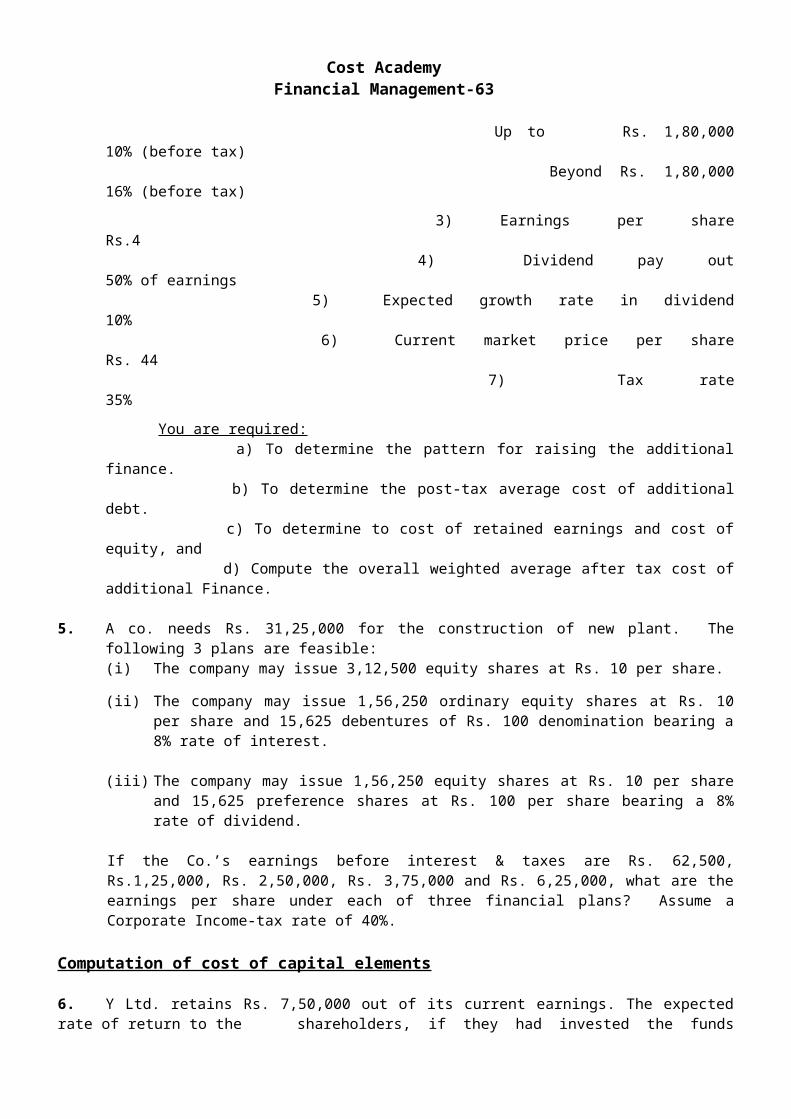
Cost Academy Financial Management-63
13. Baumol Model :
William J. Baumol developed a model for optimum cash balance which is normally used in inventory management. The optimum cash balance is the trade-off between cost of holding cash (opportunity cost of cash held) and the transaction cost (i.e. cost of converting marketable securities in to cash). Optimum cash balance is reached at a point where the two opposing costs are equal and where the total cost is minimum. This can be explained with the following diagram:
Total cost
CostHolding cost
Transaction cost
Optimum Cash BalanceThe optimum cash balance can also be computed algebraically.
Optimum Cash Balance =
A = Annual Cash disbursementsT = Transaction cost (Fixed cost) per transactionH = Opportunity cost one rupee per annum (Holding cost)
The model is based on the following assumptions:
(i) Cash needs of the firm are known with certainty.(ii) The cash is used uniformly over a period of time and it is also known with certainty.(iii) The holding cost is known and it is constant.(iv) The transaction cost also remains constant.
PROBLEMS: WORKING CAPITAL MANAGEMENT
1. The following information has been extracted from the records of a Company:
Product cost sheet Rs./unit
Raw materials 45Direct labour 20Overheads ___40Total 105Profit ___15Selling price 120
- Raw materials are in stock on an average of two months.

Cost Academy Financial Management-64
- The materials are in process on an average for 4 weeks. The degree of completion is 50%. (i.e. Labour+ Overhead)
- Finished goods stock on an average is for one month
- Time lag in payment of wages and overheads is 1½ weeks.- Time lag in receipt of proceeds from debtors is 2 months.- Credit allowed by suppliers is one month.
- 20% of the output is sold against cash.- The company expects to keep a Cash balance of Rs.1,00,000.- Take 52 weeks per annum
The Company is poised for a manufacture of 1,56,000 units in the years. You are required to prepare a statement showing the Working Capital requirements of the Co.
2. An engineering company is considering its working capital investment for the year 2009-10. The estimated fixed assets and current liabilities for the next year are Rs.6.63 crore and Rs.5.967 crore respectively. The sales and earnings before interest and taxes (EBIT) depend on investment in its current assets – particularly inventory and receivables. The company isExamining the following alternative working capital policies: Working Capital Investment in Estimated EBITPolicy current Assets Sales (Rs. Crore) (Rs. Crore) (Rs. Crore) Conservative 11.475 31.365 3.1365Moderate 9.945 29.325 2.9325Aggressive 6.63 25.50 2.55 You are required to calculate the following for each policy:(i) Rate of return on total assets.(ii) Net working capital position.(iii) Current assets to fixed assets ratio.(iv) Discuss the risk-return trade off each working capital policy.
3. The following annual figures relate to MNP Limited:
Sales (at three months credit) Rs. 90,00,000Materials consumed (suppliers extend one and half month’s Credit) Rs. 22,50,000Wages paid (one month in arrear) Rs. 18,00,000Mfg exp outstanding at the end of the year (cash expenses arepaid one month in arrear) Rs. 2,00,000
Total Administrative expenses for the year (cash expensesAre paid one month in arrear) Rs. 6,00,000Sales promotion expenses for the year (paid quarterly in Advance) Rs. 12,00,000
The company sells its products on gross – profit of 25% assuming depreciation as a part of cost of production. It keeps two month’s stock of finished gods and one month’s stock of raw materials as inventory. It keeps cash balance of Rs. 2,50,000.
Assuming a 5% safety margin, work out the working capital requirements of the company on cash cost basis. Ignore work – in – progress.
4. MN Ltd. Is commencing a new project for manufacture of electric toys. The following cost information has been ascertained for annual production of 60,000 units at full capacity: Amount per unit Rs.Raw Materials 20

Cost Academy Financial Management-65
Direct Labour 15Manufacturing overheads: Rs.
Variable 15Fixed __10 25
Selling & Distribution overheads: Rs.Variable 3Fixed ___1 __4
Total cost 64Profit __16Selling price __80
In the first year of operations expected production and sales are 40,000 units and 35,000 units respectively. To assess the need of Working capital, the following additional information is available:
i) Stock of Raw Materials 3 months consumptionii) Credit allowable for debtors 1 ½ months.iii) Credit allowable by creditors 4 monthsiv) Lag in payment of wages 1 monthv) Lag in payment of overheads ½ monthvi) cash in hand and bank is expected to Rs. 60,000.
vii) Provision for contingencies is required @ 10% of Working Capital requirement including that provision.
You are required to prepare a projected statement of Working capital requirement for the first year of operations. Debtors are taken at cost.
5. Your company is operating on 60% capacity, producing 24,000 units per annum, at the following cost-price structure:
Rs. Raw materials 5 per unit Wages 3 “ Overheads : variable 2 “ fixed 1 “ Profit __2 “ Price 13
On 31st December, 2009, the current assets and liabilities were as follows: Rs.
Raw materials 4,000 units, at cost 20,000Work in process 1,000 units, at cost 8,000Finished goods 3,000 units, at cost 33,000Sundry Debtors 78,000Creditors for goods 30,000Liability for wages 3,000Liability for expenses 6,000
In view of increased demand for the product, it has been decided that from 1st January, 2009, the unit should operate at 90% capacity. You are required to ascertain the additional working capital as would be necessary in view of additional production. The prices of materials, rates of wages and expenses and the selling price per unit will not be changed. The period of credit allowed to customers, credit allowed by suppliers and also time lag in payment of wages and expenses shall remain the same as before.
DEBTORS MANAGEMENT
6. A company’s collection pattern is as follows:- 10% of the Sales are the same month 20% of the Sales are the 2nd month

Cost Academy Financial Management-66
40% of the Sales are the 3rd month 30% of the Sales are the 4th month
The sales of the Co. for three quarters of the year are as follows ( in Rs. ) :-
Month Q1 Q2 Q3
1st 15,000 7,500 22,500 2nd 15,000 15,000 15,000 3rd 15,000 22,500 7,500Total 45,000 45,000 45,000W/Days 90 90 90
You are req. to calculate the average age of the receivable and comment on the results.
7. Premier Steel Limited has a present annual Sales turnover of Rs. 40,00,000/-. The unit Sale Price is Rs. 20/-. The Variable Costs are Rs. 12/- per unit and fixed costs amount to Rs. 5,00,000 per annum. The present credit period of one month is proposed to be extended to either 2 or 3 months whichever will be more profitable. The following additional information are available:
on the basis of Credit period of
1 month 2 months 3 months Increase in Sales by - 10% 30%
% of Bad debts to Sales 1 2 5
Fixed Cost will increase by Rs. 75,000 when Sales will increase by 30%. The Company requires a Pretax return on Investment at 20%. Evaluate the profitability of the proposals and recommend best credit period for the Company.
8. A trade whose current sales are in the region of Rs. 6 lakhs per annum and an average collection period of 30 days wants to pursue a more liberal policy to improve sales. A study made by a management consultant reveals the following information:
Credit Policy Increase in collection period Increase in sales Bad Debts
A 10 days Rs. 30,000 1.5% B 20 days Rs. 48,000 2.0% C 30 days Rs. 75,000 3.0% D 45 days Rs. 90,000 4.0%
The selling price per unit is Rs. 3. Average cost per unit is Rs. 2.25 and variable costs per unit are Rs. 2. The current bad debt loss is 1%. Required return on additional investment is 20%. Assume a 360 days year. Which of the above policies would you recommend for adoption?
9. XYZ Ltd. has annually credit sales amounting to Rs. 10 lakhs which grants a credit of 60 days. However, at present no discount facility is offered by the firm to its customers. The Co. is considering a plan to offer a discount of “3/12 net 60”. The offer of discount is expected to bring the total credit period from 60 days to 45 days & 50% of the customers (in value) are likely to avail the discount facility. The selling price of the product is Rs. 15 while the average cost p. u. comes to Rs. 12.
Please advise the company whether to resort to discount facility if the rate of return is 20% and a month is equal to 30 days. What is the maximum discount allowed by Management if interest is same. What maximum discount can be allowed by management?
10. Star Limited, manufacturers of Colour TV sets, are considering the liberalisation of existing credit terms to three of their large customers A, B and C, The credit period and likely quantity of TV sets that will be lifted by the customers are as follows:-
(Quantity Lifted (No. of TV Sets)

Cost Academy Financial Management-67
Credit Period (Days) A B C
0 1,000 1,000 - 30 1,000 1,500 -
60 1,000 2,000 1,00090 1,000 2,500 1,500
The selling price per TV set is Rs. 9,000.The expected contribution is 20% of the selling price. The cost of carrying debtors averages 20% per annum.
You are required :- a) Determine the credit period to be allowed to each customer, (Assume 360 days in a year for
calculation purposes). b) What other problems the Co. might face in allowing the credit period as determined in (a)
above?
11. A company has prepared the following projections for year:Sales 21,000 unitsSelling price per unit Rs. 40Variable cost per unit Rs. 25Total cost per unit Rs. 35Credit period allowed one month
The Co. proposes to increase the credit period allowed to its customers from one moth to two months. It is envisaged that the change in the policy as above will increase the sales by 8%. The co. desires a return of 25% on its investment. You are required to examine and advise whether the proposed Credit Policy should be implemented or not.
A problem on factoring
12. A firm has a total sales of Rs. 12,00,000 and its average collection period is 90 days. The past experience indicates that bad debt losses are 1.5% on sales. The expenditure incurred by the firm in administrating receivable collection efforts are Rs. 50,000. A factor is prepared to buy the firm’s receivables by charging 2% commission. The factor will pay advance on receivables to the firm at an interest rate of 16% p.a. after withholding 10% as reserve. Calculate effective cost of factoring to the firm. Assume 360 days in a year. 06/09/08
13. The turnover of PQR Ltd. is Rs. 120 lakhs of which 75% is on credit. The variable cost ratio is 80%. The credit terms are 2/10, net 30. on the current level of sales, the bad debts are 1%. The Company spends Rs. 1,20,000 per annum on administrating its credit sales. The cost includes salaries of staff who handle credit checking, collection etc. These are avoidable costs. The past experience indicates that 60% of the customers avail of the cash discount, the remaining customers pay on an average 60 days after the date of sale.
The Book debts (receivable) of the company are presently being financed in the ratio of 1:1 by a mix of bank borrowings and owned funds which cost per annum 15% and 14% respectively.
A factoring firm has offered to buy the firms receivables. The main elements of such deal structured by the factor are:
i) Factor reserve, 12% ii) Guaranteed payment, 25 daysiii) Interest charges, 15%, and iv) Commission 4% of the value of receivables.
Assume 360 days in a year.
What advise would you give to PQR Ltd. to continue with the in-house management of receivables or accept the factoring firm’s offer.

Cost Academy Financial Management-68
Cash Management
14. Beta Limited has an annual turnover of Rs. 84 crores and the same is spread over evenly each of the 50 weeks of the working year. However, the pattern within each week is that the daily rate of receipts on Mondays and Tuesdays is twice that experienced on the other three days of week. The cost of banking per day is Rs. 2,500. It is suggested that banking should be done daily or twice a week Tuesdays & Fridays as compared to the current practice of banking only on Fridays. Beta Limited always operates on bank overdraft and the current rate of interest is 15% per annum. This interest charge is applied by the bank on a simple daily basis.
Ignoring taxation, advise Beta Limited the best course of banking. For your exercise, use 360 days a year for computational purposes.
15. The annual cash requirement of A Ltd. is Rs. 10 lakhs. The company has marketable securities in lot sizes of Rs. 50,000, Rs. 1,00,000, Rs 2,00,000 ,Rs. 2,50,000 and Rs. 5,00,000. Cost of conversion of marketable securities per lot is Rs. 1,000. The company can earn 5% annual yield on its securities.
You are required to prepare a table indicating which lot size will have to be sold by the company. Also show that the economic lot size can be by Banmol Model.
Short Notes
1. Concept of Leveraged Lease: Leveraged lease involves lesser, lessee and financier. In leveraged lease, the lesser makes a substantial borrowing, even up to 80% of the assets purchase price. He provides remaining amount- about 20% or so-as equity to become the owner. The lesser claims all tax benefits related to the ownership of the assets. Lenders, generally large financial institutions, provide loans on a non-recourse basis to the lesser. Their debt served exclusively out of the lease proceeds. To secure the loan provided by the lenders, the lessor also agrees to give them a mortgage on the assets. Leveraged lease are called so because the high non-recourse debt creates a high degree of leverage.
2. Concept of Indian Depository Receipts: The concept of the depository receipt mechanism which is used to raise funds in foreign currency has been applied in the Indian capital market through the issue of Indian depository receipts (IDRs). Foreign companies can issue IDRs to raise funds from Indian market on the same lines as an Indian company uses ADRs /GDRs to raise foreign capital. The IDRs are listed and traded in India in the same way as other Indian securities are traded.
3. ‘Profit maximization’ and ‘Wealth maximization’ objective of a firm.
A firm’s financial management may often have the following as their objectives:(i) The maximum of firm’s profit.; (ii) The maximization of firm’s wealth / value.
The maximization of profit is often considered as an implied objective of a firm. To achieve the aforesaid objective various type of financing decisions may be taken

Cost Academy Financial Management-69
The wealth/ value of a firm is defined as the market price of the firms stock. The market price of a firm’s stock represents the local judgment of all market participants as to what the value of the particulars firm is It takes into account present and prospective future earnings per share, the
Timing and risk of these earning, the dividend policy of the firm and many other factors that bear upon the market price of the stock.
4. Limitations of Profit Maximization Objective of Financial Management (a) Time factor is ignored.(b) It is vague because it is not clear whether the term relates to economic profit, accounting
profit, profit after tax or before tax.
(c) The term maximization is also ambiguous.(d) It ignores the risk factor.
5. Firm value Vs. Profit maximization
A firm’s financial management may often have the following as their objectives:(i) The maximization of firm’s profit. (ii) The maximization of firm’s value / wealth.
The maximisation of profit is often considered as an implied objective of a firm. To achieve the aforesaid objective various type of financing decision may be taken. Options resulting into maximisation of profit may be selected by the firm’s decision makers. They even some time may adopt policies yielding exorbitant profits in short run which may prove to be unhealthy for the growth, survival and overall interests of the firm. The profit of the firm in this case is measured in terms of its total accounting profit available to its shareholders.The value/wealth of a firm is defined as the market price of the firms stock. The market price of a firm’s stock represents the focal judgment of all market participants as to what the value of the particular firm is. It takes into account present and prospective future earnings per share the timing and risk of these earning, the dividend policy of the firm and many other factors that bear upon the market price of the stock.
6. Ploughing back of profits: Retained earnings means retention of profit and reinvesting it in the company as long term funds. Such funds belong to the ordinary shareholders and increase the net worth of the company. A public limited company must plough back a reasonable amount of profit every year keeping in view the legal requirements in this regard and its own expansion plans. Such funds also entail almost no risk. Further, control of present owners is also not diluted by retaining profits.
7. Financial Instruments in the International Market
Some of the various financial instruments dealt with in the international market are:
(a) Euro Bonds (b) Foreign Bonds(c) Fully Hedged Bonds (d) Medium Term Notes(e) Floating Rate Notes (f) External Commercial Borrowings(g) Foreign Currency Futures (h) Foreign Currency Option(i) Euro Commercial Papers.
8. Global Depository Receipts ( GDR ) & American Depository Receipts ( ADR )
Global Depository Receipts (GDRs): It is a negotiable certificate denominated is US dollars which represent a Non-US Company’s publicity traded local currency equity. GDRS are created when the local currency shares of an Indian company are delivered to the depository’s local custodian bank, against which depository bank issues depository receipts in USRs.

Cost Academy Financial Management-70
The GDRS may be freely traded in the overseas market like any other dollar denominated security either on a foreign stock exchange or in the over the counter market of among qualified institutional buyers. By issue of GDRs Indian companies are able to tap global equity market to raise foreign currency funds by way of equity. It has distinct advantage over debt as there is no repayment of the principal and service costs are lower.
American Depository Receipts (ADRs): These are Depository receipts issued by accompany in the USA and are governed by the provisions of Security and Exchange Commission of USA. As the regulations are severe, Indian Companies tap the American market through private debt placements of GDRs listed in London Luxemburg Stock Exchanges. Apart from legal impediments, ADRs are costlier than GDRs. Legal fees are considerably high for US listing. Registration fee in USA is also substantial. Hence ADRs are less popular than GDR’s.
9. Deep Discount Bonds vs. Zero Coupon Bonds
Deep Discount Bonds (DDBs) are in the form of zero interest bonds. These bonds are sold at a discounted value and on maturity face value is paid to the investors. In such bonds, there is no interest payout during lock–in period.
IDBI was first to issue a Deep Discount Bonds (DDBs) in India in January 1992. The bond of a face value of Rs. 1 lakh was sold for Rs. 2,700 with a maturity period of 25 years.
A zero coupon bond (ZCB) does not carry any interest but it is sold by their issuing company at a discount. The difference between discounted value and maturing or face value represent the interest to be earned by the investor on such bonds.
10. In the close-ended lease , the assets gets transferred to the lessor at the end of lease, the risk of obsolescence, residual values etc. remain with the lessor being the legal owner of the assets. In the open-ended lease, the lessee has the option of purchasing the assets at the end of lease period.
11. Venture Capital Financing :
It refers to financing of new high risky venture promoted by qualified entrepreneurs who lack experience and funds, to give shape to their ideas. In other words, under venture capital financing venture capitalist make investment to purchase equity or debt securities from inexperienced entrepreneurs who undertake highly risky ventures with a potential of success.Some common methods of venture capital financing are as follows:
i. Equity financing: When funds are required for a longer period but the firm fails to provide returns to the investors during the initial stages, the venture capital finance is provided by way of equity share capital.
ii. Conditional loan: A conditional loan is repayable in the form of a royalty after the venture is able to generate ‘sales’. Here royalty ranges between 2 and 15 per cent. No interest is paid on such loans.
iii. Income note: It combines the features of both conventional and conditional loans. The concern has to pay both viz, interest and royalty on sales but at substantially low rates.
iv. Participating debenture: Such a security carries charges in three phases – in the start up phase no interest is charged, next stage a low rate of interest is charged unto a particular level of operation, after that, a high rate of interest is required to be paid.
12. Seed capital assistance.

Cost Academy Financial Management-71
Seed Capital Assistance: The seed capital assistance has been designed by IDBI for professionally or technically qualified entrepreneurs. All the projects eligible for financial assistance from IDBI, directly or indirectly through refinance are eligible under the scheme. The project cost should not exceed Rs. 2 corers and the maximum assistance under the project will be restricted to 50% of the required prompters contribution of Rs. 15 lakhs whichever is lower.The seed capital Assistance is interest free but carries a security charge of 1% p.a. for the first five years and an increasing rate thereafter.
13. Secured premium notes is issued along with detachable warrant and is redeemable after a notified period of say 4 to 7 years. This is a kind of NCD attached with warrant. It was first introduced by Tisco, which issued the SPNs to existing shareholders on right basis. Subsequently the SPNs will be repaid in some number of equal installments. The warrant attached to SPNs gives the holder the right to apply for and get allotment of equity shares as per the conditions within the time period notified by the company
14. External commercial Borrowings. (ECB)
An ECB is a loan taken from non-resident lenders in accordance with exchange control regulations. These loans can be taken from:
International banks Capital markets Multilateral financial institutions like IFC, ADB, IBRD etc. Export Credit Agencies Foreign collaborators Foreign Equity Holders.
ECB can be accessed under automatic and approval routes depending upon the purpose and volume.In automatic there is no need for any approval from RBI / Government while approval is required for areas such as textiles and steel sectors restructuring packages.
Present Value of Re.1 payable or receivable at the end of each period
Future Years
4% 5% 6% 7% 8% 9% 10% 11% 12% 13% 14% 15% 16%
1 .9615 .9524 .9434 .9346 .9259 .9174 .9091 .9009 .8929 .8850 .8772 .8696 .86212 .9246 .9070 .8900 .8734 .8573 .8417 .8265 .8116 .7972 .7832 .7695 .7561 .74323 .8890 .8638 .8396 .8163 .7938 .7722 .7513 .7312 .7118 .6931 .6750 .6575 .64074 .8548 .8227 .7921 .7629 .7350 .7084 .6830 .6587 .6355 .6133 .5921 .5718 .55235 .8219 .7835 .7473 .7130 .6806 .6499 .6209 .5935 .5674 .5428 .5194 .4972 .4761
6 .7903 .7462 .7050 .6663 .6302 .5963 .5645 .5346 .5066 .4803 .4556 .4323 .41047 .7599 .7107 .6651 .6228 .5835 .5470 .5132 .4817 .4524 .4251 .3996 .3759 .35388 .7307 .6768 .6274 .5820 .5403 .5019 .4665 .4339 .4039 .3762 .3506 .3269 .30509 .7026 .6446 .5919 .5439 .5003 .4604 .4241 .3909 .3606 .3329 .3075 .2843 .263010 .6756 .6139 .5584 .5084 .4632 .4224 .3855 .3522 .3220 .2946 .2697 .2472 .2267
11 .6496 .5847 .5268 .4751 .4289 .3875 .3505 .3173 .2875 .2607 .2366 .2149 .195412 .6246 .5568 .4970 .4440 3971 .3555 .3186 .2858 .2567 .2307 .2076 .1869 .168513 .6006 .5303 .4688 .4150 .3677 .3262 .2897 .2575 .2292 .2042 .1821 .1625 .145214 .5775 .5051 .4223 .3878 .3405 .2993 .2633 .2320 .2046 .1807 .1597 .1413 .125215 .5553 .4810 .4173 .3625 .3152 .2745 .2394 .2090 .1827 .1599 .1401 .1229 .1079
16 .5339 .4581 .3937 .3387 .2919 .2519 .2176 .1883 .1631 .1415 .1229 .1069 .093017 .5134 .4363 .3714 .3166 .2703 .2311 .1978 .1696 .1456 .1252 .1078 .0929 .080218 .4936 .4155 .3503 .2959 .2503 .2120 .1799 .1528 .1300 .1108 .0946 .0808 .069119 .4746 .3957 .3305 .2765 .2317 .1945 .1635 .1377 .1161 .0981 .0830 .0703 .059620 .4564 .3769 .3118 .2584 .2146 .1784 .186 .1240 .1037 .0868 .0728 .0611 .0514

Cost Academy Financial Management-72
21 .4388 .3589 .2942 .2415 .1987 .1637 .1351 .1117 .0926 .0768 .0638 .0531 .044322 .4220 .3419 .2775 .2257 .1839 .1502 .1229 .1007 .0827 .0680 .0560 .0462 .038223 .4057 .3256 .2618 .2110 .1703 .1378 .1117 .0907 .0738 .0610 .0491 .0402 .032924 .3901 .3101 .2470 .1972 .1577 .1264 .1015 .0817 .0659 .0532 .0431 .0349 .028425 .3751 .2953 .2330 .1843 .1460 .1160 .0923 .0736 .0588 .0471 .0378 .0304 .0245
Future Years
17% 18% 19% 20% 21% 22% 23% 24% 25% 26% 27% 28% 29% 30%
1 .8547 .8475 .8403 .8333 .8265 .8197 .8130 .8065 .8000 .7937 .7874 .7813 .7752 .76922 .7305 .7182 .7062 .6914 .6830 .6719 .6610 .6504 .6400 .6299 .6290 .6104 .6009 .59173 .6244 .6086 .5934 .5787 .5645 .5502 .5374 .5245 .5120 .4999 .4882 .4768 .4658 .45524 .5337 .5158 .4987 .4823 .4665 .4514 .4369 .4230 .4096 .3968 .3844 .3725 .3611 .35015 .4561 .4371 .4191 .4019 .3855 .3700 .3522 .3411 .3277 .3149 .3027 .2910 .2799 .2693
6 .3898 .3704 .3521 .3349 .3186 .3033 .2888 .2751 .2621 .2499 .2383 .2274 .2170 .20727 .3332 .3139 .2959 .2791 .2833 .2486 .2348 .2218 .2097 .1983 .1877 .1776 .1682 .15948 .2848 .2660 .2487 .2326 .2176 .2038 .1909 .1789 .1678 .1574 .1478 .1378 .1304 .12269 .2434 .2255 .2090 .1938 .1799 .1670 .1552 .1443 .1342 .1249 .1164 .1084 .1011 .094310 .2080 .1911 .1756 .1615 .1486 .1369 .1262 .1164 .1074 .0992 .0916 .0847 .0784 .0725
11 .1778 .1619 .1476 .1346 .1229 .1122 .1026 .0938 .0859 .0787 .0721 .0662 .0608 .055812 .1520 .1372 .1240 .1122 .1015 .0920 .0834 .0757 .0687 .0625 .0568 .0517 .0471 .042913 .1299 .1163 .1042 .0935 .0839 .0754 .0678 .0610 .0550 .0496 .0447 .0404 .0365 .033014 .1110 .0986 .876 .0779 .0693 .0618 .0551 .0492 .0440 .0393 .0352 .0316 .0283 .025415 .0949 .0835 .0736 .0649 .0573 .0507 .0448 .0397 .0352 .0312 .0277 .0247 .0219 .0195
16 .0813 .0708 .0618 .0541 .0474 .0415 .0364 .0320 .0282 .0248 .0218 .0193 .0170 .015017 .0683 .0600 .0520 .0451 .0391 .0340 .0296 .0258 .0225 .0197 .0172 .0151 .0132 .011618 .0393 .0508 .0437 .0376 .0324 .0279 .0241 .0208 .0180 .0156 .0135 .0118 .0102 .008919 .0506 .0431 .0357 .0313 .0267 .0229 .0196 .0168 .0144 .0124 .0107 .0092 .0079 .006820 .0433 .0365 .0308 .0261 .0221 .0187 .0159 .0135 .0115 .0098 .0084 .0072 .0061 .0053
21 .0370 .0309 .0259 .0217 .0183 .0154 .0129 .0109 .0092 .0078 .0066 .0056 .0048 .004122 .0010 .0262 .0218 .0181 .0151 .0126 .0105 .0088 .0074 .0062 .0052 .0044 .0037 .003123 .0270 .0222 .0183 .0151 .0125 .0103 .0086 .0071 .0059 .0049 .0041 .0034 .0029 .002424 .0231 .0188 .0154 .0126 .0103 .0085 .0070 .0057 .0047 .0039 .0032 .0027 .0022 .001825 .0197 .0160 .0129 .0105 .0085 .0069 .0057 .0046 .0038 .0031 .0025 .0021 .0017 .0014
Present Value of Re.1 payable or receivable annually at the end of each periodYear 1% 2% 3% 4% 5% 6% 7% 8% 9% 10%1 0.9901 0.9804 0.9709 0.9615 0.9524 0.9434 0.9346 0.9259 0.9174 0.90912 1.9704 1.9416 1.9135 1.8861 1.8594 1.8334 1.8080 1.7833 1.7591 1.73553 2.9410 2.8839 2.8286 2.7751 2.7232 2.6730 2.6243 2.5771 2.5313 2.48684 3.9020 3.8077 3.7171 3.6299 3.5459 3.4651 3.3872 3.3121 3.2397 3.16995 4.8535 4.7134 4.5797 4.4518 4.3295 4.2123 4.1002 3.9927 3.8896 3.7908
6 5.7955 5.6014 5.4172 5.2421 5.0757 4.9173 4.7665 4.6229 4.4859 4.35537 6.7282 6.4720 6.2302 6.0020 5.7863 5.5824 5.3893 5.2064 5.0369 4.86848 7.6517 7.3254 7.0196 6.7327 6.4632 6.2098 5.9713 5.7466 5.5348 5.33499 8.5661 8.1622 7.7861 7.4353 7.1978 6.8017 6.5152 6.2469 5.9852 5.759010 9.4714 8.9825 8.5302 8.1109 7.7217 7.3601 7.0236 6.7101 6.4176 6.1446
11 10.3677 9.7868 9.2526 8.7604 8.3064 7.8868 7.4987 7.1389 6.8052 6.495112 11.2552 10.5753 9.9539 9.3850 8.8632 8.3838 7.9427 7.5361 7.1607 6.813713 12.1338 11.3483 10.6349 9.9856 9.3935 8.8527 8.3576 7.9038 7.4869 7.103414 13.0038 12.1062 11.2960 10.5631 9.8986 9.2950 8.7454 8.2442 7.7861 7.366715 13.8651 12.8492 11.9379 11.1183 103796 9.7122 9.1079 8.5595 8.0607 7.6061
16 14.7180 13.5777 12.5610 11.6522 10.8377 10.1059 9.4466 8.8514 8.3125 7.823717 15.5624 14.2918 13.1660 12.1656 11.2740 10.4772 9.7632 9.1216 8.5436 8.021518 16.3984 14.9920 13.7534 12.6592 11.6895 10.8276 10.0591 9.3719 8.7556 8.201419 17.2261 15.6784 14.3237 13.1339 12.0853 11.1581 10.3356 9.6036 8.9501 8.364920 18.0457 16.3514 14.8774 13.5903 12.4622 11.4699 10.5940 9.8181 9.1285 8.5136

Cost Academy Financial Management-73
21 18.8571 17.0111 15.4149 14.0291 12.8211 11.7640 10.8355 10.0168 9.2922 8.648722 19.6605 17.6580 15.9368 14.4511 13.1630 12.0416 11.0612 10.2007 9.4424 8.771523 20.4559 18.2922 16.4435 14.8568 13.4885 12.3033 11.2722 10.3710 9.5802 8.863224 21.2435 18.9139 16.9355 15.2469 13.7986 12.5503 11.4693 10.5287 9.7066 8.984725 22.0233 19.5234 17.4131 15.6220 14.0939 12.7833 11.6536 10.6748 9.8226 9.0770Year 11% 12% 13% 14% 15% 16% 17% 18% 19% 20%1 0.9009 0.8929 0.8850 0.8772 0.8696 0.8021 0.8547 0.8475 0.8403 0.83332 1.7125 1.6901 1.6681 1.6467 1.6257 1.6052 1.5852 1.5656 1.5465 1.52783 2.4437 2.4018 2.3612 2.3216 2.2832 2.2459 2.2096 2.1743 2.1399 2.10654 3.1024 3.0373 2.9745 2.9137 2.8550 2.7982 2.7432 2.6901 2.6386 2.53675 3.6959 3.6048 3.5172 3.4331 3.3522 3.2743 3.1993 3.1272 3.0576 2.9906
6 4.2305 4.1114 3.9976 3.8887 3.7845 3.6847 3.5892 3.4976 3.4098 3.32557 4.7122 4.5638 4.4226 4.2883 4.1604 4.0385 3.9224 3.8115 3.7057 3.60458 5.1461 4.9676 4.7988 4.6389 4.4873 4.3436 4.2072 4.0776 3.9544 3.83729 5.5370 5.3282 5.1317 4.9464 4.7716 4.6065 4.4506 4.3030 4.1633 4.031010 5.8892 5.6502 4.4262 5.2161 5.0188 4.8332 4.6586 4.4941 4.3389 4.1925
11 6.2065 5.9377 5.6359 5.4527 5.2337 5.0286 4.8364 4.6560 4.4855 4.327112 6.4924 6.1944 5.9176 5.6603 5.4206 5.1971 4.9884 4.7932 4.6105 4.439213 6.7499 6.4235 6.1218 5.8424 5.5831 5.3423 5.1185 4.9095 4.7147 4.532714 6.7819 6.6282 6.3025 6.0021 5.7245 5.4675 5.2293 5.0081 4.8023 4.610615 7.8909 6.8109 6.4624 6.1422 5.8474 5.5755 5.3242 5.0916 4.8759 4.6755
16 7.3792 6.9740 6.6039 6.2651 5.9542 5.6685 5.4053 5.1624 4.9377 4.729617 7.5418 7.1196 6.7291 6.3729 6.0472 5.7487 5.4746 5.2223 4.9897 4.774618 7.7016 7.2497 6.8399 6.4676 6.1280 5.8178 5.5339 5.2732 5.0333 4.812219 7.8393 7.3658 6.9380 6.5504 6.1982 5.8775 5.5845 5.3162 5.0700 4.842520 7.9633 7.4694 7.0248 6.6231 6.2593 5.9288 5.6278 5.3527 5.1009 4.8696
21 8.0751 7.5620 7.4016 6.6870 6.3125 5.9731 5.6648 5.3837 5.1268 4.891322 8.1757 7.6446 7.4695 6.7429 6.3587 6.0113 5.6964 5.4099 5.1486 4.909423 8.2664 7.7184 7.2297 6.7921 6.3988 6.0442 5.7234 5.4321 5.1668 4.924524 8.3481 7.7843 7.2829 6.8351 6.4338 6.0726 5.7465 5.4509 5.1822 4.937125 8.4217 7.8431 7.3300 6.8729 6.4641 6.0971 5.7662 5.4669 5.1951 4.9476
Year 21% 22% 23% 24% 25% 26% 27% 28% 29% 30%1 0.8264 0.8197 0.8130 0.8065 0.8000 0.7937 0.7874 0.7813 0.7752 0.76922 1.5095 1.4915 1.4740 1.4568 1.4400 1.4235 1.4074 1.3916 1.3761 1.36093 2.0739 2.0422 2.0114 1.9813 1.9520 1.9234 1.8956 1.8684 1.8420 1.81614 2.5404 2.4936 2.4483 2.4043 2.3616 2.3202 2.2800 2.2410 2.2031 2.16625 2.9260 2.8686 2.8035 2.7454 2.6893 2.6351 2.5827 2.5320 2.4830 2.4356
6 3.2446 3.1669 3.0923 3.0206 2.9514 2.8850 2.8210 2.7554 2.7000 2.64277 3.5079 3.4155 3.3270 3.2423 3.1611 3.0833 3.0087 2.9370 2.8682 2.80218 3.7256 3.6193 3.5179 3.4212 3.3289 3.2407 3.1564 3.0758 2.9986 2.92479 3.9054 3.7863 3.6731 3.5655 3.4631 3.3607 3.2728 3.1842 3.0997 3.019010 4.0541 3.9232 3.7993 3.6819 3.5705 3.4648 5.3644 3.2689 3.1781 3.0915
11 4.1769 4.0354 3.9018 3.7757 3.6564 3.5435 3.4365 3.3351 3.2388 3.147312 4.2785 4.1274 3.9852 3.8514 3.7251 3.6060 3.4933 3.3868 3.2859 3.190313 4.3624 4.2028 4.0530 3.9124 3.7801 3.6565 3.6381 3.4272 3.3224 3.223314 4.4317 4.2646 4.1082 3.9616 3.8241 3.6949 3.5733 3.4587 3.3507 3.248715 4.4890 4.3152 4.1530 4.0013 3.8593 3.7261 3.6010 3.4834 3.3726 3.2682
16 4.5364 4.3567 4.1894 4.0333 3.8874 3.7509 3.6228 3.5026 3.3896 3.283217 4.5755 4.3908 4.2190 4.0591 3.9099 3.7705 3.6400 3.5171 3.4028 3.294818 4.6079 4.4187 4.2431 4.0799 3.9279 3.7861 3.6536 3.5294 3.4130 3.303719 4.6346 4.4415 4.2627 4.0967 3.9424 3.7985 3.6642 3.5386 3.4210 3.310520 4.6567 4.4603 4.2786 4.1103 3.9539 3.8083 3.6725 3.5458 3.4271 3.3158

Cost Academy Financial Management-74
21 4.6750 4.4756 4.2916 4.1212 3.9631 3.8161 3.6792 3.5514 3.4319 3.319822 4.6900 4.4882 4.3021 4.1300 3.9705 3.8223 3.6846 3.5558 3.4356 3.323023 4.7025 4.4985 4.3106 4.1371 3.9764 3.8273 3.6885 3.5592 3.4384 3.325424 4.7128 4.5070 4.3176 4.1428 3.9811 3.8312 3.6918 3.5619 3.4406 3.327225 4.7213 4.5139 4.3232 4.1474 3.9849 3.8342 3.6943 3.5640 3.4423 3.3236