financial synergies | q3 2017 market review
TRANSCRIPT

Q3Quarterly Market Review
Third Quarter 2017
Quarterly Market ReviewThird Quarter 2017
Overview:
Market Summary
World Stock Market Performance
World Asset Classes
US Stocks
International Developed Stocks
Emerging Markets Stocks
Select Country Performance
Select Currency Performance vs. US Dollar
Real Estate Investment Trusts (REITs)
Commodities
Fixed Income
Impact of Diversification
This report features world capital market performance
and a timeline of events for the past quarter. It begins
with a global overview, then features the returns of
stock and bond asset classes in the US and
international markets.
The report also illustrates the impact of globally
diversified portfolios.
Market Summary
3
Past performance is not a guarantee of future results. Indices are not available for direct investment. Index performance does not reflect the expenses associated with the management of an actual portfolio.
Market segment (index representation) as follows: US Stock Market (Russell 3000 Index), International Developed Stocks (MSCI World ex USA Index [net div.]), Emerging Markets (MSCI Emerging Markets Index [net div.]),
Global Real Estate (S&P Global REIT Index [net div.]), US Bond Market (Bloomberg Barclays US Aggregate Bond Index), and Global Bond ex US Market (Citi WGBI ex USA 1−30 Years [Hedged to USD]). The S&P data are
provided by Standard & Poor's Index Services Group. Frank Russell Company is the source and owner of the trademarks, service marks, and copyrights related to the Russell Indexes. MSCI data © MSCI 2017, all rights
reserved. Bloomberg Barclays data provided by Bloomberg. Citi fixed income indices copyright 2017 by Citigroup.
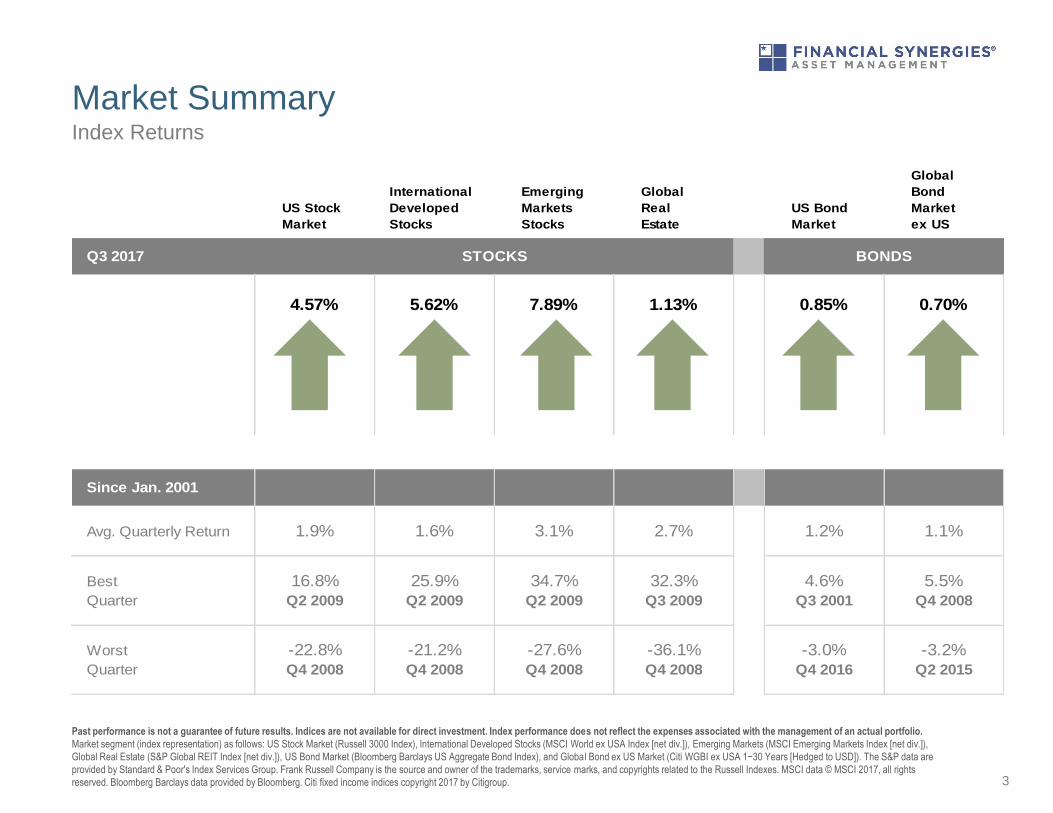
Index Returns
US Stock
Market
International
Developed
Stocks
Emerging
Markets
Stocks
Global
Real
Estate
US Bond
Market
Global
Bond
Market
ex US
Q3 2017 STOCKS BONDS
4.57% 5.62% 7.89% 1.13% 0.85% 0.70%
Since Jan. 2001
Avg. Quarterly Return 1.9% 1.6% 3.1% 2.7% 1.2% 1.1%
Best 16.8% 25.9% 34.7% 32.3% 4.6% 5.5%
Quarter Q2 2009 Q2 2009 Q2 2009 Q3 2009 Q3 2001 Q4 2008
Worst -22.8% -21.2% -27.6% -36.1% -3.0% -3.2%
Quarter Q4 2008 Q4 2008 Q4 2008 Q4 2008 Q4 2016 Q2 2015
200
210
220
230
240
250
World Stock Market Performance
4Graph Source: MSCI ACWI Index [net div.]. MSCI data © MSCI 2017, all rights reserved.
It is not possible to invest directly in an index. Performance does not reflect the expenses associated with management of an actual portfolio. Past performance is not a guarantee of future results.
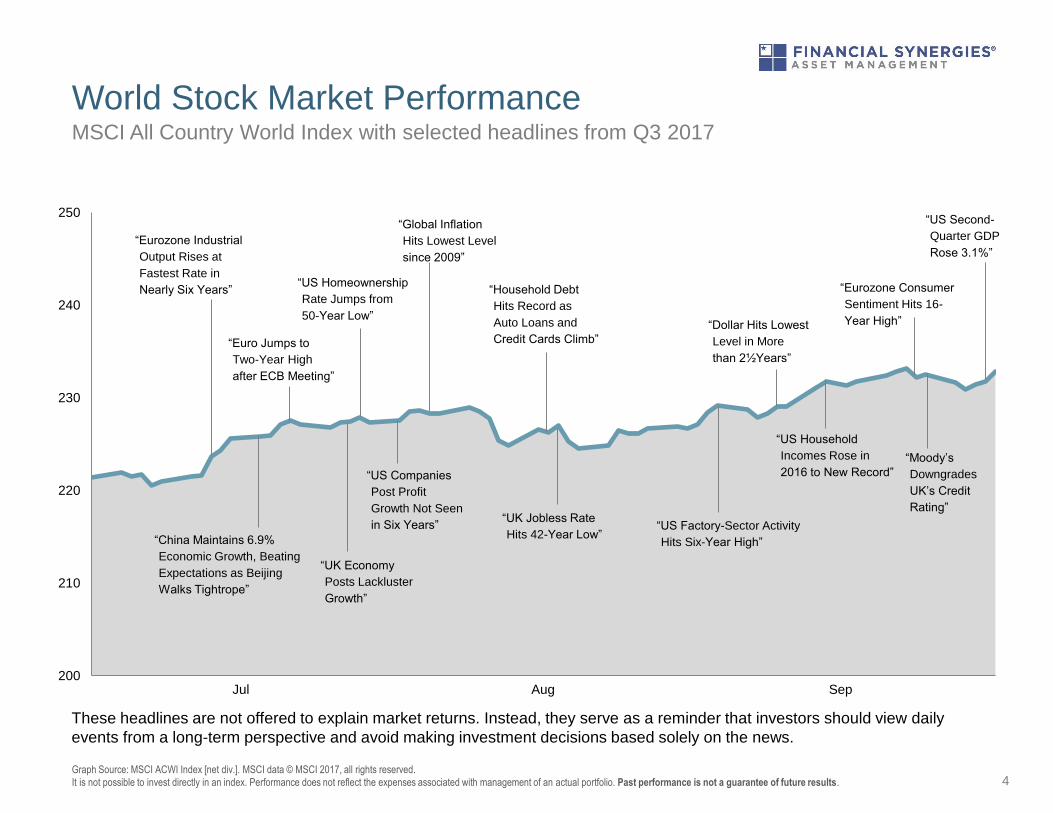
MSCI All Country World Index with selected headlines from Q3 2017
These headlines are not offered to explain market returns. Instead, they serve as a reminder that investors should view daily
events from a long-term perspective and avoid making investment decisions based solely on the news.
Jul Aug Sep
“Eurozone Industrial
Output Rises at
Fastest Rate in
Nearly Six Years”
“China Maintains 6.9%
Economic Growth, Beating
Expectations as Beijing
Walks Tightrope”
“US Companies
Post Profit
Growth Not Seen
in Six Years”
“Euro Jumps to
Two-Year High
after ECB Meeting”
“UK Economy
Posts Lackluster
Growth”
“US Homeownership
Rate Jumps from
50-Year Low”
“Global Inflation
Hits Lowest Level
since 2009”
“Household Debt
Hits Record as
Auto Loans and
Credit Cards Climb”
“UK Jobless Rate
Hits 42-Year Low”“US Factory-Sector Activity
Hits Six-Year High”
“Dollar Hits Lowest
Level in More
than 2½Years”
“US Household
Incomes Rose in
2016 to New Record”
“Eurozone Consumer
Sentiment Hits 16-
Year High”
“Moody’s
Downgrades
UK’s Credit
Rating”
“US Second-
Quarter GDP
Rose 3.1%”
150
160
170
180
190
200
210
220
230
240
Sep-2016 Dec-2016 Mar-2017 Jun-2017 Sep-2017
World Stock Market Performance
5
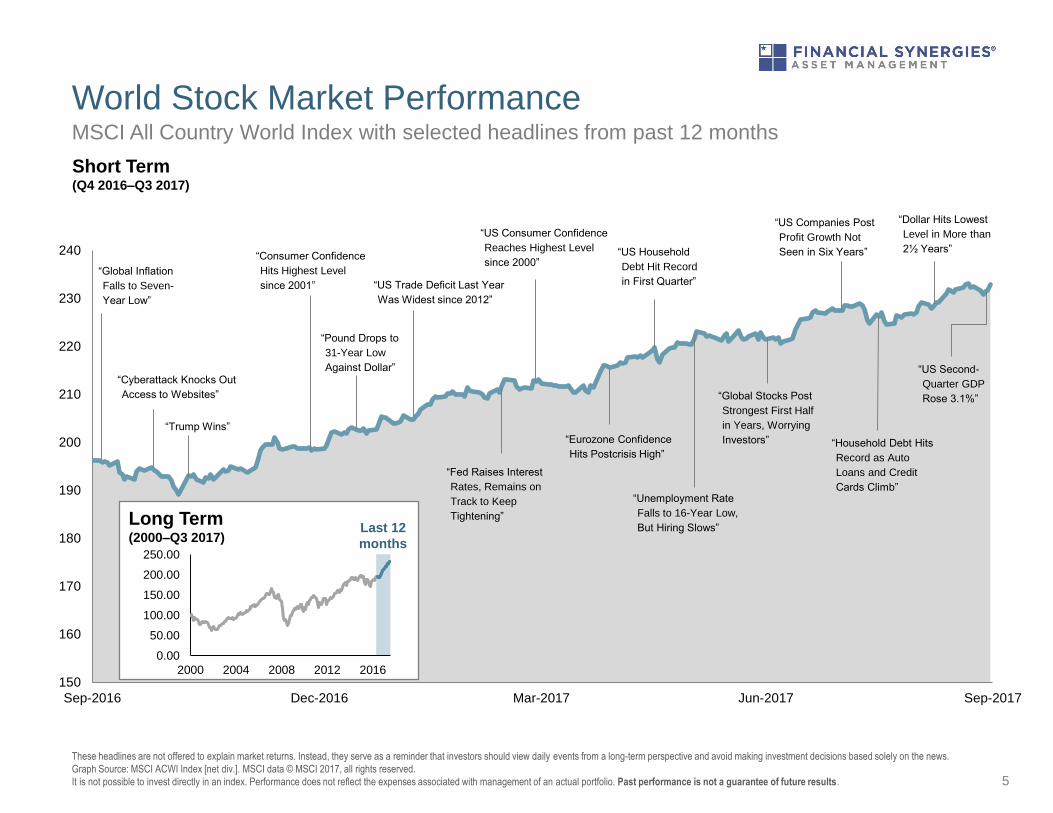
These headlines are not offered to explain market returns. Instead, they serve as a reminder that investors should view daily events from a long-term perspective and avoid making investment decisions based solely on the news.
Graph Source: MSCI ACWI Index [net div.]. MSCI data © MSCI 2017, all rights reserved.
It is not possible to invest directly in an index. Performance does not reflect the expenses associated with management of an actual portfolio. Past performance is not a guarantee of future results.
MSCI All Country World Index with selected headlines from past 12 months
“Pound Drops to
31-Year Low
Against Dollar”
“Global Inflation
Falls to Seven-
Year Low”
“US Consumer Confidence
Reaches Highest Level
since 2000”
“Fed Raises Interest
Rates, Remains on
Track to Keep
Tightening”
Short Term (Q4 2016–Q3 2017)
“Consumer Confidence
Hits Highest Level
since 2001”
“Cyberattack Knocks Out
Access to Websites”
“US Trade Deficit Last Year
Was Widest since 2012”
Long Term (2000–Q3 2017)
0.00
50.00
100.00
150.00
200.00
250.00
2000 2004 2008 2012 2016
Last 12
months
“Eurozone Confidence
Hits Postcrisis High”
“US Household
Debt Hit Record
in First Quarter”
“Global Stocks Post
Strongest First Half
in Years, Worrying
Investors”
“Unemployment Rate
Falls to 16-Year Low,
But Hiring Slows”
“US Companies Post
Profit Growth Not
Seen in Six Years”
“Household Debt Hits
Record as Auto
Loans and Credit
Cards Climb”
“Dollar Hits Lowest
Level in More than
2½ Years”
“US Second-
Quarter GDP
Rose 3.1%”
“Trump Wins”
World Asset Classes
6
Past performance is not a guarantee of future results. Indices are not available for direct investment. Index performance does not reflect the expenses associated with the management of an actual portfolio.
The S&P data is provided by Standard & Poor's Index Services Group. Frank Russell Company is the source and owner of the trademarks, service marks, and copyrights related to the Russell Indexes. MSCI data © MSCI
2017, all rights reserved. Dow Jones data (formerly Dow Jones Wilshire) provided by Dow Jones Indices. Bloomberg Barclays data provided by Bloomberg. Treasury bills © Stocks, Bonds, Bills, and Inflation Yearbook™,
Ibbotson Associates, Chicago (annually updated work by Roger G. Ibbotson and Rex A. Sinquefield).
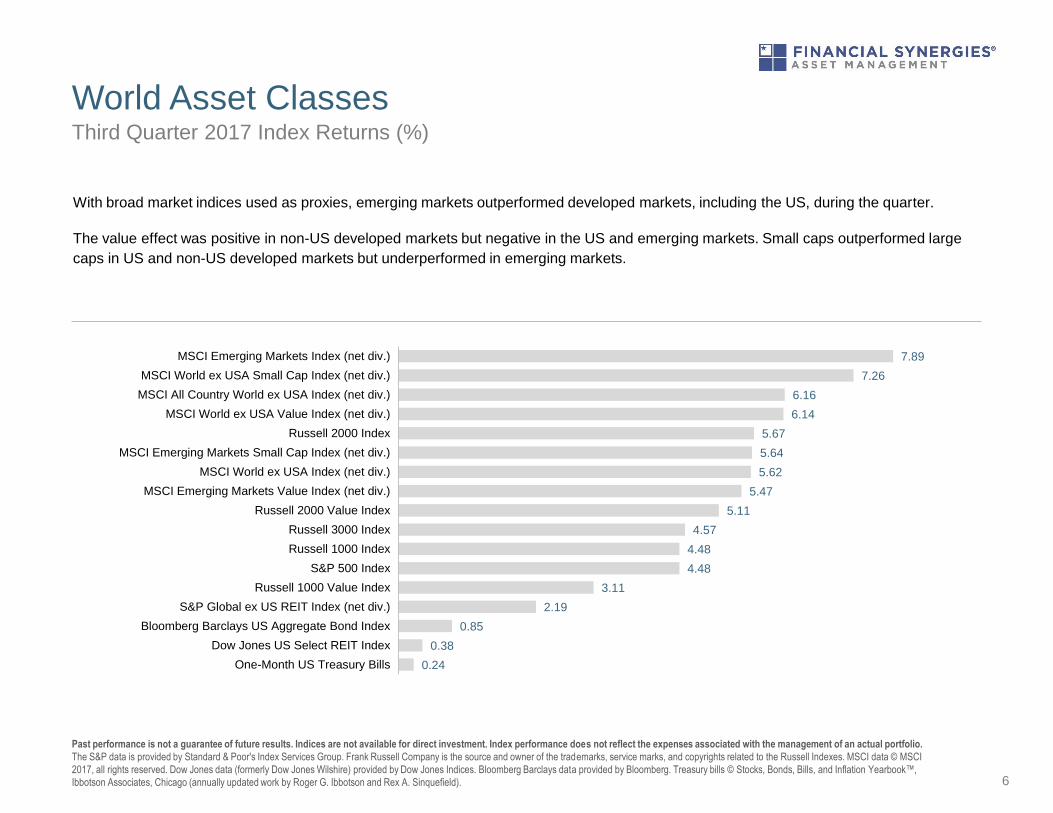
With broad market indices used as proxies, emerging markets outperformed developed markets, including the US, during the quarter.
The value effect was positive in non-US developed markets but negative in the US and emerging markets. Small caps outperformed large
caps in US and non-US developed markets but underperformed in emerging markets.
Third Quarter 2017 Index Returns (%)
7.89
7.26
6.16
6.14
5.67
5.64
5.62
5.47
5.11
4.57
4.48
4.48
3.11
2.19
0.85
0.38
0.24
MSCI Emerging Markets Index (net div.)
MSCI World ex USA Small Cap Index (net div.)
MSCI All Country World ex USA Index (net div.)
MSCI World ex USA Value Index (net div.)
Russell 2000 Index
MSCI Emerging Markets Small Cap Index (net div.)
MSCI World ex USA Index (net div.)
MSCI Emerging Markets Value Index (net div.)
Russell 2000 Value Index
Russell 3000 Index
Russell 1000 Index
S&P 500 Index
Russell 1000 Value Index
S&P Global ex US REIT Index (net div.)
Bloomberg Barclays US Aggregate Bond Index
Dow Jones US Select REIT Index
One-Month US Treasury Bills
US Stocks
7
Third Quarter 2017 Index Returns
Past performance is not a guarantee of future results. Indices are not available for direct investment. Index performance does not reflect the expenses associated with the management of an actual portfolio.
Market segment (index representation) as follows: Marketwide (Russell 3000 Index), Large Cap (Russell 1000 Index), Large Cap Value (Russell 1000 Value Index), Large Cap Growth (Russell 1000 Growth Index), Small Cap
(Russell 2000 Index), Small Cap Value (Russell 2000 Value Index), and Small Cap Growth (Russell 2000 Growth Index). World Market Cap represented by Russell 3000 Index, MSCI World ex USA IMI Index, and MSCI
Emerging Markets IMI Index. Russell 3000 Index is used as the proxy for the US market. Frank Russell Company is the source and owner of the trademarks, service marks, and copyrights related to the Russell Indexes. MSCI
data © MSCI 2017, all rights reserved.
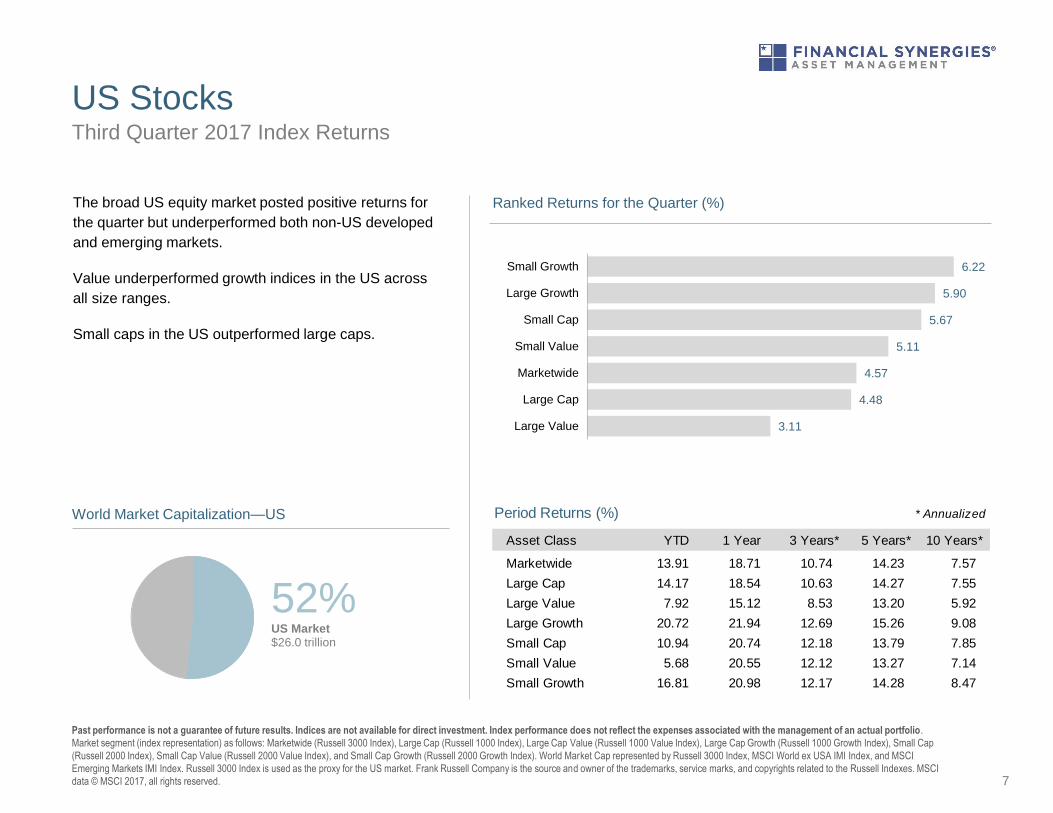
The broad US equity market posted positive returns for
the quarter but underperformed both non-US developed
and emerging markets.
Value underperformed growth indices in the US across
all size ranges.
Small caps in the US outperformed large caps.
World Market Capitalization—US
52%US Market $26.0 trillion
Period Returns (%) * Annualized
Asset Class YTD 1 Year 3 Years** 5 Years** 10 Years**
Marketwide 13.91 18.71 10.74 14.23 7.57
Large Cap 14.17 18.54 10.63 14.27 7.55
Large Value 7.92 15.12 8.53 13.20 5.92
Large Growth 20.72 21.94 12.69 15.26 9.08
Small Cap 10.94 20.74 12.18 13.79 7.85
Small Value 5.68 20.55 12.12 13.27 7.14
Small Growth 16.81 20.98 12.17 14.28 8.47
6.22
5.90
5.67
5.11
4.57
4.48
3.11
Small Growth
Large Growth
Small Cap
Small Value
Marketwide
Large Cap
Large Value
Ranked Returns for the Quarter (%)
International Developed Stocks
8
Third Quarter 2017 Index Returns
Past performance is not a guarantee of future results. Indices are not available for direct investment. Index performance does not reflect the expenses associated with the management of an actual portfolio.
Market segment (index representation) as follows: Large Cap (MSCI World ex USA Index), Small Cap (MSCI World ex USA Small Cap Index), Value (MSCI World ex USA Value Index), and Growth (MSCI World ex USA
Growth). All index returns are net of withholding tax on dividends. World Market Cap represented by Russell 3000 Index, MSCI World ex USA IMI Index, and MSCI Emerging Markets IMI Index. MSCI World ex USA IMI Index is
used as the proxy for the International Developed market. MSCI data © MSCI 2017, all rights reserved. Frank Russell Company is the source and owner of the trademarks, service marks, and copyrights related to the Russell
Indexes.
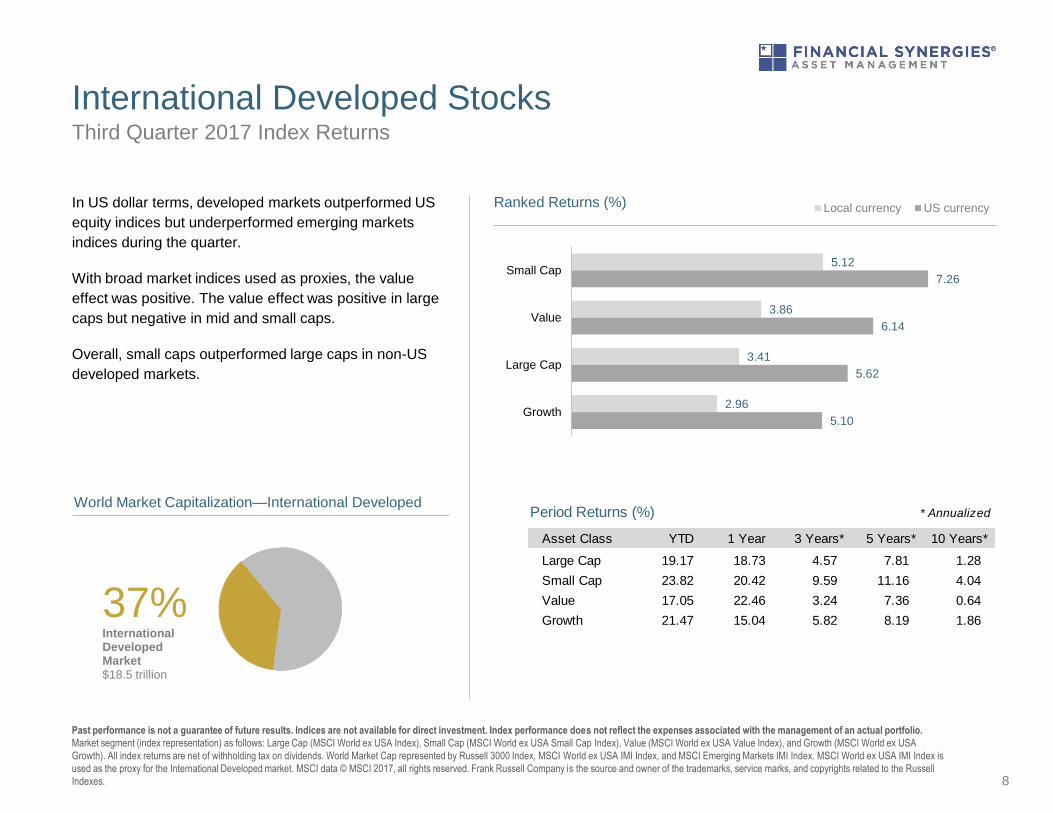
In US dollar terms, developed markets outperformed US
equity indices but underperformed emerging markets
indices during the quarter.
With broad market indices used as proxies, the value
effect was positive. The value effect was positive in large
caps but negative in mid and small caps.
Overall, small caps outperformed large caps in non-US
developed markets.
Period Returns (%) * Annualized
Asset Class YTD 1 Year 3 Years** 5 Years** 10 Years**
Large Cap 19.17 18.73 4.57 7.81 1.28
Small Cap 23.82 20.42 9.59 11.16 4.04
Value 17.05 22.46 3.24 7.36 0.64
Growth 21.47 15.04 5.82 8.19 1.8637%International Developed Market$18.5 trillion
World Market Capitalization—International Developed
5.12
3.86
3.41
2.96
7.26
6.14
5.62
5.10
Small Cap
Value
Large Cap
Growth
Ranked Returns (%) Local currency US currency
Emerging Markets Stocks
9
Third Quarter 2017 Index Returns
Past performance is not a guarantee of future results. Indices are not available for direct investment. Index performance does not reflect the expenses associated with the management of an actual portfolio.
Market segment (index representation) as follows: Large Cap (MSCI Emerging Markets Index), Small Cap (MSCI Emerging Markets Small Cap Index), Value (MSCI Emerging Markets Value Index), and Growth (MSCI
Emerging Markets Growth Index). All index returns are net of withholding tax on dividends. World Market Cap represented by Russell 3000 Index, MSCI World ex USA IMI Index, and MSCI Emerging Markets IMI Index. MSCI
Emerging Markets IMI Index used as the proxy for the emerging market portion of the market. MSCI data © MSCI 2017, all rights reserved. Frank Russell Company is the source and owner of the trademarks, service marks,
and copyrights related to the Russell Indexes.
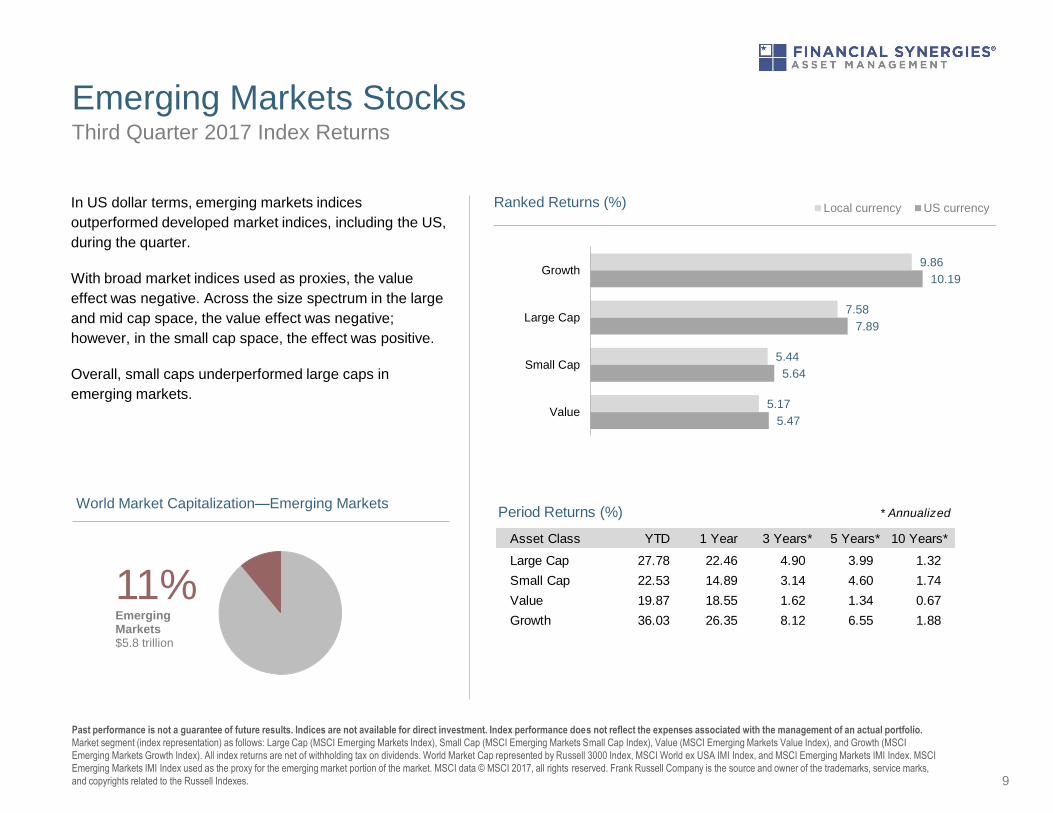
In US dollar terms, emerging markets indices
outperformed developed market indices, including the US,
during the quarter.
With broad market indices used as proxies, the value
effect was negative. Across the size spectrum in the large
and mid cap space, the value effect was negative;
however, in the small cap space, the effect was positive.
Overall, small caps underperformed large caps in
emerging markets.
9.86
7.58
5.44
5.17
10.19
7.89
5.64
5.47
Growth
Large Cap
Small Cap
Value
Ranked Returns (%) Local currency US currency
Period Returns (%) * Annualized
Asset Class YTD 1 Year 3 Years** 5 Years** 10 Years**
Large Cap 27.78 22.46 4.90 3.99 1.32
Small Cap 22.53 14.89 3.14 4.60 1.74
Value 19.87 18.55 1.62 1.34 0.67
Growth 36.03 26.35 8.12 6.55 1.88
11%Emerging Markets$5.8 trillion
World Market Capitalization—Emerging Markets
-1.56
-6.82
-8.77
-12.37
23.78
17.40
17.26
15.59
14.49
9.97
9.75
9.32
9.16
6.69
4.14
3.92
3.39
2.86
2.43
1.99
1.79
1.72
1.19
0.61
Brazil
Russia
Chile
Peru
China
Thailand
Czech Republic
Hungary
Poland
Colombia
UAE
Egypt
South Africa
India
Philippines
Taiwan
Malaysia
Korea
Mexico
Turkey
Indonesia
Qatar
Greece
Pakistan
Ranked Emerging Markets Returns (%)
-8.21
18.36
13.65
10.94
10.21
9.35
8.87
8.72
8.40
7.95
7.52
6.63
5.65
5.08
4.93
4.45
4.37
4.11
3.75
3.41
3.29
2.49
2.09
Norway
Italy
Portugal
Austria
Netherlands
Belgium
Germany
France
Denmark
Canada
Ireland
UK
Sweden
Hong Kong
US
Japan
Spain
Finland
Singapore
Australia
New Zealand
Switzerland
Israel
Ranked Developed Markets Returns (%)
Select Country Performance
10
Past performance is not a guarantee of future results. Indices are not available for direct investment. Index performance does not reflect the expenses associated with the management of an actual portfolio.
Country performance based on respective indices in the MSCI World ex US IMI Index (for developed markets), MSCI USA IMI Index (for US), and MSCI Emerging Markets IMI Index. All returns in USD and net of withholding
tax on dividends. MSCI data © MSCI 2017, all rights reserved. UAE and Qatar have been reclassified as emerging markets by MSCI, effective May 2014.
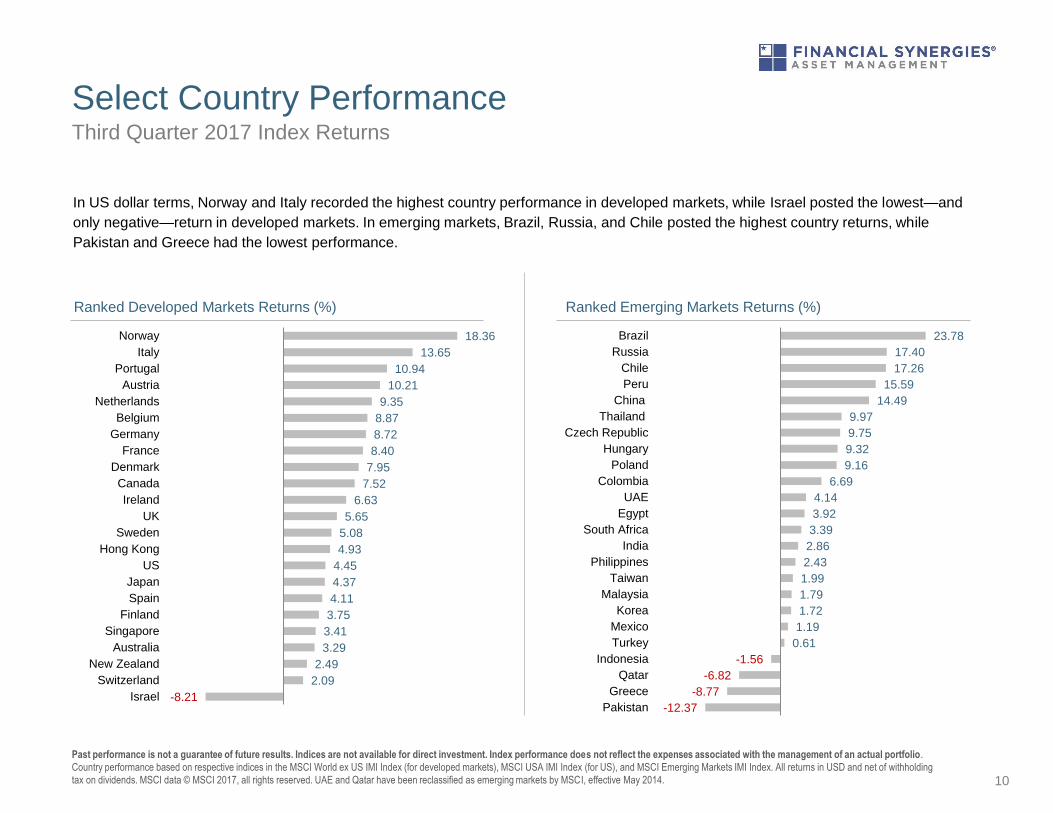
In US dollar terms, Norway and Italy recorded the highest country performance in developed markets, while Israel posted the lowest—and
only negative—return in developed markets. In emerging markets, Brazil, Russia, and Chile posted the highest country returns, while
Pakistan and Greece had the lowest performance.
Third Quarter 2017 Index Returns
-0.10
-0.33
-0.47
-0.61
-0.67
-0.94
-1.04
-1.05
-2.96
4.75
4.14
4.03
4.00
3.13
2.97
2.66
2.06
1.86
1.77
1.66
0.32
Brazilian real (BRC)
Czech koruna (CZK)
Colombian peso (COP)
Chilean peso (CLP)
Hungary forint (HUF)
Russian ruble (RUB)
Egyptian pound (EGP)
Chinese yuan (CNY)
Thailand baht (THB)
Poland new zloty (PLZ)
Malaysian ringgit (MYR)
Taiwanese NT dollar (TWD)
South Korean won (KRW)
Mexican peso (MXP)
Pakistani rupee (PKR)
Peru new sol (PEI)
Philippine peso (PHP)
Turkish new lira (TRY)
Indian rupee (INR)
Indonesia rupiah (IDR)
South African rand (ZAR)
Ranked Emerging Markets (%)
-0.05
-0.18
-1.03
-1.21
-1.27
5.23
3.84
3.65
3.56
3.33
3.29
2.29
1.39
Norwegian krone (NOK)
Canadian dollar (CAD)
Euro (EUR)
Danish krone (DKK)
Swedish krona (SEK)
British pound (GBP)
Australian dollar (AUD)
Singapore dollar (SGD)
Hong Kong dollar (HKD)
Japanese yen (JPY)
Swiss franc (CHF)
Israel shekel (ILS)
New Zealand dollar (NZD)
Ranked Developed Markets (%)
Select Currency Performance vs. US Dollar
11Past performance is not a guarantee of future results. Indices are not available for direct investment. Index performance does not reflect the expenses associated with the management of an actual portfolio.
MSCI data © MSCI 2017, all rights reserved.
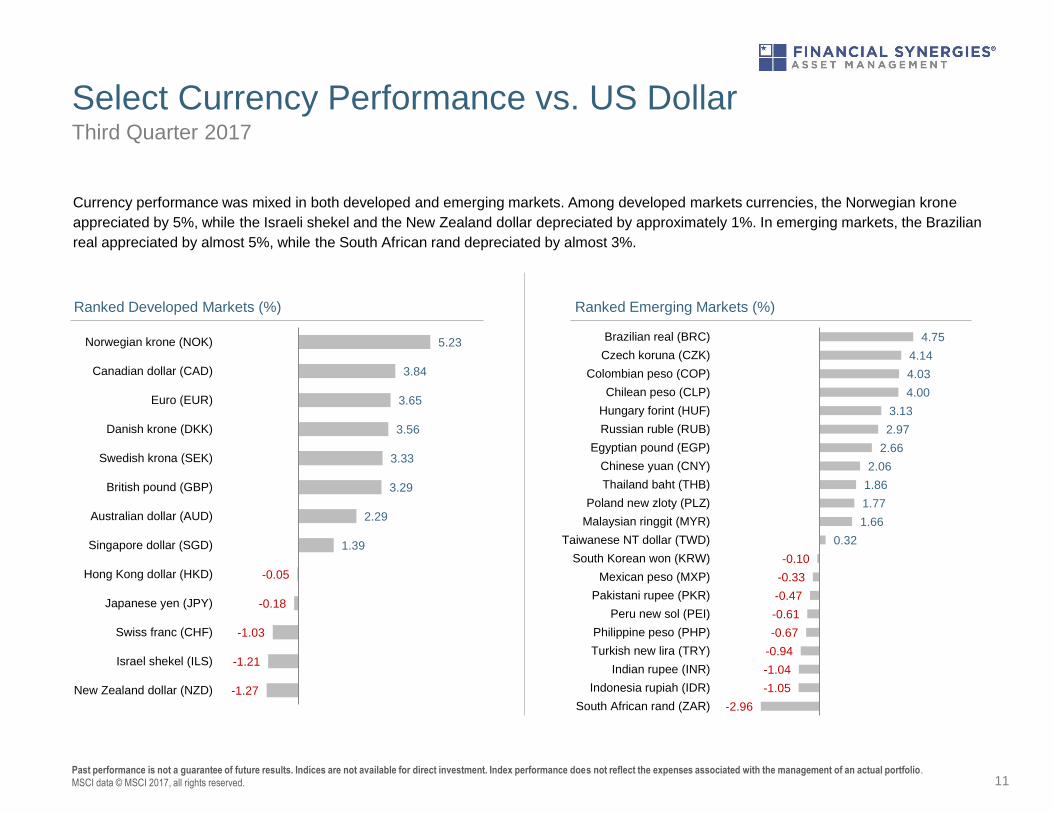
Currency performance was mixed in both developed and emerging markets. Among developed markets currencies, the Norwegian krone
appreciated by 5%, while the Israeli shekel and the New Zealand dollar depreciated by approximately 1%. In emerging markets, the Brazilian
real appreciated by almost 5%, while the South African rand depreciated by almost 3%.
Third Quarter 2017
Real Estate Investment Trusts (REITs)
12
Third Quarter 2017 Index Returns
Past performance is not a guarantee of future results. Indices are not available for direct investment. Index performance does not reflect the expenses associated with the management of an actual portfolio.
Number of REIT stocks and total value based on the two indices. All index returns are net of withholding tax on dividends. Total value of REIT stocks represented by Dow Jones US Select REIT Index and the S&P Global ex US
REIT Index. Dow Jones US Select REIT Index used as proxy for the US market, and S&P Global ex US REIT Index used as proxy for the World ex US market. Dow Jones US Select REIT Index data provided by Dow Jones ©.
S&P Global ex US REIT Index data provided by Standard and Poor's Index Services Group © 2017.
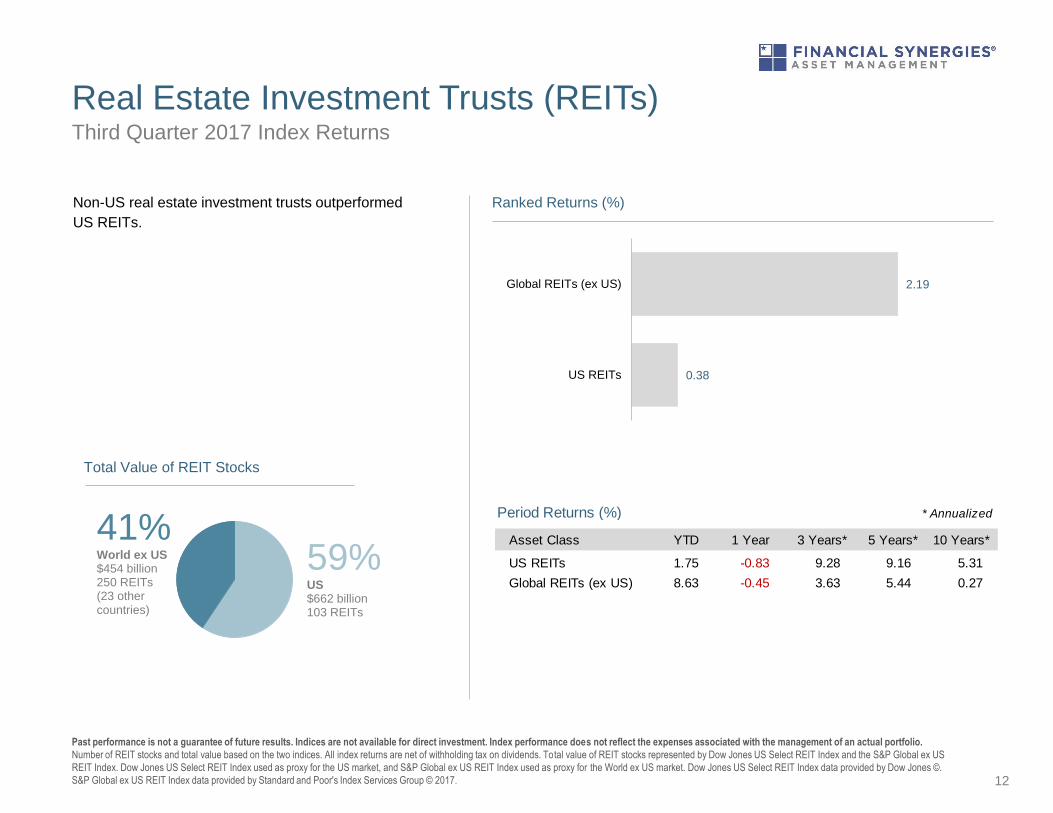
Non-US real estate investment trusts outperformed
US REITs.
2.19
0.38
Global REITs (ex US)
US REITs
Ranked Returns (%)
Period Returns (%) * Annualized
Asset Class YTD 1 Year 3 Years** 5 Years** 10 Years**
US REITs 1.75 -0.83 9.28 9.16 5.31
Global REITs (ex US) 8.63 -0.45 3.63 5.44 0.27
59%US $662 billion 103 REITs
41%World ex US$454 billion 250 REITs (23 other countries)
Total Value of REIT Stocks
Commodities
13
Third Quarter 2017 Index Returns
Past performance is not a guarantee of future results. Index is not available for direct investment. Index performance does not reflect the expenses associated with the management of an actual portfolio.
All index returns are net of withholding tax on dividends. Securities and commodities data provided by Bloomberg.
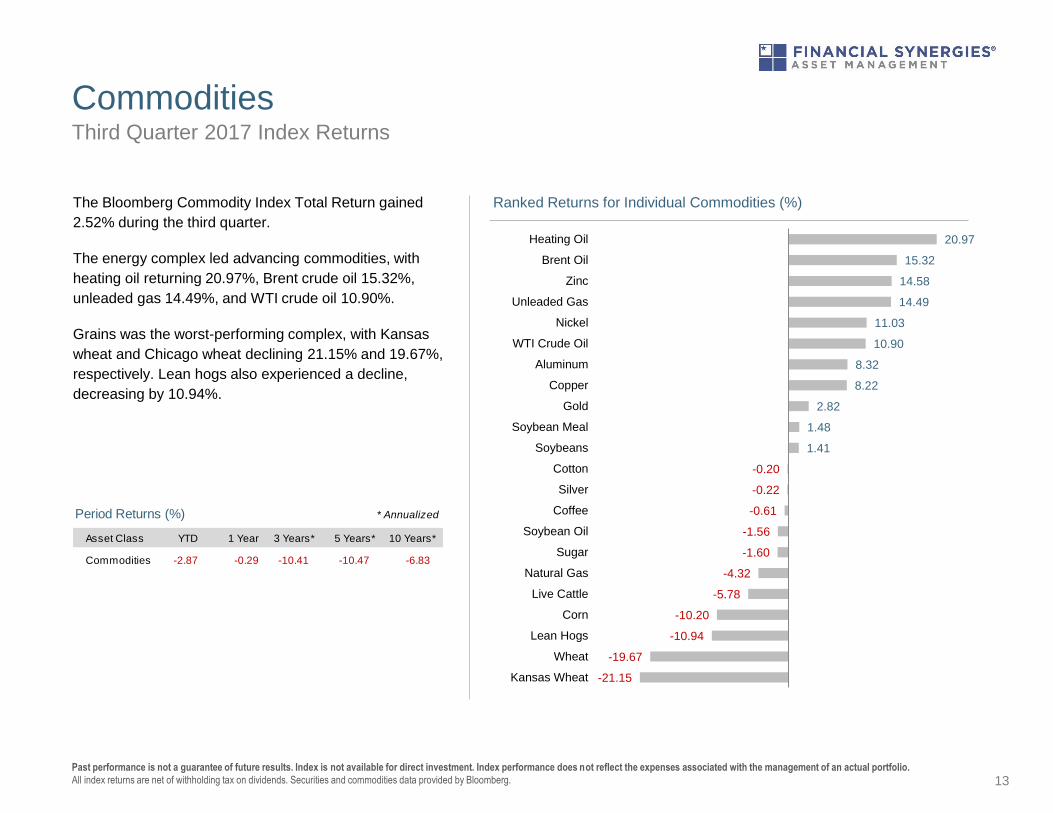
The Bloomberg Commodity Index Total Return gained
2.52% during the third quarter.
The energy complex led advancing commodities, with
heating oil returning 20.97%, Brent crude oil 15.32%,
unleaded gas 14.49%, and WTI crude oil 10.90%.
Grains was the worst-performing complex, with Kansas
wheat and Chicago wheat declining 21.15% and 19.67%,
respectively. Lean hogs also experienced a decline,
decreasing by 10.94%.
Period Returns (%)
Asset Class YTD 1 Year 3 Years** 5 Years** 10 Years**
Commodities -2.87 -0.29 -10.41 -10.47 -6.83
* Annualized
-0.20
-0.22
-0.61
-1.56
-1.60
-4.32
-5.78
-10.20
-10.94
-19.67
-21.15
20.97
15.32
14.58
14.49
11.03
10.90
8.32
8.22
2.82
1.48
1.41
Heating Oil
Brent Oil
Zinc
Unleaded Gas
Nickel
WTI Crude Oil
Aluminum
Copper
Gold
Soybean Meal
Soybeans
Cotton
Silver
Coffee
Soybean Oil
Sugar
Natural Gas
Live Cattle
Corn
Lean Hogs
Wheat
Kansas Wheat
Ranked Returns for Individual Commodities (%)
2.33
2.892.70
3.27
10-Year USTreasury
Municipals AAA-AACorporates
A-BBBCorporates
Bond Yields across Issuers (%)
Fixed Income
14
One basis point equals 0.01%. Past performance is not a guarantee of future results. Indices are not available for direct investment. Index performance does not reflect the expenses associated with the
management of an actual portfolio. Yield curve data from Federal Reserve. State and local bonds are from the S&P National AMT-Free Municipal Bond Index. AAA-AA Corporates represent the Bank of America Merrill Lynch
US Corporates, AA-AAA rated. A-BBB Corporates represent the Bank of America Merrill Lynch US Corporates, BBB-A rated. Bloomberg Barclays data provided by Bloomberg. US long-term bonds, bills, inflation, and fixed
income factor data © Stocks, Bonds, Bills, and Inflation (SBBI) Yearbook™, Ibbotson Associates, Chicago (annually updated work by Roger G. Ibbotson and Rex A. Sinquefield). Citi fixed income indices copyright 2017 by
Citigroup. The BofA Merrill Lynch Indices are used with permission; © 2017 Merrill Lynch, Pierce, Fenner & Smith Incorporated; all rights reserved. Merrill Lynch, Pierce, Fenner & Smith Incorporated is a wholly owned
subsidiary of Bank of America Corporation. The S&P data are provided by Standard & Poor's Index Services Group.
Third Quarter 2017 Index Returns
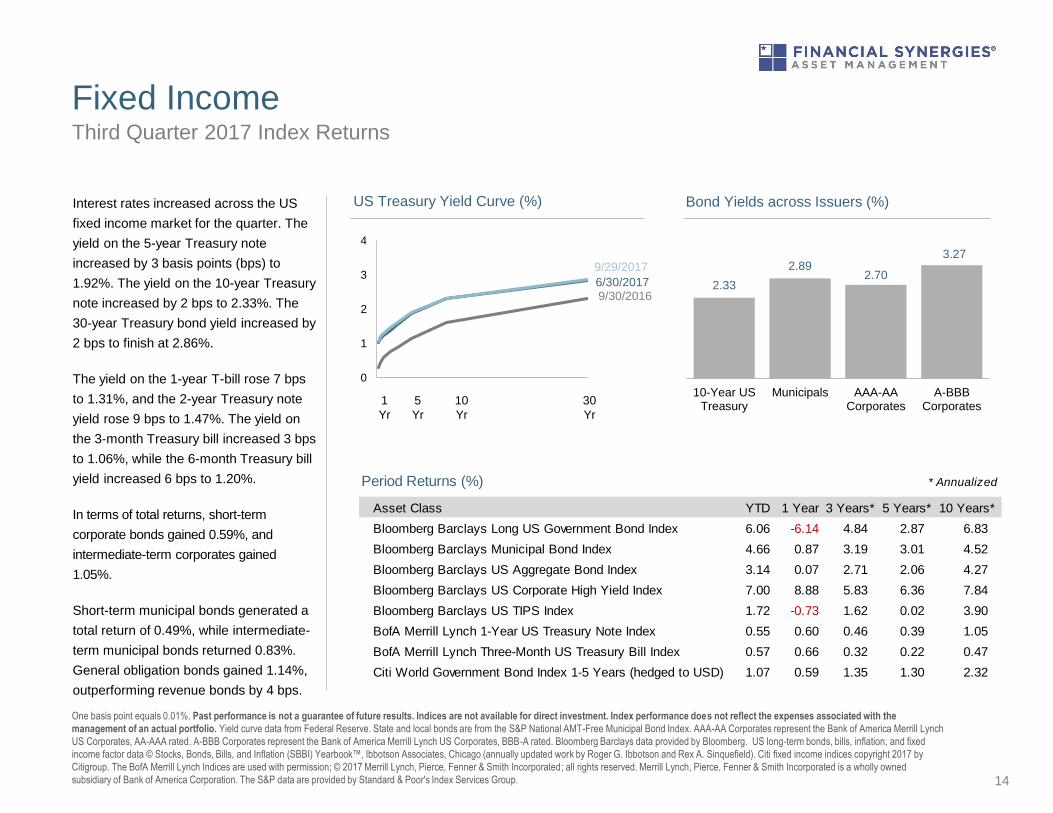
Interest rates increased across the US
fixed income market for the quarter. The
yield on the 5-year Treasury note
increased by 3 basis points (bps) to
1.92%. The yield on the 10-year Treasury
note increased by 2 bps to 2.33%. The
30-year Treasury bond yield increased by
2 bps to finish at 2.86%.
The yield on the 1-year T-bill rose 7 bps
to 1.31%, and the 2-year Treasury note
yield rose 9 bps to 1.47%. The yield on
the 3-month Treasury bill increased 3 bps
to 1.06%, while the 6-month Treasury bill
yield increased 6 bps to 1.20%.
In terms of total returns, short-term
corporate bonds gained 0.59%, and
intermediate-term corporates gained
1.05%.
Short-term municipal bonds generated a
total return of 0.49%, while intermediate-
term municipal bonds returned 0.83%.
General obligation bonds gained 1.14%,
outperforming revenue bonds by 4 bps.
Period Returns (%)
Asset Class YTD 1 Year 3 Years** 5 Years** 10 Years**
Bloomberg Barclays Long US Government Bond Index 6.06 -6.14 4.84 2.87 6.83
Bloomberg Barclays Municipal Bond Index 4.66 0.87 3.19 3.01 4.52
Bloomberg Barclays US Aggregate Bond Index 3.14 0.07 2.71 2.06 4.27
Bloomberg Barclays US Corporate High Yield Index 7.00 8.88 5.83 6.36 7.84
Bloomberg Barclays US TIPS Index 1.72 -0.73 1.62 0.02 3.90
BofA Merrill Lynch 1-Year US Treasury Note Index 0.55 0.60 0.46 0.39 1.05
BofA Merrill Lynch Three-Month US Treasury Bill Index 0.57 0.66 0.32 0.22 0.47
Citi World Government Bond Index 1-5 Years (hedged to USD) 1.07 0.59 1.35 1.30 2.32
* Annualized
9/30/20166/30/2017
9/29/2017
0
1
2
3
4
US Treasury Yield Curve (%)
1
Yr
5
Yr
10
Yr
30
Yr
$0
$20,000
$40,000
$60,000
$80,000
$100,000
12/1988 12/1993 12/1998 12/2003 12/2008 12/2013
Growth of Wealth: The Relationship between Risk and Return
Stock/Bond Mix
Impact of Diversification
15
Third Quarter 2017 Index Returns
1. STDEV (standard deviation) is a measure of the variation or dispersion of a set of data points. Standard deviations are often used to quantify the historical return volatility of a security or portfolio.
Diversification does not eliminate the risk of market loss. Past performance is not a guarantee of future results. Indices are not available for direct investment. Index performance does not reflect expenses associated
with the management of an actual portfolio. Asset allocations and the hypothetical index portfolio returns are for illustrative purposes only and do not represent actual performance. Global Stocks represented by MSCI All
Country World Index (gross div.) and Treasury Bills represented by US One-Month Treasury Bills. Globally diversified allocations rebalanced monthly, no withdrawals. Data © MSCI 2017, all rights reserved. Treasury bills ©
Stocks, Bonds, Bills, and Inflation Yearbook™, Ibbotson Associates, Chicago (annually updated work by Roger G. Ibbotson and Rex A. Sinquefield).
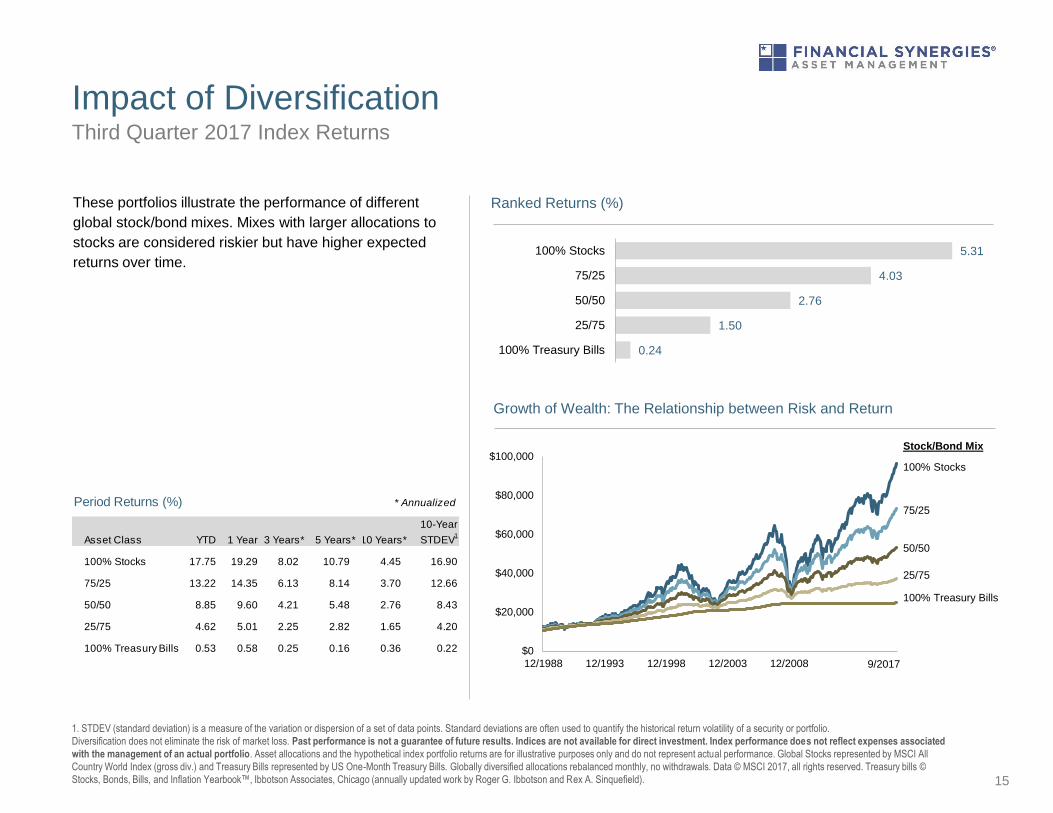
These portfolios illustrate the performance of different
global stock/bond mixes. Mixes with larger allocations to
stocks are considered riskier but have higher expected
returns over time.
0.24
1.50
2.76
4.03
5.31
100% Treasury Bills
25/75
50/50
75/25
100% Stocks
Ranked Returns (%)
Asset Class YTD 1 Year 3 Years** 5 Years**10 Years**
10-Year
STDEV1
100% Stocks 17.75 19.29 8.02 10.79 4.45 16.90
75/25 13.22 14.35 6.13 8.14 3.70 12.66
50/50 8.85 9.60 4.21 5.48 2.76 8.43
25/75 4.62 5.01 2.25 2.82 1.65 4.20
100% Treasury Bills 0.53 0.58 0.25 0.16 0.36 0.22
Period Returns (%) * Annualized
9/2017
100% Stocks
75/25
50/50
25/75
100% Treasury Bills