financial summary for bob smith jill smithfinancial summary for bob smith and jill smith solution:...
TRANSCRIPT

Financial Summaryfor
Bob SmithJill Smith
May 6, 2016
Allan Norman, M.Sc., CFP, CIM
Atlantis Financial Inc48A Alliance BlvdSuite 208Barrie, ON L4M 5K3Phone: 705-726-6884 x 230Fax: 705-726-9884Email: [email protected]
Prepared by:

The calculations and output of the VisionWorks program are for demonstration purposes only. While every effort has been made to ensure that the results are accurate, the planner and Vision Systems Corp. (the owner of the software that produces the plan) expressly disclaim any liability, loss, or risk - financial or otherwise - incurred as a consequence - directly or indirectly - of the use and/or application of any of the ideas, advice, suggestions, or techniques demonstrated.
VisionWorks™ is a registered trademark of Vision Systems Corp.

Table of Contents
Section Page
Prologue 1
Introduction 2
Plan Parties 3
4Family Tree
Goals and Objectives 5
Challenges and Problems 6
Reccomendations 7
To Do List 9
Values 10
Financial Attitudes 11
Net Worth 12
12Net Worth Statement (Current Solution)
Cash Sources 14
14Cash Sources (Income Plan)
Cash Uses 15
15Cash Uses (Spending Plan)
18T1 General Income Tax Return
22Tax Rate Table
25Tax Rate Graph
Compare 27
Private Company Dividends 33
Trust Distributions 35

Table of Contents
Section Page
Net Cash Flow Forecast 36
36Cash Sources and Cash Uses
41Retirement Cash Sources and Uses
44OAS, CPP / QPP, GIS Table
Net Worth Forecast 50
50Net Worth Forecast
Income Assets Forecast 54
54Income Assets Forecast
Estate Summary 59
59Forecasted Estate Value
61Residue for Distribution
Epilogue 62
Appendix A1
A1General Assumptions

Financial Summary for Bob Smith and Jill Smith Solution: Dividends/ Investco/ Solutions
Prologue
Habit 2Begin with the End in Mind
To begin with the end in mind means to start with a clear understanding of your destination. It means to know where you're going so that you better understand where you are now and so that the steps you take are always in the right direction.
By keeping that end clearly in mind, you can make certain that whatever you do on any particular day does not violate the criteria you have defined as supremely important, and that each day of your life contributes in a meaningful way to the vision you have of your life as a whole.
Stephen R. CoveyThe Seven Habits of Highly Effective PeopleSimon & Schuster, 1989.
Prepared by Allan Norman, M.Sc., CFP, CIM - 1 - May 6, 2016

Financial Summary for Bob Smith and Jill Smith
Introduction
Solution: Dividends/ Investco/ Solutions
The only purpose of planning is to clarify your vision of life and discover how to act effectively to achieve that vision.
To do this, we will create your life plan. Because you will be involved in the planning process, you will learn the implications of different decisions.
Through Atlantis Financial you have a powerful new technology at your disposal. You have discovered a new way to make the most informed decisions possible in the future. As your life unfolds, you will face new choices. You will be able to model them and discover their long-term implications. You will make mistakes on the software's practise field, rather than making costly and irreversible mistakes in real life.
We all have to manage change. By using the software as a decision-making model, you will master change. You will have a greater sense of control. You will be more satisfied with your new decisions and feel more fulfilled. And most importantly, you will easily recognize opportunities that will help you achieve your vision. These are the lasting benefits of life planning.
Prepared by Allan Norman, M.Sc., CFP, CIM - 2 - May 6, 2016
Financial Summary for Bob Smith and Jill Smith
Plan Parties
Solution: Dividends/ Investco/ Solutions
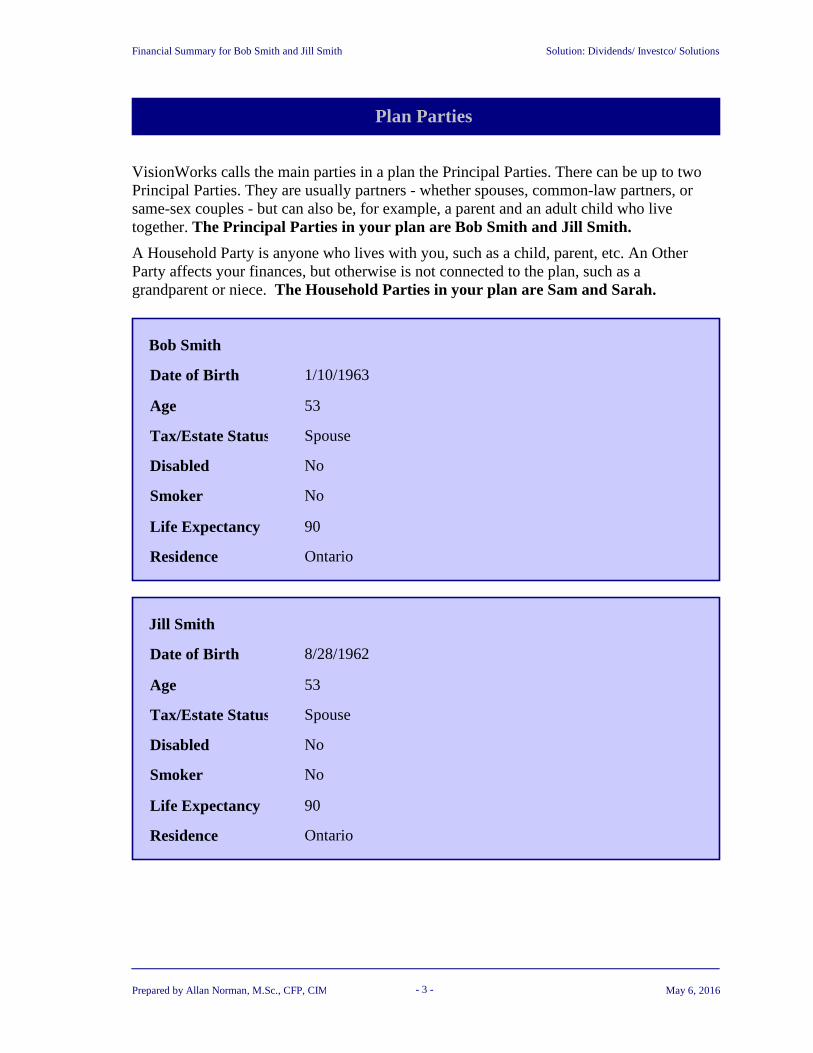
VisionWorks calls the main parties in a plan the Principal Parties. There can be up to two Principal Parties. They are usually partners - whether spouses, common-law partners, or same-sex couples - but can also be, for example, a parent and an adult child who live together. The Principal Parties in your plan are Bob Smith and Jill Smith.
A Household Party is anyone who lives with you, such as a child, parent, etc. An Other Party affects your finances, but otherwise is not connected to the plan, such as a grandparent or niece. The Household Parties in your plan are Sam and Sarah.
Bob Smith
Date of Birth 1/10/1963
Age 53
Tax/Estate Status Spouse
Disabled No
Smoker No
Life Expectancy 90
Residence Ontario
Jill Smith
Date of Birth 8/28/1962
Age 53
Tax/Estate Status Spouse
Disabled No
Smoker No
Life Expectancy 90
Residence Ontario
Prepared by Allan Norman, M.Sc., CFP, CIM - 3 - May 6, 2016

Financial Summary for Bob Smith and Jill Smith
Family Tree
Solution: Dividends/ Investco/ Solutions
Bob1/10/1963
Jill8/28/1962
Sam4/15/1994
Sarah3/6/1996
Prepared by Allan Norman, M.Sc., CFP, CIM - 4 - May 6, 2016

Financial Summary for Bob Smith and Jill Smith Solution: Dividends/ Investco/ Solutions
Goals and Objectives
Goals
• He would like to be in a position to retire at age 61 (End of December 2024)
• She would like to retire today but is prepared to work until she turns 62 (August 2024)
• Pay for their children's university education and help them with their first home
• Home renovations; three bathrooms, basement, kitchen, sprinkler system and paved drive
• In retirement she would like to be in Florida 6 months of the year, he would prefer just a few weeks.
• In retirement they would like to fund one family vacation a year that would include children and future grand children
• The would like to leave their children a minimum inheritance of $500,000 each
• Ultimately, they don't want to worry about money and they want to have enough so they can have and do the things they want when they want.
They do not want to include the potential sale of his business or any possible inheritances in their plan
Objectives
• Accumulate $1 million in retirement savings by the time they are age 60.
• Pay off their $350,000 debt
• Contribute $25,000/child/year to get them through university debt free
• Set aside $25,000 - $50,000 for each child for a down payment on their first house (optional).
• Complete a home renovation project each year for the next 5 years. Master bath $10,000; basement and bath $15,000, Sprinkler system $10,000, Driveway $10,000, Kitchen $20,000. He would like to do most of the work himself.
• An after tax retirement income of $70,000/yr inflated at 3%
• At age 75 or 80 reduce spending to $60,000/yr after tax
Prepared by Allan Norman, M.Sc., CFP, CIM - 5 - May 6, 2016

Financial Summary for Bob Smith and Jill Smith Solution: Dividends/ Investco/ Solutions
Challenges and Problems
Challenges
• As a business owner he made very little money when their children where young so they did not save for their children's education
• In the past few years his income has increased and now they are not eligible for government education grants, and the children are not eligible for student loans.
• The children have not been able to get summer jobs
• They are using their line of credit to fund education expenses so the debt is increasing rather than decreasing.
• They have maximized their RRSP and TFSA accounts and they are not sure where to save their money so they aren't tempted to spend it.
• He is losing a lot of his income to tax which means less money for investing, paying down debt, and helping the kids with their education.
• She is not sure she able to continue working for another 8 years.
• With the debt and their kids in University, they are concerned about their financial well-being and are afraid to spend money on. This has affected their lifestyle and they have become home bodies
Problems
• They owe $350,000 and they anticipate having to borrow another $100,000 to pay for their children's education.
• He makes $190,000 and pays about $50,000 in tax.
• She earns $42,000/yr. and wonders where it all goes because she doesn't pay household bills.
• Like most couples, they don't know where all of their money is going. If this “leaked” money was captured and saved, they would have an additional $388,000 by the time they retire in 2024.
• If they save all of the money that is leaking from their household budget over their lifetime they would have an additional $2.5 million.
• When the last surviving spouse passes away they will lose $1.1 million (future $) or $392,000 (current $) of what they have built over their life time to tax.
Prepared by Allan Norman, M.Sc., CFP, CIM - 6 - May 6, 2016

Financial Summary for Bob Smith and Jill Smith Solution: Dividends/ Investco/ Solutions
Reccomendations
1. Recommendations
• Set up a family trust where all family members are beneficiaries. Pay enough to the family trust to cover the children's university costs. Then pay the children a dividend to pay their tuition.
• Keep the family trust until the children are established and then review if it makes sense to keep it. This may be used to help the kids with a down payment for a house?
• Reduce his income to what they need to run the household, $80,000. Continue to pay her $10,000.
• Set up a holding company to own shares in his OPCO. Send $85,000 in dividends over to the holding company for long term investments
• We will follow an all equity passive investment strategy with low distributions in the HOLDCO, rather than corporate class funds. Corporate class funds were considered, as in theory they don't pay taxable distributions and taxes are deferred into the future, however, in our experience corporate class funds can pay distributions and their fee is slightly higher so we have decided not to use them.
• Stop making RRSP contributions
• Continue to deposit $11,000/yr (maximum) to the TFSA for life.
• Once retired review income needs and sources. In the current projection he draws $20,000/yr in dividends and she draws $10,000/yr. The income shortage is made up with RRIF payments. The aim is to keep their taxable income just below the next tax bracket. Retirement income needs should be reviewed each December or January to anticipate taxable income for the upcoming year.
• Although the debt appears to be large it is not an issue and should not be the measure of financial well-being. If they continue to pay $24,000/year toward the mortgage it will be paid off by the time he wants to be in a position to retire. They should continue to pay interest only on the 2 loans where the interest is tax deductible. Once the mortgage is paid off then they can continue paying $24,000 a year until all loans are paid off. Note that the projections show that their net worth will be higher if they do not pay off the two smaller loans so again, debt should not scare them. There is a whole life policy in place that will pay off most of the loans and they are accumulating money in a TFSA which can be withdrawn at any time tax free to pay down the loan.
• They have adequate life insurance. He has $750,000 of 10yrt and $130,000 whole life premium which we recommend that he continues to pay for life. She has $250,000 of
Prepared by Allan Norman, M.Sc., CFP, CIM - 7 - May 6, 2016

Financial Summary for Bob Smith and Jill Smith Solution: Dividends/ Investco/ Solutions
Reccomendations
10yrt and $50,000 of employee insurance.
• He has disability insurance and she has coverage at work plus $50,000 return of premium CI policy. They have both agreed that if he died or became disabled they/she would sell the home, pay off the debt and move to a smaller house.
• At some point in the future it is going to have to be decided what to do with the assets building in the holding company. Estate freeze, buy life insurance, or draw it down faster.
2. Investment Allocation Recommendation
It is recommended to follow an asset dedication strategy rather than an asset allocation strategy.
• An all equity portfolio until 5 years prior to retirement. Passive funds 30% Canada, 30% US, 30% international, 10% REIT.
• 5 years prior to retirement begin to add bonds to the portfolio. For example if we need $40,000/year from an investment account then 5 years prior to retirement move 1 year's ($40,000) income to bonds. Repeat this each year so that when retirement happens you have 5 years of income in bonds or cash. In retirement you will draw money from the bonds and replace that with money from the equities only if equities are up. If investment markets are down we have a 5 year cash bridge to wait until markets recover.
Prepared by Allan Norman, M.Sc., CFP, CIM - 8 - May 6, 2016
To Do List
Financial Summary for Bob Smith and Jill Smith Solution: Dividends/ Investco/ Solutions
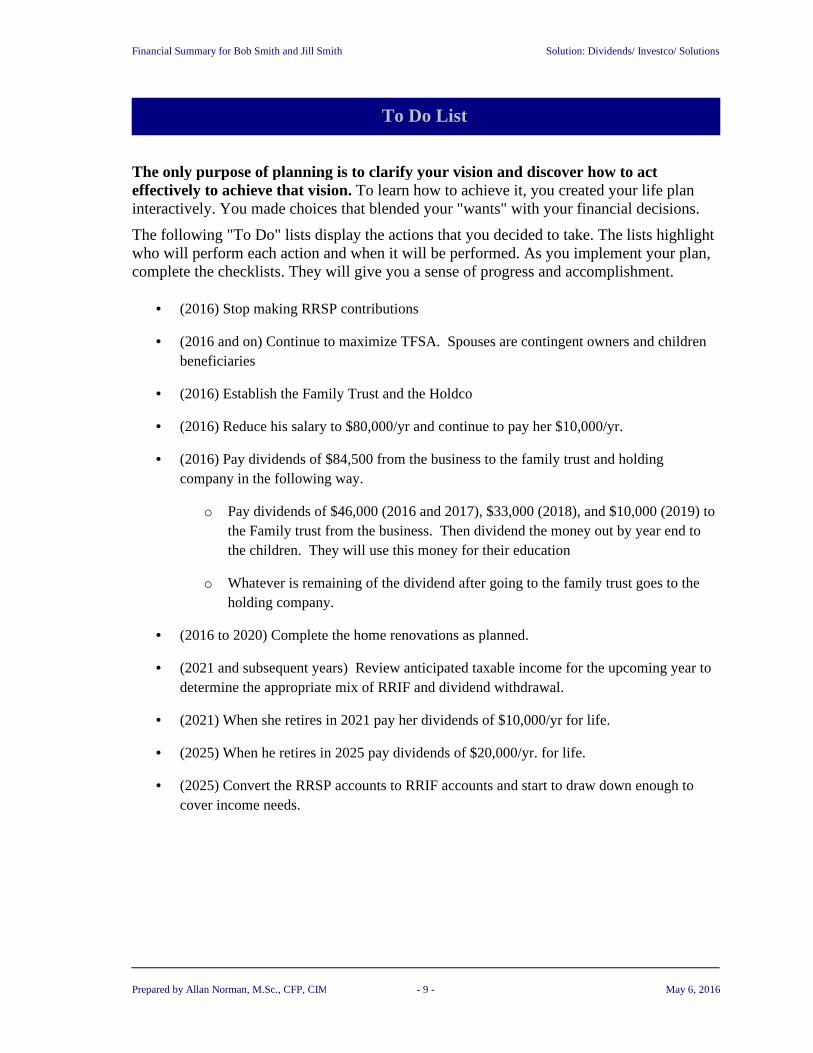
The only purpose of planning is to clarify your vision and discover how to act effectively to achieve that vision. To learn how to achieve it, you created your life plan interactively. You made choices that blended your "wants" with your financial decisions.
The following "To Do" lists display the actions that you decided to take. The lists highlight who will perform each action and when it will be performed. As you implement your plan, complete the checklists. They will give you a sense of progress and accomplishment.
• (2016) Stop making RRSP contributions
• (2016 and on) Continue to maximize TFSA. Spouses are contingent owners and children beneficiaries
• (2016) Establish the Family Trust and the Holdco
• (2016) Reduce his salary to $80,000/yr and continue to pay her $10,000/yr.
• (2016) Pay dividends of $84,500 from the business to the family trust and holding company in the following way.
o Pay dividends of $46,000 (2016 and 2017), $33,000 (2018), and $10,000 (2019) to the Family trust from the business. Then dividend the money out by year end to the children. They will use this money for their education
o Whatever is remaining of the dividend after going to the family trust goes to the holding company.
• (2016 to 2020) Complete the home renovations as planned.
• (2021 and subsequent years) Review anticipated taxable income for the upcoming year to determine the appropriate mix of RRIF and dividend withdrawal.
• (2021) When she retires in 2021 pay her dividends of $10,000/yr for life.
• (2025) When he retires in 2025 pay dividends of $20,000/yr. for life.
• (2025) Convert the RRSP accounts to RRIF accounts and start to draw down enough to cover income needs.
Prepared by Allan Norman, M.Sc., CFP, CIM - 9 - May 6, 2016

Financial Summary for Bob Smith and Jill Smith
Values
Solution: Dividends/ Investco/ Solutions
Your vision is based to a great extent on what means the most to you. Our values largely determine what we want. We base many important decisions on them.
The table below presents your most important family values.
Value Definition
Health To be healthy and lead a healthy lifestyle.
Enjoyment To enjoy life and have fun.
Family To contribute to family members.
Friendship To have close companionship.
Activity To be fully occupied at all times.
Self-Development To be the best that I can be.
Academics
Academics
Academics
Academics
Achievement
Achievement
Achievement
Achievement
Activity
Activity
Activity
Activity
Advancement
Advancement
Advancement
Advancement
Adventure
Adventure
Adventure
Adventure
Enjoyment
Enjoyment
Enjoyment
Enjoyment
Expertise
Expertise
Expertise
Expertise
Family
Family
Family
Family
Friendship
Friendship
Friendship
Friendship
Health
Health
Health
Health
Independence
Independence
Independence
Independence
Location
Location
Location
Location
Power
Power
Power
Power
Prestige
Prestige
Prestige
Prestige
Routine
Routine
Routine
Routine
Security
Security
Security
Security
Self-Development
Self-Development
Self-Development
Self-Development
Self-Realization
Self-Realization
Self-Realization
Self-Realization
Social Service
Social Service
Social Service
Social Service
Wealth
Wealth
Wealth
Wealth
VeryImportant
QuiteImportant
Important
SomewhatImportant
NotImportant
Values Graph
Prepared by Allan Norman, M.Sc., CFP, CIM - 10 - May 6, 2016

Financial Summary for Bob Smith and Jill Smith
Financial Attitudes
Solution: Dividends/ Investco/ Solutions
We base many everyday decisions on our financial attitudes. They are important for three reasons. First, you will act on a life plan that suits your attitudes because you feel comfortable with it. Second, your attitudes suggest what you should change. What suits you best? Work? Reduced spending? More risk? Third, we prefer to base our life plan on our attitudes. We feel that it will endure, because it is under our direct control.
The table below shows the results of the financial attitudes exercise that you completed.
AttitudeBob Jill
Low Avge High Low Avge High
Accountability 43.8 66.7 77.8 43.8 50.0 77.8
Work 54.8 75.0 86.0 50.0 54.8 86.0
Spending 50.0 56.5 80.5 33.3 56.5 80.5
Appearance 25.0 41.0 75.3 41.0 41.7 75.3
Contentment 41.7 58.6 89.4 33.3 58.6 89.4
Risk 58.3 59.0 76.0 41.7 59.0 76.0
Trust 28.2 41.7 62.8 28.2 50.0 62.8
Participation 50.0 69.0 86.8 41.7 69.0 86.8
Learning 61.3 82.9 91.7 58.3 61.3 82.9
Financial attitude scores are compared to a national survey, then placed in one of three columns.Average (middle column): It offers no meaningful insight. The low and high boundary scores for the Average Range, which are displayed in blue numbers in the grey columns, are from the national survey.Low (left column): It indicates that the majority of the population would score higher than you.High (right column): It indicates that the majority of the population would score lower than you.
DefinitionAttitude
Willingness to accept responsibility for future results.Accountability
Willingness to achieve your wants by creating wealth through work.Work
Tendency to spend rather than save.Spending
Concern about how one appears to others.Appearance
Satisfaction with your lifestyle and a willingness to defer, alter, or eliminate wants.Contentment
Willingness to accept unpredictable outcomes.Risk
Willingness to delegate responsibilities to others.Trust
Tendency to be involved in the management of your finances and portfolio.Participation
Tendency to learn from past financial decisions and reflect on them when makingcurrent ones.
Learning
Prepared by Allan Norman, M.Sc., CFP, CIM - 11 - May 6, 2016

Financial Summary for Bob Smith and Jill Smith
Net Worth
Net Worth Statement
Solution: Dividends/ Investco/ Solutions
Net worth is the value of what you own less the value of what you owe - that is, your assets less your liabilities. Your net worth includes your possessions such as your home and your income assets such as your portfolios and RRSPs. The Net Worth Statement below is based on amounts that you estimated. It is the starting point for your life plan.
Bob Jill TotalAssets and Liabilities
Dividends/ Investco/ Solutions (Current Values)
Assets
Homes Our house $544,500 $5,500
Subtotal $544,500 $5,500 $550,000
Vehicles 2013 Car $9,000 $1,000
2015 Car $15,000 $15,000
Subtotal $24,000 $16,000 $40,000
Non-Reg. Portfolios SM Non-Reg. Portfolio $100,659
Subtotal $100,659 $100,659
Other Accounts/Plans TFSA $35,254
TFSA $35,258
Subtotal $35,258 $35,254 $70,512
Pension Plans RRSP - Atlantis $30,605
RRSP $254,323
Subtotal $254,323 $30,605 $284,928
Private Companies INVESTCO: Common A $146,049
INVESTCO: Common C $146,049
Subtotal $146,049 $146,049 $292,098
Life Insurance Whole Life - Sun Life $36,651
Subtotal $36,651 $36,651
$1,141,440AssetsTotal $233,408 $1,374,848
Liabilities
Homes Our house - Line of credit ($179,542) ($1,814)
Prepared by Allan Norman, M.Sc., CFP, CIM - 12 - May 6, 2016

Financial Summary for Bob Smith and Jill Smith
Net Worth
Solution: Dividends/ Investco/ Solutions
Bob Jill TotalAssets and Liabilities
LiabilitiesSubtotal ($179,542) ($1,814) ($181,356)
Vehicles 2015 Car - Finance ($9,305) ($9,305)
Subtotal ($9,305) ($9,305) ($18,610)
Other Business line of credit ($68,524)
SM Line of credit ($113,588)
Subtotal ($182,112) ($182,112)
$370,959LiabilitiesTotal $11,119 $382,078
Net Worth $770,481 $222,289 $992,770
Category PercentAmount
Total Assets Chart for 2016
Homes $550,000 40.00Vehicles $40,000 2.91Non-Reg. Portfolios $100,659 7.32Other Accounts/Plans $70,512 5.13Pension Plans $284,928 20.72Private Companies $292,098 21.25Life Insurance $36,651 2.67
Total $1,374,848 100.00
Trust Bob Jill Total
Norman Family Trust 2014 $0 $0 $0
Prepared by Allan Norman, M.Sc., CFP, CIM - 13 - May 6, 2016
Financial Summary for Bob Smith and Jill Smith
Cash Sources
Cash Sources (Income Plan)
Solution: Dividends/ Investco/ Solutions
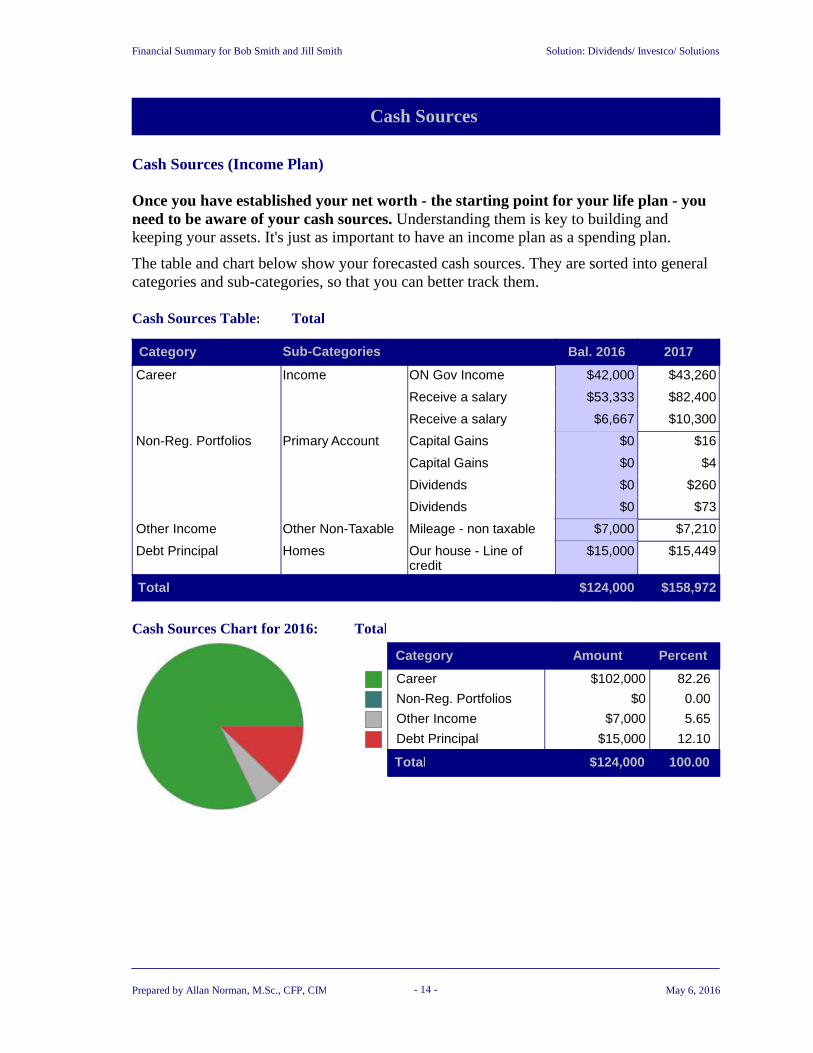
Once you have established your net worth - the starting point for your life plan - you need to be aware of your cash sources. Understanding them is key to building and keeping your assets. It's just as important to have an income plan as a spending plan.
The table and chart below show your forecasted cash sources. They are sorted into general categories and sub-categories, so that you can better track them.
Category Sub-Categories Bal. 2016 2017
TotalCash Sources Table:
IncomeCareer ON Gov Income $42,000 $43,260
Receive a salary $53,333 $82,400
Receive a salary $6,667 $10,300
Primary AccountNon-Reg. Portfolios Capital Gains $0 $16
Capital Gains $0 $4
Dividends $0 $260
Dividends $0 $73
Other Non-TaxableOther Income Mileage - non taxable $7,000 $7,210
HomesDebt Principal Our house - Line ofcredit
$15,000 $15,449
Total $124,000 $158,972
Category PercentAmount
TotalCash Sources Chart for 2016:
Career $102,000 82.26
Non-Reg. Portfolios $0 0.00
Other Income $7,000 5.65
Debt Principal $15,000 12.10
Total $124,000 100.00
Prepared by Allan Norman, M.Sc., CFP, CIM - 14 - May 6, 2016

Financial Summary for Bob Smith and Jill Smith
Cash Uses
Cash Uses (Spending Plan)
Solution: Dividends/ Investco/ Solutions
Once you have established your net worth and cash sources, you need to be aware of your cash uses. Understanding them is key to building and keeping assets. If you intend to achieve your vision, you should monitor your cash uses - your spending plan.
The table and chart below show your forecasted cash uses. They are sorted into general categories and sub-categories, so that you can better track them.
Category Sub-Categories Bal. 2016 2017
Cash Uses Table: Total
Operating Expenses $8,267 $12,772Our houseHomes
Property Taxes $2,667 $4,120
Renovations $10,000 $15,450
General entertainment $1,334 $2,060EntertainmentLifestyle Expenses
Alcohol $333 $515General Expenses
Clothing $1,733 $2,678
Groceries $5,600 $8,652
kids $666 $1,030
Miscellaneous Cash $2,200 $3,399
Personal $333 $515
Travel to a hot, busy allinclusive beach resortwith the kids for 2weeks every MarchBreak
$3,333 $5,150Vacations
2013 Car $6,841 $10,570Vehicles
2015 Car $2,000 $3,090
$3,296 $5,148CPP/QPPContributions
Career
$637 $818EI premiums
Pay union orprofessional dues
$167 $257Expenses
TFSA $5,500 $5,500ContributionsOther Accounts/Plans
TFSA $5,500 $5,500
OPSU $600 $927ContributionsRRSP / Pension Plans
Health and dental policy $1,833 $2,832PremiumsInsurance
Tax-Free C.I. - RBC $400 $600
Prepared by Allan Norman, M.Sc., CFP, CIM - 15 - May 6, 2016
Financial Summary for Bob Smith and Jill Smith
Cash Uses
Solution: Dividends/ Investco/ Solutions
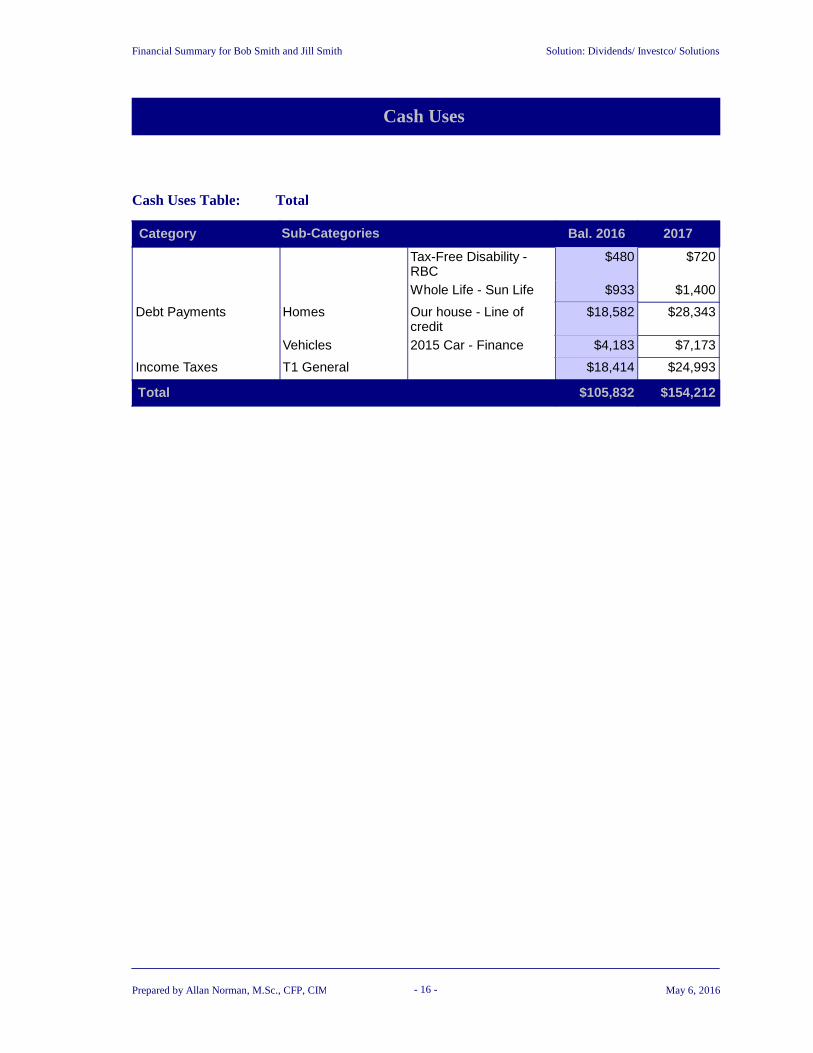
Category Sub-Categories Bal. 2016 2017
Cash Uses Table: Total
Tax-Free Disability -RBC
$480 $720
Whole Life - Sun Life $933 $1,400
Our house - Line ofcredit
$18,582 $28,343HomesDebt Payments
2015 Car - Finance $4,183 $7,173Vehicles
$18,414 $24,993T1 GeneralIncome Taxes
Total $105,832 $154,212
Prepared by Allan Norman, M.Sc., CFP, CIM - 16 - May 6, 2016

Financial Summary for Bob Smith and Jill Smith
Cash Uses
Solution: Dividends/ Investco/ Solutions
Category PercentAmount
Cash Uses Chart for 2016:
$20,934 19.78Homes
$24,373 23.03Lifestyle Expenses
$4,100 3.87Career
$11,000 10.39Other Accounts/Plans
$600 0.57RRSP / Pension Plans
$3,646 3.45Insurance
$22,765 21.51Debt Payments
$18,414 17.40Income Taxes
Total $105,832 100.00
Category PercentAmount
Cash Uses Chart for 2017:
$32,342 20.97Homes
$37,659 24.42Lifestyle Expenses
$6,223 4.04Career
$11,000 7.13Other Accounts/Plans
$927 0.60RRSP / Pension Plans
$5,552 3.60Insurance
$35,516 23.03Debt Payments
$24,993 16.21Income Taxes
Total $154,212 100.00
Prepared by Allan Norman, M.Sc., CFP, CIM - 17 - May 6, 2016
Financial Summary for Bob Smith and Jill Smith
Cash Uses
Estimated Income Taxes Payable
Solution: Dividends/ Investco/ Solutions
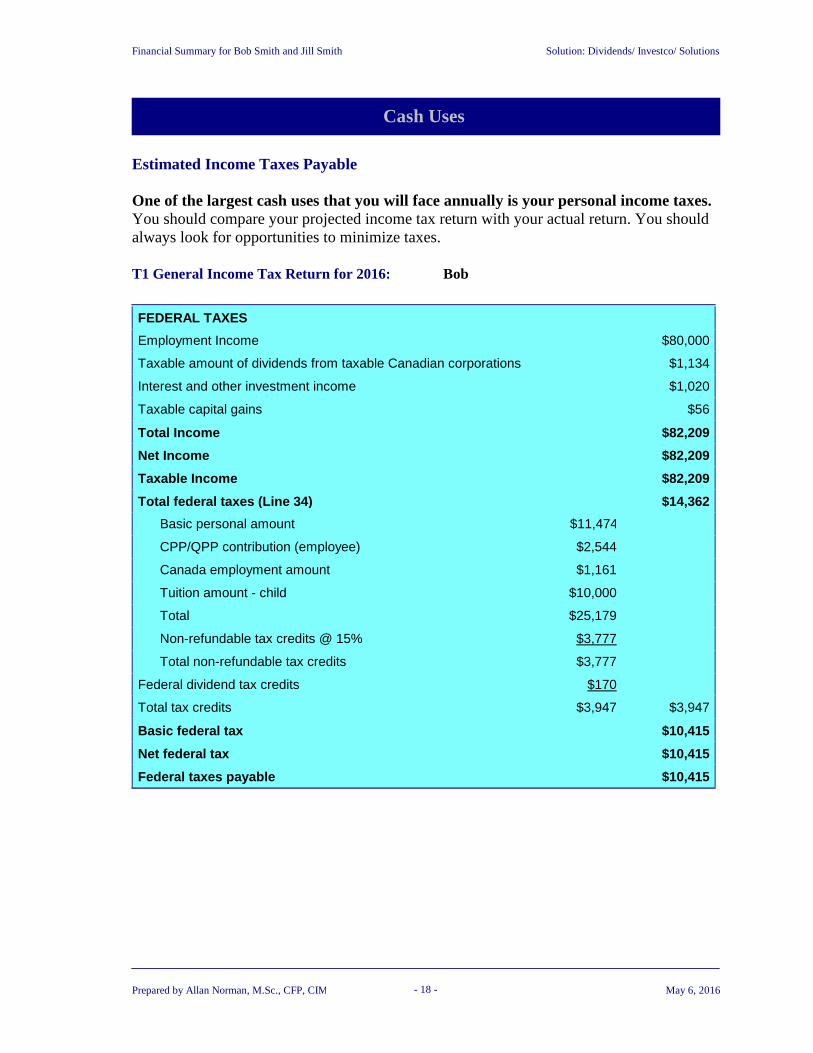
One of the largest cash uses that you will face annually is your personal income taxes. You should compare your projected income tax return with your actual return. You should always look for opportunities to minimize taxes.
T1 General Income Tax Return for 2016: Bob
FEDERAL TAXES
Employment Income $80,000
Taxable amount of dividends from taxable Canadian corporations $1,134
Interest and other investment income $1,020
Taxable capital gains $56
Total Income $82,209
Net Income $82,209
Taxable Income $82,209
Total federal taxes (Line 34) $14,362
Basic personal amount $11,474
CPP/QPP contribution (employee) $2,544
Canada employment amount $1,161
Tuition amount - child $10,000
Total $25,179
Non-refundable tax credits @ 15% $3,777
Total non-refundable tax credits $3,777
Federal dividend tax credits $170
Total tax credits $3,947 $3,947
Basic federal tax $10,415
Net federal tax $10,415
Federal taxes payable $10,415
Prepared by Allan Norman, M.Sc., CFP, CIM - 18 - May 6, 2016

Financial Summary for Bob Smith and Jill Smith
Cash Uses
Solution: Dividends/ Investco/ Solutions
T1 General Income Tax Return for 2016: Bob
PROVINCIAL TAXES
Ontario tax on taxable income $5,819
Basic personal amount $10,011
CPP/QPP contribution (employee) $2,544
Tuition amount - child $10,000
Total $22,555
Total non-refundable tax credits @ 5.05% $1,139
Ontario non-refundable tax credits $1,139
Ontario dividend tax credit $113
Ontario Health Premium $750
Ontario tax $5,317
TAXES PAYABLE $15,732
Prepared by Allan Norman, M.Sc., CFP, CIM - 19 - May 6, 2016
Financial Summary for Bob Smith and Jill Smith
Cash Uses
Solution: Dividends/ Investco/ Solutions
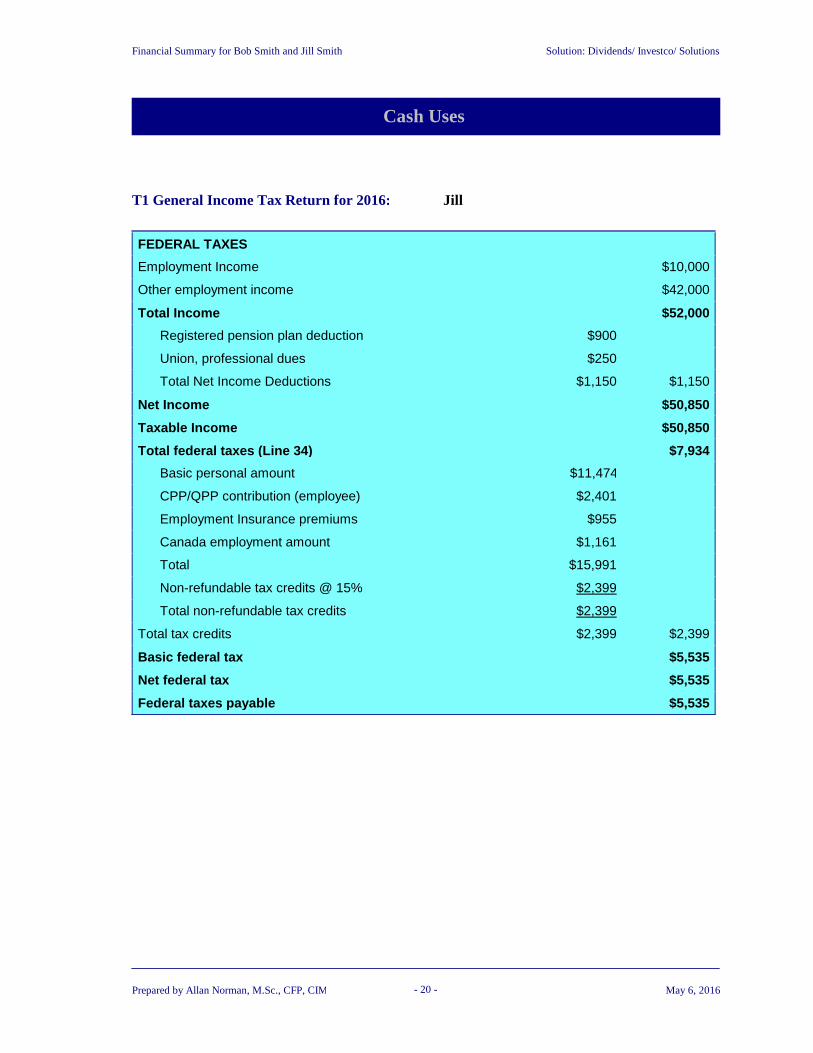
T1 General Income Tax Return for 2016: Jill
FEDERAL TAXES
Employment Income $10,000
Other employment income $42,000
Total Income $52,000
Registered pension plan deduction $900
Union, professional dues $250
Total Net Income Deductions $1,150 $1,150
Net Income $50,850
Taxable Income $50,850
Total federal taxes (Line 34) $7,934
Basic personal amount $11,474
CPP/QPP contribution (employee) $2,401
Employment Insurance premiums $955
Canada employment amount $1,161
Total $15,991
Non-refundable tax credits @ 15% $2,399
Total non-refundable tax credits $2,399
Total tax credits $2,399 $2,399
Basic federal tax $5,535
Net federal tax $5,535
Federal taxes payable $5,535
Prepared by Allan Norman, M.Sc., CFP, CIM - 20 - May 6, 2016

Financial Summary for Bob Smith and Jill Smith
Cash Uses
Solution: Dividends/ Investco/ Solutions
T1 General Income Tax Return for 2016: Jill
PROVINCIAL TAXES
Ontario tax on taxable income $2,950
Basic personal amount $10,011
CPP/QPP contribution (employee) $2,401
Employment Insurance premiums $955
Total $13,367
Total non-refundable tax credits @ 5.05% $675
Ontario non-refundable tax credits $675
Ontario Health Premium $600
Ontario tax $2,875
TAXES PAYABLE $8,410
Prepared by Allan Norman, M.Sc., CFP, CIM - 21 - May 6, 2016

Financial Summary for Bob Smith and Jill Smith
Cash Uses
Tax Rate Table
Solution: Dividends/ Investco/ Solutions
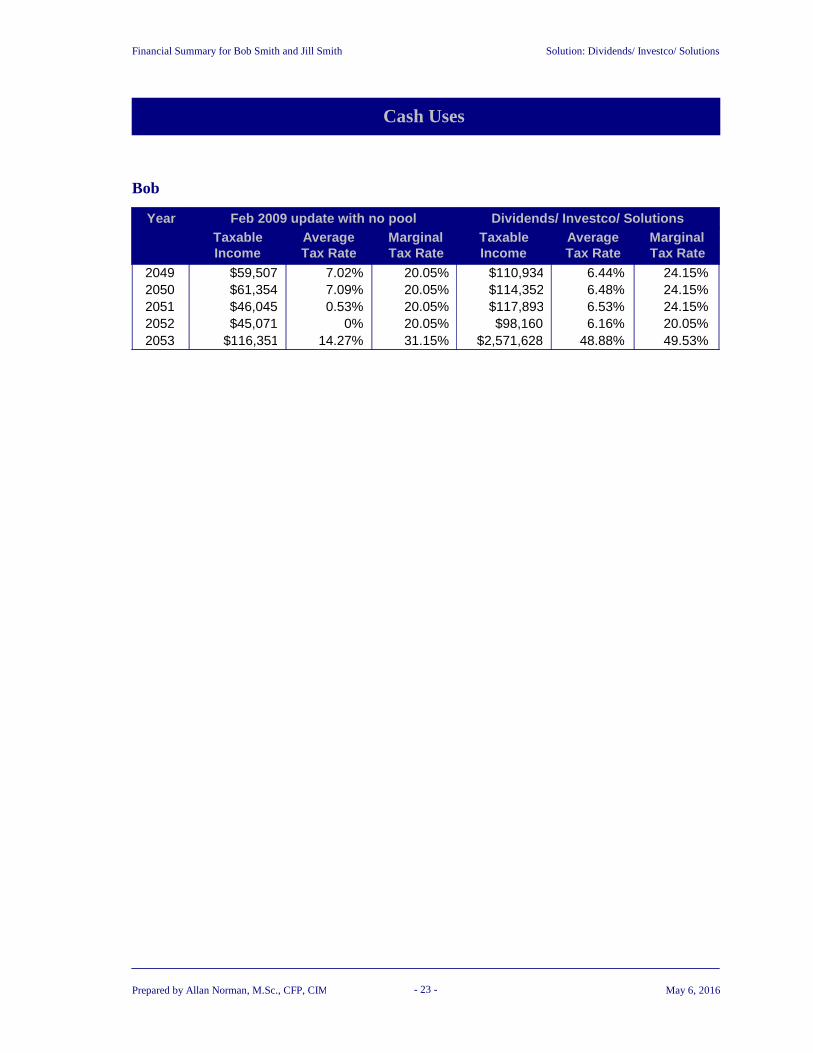
The following table displays your average and marginal tax rates over time. Notice that the original solution "All Salary" is compared to the new solution "Dividends/Investco" where we reduced Bob's salary and paid the children dividends and saved for retirement in Investco.
Bob
Year Dividends/ Investco/ SolutionsFeb 2009 update with no poolTaxableIncome
MarginalTax Rate
MarginalTax Rate
TaxableIncome
AverageTax Rate
AverageTax Rate
2016 $150,001 47.97% $82,209 35.39%30.55% 19.14%2017 $126,727 43.41% $84,807 35.39%27.61% 19.17%2018 $125,483 43.41% $87,415 35.39%27.98% 19.21%2019 $125,810 43.41% $90,518 35.39%27.62% 20.41%2020 $126,706 43.41% $94,159 35.39%27.32% 21.57%2021 $127,459 43.41% $101,358 39.41%27% 22.17%2022 $128,589 43.41% $98,629 35.39%26.73% 21.37%2023 $301,902 49.53% $141,681 43.41%39.23% 27.07%2024 $19,384 20.05% $145,049 43.41%4.21% 26.91%2025 $32,362 20.05% $68,029 31.15%12.41% 12.25%2026 $34,097 20.05% $68,420 31.15%12.6% 11.91%2027 $34,395 20.05% $68,837 31.15%11.42% 11.56%2028 $42,772 20.05% $62,982 24.15%10.02% 6.45%2029 $39,745 20.05% $72,124 31.15%8.96% 9.16%2030 $39,418 20.05% $80,872 31.15%8.56% 11.33%2031 $49,582 20.05% $82,453 31.15%10.97% 11.17%2032 $42,831 20.05% $85,135 31.15%7.96% 11.28%2033 $39,543 20.05% $88,631 31.15%6.63% 11.55%2034 $40,269 20.05% $104,430 31.15%6.53% 14.17%2035 $41,172 20.05% $98,306 31.15%6.49% 12.35%2036 $42,159 20.05% $97,858 31.15%6.48% 11.59%2037 $43,572 20.05% $99,337 31.15%6.58% 11.25%2038 $44,968 20.05% $75,827 20.05%6.67% 4.28%2039 $46,342 20.05% $78,322 20.05%6.74% 4.42%2040 $47,761 20.05% $80,926 20.05%6.81% 4.58%2041 $59,728 20.05% $88,944 24.15%9.49% 6.31%2042 $48,664 20.05% $89,084 24.15%6.7% 5.74%2043 $49,530 20.05% $92,193 24.15%6.6% 5.96%2044 $51,045 20.05% $95,436 24.15%6.66% 6.17%2045 $52,641 20.05% $98,824 24.15%6.74% 6.36%2046 $54,283 20.05% $99,037 20.05%6.81% 5.82%2047 $55,973 20.05% $102,842 24.15%6.88% 6.05%2048 $57,717 20.05% $106,821 24.15%6.95% 6.24%
Prepared by Allan Norman, M.Sc., CFP, CIM - 22 - May 6, 2016
Financial Summary for Bob Smith and Jill Smith
Cash Uses
Solution: Dividends/ Investco/ Solutions
Bob
Year Dividends/ Investco/ SolutionsFeb 2009 update with no poolTaxableIncome
MarginalTax Rate
MarginalTax Rate
TaxableIncome
AverageTax Rate
AverageTax Rate
2049 $59,507 20.05% $110,934 24.15%7.02% 6.44%2050 $61,354 20.05% $114,352 24.15%7.09% 6.48%2051 $46,045 20.05% $117,893 24.15%0.53% 6.53%2052 $45,071 20.05% $98,160 20.05%0% 6.16%2053 $116,351 31.15% $2,571,628 49.53%14.27% 48.88%
Prepared by Allan Norman, M.Sc., CFP, CIM - 23 - May 6, 2016

Financial Summary for Bob Smith and Jill Smith
Cash Uses
Solution: Dividends/ Investco/ Solutions
Jill
Year Dividends/ Investco/ SolutionsFeb 2009 update with no poolTaxableIncome
MarginalTax Rate
MarginalTax Rate
TaxableIncome
AverageTax Rate
AverageTax Rate
2016 $17,624 20.05% $50,850 31.15%4.48% 16.54%2017 $20,179 20.05% $52,687 31.15%6.78% 16.58%2018 $19,269 20.05% $54,433 31.15%5.4% 16.56%2019 $31,630 20.05% $56,273 31.15%12.18% 16.55%2020 $22,859 20.05% $58,174 31.15%8.31% 16.53%2021 $23,803 20.05% $23,188 20.05%8.74% 0.79%2022 $21,087 20.05% $32,842 20.05%5.41% 5.5%2023 $24,295 20.05% $51,533 24.15%9.89% 11.55%2024 $22,259 20.05% $52,914 24.15%7.52% 11.51%2025 $25,505 20.05% $43,106 20.05%10.01% 9.76%2026 $26,385 20.05% $43,162 20.05%10.09% 9.48%2027 $23,896 20.05% $40,074 20.05%0% 2.18%2028 $31,096 20.05% $48,513 20.05%4.02% 5.84%2029 $32,309 20.05% $54,944 20.05%4.31% 7.26%2030 $33,560 20.05% $65,245 24.15%4.6% 9.5%2031 $35,709 20.05% $67,940 24.15%5.36% 9.65%2032 $40,681 20.05% $70,729 24.15%7.32% 9.8%2033 $42,234 20.05% $74,312 31.15%7.48% 10.3%2034 $43,144 20.05% $89,930 31.15%7.43% 13.52%2035 $44,047 20.05% $83,247 31.15%7.38% 11.27%2036 $45,034 20.05% $82,631 31.15%7.34% 10.36%2037 $46,447 20.05% $84,094 31.15%7.42% 9.98%2038 $47,843 20.05% $75,827 20.05%7.48% 7.6%2039 $49,217 20.05% $78,322 20.05%7.82% 7.5%2040 $50,636 20.05% $80,926 20.05%7.86% 7.41%2041 $54,133 20.05% $88,944 24.15%8.35% 8.32%2042 $51,539 20.05% $89,084 24.15%7.45% 7.64%2043 $52,405 20.05% $92,193 24.15%7.34% 7.53%2044 $53,920 20.05% $95,436 24.15%7.38% 7.44%2045 $55,516 20.05% $98,824 24.15%7.43% 7.36%2046 $57,158 20.05% $99,037 20.05%7.47% 6.68%2047 $58,848 20.05% $102,842 24.15%7.52% 6.6%2048 $60,592 20.05% $106,821 24.15%7.57% 6.5%2049 $62,382 20.05% $111,018 24.15%7.62% 6.46%2050 $64,229 20.05% $116,288 24.15%7.67% 6.61%2051 $60,596 20.05% $121,832 24.15%6.59% 6.74%2052 $387,062 47.97% $115,963 20.05%35.15% 6.28%
Prepared by Allan Norman, M.Sc., CFP, CIM - 24 - May 6, 2016

Financial Summary for Bob Smith and Jill Smith
Cash Uses
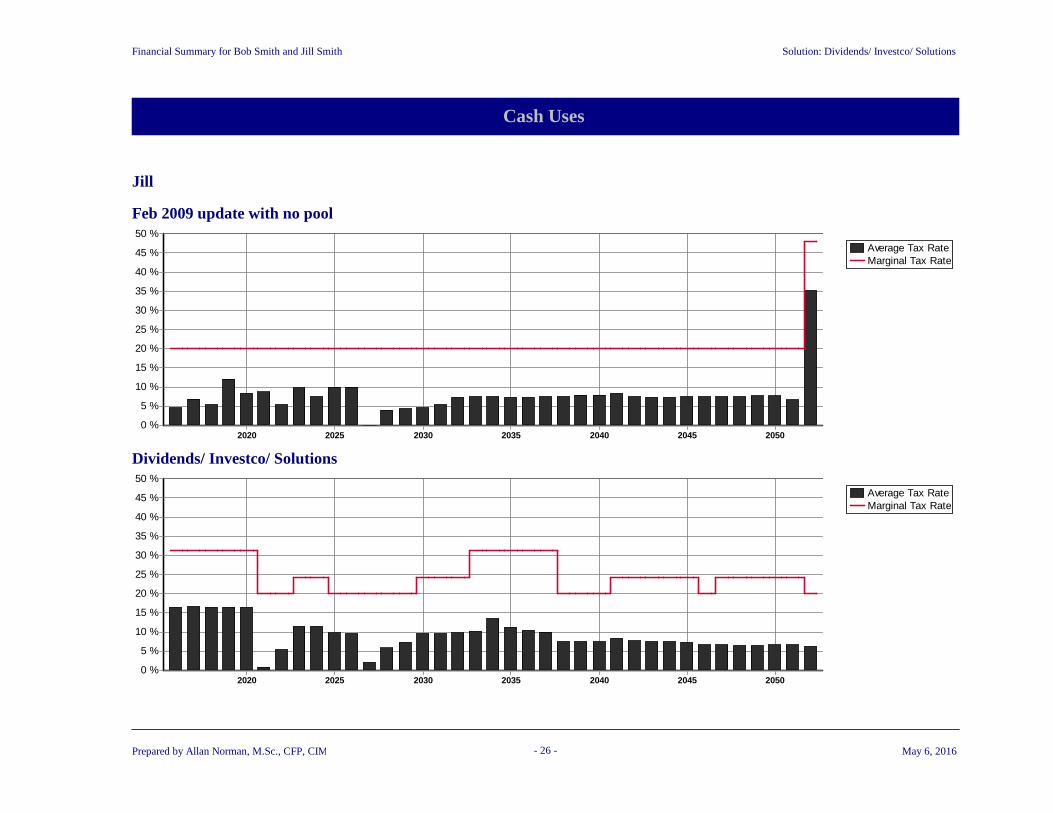
Tax Rate Graph
Solution: Dividends/ Investco/ Solutions
Bob
Average Tax RateMarginal Tax Rate
2050204520402035203020252020
50 %
45 %
40 %
35 %
30 %
25 %
20 %
15 %
10 %
5 %
0 %
Feb 2009 update with no pool
Average Tax RateMarginal Tax Rate
2050204520402035203020252020
50 %
45 %
40 %
35 %
30 %
25 %
20 %
15 %
10 %
5 %
0 %
Dividends/ Investco/ Solutions
Prepared by Allan Norman, M.Sc., CFP, CIM - 25 - May 6, 2016
Financial Summary for Bob Smith and Jill Smith
Cash Uses
Solution: Dividends/ Investco/ Solutions
Jill
Average Tax RateMarginal Tax Rate
2050204520402035203020252020
50 %
45 %
40 %
35 %
30 %
25 %
20 %
15 %
10 %
5 %
0 %
Feb 2009 update with no pool
Average Tax RateMarginal Tax Rate
2050204520402035203020252020
50 %
45 %
40 %
35 %
30 %
25 %
20 %
15 %
10 %
5 %
0 %
Dividends/ Investco/ Solutions
Prepared by Allan Norman, M.Sc., CFP, CIM - 26 - May 6, 2016

Solution: Dividends/ Investco/ Solutions
Compare
Financial Summary for Bob Smith and Jill Smith
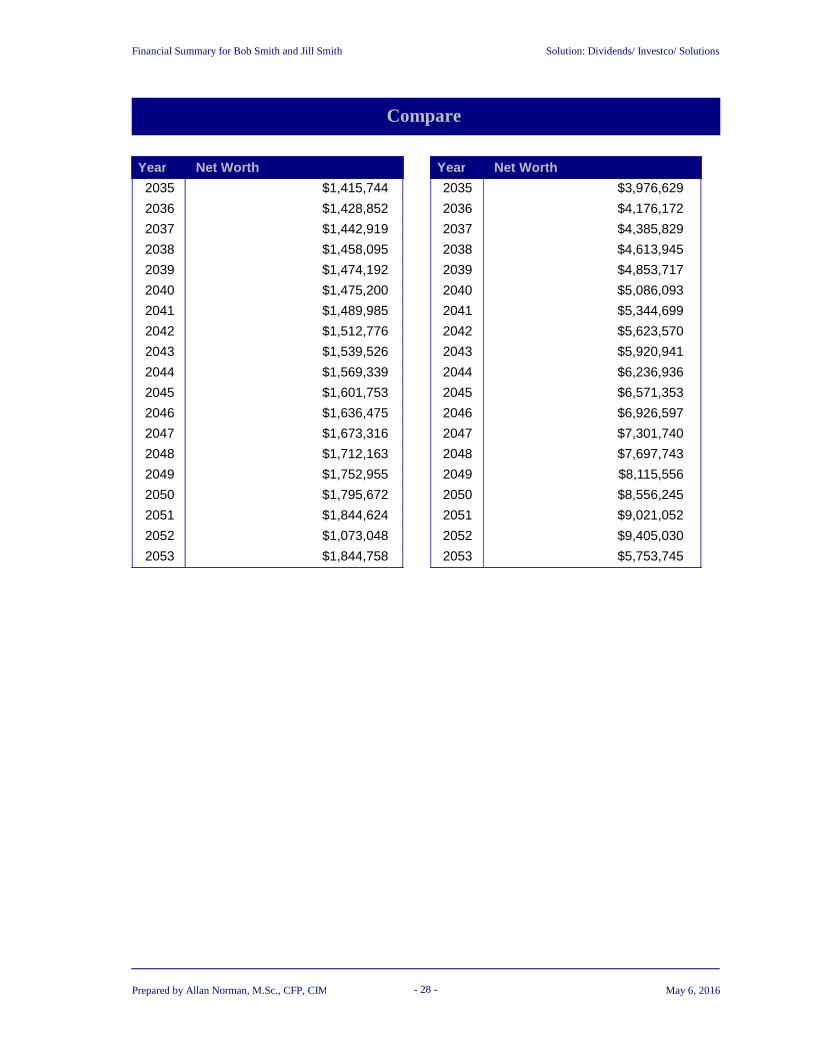
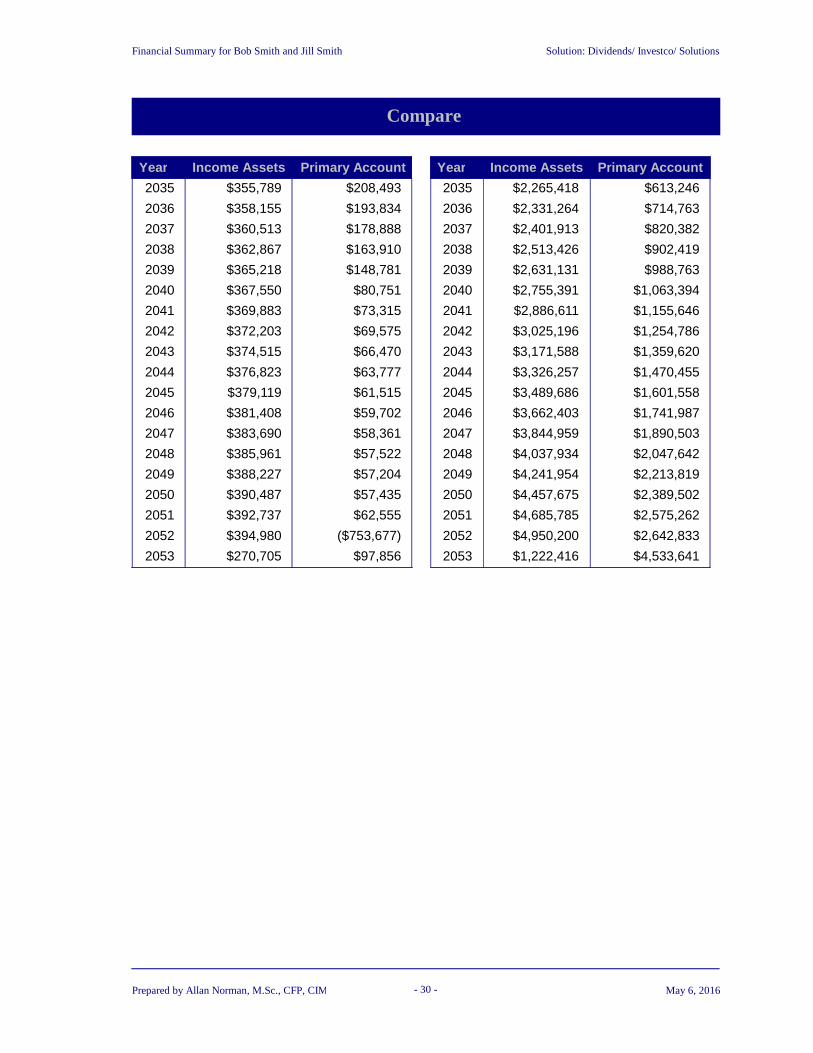
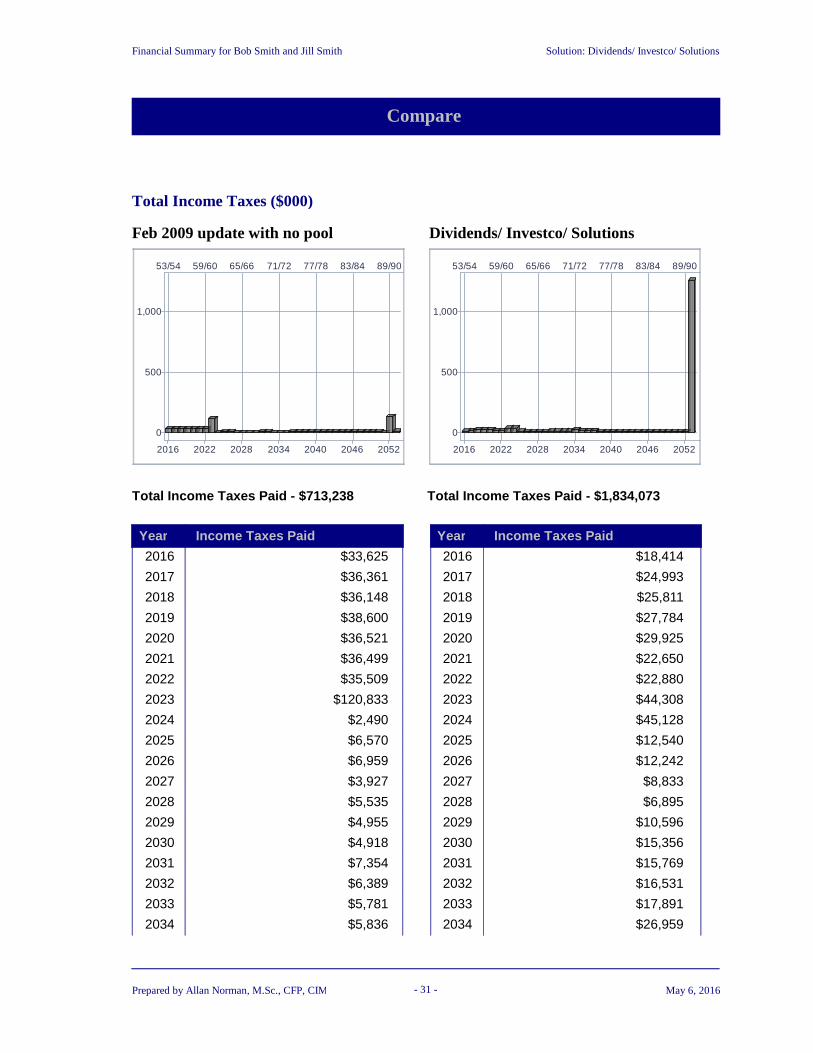
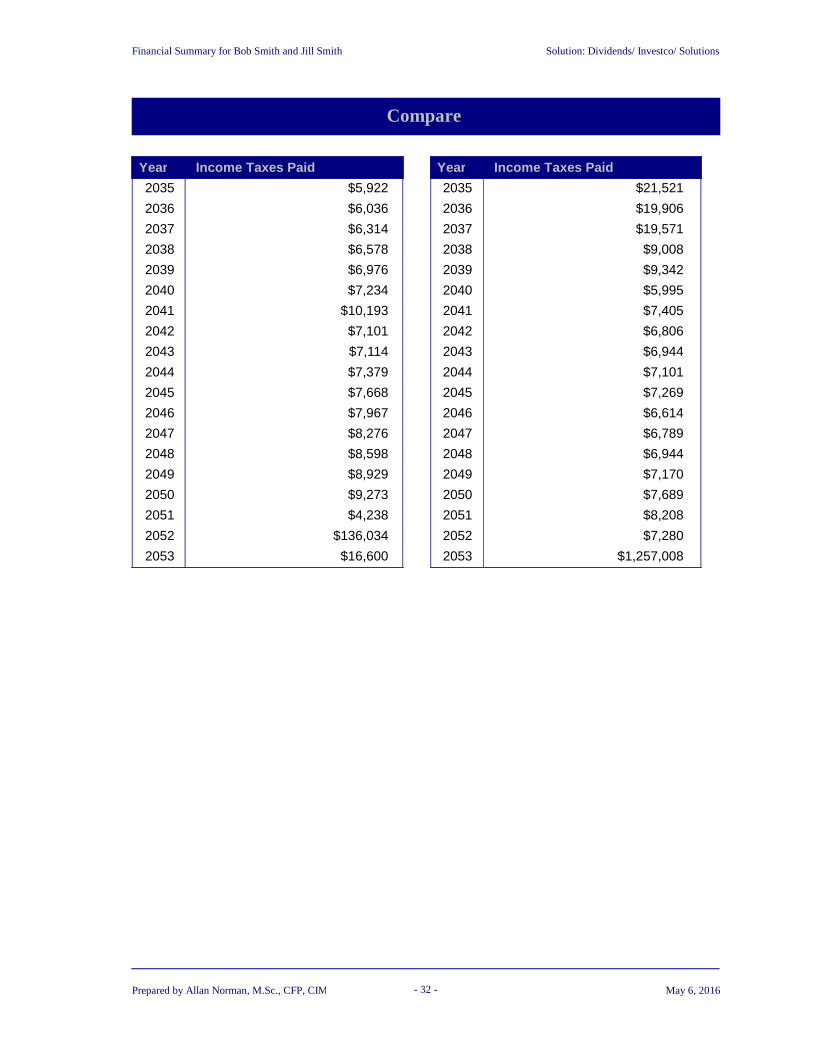
On the following pages we have compared your current approach to the new planned approach. The first page compares your total net worth over time, the next compares your income assets (investments you will use to provide an income), and the last section compares your taxes over time.
Total Net Worth ($000)
Feb 2009 update with no pool Dividends/ Investco/ Solutions
0
2,000
4,000
6,000
8,000
2016 2022 2028 2034 2040 2046 2052
53/54 59/60 65/66 71/72 77/78 83/84 89/90
0
2,000
4,000
6,000
8,000
2016 2022 2028 2034 2040 2046 2052
53/54 59/60 65/66 71/72 77/78 83/84 89/90
Year Net Worth Year Net Worth
2016 $940,123 2016 $1,100,088
2017 $981,794 2017 $1,232,389
2018 $1,043,663 2018 $1,388,859
2019 $1,108,476 2019 $1,581,264
2020 $1,172,076 2020 $1,799,519
2021 $1,240,783 2021 $2,000,051
2022 $1,314,926 2022 $2,214,726
2023 $1,316,938 2023 $2,443,915
2024 $1,322,683 2024 $2,625,184
2025 $1,324,519 2025 $2,432,238
2026 $1,326,013 2026 $2,536,448
2027 $1,334,372 2027 $2,662,524
2028 $1,348,793 2028 $2,782,393
2029 $1,364,869 2029 $2,911,215
2030 $1,368,558 2030 $3,062,527
2031 $1,372,939 2031 $3,223,837
2032 $1,380,940 2032 $3,393,721
2033 $1,391,418 2033 $3,595,147
2034 $1,403,164 2034 $3,782,288
Prepared by Allan Norman, M.Sc., CFP, CIM - 27 - May 6, 2016
Solution: Dividends/ Investco/ Solutions
Compare
Financial Summary for Bob Smith and Jill Smith
Year Net Worth Year Net Worth
2035 $1,415,744 2035 $3,976,629
2036 $1,428,852 2036 $4,176,172
2037 $1,442,919 2037 $4,385,829
2038 $1,458,095 2038 $4,613,945
2039 $1,474,192 2039 $4,853,717
2040 $1,475,200 2040 $5,086,093
2041 $1,489,985 2041 $5,344,699
2042 $1,512,776 2042 $5,623,570
2043 $1,539,526 2043 $5,920,941
2044 $1,569,339 2044 $6,236,936
2045 $1,601,753 2045 $6,571,353
2046 $1,636,475 2046 $6,926,597
2047 $1,673,316 2047 $7,301,740
2048 $1,712,163 2048 $7,697,743
2049 $1,752,955 2049 $8,115,556
2050 $1,795,672 2050 $8,556,245
2051 $1,844,624 2051 $9,021,052
2052 $1,073,048 2052 $9,405,030
2053 $1,844,758 2053 $5,753,745
Prepared by Allan Norman, M.Sc., CFP, CIM - 28 - May 6, 2016

Solution: Dividends/ Investco/ Solutions
Compare
Financial Summary for Bob Smith and Jill Smith
Total Income Assets ($000)
Feb 2009 update with no pool Dividends/ Investco/ Solutions
-1,000
0
1,000
2,000
3,000
4,000
5,000
6,000
7,000
8,000
-1,000
0
1,000
2,000
3,000
4,000
5,000
6,000
7,000
8,000
2016 2022 2028 2034 2040 2046 20522016 2022 2028 2034 2040 2046 2052
53/54 59/60 65/66 71/72 77/78 83/84 89/9053/54 59/60 65/66 71/72 77/78 83/84 89/90
-1,000
0
1,000
2,000
3,000
4,000
5,000
6,000
7,000
8,000
-1,000
0
1,000
2,000
3,000
4,000
5,000
6,000
7,000
8,000
2016 2022 2028 2034 2040 2046 20522016 2022 2028 2034 2040 2046 2052
53/54 59/60 65/66 71/72 77/78 83/84 89/9053/54 59/60 65/66 71/72 77/78 83/84 89/90
Income AssetsPrimary Account
Year Income Assets Year Income AssetsPrimary Account Primary Account
2016 $593,750 2016 $864,292($7,633) $18,166
2017 $601,861 2017 $955,803$10,954 $23,664
2018 $610,068 2018 $1,065,544($2,603) $20,955
2019 $618,373 2019 $1,204,205$24,992 $28,912
2020 $626,780 2020 $1,361,983$45,938 $30,590
2021 $635,290 2021 $1,524,323$97,255 $30,469
2022 $643,906 2022 $1,697,724$150,870 $32,303
2023 $272,630 2023 $1,843,120$455,950 $75,695
2024 $281,466 2024 $1,936,056$436,872 $98,712
2025 $290,417 2025 $1,678,589$412,341 $118,374
2026 $299,485 2026 $1,716,474$386,164 $140,521
2027 $308,672 2027 $1,768,228$365,709 $169,492
2028 $317,983 2028 $1,832,321$350,279 $181,065
2029 $327,479 2029 $1,895,667$335,475 $200,760
2030 $337,106 2030 $1,959,952$278,494 $237,263
2031 $345,546 2031 $2,025,483$260,130 $278,481
2032 $348,404 2032 $2,092,295$247,603 $323,403
2033 $351,037 2033 $2,159,023$235,194 $406,889
2034 $353,416 2034 $2,202,262$222,261 $513,151
Prepared by Allan Norman, M.Sc., CFP, CIM - 29 - May 6, 2016
Solution: Dividends/ Investco/ Solutions
Compare
Financial Summary for Bob Smith and Jill Smith
Year Income Assets Year Income AssetsPrimary Account Primary Account
2035 $355,789 2035 $2,265,418$208,493 $613,246
2036 $358,155 2036 $2,331,264$193,834 $714,763
2037 $360,513 2037 $2,401,913$178,888 $820,382
2038 $362,867 2038 $2,513,426$163,910 $902,419
2039 $365,218 2039 $2,631,131$148,781 $988,763
2040 $367,550 2040 $2,755,391$80,751 $1,063,394
2041 $369,883 2041 $2,886,611$73,315 $1,155,646
2042 $372,203 2042 $3,025,196$69,575 $1,254,786
2043 $374,515 2043 $3,171,588$66,470 $1,359,620
2044 $376,823 2044 $3,326,257$63,777 $1,470,455
2045 $379,119 2045 $3,489,686$61,515 $1,601,558
2046 $381,408 2046 $3,662,403$59,702 $1,741,987
2047 $383,690 2047 $3,844,959$58,361 $1,890,503
2048 $385,961 2048 $4,037,934$57,522 $2,047,642
2049 $388,227 2049 $4,241,954$57,204 $2,213,819
2050 $390,487 2050 $4,457,675$57,435 $2,389,502
2051 $392,737 2051 $4,685,785$62,555 $2,575,262
2052 $394,980 2052 $4,950,200($753,677) $2,642,833
2053 $270,705 2053 $1,222,416$97,856 $4,533,641
Prepared by Allan Norman, M.Sc., CFP, CIM - 30 - May 6, 2016
Solution: Dividends/ Investco/ Solutions
Compare
Financial Summary for Bob Smith and Jill Smith
Total Income Taxes ($000)
Feb 2009 update with no pool Dividends/ Investco/ Solutions
0
500
1,000
2016 2022 2028 2034 2040 2046 2052
53/54 59/60 65/66 71/72 77/78 83/84 89/90
0
500
1,000
2016 2022 2028 2034 2040 2046 2052
53/54 59/60 65/66 71/72 77/78 83/84 89/90
Total Income Taxes Paid - $713,238 Total Income Taxes Paid - $1,834,073
Year Income Taxes Paid Year Income Taxes Paid
2016 $33,625 2016 $18,414
2017 $36,361 2017 $24,993
2018 $36,148 2018 $25,811
2019 $38,600 2019 $27,784
2020 $36,521 2020 $29,925
2021 $36,499 2021 $22,650
2022 $35,509 2022 $22,880
2023 $120,833 2023 $44,308
2024 $2,490 2024 $45,128
2025 $6,570 2025 $12,540
2026 $6,959 2026 $12,242
2027 $3,927 2027 $8,833
2028 $5,535 2028 $6,895
2029 $4,955 2029 $10,596
2030 $4,918 2030 $15,356
2031 $7,354 2031 $15,769
2032 $6,389 2032 $16,531
2033 $5,781 2033 $17,891
2034 $5,836 2034 $26,959
Prepared by Allan Norman, M.Sc., CFP, CIM - 31 - May 6, 2016
Solution: Dividends/ Investco/ Solutions
Compare
Financial Summary for Bob Smith and Jill Smith
Year Income Taxes Paid Year Income Taxes Paid
2035 $5,922 2035 $21,521
2036 $6,036 2036 $19,906
2037 $6,314 2037 $19,571
2038 $6,578 2038 $9,008
2039 $6,976 2039 $9,342
2040 $7,234 2040 $5,995
2041 $10,193 2041 $7,405
2042 $7,101 2042 $6,806
2043 $7,114 2043 $6,944
2044 $7,379 2044 $7,101
2045 $7,668 2045 $7,269
2046 $7,967 2046 $6,614
2047 $8,276 2047 $6,789
2048 $8,598 2048 $6,944
2049 $8,929 2049 $7,170
2050 $9,273 2050 $7,689
2051 $4,238 2051 $8,208
2052 $136,034 2052 $7,280
2053 $16,600 2053 $1,257,008
Prepared by Allan Norman, M.Sc., CFP, CIM - 32 - May 6, 2016
Financial Summary for Bob Smith and Jill Smith
Private Company Dividends
Solution: Dividends/ Investco/ Solutions
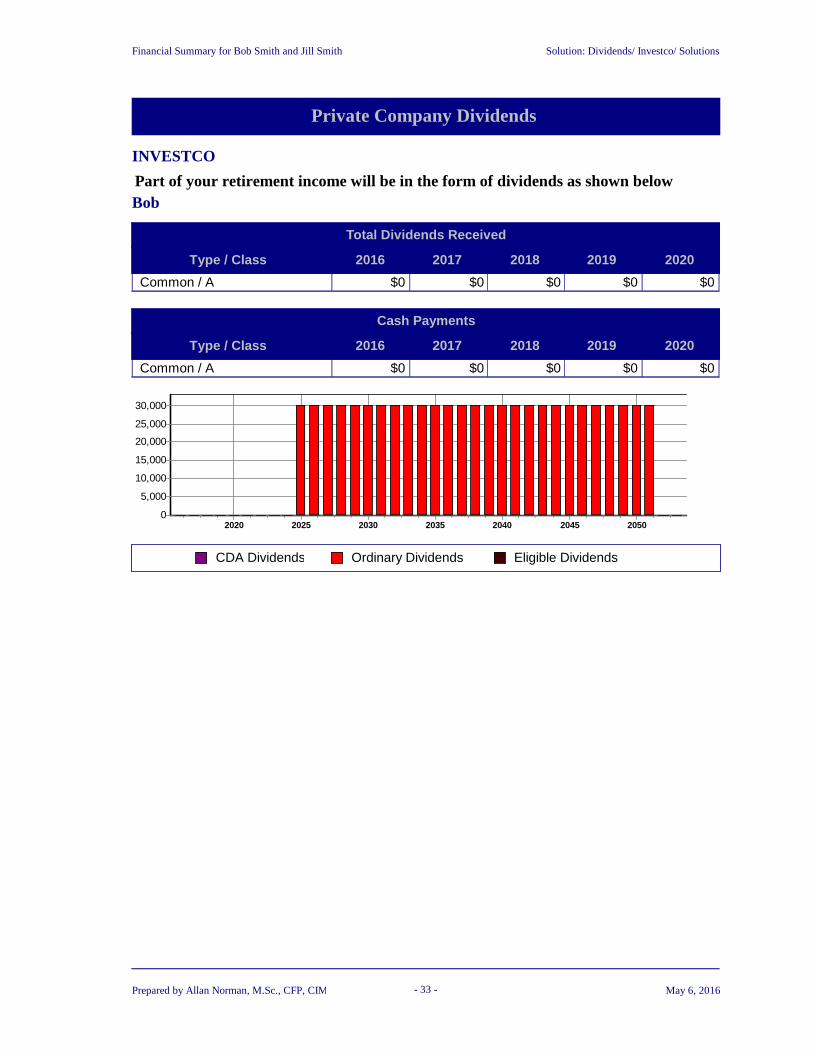
INVESTCO
Part of your retirement income will be in the form of dividends as shown belowBob
2016Type / Class 2017 2018 2019 2020
Total Dividends Received
Common / A $0 $0 $0 $0 $0
2016Type / Class 2017 2018 2019 2020
Cash Payments
Common / A $0 $0 $0 $0 $0
CDA Dividends Ordinary Dividends Eligible Dividends
2050204520402035203020252020
30,000
25,000
20,000
15,000
10,000
5,000
0
Prepared by Allan Norman, M.Sc., CFP, CIM - 33 - May 6, 2016
Financial Summary for Bob Smith and Jill Smith
Private Company Dividends
Solution: Dividends/ Investco/ Solutions
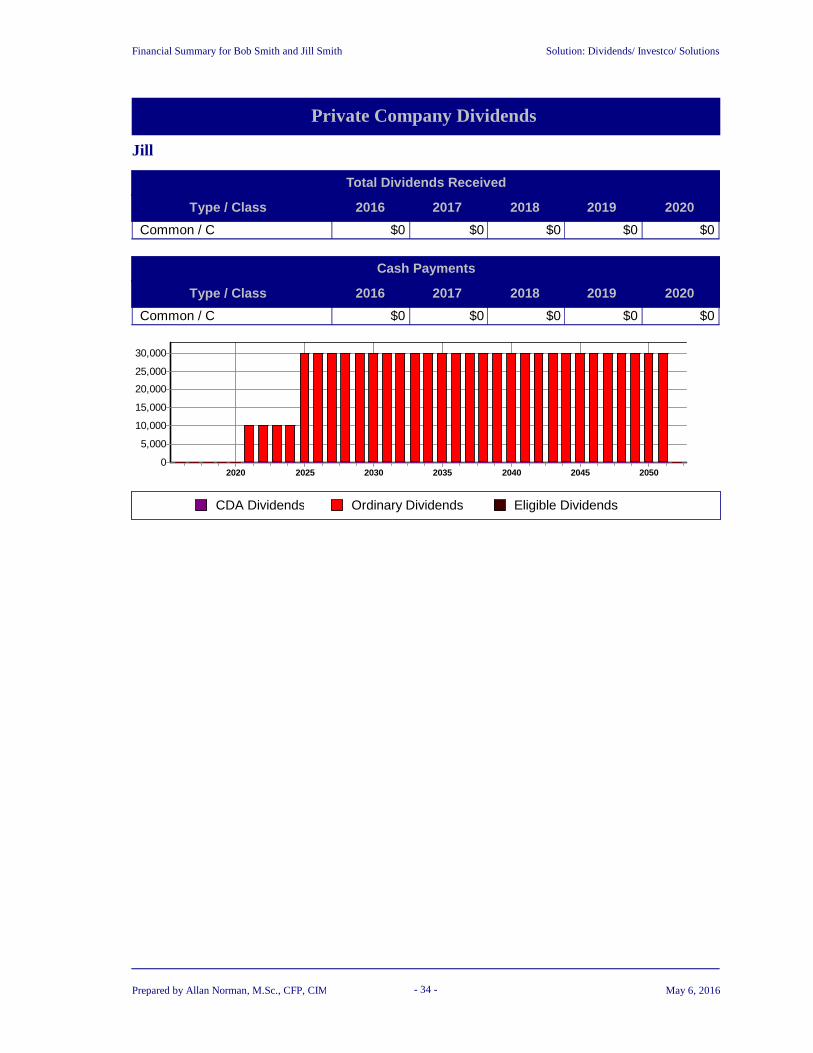
Jill
2016Type / Class 2017 2018 2019 2020
Total Dividends Received
Common / C $0 $0 $0 $0 $0
2016Type / Class 2017 2018 2019 2020
Cash Payments
Common / C $0 $0 $0 $0 $0
CDA Dividends Ordinary Dividends Eligible Dividends
2050204520402035203020252020
30,000
25,000
20,000
15,000
10,000
5,000
0
Prepared by Allan Norman, M.Sc., CFP, CIM - 34 - May 6, 2016
Financial Summary for Bob Smith and Jill Smith
Trust Distributions
Solution: Dividends/ Investco/ Solutions
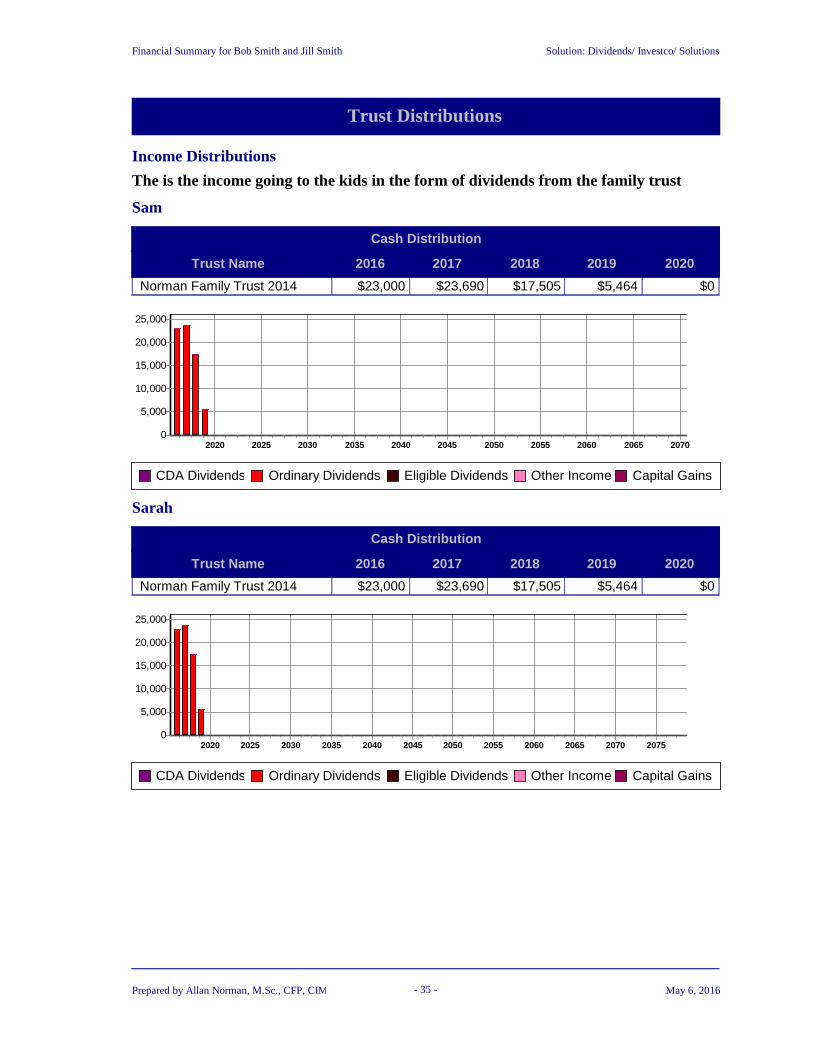
Income Distributions
The is the income going to the kids in the form of dividends from the family trust
Sam
2016Trust Name 2017 2018 2019 2020
Cash Distribution
Norman Family Trust 2014 $23,000 $23,690 $17,505 $5,464 $0
20702065206020552050204520402035203020252020
25,000
20,000
15,000
10,000
5,000
0
CDA Dividends Ordinary Dividends Eligible Dividends Other Income Capital Gains
Sarah
2016Trust Name 2017 2018 2019 2020
Cash Distribution
Norman Family Trust 2014 $23,000 $23,690 $17,505 $5,464 $0
207520702065206020552050204520402035203020252020
25,000
20,000
15,000
10,000
5,000
0
CDA Dividends Ordinary Dividends Eligible Dividends Other Income Capital Gains
Prepared by Allan Norman, M.Sc., CFP, CIM - 35 - May 6, 2016

Financial Summary for Bob Smith and Jill Smith
Net Cash Flow Forecast
Solution: Dividends/ Investco/ Solutions
Cash Sources and Cash Uses
To understand your annual savings target, you must analyze your net cash flow by dividing it into two parts - cash sources and cash uses. Years of negative savings need not be a concern as long as your forecasted income assets are positive throughout your expected lifetime. For detail, refer to the Income Assets Forecast section.
The graphs below show your forecasted cash sources and cash uses over your expected lifetime. The related table shows ten-year targets. The tables that follow display details for the next three years and then every five years.
Prepared by Allan Norman, M.Sc., CFP, CIM - 36 - May 6, 2016

Financial Summary for Bob Smith and Jill Smith
Net Cash Flow Forecast
Solution: Dividends/ Investco/ Solutions
Cash Sources Stacked Bar Graph (Actual / Inflated Dollars, $000)
Debt PrincipalOther SalesInsuranceOther IncomePrivate CompaniesRRSPs / Pension PlansGovernment BenefitsNon-Reg. PortfoliosCareer
2050204520402035203020252020
230
220
210
200
190
180
170
160
150
140
130
120
110
100
90
80
70
60
50
40
30
20
10
0
Prepared by Allan Norman, M.Sc., CFP, CIM - 37 - May 6, 2016

Financial Summary for Bob Smith and Jill Smith
Net Cash Flow Forecast
Solution: Dividends/ Investco/ Solutions
Cash Sources Stacked Bar Graph (Today's / Constant Dollars, $000)
Debt PrincipalOther SalesInsuranceOther IncomePrivate CompaniesRRSPs / Pension PlansGovernment BenefitsNon-Reg. PortfoliosCareer
2050204520402035203020252020
240
230
220
210
200
190
180
170
160
150
140
130
120
110
100
90
80
70
60
50
40
30
20
10
0
Prepared by Allan Norman, M.Sc., CFP, CIM - 38 - May 6, 2016

Financial Summary for Bob Smith and Jill Smith
Net Cash Flow Forecast
Solution: Dividends/ Investco/ Solutions
Cash Uses Stacked Bar Graph (Actual / Inflated Dollars, $000)
Spouse's Income TaxesIncome TaxesDebt PaymentsInsuranceRRSPs / Pension PlansOther Accounts/PlansCareerLifestyle ExpensesHomes
2050204520402035203020252020
190
180
170
160
150
140
130
120
110
100
90
80
70
60
50
40
30
20
10
0
Prepared by Allan Norman, M.Sc., CFP, CIM - 39 - May 6, 2016

Financial Summary for Bob Smith and Jill Smith
Net Cash Flow Forecast
Solution: Dividends/ Investco/ Solutions
Cash Uses Stacked Bar Graph (Today's / Constant Dollars, $000)
Spouse's Income TaxesIncome TaxesDebt PaymentsInsuranceRRSPs / Pension PlansOther Accounts/PlansCareerLifestyle ExpensesHomes
2050204520402035203020252020
190
180
170
160
150
140
130
120
110
100
90
80
70
60
50
40
30
20
10
0
Prepared by Allan Norman, M.Sc., CFP, CIM - 40 - May 6, 2016
Financial Summary for Bob Smith and Jill Smith Solution: Dividends/ Investco/ Solutions
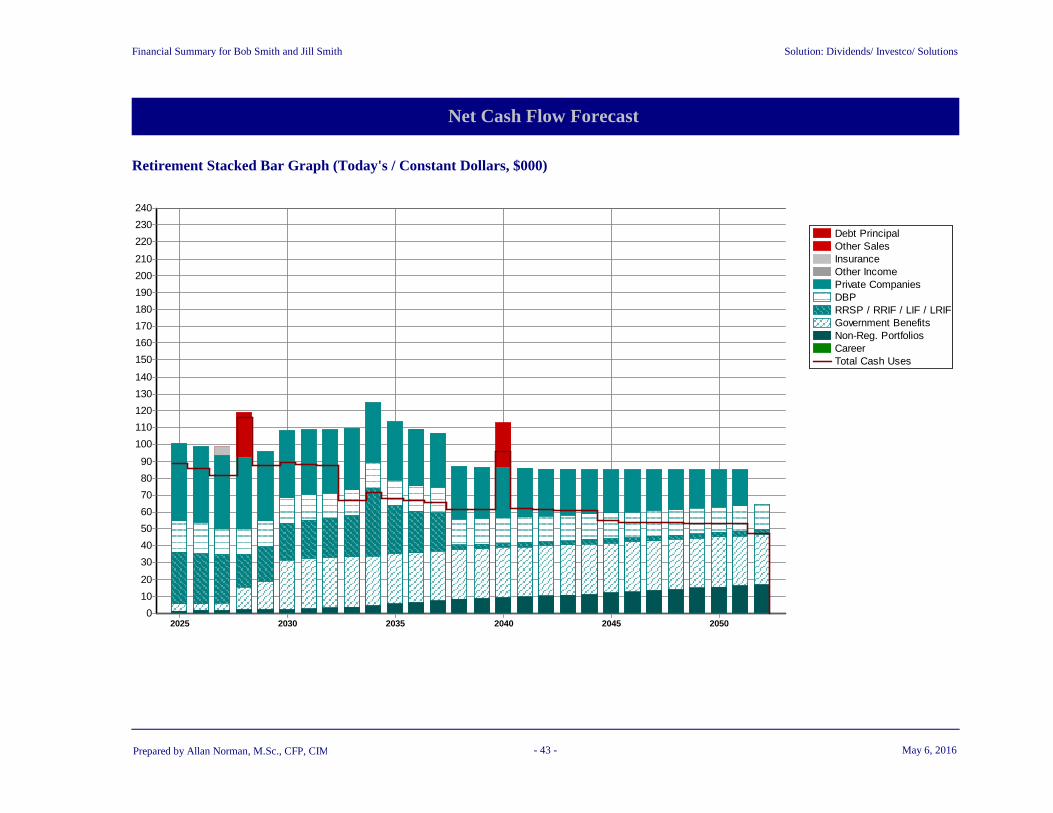
Net Cash Flow Forecast
Retirement Sources and Uses
During retirement, net cash flow includes cash sources such as from government plans that are not available at other times in your life. Your retirement years may also be a time of deficits (cash uses exceed cash sources) that may cause a decline in the value of your income assets. Should they become negative, you will have to sell your possessions.
The table below shows your forecasted cash sources and uses during your retirement years and is based on your expected lifetime.
Prepared by Allan Norman, M.Sc., CFP, CIM - 41 - May 6, 2016

Financial Summary for Bob Smith and Jill Smith Solution: Dividends/ Investco/ Solutions
Net Cash Flow Forecast
Retirement Stacked Bar Graph (Actual / Inflated Dollars, $000)
Debt PrincipalOther SalesInsuranceOther IncomePrivate CompaniesDBPRRSP / RRIF / LIF / LRIFGovernment BenefitsNon-Reg. PortfoliosCareerTotal Cash Uses
205020452040203520302025
240
230
220
210
200
190
180
170
160
150
140
130
120
110
100
90
80
70
60
50
40
30
20
10
0
Prepared by Allan Norman, M.Sc., CFP, CIM - 42 - May 6, 2016
Financial Summary for Bob Smith and Jill Smith Solution: Dividends/ Investco/ Solutions
Net Cash Flow Forecast
Retirement Stacked Bar Graph (Today's / Constant Dollars, $000)
Debt PrincipalOther SalesInsuranceOther IncomePrivate CompaniesDBPRRSP / RRIF / LIF / LRIFGovernment BenefitsNon-Reg. PortfoliosCareerTotal Cash Uses
205020452040203520302025
240
230
220
210
200
190
180
170
160
150
140
130
120
110
100
90
80
70
60
50
40
30
20
10
0
Prepared by Allan Norman, M.Sc., CFP, CIM - 43 - May 6, 2016

Financial Summary for Bob Smith and Jill Smith
Net Cash Flow Forecast
Solution: Dividends/ Investco/ Solutions
OAS, CPP / QPP, GIS
Note: There is no OAS clawback until the final year
Bob
OAS / GIS
Year Adjusted Benefit Clawback Net BenefitBenefit GIS Benefit
$10,3552030 $10,859 $0 $10,859 $0$10,6662031 $12,202 $0 $12,202 $0$10,9862032 $12,568 $0 $12,568 $0$11,3152033 $12,945 $0 $12,945 $0$11,6552034 $13,333 $0 $13,333 $0$12,0052035 $13,733 $0 $13,733 $0$12,3652036 $14,145 $0 $14,145 $0$12,7362037 $14,569 $0 $14,569 $0$13,1182038 $15,007 $0 $15,007 $0$13,5112039 $15,457 $0 $15,457 $0$13,9172040 $15,920 $0 $15,920 $0$14,3342041 $16,398 $0 $16,398 $0$14,7642042 $16,890 $0 $16,890 $0$15,2072043 $17,397 $0 $17,397 $0$15,6632044 $17,919 $0 $17,919 $0$16,1332045 $18,456 $0 $18,456 $0$16,6172046 $19,010 $0 $19,010 $0$17,1162047 $19,580 $0 $19,580 $0$17,6292048 $20,168 $0 $20,168 $0$18,1582049 $20,773 $0 $20,773 $0$18,7032050 $21,396 $0 $21,396 $0$19,2642051 $22,038 $0 $22,038 $0$19,8422052 $22,699 $0 $22,699 $0$20,4372053 $23,380 $23,380 $0 $0
Prepared by Allan Norman, M.Sc., CFP, CIM - 44 - May 6, 2016

Financial Summary for Bob Smith and Jill Smith
Net Cash Flow Forecast
Solution: Dividends/ Investco/ Solutions
CPP / QPP
Year Additional Contributions Adjusted BenefitBenefit
$13,9302028 $0 $9,078
$14,3482029 $0 $10,200
$14,7782030 $0 $10,506
$15,2212031 $0 $10,822
$15,6782032 $0 $11,146
$16,1482033 $0 $11,481
$16,6332034 $0 $11,825
$17,1322035 $0 $12,180
$17,6462036 $0 $12,545
$18,1752037 $0 $12,922
$18,7202038 $0 $13,309
$19,2822039 $0 $13,709
$19,8602040 $0 $14,120
$20,4562041 $0 $14,543
$21,0702042 $0 $14,980
$21,7022043 $0 $15,429
$22,3532044 $0 $15,892
$23,0242045 $0 $16,369
$23,7142046 $0 $16,860
$24,4262047 $0 $17,366
$25,1592048 $0 $17,887
$25,9132049 $0 $18,423
$26,6912050 $0 $18,976
$27,4912051 $0 $19,545
$28,3162052 $0 $20,131
$29,1662053 $0 $39,136
Prepared by Allan Norman, M.Sc., CFP, CIM - 45 - May 6, 2016

Financial Summary for Bob Smith and Jill Smith
Net Cash Flow Forecast
Solution: Dividends/ Investco/ Solutions
Jill
OAS / GIS
Year Adjusted Benefit Clawback Net BenefitBenefit GIS Benefit
$10,0542029 $3,834 $0 $3,834 $0$10,3552030 $11,846 $0 $11,846 $0$10,6662031 $12,202 $0 $12,202 $0$10,9862032 $12,568 $0 $12,568 $0$11,3152033 $12,945 $0 $12,945 $0$11,6552034 $13,333 $0 $13,333 $0$12,0052035 $13,733 $0 $13,733 $0$12,3652036 $14,145 $0 $14,145 $0$12,7362037 $14,569 $0 $14,569 $0$13,1182038 $15,007 $0 $15,007 $0$13,5112039 $15,457 $0 $15,457 $0$13,9172040 $15,920 $0 $15,920 $0$14,3342041 $16,398 $0 $16,398 $0$14,7642042 $16,890 $0 $16,890 $0$15,2072043 $17,397 $0 $17,397 $0$15,6632044 $17,919 $0 $17,919 $0$16,1332045 $18,456 $0 $18,456 $0$16,6172046 $19,010 $0 $19,010 $0$17,1162047 $19,580 $0 $19,580 $0$17,6292048 $20,168 $0 $20,168 $0$18,1582049 $20,773 $0 $20,773 $0$18,7032050 $21,396 $0 $21,396 $0$19,2642051 $22,038 $0 $22,038 $0$19,8422052 $22,699 $0 $22,699 $0
Prepared by Allan Norman, M.Sc., CFP, CIM - 46 - May 6, 2016

Financial Summary for Bob Smith and Jill Smith
Net Cash Flow Forecast
Solution: Dividends/ Investco/ Solutions
CPP / QPP
Year Additional Contributions Adjusted BenefitBenefit
$7,6902022 $0 $1,640
$7,9202023 $0 $5,069
$8,1582024 $0 $5,221
$8,4032025 $0 $5,378
$8,6552026 $0 $5,539
$8,9142027 $0 $5,705
$9,1822028 $0 $9,903
$9,4572029 $0 $10,200
$9,7412030 $0 $10,506
$10,0332031 $0 $10,822
$10,3342032 $0 $11,146
$10,6442033 $0 $11,481
$10,9642034 $0 $11,825
$11,2932035 $0 $12,180
$11,6312036 $0 $12,545
$11,9802037 $0 $12,922
$12,3402038 $0 $13,309
$12,7102039 $0 $13,709
$13,0912040 $0 $14,120
$13,4842041 $0 $14,543
$13,8882042 $0 $14,980
$14,3052043 $0 $15,429
$14,7342044 $0 $15,892
$15,1762045 $0 $16,369
$15,6322046 $0 $16,860
$16,1012047 $0 $17,366
$16,5842048 $0 $17,887
$17,0812049 $0 $18,423
$17,5932050 $0 $18,976
$18,1212051 $0 $19,545
$18,6652052 $0 $20,131
Prepared by Allan Norman, M.Sc., CFP, CIM - 47 - May 6, 2016

Financial Summary for Bob Smith and Jill Smith
Net Cash Flow Forecast
Solution: Dividends/ Investco/ Solutions
Total
YearSources
AgeUses
OAS/CPP Pensions Portfolios Other
Surplus/ Income(Deficit) Assets
Retirement Sources and Uses (Actual / Inflated Dollars)
2025 62/63 5,378 64,040 1,916 60,000 115,679 15,654 1,796,9622026 63/64 5,539 64,761 2,297 60,000 115,256 17,342 1,856,9952027 64/65 5,705 60,867 2,727 67,400 113,432 23,267 1,937,7202028 65/66 18,981 49,290 3,289 98,408 165,275 4,693 2,013,3862029 66/67 24,234 52,962 3,514 60,000 128,365 12,345 2,096,4272030 67/68 43,717 55,993 3,896 60,000 135,253 28,353 2,197,2152031 68/69 46,048 58,793 4,604 60,000 137,858 31,586 2,303,9642032 69/70 47,428 61,664 5,404 60,000 140,878 33,617 2,415,6982033 70/71 48,852 66,000 6,276 60,000 110,771 70,357 2,565,9122034 71/72 50,316 93,766 7,896 60,000 122,234 89,744 2,715,4132035 72/73 51,826 76,743 9,958 60,000 119,263 79,264 2,878,6632036 73/74 53,380 71,530 11,900 60,000 120,188 76,623 3,046,0272037 74/75 54,982 70,221 13,870 60,000 122,470 76,603 3,222,2942038 75/76 56,632 34,028 15,920 60,000 117,846 48,734 3,415,8452039 76/77 58,332 35,045 17,511 60,000 121,178 49,710 3,619,8942040 77/78 60,080 36,108 19,187 114,514 195,396 34,492 3,818,7852041 78/79 61,882 37,187 20,635 60,000 130,621 49,084 4,042,2562042 79/80 63,740 38,305 22,425 60,001 132,244 52,227 4,279,9822043 80/81 65,652 39,458 24,349 60,000 135,563 53,896 4,531,2082044 81/82 67,622 40,639 26,383 60,000 139,004 55,641 4,796,7122045 82/83 69,650 41,865 28,534 60,000 128,640 71,409 5,091,2432046 83/84 71,740 43,123 31,078 60,000 130,527 75,414 5,404,3902047 84/85 73,892 44,417 33,803 60,001 134,312 77,800 5,735,4632048 85/86 76,110 45,757 36,685 60,000 138,159 80,393 6,085,5762049 86/87 78,392 47,131 39,734 60,000 142,204 83,054 6,455,7742050 87/88 80,744 48,548 42,959 60,000 146,439 85,812 6,847,1772051 88/89 83,166 50,013 46,368 60,000 150,789 88,758 7,261,0472052 89/90 85,660 51,522 49,973 868 137,380 50,644 7,593,0322053 90/91 41,636 27,001 49,786 2,152,465 1,359,482 911,406 5,756,057
Prepared by Allan Norman, M.Sc., CFP, CIM - 48 - May 6, 2016

Financial Summary for Bob Smith and Jill Smith
Net Cash Flow Forecast
Solution: Dividends/ Investco/ Solutions
Total
YearSources
AgeUses
OAS/CPP Pensions Portfolios Other
Surplus/ Income(Deficit) Assets
Retirement Sources and Uses (Today's / Constant Dollars)
2025 62/63 4,122 49,081 1,468 45,985 88,658 11,998 1,377,2222026 63/64 4,122 48,188 1,709 44,646 85,761 12,904 1,381,7792027 64/65 4,121 43,972 1,970 48,691 81,946 16,808 1,399,8502028 65/66 13,313 34,571 2,307 69,021 115,921 3,291 1,412,1482029 66/67 16,502 36,065 2,393 40,857 87,410 8,406 1,427,5652030 67/68 28,902 37,018 2,576 39,667 89,418 18,745 1,452,6182031 68/69 29,556 37,737 2,955 38,512 88,486 20,274 1,478,8272032 69/70 29,556 38,427 3,368 37,390 87,791 20,949 1,505,3832033 70/71 29,556 39,931 3,797 36,301 67,018 42,567 1,552,4192034 71/72 29,555 55,078 4,638 35,244 71,799 52,715 1,595,0192035 72/73 29,556 43,765 5,679 34,217 68,014 45,203 1,641,6612036 73/74 29,555 39,604 6,589 33,221 66,545 42,424 1,686,5112037 74/75 29,556 37,747 7,456 32,253 65,834 41,178 1,732,1422038 75/76 29,556 17,759 8,308 31,314 61,503 25,434 1,782,7042039 76/77 29,556 17,757 8,873 30,401 61,400 25,188 1,834,1702040 77/78 29,555 17,763 9,439 56,333 96,122 16,968 1,878,5892041 78/79 29,555 17,761 9,855 28,656 62,385 23,443 1,930,6042042 79/80 29,556 17,762 10,398 27,822 61,321 24,217 1,984,6052043 80/81 29,556 17,764 10,962 27,011 61,029 24,263 2,039,9002044 81/82 29,556 17,762 11,532 26,225 60,755 24,319 2,096,5312045 82/83 29,556 17,765 12,108 25,461 54,588 30,302 2,160,4512046 83/84 29,556 17,766 12,804 24,719 53,775 31,070 2,226,5372047 84/85 29,556 17,766 13,521 23,999 53,723 31,119 2,294,1112048 85/86 29,556 17,769 14,246 23,300 53,652 31,220 2,363,2552049 86/87 29,556 17,770 14,981 22,621 53,615 31,313 2,433,9962050 87/88 29,556 17,771 15,725 21,963 53,603 31,411 2,506,3742051 88/89 29,556 17,774 16,479 21,323 53,588 31,543 2,580,4562052 89/90 29,555 17,777 17,242 300 47,400 17,474 2,619,8422053 90/91 13,947 9,045 16,677 721,039 455,403 305,305 1,928,181
Prepared by Allan Norman, M.Sc., CFP, CIM - 49 - May 6, 2016
Financial Summary for Bob Smith and Jill Smith
Net Worth Forecast
Net Worth Forecast
Solution: Dividends/ Investco/ Solutions
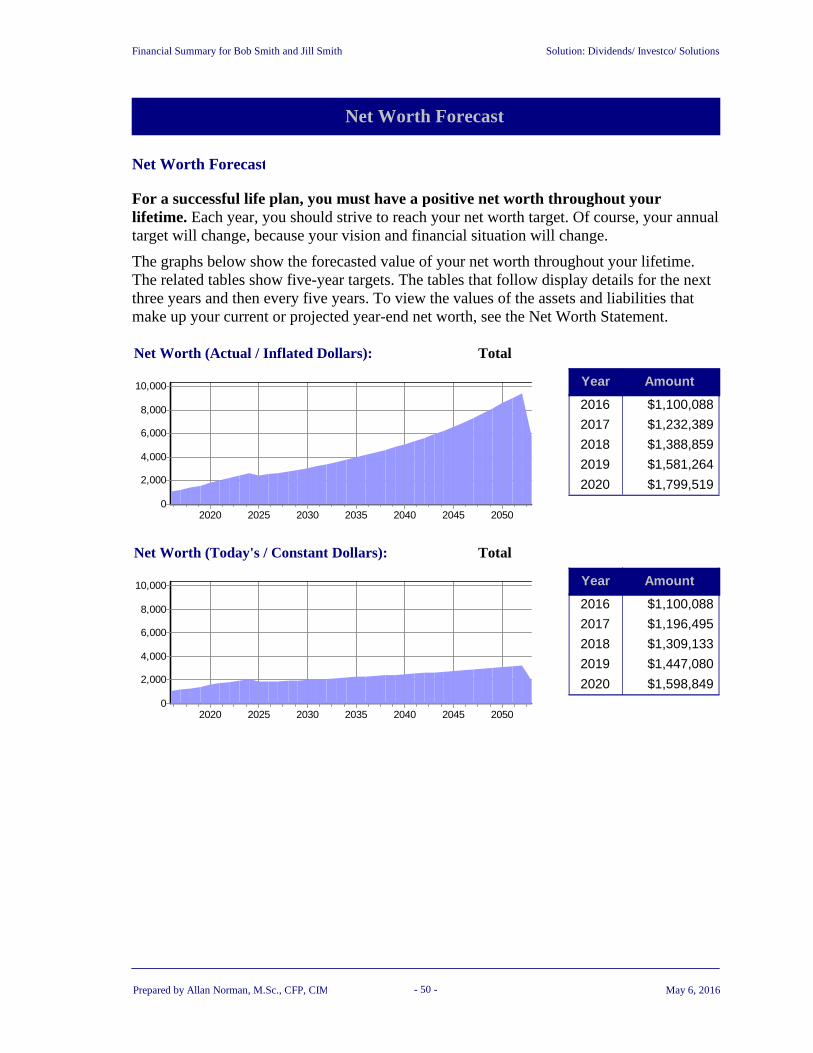
For a successful life plan, you must have a positive net worth throughout your lifetime. Each year, you should strive to reach your net worth target. Of course, your annual target will change, because your vision and financial situation will change.
The graphs below show the forecasted value of your net worth throughout your lifetime. The related tables show five-year targets. The tables that follow display details for the next three years and then every five years. To view the values of the assets and liabilities that make up your current or projected year-end net worth, see the Net Worth Statement.
TotalNet Worth (Actual / Inflated Dollars):
2050204520402035203020252020
10,000
8,000
6,000
4,000
2,000
0
Year Amount
2016 $1,100,088
2017 $1,232,389
2018 $1,388,859
2019 $1,581,264
2020 $1,799,519
TotalNet Worth (Today's / Constant Dollars):
2050204520402035203020252020
10,000
8,000
6,000
4,000
2,000
0
Year Amount
2016 $1,100,088
2017 $1,196,495
2018 $1,309,133
2019 $1,447,080
2020 $1,598,849
Prepared by Allan Norman, M.Sc., CFP, CIM - 50 - May 6, 2016

Financial Summary for Bob Smith and Jill Smith
Net Worth Forecast
Solution: Dividends/ Investco/ Solutions
Assets Stacked Bar Graph (Actual / Inflated Dollars, $000)
Life InsurancePrivate CompaniesRRSPs / Pension PlansOther Accounts/PlansNon-Reg. PortfoliosVehiclesHomes
2050204520402035203020252020
9,000
8,500
8,000
7,500
7,000
6,500
6,000
5,500
5,000
4,500
4,000
3,500
3,000
2,500
2,000
1,500
1,000
500
0
Prepared by Allan Norman, M.Sc., CFP, CIM - 51 - May 6, 2016
Financial Summary for Bob Smith and Jill Smith
Net Worth Forecast
Solution: Dividends/ Investco/ Solutions
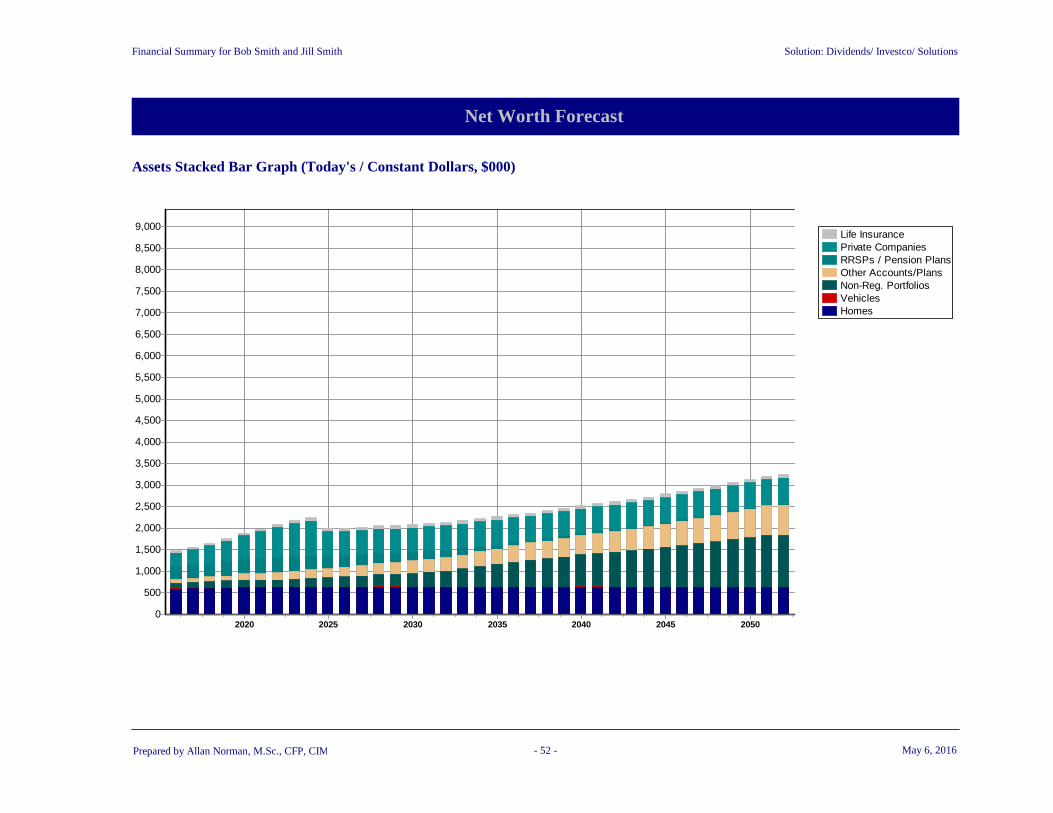
Assets Stacked Bar Graph (Today's / Constant Dollars, $000)
Life InsurancePrivate CompaniesRRSPs / Pension PlansOther Accounts/PlansNon-Reg. PortfoliosVehiclesHomes
2050204520402035203020252020
9,000
8,500
8,000
7,500
7,000
6,500
6,000
5,500
5,000
4,500
4,000
3,500
3,000
2,500
2,000
1,500
1,000
500
0
Prepared by Allan Norman, M.Sc., CFP, CIM - 52 - May 6, 2016

Financial Summary for Bob Smith and Jill Smith
Net Worth Forecast
Solution: Dividends/ Investco/ Solutions
OtherVehiclesHomes
2050204520402035203020252020
380
360
340
320
300
280
260
240
220
200
180
160
140
120
100
80
60
40
20
0
Liabilities Stacked Bar Graph
Prepared by Allan Norman, M.Sc., CFP, CIM - 53 - May 6, 2016
Financial Summary for Bob Smith and Jill Smith
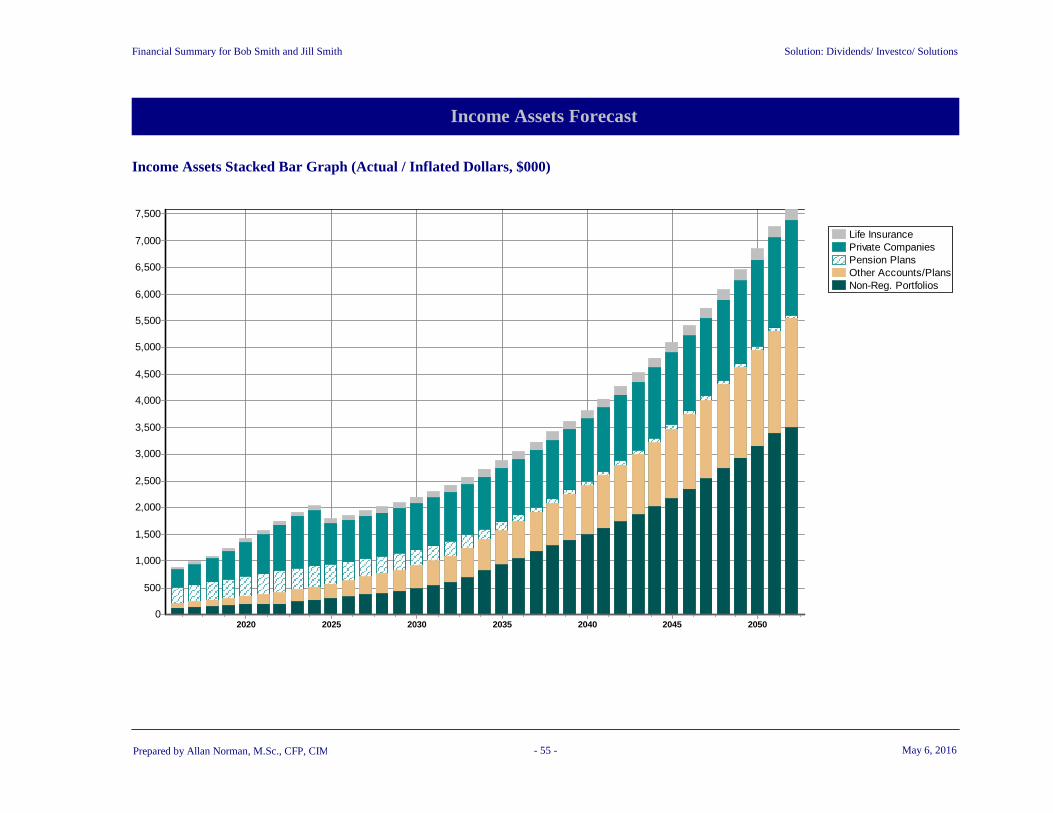
Income Assets Forecast
Income Assets Forecast
Solution: Dividends/ Investco/ Solutions
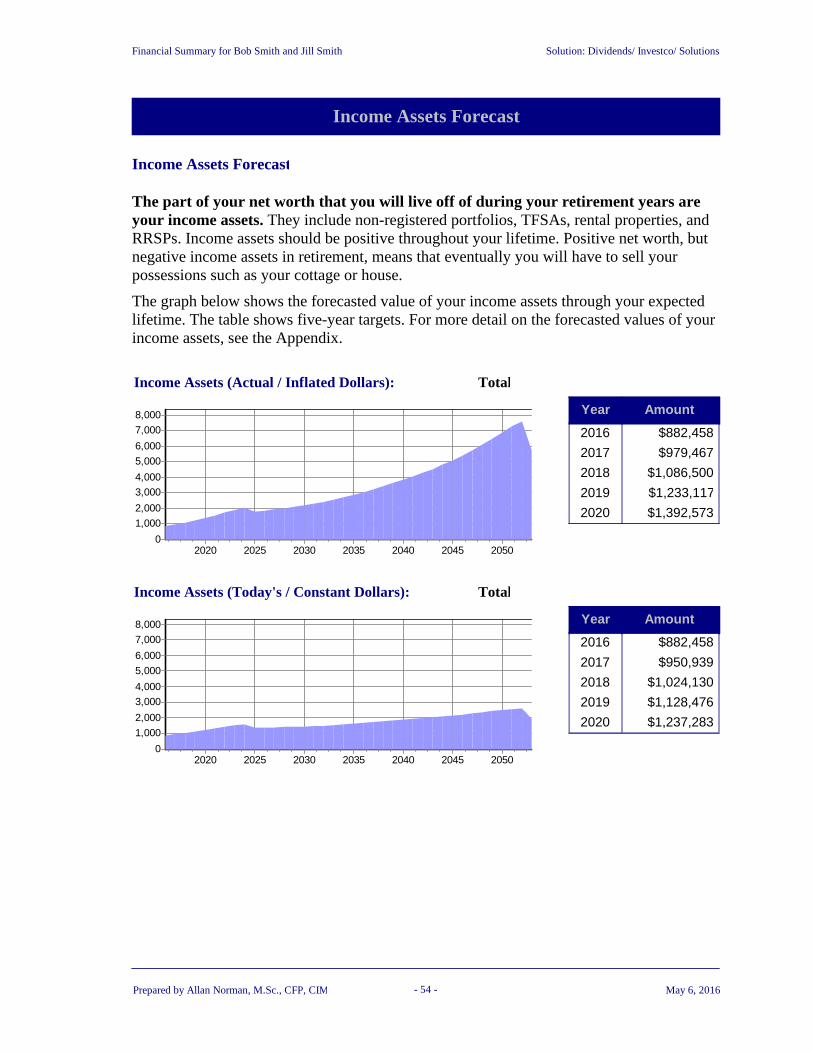
The part of your net worth that you will live off of during your retirement years are your income assets. They include non-registered portfolios, TFSAs, rental properties, and RRSPs. Income assets should be positive throughout your lifetime. Positive net worth, but negative income assets in retirement, means that eventually you will have to sell your possessions such as your cottage or house.
The graph below shows the forecasted value of your income assets through your expected lifetime. The table shows five-year targets. For more detail on the forecasted values of your income assets, see the Appendix.
TotalIncome Assets (Actual / Inflated Dollars):
2050204520402035203020252020
8,000
7,000
6,000
5,000
4,000
3,000
2,000
1,000
0
Year Amount
2016 $882,458
2017 $979,467
2018 $1,086,500
2019 $1,233,117
2020 $1,392,573
TotalIncome Assets (Today's / Constant Dollars):
2050204520402035203020252020
8,000
7,000
6,000
5,000
4,000
3,000
2,000
1,000
0
Year Amount
2016 $882,458
2017 $950,939
2018 $1,024,130
2019 $1,128,476
2020 $1,237,283
Prepared by Allan Norman, M.Sc., CFP, CIM - 54 - May 6, 2016
Financial Summary for Bob Smith and Jill Smith
Income Assets Forecast
Solution: Dividends/ Investco/ Solutions
Income Assets Stacked Bar Graph (Actual / Inflated Dollars, $000)
Life InsurancePrivate CompaniesPension PlansOther Accounts/PlansNon-Reg. Portfolios
2050204520402035203020252020
7,500
7,000
6,500
6,000
5,500
5,000
4,500
4,000
3,500
3,000
2,500
2,000
1,500
1,000
500
0
Prepared by Allan Norman, M.Sc., CFP, CIM - 55 - May 6, 2016

Financial Summary for Bob Smith and Jill Smith
Income Assets Forecast
Solution: Dividends/ Investco/ Solutions
Income Assets Stacked Bar Graph (Today's / Constant Dollars, $000)
Life InsurancePrivate CompaniesPension PlansOther Accounts/PlansNon-Reg. Portfolios
2050204520402035203020252020
7,500
7,000
6,500
6,000
5,500
5,000
4,500
4,000
3,500
3,000
2,500
2,000
1,500
1,000
500
0
Prepared by Allan Norman, M.Sc., CFP, CIM - 56 - May 6, 2016

Financial Summary for Bob Smith and Jill Smith
Beneficiaries
Will
Solution: Dividends/ Investco/ Solutions
Your Will is a vital part of your plan. After the payment of your final expenses such as income taxes, your beneficiaries receive designated dollar amounts and specific assets. The residue of your estate is then distributed. Because the exact amount of the residue is unknown now, it is distributed by percentages.
The tables below summarize the terms of your Will.
Bob JillExpense
Expenses
Funeral and Other Expenses $44,778 $43,474
Legal and Accounting Fees $0 $0
Executor Compensation $0 $0
Spousal Equalization Payment $0 $0
Support Payments $0 $0
Trustee Fees $0 $0
Total $44,778 $43,474
Bob JillAsset
Beneficiary BeneficiaryPercent Percent
Asset Beneficiaries
EstateEstate 100 1002013 Car
BobJill 100 1002015 Car
EstateJill 100 100INVESTCO: Common A
BobEstate 100 100INVESTCO: Common C
BobJill 100 100Our house
Jill 100Tax-Free C.I. - RBC
Dollar
Bob JillBeneficiary
DollarPercent Percent
Dollar and Percent Beneficiaries
Bob 100
Jill 100
$0Total 100 $0 100
Prepared by Allan Norman, M.Sc., CFP, CIM - 57 - May 6, 2016

Financial Summary for Bob Smith and Jill Smith
Beneficiaries
Other Beneficiary Designations
Solution: Dividends/ Investco/ Solutions
Naming the beneficiaries of your TFSAs, DPSPs, annuities, life insurance policies, and registered pension plans is also an important part of creating an estate plan.
Bob JillAsset
Beneficiary BeneficiaryPercent Percent
Asset Beneficiaries
Bob 100OPSU
Bob 100RRSP - Atlantis
Jill 100RRSP
Jill 100TFSA
Bob 100TFSA
Bob JillLife Insurance Policy
Beneficiary BeneficiaryPercent Percent
Life Insurance Beneficiaries
Jill 10010 yrt - Manulife
Bob 10010 yrt - Manulife
Jill 100Whole Life - Sun Life
Prepared by Allan Norman, M.Sc., CFP, CIM - 58 - May 6, 2016

Financial Summary for Bob Smith and Jill Smith
Estate Summary
Forecasted Estate Value
Solution: Dividends/ Investco/ Solutions
Knowing how much your heirs should receive from your estate is part of your life plan. The Estate Value table below shows your beneficiaries and the amount that each will receive according to the terms of your Will. It also shows the beneficiaries that you named for registered plans, annuities, and life insurance policies. The amount shown is a forecast and is based on your expected lifetime. If you died today, the amount would vary.
If you die intestate (without a valid Will), the amount that each beneficiary is forecasted to receive is based on the intestacy laws of your province or territory of residence.
Estate Value: Bob
ComponentBeneficiaries
Sam Sarah
JTWROS Assets
$465,629 $465,629Assets Named In Will
Less Liabilities Transferred
Family Law Transfer
Dollar Allocation Received
50% 50%Percent Allocation Received
$2,209,273 $2,209,273
$35,883 $35,883Registered Plans, Annuities
Life Insurance Benefits
Total Received $2,710,784 $2,710,784
Name Amount
Estate Value Chart: Bob
Sam $2,710,784
Sarah $2,710,784
Prepared by Allan Norman, M.Sc., CFP, CIM - 59 - May 6, 2016

Financial Summary for Bob Smith and Jill Smith
Estate Summary
Solution: Dividends/ Investco/ Solutions
Estate Value: Jill
ComponentBeneficiaries
Bob
JTWROS Assets
$902,233Assets Named In Will
Less Liabilities Transferred
Family Law Transfer
Dollar Allocation Received
100%Percent Allocation Received
$2,152,464
Total Received $4,141,460
Name Amount
Estate Value Chart: Jill
Bob $4,141,460
Prepared by Allan Norman, M.Sc., CFP, CIM - 60 - May 6, 2016

Financial Summary for Bob Smith and Jill Smith
Estate Summary
Residue for Distribution
Solution: Dividends/ Investco/ Solutions
JillComponent Bob
$2,236,956Liquid Assets $5,790,649
$0Insurance Paid to Estate $0
$7,280Taxes Paid at Death $1,257,008
$0U.S. Estate Taxes $0
$33,717Estate Administration Taxes $68,005
$2,195,959After-Tax Residue Assets $4,465,636
$20Liabilities $2,312
$0Bequests and $ Allocations $0
$43,474Funeral and Other Expenses $44,778
$0Legal and Accounting Fees $0
$0Executor and Trustee Fees $0
$0Spousal Equalization / Support $0
$2,152,464Residue for Distribution $4,418,546
Prepared by Allan Norman, M.Sc., CFP, CIM - 61 - May 6, 2016

Financial Summary for Bob Smith and Jill Smith Solution: Dividends/ Investco/ Solutions
Epilogue
Until one is committedthere is hesitancy, the chance to draw back,always ineffectiveness.Concerning all acts of initiative (and creation),there is one elementary truth,the ignorance of which kills countless ideasand splendid plans:that the moment one definitely commits oneself,then Providence moves too.All sorts of things occur to help onethat would never otherwise have occurred.A whole stream of events issues from the decision,raising in one's favour all mannerof unforseen incidents and meetingsand material assistance,which no man could have dreamtwould have come his way.
I have learned a deep respectfor one of Goethe's couplets:'Whatever you can do, or dream you can, begin it.Boldness has genius, power and magic in it.'
W.H. MurrayThe Scottish Himalayan ExpeditionJ. M. Dent & Sons Ltd., 1951.
Prepared by Allan Norman, M.Sc., CFP, CIM - 62 - May 6, 2016

Financial Summary for Bob Smith and Jill Smith
Appendix
General Assumptions
Solution: Dividends/ Investco/ Solutions
We have made the following assumptions:
a) Investments grow at 6%b) The home appreciates at 3%
General Assumptions
Inflation-Rate AssumptionCDN/U.S. Exchange-Rate Assumption
3%$1.33 CDN = $1.00 U.S.
Prepared by Allan Norman, M.Sc., CFP, CIM - A1 - May 6, 2016