financial strategy documentation · 2018-06-30 · financial strategy documentation 2018 regional...
TRANSCRIPT

Financial strategy documentation
2018 Regional Transportation Plan
oregonmetro.gov/rtp
An explanation of methods to develop the 2018-2040 financial forecast
PUBLIC REVIEW DRAFT
June 29, 2018 This draft report is subject to review and consultation with federal partners.
2018 Regional Transportation Plan Appendix H
1
Metro respects civil rights
Metro fully complies with Title VI of the Civil Rights Act of 1964 that requires that no person be excluded from the participation in, be denied the benefits of, or be otherwise subjected to discrimination on the basis of race, color or national origin under any program or activity for which Metro receives federal financial assistance.
Metro fully complies with Title II of the Americans with Disabilities Act and Section 504 of the Rehabilitation Act that requires that no otherwise qualified individual with a disability be excluded from the participation in, be denied the benefits of, or be subjected to discrimination solely by reason of their disability under any program or activity for which Metro receives federal financial assistance.
If any person believes they have been discriminated against regarding the receipt of benefits or services because of race, color, national origin, sex, age or disability, they have the right to file a complaint with Metro. For information on Metro’s civil rights program, or to obtain a discrimination complaint form, visit www.oregonmetro.gov/civilrights or call 503-797-1536.
Metro provides services or accommodations upon request to persons with disabilities and people who need an interpreter at public meetings. If you need a sign language interpreter, communication aid or language assistance, call 503-797-1700 or TDD/TTY 503-797-1804 (8 a.m. to 5 p.m. weekdays) 5 business days before the meeting. All Metro meetings are wheelchair accessible. For up-to-date public transportation information, visit TriMet’s website at www.trimet.org.
Metro is the federally mandated metropolitan planning organization designated by the governor to develop an overall transportation plan and to allocate federal funds for the region.
The Joint Policy Advisory Committee on Transportation (JPACT) is a 17-member committee that provides a forum for elected officials and representatives of agencies involved in transportation to evaluate transportation needs in the region and to make recommendations to the Metro Council. The established decision-making process assures a well-balanced regional transportation system and involves local elected officials directly in decisions that help the Metro Council develop regional transportation policies, including allocating transportation funds.
Project web site: oregonmetro.gov/rtp
The preparation of this report was financed in part by the U.S. Department of Transportation, Federal Highway Administration and Federal Transit Administration. The opinions, findings and conclusions expressed in this report are not necessarily those of the U.S. Department of Transportation, Federal Highway Administration and Federal Transit Administration.
2018 Regional Transportation Plan Appendix H
2

Appendix H – DRAFT 2018 Regional Transportation Plan Financial Strategy Documentation Page 1 of 61
TABLE OF CONTENTS 1.0 Introduction and Summary ..................................................................................................................... 3
1.1 Financial/Fiscal Constraint Overview .................................................................................................. 3
1.2 Reasonable Availability of Expected Funds ......................................................................................... 4
1.3 Year of Expenditure (YOE$) or Constant Year $ .................................................................................. 5
1.4 Constrained Revenue Forecast Summary ........................................................................................... 7
2.0 Economic Conditions ............................................................................................................................. 11
2.1 Economic Summary .......................................................................................................................... 11
2.2 The National Economic Picture ......................................................................................................... 11
2.3 The State of Oregon Economic Picture ............................................................................................. 12
2.4 The Metro Regional Picture .............................................................................................................. 15
2.5 Economic Indicators Summary.......................................................................................................... 18
3.0 Revenue Assumptions ........................................................................................................................... 20
3.1 Revenue Growth and Inflation .......................................................................................................... 20
3.2 Federal Revenues Allocated to Metro .............................................................................................. 20
3.3 Federal Transit Revenues (FTA based revenue allocations) ............................................................. 21
3.4 Federal Funds Allocated to Local Agencies through the ODOT Enhance Program ........................... 22
3.5 Federal Fund Appropriations to the Oregon Department of Transportation (ODOT) ...................... 22
3.6 ODOT Operations Maintenance and Pavement (Fix-It) Program ..................................................... 25
3.7 State Revenue Growth Assumptions ................................................................................................ 28
3.8 Oregon HB2017 ................................................................................................................................. 29
3.9 Local Revenue Assumptions.............................................................................................................. 31
4.0 Revenue Source Summary .................................................................................................................... 35
4.1 Revenue Source Scenarios and Overview ......................................................................................... 35
4.2 Federal Revenue Forecasts (by fund type or funding program) ....................................................... 38
4.3 State and Federal Combined Revenue Forecasts ............................................................................. 42
4.4 Summary of State and Federal Combined Constrained Revenues ................................................... 47
4.5 Local Revenues .................................................................................................................................. 47
4.6 Constrained Revenue Sources Split Across RTP Division Years ........................................................ 49
5.0 Revenue Programs Glossary ................................................................................................................. 53
2018 Regional Transportation Plan Appendix H
3

Appendix H – DRAFT 2018 Regional Transportation Plan Financial Strategy Documentation Page 2 of 61
5.1 Key Federal Revenues ....................................................................................................................... 53
5.2 Federal Transit Agency Sourced Funding .......................................................................................... 58
References .................................................................................................................................................. 61
2018 Regional Transportation Plan Appendix H
4
Appendix H – DRAFT 2018 Regional Transportation Plan Financial Strategy Documentation Page 3 of 61
1.0 INTRODUCTION AND SUMMARY
1.0 Introduction and Summary ...................................................................... Error! Bookmark not defined.
1.1 Financial/Fiscal Constraint Overview ................................................... Error! Bookmark not defined.
1.2 Reasonable Availability of Expected Funds .......................................... Error! Bookmark not defined.
1.3 Year of Expenditure (YOE$) or Constant Year $ ................................... Error! Bookmark not defined.
1.4 Constrained Revenue Forecast Summary ............................................ Error! Bookmark not defined.
Thisappendixsummarizesthefinancialplanningcomponenttothe2018RegionalTransportationPlan(RTP)forthethree‐countyMetroregion.AspartoftheRTPdevelopment,federalregulationsrequireafinancially/fiscallyconstrainedRTPthatclearlydemonstratethattheincludedtotalprojectcostsdonotexceedthetotalrevenuelevelreasonablyexpectedtobeavailabletothegreaterPortlandregionoverthelifeoftheplan.
1. TheFinancialPlanappendixisdividedintofiveprimarysectionswhichincludesthefollowing:
2. Introduction:Ashortintroductionandbriefdiscussionsoffiscalconstraint,definingReasonablyExpectedtobeAvailablefunding,andYearofExpendituremethodologyisincluded.
3. EconomicConditions:Abriefoverviewofthenational,stateandlocaleconomicconditionsisprovidedinthissection.
4. RevenueAssumptions:Keyassumptionsdevelopingtherevenueforecastsareprovedhere.
5. RevenueSourceSummary:Thesummaryoffundingbyfederal,stateandlocalisidentifiedhere.
6. RevenueProgramsGlossary:Revenueprogramdefinitionsanduseparameters.
1.1 Financial/Fiscal Constraint Overview[1]
Financialplanningtakesalong‐rangelookathowtransportationinvestmentsarefunded,andatthepossiblesourcesoffunds.TheRTP,witha20+yearplanninghorizon,mustincludeafinancialplanthatestimateshowmuchfundingwillbeneededtoimplementrecommendedimprovements,aswellasoperateandmaintainthesystemasawhole,overthelifeoftheplan.ThisincludesinformationonhowtheMetroandourpartneringagenciesreasonablyexpecttofundtheprojectsincludedintheplan,includinganticipatedrevenuesfromFHWAandFTA,stategovernment,regionalorlocalsources,theprivatesector,andusercharges.Themetropolitantransportationplanmustdemonstratethatthereisabalancebetweentheexpectedrevenuesourcesfortransportationinvestmentsandtheestimatedcostsoftheprojectsandprogramsdescribedintheplan.Theplanmustbefiscally(orfinancially)constrainedtosatisfytherequirementsidentifiedby23CFR§450.324,DevelopmentandContentoftheMetropolitanTransportationPlan.
2018 Regional Transportation Plan Appendix H
5

Appendix H – DRAFT 2018 Regional Transportation Plan Financial Strategy Documentation Page 4 of 61
Therequirementoffinancial/fiscalconstraintaspartoftheRTPdevelopmenthasbeeninplacesincetheenactmentoftheIntermodalSurfaceTransportationEfficiencyAct(ISTEA)in1991.ItwasfollowedbytheTransportationEquityActforthe21stCentury(TEA‐21)in1998.ItcontinuedaspartoftheSafe,Accountable,Flexible,EfficientTransportationEquityAct:ALegacyforUsers(SAFETEA‐LU)in2005,andmostrecentlyaspartofMovingAheadforProgressinthe21stCentury(MAP‐21)in2012.
Thetotalofallfederal,state,andlocalfundingrevenuestreamsidentifiedovertheRTP20+yearplanninghorizonbecomesthe“financiallyconstrained”portiontotheRTP.Thisbecomestheregion’sbudgettoplanandimplementstrategiestofundspecificprojectsidentifiedintheRTPtomeettheRTP’soutcomes.Theprocesstoidentifyallappropriatefederal,state,andlocalrevenuesourcestobeincludedintheRTPinvolvesusingdifferentmethodologieswhichallmustmeetthefederalcriteriaof“reasonablyexpectedtobeavailable.”
1.2 Reasonable Availability of Expected Funds[2]
Projectingaccuraterevenuestreamsandexpectedfundinglevelsbeyondafive‐yearplanninghorizonisadifficultchallenge.Thecurrentleveloffiscaluncertaintysurroundingthetransportationplanningandimplementationprocessonlyexacerbatesthedifficulty.DuringtheperiodofSAFETEA‐LU,FHWAestablishedtheplanningconceptof“reasonableavailabilityoffunding”enablingametropolitanplanningorganization(MPO),suchasMetro,todeveloprevenueestimates,methodologies,andpotentialnewfundingstreamsthatareexpectedtobeavailabletofundprojectsandRTPstrategiesovertheRTP’splanninghorizonyears.OverthelifeofSAFETEA‐LUandMAP‐21,therevenueforecastingconceptofreasonableavailabilityoffundinghasevolvedandbeenclarifiedtoincludemethodologiessuchas:
Identificationofnewfundingsourcesandlevelsoffundingnotcurrentlyinplace,butarereasonablyexpectedtobeinplaceinthefuture.Examples:
o Estimatingareauthorizationofalong‐termfundingmeasurebasedonpastsupportforthemeasureandprojects.
o Estimatingrevenuesoutofadrafttransportationlegislationbillnotyetapprovedthathasdocumentedstrongsupportinthestatelegislature
Projectingfuturerevenuesusinghistoricaltrendsincludingconsiderationofpastlegislativeorexecutiveactions.Examples:
o Usingtheaverageofformulaallocationfrommultiplepastyearstoprojectannualfutureyearamounts.
o Usingapprovedfuturedevelopmentschedulesandplansthatincludewithdevelopersystemchargestoextrapolatefuturepotentiallocalrevenues.
Projectingfuturerevenuesbasedonvalidandagreeduponeconomicforecastingmethodologies.Example:
2018 Regional Transportation Plan Appendix H
6
Appendix H – DRAFT 2018 Regional Transportation Plan Financial Strategy Documentation Page 5 of 61
o Incorporatingafutureannualgrowthrateorinflationaryescalationbasedonhistoricaltrendsandavailableeconomicprojections
o Projectingthecontinuationofformulaallocationsbasedupontheagreeassumptionanewtransportationfundingbillwillbepassedatsimilarfundingrates.
Identificationofnewrevenuesourcesthatdonotcurrentlyexist,orthatrequireadditionalactionsbeforethestateDOT,MPO,orpublictransportationoperatorcancommitsuchfundingtotransportationprojects.Examples:
o Metro’sHighCapacityTransitfundingmethodologythatwillrequireLegislatureapprovalforthestaterevenuecommitment,butmaycountasconstrainedfundingbasedonprioryearhistoricalallocations.
o Thepassageofafuturegastaxincreasebasedonexistingsupportbythepublicandinthelegislature,
Determiningwhetherafuturefundingsourceisreasonablyexpectedtobeavailableisajudgmentcall.Whendevelopingandutilizingthereasonableavailabilityconcepttoidentifyneworenhancedrevenuesources,twokeyconsiderationsmustbeincludedtodetermineiftheassumptionisreasonable:
1. Evidenceofreviewandsupportofthenewrevenueassumptionsbystateandlocalofficials.
2. Documentationoftherationaleandproceduralstepstobetakenwithmilestonedatesforsecuringthefunds.
The2018RTPfinancialplanincludesanumberofprojectsandstrategiesbasedonreasonableavailabilityoffuturefunding.TheseprojectsandstrategiesareidentifiedwithintheRTPconstrainedlist.The2018RTPfinancialplanincludesanumberofprojectsandstrategiesbasedonreasonableavailabilityoffuturefunding.TheseprojectsandstrategiesareidentifiedwithintheRTPconstrainedlist.Metro’sfinanciallyconstrainedplanincludesacorerevenueforecastconsistingoffederal,state,andlocalfunds.Thefundsareidentifiedwithinthisappendixalongwithasummaryoutliningtheparametersandeligibilityfortheiruse.
Whilecurrentrevenueforecastingmethodologiesassumeacontinuedflowoffederaltransportationfundapportionments,Metroacknowledgestheconsiderablechallengeassociatedwithfinancingfuturetransportationinvestments.ThepossiblefutureinsolvencywiththeHighwayTrustFund,continuedexpandingdemandsforsystemmaintenance,andagrowingpopulationthatwillrequirenewcapacityroadwayandtransitsystemimprovementsrequireMetrotoexamineandevaluatepossiblealternatefundingsourcesbeyondtraditionalfederalsourcestosupportthetransportationdemandwithintheregion.
1.3 Year of Expenditure (YOE$) or Constant Year $
Inaccordancewith23CFR§450.324(g)(11)(iv).Metromustinclude“aninflationrate(s)toreflect“yearofexpendituredollars,”basedonreasonablefinancialprinciplesandinformation,developedcooperativelybytheMPO,State(s),andpublictransportationoperator(s).”
2018 Regional Transportation Plan Appendix H
7

Appendix H – DRAFT 2018 Regional Transportation Plan Financial Strategy Documentation Page 6 of 61
Consistentwiththefederalguidelines,thefinancialplantakesintoaccountinflationandincorporatespossibleinflationaryimpactstotheprojectcosts.
Therationalebehindthisrequirementisthatlong‐rangeestimatesoftransportationcostshaveunderstatedthedeficitbetweencostsandrevenues.ByaddingacostescalatortoprojectcoststoreflecttheminYOEdollars,theimpactofinflationisaddressed.Asecondapproachistoleavetheprojectcostsincurrentyeardollarvalues,andthendiscountthefuturerevenuesintocurrentdollars.Throughthisapproachtheimpactfrominflationupontheannualpurchasingpowerisalsoaddressed.Metro’sreviewoftherequirementdetermineddiscountingtherevenuesbackintocurrentdollarswasthemoreefficientwaytoaddresstheimpactofinflation.Webelieveitpresentsamoreaccuratepictureofcosts,revenues,anddeficitsassociatedwithalong‐rangetransportationplan.Thefollowingprovidesthemethodologyusedincalculatingcostsandrevenuesintodiscounteddollars.
Inflation and 2018 $
ProjectsarereflectedinYOEdollarsoutto2040inmanyoftherevenuetables.TheagreeduponinflationratefortheRTPswassetat3.1%Ratherthanassignaninflationaryvaluetotheprojectcosts,Metrodiscountedestimatedfederalrevenuesbackintocurrentdollars.Thisapproachde‐valuestheestimatedrevenuestoaccountforinflation.TheapproachwasconsistentwiththeODOTLongRangeFundingAssumptions(LRFA)workgroupandwasdevelopedbyODOT’sSeniorEconomistincollaborationwithtransitprovidersandMPOsfortheMPOstousewhenupdatinglong‐rangetransportationplans.Threeoverallrealdollarapproacheswereused:
3. Thebasicapproachstartswithfederalrevenuesstatedin2018YOEdollars.Eachyear,the2018realdollarsarede‐valuedby1%fromtheinitial2018revenuevalue.Thisoccursbecausetheforecastedgrowthisabout2.1‐2.2%annuallyforthefederalfundswhiletheannualinflationratehasbeenestablishedat3.1%.Evenwiththe2.2%growth,thefederalfundsarenotkeepingupwithinflation.Fromthe2018amount,fundsthenlost1%eachyeartoreflecttheminconstant2018$dollars.Thereisnoinflationaryacceleratorormultiplierincludedwiththefunds.The2018$revenuescontinueeachyearlosing1%annually,(or,specifically,1.031%annually).Thisshowstheimpactinflationhasonthetruepurchasingpoweroftherevenues.
4. Convertinginto2016$:Somerevenueswerealreadyconvertedinto2016$.Theseamountswereusedwhereappropriatestartingthenwiththediscounted2018value.
5. NoAnnualGrowth:Athirdversionusedeliminatedannualgrowthresultinginastraight‐line,0%revenuegrowth.Revenuegrowthmayoccurannually,butitisoffsetbyinflation.Eachyearannualinflationcontinuestoweakenthetruepurchasingpowerofthefunds.So,unlesstheannualrevenuesseeatruegrowthofatleast3.1%,therealvaluediminisheseachyearduetoinflation.Thefarthertherevenueprojectionsareshown,thegreatertheimpactontherealpurchasingpoweroftheavailablerevenues.Thisapproachwasusedprimarilyforthelocalrevenuesourcesthatprovided23yearstotals,butdidnotincludeanyannualgrowth.Thetotalamountwasthendividedby23intoannualamountstoaccountforthelengthofthe2018RTPplanningtimeframe.
2018 Regional Transportation Plan Appendix H
8
Appendix H – DRAFT 2018 Regional Transportation Plan Financial Strategy Documentation Page 7 of 61
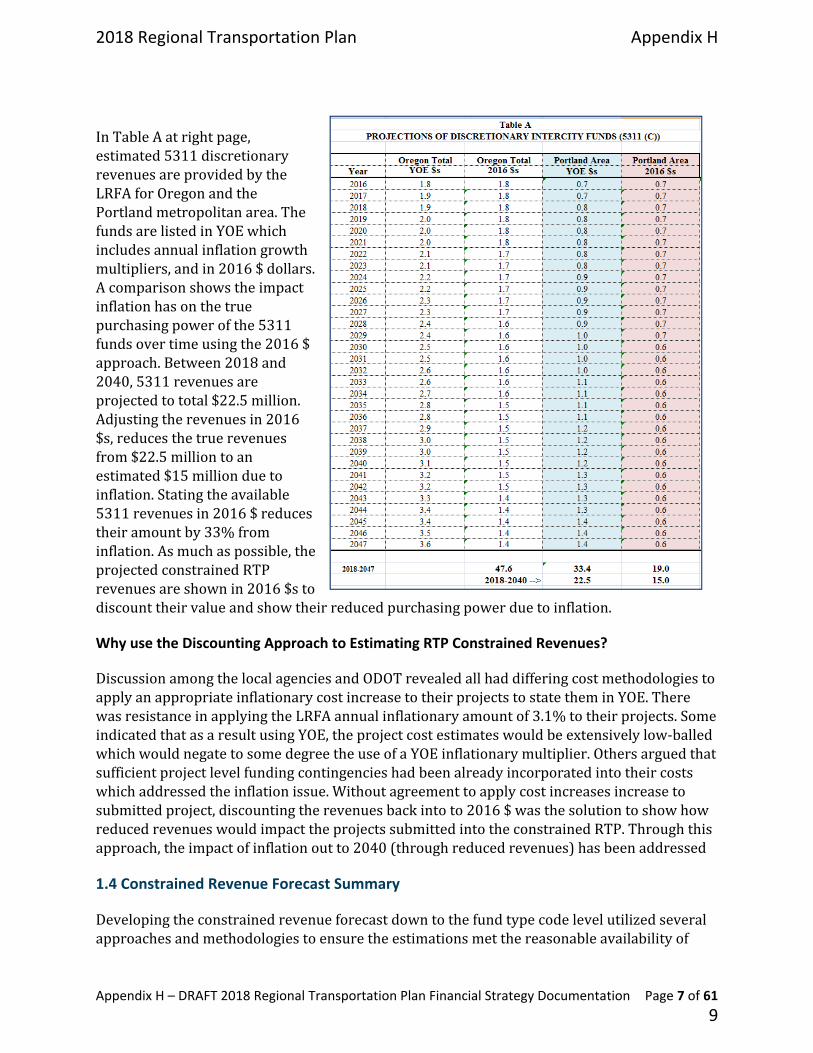
InTableAatrightpage,estimated5311discretionaryrevenuesareprovidedbytheLRFAforOregonandthePortlandmetropolitanarea.ThefundsarelistedinYOEwhichincludesannualinflationgrowthmultipliers,andin2016$dollars.Acomparisonshowstheimpactinflationhasonthetruepurchasingpowerofthe5311fundsovertimeusingthe2016$approach.Between2018and2040,5311revenuesareprojectedtototal$22.5million.Adjustingtherevenuesin2016$s,reducesthetruerevenuesfrom$22.5milliontoanestimated$15millionduetoinflation.Statingtheavailable5311revenuesin2016$reducestheiramountby33%frominflation.Asmuchaspossible,theprojectedconstrainedRTPrevenuesareshownin2016$stodiscounttheirvalueandshowtheirreducedpurchasingpowerduetoinflation.
Why use the Discounting Approach to Estimating RTP Constrained Revenues?
DiscussionamongthelocalagenciesandODOTrevealedallhaddifferingcostmethodologiestoapplyanappropriateinflationarycostincreasetotheirprojectstostatetheminYOE.TherewasresistanceinapplyingtheLRFAannualinflationaryamountof3.1%totheirprojects.SomeindicatedthatasaresultusingYOE,theprojectcostestimateswouldbeextensivelylow‐balledwhichwouldnegatetosomedegreetheuseofaYOEinflationarymultiplier.Othersarguedthatsufficientprojectlevelfundingcontingencieshadbeenalreadyincorporatedintotheircostswhichaddressedtheinflationissue.Withoutagreementtoapplycostincreasesincreasetosubmittedproject,discountingtherevenuesbackintoto2016$wasthesolutiontoshowhowreducedrevenueswouldimpacttheprojectssubmittedintotheconstrainedRTP.Throughthisapproach,theimpactofinflationoutto2040(throughreducedrevenues)hasbeenaddressed
1.4 Constrained Revenue Forecast Summary
Developingtheconstrainedrevenueforecastdowntothefundtypecodelevelutilizedseveralapproachesandmethodologiestoensuretheestimationsmetthereasonableavailabilityof
2018 Regional Transportation Plan Appendix H
9
Appendix H – DRAFT 2018 Regional Transportation Plan Financial Strategy Documentation Page 8 of 61
expectedfundsforthefuture.Theapproachesandmethodologiesusedarediscussedinlatersectionsofthisfinancialplan.
DuetothecentralizedfundingapproachODOTuses,severalfederalandstatefundtypescouldnotbeseparatedandestimatedoutto2040.DeterminingthereasonableavailabilityofsomefederalandstatefundshadtobeaccomplishedthroughODOTprogrammatictotals.Whilethemethodologyuseholdstruethelogicofreasonableavailabilityoffunding,itcouldnotsolvetheODOT“mixing”approachatacentralizedstatewidelevelratherthanbyindividualfundtypecodeidentificationdowntotheMPOandregionallevel.Example,therewasnowaytodeterminetheRegion1reasonableavailabilityofannualSurfaceTransportationBlockGrant(STBG)fundsduetothecentralizedapproachinmixingfederalandstatefundtypesacrossstatewideallocationsandnotspecificregionalallocationsbyindividualfundtypecodes.Thislimitationhasseriousimplicationsfordevelopinganddemonstratingaccuratefiscalconstraintvalidationstothefundtypecodelevelperrequirementsidentifiedacross23CFR450.300‐338.
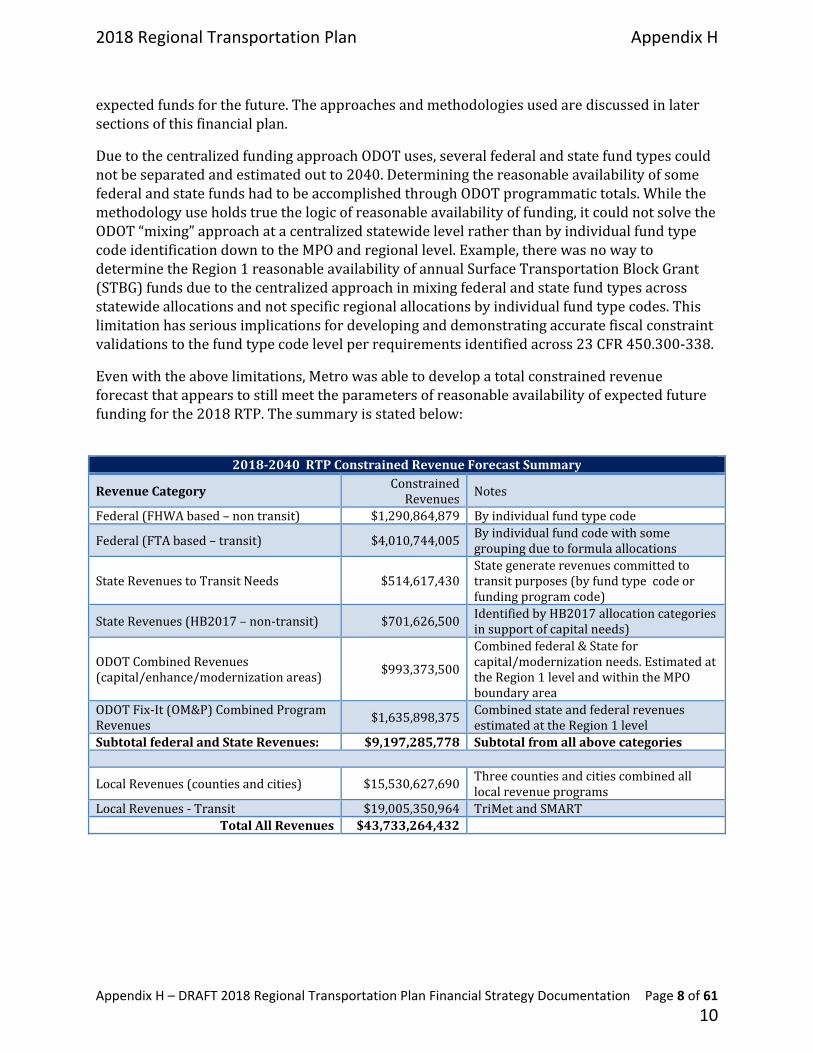
Evenwiththeabovelimitations,Metrowasabletodevelopatotalconstrainedrevenueforecastthatappearstostillmeettheparametersofreasonableavailabilityofexpectedfuturefundingforthe2018RTP.Thesummaryisstatedbelow:
2018‐2040RTPConstrainedRevenueForecastSummary
RevenueCategoryConstrainedRevenues Notes
Federal(FHWAbased–nontransit) $1,290,864,879 Byindividualfundtypecode
Federal(FTAbased–transit) $4,010,744,005 Byindividualfundcodewithsomegroupingduetoformulaallocations
StateRevenuestoTransitNeeds $514,617,430Stategeneraterevenuescommittedtotransitpurposes(byfundtypecodeorfundingprogramcode)
StateRevenues(HB2017–non‐transit) $701,626,500IdentifiedbyHB2017allocationcategoriesinsupportofcapitalneeds)
ODOTCombinedRevenues(capital/enhance/modernizationareas)
$993,373,500
Combinedfederal&Stateforcapital/modernizationneeds.EstimatedattheRegion1levelandwithintheMPOboundaryarea
ODOTFix‐It(OM&P)CombinedProgramRevenues
$1,635,898,375 CombinedstateandfederalrevenuesestimatedattheRegion1level
SubtotalfederalandStateRevenues: $9,197,285,778 Subtotalfromallabovecategories
LocalRevenues(countiesandcities) $15,530,627,690Threecountiesandcitiescombinedalllocalrevenueprograms
LocalRevenues‐Transit $19,005,350,964 TriMetandSMARTTotalAllRevenues $43,733,264,432
2018 Regional Transportation Plan Appendix H
10

Appendix H – DRAFT 2018 Regional Transportation Plan Financial Strategy Documentation Page 9 of 61
2018‐2040RTPConstrainedRevenueForecastSummary
RevenuesEstimatesAdjustedforCapitalvsO&M
RevenueCategory ConstrainedRevenues
Notes
FederalandStateRevenues $9,197,285,778 ByindividualfundtypecodeLocalRevenues(Estimatedavailableforcapitalneeds) $4,971,217,430 3countiesandcitiestogether
LocalRevenuesforTransit(Estimatedavailableforcapitalneeds)
$7,939,217,500 TriMetandSMART
TotalConstrainedRevenuesforProjectsinclusionintheRTP $22,107,72,708
Limitslocalfundstoavailablefundsforcapitalneedsidentifiedbyagencies
As showninthepreviousphaserevenuetablesandbelow,thehypotheticaltotalrevenues43,733,264,432forthegreaterPortlandregiondonotrepresenttheactualavailablerevenuesforregionalsystemcapitalimprovements.Thethreecounties,cities,TriMet,SMART,ODOTallhavetoaddressoperations and maintenance (O&M) needs which removes available revenues from capital improvmenent needs. The regional O&M commitment for the region is significant and consumes approximately 51% of the total identified federal, state, and local revenues identified for the greater Portland region. When removing the estimated O&M funding piece of the transportation revenue forecast decreases the constrained revenue forecast to an estimated $22.1 billion available for capital improvements needs.
Reducingtheidentifiedrevenuesforcapitalimprovementneedsresultsintheshareoffederalandstaterevenuesdoublingfrom21%to42%,asnotedabove.However,thenetfutureshareoffederalfundstothegreaterPortlandregionisanticipatedtodecreaseduetoinflation.Thefederalfundgrowthprojectionwassetat2.2%overtheRTP’syearsof2018‐2040.A2.2%growthforecastisconsideredtobemoderateandrepresentstheprognosisoffavorablelong‐termeconomicgrowthfortheregion.
However,inflationisestimatedtobeannuallyat3.1%.Asaresult,thegreaterPortlandregionwillfaceexpandingchallengestryingtofundfutureprojectsprimarilywithfederalfunds.Thenetimpactofinflationupontransportationrevenueswillresultinadecreasingtruepurchasing
2018 Regional Transportation Plan Appendix H
11

Appendix H – DRAFT 2018 Regional Transportation Plan Financial Strategy Documentation Page 10 of 61
powerofallocatedandavailablefederalfundsfortransportationcapitalprojects.Thegapbetweenavailablefederalfundsandneededfederalfundsfortransportationprojectswillexpandoverfutureyears.EachRTPcycle,theregioncanexpectthecontributionpercentageoffederalfundssupportingneededtransportationprojectstodecrease.Likeawellgoingdry,thegreaterPortlandregionovertimewillfaceashrinkingfederalshareoftransportationrevenuesforneededcapitalimprovementprojects.Otherandadditionalnonfederaltransportationrevenuesourceswillneedtobesecuredtoadequatelymeettheregionaltransportationsystem’scapitalimprovementplusoperationsandmaintenanceprojectneeds.
Remaining Sections of the Constrained Revenue Forecast
Section2discussestheeconomicindicatorsandmethodologiesusedtodeterminetherevenuegrowthprojections.Theeconomicforecastispositive;however,theissueofinflationunderminestherevenuegrowth,especiallytofederalfunds.
Section3identifiesthevariousrevenueprogramsandtheassumptionsintheirallocationamountsanduse.
Section4coversthespecificrevenuesortheirfundingprogramswiththeestimatesoutto2040.
Section5providesafederalglossaryoftherevenueprogramdefinitionsanduses.
2018 Regional Transportation Plan Appendix H
12
Appendix H – DRAFT 2018 Regional Transportation Plan Financial Strategy Documentation Page 11 of 61
2.0 ECONOMIC CONDITIONS
2.0 Economic Conditions ................................................................................ Error! Bookmark not defined.
2.1 Economic Summary ............................................................................. Error! Bookmark not defined.
2.2 The National Economic Picture ............................................................ Error! Bookmark not defined.
2.3 The State of Oregon Economic Picture ................................................ Error! Bookmark not defined.
2.4 The Metro Regional Picture ................................................................. Error! Bookmark not defined.
2.5 Economic Indicators Summary............................................................. Error! Bookmark not defined.
2.1 Economic Summary[3][4]
Theoveralleconomichealthofthenation,thestate,andtheregionallcombinetoinfluencetherevenueforecastsofavailablerevenuesfortransportationprojectsthrough2040.MosteconomicexpertsagreethatthenationaleconomyhasimprovedsincetheGreatRecessionof2008‐09.Atthenationallevel,fearsofglobaleconomicvulnerabilitiestoglobalinflationandtoanotherbankingmeltdowncontinuetosurface.Atthestatelevel,thepictureforOregonismoreoptimistic,withjobandincomegrowthbeingcitedasclearindicatorsofastrengtheningeconomy.Yet,punditsalsowarntowatchoutforstormcloudsthatcouldbeonthehorizon.Attheregionallevel,thepictureisencouragingaswell.Asof2018,thePortlandareaisnowexperienceaconstructionlaborshortfallduetoaboomingconstructionsectioninbothprivateandpublicinfrastructureimprovements.
2.2 The National Economic Picture
The glass is murky
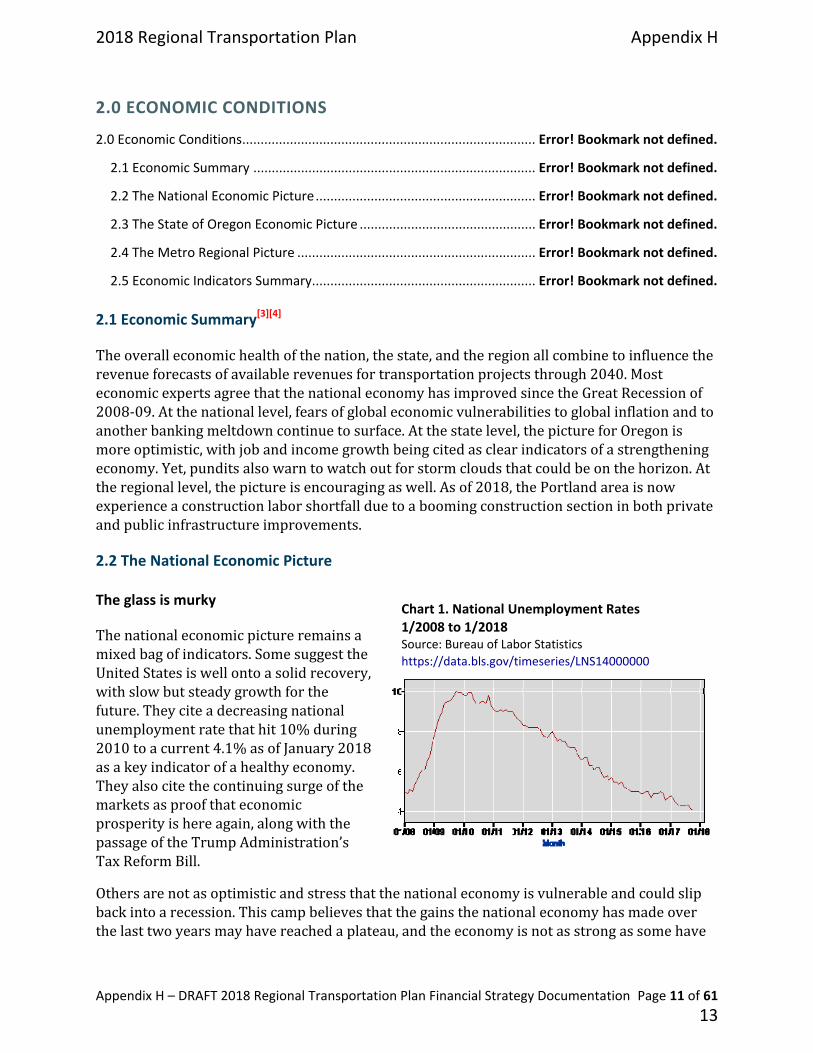
Thenationaleconomicpictureremainsamixedbagofindicators.SomesuggesttheUnitedStatesiswellontoasolidrecovery,withslowbutsteadygrowthforthefuture.Theyciteadecreasingnationalunemploymentratethathit10%during2010toacurrent4.1%asofJanuary2018asakeyindicatorofahealthyeconomy.Theyalsocitethecontinuingsurgeofthemarketsasproofthateconomicprosperityishereagain,alongwiththepassageoftheTrumpAdministration’sTaxReformBill.
Othersarenotasoptimisticandstressthatthenationaleconomyisvulnerableandcouldslipbackintoarecession.Thiscampbelievesthatthegainsthenationaleconomyhasmadeoverthelasttwoyearsmayhavereachedaplateau,andtheeconomyisnotasstrongassomehave
Chart 1. National Unemployment Rates 1/2008 to 1/2018 Source: Bureau of Labor Statistics https://data.bls.gov/timeseries/LNS14000000
2018 Regional Transportation Plan Appendix H
13
Appendix H – DRAFT 2018 Regional Transportation Plan Financial Strategy Documentation Page 12 of 61
reported.Theyfearthemarketsreflectaneconomicbubble,whichalongwiththebankingandrealestatesectors,willburstsoon,plungingthenationaleconomyintorecessionagain.Theycitethemarketsell‐offduringFebruary2018asproofofasymptomofafragileeconomythatgoesbeyondarequiredcorrection.
Overall,manyeconomistsandfinancialinvestmentleadersareoptimisticaboutournationaleconomicfuture.Theypointtodecreasingunemploymentnumbers,strongjobgrowthinmultipleregionalareas,andstressopinionsthatmanyindustrialsectorsarepoisedforsignificantinvestmentandexpansionoverthenextseveralyears.Theoneconditionalsoexpressedforageneraloptimistexpansionperiodisthatinflationmustbemaintainedandkeptundercontrol.
2.3 The State of Oregon Economic Picture
Perhaps the glass is half-full
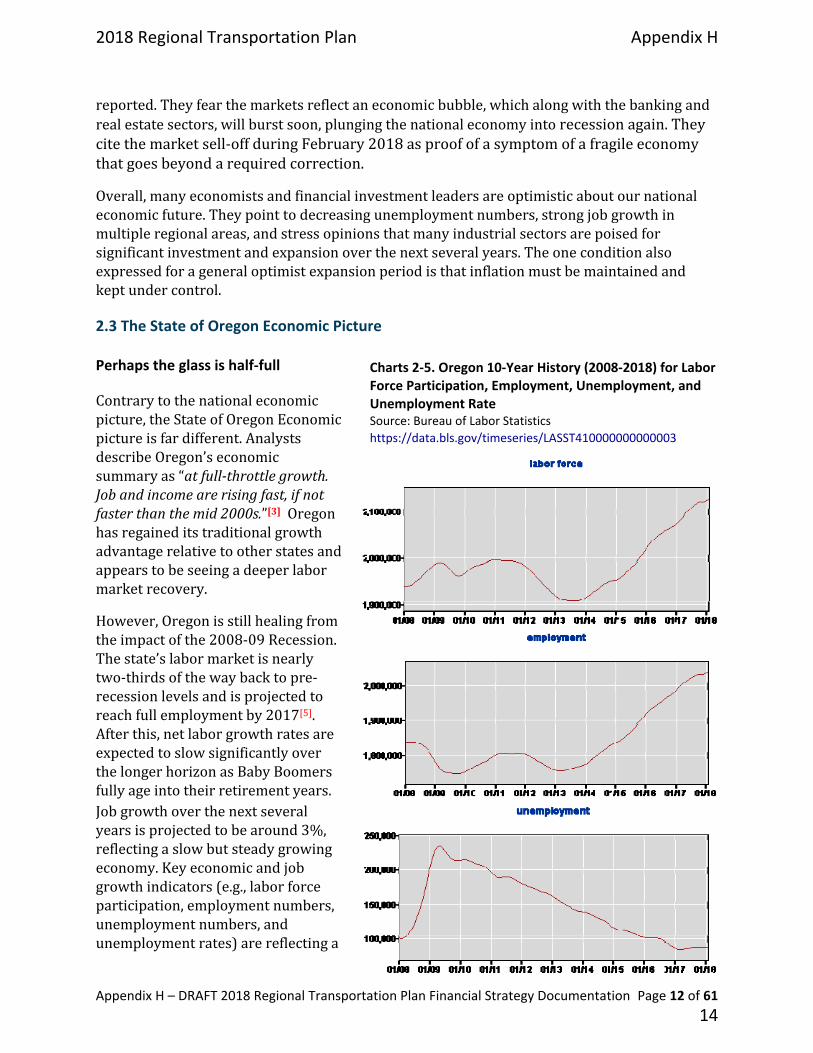
Contrarytothenationaleconomicpicture,theStateofOregonEconomicpictureisfardifferent.AnalystsdescribeOregon’seconomicsummaryas“atfull‐throttlegrowth.Jobandincomearerisingfast,ifnotfasterthanthemid2000s.”[3]Oregonhasregaineditstraditionalgrowthadvantagerelativetootherstatesandappearstobeseeingadeeperlabormarketrecovery.
However,Oregonisstillhealingfromtheimpactofthe2008‐09Recession.Thestate’slabormarketisnearlytwo‐thirdsofthewaybacktopre‐recessionlevelsandisprojectedtoreachfullemploymentby2017[5].Afterthis,netlaborgrowthratesareexpectedtoslowsignificantlyoverthelongerhorizonasBabyBoomersfullyageintotheirretirementyears.Jobgrowthoverthenextseveralyearsisprojectedtobearound3%,reflectingaslowbutsteadygrowingeconomy.Keyeconomicandjobgrowthindicators(e.g.,laborforceparticipation,employmentnumbers,unemploymentnumbers,andunemploymentrates)arereflectinga
Charts 2-5. Oregon 10-Year History (2008-2018) for Labor Force Participation, Employment, Unemployment, and Unemployment Rate Source: Bureau of Labor Statistics https://data.bls.gov/timeseries/LASST410000000000003
2018 Regional Transportation Plan Appendix H
14
Appendix H – DRAFT 2018 Regional Transportation Plan Financial Strategy Documentation Page 13 of 61
positiveturnaroundforthestate’soveralleconomichealth.
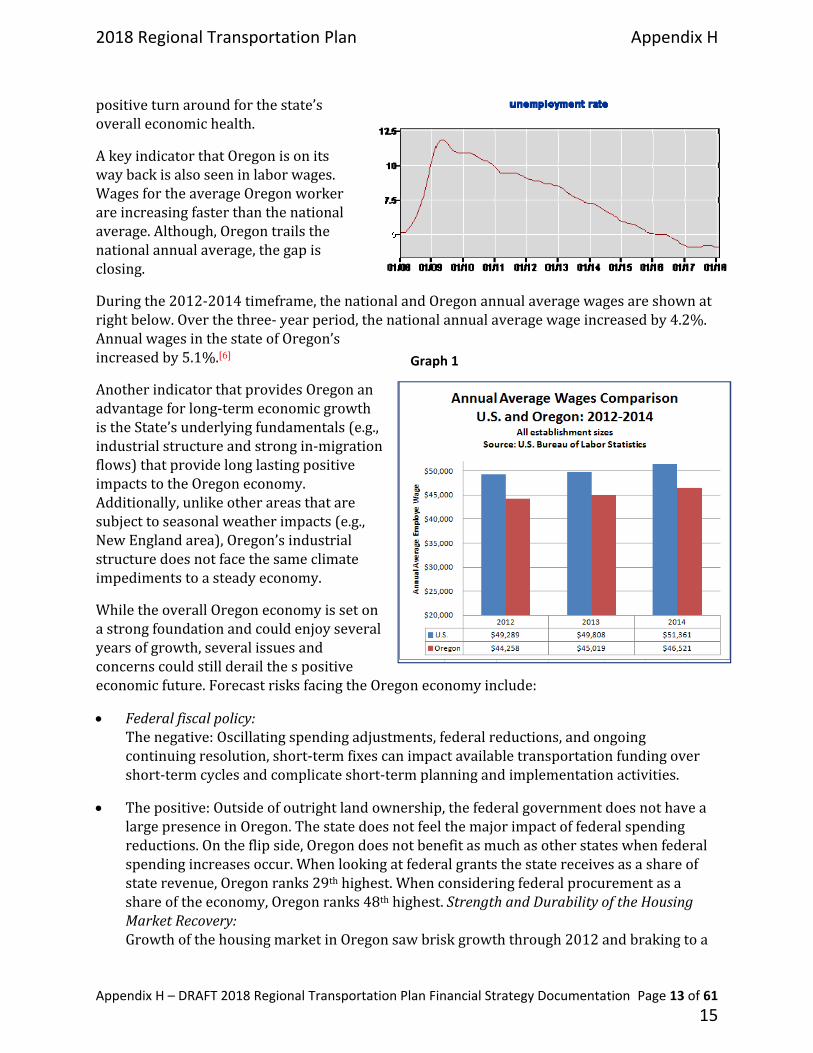
AkeyindicatorthatOregonisonitswaybackisalsoseeninlaborwages.WagesfortheaverageOregonworkerareincreasingfasterthanthenationalaverage.Although,Oregontrailsthenationalannualaverage,thegapisclosing.
Duringthe2012‐2014timeframe,thenationalandOregonannualaveragewagesareshownatrightbelow.Overthethree‐yearperiod,thenationalannualaveragewageincreasedby4.2%.AnnualwagesinthestateofOregon’sincreasedby5.1%.[6]
AnotherindicatorthatprovidesOregonanadvantageforlong‐termeconomicgrowthistheState’sunderlyingfundamentals(e.g.,industrialstructureandstrongin‐migrationflows)thatprovidelonglastingpositiveimpactstotheOregoneconomy.Additionally,unlikeotherareasthataresubjecttoseasonalweatherimpacts(e.g.,NewEnglandarea),Oregon’sindustrialstructuredoesnotfacethesameclimateimpedimentstoasteadyeconomy.
WhiletheoverallOregoneconomyissetonastrongfoundationandcouldenjoyseveralyearsofgrowth,severalissuesandconcernscouldstillderailthespositiveeconomicfuture.ForecastrisksfacingtheOregoneconomyinclude:
Federalfiscalpolicy:Thenegative:Oscillatingspendingadjustments,federalreductions,andongoingcontinuingresolution,short‐termfixescanimpactavailabletransportationfundingovershort‐termcyclesandcomplicateshort‐termplanningandimplementationactivities.
Thepositive:Outsideofoutrightlandownership,thefederalgovernmentdoesnothavealargepresenceinOregon.Thestatedoesnotfeelthemajorimpactoffederalspendingreductions.Ontheflipside,Oregondoesnotbenefitasmuchasotherstateswhenfederalspendingincreasesoccur.Whenlookingatfederalgrantsthestatereceivesasashareofstaterevenue,Oregonranks29thhighest.Whenconsideringfederalprocurementasashareoftheeconomy,Oregonranks48thhighest.StrengthandDurabilityoftheHousingMarketRecovery:GrowthofthehousingmarketinOregonsawbriskgrowththrough2012andbrakingtoa
Graph 1
2018 Regional Transportation Plan Appendix H
15

Appendix H – DRAFT 2018 Regional Transportation Plan Financial Strategy Documentation Page 14 of 61
completestallin2013,withrecoverytomoderategrowthin2014.Howlongthehousingmarketcontinuestoimprove,andtowhatdegreecanandwilltheimpactbeupontheoverallstateeconomy,isatopicforongoingdebate.Whilethehousingmarketappearstohavepassedthecrucibleofforeclosureactivity,salesofbothexistinghomesandnewconstructiondoesnotyetapproachpre‐recessionlevels.Anotherconcernisthepossibilityofanothersubprimeraterealestatebubbleemergingthatcouldnegativelyimpactthehousingmarketagain.
RealEstateSupplyNotKeepingUpDemand:Expectationsarethatinastableandgrowingeconomy,newconstructionstartswillincreaseaswelltohelpmeettheincreaseindemand.Asdemandoutweighssupply,rentalpriceshaveincreasedandhomeaffordabilityisdecreasing.Asrentsandhomepricesareincreasedfasterthanincomeandwages,householdsarefacinglessdiscretionaryincometospendinotherareas,impactingretailsaleareas.Questionsremainifnewconstructionactivitywillpickupsufficientlytoalleviatethedemandandhelpimprovehomerentalandownershipaffordability.
CommodityPriceIndexandInflation:ThelastperiodofextremeinflationintheUnitedStatesoccurredduringthe1970swheninflationexceeded10%andhitalmost14%during1979.ThehighinflationaryimpactchangedthemonetarypolicyfortheUnitedStatesfrom1980onward.TheFederalReserveSystem(orFed)implementednewprocedurestocloselymonitorinflationtoensureradicalperiodsofinflationdidnotoccuragain.
For the most part, the Fed has controlled inflation and kept it to a creep over the past twenty years. However, fears still abound that Untied States could again experience a hyper-inflation period brought on by global economic instability or as a result of out-of-control growth. Part of the rationale is that global economic instability could result in world-wide commodity shortages resulting in extremepriceincreases.EachyeartheFedmustdecideifinterestratesshouldberaisedtoreducethemoneysupplyasawaytocontrol
Charts 6-7. CPI – All Urban Consumers 10-year inflation rate 2008-2018 Source: Bureau of Labor Statistics https://data.bls.gov/timeseries/CUUR0000SA0L1E?output view=pct 12mths
2018 Regional Transportation Plan Appendix H
16
Appendix H – DRAFT 2018 Regional Transportation Plan Financial Strategy Documentation Page 15 of 61
inflation.Sincethe2008‐09Recession,theFedhasheldoffsignificantlyraisinginterestrates.Rateincreasesareoccurringasof2017,butnotinthemannerthatwouldindicateanattempttooff‐sethyperinflation
Overall,theeconomicpictureappearspositiveandfavorableforsteadylongtermgrowth.Thestatepossessesalltheneededresources,multipleeconomiclegs,laborsupply,tourism,qualityofliferesources,etc.todevelopandsustainlong‐termeconomicgrowth.Atthesametime,thereexistsomeseriouschallengesjustbeyondthehorizonthatcouldimpactlong‐termeconomicgrowthandavailablefundingfortransportation.The2018RTPFinancialPlanRevenueForecastreflectsapragmaticbutoptimisticsetofassumptionsaboutfuturerevenue.
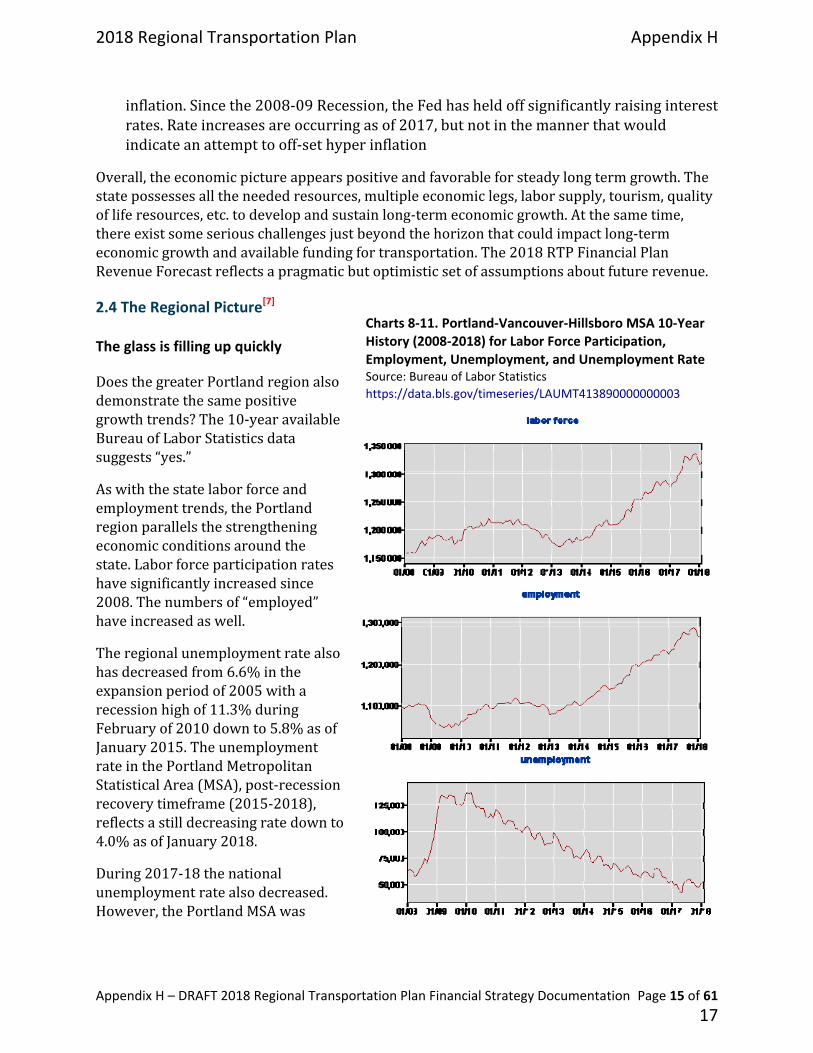
2.4 The Regional Picture[7]
The glass is filling up quickly
DoesthegreaterPortlandregionalsodemonstratethesamepositivegrowthtrends?The10‐yearavailableBureauofLaborStatisticsdatasuggests“yes.”
Aswiththestatelaborforceandemploymenttrends,thePortlandregionparallelsthestrengtheningeconomicconditionsaroundthestate.Laborforceparticipationrateshavesignificantlyincreasedsince2008.Thenumbersof“employed”haveincreasedaswell.
Theregionalunemploymentratealsohasdecreasedfrom6.6%intheexpansionperiodof2005witharecessionhighof11.3%duringFebruaryof2010downto5.8%asofJanuary2015.TheunemploymentrateinthePortlandMetropolitanStatisticalArea(MSA),post‐recessionrecoverytimeframe(2015‐2018),reflectsastilldecreasingratedownto4.0%asofJanuary2018.
During2017‐18thenationalunemploymentratealsodecreased.However,thePortlandMSAwas
Charts 8-11. Portland-Vancouver-Hillsboro MSA 10-Year History (2008-2018) for Labor Force Participation, Employment, Unemployment, and Unemployment Rate Source: Bureau of Labor Statistics https://data.bls.gov/timeseries/LAUMT413890000000003
2018 Regional Transportation Plan Appendix H
17
Appendix H – DRAFT 2018 Regional Transportation Plan Financial Strategy Documentation Page 16 of 61
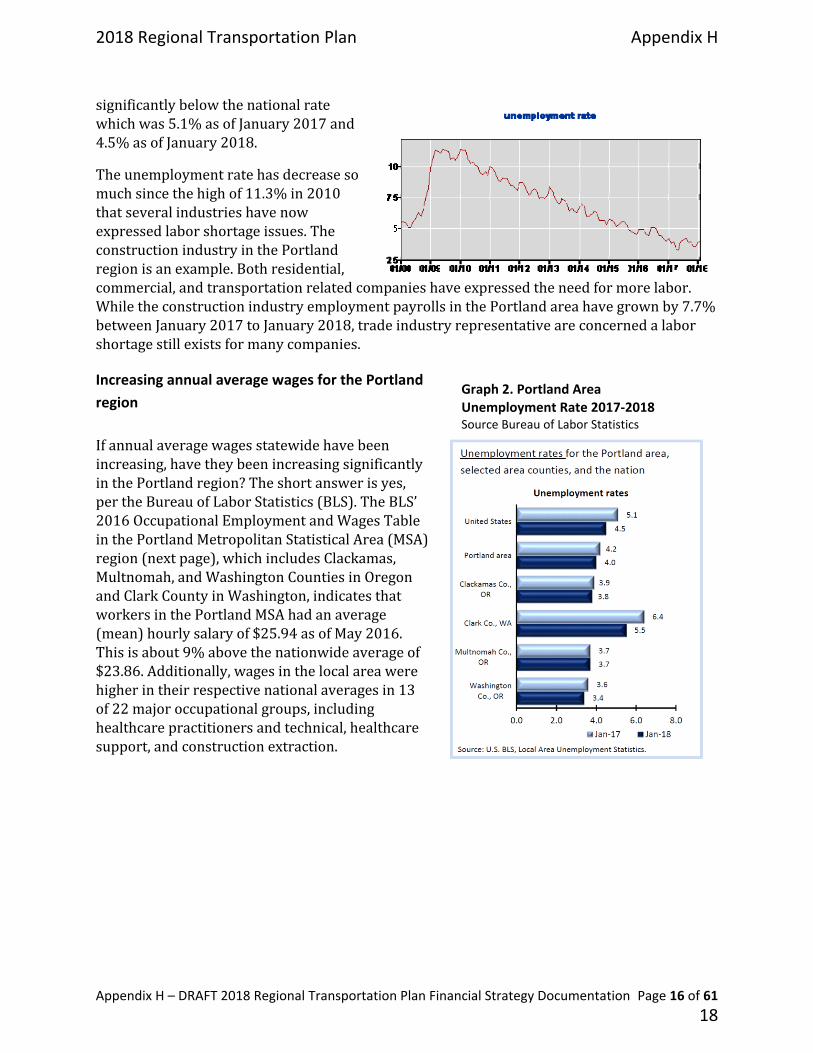
significantlybelowthenationalratewhichwas5.1%asofJanuary2017and4.5%asofJanuary2018.
Theunemploymentratehasdecreasesomuchsincethehighof11.3%in2010thatseveralindustrieshavenowexpressedlaborshortageissues.TheconstructionindustryinthePortlandregionisanexample.Bothresidential,commercial,andtransportationrelatedcompanieshaveexpressedtheneedformorelabor.WhiletheconstructionindustryemploymentpayrollsinthePortlandareahavegrownby7.7%betweenJanuary2017toJanuary2018,tradeindustryrepresentativeareconcernedalaborshortagestillexistsformanycompanies.
Increasing annual average wages for the Portland
region
Ifannualaveragewagesstatewidehavebeenincreasing,havetheybeenincreasingsignificantlyinthePortlandregion?Theshortanswerisyes,pertheBureauofLaborStatistics(BLS).TheBLS’2016OccupationalEmploymentandWagesTableinthePortlandMetropolitanStatisticalArea(MSA)region(nextpage),whichincludesClackamas,Multnomah,andWashingtonCountiesinOregonandClarkCountyinWashington,indicatesthatworkersinthePortlandMSAhadanaverage(mean)hourlysalaryof$25.94asofMay2016.Thisisabout9%abovethenationwideaverageof$23.86.Additionally,wagesinthelocalareawerehigherintheirrespectivenationalaveragesin13of22majoroccupationalgroups,includinghealthcarepractitionersandtechnical,healthcaresupport,andconstructionextraction.
Graph 2. Portland Area Unemployment Rate 2017-2018 Source Bureau of Labor Statistics
2018 Regional Transportation Plan Appendix H
18

Appendix H – DRAFT 2018 Regional Transportation Plan Financial Strategy Documentation Page 17 of 61
Local Inflation Trends:
“Inflation”reflectsageneralincreaseinpricesandfallinthepurchasingvalueofmoney.Theinflationratemeasuresofhowfastacurrencylosesitsvalue.Theinflationratemayriseduetomassiveprintingofmoney,whichincreasessupplyintheeconomyandthusreducesdemand.Equally,itmayoccurbecausecertainimportantcommoditiesbecomerarerandthusmoreexpensive.Centralbanksattempttocontroltheinflationratebyincreasinganddecreasingthemoneysupply.ThestandardmeasurementofthechangeinprocessistheConsumerPriceIndex(CPI).AsmonitoredbytheBureauofLaborStatistics,theCPIameasureoftheaveragechangeovertimeinthepricespaidbyurbanconsumersforamarketbasketofconsumergoodsandservices.
FromtheBLSCPIPortlandMSASecondhalfof2017report,thePortlandMSAareaCPIrose3.9%.TheBLSreportattributesmuchoftheincreasetotheriseinthepriceofgasolineandmedicalcare.Thisreflectsasignificantincreaseininflationfortheregionastheannuallyaveragesince2012hasrangedfromaslowas1.5%to2.5%.The2017rateof3.9%isnotexpectedtolastanddecreasedowntowardsthe3%range.Nationally,theone‐yearchangefromMarch2017toMarch2018sawtheCPIrise2.4%.
Table B. Key Occupation Wage Comparison for the Portland-Vancouver MSA and U.S., May 2016 Source: Bureau of Labor Statistics
2018 Regional Transportation Plan Appendix H
19

Appendix H – DRAFT 2018 Regional Transportation Plan Financial Strategy Documentation Page 18 of 61
ThevarianceinCPIbetween
nationalchangesandthePortlandarea’sinflationaryfluctuationsresultedintheODOTLongRangeFundingAssumptionsworkgrouptoadopta3.1%averageinflationratetouseindevelopmentoftheMPO’sRegionalTransportationPlans.Theratesignifiesthatoverallinflationwillnotgetoutofcontrol,butacknowledgesthatthePortlandregioncouldexperienceshortperiodsofhigherinflationduetothecontinuedgrowthandexpansion. Tohelpavoidplanningimpactsofpossiblefutureshort‐terminflationaryswings,FHWAimposedaninflationaryyearofexpenditure(YOE)requirementtoaddresstheimpactofinflationonthetruepurchasingpowerofidentifiedrevenues.MPOshavetwoapproachestocomplywiththeYOErequirement:AddinflationarycoststoeachprojectontheconstrainedRTP.Or,discounttheidentifiedrevenuestoaddressinflation.Metrochosethelattertodiscounttherevenues.Thiswasdiscussedinmoredetailpreviouslyinsection1.3.
2.5 Economic Indicators Summary
Thereviewofthemajoreconomicindicatorsnationally,atthestatelevelandacrossthemetropolitanMetroareasupportslongtermpositivegrowthandanoptimisticeconomicpicture.TheLFRAassessmentisoptimisticaswellresultinginalong‐termeconomicgrowthprojectionthatisrevealedinthefederalrevenueestimates.Alleconomicindicatorsfromlaborforceparticipation,employment,unemployment,andwagesreflectcurrentandfuturestrongeconomicgrowth.CPIandinflationremainsasabitofawildcardthatcouldtripupthefuturestateandregionaleconomy.However,withtheFederalReserveBoard’sstronganti‐inflationaryfiscalpoliciesbeingimplemented,thelikelihoodofhyperinflationorprolongedperiodsofhighinflationdonotappearevidentforthefuture.
Chart 13. The Economic Daily – CPI 12 month National March 2017 to March 2018 Source Bureau of Labor Statistics https://www.bls.gov/opub/ted/2018/consumer-price-index-rose-2-point-4-percent-over-the-year-ending-march-2018.htm
Graph 3. CPI Changes first half and second half 2014-2017
2018 Regional Transportation Plan Appendix H
20
Appendix H – DRAFT 2018 Regional Transportation Plan Financial Strategy Documentation Page 19 of 61
Aspositiveaseconomicpictureappearstoberesultinginexpectedmoderatelyhighgrowthforfuturetransportationfederalandstaterevenueestimates,theLRFAcouldnotsupportakeyeconomicassumptionthatmostfutureannualfederalandstaterevenueswillnotexceedannualinflation.EventhepassageoftheFASTActandtheefforttoresolvetheinsolvencytotheHighwayTrustFundwasnotenoughtojustifyanLRFAforecastthatfederalrevenuegrowthwouldbeat3.1%orhigher.Meetingorexceedingannualinflationwouldrepresentanextremelystrongeconomicgrowthforecastwhichdoesnotappeartobeevident.TheLRFA’spositionsupportsamoderaterevenuegrowthforecast.TheLRFAestablisheda2.2%annualgrowthforecastformostfederalfundstousefortheMPO’sRTPs.
Thefederalrevenueforecastofanannualgrowthrateof2.2%isstillveryoptimisticwhenactualannualfederalrevenuegrowthrateshavebeenaround1.5%‐2.0%.However,itstilltrailstheannualinflationbyabout1%.Thisleavestheregionwiththeunfortunaterealizationthatthefederalsharetomajortransportationprojectswillcontinuetodecreaseforthefuture.Otherrevenueoptionswillneedtobeexploredtohelpoff‐setthecontinuinglossoffederalrevenuesfortransportationinfrastructureimprovements.
2018 Regional Transportation Plan Appendix H
21
Appendix H – DRAFT 2018 Regional Transportation Plan Financial Strategy Documentation Page 20 of 61
3.0 REVENUE ASSUMPTIONS
3.0 Revenue Assumptions .............................................................................. Error! Bookmark not defined.
3.1 Revenue Growth and Inflation ............................................................. Error! Bookmark not defined.
3.2 Federal Revenues Allocated to Metro ................................................. Error! Bookmark not defined.
3.3 Federal Transit Revenues (FTA based revenue allocations) ................ Error! Bookmark not defined.
3.4 Federal Funds Allocated to Local Agencies through the ODOT Enhance Program ... Error! Bookmark
not defined.
3.5 Federal Fund Appropriations to the Oregon Department of Transportation (ODOT) ................ Error!
Bookmark not defined.
3.6 ODOT Operations Maintenance and Pavement (Fix-It) Program ........ Error! Bookmark not defined.
3.7 State Revenue Growth Assumptions ................................................... Error! Bookmark not defined.
3.8 Oregon HB2017 .................................................................................... Error! Bookmark not defined.
3.9 Local Revenue Assumptions................................................................. Error! Bookmark not defined.
3.1 Revenue Growth and Inflation
ThisfinancialplancontinuesusinghistoricalapportionmentandallocationtrendsandassumesthatCongresscanresolvetheinsolvencyissuesfacingtheHighwayTrustFund.Metroacknowledgesthefund’sinsolvencyissueisseriousandthepassageoftheFASTActisnotthecompletesolution.Congresswillneedtoimplementadditionallong‐termsolutionstomaintainthefund’ssolvency.Since2005,therehavebeenfluctuations,butoverallMetrohasreceiveditsannualappropriationswithinthehistoricalallocationtrends.
TheconsensusoftheODOTLongRangeFundingAssumptions(LRFA)workgroupandwiththepassageoftheFASTActisthatfederalfundingappropriationswillcontinueattheirhistoricallevelsandseemoderategrowthforthefuture.TheLRFArecommendedanaverage2.2%annualgrowthrateformanyoftheidentifiedfederalfunds.Whilethisrepresentsasolidfuturerevenueforecast,theexpectedandLRFAadoptedinflationrateisprojectedtobe3.1%.Thisequatestoaconstantdollarvaluelossofabout1%annually.
Sincethefederalfundswillnotkeepupwithannualinflation,theirrealcontributiontotransportationprojectswillcontinuetobediminishedovertime.Otherrevenuesources,especiallylocallygeneratedsources,willneedtobetopursuedsuchasself‐helptaxmeasures,regionalassessments,orotherideasthatresidentswillsupporttohelpoffsettheprojectedandongoingdecreaseofavailablefederalfundsfortransportationprojects.
3.2 Federal Revenues Allocated to Metro
MetroreceivesanannualapportionmentfromODOTforthreefederalfundingprograms:
SurfaceTransportationBlockGrantSTBG)funds.
2018 Regional Transportation Plan Appendix H
22

Appendix H – DRAFT 2018 Regional Transportation Plan Financial Strategy Documentation Page 21 of 61
CongestionMitigationAirQuality(CMAQ)improvementfunds.
TransportationAlternatives(TA)funds.
Metroisadirectrecipientoftheabovefundsandresponsiblefortheirmanagement,allocation/distribution,programminginthefour‐yearMetropolitanTransportationImprovementProgram(MTIP),plusprovidingexpenditureandreimbursementmonitoringinpartnershipwithODOTtoensurethefundsareusedcorrectlyandinatimelyfashion.
MetroalsoisresponsiblefortheprogrammingofallfederaltransportationfundsintotheMTIPthatincludetransit(e.g.,UrbanizedAreaFormulaGrants‐5307,NewStarts/SmallStartsCapitalInvestmentGrants‐5309,EnhancedMobilityofSeniorsandPeoplewithDisabilities‐5310,etc.),otherroadway/bridgeimprovementfunds(e.g.,HBRR),andspecialannualfederalbudgettransportationfundsdesignatedforspecificprojects.Thisfinancialplanincludesrevenueforecastsforallfederaltransportationfundswithahistoryofbeingallocatedorawardtotheregion.Section4.0identifiestheapplicablefederaltransportationfundsincludedintherevenueforecast.Section5.0providesadditionaldescriptivedetailsandrevenueforecastmethodologies.
3.3 Federal Transit Revenues (FTA based revenue allocations)
TheMetroMPOareafallswithinthePortlandUrbanizedArea(UZA)whichincludesportionsofMarionCounty,OregonandClarkCounty,WashingtonwhichisnotpartoftheMPOboundary.PertheFTANationalTransitdatabaseGlossary,anUZAisanareadefinedbytheU.S.CensusBureauthatincludes:
Oneormoreincorporatedcities,villages,andtowns(centralplace);and
Theadjacentdenselysettledsurroundingterritory(urbanfringe)thattogetherhasaminimumof50,000persons.
Theurbanfringegenerallyconsistsofcontiguousterritoryhavingadensityofatleast1,000personspersquaremile.Urbanizedareasdonotconformtocongressionaldistrictsoranyotherpoliticalboundaries.ThePortland,OR‐WAUZAconsistofthethreetransitagencies:Tri‐CountyMetropolitanDistrictofOregon(TriMet),SouthMetroAreaRegionalTransit(SMART),andtheClarkCountyPublicTransportationBenefitAuthority(C‐TRAN).Appropriatedfederaltransitformulafundsarethensplitbyagreedformulaamongthreetransitagencies.Forthepurposesofthisrevenueforecast,allocationstoC‐TRANarenotincluded,astheVancouver,WAareafallsoutsideoftheMetroPortlandMPOboundaryarea.
TriMetandSMARTreceiveformulaFTASectionfundsthatmayinclude:5307,5310,5337,and5339funds.BothalsohavebeensuccessfulincompetingforandsecuringdiscretionaryFTA5309grantsandotherFTAdiscretionarygrantsovertheyears.TriMetalsowillbetheimplementingleadagencyfortheFTANewStartsandSmallStartsgrantsassumingMetroandTriMetsuccessfullyobtaintheselargediscretionarygrantsfortheexpansionofTriMet’sMAXlightrailsystem.
2018 Regional Transportation Plan Appendix H
23

Appendix H – DRAFT 2018 Regional Transportation Plan Financial Strategy Documentation Page 22 of 61
3.4 Federal Funds Allocated to Local Agencies through the ODOT Enhance Program
AportionofthevariousfederalfundsODOTisappropriatedstatewidewillbeallocatedtolocalagenciesthroughODOT’sEnhance/ModernizationProgram.TheEnhanceprogramcombinesseveralsourcesoffundingforinvestmentsintoasingleproposalprocess.TheprogramfocusesoncapitalneedsandisseparatefromODOT’scapitalprogram.ThishelpstomeettheexpectationofODOTtoidentifyandfundthebestmultimodaltransportationsolutionsneededtomovepeopleandgoodsthroughthetransportationsystem.Eligibleprojectsmustbeconsistentwithstateandlocalplans;localproposersarerequiredtoprovidematchfunds;andprojectsmustbenefitthestate’smultimodaltransportationsystem(eitheronoroffthestatesystem).
ProjectactivitiesthatareeligiblefortheEnhancecategoryfundsinclude:
Bicycleand/orPedestrianfacilitiesonoroffthehighwayright‐of‐way
PublicTransportation(capitalprojectsonly,notongoingoperations),TransitFleetreplacementsinwhichtitleisnotheldbyODOT
SafeRoutestoSchool(infrastructureprojects)
ScenicByways(constructionprojects)
TransportationAlternativesasdefinedbytheTransportationAlternativesDataExchange(TrADE)
TransportationDemandManagement
TransportationOptions
ForpurposesoftheRTPConstrainedRevenueForecast,theestimatedfederalfundsthatwillendbeingallocatedtothelocalagenciesandincludethefollowingrevenuesorspecificfundtypes:
Modernization/Enhance‐L(federaldiscretionaryforcapital/modernizationpurposes.Includesacombinationofmultiplefederalfundtypes)
HBRR‐L(federalHighwayBridgeReplacementandRehabilitationProgramlocalallocations)
FederalHighwaySafetyImprovementProgram(HSIP)
ConnectOregon
Miscellaneousfederaldiscretionaryallocations(Tigergrants,FASTLane,INFRAGrants,ITS,etc.)
Thefederalfundsorallocatedfundprogramsarelistedinthefederalrevenuesection.
3.5 Federal Fund Appropriations to the Oregon Department of Transportation (ODOT)
ODOTisthedirectrecipientofmostofthefederaltransportationfundsthestateofOregonreceivesforhighwayimprovements.ODOTisalsochargedwiththestewardshipand
2018 Regional Transportation Plan Appendix H
24

Appendix H – DRAFT 2018 Regional Transportation Plan Financial Strategy Documentation Page 23 of 61
managementofallfederaltransportationfundsallocatedtothestate.TypicalfederalfundsODOTisallocatedincludes:
EmergencyRelief(ER)funds
FederalLandsAccessProgram(FLAP)
HighwaySafetyImprovementProgram(HSIP)
IntelligentTransportationSystems(ITS)program
HighwayBridgeProgram(HBP)
NationalHighwayPerformanceProgram(NHPP)
NationalHighwayFreightProgramNHFP)
Railway‐HighwayCrossingsProgram
StatewideandNonmetropolitanPlanning(SPR)
SurfaceTransportationBlockGrant(STBG)funds
Discretionaryfederaltransportationimprovements(TIGERFASTLanegrants,INFRAGrants)
DuetothecentralizedapproachODOTutilizeswhendeterminingthepriorityandallocationoftheirfederalandstatefunds,determiningspecificfederalrevenueallocationsbyspecificthespecificfundtype(aslistedabove)isnotpossiblecurrently.However,ODOTRegion1didexamineanddevelopalong‐rangerevenueforecastestimatebasedonhistoricalallocationestimatesandtheODOTLRFAprojectionsfornumerousstatewidefederalfundallocationsfortheircapitalprogramneeds.TheODOTRegion1Capitalprogramestimateincludesfederalandstatefundsmixedtogetherandcan’tseparatethestatefundswiththeexceptionofHB2017statefundsandspecificstatefundsidentifiedfortransitneeds.Currently,Region1can’tidentifytheratioorforecastannualfederalfundamountsthatwillbeallocatedtothemduetothecentralizedandstatewideapproachODOTHeadquartersusestoallocatefederalfundstoprojects.
Theestimateoutto2040forODOTRegion1developedtheircapitalprogramneedsbasedonsixareasasfollows:
MinimumModernizationProgram
RemainingStateJTA(HB2001)funds
FederalFreightProgram(HFP)
FederalLandsAccessProgram(FLAP)
FederalDiscretionary
Modernization(Mod)Legislature(HB2017)
ODOTRegion1estimatedatotalof$1.522billioninrevenuesarereasonablyexpectedtobeavailableoutto2040fortheabovecapitalprogramsintheMPOboundaryareaandisshownin
2018 Regional Transportation Plan Appendix H
25

Appendix H – DRAFT 2018 Regional Transportation Plan Financial Strategy Documentation Page 24 of 61
theRevenueTableCbelow.However,uponafurtherreviewofHB2017,MetrofoundthetotalforthecapitalprogrampotentiallyhigherasshowninTableD.
TABLE C
ODOT Region 1 Projected Modernization/Capital Revenues (2018 Constant $) (December 2017)
Revenue Program Use 2018-2027 2028-2040 TotalMinimum Modernization Program
Capital $114,956,521 $149,443,479 $264,400,000
Remaining JTA Capital $10,000,000 $0 $10,000,000Federal Freight Program (HFP) Capital $42,643,480 $55,436,520 $98,080,000Federal Lands Access Program (FLAP)
Capital $0 $0 $0
Federal Discretionary Capital $65,217,390 $84,782,610 $150,000,000Mod Legislature (HB2017) Capital $434,782,610 $565,217,390 $1,000,000,000
Totals: $667,600,001 $854,879,999 $1,522,480,000
TABLE DUpdated ODOT Region 1 Modernization/Capital Revenues(2018 Constant $) (March 2018)
Revenue Program Use 2018-2027 2028-2040 Total Minimum Modernization Program
Capital $122,760,292 $142,210,641 $264,970,933
Remaining JTA Capital $10,000,000 $0 $10,000,000Federal Freight Program (HFP) Capital $42,643,480 $55,436,520 $98,080,000Federal Lands Access Program (FLAP)
Capital $0 $0 $0
Federal Discretionary Capital $65,217,390 $84,782,610 $150,000,000HB2017 Rose Quarter Capital $375,000,000 $0 $375,000,000HB2017 Safe Routes to School-SR2S
Capital $31,387,500 $48,964,500 $80,352,000
HB2017 Highway and Street projects
Capital $249,700,000 $0 $249,700,000
HB2017 Bridges Safety (Sec 71a-c)
Capital 12,555,000 $19,585,800 $32,140,800
HB2017 Seismic (Sec 71a-c) Capital $9,416,250 $14,689,350 $24,105,600HB2017 Pavement (Sec 71a-c) Capital 7,533,000 $11,751,580 $19,284,480HB2017 Maintenance (Sec 71 a-c)
Capital $1,883,250 2,937,870 $4,821,120
Future Legislature (After HB2017)
Capital $507,655,054 $565,217,390 $1,000,000,000
Totals: $1,435,751,217 $380,358,770 $1,816,109,987 Notes and qualifications: 1. A total of $10 million of JTA funds is estimated to be available. The funds have been applied in the first RTP
Year Division 2. FLAP: The estimated allocation of FLAP over the RTP 23 year period is estimated at a maximum $107.3 million.
FLAP is assumed to be allocated to projects outside of the MPO Boundary and therefore no funding in the MPO boundary is reflected. Region 1 does not assume a contribution from FLAP to the ODOT Metro modernization target.
3. Federal discretionary are various large transportation grants (FAST Lane, etc.) that ODOT estimates they will receive over the RTP horizon year period.
2018 Regional Transportation Plan Appendix H
26

Appendix H – DRAFT 2018 Regional Transportation Plan Financial Strategy Documentation Page 25 of 61
4. “Mod Legislature” includes three projects that would be funded from the State Legislature through a combination of fee and tax increases. The projects are identified in draft bill format now. Based on historical funding trends in the state, and that the projects are in draft legislation, Metro supports the assumption the funding meets the definition of “Reasonable Availability”. The total estimated funding would be $1 billion. Mod Legislature also includes state funding o specifically named projects. In the final revenue forecast tables, the amount identified in the Mod Legislature does not include the funding for the HB2017 named capital improvement projects which are shown separately under the HB2017 revenue source.
5. Revenues identified in HB2017 Section 71 a-c do not provide a regional split only a statewide annual estimate. Metro used the 81% of 31% methodology for these identified funds for inclusion in the RTP.
3.6 ODOT Operations Maintenance and Pavement (Fix-It) Program
TheFix‐ItprogramincludesfundingcategoriesthatmaintainorfixODOT’sportionofthetransportationsystem.Thisisthenon‐capacityenhancingoperationsandmaintenance(O&M)componenttoODOT’soverallsystempreservation.TherearegenerallyfourmajorcategoriesofFix‐itprogramswhichinclude:
Bridges(repair/rehabilitate)
Culverts(repair/replace)
HighwayPavementMaintenance
Safetyandoperations
WithinSafetyandoperations,thefollowingsubcategoriesdefinethelargersafetyandoperationsprogram:
Highwaycrossings
Roadwaysafety(non‐capacityrepairs/rehabilitation)
Landslides/rockfallsmitigation
Illumination/Signals/ITS
Onaverage,theFix‐Itprogramhasbeenfundedprimarilywithfederalfunds(wellover90%ofprojectfundinghasbeenfederal)withthestatefundsprovidingtherequiredmatch.However,becauseofthecentralizedstatewideallocationoffunding,Region1couldnotprovideabreakoutoutoffederalfundingcompositiondowntothespecificfundtypecode.
Developingtheconstrainedrevenueforecastoutto2040utilizedthethreeyearstate‐wideFix‐itprogramfundingestimatesfromthe2018‐2021STIPandthedraft2021‐2024STIP.Thetotalthree‐yearestimatefromthecurrent2018‐2021STIPfortheFix‐Itprogramis$814,857,085asshowninRevenueTableE.Thisaveragesouttoapproximately$286,499,518overthethreeyearfundingperiod.
Revenue Table E
2018 Regional Transportation Plan Appendix H
27
Appendix H – DRAFT 2018 Regional Transportation Plan Financial Strategy Documentation Page 26 of 61
Asmentionpreviously,ODOTusesacentralizedapprovedtoallocatingFix‐ItprogramrevenuestothevariousODOTregions.Additionally,ODOTmixesthecompositionoftheprogramfundtypecodes.ItwasnotpossibletosplitoutthespecificfundtypecodeandamountforeachFix‐ItprogramcategoryandspecifyhowmuchSTBG,NHPP,NHFP,etc.arebeingallocatedtoeachODOTregionandtotheMPOs.
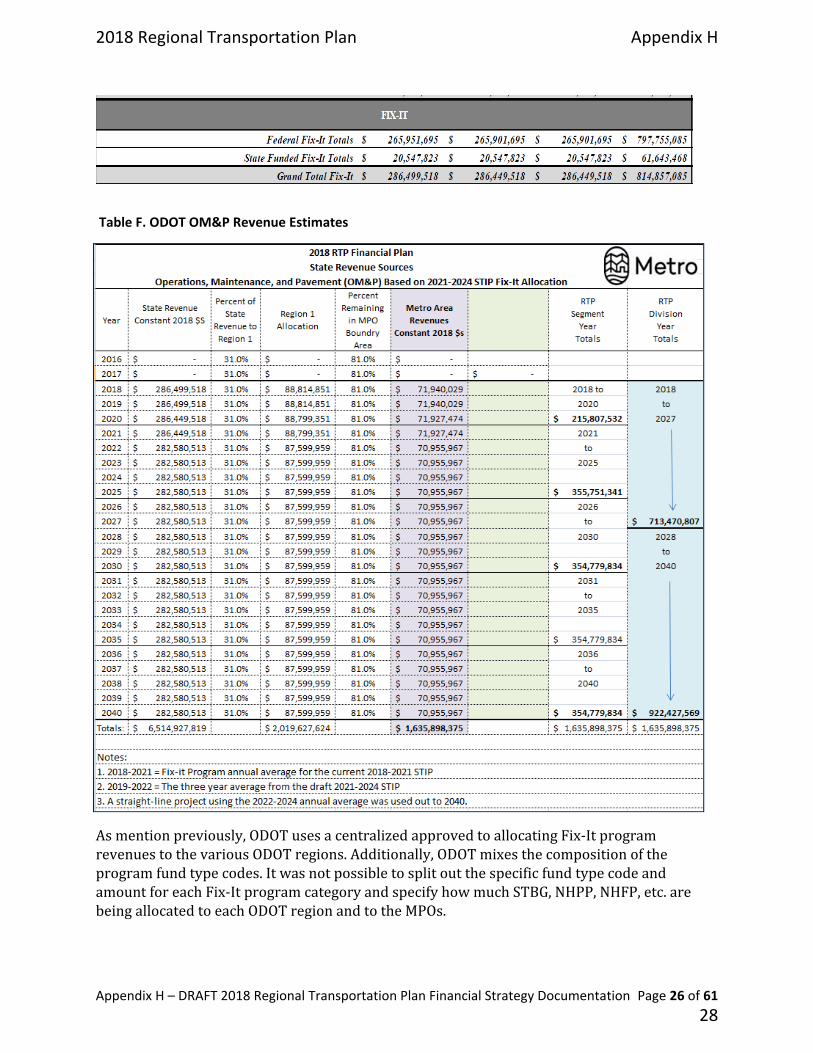
Table F. ODOT OM&P Revenue Estimates
2018 Regional Transportation Plan Appendix H
28

Appendix H – DRAFT 2018 Regional Transportation Plan Financial Strategy Documentation Page 27 of 61
IfaspecificfundingsplitallocationmethodologywasavailabletodeterminetheapproximatesplitforODOTRegion1andthenfortheMPOarea,itwasusedandisidentifiedastherevenuemethodologysourceinSection4.2foreachidentifiedfundcode.Ifnomethodologywasavailable,thenMetroreliedonastandard“81%of31%”allocationmethodology.The81%of31%allocationmethodologycomprisesthefollowingassumptions:
a. Therevenuesourcetotalwasidentifiedandconfirmedtobeastatewideallocation.
b. 31%ofthestatewidetotalwasestimatedwouldbeallocatedtotheODOTRegion1area
c. 81%ofthe31%wasestimatedwouldremainintheMPOboundaryarea.ThisbecametheannualamountfortheMetroMPOarea.
d. Thefunds(ifallocatedinYOEamounts)werethendiscountedinto2016$dollarsforeachyearoutto2040.
Forthe2018‐2040STIPFix‐itProgramestimate,ODOTidentifiedastatewidetotalof$847,741,539overthethree‐year(2022‐2024)fundingperiod.The$847millionestimateiscomprisedofareducedprogramestimateof$658,241,539byOTCdirectionplusanaugmentationbyHB2017of$189,500,000.Thethree‐yearaveragetotaled$282,580,513whichwasusedforthe2022‐2024timeframe.The$282millionwasusedasthebaselineamountoutto2040asshowninTableConthenextpage.BasedontheestimatesprovideinbothSTIPs,theFix‐Itprogramrevenueswouldtotalapproximately$1,635,898,375whichwillbeacombinationofbothfederalandstaterevenuesfromHB2017.
CombiningboththeODOTRegion1estimatedcapital/modernizationrevenueswiththeirO&MFix‐Itrevenuesprovidesatotalrevenuepictureof$4billiondollars.Unfortunately,estimatingspecificfundcoderevenuesdowntotheRegion1levelisnotpossibleduetothecentralizedallocationmethodologyODOTusesandthelackofspecificfundingtablemethodologydevelopedbytheODOTLRFA.ThebestMetrocouldestimatearethecombinedfederalandstaterevenuesODOTreceivesandextrapolatetheirrevenueassumptionsbyfundingprogramoutto2040.MetroanticipatesdevelopmentofrevenueestimatesforallidentifiedfundtypecodesdowntotheMPOandRegion1levelwillcontinuetobeadiscussionanddirectivefromUSDOT.However,withoutformaldirectionfromUSDOT,littlechangeisexpectedforthenextRTPupdatecycle(duein2023).
ListedinthebelowtableisasummaryofODOTfederalandstaterevenuesasbestidentifiedbyMetrousingestimatesprovidedbyODOT’sLRFA,withadditionalinputfromRegion1staffandafair‐shareallocationmethodologyappliedtoestimatefundsintheMPOregion.Thetotalofthesixidentifiedfundingprogramsisestimatedwillgenerateatotalof$4billiondollarsforODOToutto2040.
2018 Regional Transportation Plan Appendix H
29
Appendix H – DRAFT 2018 Regional Transportation Plan Financial Strategy Documentation Page 28 of 61
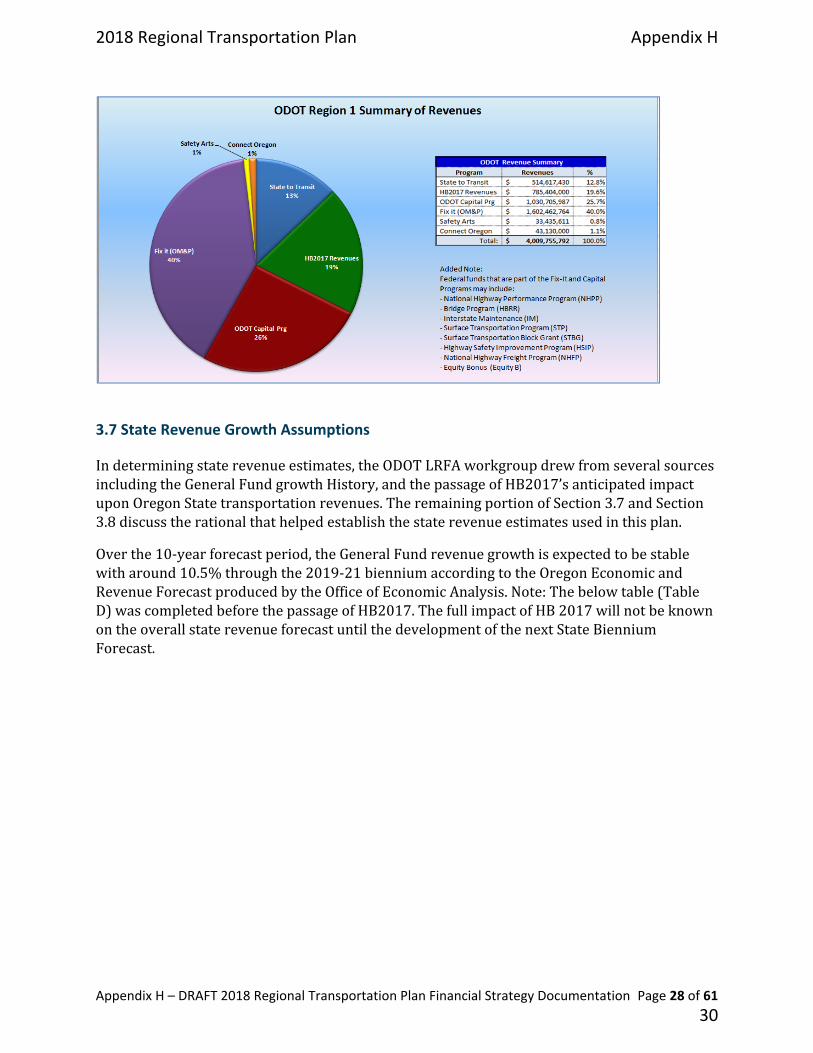
3.7 State Revenue Growth Assumptions
Indeterminingstaterevenueestimates,theODOTLRFAworkgroupdrewfromseveralsourcesincludingtheGeneralFundgrowthHistory,andthepassageofHB2017’santicipatedimpactuponOregonStatetransportationrevenues.TheremainingportionofSection3.7andSection3.8discusstherationalthathelpedestablishthestaterevenueestimatesusedinthisplan.
Overthe10‐yearforecastperiod,theGeneralFundrevenuegrowthisexpectedtobestablewitharound10.5%throughthe2019‐21bienniumaccordingtotheOregonEconomicandRevenueForecastproducedbytheOfficeofEconomicAnalysis.Note:Thebelowtable(TableD)wascompletedbeforethepassageofHB2017.ThefullimpactofHB2017willnotbeknownontheoverallstaterevenueforecastuntilthedevelopmentofthenextStateBienniumForecast.
2018 Regional Transportation Plan Appendix H
30
Appendix H – DRAFT 2018 Regional Transportation Plan Financial Strategy Documentation Page 29 of 61
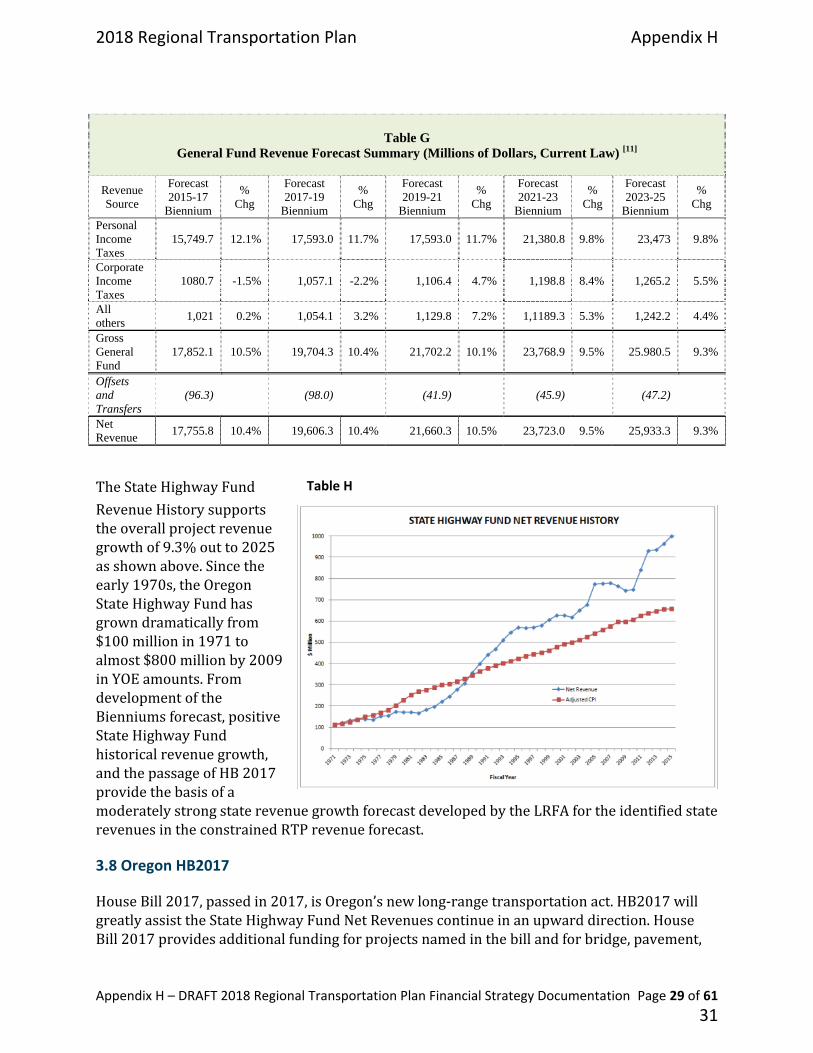
Table G General Fund Revenue Forecast Summary (Millions of Dollars, Current Law) [11]
Revenue Source
Forecast 2015-17
Biennium
% Chg
Forecast 2017-19
Biennium
% Chg
Forecast 2019-21
Biennium
% Chg
Forecast 2021-23
Biennium
% Chg
Forecast 2023-25
Biennium
% Chg
Personal Income Taxes
15,749.7 12.1% 17,593.0 11.7% 17,593.0 11.7% 21,380.8 9.8% 23,473 9.8%
Corporate Income Taxes
1080.7 -1.5% 1,057.1 -2.2% 1,106.4 4.7% 1,198.8 8.4% 1,265.2 5.5%
All others
1,021 0.2% 1,054.1 3.2% 1,129.8 7.2% 1,1189.3 5.3% 1,242.2 4.4%
Gross General Fund
17,852.1 10.5% 19,704.3 10.4% 21,702.2 10.1% 23,768.9 9.5% 25.980.5 9.3%
Offsets and Transfers
(96.3) (98.0) (41.9) (45.9) (47.2)
Net Revenue
17,755.8 10.4% 19,606.3 10.4% 21,660.3 10.5% 23,723.0 9.5% 25,933.3 9.3%
TheStateHighwayFund
RevenueHistorysupportstheoverallprojectrevenuegrowthof9.3%outto2025asshownabove.Sincetheearly1970s,theOregonStateHighwayFundhasgrowndramaticallyfrom$100millionin1971toalmost$800millionby2009inYOEamounts.FromdevelopmentoftheBienniumsforecast,positiveStateHighwayFundhistoricalrevenuegrowth,andthepassageofHB2017providethebasisofamoderatelystrongstaterevenuegrowthforecastdevelopedbytheLRFAfortheidentifiedstaterevenuesintheconstrainedRTPrevenueforecast.
3.8 Oregon HB2017
HouseBill2017,passedin2017,isOregon’snewlong‐rangetransportationact.HB2017willgreatlyassisttheStateHighwayFundNetRevenuescontinueinanupwarddirection.HouseBill2017providesadditionalfundingforprojectsnamedinthebillandforbridge,pavement,
Table H
2018 Regional Transportation Plan Appendix H
31
Appendix H – DRAFT 2018 Regional Transportation Plan Financial Strategy Documentation Page 30 of 61
culvert,seismicandsafetyprojects.HB2017‐Aimplementsavarietyofinitiativesforthetransportationfundingpackageof2017.Thebillincludesthefollowing:
MakesvariouschangestotheOregonTransportationCommission(OTC).DirectstheOTCtomaintainarealpropertyinventoryofODOT,todevelopandmaintainacomprehensive20yearplan,createstheContinuousImprovementAdvisoryCommittee,directstheOTCtodevelopasetofuniformstandardsfortrafficinfrastructure,andtodevelopawebsitetoincludeprojectinformation.
EstablishesaninternalauditorwithinODOT.
MakespermanenttheJointCommitteeonTransportation.
Providesfornewrevenuefromincreasedfeesandtaxes,andthecreationofapayroll,privilege,andusetax.Distributionofnewrevenueisasfollows:
o ForcalendaryearsbeginningonorafterJanuary1,2022,$30millionfortheI5RoseQuarterProject.
o $10millionforSafeRoutestoSchools
o Afterthesedistributions,fundswillbedistributedasfollows:
50%toODOT
30%toCounties
20%toCities
OfthefundsmadeavailabletoODOT,theywillbeallocatedasfollows:
o First,$10millionforsafety,andtheremaindersplitaslistedbelow:
40%forbridges
30%forseismicimprovementsrelatedtohighwaysandbridges
24%forstatehighwaypavementpreservationandculverts
6%forstatehighwaymaintenanceandsafetyimprovements
o Additionally,thebillauthorizesODOTtoissuehigheruserbondsnottoexceed$480million.Thesebondproceedswillbedistributedtothefollowingregions,foravarietyofprojects:
Region1:$249,700,000
Region2:$201,950,000
Region3:$75,000,000
Region4:$76,493,000
Region5:$43,647,000
IncreasesthedistributionoffundstosmallcitiesandcountiesthroughtheSmallCitiesandCountiesProgram.Andcreatesthesmallcityadvisorycommittee.
2018 Regional Transportation Plan Appendix H
32

Appendix H – DRAFT 2018 Regional Transportation Plan Financial Strategy Documentation Page 31 of 61
ThebillestablishesrequirementsforthedistributionofConnectOregonfunds.
Transfersthejurisdictionofvarioushighwaystolocalgovernments.
Additionalgasandvehicleregistrationtaxrevenuesallocateddirectlytothecities,counties,andODOT.AddedgastaxrevenuesforthecountiesandcitiesasidentifiedinHB2017areconsideredapass‐throughrevenueandareidentifiedaslocalfundsforthecitiesandcountiesontopoftheirexistinggastax/vehicleregistrationrevenuesthatareidentifiedintheirlocalrevenuetemplates
Additional employer/employee payroll tax revenues generated as a result of HB2017 are considered local revenues and are identified in the local revenue section.
3.9 Local Revenue Assumptions
Transportation System Plans (TSPs)
Threecounties(Clackamas,Multnomah,andWashington)plus24citieswithinthemcomprisetheMetroMPOarea.Asof2015,theMPOpopulationisabout1.6millionandrapidlygrowing.Withinthisareaaretwomajortransitagencies(TriMetandSMART)servingthetransitneedswithinthethreecounties.Localrevenuetemplatesummariesweredevelopedforeachagencyusingtheagency’sTransportationSystemPlan(TSP)astherevenueasshowinFigure1.EachTSPincludesa20yearpriorityofneeds,projectsandanidentificationofrevenuesto
Figure 1. Example of Agency Local Revenue Template
2018 Regional Transportation Plan Appendix H
33

Appendix H – DRAFT 2018 Regional Transportation Plan Financial Strategy Documentation Page 32 of 61
supporttheprojects.
Theoretically,thiseffortwouldhavequicklyproducedasoundlocalrevenuefoundationforeachagency.FromeachTSP,basicdraftrevenuetemplatesweredevelopedsummarizingtheavailablelocalrevenuesgeneratedorcollectedbytheagency.Thiseffortshouldhaveproducedareliablebasicfoundationoflocalrevenuesforeachagency.However,virtuallyeveryagencydiscoveredrevenuelogic,computational,ormethodologydiscrepanciesintheirTSPs.Asaresult,Metroworkedwitheachleadagencytoreview,update,andcorrecttherevenuesassumptionsandestimates.
Eachagencyhadtoverifytherevenueprogramestimatedannualortotalrevenuestheprogramprojectedwouldbegenerated.Nearlyallofthelocalrevenueprogramsdidnotincludegrowthmultiplierstoaddressforinflationoverfutureyears.Therefore,Metro’sreviewformostofthelocalrevenueprogramsdidnotrequirediscountingandhavebeenincludedasconstantrealdollarsintheconstrainedRTPforecast.ThereasoninflationarygrowthmultiplierswerenotusedintheTSPswerebasedonalackofpropergrowthassumptionsavailablefortherevenueprograms.Ratherthanoverestimatethegenerationoflocalrevenuesfrominflation,localagenciesacceptedtheTSPsconservativerevenuefindings.Note:Someprogramsdidincluderevenuegrowthfrompopulationgrowthandtheimpactontheproject.However,againtheydidnotincludeinflationarygrowthfactors.Assuch,therevenueswereconsideredalreadydiscounted.
Oncetheannualamountandlengthofapplicablegenerationperiod,orthetotalamountandlogicbehindthetotal,wasdetermined,theannualamountsweredeterminedforeachRTPyear(2018‐2040)alongwithRTPdivisionyearrequiredtotals.
Figure 2
2018 Regional Transportation Plan Appendix H
34
Appendix H – DRAFT 2018 Regional Transportation Plan Financial Strategy Documentation Page 33 of 61
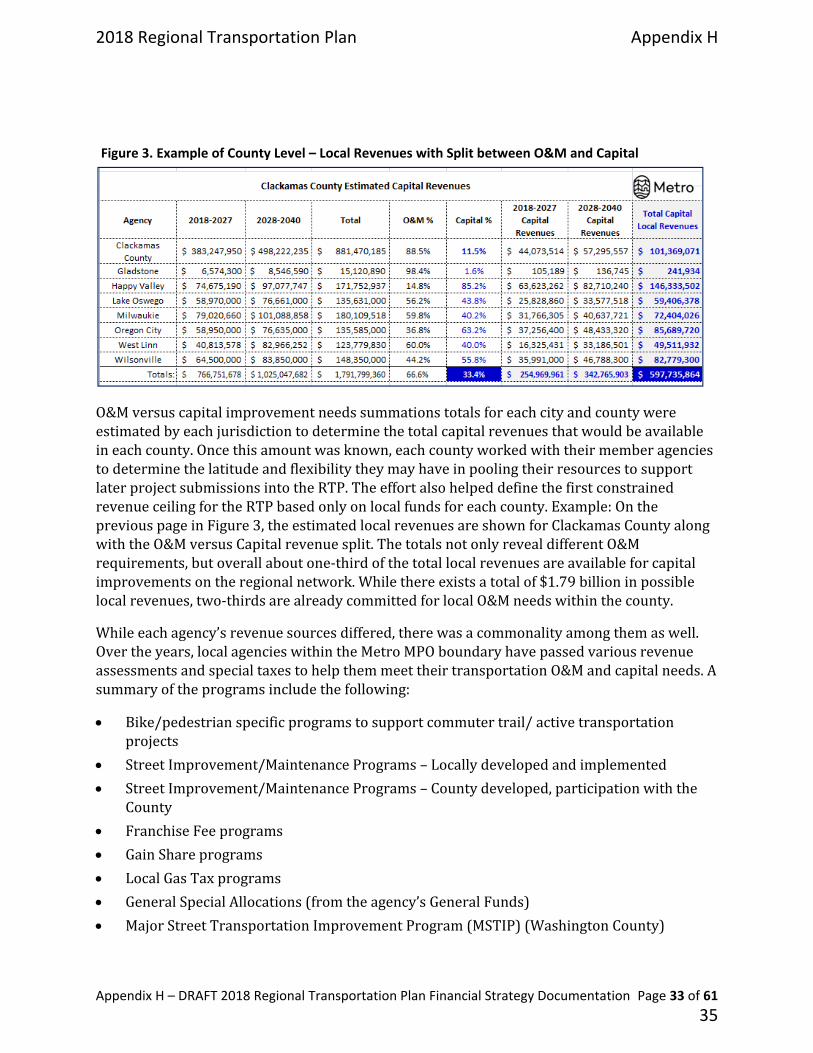
O&Mversuscapitalimprovementneedssummationstotalsforeachcityandcountywereestimatedbyeachjurisdictiontodeterminethetotalcapitalrevenuesthatwouldbeavailableineachcounty.Oncethisamountwasknown,eachcountyworkedwiththeirmemberagenciestodeterminethelatitudeandflexibilitytheymayhaveinpoolingtheirresourcestosupportlaterprojectsubmissionsintotheRTP.TheeffortalsohelpeddefinethefirstconstrainedrevenueceilingfortheRTPbasedonlyonlocalfundsforeachcounty.Example:OnthepreviouspageinFigure3,theestimatedlocalrevenuesareshownforClackamasCountyalongwiththeO&MversusCapitalrevenuesplit.ThetotalsnotonlyrevealdifferentO&Mrequirements,butoverallaboutone‐thirdofthetotallocalrevenuesareavailableforcapitalimprovementsontheregionalnetwork.Whilethereexistsatotalof$1.79billioninpossiblelocalrevenues,two‐thirdsarealreadycommittedforlocalO&Mneedswithinthecounty.
Whileeachagency’srevenuesourcesdiffered,therewasacommonalityamongthemaswell.Overtheyears,localagencieswithintheMetroMPOboundaryhavepassedvariousrevenue assessmentsandspecialtaxestohelpthemmeettheirtransportationO&Mandcapitalneeds.Asummaryoftheprogramsincludethefollowing:
Bike/pedestrianspecificprogramstosupportcommutertrail/activetransportationprojects
StreetImprovement/MaintenancePrograms–Locallydevelopedandimplemented
StreetImprovement/MaintenancePrograms–Countydeveloped,participationwiththeCounty
FranchiseFeeprograms
GainShareprograms
LocalGasTaxprograms
GeneralSpecialAllocations(fromtheagency’sGeneralFunds)
MajorStreetTransportationImprovementProgram(MSTIP)(WashingtonCounty)
Figure 3. Example of County Level – Local Revenues with Split between O&M and Capital
2018 Regional Transportation Plan Appendix H
35
Appendix H – DRAFT 2018 Regional Transportation Plan Financial Strategy Documentation Page 34 of 61
Miscellaneousprograms(interestgeneratingprogramssupportingtransportation,etc.)
ParkingFeeprograms
PrivateDeveloperCreditContributions
PropertyTaxtransportationimprovementallocations
RoadUtilityFeeprograms
SpecialFundingDistrictAssessments
SystemDevelopmentCharges(SDC)–Locallydevelopedandmanaged
SystemDevelopmentCharges(SDC)Countydevelopwithlocalparticipation
TransportationDevelopmentTax(TDT)programs
GeneralObligation/CapitalBondprograms
TransportationandStormDrainageUtilityprograms
SchoolPartnershipprograms
StreetLightFeeprograms
UrbanRoadandMaintenanceprograms
2018 Regional Transportation Plan Appendix H
36
Appendix H – DRAFT 2018 Regional Transportation Plan Financial Strategy Documentation Page 35 of 61
4.0 REVENUE SOURCE SUMMARY
4.0 Revenue Source Summary ...................................................................... Error! Bookmark not defined.
4.1 Revenue Source Scenarios and Overview ............................................ Error! Bookmark not defined.
4.2 Federal Revenue Forecasts (by fund type or funding program) .......... Error! Bookmark not defined.
4.3 State and Federal Combined Revenue Forecasts ................................ Error! Bookmark not defined.
4.4 Summary of State and Federal Combined Constrained Revenues ...... Error! Bookmark not defined.
4.5 Local Revenues ..................................................................................... Error! Bookmark not defined.
4.6 Constrained Revenue Sources Split Across RTP Division Years ........... Error! Bookmark not defined.
4.1 Revenue Source Scenarios and Overview
Thetablesonthefollowingpagesdescribethespecificrevenueassumptionsusedtodevelopthefinanciallyconstrained2018‐2040RTP.Developingthefinalconstrainedrevenuescenariobeganbyconsideringfourpossiblefuturefundingpossibilitiesforthefederalrevenues.BasedonthefutureeconomicconditionstheLRFAworkgroupreviewedandevaluated(alsodiscussedinSection2),theLRFAconsideredthemostlikelyfundingscenariostheregioncouldexpectandiftheymatchedupwiththefourfundingscenarios.Aspartoftheevaluation,theLRFAalsoestablishedanannualinflationarygrowthof3.1%asthetargetinflationrate.Anyrevenuescenariowouldbejudgedagainsttheannualinflationaryrate.Basedontheeconomicindicatorsfourfundingscenarioswereestablishedforconsideration.Theyincluded:
ExistingResources–NoAction(ER‐NA)Thisfundingscenarioisbasedonthe10‐yearaveragetheregionhasreceivedwithoutanyannualgrowthincluded.Itrepresentstheminimumamountoffundingtheregionmightreceive.Insomecaseswherethehistoricalannualfundinghasbeensporadicornotconsistentlyavailable,theworstcasescenarioofa$0fundingbalancewasapplied.TheER‐NAscenariorepresentsapooreconomicoutlook,unresolvedhighwaytrustfundissues,poorrevenuesbeingavailable,andwouldnotkeepupwithannualinflationrates.Theevaluationoftheeconomicindicatorsdidnotmatchuporsupportthelogicofthisscenario.Therefore,itwaseliminatedasareasonablerevenuescenario.
FinanciallyConstrainedThisscenariogenerallyrepresentsamorepositiveeconomicgrowthscenario.IthasbeendividedintoarangeamongaConservativeScenario,ModerateScenario,andOptimisticScenarioasfollows:
o ConservativeScenario:Thisfundingscenariocanbedescribedasasloworweakgrowthrevenuescenario.ItutilizestheprojectedFY2018annualallocation(orhistoricalaverageifFY2018wasnotavailable)andappliedasmallpositiveannualgrowthamountintherangeofabout1%to1.5%tothefederalrevenues.Whileitwouldreflectanannualpositivechange,itdidnotmatchupconsistentlywithpasthistoricalallocations.Italsoreflectsarevenuescenariothatiswellshortoftheability
2018 Regional Transportation Plan Appendix H
37
Appendix H – DRAFT 2018 Regional Transportation Plan Financial Strategy Documentation Page 36 of 61
tosufficientlykeepupwithannualinflation.Thisrevenue scenariowasdeemedexcessivelyconservativeanddismissedasapossiblefundingscenario.
o OptimisticScenario:Thisrevenuescenariocanbebestdescribedasanever‐endinghoteconomy”.Theoptimisticrevenuescenarioprovidesgoingrevenuegrowththatwouldoutpaceinflation.Federalfundannualgrowthwouldhavetoexceed3.1%.Whiletheeconomicindicatorssuggestashort‐termhoteconomymightemergefromtimetotime,thefearofuncontrolledexpansionandhyper‐inflationwouldquicklyresultfederalmonetaryconstraintpoliciesthenegatethehoteconomy.Also,theideaofasustainedhoteconomyovera23‐yearperiodseemedunrealisticaswell.Asaresult,theoptimisticrevenuescenariowaseliminatedfromconsideration.
o ModerateScenario:Themoderatescenarioincreasestheannualgrowthforthefederalrevenues.Thereviewandevaluationoftheeconomicindicatorsfavoredamoderatescenarioabovetheconservativescenario,butbelowtheOptimisticscenario.FromthereviewoftheeconomicindicatorsandthenewlypassedFASTAct,theLRFAestablisheda2.2%annualgrowthrateforthefederalfunds.Thiseffectivelysplitsthedifferencebetweentheconservativeandoptimisticrevenues.At2.2%,theLRFAagreedthegrowthwasstillreasonableandmetthe“reasonableavailability”definitionofconstrainedrevenuesfortheRTP.Revenuefundingtableswerethendevelopedforthevariousidentifiedfederalrevenues.
TheestimatedrevenueswerecalculatedinYearofExpenditure(YOE)andinmanycasesdiscounted2016dollars.Uponreviewoftheestimatedrevenues,MetroconcurredwiththeLRFA’sassumptionanddeterminedtheserevenuerecommendationswouldbeusedforMetro’snewRTP.TheserecommendationsarethefederalrevenueprojectionsMetrohasusedindevelopingtheconstrainedRTPRevenueForecastandareshowninSection4.2.Belowisasampletable(federalFTA5310revenueestimates)fromtheLRFAFundingAssumptionsRevenueTables.
WhiletherevenueforecastsaremuchstrongerthantheConservativeScenario,theModerateRevenueScenarioat2.2%annualgrowthstillfailstokeepupwithannualinflationwhichwasestablishedat3.1%resultinginadiminishingpurchasingpowerof thefederalfundsandaneedfortheregiontolookatotherfundingoptions.
Indevelopingtherevenueforecasts,theLRFAevaluatedthemajoreconomicindicatorsandfundingtrendsthatarediscussedinthebeginningofthisFinancialPlan.Metro’sreviewsupportedtheLRFA’sfindings.Wefoundnodiscrepancieswiththeiranalysesorfinancialconclusions.Therefore,MetrochosetofollowtheLRFArecommendationsascloselyaspossibletodevelopMetro’sfinalfinanciallyconstrainedrevenueforecastforthenewRTP.
BecauseofthewayODOTmanages,allocates,andprioritizestheirfundingrequirementsfromacentralizedstate‐wideapproach,itODOTRegion1couldnotbreak‐outtheirfederalfundingrevenueestimatesbasedontheLRFAstatewideprojections.However,Metroattemptedtodeterminethefederalrevenuesbasedon
2018 Regional Transportation Plan Appendix H
38

Appendix H – DRAFT 2018 Regional Transportation Plan Financial Strategy Documentation Page 37 of 61
fundingprogramforODOT.ThisisdetailedfurtherintheStateportioninSection4.3.Overall,thecombinedfederalandstaterevenuesforbothhighwaycapacity,highwayO&M,andtransitneedsareestimatedtobeapproximately$9.2billion.
StrategicUnconstrainedScenario:Thisscenarioisnotfinanciallyconstrainedandexistsoutsideoftheconstrainedrevenueforecast.Itwasnotconsideredasaviableoptionfortheconstrainedrevenueforecast.Itdoesnotrepresenttheconceptof“reasonablyavailablefunding.”However,itservesanimportantpurposetohelpdefinetheunfundedneededsegmentbeyondtheconstrainedrevenuesthattheregionrequirestoadequatelymeettheRTP’scapitalandoperationsandmaintenance(O&M)goalsandstrategies.
TheStrategicUnconstrainedScenariorepresentsanexercisetoidentifyadditionalfundingtomeettheRTPsystemimprovementneedsabovetheconstrainedrevenues.Whetherthisamountis120%,150%,175%,ormorebeyondtheconstrainedavailablerevenuesisnotyetknown.ThiswillbeuptotheJointPolicyAdvisoryCommitteeonTransportation,theadvisorybodyforMetro’sMPOfunctions,todetermine.Byestablishingthestrategicunconstrainedrevenuescenario,regionalleaderswillbeabletoconsiderifandwhere
2018 Regional Transportation Plan Appendix H
39
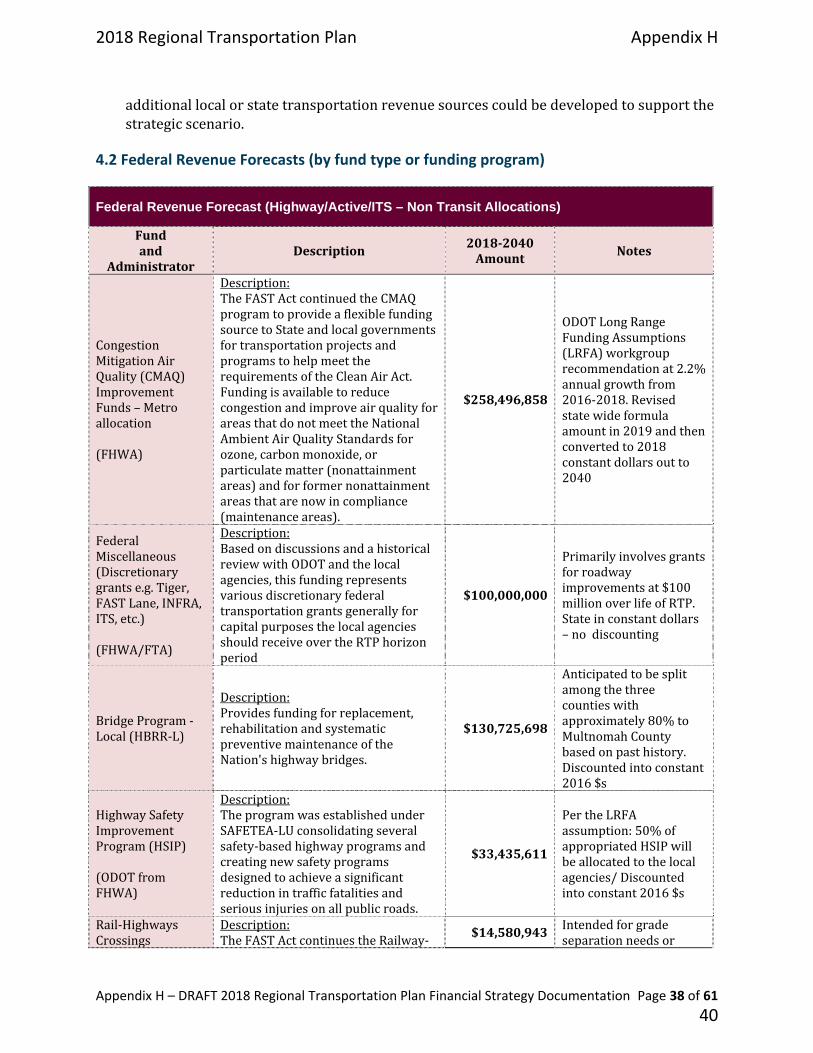
Appendix H – DRAFT 2018 Regional Transportation Plan Financial Strategy Documentation Page 38 of 61
additionallocalorstatetransportationrevenuesourcescouldbedevelopedtosupportthestrategicscenario.
4.2 Federal Revenue Forecasts (by fund type or funding program)
Federal Revenue Forecast (Highway/Active/ITS – Non Transit Allocations)
Fundand
AdministratorDescription
2018‐2040Amount Notes
CongestionMitigationAirQuality(CMAQ)ImprovementFunds–Metroallocation(FHWA)
Description:TheFASTActcontinuedtheCMAQprogramtoprovideaflexiblefundingsourcetoStateandlocalgovernmentsfortransportationprojectsandprogramstohelpmeettherequirementsoftheCleanAirAct.FundingisavailabletoreducecongestionandimproveairqualityforareasthatdonotmeettheNationalAmbientAirQualityStandardsforozone,carbonmonoxide,orparticulatematter(nonattainmentareas)andforformernonattainmentareasthatarenowincompliance(maintenanceareas).
$258,496,858
ODOTLongRangeFundingAssumptions(LRFA)workgrouprecommendationat2.2%annualgrowthfrom2016‐2018.Revisedstatewideformulaamountin2019andthenconvertedto2018constantdollarsoutto2040
FederalMiscellaneous(Discretionarygrantse.g.Tiger,FASTLane,INFRA,ITS,etc.)(FHWA/FTA)
Description:BasedondiscussionsandahistoricalreviewwithODOTandthelocalagencies,thisfundingrepresentsvariousdiscretionaryfederaltransportationgrantsgenerallyforcapitalpurposesthelocalagenciesshouldreceiveovertheRTPhorizonperiod
$100,000,000
Primarilyinvolvesgrantsforroadwayimprovementsat$100millionoverlifeofRTP.Stateinconstantdollars–nodiscounting
BridgeProgram‐Local(HBRR‐L)
Description:Providesfundingforreplacement,rehabilitationandsystematicpreventivemaintenanceoftheNation'shighwaybridges.
$130,725,698
Anticipatedtobesplitamongthethreecountieswithapproximately80%toMultnomahCountybasedonpasthistory.Discountedintoconstant2016$s
HighwaySafetyImprovementProgram(HSIP)(ODOTfromFHWA)
Description:TheprogramwasestablishedunderSAFETEA‐LUconsolidatingseveralsafety‐basedhighwayprogramsandcreatingnewsafetyprogramsdesignedtoachieveasignificantreductionintrafficfatalitiesandseriousinjuriesonallpublicroads.
$33,435,611
PertheLRFAassumption:50%ofappropriatedHSIPwillbeallocatedtothelocalagencies/Discountedintoconstant2016$s
Rail‐HighwaysCrossings
Description:TheFASTActcontinuestheRailway‐
$14,580,943Intendedforgradeseparationneedsor
2018 Regional Transportation Plan Appendix H
40
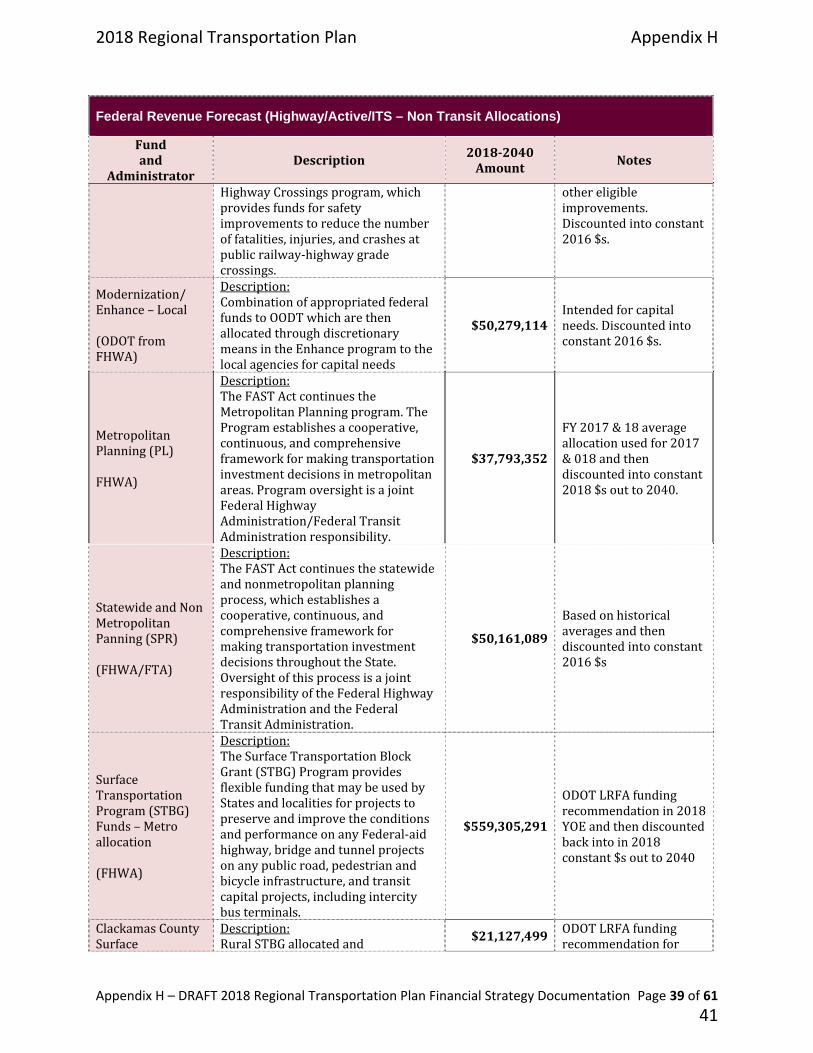
Appendix H – DRAFT 2018 Regional Transportation Plan Financial Strategy Documentation Page 39 of 61
Federal Revenue Forecast (Highway/Active/ITS – Non Transit Allocations)
Fundand
AdministratorDescription 2018‐2040
AmountNotes
HighwayCrossingsprogram,whichprovidesfundsforsafetyimprovementstoreducethenumberoffatalities,injuries,andcrashesatpublicrailway‐highwaygradecrossings.
othereligibleimprovements.Discountedintoconstant2016$s.
Modernization/Enhance–Local(ODOTfromFHWA)
Description:CombinationofappropriatedfederalfundstoOODTwhicharethenallocatedthroughdiscretionarymeansintheEnhanceprogramtothelocalagenciesforcapitalneeds
$50,279,114Intendedforcapitalneeds.Discountedintoconstant2016$s.
MetropolitanPlanning(PL)FHWA)
Description:TheFASTActcontinuestheMetropolitanPlanningprogram.TheProgramestablishesacooperative,continuous,andcomprehensiveframeworkformakingtransportationinvestmentdecisionsinmetropolitanareas.ProgramoversightisajointFederalHighwayAdministration/FederalTransitAdministrationresponsibility.
$37,793,352
FY2017&18averageallocationusedfor2017&018andthendiscountedintoconstant2018$soutto2040.
StatewideandNonMetropolitanPanning(SPR)(FHWA/FTA)
Description:TheFASTActcontinuesthestatewideandnonmetropolitanplanningprocess,whichestablishesacooperative,continuous,andcomprehensiveframeworkformakingtransportationinvestmentdecisionsthroughouttheState.OversightofthisprocessisajointresponsibilityoftheFederalHighwayAdministrationandtheFederalTransitAdministration.
$50,161,089
Basedonhistoricalaveragesandthendiscountedintoconstant2016$s
SurfaceTransportationProgram(STBG)Funds–Metroallocation(FHWA)
Description:TheSurfaceTransportationBlockGrant(STBG)ProgramprovidesflexiblefundingthatmaybeusedbyStatesandlocalitiesforprojectstopreserveandimprovetheconditionsandperformanceonanyFederal‐aidhighway,bridgeandtunnelprojectsonanypublicroad,pedestrianandbicycleinfrastructure,andtransitcapitalprojects,includingintercitybusterminals.
$559,305,291
ODOTLRFAfundingrecommendationin2018YOEandthendiscountedbackintoin2018constant$soutto2040
ClackamasCountySurface
Description:RuralSTBGallocatedand
$21,127,499 ODOTLRFAfundingrecommendationfor
2018 Regional Transportation Plan Appendix H
41
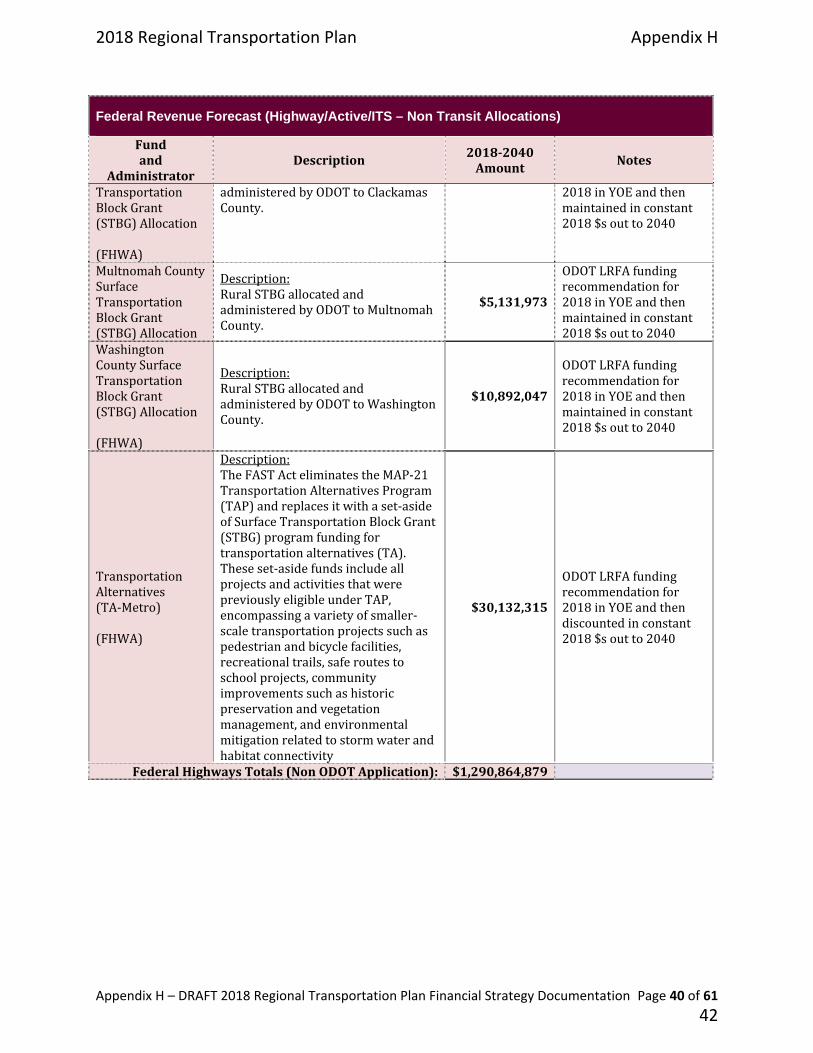
Appendix H – DRAFT 2018 Regional Transportation Plan Financial Strategy Documentation Page 40 of 61
Federal Revenue Forecast (Highway/Active/ITS – Non Transit Allocations)
Fundand
AdministratorDescription 2018‐2040
AmountNotes
TransportationBlockGrant(STBG)Allocation(FHWA)
administeredbyODOTtoClackamasCounty.
2018inYOEandthenmaintainedinconstant2018$soutto2040
MultnomahCountySurfaceTransportationBlockGrant(STBG)Allocation
Description:RuralSTBGallocatedandadministeredbyODOTtoMultnomahCounty.
$5,131,973
ODOTLRFAfundingrecommendationfor2018inYOEandthenmaintainedinconstant2018$soutto2040
WashingtonCountySurfaceTransportationBlockGrant(STBG)Allocation(FHWA)
Description:RuralSTBGallocatedandadministeredbyODOTtoWashingtonCounty.
$10,892,047
ODOTLRFAfundingrecommendationfor2018inYOEandthenmaintainedinconstant2018$soutto2040
TransportationAlternatives(TA‐Metro)(FHWA)
Description:TheFASTActeliminatestheMAP‐21TransportationAlternativesProgram(TAP)andreplacesitwithaset‐asideofSurfaceTransportationBlockGrant(STBG)programfundingfortransportationalternatives(TA).Theseset‐asidefundsincludeallprojectsandactivitiesthatwerepreviouslyeligibleunderTAP,encompassingavarietyofsmaller‐scaletransportationprojectssuchaspedestrianandbicyclefacilities,recreationaltrails,saferoutestoschoolprojects,communityimprovementssuchashistoricpreservationandvegetationmanagement,andenvironmentalmitigationrelatedtostormwaterandhabitatconnectivity
$30,132,315
ODOTLRFAfundingrecommendationfor2018inYOEandthendiscountedinconstant2018$soutto2040
FederalHighwaysTotals(NonODOT Application): $1,290,864,879
2018 Regional Transportation Plan Appendix H
42
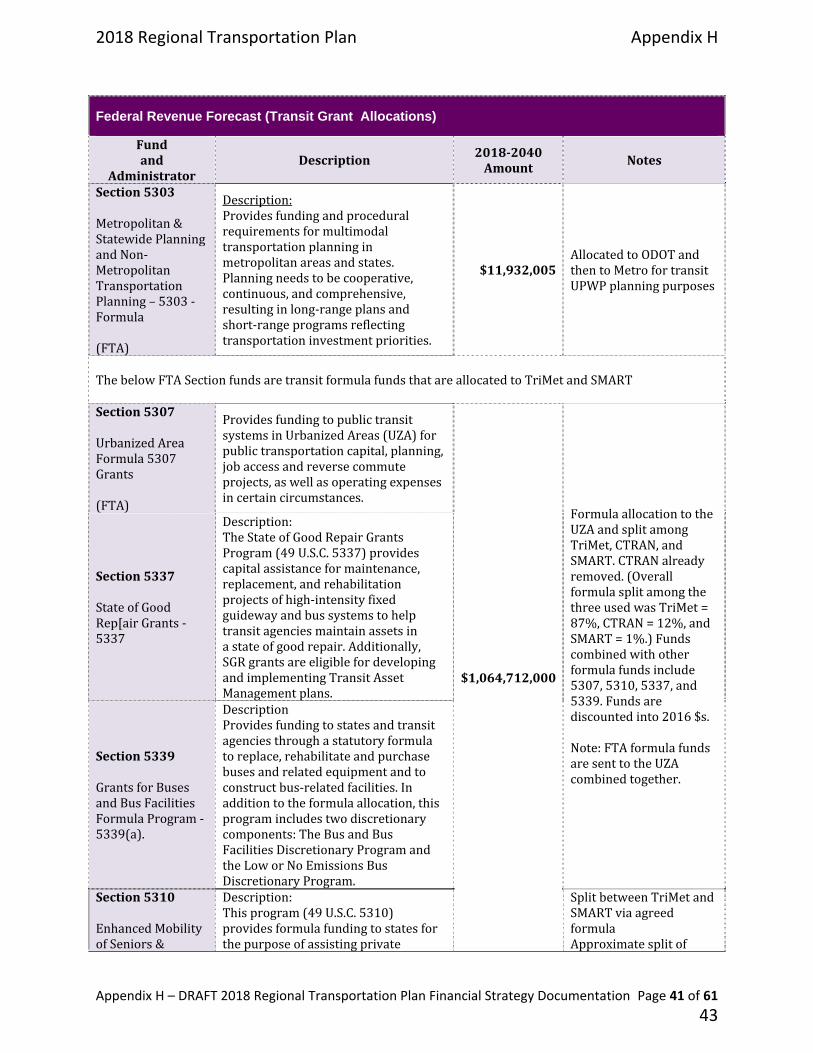
Appendix H – DRAFT 2018 Regional Transportation Plan Financial Strategy Documentation Page 41 of 61
Federal Revenue Forecast (Transit Grant Allocations)
Fundand
AdministratorDescription 2018‐2040
AmountNotes
Section5303Metropolitan&StatewidePlanningandNon‐MetropolitanTransportationPlanning–5303‐Formula(FTA)
Description:Providesfundingandproceduralrequirementsformultimodaltransportationplanninginmetropolitanareasandstates.Planningneedstobecooperative,continuous,andcomprehensive,resultinginlong‐rangeplansandshort‐rangeprogramsreflectingtransportationinvestmentpriorities.
$11,932,005AllocatedtoODOTandthentoMetrofortransitUPWPplanningpurposes
ThebelowFTASectionfundsaretransitformulafundsthatareallocatedtoTriMetandSMARTSection5307UrbanizedAreaFormula5307Grants(FTA)
ProvidesfundingtopublictransitsystemsinUrbanizedAreas(UZA)forpublictransportationcapital,planning,jobaccessandreversecommuteprojects,aswellasoperatingexpensesincertaincircumstances.
$1,064,712,000
FormulaallocationtotheUZAandsplitamongTriMet,CTRAN,andSMART.CTRANalreadyremoved.(OverallformulasplitamongthethreeusedwasTriMet=87%,CTRAN=12%,andSMART=1%.)Fundscombinedwithotherformulafundsinclude5307,5310,5337,and5339.Fundsarediscountedinto2016$s.Note:FTAformulafundsaresenttotheUZAcombinedtogether.
Section5337StateofGoodRep[airGrants‐5337
Description:TheStateofGoodRepairGrantsProgram(49U.S.C.5337)providescapitalassistanceformaintenance,replacement,andrehabilitationprojectsofhigh‐intensityfixedguidewayandbussystemstohelptransitagenciesmaintainassetsinastateofgoodrepair.Additionally,SGRgrantsareeligiblefordevelopingandimplementingTransitAssetManagementplans.
Section5339GrantsforBusesandBusFacilitiesFormulaProgram‐5339(a).
DescriptionProvidesfundingtostatesandtransitagenciesthroughastatutoryformulatoreplace,rehabilitateandpurchasebusesandrelatedequipmentandtoconstructbus‐relatedfacilities.Inadditiontotheformulaallocation,thisprogramincludestwodiscretionarycomponents:TheBusandBusFacilitiesDiscretionaryProgramandtheLoworNoEmissionsBusDiscretionaryProgram.
Section5310EnhancedMobilityofSeniors&
Description:Thisprogram(49U.S.C.5310)providesformulafundingtostatesforthepurposeofassistingprivate
SplitbetweenTriMetandSMARTviaagreedformulaApproximatesplitof
2018 Regional Transportation Plan Appendix H
43
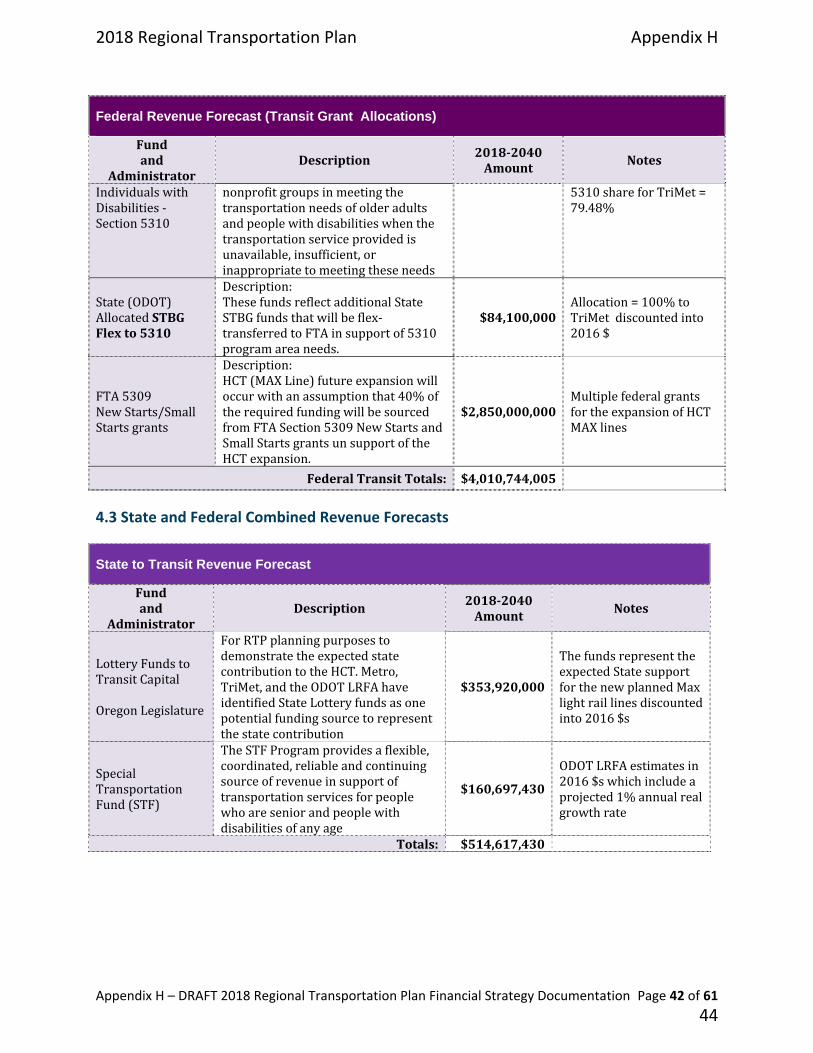
Appendix H – DRAFT 2018 Regional Transportation Plan Financial Strategy Documentation Page 42 of 61
Federal Revenue Forecast (Transit Grant Allocations)
Fundand
AdministratorDescription 2018‐2040
AmountNotes
IndividualswithDisabilities‐Section5310
nonprofitgroupsinmeetingthetransportationneedsofolderadultsandpeoplewithdisabilitieswhenthetransportationserviceprovidedisunavailable,insufficient,orinappropriatetomeetingtheseneeds
5310shareforTriMet=79.48%
State(ODOT)AllocatedSTBGFlexto5310
Description:ThesefundsreflectadditionalStateSTBGfundsthatwillbeflex‐transferredtoFTAinsupportof5310programareaneeds.
$84,100,000Allocation=100%toTriMetdiscountedinto2016$
FTA5309NewStarts/SmallStartsgrants
Description:HCT(MAXLine)futureexpansionwilloccurwithanassumptionthat40%oftherequiredfundingwillbesourcedfromFTASection5309NewStartsandSmallStartsgrantsunsupportoftheHCTexpansion.
$2,850,000,000MultiplefederalgrantsfortheexpansionofHCTMAXlines
FederalTransitTotals: $4,010,744,005
4.3 State and Federal Combined Revenue Forecasts
State to Transit Revenue Forecast
Fundand
AdministratorDescription 2018‐2040
AmountNotes
LotteryFundstoTransitCapitalOregonLegislature
ForRTPplanningpurposes todemonstratetheexpectedstatecontributiontotheHCT.Metro,TriMet,andtheODOTLRFAhaveidentifiedStateLotteryfundsasonepotentialfundingsourcetorepresentthestatecontribution
$353,920,000
ThefundsrepresenttheexpectedStatesupportforthenewplannedMaxlightraillinesdiscountedinto2016$s
SpecialTransportationFund(STF)
TheSTFProgramprovidesaflexible,coordinated,reliableandcontinuingsourceofrevenueinsupportoftransportationservicesforpeoplewhoareseniorandpeoplewithdisabilitiesofanyage
$160,697,430
ODOTLRFAestimatesin2016$swhichincludeaprojected1%annualrealgrowthrate
Totals: $514,617,430
2018 Regional Transportation Plan Appendix H
44
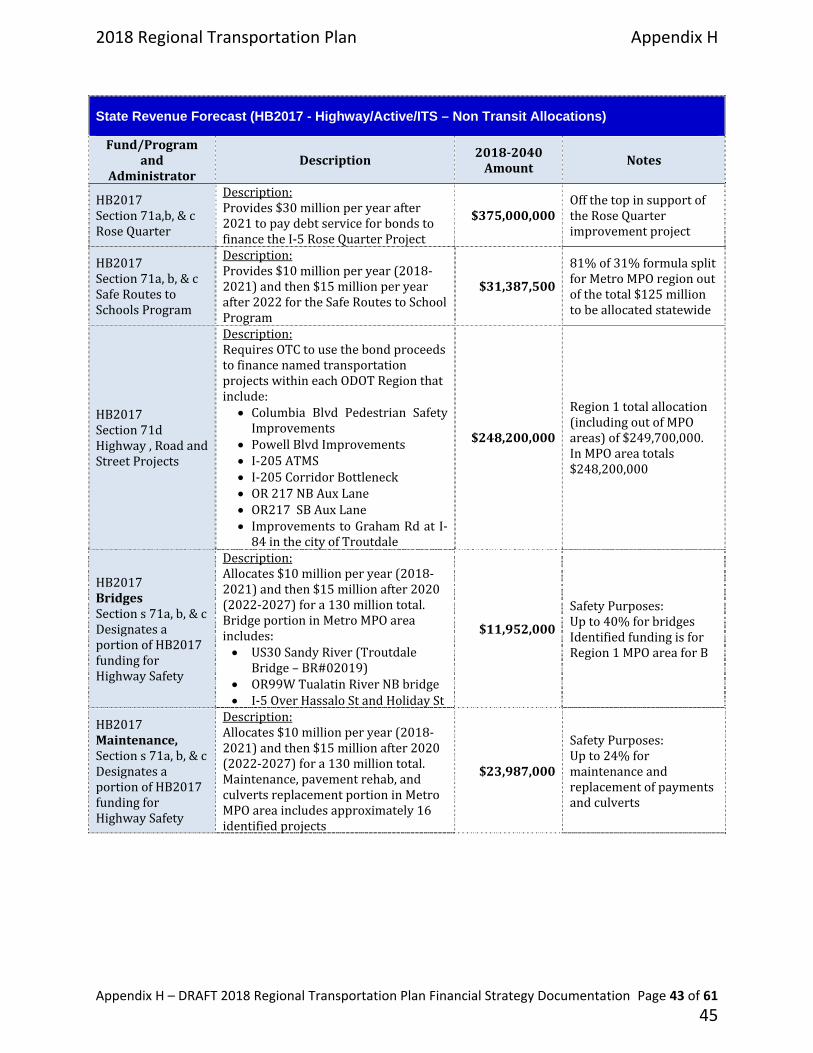
Appendix H – DRAFT 2018 Regional Transportation Plan Financial Strategy Documentation Page 43 of 61
State Revenue Forecast (HB2017 - Highway/Active/ITS – Non Transit Allocations)
Fund/Programand
AdministratorDescription 2018‐2040
AmountNotes
HB2017Section71a,b,&cRoseQuarter
Description:Provides$30millionperyearafter2021topaydebtserviceforbondstofinancetheI‐5RoseQuarterProject
$375,000,000OffthetopinsupportoftheRoseQuarterimprovementproject
HB2017Section71a,b,&cSafeRoutestoSchoolsProgram
Description:Provides$10millionperyear(2018‐2021)andthen$15millionperyearafter2022fortheSafeRoutestoSchoolProgram
$31,387,500
81%of31%formulasplitforMetroMPOregionoutofthetotal$125milliontobeallocatedstatewide
HB2017Section71dHighway,RoadandStreetProjects
Description:RequiresOTCtousethebondproceedstofinancenamedtransportationprojectswithineachODOTRegionthatinclude:
Columbia Blvd Pedestrian SafetyImprovements
PowellBlvdImprovements I‐205ATMS I‐205CorridorBottleneck OR217NBAuxLane OR217SBAuxLane ImprovementstoGrahamRdatI‐84inthecityofTroutdale
$248,200,000
Region1totalallocation(includingoutofMPOareas)of$249,700,000.InMPOareatotals$248,200,000
HB2017BridgesSections71a,b,&cDesignatesaportionofHB2017fundingforHighwaySafety
Description:Allocates$10millionperyear(2018‐2021)andthen$15millionafter2020(2022‐2027)fora130milliontotal.BridgeportioninMetroMPOareaincludes: US30SandyRiver(Troutdale
Bridge–BR#02019) OR99WTualatinRiverNBbridge I‐5OverHassaloStandHolidaySt
$11,952,000
SafetyPurposes:Upto40%forbridgesIdentifiedfundingisforRegion1MPOareaforB
HB2017Maintenance,Sections71a,b,&cDesignatesaportionofHB2017fundingforHighwaySafety
Description:Allocates$10millionperyear(2018‐2021)andthen$15millionafter2020(2022‐2027)fora130milliontotal.Maintenance,pavementrehab,andculvertsreplacementportioninMetroMPOareaincludesapproximately16identifiedprojects
$23,987,000
SafetyPurposes:Upto24%formaintenanceandreplacementofpaymentsandculverts
2018 Regional Transportation Plan Appendix H
45

Appendix H – DRAFT 2018 Regional Transportation Plan Financial Strategy Documentation Page 44 of 61
State Revenue Forecast (HB2017 - Highway/Active/ITS – Non Transit Allocations)
Fund/Programand
AdministratorDescription 2018‐2040
AmountNotes
HB2017Safety,Sections71a,b,&cDesignatesaportionofHB2017fundingforHighwaySafety
Description:Allocates$10millionperyear(2018‐2021)andthen$15millionafter2020(2022‐2027)fora130milliontotal.Safety/Maintenance/Preservationimprovements:2projectsidentified: I‐84EastPortlandFwy–NE181st
Ave I‐84Fariview–MarineDr&Tooth
RockTunnel
$4,600,000
SafetyPurposes:Upto6%formaintenance,preservationandsafetyimprovements
Totals: $701,626,500
State and Federal Combined Revenue Forecast (ODOT Capital Programs)
FundorProgramand
AdministratorDescription 2018‐2040
AmountNotes
MinimumModernization(Mod)Program(capital)(ODOT)
Description:ODOT’sModernizationprogram,whichisusedtopayforhighwayimprovementsthataddcapacity,suchaswideningahighway,buildingabypass,orimprovinganinterchange
$264,970,933
Comprisedofbothfederalandstatefundingelementsindiscounted2016$
RemainingJTAFunding(capital)(OregonLegislature)
Description:In2009,theLegislativeAssemblyenactedtheOregonJobsandTransportationActof2009(JTA).JTAauthorizesanumberoftransportationprograms.Thefundingiswindingdownandwillexpireduringthefirstten‐7earperiodofthe2018RTP
$10,000,000ExpectedtobeexpendedbytheendofthefirstRTP10‐yearperiod
NationalHighwayFreightProgram(FHWA)
Description:TheFASTActestablishesanewNationalHighwayFreightProgramtoimprovetheefficientmovementoffreightontheNationalHighwayFreightNetwork(NHFN)andsupportseveralfreightrelatedinfrastructureimprovementgoals
$67,374,013
BasedonLRFAtablesformodernizationneedsinitiallyestimatedinYOEandthendiscountedbackinto2016$s
FederalDiscretionary(capital)
Variousfederaldiscretionarytransportationgrants(FastLane,INFRA,Tiger,ITS,etc.)ODOTanticipatestheywillreceiveoverthe
$150,000,000
Revenuesbasedonpasthistoryofabout$6.5millionaverageperyearwithnogrowth.ODOT
2018 Regional Transportation Plan Appendix H
46

Appendix H – DRAFT 2018 Regional Transportation Plan Financial Strategy Documentation Page 45 of 61
State and Federal Combined Revenue Forecast (ODOT Capital Programs)
FundorProgramand
AdministratorDescription 2018‐2040
AmountNotes
(FHWA) RTPhorizonyear estimatesthatoverthe23RTPhorizonyear,theywouldsecureatotalof$150millioninvariousformsofdiscretionarytransportationfunds(e.g.FASTLane,INFRA,TIGER,ITS,etc.
ModLegislatureFutureUndefinedforCapitalpurposes(OregonLegislatureOTC)
RemainingrevenuesforcapitalimprovementsoverthelifeoftheRTP
$501,028,554
RemainingestimatedfundingovertheRTPhorizonyearswhentheOregonLegislaturepassesafollow‐ontransportationprogram(2028‐20240timeframe)
TotalStateandFederalRevenueEstimatesinSupportofODOTRegion1Mod/EnhancePrograms:
$993,373,500
State and Federal Combined Revenue Forecast (ODOT Non-Capacity Fix-it/O&M Program)
FundingProgramand
AdministratorDescription Amount Notes
Fix‐ItProgramOregonLegislatureOTC
Description:TheFix‐ItprogramincludesfundingcategoriesthatmaintainorfixODOT’sportionofthetransportationsystem.Thisisthenon‐capacityenhancingoperationsandmaintenance(O&M)componenttoODOT’soverallsystempreservation.TherearegenerallyfourmajorcategoriesofFix‐itprogramswhichincludeBridges(repair/rehabilitate),Culverts(repair/replace),HighwayPavementMaintenance,andSafetyandoperations
$1,635,898,375
Estimatesfromthecurrent2018‐2021and2021‐2024draftSTIPwithastraight‐lineprojectionoutto2040,thendiscountedbackinto2018$
TotalfederalandStatecombinedrevenuesforODOT: $1,635,898,375
2018 Regional Transportation Plan Appendix H
47

Appendix H – DRAFT 2018 Regional Transportation Plan Financial Strategy Documentation Page 46 of 61
Fix-It Non-Capacity Project Grouping Buckets Proposed for the RTP
Project Grouping Description
Project Grouping
Bucket Programming
Notes
Bridge Rehabilitate&Repair
Minorrepair/rehabilitateprojects.Outof the total identified Fix‐it revenuesapproximately20%will be committedtotheBridgeProgram
$327,179,675Projectgroupingtotalcostthreshold=$5million
Culverts RepairandReplace
Repair and replacement eligibleprojects that do not change theroadway existing capacity. Out of thetotal identified Fix‐it revenuesapproximately10%will be committedtotheBridgeProgram
$163,589,838Projectgroupingtotalcostceilingthreshold=$5million
Highway PavementMaintenance
Non‐capacity pavementrehabilitation/repair projects thatcouldincludeoverlays,slurryseals,fullpavement replacement, and otherminor non‐capacity roadwayimprovements (curb and gutters,adding/widening shoulders as long asthe project remains exempt and willclear NEPA as a CE. Out of the totalidentified Fix‐it revenuesapproximately30%will be committedtotheBridgeProgram
$490,769,513Projectgroupingtotalcostceilingthreshold=$5million
Safety andOperationsImprovements
Allincludedgroupingprojectsmustbenon‐ capacity type projectimprovements,mustbeexemptforairqualityanalysis,mustclearNEPAwithaCEandcan’texceedthe totalprojectcost threshold of $5 million. Projectsthat exceed the threshold must beindividually identified in the RTP asstand‐ alone projects. Eligible safetyandoperationalimprovementsforthisproject grouping may include thefollowing: Highwaycrossingsimprovements Roadway safety (non capacity
repairs/rehabilitation Landslides/rockfallsmitigation Illumination/Signals,ITS
Out of the total identified Fix‐itrevenues approximately 40% will becommittedtotheBridgeProgram
$654,359,350Projectgroupingtotalcostthreshold=$5million
Total: $1,635,898,375 Notes:
1. All projects eligible to be included in a project grouping must clearly demonstrate that they are not capacity enhancing projects.
2. Only projects that will clear NEPA with a CE are eligible to be included in the project grouping bucket. 3. All projects in the project grouping bucket must be exempt for air quality analysis and clearly show they meet this
requirement per 40 CFR 93.126, Table 2 and 40 CFR 93.127, Table 3. 4. Specific project listings are not required to be submitted for the identified project groupings in the RTP. They are required
when used in the MTIP.
2018 Regional Transportation Plan Appendix H
48

Appendix H – DRAFT 2018 Regional Transportation Plan Financial Strategy Documentation Page 47 of 61
5. The funding amount stated in the project groupings do not represent additional revenues, but an estimated commitment from the total Fix-It program for the four identified project grouping buckets.
6. The threshold amounts reflect a total project cost ceiling for the applicable bucket. If the project has a total project cost above the ceiling threshold it will need to be added to the RTP as a stand-alone project and may not be included in the project grouping bucket
7. While not capacity enhancing, the Fix-it program projects are considered to be regionally significant as they are: Located on the Metro Roadway Arterials and Throughway system network Will most likely receive federal funds and become federalized Are expected to complete NEPA with a CE Reflect a federal, state, and/or local funding investment ensuring the operations and maintenance needs for the
Arterials and Throughways network are being addressed.
4.4 Summary of State and Federal Combined Constrained Revenues
Table4.2aboverepresentsatotalfundingoffederalandstateconstrainedrevenuesdividedbytheirallocationorprogramsource.Thetotalestimatedconstrainedfederalandstaterevenuesforbothhighwayandtransitneedsis$9,197,285,778.
4.5 Local Revenues
AsnotedinSection3.10,localagenciesutilizemultipleassessments,taxes,andothermeanstogeneratetransportationrevenuesfortheirjurisdiction.Onlyaportionofthetotalgeneratelocalrevenuescanbeappliedforcapitalprojectneeds.Somejurisdiction’soperationsandmaintenance(O&M)annualrequirementscanconsumeashighas100%oftheiravailablelocalfunds.Comparingotherjurisdictions,theirannualO&Mrequirementsrange,andcanconsumebetween50%‐90%ofthetotallocalfundsgenerated.AsaresultlocalagenciesstrugglewiththeabilitytomeettheirannualO&Mrequirementsandstillretainsufficientlocalfundsforcapitalandexpansionneeds.Thetablebelowprovidesathree‐countyandtheCityofPortlandsummaryoflocalrevenuesandtheiridentifiedamountforcapitalprojectneeds.
2018 Regional Transportation Plan Appendix H
49
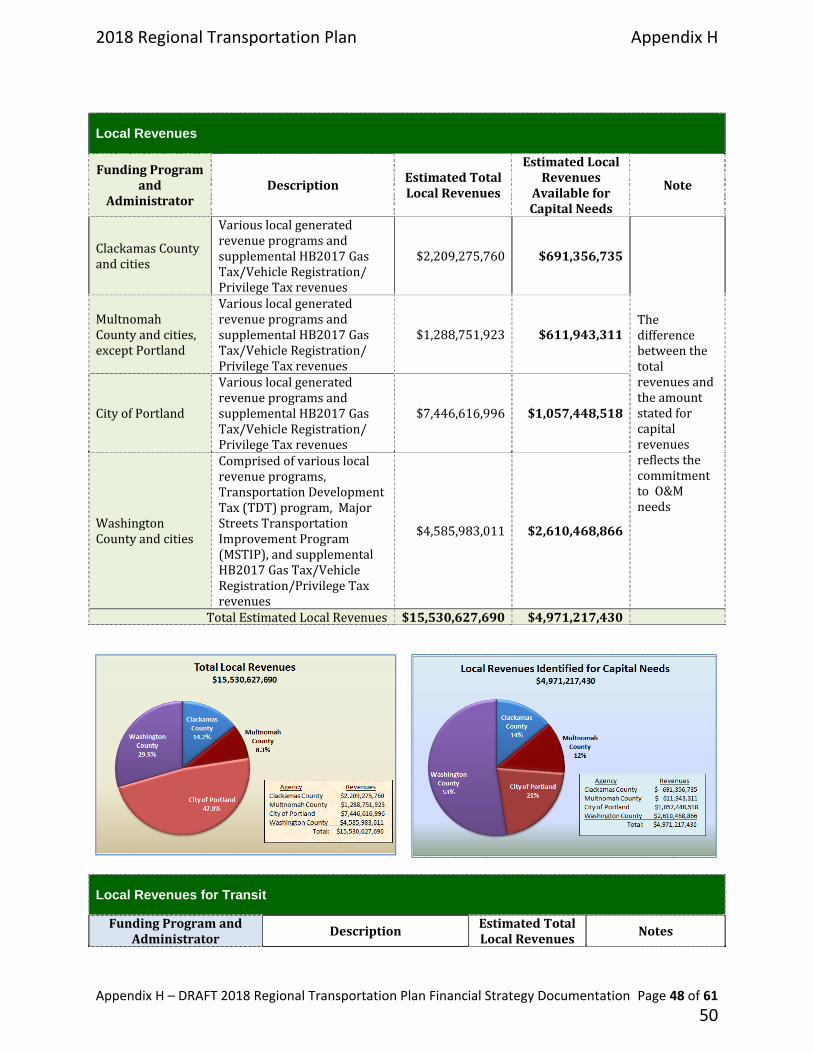
Appendix H – DRAFT 2018 Regional Transportation Plan Financial Strategy Documentation Page 48 of 61
Local Revenues
FundingProgramand
AdministratorDescription
EstimatedTotalLocalRevenues
EstimatedLocalRevenues
AvailableforCapitalNeeds
Note
ClackamasCountyandcities
VariouslocalgeneratedrevenueprogramsandsupplementalHB2017GasTax/VehicleRegistration/PrivilegeTaxrevenues
$2,209,275,760 $691,356,735
ThedifferencebetweenthetotalrevenuesandtheamountstatedforcapitalrevenuesreflectsthecommitmenttoO&Mneeds
MultnomahCountyandcities,exceptPortland
VariouslocalgeneratedrevenueprogramsandsupplementalHB2017GasTax/VehicleRegistration/PrivilegeTaxrevenues
$1,288,751,923 $611,943,311
CityofPortland
VariouslocalgeneratedrevenueprogramsandsupplementalHB2017GasTax/VehicleRegistration/PrivilegeTaxrevenues
$7,446,616,996 $1,057,448,518
WashingtonCountyandcities
Comprisedofvariouslocalrevenueprograms,TransportationDevelopmentTax(TDT)program,MajorStreetsTransportationImprovementProgram(MSTIP),andsupplementalHB2017GasTax/VehicleRegistration/PrivilegeTaxrevenues
$4,585,983,011 $2,610,468,866
TotalEstimatedLocalRevenues $15,530,627,690 $4,971,217,430
Local Revenues for Transit
FundingProgramandAdministrator
DescriptionEstimatedTotalLocalRevenues
Notes
2018 Regional Transportation Plan Appendix H
50
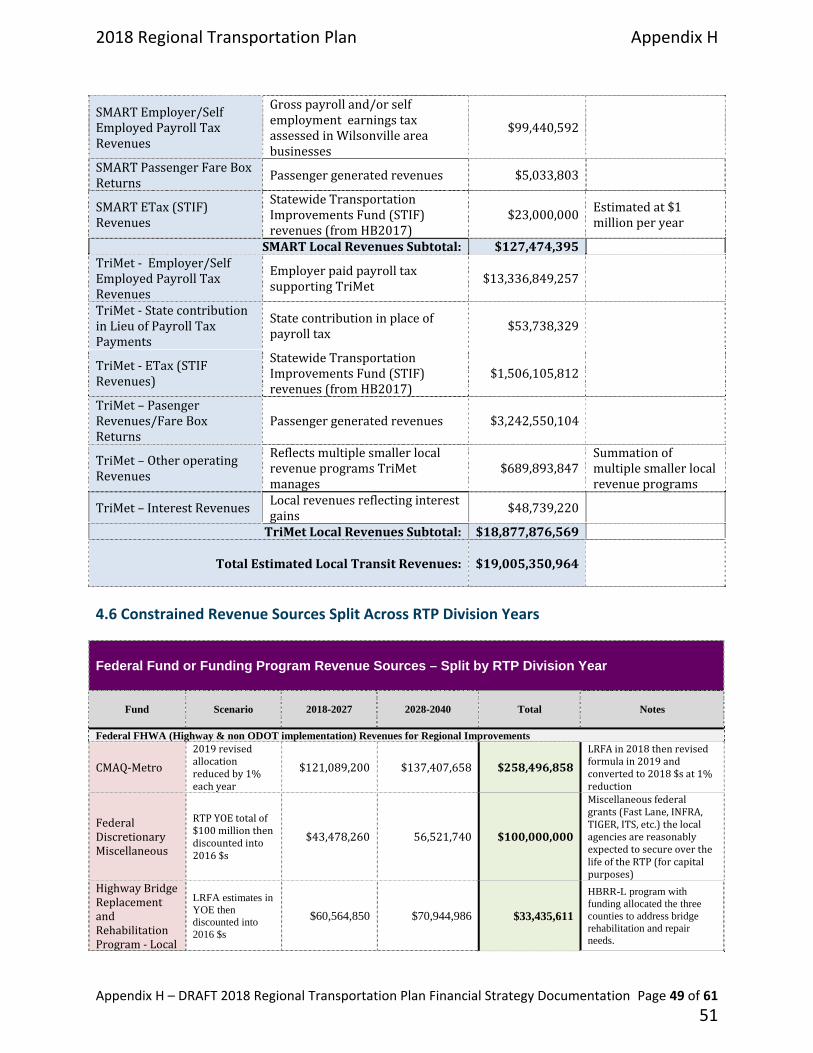
Appendix H – DRAFT 2018 Regional Transportation Plan Financial Strategy Documentation Page 49 of 61
SMARTEmployer/SelfEmployedPayrollTaxRevenues
Grosspayrolland/orselfemploymentearningstaxassessedinWilsonvilleareabusinesses
$99,440,592
SMARTPassengerFareBoxReturns
Passengergeneratedrevenues $5,033,803
SMARTETax(STIF)Revenues
StatewideTransportationImprovementsFund(STIF)revenues(fromHB2017)
$23,000,000Estimatedat$1millionperyear
SMARTLocalRevenuesSubtotal: $127,474,395 TriMet‐Employer/SelfEmployedPayrollTaxRevenues
EmployerpaidpayrolltaxsupportingTriMet
$13,336,849,257
TriMet‐StatecontributioninLieuofPayrollTaxPayments
Statecontributioninplaceofpayrolltax $53,738,329
TriMet‐ETax(STIFRevenues)
StatewideTransportationImprovementsFund(STIF)revenues(fromHB2017)
$1,506,105,812
TriMet–PasengerRevenues/FareBoxReturns
Passengergeneratedrevenues $3,242,550,104
TriMet–OtheroperatingRevenues
ReflectsmultiplesmallerlocalrevenueprogramsTriMetmanages
$689,893,847Summationofmultiplesmallerlocalrevenueprograms
TriMet–InterestRevenuesLocalrevenuesreflectinginterestgains
$48,739,220
TriMetLocalRevenuesSubtotal: $18,877,876,569
TotalEstimatedLocalTransitRevenues: $19,005,350,964
4.6 Constrained Revenue Sources Split Across RTP Division Years
Federal Fund or Funding Program Revenue Sources – Split by RTP Division Year
Fund
Scenario 2018-2027 2028-2040 Total Notes
Federal FHWA (Highway & non ODOT implementation) Revenues for Regional Improvements
CMAQ‐Metro
2019revisedallocationreducedby1%eachyear
$121,089,200 $137,407,658 $258,496,858
LRFAin2018thenrevisedformulain2019andconvertedto2018$sat1%reduction
FederalDiscretionaryMiscellaneous
RTPYOEtotalof$100millionthendiscountedinto2016$s
$43,478,260 56,521,740 $100,000,000
Miscellaneousfederalgrants(FastLane,INFRA,TIGER,ITS,etc.)thelocalagenciesarereasonablyexpectedtosecureoverthelifeoftheRTP(forcapitalpurposes)
HighwayBridgeReplacementandRehabilitationProgram‐Local
LRFA estimates in YOE then discounted into 2016 $s
$60,564,850 $70,944,986 $33,435,611
HBRR-L program with funding allocated the three counties to address bridge rehabilitation and repair needs.
2018 Regional Transportation Plan Appendix H
51
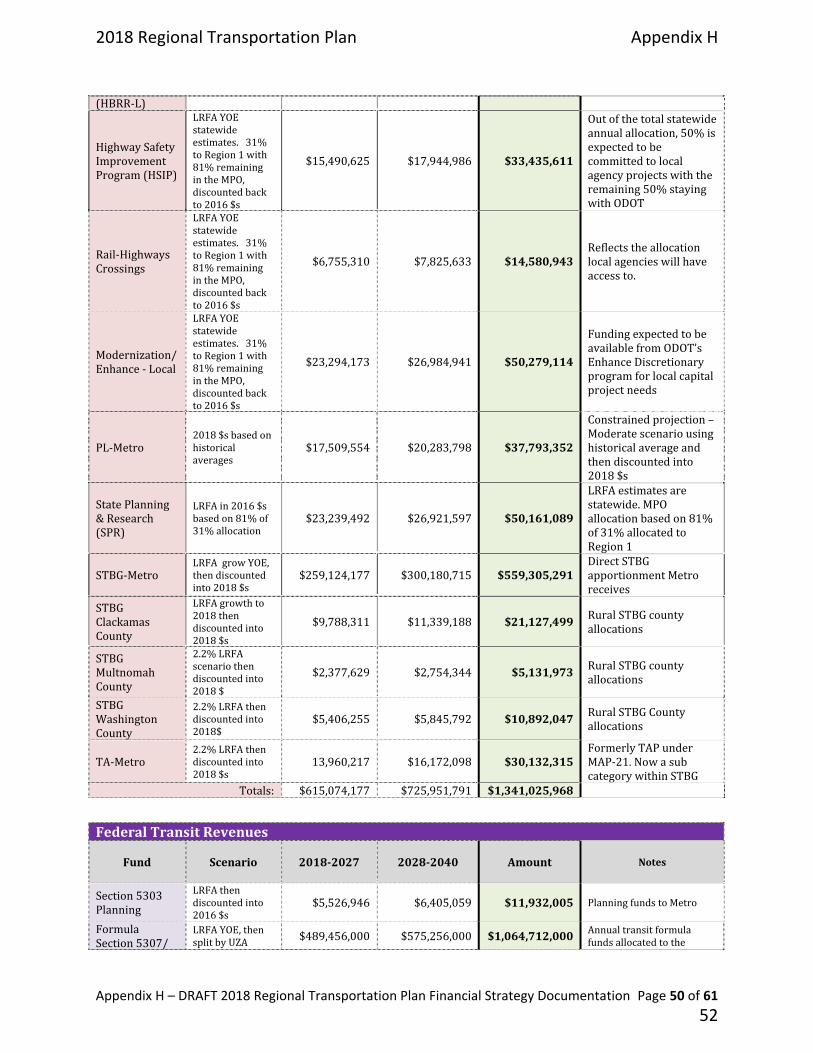
Appendix H – DRAFT 2018 Regional Transportation Plan Financial Strategy Documentation Page 50 of 61
(HBRR‐L)
HighwaySafetyImprovementProgram(HSIP)
LRFAYOEstatewideestimates.31%toRegion1with81%remainingintheMPO,discountedbackto2016$s
$15,490,625 $17,944,986 $33,435,611
Outofthetotalstatewideannualallocation,50%isexpectedtobecommittedtolocalagencyprojectswiththeremaining50%stayingwithODOT
Rail‐HighwaysCrossings
LRFAYOEstatewideestimates.31%toRegion1with81%remainingintheMPO,discountedbackto2016$s
$6,755,310 $7,825,633 $14,580,943Reflectstheallocationlocalagencieswillhaveaccessto.
Modernization/Enhance‐Local
LRFAYOEstatewideestimates.31%toRegion1with81%remainingintheMPO,discountedbackto2016$s
$23,294,173 $26,984,941 $50,279,114
FundingexpectedtobeavailablefromODOT’sEnhanceDiscretionaryprogramforlocalcapitalprojectneeds
PL‐Metro2018$sbasedonhistoricalaverages
$17,509,554 $20,283,798 $37,793,352
Constrainedprojection–Moderatescenariousinghistoricalaverageandthendiscountedinto2018$s
StatePlanning&Research(SPR)
LRFAin2016$sbasedon81%of31%allocation
$23,239,492 $26,921,597 $50,161,089
LRFAestimatesarestatewide.MPOallocationbasedon81%of31%allocatedtoRegion1
STBG‐MetroLRFAgrowYOE,thendiscountedinto2018$s
$259,124,177 $300,180,715 $559,305,291DirectSTBGapportionmentMetroreceives
STBGClackamasCounty
LRFAgrowthto2018thendiscountedinto2018$s
$9,788,311 $11,339,188 $21,127,499RuralSTBGcountyallocations
STBGMultnomahCounty
2.2%LRFAscenariothendiscountedinto2018$
$2,377,629 $2,754,344 $5,131,973 RuralSTBGcountyallocations
STBGWashingtonCounty
2.2%LRFAthendiscountedinto2018$
$5,406,255 $5,845,792 $10,892,047RuralSTBGCountyallocations
TA‐Metro2.2%LRFAthendiscountedinto2018$s
13,960,217 $16,172,098 $30,132,315FormerlyTAPunderMAP‐21.NowasubcategorywithinSTBG
Totals: $615,074,177 $725,951,791 $1,341,025,968
FederalTransitRevenues
Fund
Scenario 2018‐2027 2028‐2040 Amount Notes
Section5303Planning
LRFAthendiscountedinto2016$s
$5,526,946 $6,405,059 $11,932,005 PlanningfundstoMetro
FormulaSection5307/
LRFAYOE,thensplitbyUZA $489,456,000 $575,256,000 $1,064,712,000 Annualtransitformula
fundsallocatedtothe
2018 Regional Transportation Plan Appendix H
52
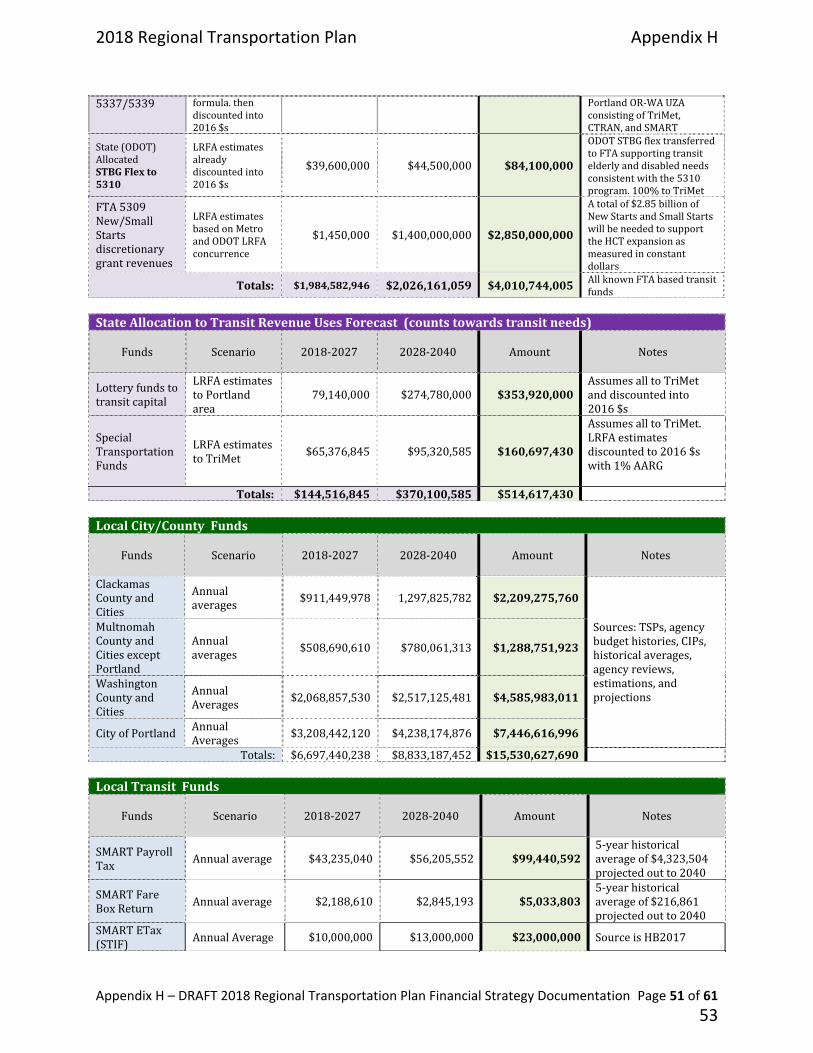
Appendix H – DRAFT 2018 Regional Transportation Plan Financial Strategy Documentation Page 51 of 61
5337/5339 formula.thendiscountedinto2016$s
PortlandOR‐WAUZAconsistingofTriMet,CTRAN,andSMART
State(ODOT)AllocatedSTBGFlexto5310
LRFAestimatesalreadydiscountedinto2016$s
$39,600,000 $44,500,000 $84,100,000
ODOTSTBGflextransferredtoFTAsupportingtransitelderlyanddisabledneedsconsistentwiththe5310program.100%toTriMet
FTA5309New/SmallStartsdiscretionarygrantrevenues
LRFAestimatesbasedonMetroandODOTLRFAconcurrence
$1,450,000 $1,400,000,000 $2,850,000,000
Atotalof$2.85billionofNewStartsandSmallStartswillbeneededtosupporttheHCTexpansionasmeasuredinconstantdollars
Totals: $1,984,582,946 $2,026,161,059 $4,010,744,005 AllknownFTAbasedtransitfunds
StateAllocationtoTransitRevenueUsesForecast(countstowardstransitneeds)
Funds
Scenario 2018‐2027 2028‐2040 Amount Notes
Lotteryfundstotransitcapital
LRFAestimatestoPortlandarea
79,140,000 $274,780,000 $353,920,000AssumesalltoTriMetanddiscountedinto2016$s
SpecialTransportationFunds
LRFAestimatestoTriMet
$65,376,845 $95,320,585 $160,697,430
AssumesalltoTriMet.LRFAestimatesdiscountedto2016$swith1%AARG
Totals: $144,516,845 $370,100,585 $514,617,430 LocalCity/CountyFunds
Funds
Scenario 2018‐2027 2028‐2040 Amount Notes
ClackamasCountyandCities
Annualaverages
$911,449,978 1,297,825,782 $2,209,275,760
Sources:TSPs,agencybudgethistories,CIPs,historicalaverages,agencyreviews,estimations,andprojections
MultnomahCountyandCitiesexceptPortland
Annualaverages
$508,690,610 $780,061,313 $1,288,751,923
WashingtonCountyandCities
AnnualAverages
$2,068,857,530 $2,517,125,481 $4,585,983,011
CityofPortlandAnnualAverages
$3,208,442,120 $4,238,174,876 $7,446,616,996
Totals: $6,697,440,238 $8,833,187,452 $15,530,627,690 LocalTransitFunds
Funds
Scenario 2018‐2027 2028‐2040 Amount Notes
SMARTPayrollTax
Annualaverage $43,235,040 $56,205,552 $99,440,5925‐yearhistoricalaverageof$4,323,504projectedoutto2040
SMARTFareBoxReturn
Annualaverage $2,188,610 $2,845,193 $5,033,8035‐yearhistoricalaverageof$216,861projectedoutto2040
SMARTETax(STIF)
AnnualAverage $10,000,000 $13,000,000 $23,000,000 SourceisHB2017
2018 Regional Transportation Plan Appendix H
53
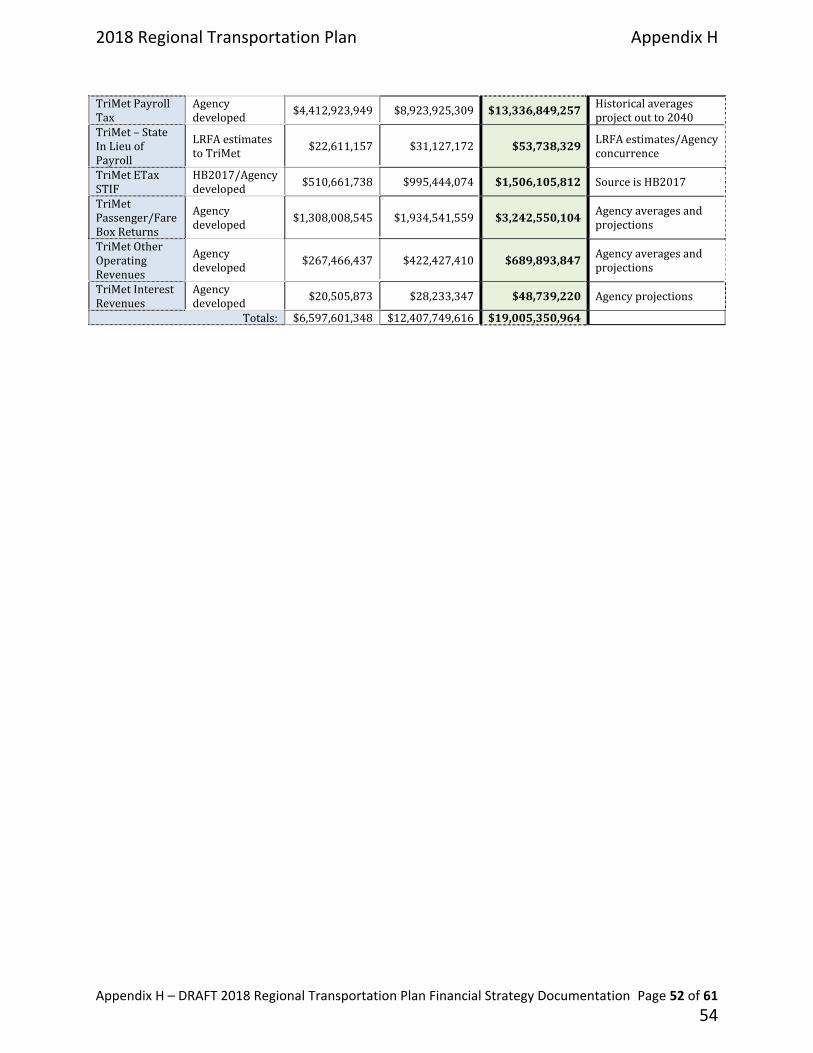
Appendix H – DRAFT 2018 Regional Transportation Plan Financial Strategy Documentation Page 52 of 61
TriMetPayrollTax
Agencydeveloped
$4,412,923,949 $8,923,925,309 $13,336,849,257Historicalaveragesprojectoutto2040
TriMet–StateInLieuofPayroll
LRFAestimatestoTriMet
$22,611,157 $31,127,172 $53,738,329LRFAestimates/Agencyconcurrence
TriMetETaxSTIF
HB2017/Agencydeveloped
$510,661,738 $995,444,074 $1,506,105,812 SourceisHB2017
TriMetPassenger/FareBoxReturns
Agencydeveloped
$1,308,008,545 $1,934,541,559 $3,242,550,104Agencyaveragesandprojections
TriMetOtherOperatingRevenues
Agencydeveloped
$267,466,437 $422,427,410 $689,893,847Agencyaveragesandprojections
TriMetInterestRevenues
Agencydeveloped
$20,505,873 $28,233,347 $48,739,220 Agencyprojections
Totals: $6,597,601,348 $12,407,749,616 $19,005,350,964
2018 Regional Transportation Plan Appendix H
54
Appendix H – DRAFT 2018 Regional Transportation Plan Financial Strategy Documentation Page 53 of 61
5.0 REVENUE PROGRAMS GLOSSARY
5.0 Revenue programs glossary ..................................................................... Error! Bookmark not defined.
5.1 Key Federal Revenues ....................................................................................................................... 53
5.2 Federal Transit Agency Sourced Funding .......................................................................................... 58
5.1 Key Federal Revenues
Congestion Mitigation Air Quality (CMAQ) Improvement Funds
TheFASTActcontinuedtheCMAQprogramtoprovideaflexiblefundingsourcetoStateandlocalgovernmentsfortransportationprojectsandprogramstohelpmeettherequirementsoftheCleanAirAct.FundingisavailabletoreducecongestionandimproveairqualityforareasthatdonotmeettheNationalAmbientAirQualityStandardsforozone,carbonmonoxide,orparticulatematter(nonattainmentareas)andforformernonattainmentareasthatarenowincompliance(maintenanceareas).
EligibleActivities
Fundsmaybeusedforatransportationprojectorprogramthatislikelytocontributetotheattainmentormaintenanceofanationalambientairqualitystandard,withahighlevelofeffectivenessinreducingairpollution,andthatisincludedinthemetropolitanplanningorganization’s(MPO’s)currenttransportationplanandtransportationimprovementprogram(TIP)orthecurrentstatetransportationimprovementprogram(STIP)inareaswithoutanMPO.
TheFASTActaddedeligibilityforverifiedtechnologiesfornon‐roadvehiclesandnon‐roadenginesthatareusedinport‐relatedfreightoperationslocatedinozone,PM10,orPM2.5nonattainmentormaintenanceareasfundedinwholeorinpartunder23U.S.C.orchapter53of49U.S.C.[23U.S.C.149(b)(8)(A)(ii)]
TheActalsospecificallymakeseligibletheinstallationofvehicle‐to‐infrastructurecommunicationsequipment.[23U.S.C.149(b)(9)]
TheFASTActcontinueseligibilityforelectricvehicleandnaturalgasvehicleinfrastructureandaddspriorityforinfrastructurelocatedonthecorridorsdesignatedunder23U.S.C.151.[23U.S.C.149(c)(2)]
TheFASTActamendedtheeligibleusesofCMAQfundssetasideforPM2.5nonattainmentandmaintenanceareas.PM2.5set‐asidefundsmaybeusedtoreducefineparticulatematteremissionsinaPM2.5nonattainmentormaintenancearea,including:
Dieselretrofits;
Installationofdieselemissioncontroltechnologyonnon‐roaddieselequipmentoron‐roaddieselequipmentthatisoperatedonahighwayconstructionprojects;and
2018 Regional Transportation Plan Appendix H
55

Appendix H – DRAFT 2018 Regional Transportation Plan Financial Strategy Documentation Page 54 of 61
Themostcost‐effectiveprojectstoreduceemissionsfromport‐relatedlandsidenonroadoron‐roadequipmentthatisoperatedwithintheboundariesofthearea.[23U.S.C.149(k)(2)&(4)]
UnlikeSTPfunding,theeligibilityforusingCMAQmustfocusondirectairqualityimprovementprojectsthatreduceharmfulpollutantsthatincludeozone,carbonmonoxide,andparticulatematter(PM).ThefocusonairqualityimprovementcriteriarequiresnominatedprojectstoundergoamuchmoredetailedlevelofreviewtoensuretheproposedimprovementsareeligibleforCMAQfunding.
Surface Transportation Block Grant (STBG)
TheFASTActconvertsthelong‐standingSurfaceTransportationProgramintotheSurfaceTransportationBlockGrantProgramacknowledgingthatthisprogramhasthemostflexibleeligibilitiesamongallFederal‐aidhighwayprogramsandaligningtheprogram’snamewithhowFHWAhashistoricallyadministeredit.TheSTBGpromotesflexibilityinStateandlocaltransportationdecisionsandprovidesflexiblefundingtobestaddressStateandlocaltransportationneeds.
EligibleProjectsandActivities
LocationofProjects(23U.S.C.133(c)):STBGprojectsmaynotbeundertakenonaroadfunctionallyclassifiedasalocalroadoraruralminorcollectorunlesstheroadwasonaFederal‐aidhighwaysystemonJanuary1,1991,except‐
Forabridgeortunnelproject(otherthantheconstructionofanewbridgeortunnelatanewlocation);
Foraprojectdescribedin23U.S.C.133(b)(4)‐(11)anddescribedbelowunder"EligibleActivities"(b)(4)through(11);
Fortransportationalternativesprojectsdescribedin23U.S.C.101(a)(29)beforeenactmentoftheFASTAct(thesearedescribedin23U.S.C.133(h)andinseparateTASet‐Asideguidance.);and
AsapprovedbytheSecretary.
EligibleActivities(23U.S.C.133(b)):Subjecttothelocationofprojectsrequirementsinparagraph(a),thefollowingeligibleactivitiesarelistedin23U.S.C.133(b):
Construction,asdefinedin23U.S.C.101(a)(4),ofthefollowing:
o Highways,bridges,andtunnels,includingdesignatedroutesoftheAppalachiandevelopmenthighwaysystemandlocalaccessroadsunder40U.S.C.14501;
o Ferryboatsandterminalfacilitieseligibleunder23U.S.C.129(c);transitcapitalprojectseligibleunderchapter53oftitle49,UnitedStatesCode;
o Infrastructure‐basedintelligenttransportationsystemscapitalimprovements,includingtheinstallationofvehicle‐to‐infrastructurecommunicationequipment;
2018 Regional Transportation Plan Appendix H
56

Appendix H – DRAFT 2018 Regional Transportation Plan Financial Strategy Documentation Page 55 of 61
o TruckparkingfacilitieseligibleunderSection1401ofMAP‐21(23U.S.C.137note);and
o BorderinfrastructureprojectseligibleunderSection1303ofSAFETEA‐LU(23U.S.C.101note).
Operationalimprovementsandcapitalandoperatingcostsfortrafficmonitoring,management,andcontrolfacilitiesandprograms.Operationalimprovementisdefinedin23U.S.C.101(a)(18).
Environmentalmeasureseligibleunder23U.S.C.119(g),328,and329,andtransportationcontrolmeasureslistedinSection108(f)(1)(A)(otherthanclause(xvi)ofthatsection)oftheCleanAirAct(42U.S.C.7408(f)(1)(A)).
Highwayandtransitsafetyinfrastructureimprovementsandprograms,includingrailway‐highwaygradecrossings.
Fringeandcorridorparkingfacilitiesandprogramsinaccordancewith23U.S.C.137andcarpoolprojectsinaccordancewith23U.S.C.146.Carpoolprojectisdefinedin23U.S.C.101(a)(3).
Recreationaltrailsprojectseligibleunder23U.S.C.206,pedestrianandbicycleprojectsinaccordancewith23U.S.C.217(includingmodificationstocomplywithaccessibilityrequirementsundertheAmericanswithDisabilitiesActof1990(42U.S.C.12101etseq.)),andtheSafeRoutestoSchoolProgramunderSection1404ofSAFETEA‐LU(23U.S.C.402note).
Planning,design,orconstructionofboulevardsandotherroadwayslargelyintheright‐of‐wayofformerInterstateSystemroutesorotherdividedhighways.
DevelopmentandimplementationofaStateassetmanagementplanfortheNationalHighwaySystem(NHS)andaperformance‐basedmanagementprogramforotherpublicroads.
Protection(includingpainting,scourcountermeasures,seismicretrofits,impactprotectionmeasures,securitycountermeasures,andprotectionagainstextremeevents)forbridges(includingapproachestobridgesandotherelevatedstructures)andtunnelsonpublicroads,andinspectionandevaluationofbridgesandtunnelsandotherhighwayassets.
Surfacetransportationplanningprograms,highwayandtransitresearchanddevelopmentandtechnologytransferprograms,andworkforcedevelopment,training,andeducationunderchapter5oftitle23,UnitedStatesCode.
Surfacetransportationinfrastructuremodificationstofacilitatedirectintermodalinterchange,transfer,andaccessintoandoutofaportterminal.
Projectsandstrategiesdesignedtosupportcongestionpricing,includingelectronictollcollectionandtraveldemandmanagementstrategiesandprograms.
UponrequestofaStateandsubjecttotheapprovaloftheSecretary,ifTransportationInfrastructureFinanceandInnovationAct(TIFIA)creditassistanceisapprovedforanSTBG‐eligibleproject,thentheStatemayuseSTBGfundstopaythesubsidyandadministrativecostsassociatedwithprovidingFederalcreditassistancefortheprojects.
2018 Regional Transportation Plan Appendix H
57
Appendix H – DRAFT 2018 Regional Transportation Plan Financial Strategy Documentation Page 56 of 61
ThecreationandoperationbyaStateofanofficetoassistinthedesign,implementation,andoversightofpublic‐privatepartnershipseligibletoreceivefundingundertitle23andchapter53oftitle49,UnitedStatesCode,andthepaymentofastipendtounsuccessfulprivatebidderstooffsettheirproposaldevelopmentcosts,ifnecessarytoencouragerobustcompetitioninpublic‐privatepartnershipprocurements.
Anytypeofprojecteligibleunder23U.S.C.133asineffectonthedaybeforetheFASTActwasenacted.Amongtheseare:
o Replacementofbridgeswithfillmaterial;
o Trainingofbridgeandtunnelinspectors;Applicationofcalciummagnesiumacetate,sodiumacetate/formate,orotherenvironmentallyacceptable,minimallycorrosiveanti‐icinganddeicingcompositionsforbridges(andapproachestobridgesandotherelevatedstructures)andtunnels;
o Projectstoaccommodateothertransportationmodescontinuetobeeligiblepursuantto23U.S.C.142(c)ifsuchaccommodationdoesnotadverselyaffecttrafficsafety;
o Transitcapitalprojectseligibleforassistanceunderchapter53oftitle49,UnitedStatesCode,includingvehiclesandfacilities(publiclyorprivatelyowned)thatareusedtoprovideintercitypassengerbusservice;
o Approachroadwaystoferryterminalstoaccommodateothertransportationmodesandtoprovideaccessintoandoutoftheports;
o Transportationalternativespreviouslydescribedin23U.S.C.101(a)(29)anddescribedin23U.S.C.213;
o Projectsrelatingtointersectionshavingdisproportionatelyhighaccidentrates,highlevelsofcongestion(asevidencedbyinterruptedtrafficflowattheintersectionandalevelofserviceratingof"F"duringpeaktravelhours,calculatedinaccordancewiththeHighwayCapacityManual),andarelocatedonaFederal‐aidhighway;
o ConstructionandoperationalimprovementsforanyminorcollectoriftheminorcollectorandtheprojecttobecarriedoutareinthesamecorridorandinproximitytoanNHSroute;theconstructionorimprovementswillenhancethelevelofserviceontheNHSrouteandimproveregionaltrafficflow;andtheconstructionorimprovementsaremorecost‐effective,asdeterminedbyabenefit‐costanalysis,thananimprovementtotheNHSroute;
o x.Workforcedevelopment,training,andeducationactivitiesdiscussedin23U.S.C.504(e);
o Advancedtruckstopelectrificationsystems.Truckstopelectrificationsystemisdefinedin23U.S.C.101(a)(32);
o Installationofsafetybarriersandnetsonbridges,hazardeliminations,projectstomitigatehazardscausedbywildlife;
o Electricvehicleandnaturalgasvehicleinfrastructureinaccordancewith23U.S.C.137;
o Datacollection,maintenance,andintegrationandthecostsassociatedwithobtaining,updating,andlicensingsoftwareandequipmentrequiredforrisk‐basedasset
2018 Regional Transportation Plan Appendix H
58
Appendix H – DRAFT 2018 Regional Transportation Plan Financial Strategy Documentation Page 57 of 61
managementandperformancebasedmanagement,andforsimilaractivitiesrelatedtothedevelopmentandimplementationofaperformancebasedmanagementprogramforotherpublicroads;
o Constructionofanybridgeinaccordancewith23U.S.C.144(f)thatreplacesanylowwatercrossing(regardlessofthelengthofthelowwatercrossing);anybridgethatwasdestroyedpriortoJanuary1,1965;anyferrythatwasinexistenceonJanuary1,1984;oranyroadbridgethatisrenderedobsoleteasaresultofaCorpsofEngineersfloodcontrolorchannelizationprojectandisnotrebuiltwithfundsfromtheCorpsofEngineers.NotsubjecttotheLocationofProjectrequirementin23U.S.C.133(c);and
o Actionsinaccordancewiththedefinitionandconditionsin23U.S.C.144(g)topreserveorreducetheimpactofaprojectonthehistoricintegrityofahistoricbridgeiftheloadcapacityandsafetyfeaturesofthehistoricbridgeareadequatetoservetheintendeduseforthelifeofthehistoricbridge.NotsubjecttotheLocationofProjectrequirementin23U.S.C.133(c).
Transportation Alternatives (TA-Metro)
TheFASTActeliminatestheMAP‐21TransportationAlternativesProgram(TAP)andreplacesitwithaset‐asideofSurfaceTransportationBlockGrant(STBG)programfundingfortransportationalternatives(TA).Theseset‐asidefundsincludeallprojectsandactivitiesthatwerepreviouslyeligibleunderTAP,encompassingavarietyofsmaller‐scaletransportationprojectssuchaspedestrianandbicyclefacilities,recreationaltrails,saferoutestoschoolprojects,communityimprovementssuchashistoricpreservationandvegetationmanagement,andenvironmentalmitigationrelatedtostormwaterandhabitatconnectivity.
Federal Lands Access Program (G200) [13]
ThepurposeoftheFederalLandsAccessProgram(AccessProgram)providesfundsforprojectsonFederalLandsaccesstransportationfacilitiesthatarelocatedonoradjacentto,orthatprovideaccesstoFederallands.
Equity Bonus (LZ20)
TheEquityBonusprovidesfundingtoStatesbasedonequityconsiderations.TheseincludeaminimumrateofreturnoncontributionstotheHighwayAccountoftheHighwayTrustFund.Generally,committedfundstakeontheeligibilityandmatchrequirementsoftheprogramtheyareaddedto.Forplanningpurposes,thestandardSTPfederalshareof89.73%withamatchrequirementof10.27%isusedforprogrammingpurposes.
Highway Safety Improvement Program (HSIP)
TheHSIPprogramisintendedtoachieveasignificantreductionintrafficfatalitiesandseriousinjuriesonallpublicroads,includingnon‐State‐ownedpublicroadsandroadsontriballands.TheHSIPrequiresadata‐driven,strategicapproachtoimprovinghighwaysafetyonallpublicroadsthatfocusesonperformance.Thefederalshareisnormally90%whichrequiresaparticipantmatchofatleast10%.
2018 Regional Transportation Plan Appendix H
59

Appendix H – DRAFT 2018 Regional Transportation Plan Financial Strategy Documentation Page 58 of 61
Metropolitan Planning Funds (PL)
TheFASTActcontinuestheMetropolitanPlanningprogram.TheProgramestablishesacooperative,continuous,andcomprehensiveframeworkformakingtransportationinvestmentdecisionsinmetropolitanareas.ProgramoversightisajointFederalHighwayAdministration/FederalTransitAdministrationresponsibility.ThefundsareprimarilyusedinsupportofMetro’sannualUnifiedPlanningWorkProgram(UPWP)
State Planning & Research (SPR):
TheStatePlanningandResearchProgramfundsStates'statewideplanningandresearchactivities.Thefundsareusedtoestablishacooperative,continuous,andcomprehensiveframeworkformakingtransportationinvestmentdecisionsandtocarryouttransportationresearchactivitiesthroughouttheState.
5.2 Federal Transit Agency Sourced Funding
Section 5307 Urbanized Area Formula Grants:
ThisprogramprovidesgrantstoUrbanizedAreas(UZA)forpublictransportationcapital,planning,jobaccessandreversecommuteprojects,aswellasoperatingexpensesincertaincircumstances.InthegreaterPortlandregionTriMetandSMARTaretheprimarydirectrecipientsof5307funds.Thefederalshareisnormally80%whichrequiresaparticipatingmatchof20%.Onenotableexceptionexiststothematchrequirement.Ifthe5307willbeusedforaJobAccessReverseCommute(JARC)project,therequiredmatchnowis50%againsta50%federalshare.
Section 5309 Fixed Guideway Capital Investment Grants (New Starts)
Providesgrantsfornewandexpandedrail,busrapidtransit,andferrysystemsthatreflectlocalprioritiestoimprovetransportationoptionsinkeycorridors.Thefederalshareisnormally80%whichrequiresaparticipatingmatchof20%.
RevenueScenarios:TheBasescenariousedtheFY2018amountfollowedbytheeleven‐yearhistoricalaveragewithnogrowth.TheConstrainedscenariousedFY2018amountwith1%annualgrowth.TheAdequatelyConstrainedusedFY2018amountwith2%annualgrowth.
Section 5310 Enhanced Mobility for Seniors and Individuals with Disabilities
Section5310fundsareintendedtoimprovemobilityforseniorsandindividualswithdisabilitiesbyremovingbarrierstotransportationserviceandexpandingtransportationmobilityoptions.Thisprogramsupportstransportationservicesplanned,designed,andcarriedouttomeetthespecialtransportationneedsofseniorsandindividualswithdisabilitiesinallareas–largeurbanized(over200,000),smallurbanized(50,000‐200,000),andrural(under50,000).EligibleprojectsincludebothtraditionalcapitalinvestmentandnontraditionalinvestmentbeyondtheAmericanswithDisabilitiesAct(ADA)complementaryparatransitservices.
2018 Regional Transportation Plan Appendix H
60
Appendix H – DRAFT 2018 Regional Transportation Plan Financial Strategy Documentation Page 59 of 61
Atleast55percentofprogramfundsmustbeusedoncapitalor“traditional”5310projects.Examplesinclude:
Busesandvans;wheelchairlifts,ramps,andsecurementdevices;transit‐relatedinformationtechnologysystemsincludingscheduling/routing/one‐callsystems;andmobilitymanagementprograms.
Acquisitionoftransportationservicesunderacontract,lease,orotherarrangement.Bothcapitalandoperatingcostsassociatedwithcontractedserviceareeligiblecapitalexpenses.User‐sidesubsidiesareconsideredoneformofeligiblearrangement.Fundsmayberequestedforcontractedservicescoveringatimeperiodofmorethanoneyear.Thecapitaleligibilityofacquisitionofservicesasauthorizedin49U.S.C.5310(b)(4)islimitedtotheSection5310program.
Theremaining45percentisforother“nontraditional”projects.UnderMAP‐21,theprogramwasmodifiedtoincludeprojectseligibleundertheformer5317NewFreedomprogram,describedas:CapitalandoperatingexpensesfornewpublictransportationservicesandalternativesbeyondthoserequiredbytheADA,designedtoassistindividualswithdisabilitiesandseniors.Examplesinclude:
Traveltraining;
Volunteerdriverprograms
Buildinganaccessiblepathtoabusstopincludingcurb‐cutssidewalks,accessiblepedestriansignalsorotheraccessiblefeatures
Improvingsignage,orway‐findingtechnology
Incrementalcostofprovidingsamedayserviceordoor‐to‐doorservice;purchasingvehiclestosupportnewaccessibletaxi,ridessharingand/orvanpooling,programs
Mobilitymanagement.
Section 5312 Research, Development, Demonstration, and Deployment Projects
Section5312supportsresearchactivitiesthatimprovethesafety,reliability,efficiency,andsustainabilityofpublictransportationbyinvestinginthedevelopment,testing,anddeploymentofinnovativetechnologies,materials,andprocesses;carryoutrelatedendeavors;andtosupportthedemonstrationanddeploymentoflow‐emissionandno‐emissionvehiclestopromotecleanenergyandimproveairquality.UnderMAP‐21,5314fundswhichareverysimilarwereconsolidatedintothe5312program.Thefederalshareisnormally80%ofthetotalprojectcostwhichrequiresa20%participatingmatch.
Section 5337 State of Good Repair Formula Grants
Section5337fundsarededicatedtorepairingandupgradingthenation’srailtransitsystemsalongwithhigh‐intensitymotorbussystemsthatusehigh‐occupancyvehiclelanes,including
2018 Regional Transportation Plan Appendix H
61

Appendix H – DRAFT 2018 Regional Transportation Plan Financial Strategy Documentation Page 60 of 61
busrapidtransit(BRT).Thefederalshareisnormally80%ofthetotalprojectcostrequiringaparticipatingmatchof20%.
2018 Regional Transportation Plan Appendix H
62
Appendix H – DRAFT 2018 Regional Transportation Plan Financial Strategy Documentation Page 61 of 61
REFERENCES
1. 23CFR§450.322,DevelopmentandContentoftheMetropolitanTransportationPlan.
2. 23CFR§450.322(f)(10)(i‐viii)(FinancialPlanoverviewandrequirements).
3. OregonEconomicandRevenueForecast,OfficeofEconomicAnalysis,OregonDepartment
ofAdministrativeServices,May2015.
4. “Crushed:DowEntersCorrectionTerritoryAfterBiggestSelloffinFourYears”,VictoriaCraig,FoxBusinessNews,August21,2015.
5. BureauofLaborStatistics:Oregon10‐YearHistory(2005‐2015)forLaborForceParticipation,Employment,Unemployment,andUnemploymentRate,http://www.bls.gov/eag/eag.or.htm
6. U.S.BureauofLaborStatistics,QuarterlyCensusofEmploymentandWages,2012‐2014Comparison,http://www.bls.gov/cew/apps/data_views/data_views.htm#tab=Tables
7. U.S.BureauofLaborStatistics,LocalAreaUnemploymentStatistics,Portland‐Vancouver‐HillsboroMSA,http://www.bls.gov/eag/eag.or_portland_msa.htm
8. UnitedStatesInflationRates,TradingEconomics,http://www.tradingeconomics.com/united‐states/inflation‐cpi/forecast
9. FederalHighwayTrustFundOverview,
http://www.fhwa.dot.gov/reports/fifahiwy/fifahi05.htm
10. “HighwayTrustFundBasics:APrimeronFederalSurfaceTransportationSpending”,MichaelSargent,TheBackgrounder,Number3014,TheHeritageFoundation,May11,2015.
11. TableR.2,GeneralFundForecastSummary,page30,OregonEconomicandRevenueForecast,VolumeXXXV,May,2015
12. FHWACMAQProjectDevelopmentProcessflowchart,FHWACMAQBrochure,
http://www.fhwa.dot.gov/environment/air_quality/cmaq/reference/brochure/brochure08.cfm
13. MAP‐21FactSheets,FederalLandsAccessProgram,http://www.fhwa.dot.gov/map21/factsheets/flap.cfm
14.
15. FinancialAssumptionsfortheDevelopmentofMetropolitanTransportationPlansSFY2012‐2040),OregonDepartmentofTransportation(ODOT),PlanningSection,Long‐RangePlanningUnit,February2011.
16.
2018 Regional Transportation Plan Appendix H
63

If you picnic at Blue Lake or take your kids to the Oregon Zoo, enjoy symphonies at the Schnitz or auto shows at the convention center, put out your trash or drive your car – we’ve already crossed paths.
So, hello. We’re Metro – nice to meet you.
In a metropolitan area as big as Portland, we can do a lot of things better together. Join us to help the region prepare for a happy, healthy future.
Metro Council PresidentTom Hughes
Metro CouncilorsShirley Craddick, District 1Betty Dominguez, District 2Craig Dirksen, District 3Kathryn Harrington, District 4Sam Chase, District 5Bob Stacey, District 6
AuditorBrian Evans
Stay in touch with news, stories and things to do.oregonmetro.gov/news
If you have a disability and need accommodations, call 503-220-2781, or call Metro’s TDD line at 503-797-1804. If you require a sign language interpreter, call at least 48 hours in advance.
For more information, visit oregonmetro.gov/rtp
Printed on recycled-content paper
June 25, 2018
600 NE Grand Ave. Portland, OR 97232-2736 503-797-1700503-797-1804 TDD503-797-1795 fax
What do you think?
Comment on the draft 2018 Regional Transportation Plan June 29 through Aug. 13, 2018.
Submit comments:• online at oregonmetro.gov/rtp • by mail to Metro Planning
600 NE Grand Ave. Portland, OR 97232
• by email to [email protected]
• by phone at 503-797-1750 or TDD 503-797-1804.
Explore the interactive project map and other information at oregonmetro.gov/2018projects.
2018 Regional Transportation Plan Appendix H
64