financial statements - mce clean energy€™s discussion and analysis 3 basic financial statements:...
TRANSCRIPT

FINANCIAL STATEMENTSYears Ended March 31, 2017 & 2016with Report of Independent Auditors
mceCleanEnergy.org

MARIN CLEAN ENERGY
YEARS ENDED MARCH 31, 2017 AND 2016
TABLE OF CONTENTS
Independent Auditors’ Report
1
Management’s Discussion and Analysis
3
Basic Financial Statements:
Statements of Net Position
10
Statements of Revenues, Expenses and Changes in Net Position
11
Statements of Cash Flows
12
Notes to the Basic Financial Statements
14

15000 Hopyard Road, Suite 335 Pleasanton, CA 94588 Tel: 925.734.6600 Fax: 925.734.6611 www.vtdcpa.com
F R E S N O L A G U N A H I L L S P A L O A L T O P L E A S A N T O N R A N C H O C U C A M O N G A R I V E R S I D E S A C R A M E N T O
INDEPENDENT AUDITORS’ REPORT
Board of DirectorsMarin Clean EnergySan Rafael, California
We have audited the accompanying financial statements of Marin Clean Energy (“MCE”), as of and for the years ended March 31, 2017 and 2016, and the related notes to the financial statements, which collectively comprise MCE’s basic financial statements as listed in the table of contents.
Management's Responsibility for the Financial Statements
Management is responsible for the preparation and fair presentation of these financial statements in accordance with accounting principles generally accepted in the United States of America; this includes the design, implementation, and maintenance of internal control relevant to the preparation and fairpresentation of financial statements that are free from material misstatement, whether due to fraud or error.
Auditors' Responsibility
Our responsibility is to express an opinion on these financial statements based on our audits. We conducted our audits in accordance with auditing standards generally accepted in the United States of America. Those standards require that we plan and perform the audit to obtain reasonable assurance about whether the financial statements are free from material misstatement.
An audit involves performing procedures to obtain audit evidence about the amounts and disclosures in the financial statements. The procedures selected depend on the auditor’s judgment, including the assessment of the risks of material misstatement of the financial statements, whether due to fraud or error. In making those risk assessments, the auditor considers internal control relevant to the entity’s preparation and fair presentation of the financial statements in order to design audit procedures that are appropriate in the circumstances, but not for the purpose of expressing an opinion on the effectiveness of the entity’s internal control. Accordingly, we express no such opinion. An audit also includes evaluating the appropriateness of accounting policies used and the reasonableness of significant accounting estimates made by management, as well as evaluating the overall presentation of the financial statements.
We believe that the audit evidence we have obtained is sufficient and appropriate to provide a basis for our audit opinion.

2
Opinion
In our opinion, the financial statements referred to above present fairly, in all material respects, the financial position of Marin Clean Energy, as of March 31, 2017 and 2016, and the changes in financial position and cash flows for the years then ended in accordance with accounting principles generally accepted in the United States of America.
Other Matters
Required Supplementary Information
Accounting principles generally accepted in the United States of America require that the management’s discussion and analysis, as listed in the table of contents, be presented to supplement the basic financial statements. Such information, although not a part of the basic financial statements, is required by the Governmental Accounting Standards Board, who considers it to be an essential part of financial reporting for placing the basic financial statements in an appropriate operational, economic, or historical context. We have applied certain limited procedures to the required supplementary information in accordance with auditing standards generally accepted in the United States of America, which consisted of inquiries of management about the methods of preparing the information and comparing the information for consistency with management’s responses to our inquiries, the basic financial statements, and other knowledge we obtained during our audit of the basic financial statements. We do not express an opinion or provide any assurance on the information because the limited procedures do not provide us with sufficient evidence to express an opinion or provide any assurance.
Pleasanton, CaliforniaJuly 12, 2017

MARIN CLEAN ENERGY
3
MANAGEMENT’S DISCUSSION AND ANALYSIS
The Management’s Discussion and Analysis provides an overview of Marin Clean Energy’s (MCE)
financial activities for the fiscal years ended March 31, 2017 and 2016. The information presented
here should be considered in conjunction with the audited financial statements.
Contents of this Report
This report is divided into the following sections:
• Management discussion and analysis, which provides an overview of operations.
• The Basic Financial Statements, which offer information on MCE’s financial results.
o The Statements of Net Position includes all of MCE’s assets, liabilities, and net
position using the accrual basis of accounting. The Statements of Net Position
provide information about the nature and amount of resources and obligations at a
specific point in time.
o The Statements of Revenues, Expenses, and Changes in Net Position report all of
MCE’s revenue and expenses for the years shown.
o The Statements of Cash Flows report the cash provided and used by operating
activities, as well as other sources and payments, such as debt financing.
o Notes to the Basic Financial Statements, which provide additional details and
information pertaining to the financial statements.
Nature of Operations
MCE is a California Joint Powers Authority founded in 2008 pursuant to the Joint Exercise of
Powers Act and is a public agency separate from its members. MCE provides electric service to
retail customers as a Community Choice Aggregation Program under the California Public Utilities
Code Section 366.2.
MCE’s mission is to address climate change by reducing energy related greenhouse gas emissions
through renewable energy supply and energy efficiency at stable and competitive rates for
customers while providing local economic and workforce benefits. MCE provides electric service
to retail customers and has the rights and powers to set rates and charges for electricity and services
it furnishes, incur indebtedness, and issue bonds or other obligations. MCE acquires electricity from
commercial suppliers and delivers it through existing physical infrastructure and equipment
managed by the California Independent System Operator and Pacific Gas and Electric Company.
MCE’s Energy Efficiency Program supports the development, coordination and implementation of
residential, commercial and multi-family energy efficiency programs in and around MCE’s service
area.

MARIN CLEAN ENERGY MANAGEMENT’S DISCUSSION AND ANALYSIS
(Continued)
4
The parties to MCE’s Joint Powers Agreement consist of local governments whose governing bodies elect to join MCE. Pursuant to the Public Utilities Code, when new parties join MCE, all electricity customers in its jurisdiction automatically become default customers of MCE for electric generation, provided that customers are given the option to “opt out”. MCE receives no financial support from the parties to its Joint Powers Agreement and relies exclusively on operating revenues to meet its financial commitments. MCE began to deliver electricity and energy efficiency programs in May 2010 and April 2013 respectively. From time to time new communities apply and are accepted to join MCE. The number of customers served following each new community enrollment phase since 2013 appears in the following table. MCE enrolled customers from new communities in July 2013, February 2015, May 2015 and September 2016. The September 2016 enrolment resulted from the cities of American Canyon, Calistoga, Lafayette, Napa, St. Helena, Walnut Creek and the Town of Yountville joining MCE and led to a 49% increase in MCE’s customer base.
July 2013 Feb 2015 May 2015 Sep 2016MCE Customer GroupsResidential 106,510 120,204 149,610 224,536Commercial & Industrial 13098 15,316 19,147 27,402Street Lighting & Traffic 748 1,014 1,219 1,903Agriculture & Pump 109 1,467 1,625 1,702 Total 120,465 138,001 171,601 255,543
Customer Account Additions 32,651 17,536 33,600 83,942% Increase in Customers Accounts 37% 15% 24% 49%
Enrolled Retail Service AccountsPhase-In Period (End of Month)

MARIN CLEAN ENERGY
MANAGEMENT’S DISCUSSION AND ANALYSIS
(Continued)
5
Financial and Operational Highlights
MCE’s recorded change in net position of $15.1 million in fiscal 2016/17 increasing the net
position to $44.7 million as of March 31, 2017. Net income was $16.3 million in fiscal 2015/16.
During fiscal 2016/17, MCE increased its cash and cash equivalents to $36.7 million. Working
capital (current assets minus current liabilities) increased to $41.1 million and the current ratio
(current assets divided by current liabilities) decreased from 2.81:1 to 2.73:1. For fiscal years
2016/17 and 2015/16, 78% and 79% of MCE’s total liabilities consisted of accrued electricity costs
which represent electricity delivered to MCE but not yet paid to the supplier. During fiscal 2015/16
MCE repaid notes payable to the bank ahead of schedule. MCE had no bank debt or letters of credit
outstanding as of March 31, 2017.
The following table is a summary of MCE’s assets, liabilities, and net position as of March 31:
2017 2016 2015
Current assets
Cash and cash equivalents 36,655,995$ 21,696,949$ 10,173,815$
Other current assets 28,112,638 19,424,154 16,027,326
Total current assets 64,768,633 41,121,103 26,201,141
Noncurrent assets
Capital assets 571,666 542,199 407,626
Other noncurrent assets 3,032,573 2,479,516 1,378,587
Total noncurrent assets 3,604,239 3,021,715 1,786,213
Total assets 68,372,872 44,142,818 27,987,354
Current liabilities
Accrued cost of electricity 18,477,359 11,500,898 8,808,354
Other current liabilities 5,235,796 3,110,850 3,898,645
Notes payable to bank - - 1,035,409
Total current liabilities 23,713,155 14,611,748 13,742,408
Noncurrent liabilities
Notes payable to bank - - 988,627
Total liabilities 23,713,155 14,611,748 14,731,035
Net position:
Net investment in capital assets 571,666 542,199 407,626
Restricted 2,212,221 1,659,164 598,200
Unrestricted 41,875,830 27,329,707 12,250,493
Total net position 44,659,717$ 29,531,070$ 13,256,319$
Working Capital: 41,055,478$ 26,509,355$ 12,458,733$
Current Ratio: 2.73 2.81 1.91
Total Liabilities / Net Position: 0.53 0.49 1.11
Liquidity Detail:
Cash and cash equivalents 36,655,995$ 21,696,949$ 10,173,815$
Unutilized portion of line of credit 20,000,000 7,800,000 -
Total Liquidity 56,655,995$ 29,496,949$ 10,173,815$

MARIN CLEAN ENERGY
MANAGEMENT’S DISCUSSION AND ANALYSIS
(Continued)
6
Consistent with its Reserve Policy, MCE is building its net position to support the working capital
requirements of the Agency, to provide a reserve to manage the risk of adverse economic or
regulatory events, and to improve its credit worthiness. A strong net position allows MCE to
provide consistent and reliable service to the community and to contract for energy and other
services at lower costs and on more favorable terms.
MCE’s results of operations are summarized as follows for the fiscal year ended March 31:
2017 2016 2015
Operating revenues 181,166,489$ 151,664,778$ 100,654,696$
Interest income 105,271 12,179 3,716
Total income 181,271,760 151,676,957 100,658,412
Operating expenses 166,110,598 135,257,348 96,835,644
Interest and related expenses 32,515 144,858 124,485
Total expenses 166,143,113 135,402,206 96,960,129
Change in net position 15,128,647 16,274,751 3,698,283
Beginning net position 29,531,070 13,256,319 9,558,036
Ending net position 44,659,717$ 29,531,070$ 13,256,319$
Electricity Sales and Costs
Electricity revenues increased by $30.2 million to $179.7 million in fiscal 2016/17 as a result of the
inclusion of new communities. Customer accounts grew from approximately 171,000 in March
2016 to 255,000 during the year. Increased customer load was offset by a 9% decrease in average
electricity rates which went into effect in September 2016. Cost of electricity increased by $28.2
million to $152.2 million as MCE acquired electricity to serve the new customers. Gross surplus,
defined as electricity sales less cost of electricity, increased to $27.4 million from $25.4 million in
the prior year. Gross margin, defined as gross surplus as a percent of electricity sales, decreased
from 17% in 2016 to 15.2% in 2017. Year over year changes in gross surplus and gross margin
were impacted by an increase in retail load, decreased average retail electricity rates and a lower
average cost of power.
MCE’s gross surplus and gross margin are summarized as follows for the fiscal year ended March
31:
2017 2016 2015
Electricity sales, net 179,689,662$ 149,486,696$ 98,840,861$
Cost of electricity 152,293,297 124,095,978 87,996,399
Gross surplus 27,396,365$ 25,390,718$ 10,844,462$
Gross margin: 15.2% 17.0% 11.0%

MARIN CLEAN ENERGY
MANAGEMENT’S DISCUSSION AND ANALYSIS
(Continued)
7
Operating Revenues and Operating Expenses less Cost of Electricity
Total operating revenue less the cost of electricity increased to $28.9 million in fiscal 2016/17, up
from $27.6 million in the prior year. This was driven by increased gross surplus and offset by
$211,000 decrease in rate-payer funding for the Public Purpose Programs. During the fiscal years
2014/15 and 2015/16 MCE recognized other revenues relating to payments required from energy
suppliers as a result of delays in energy deliveries, as well as a one-time consideration for a lease
termination. These accounted for the majority of other revenues during those years. For fiscal
2016/17, these events did not occur and the result is a significant drop in other revenues. Year-over-
year operating expenses, excluding cost of electricity, increased by 23.8% to $13.8 million
reflecting increased staffing, contractor, legal and general overhead costs. Operating expenses,
excluding cost of electricity, as a percent of operating revenue less cost of electricity rose from
40.5% in fiscal 2015/16 to 47.9% in fiscal 2016/17.
MCE’s gross surplus, operating income, and various ratios are summarized as follows:
2017 2016 2015
Gross surplus 27,396,365$ 25,390,718$ 10,844,462$
Public purpose program revenue 1,334,519 1,545,030 1,125,344
Other revenue 142,308 633,052 688,491
Total operating revenues less cost of electricity 28,873,192 27,568,800 12,658,297
Operating expenses, excluding cost of electricity 13,817,301 11,161,370 8,839,245
Operating income 15,055,891$ 16,407,430$ 3,819,052$
Operating expenses, excluding cost of electricity,
over total operating revenues less cost of electricity: 47.9% 40.5% 69.8%
% increase in Gross surplus: 7.9% 134.1% 27.3%
% increase in operating expenses less
cost of electricity: 23.8% 26.3% 15.4%
% increase in operating income: -8.2% 329.6% 110.8%

MARIN CLEAN ENERGY
MANAGEMENT’S DISCUSSION AND ANALYSIS
(Continued)
8
FINANCIAL SUMMARY
$-
$20
$40
$60
$80
$100
$120
$140
$160
$180
$200
2014 2015 2016 2017
$ M
ILL
ION
S
CHANG ES IN NET P OSITION: F ISCAL YEAR ENDED MARCH 3 1 :
Increase in Net Position Total Revenues Total Expenses
ASSETS, LIABILITIES, AND NET POSITION AS OF MARCH 31:
2017 2016 2017 2016
Cash and cash equivalents 36,655,995$ 21,696,949$ Accrued cost of electricity 18,477,359$ 11,500,898$
Accounts receivable, net 15,740,298 12,217,586 Grant advances 3,023,856 1,220,909
Accrued revenue 7,938,840 5,356,608 Other liabilities 2,211,940 1,889,941
Other assets 8,037,739 4,871,675 Net position 44,659,717 29,531,070
Total Assets 68,372,872$ 44,142,818$ Total liabilities & net position 68,372,872$ 44,142,818$
- 10 20 30 40
Cash and cash equivalents
Accounts receivable, net
Accrued revenue
Other assets
Millions
Assets
2017
2016
- 10 20 30 40 50
Accrued cost of
electricity
Grant advances
Other liabilities
Net position
Millions
Liabilities & Equity
2017
2016
MARIN CLEAN ENERGY
MANAGEMENT’S DISCUSSION AND ANALYSIS
(Continued)
9
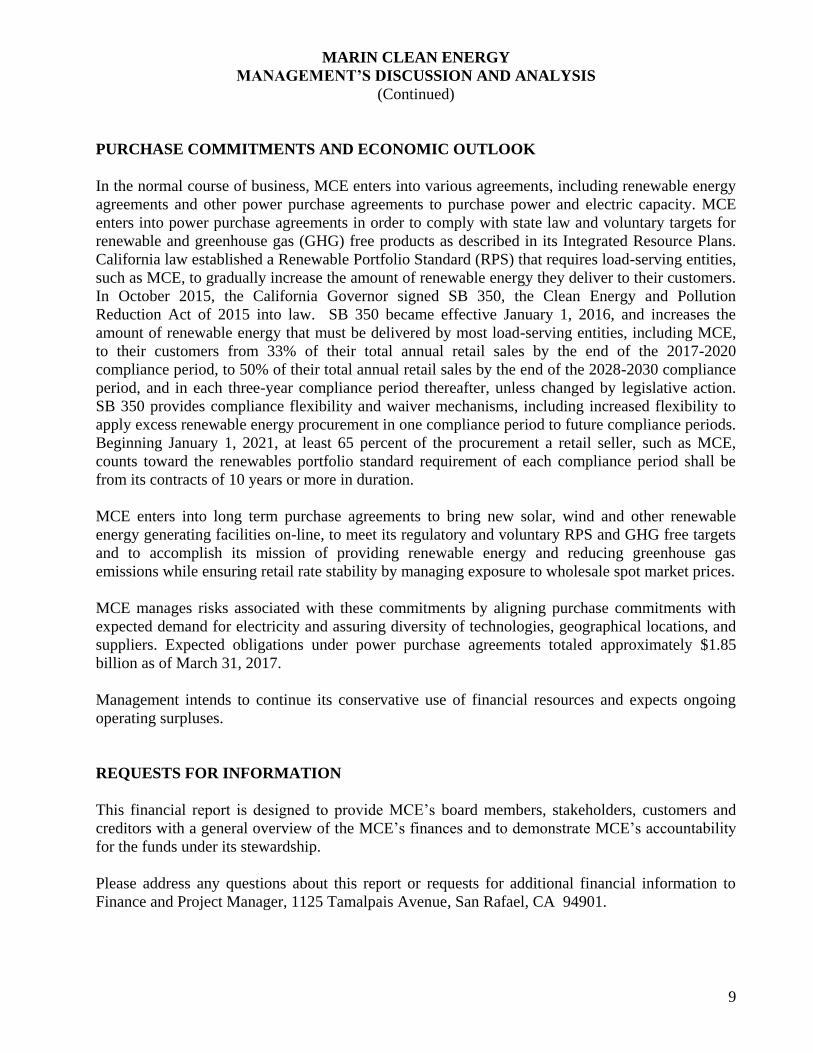
PURCHASE COMMITMENTS AND ECONOMIC OUTLOOK
In the normal course of business, MCE enters into various agreements, including renewable energy
agreements and other power purchase agreements to purchase power and electric capacity. MCE
enters into power purchase agreements in order to comply with state law and voluntary targets for
renewable and greenhouse gas (GHG) free products as described in its Integrated Resource Plans.
California law established a Renewable Portfolio Standard (RPS) that requires load-serving entities,
such as MCE, to gradually increase the amount of renewable energy they deliver to their customers.
In October 2015, the California Governor signed SB 350, the Clean Energy and Pollution
Reduction Act of 2015 into law. SB 350 became effective January 1, 2016, and increases the
amount of renewable energy that must be delivered by most load-serving entities, including MCE,
to their customers from 33% of their total annual retail sales by the end of the 2017-2020
compliance period, to 50% of their total annual retail sales by the end of the 2028-2030 compliance
period, and in each three-year compliance period thereafter, unless changed by legislative action.
SB 350 provides compliance flexibility and waiver mechanisms, including increased flexibility to
apply excess renewable energy procurement in one compliance period to future compliance periods.
Beginning January 1, 2021, at least 65 percent of the procurement a retail seller, such as MCE,
counts toward the renewables portfolio standard requirement of each compliance period shall be
from its contracts of 10 years or more in duration.
MCE enters into long term purchase agreements to bring new solar, wind and other renewable
energy generating facilities on-line, to meet its regulatory and voluntary RPS and GHG free targets
and to accomplish its mission of providing renewable energy and reducing greenhouse gas
emissions while ensuring retail rate stability by managing exposure to wholesale spot market prices.
MCE manages risks associated with these commitments by aligning purchase commitments with
expected demand for electricity and assuring diversity of technologies, geographical locations, and
suppliers. Expected obligations under power purchase agreements totaled approximately $1.85
billion as of March 31, 2017.
Management intends to continue its conservative use of financial resources and expects ongoing
operating surpluses.
REQUESTS FOR INFORMATION
This financial report is designed to provide MCE’s board members, stakeholders, customers and
creditors with a general overview of the MCE’s finances and to demonstrate MCE’s accountability
for the funds under its stewardship.
Please address any questions about this report or requests for additional financial information to
Finance and Project Manager, 1125 Tamalpais Avenue, San Rafael, CA 94901.

BASIC FINANCIAL STATEMENTS

MARIN CLEAN ENERGY
10
The accompanying notes are an integral part of these financial statements
STATEMENTS OF NET POSITION
MARCH 31, 2017 AND 2016
2017 2016
ASSETS
Current assets
Cash and cash equivalents 36,655,995$ 21,696,949$
Accounts receivable, net of allowance 15,740,298 12,217,586
Energy settlements receivable 1,694,749 -
Other receivables 246,763 525,658
Accrued revenue 7,938,840 5,356,608
Prepaid expenses 940,342 1,261,373
Other current assets and deposits 1,551,646 62,929
Total current assets 64,768,633 41,121,103
Noncurrent assets
Restricted cash 2,759,721 2,206,664 Capital assets, net of depreciation 571,666 542,199
Other noncurrent assets and deposits 272,852 272,852
Total noncurrent assets 3,604,239 3,021,715
Total assets 68,372,872 44,142,818
LIABILITIES
Current liabilities
Accounts payable 600,800 657,336
Accrued cost of electricity 18,477,359 11,500,898
Other accrued liabilities 546,048 305,054
Security deposits - energy suppliers 105,000 -
User taxes and energy surcharges due to other governments 960,092 927,551
Advances from public purpose programs 3,023,856 1,220,909
Total current liabilities 23,713,155 14,611,748
NET POSITION
Net position
Net investment in capital assets 571,666 542,199
Restricted for line of credit collateral 2,212,221 1,659,164
Unrestricted 41,875,830 27,329,707
Total net position 44,659,717$ 29,531,070$

MARIN CLEAN ENERGY
11
The accompanying notes are an integral part of these financial statements
STATEMENTS OF REVENUES, EXPENSES
AND CHANGES IN NET POSITION
FISCAL YEARS ENDED MARCH 31, 2017 AND 2016
2017 2016
OPERATING REVENUES
Electricity sales, net 179,689,662$ 149,486,696$
Public purpose program revenue 1,334,519 1,545,030
Other revenue 142,308 633,052
Total operating revenues 181,166,489 151,664,778
OPERATING EXPENSES
Cost of electricity 152,293,297 124,095,978
Contract services 7,764,638 6,584,384
Staff compensation 4,858,587 3,405,416
General and administration 1,101,430 1,094,963
Depreciation 92,646 76,607
Total operating expenses 166,110,598 135,257,348
Operating income 15,055,891 16,407,430
NONOPERATING REVENUES (EXPENSES)
Interest income 105,271 12,179
Interest and related expenses (32,515) (144,858)
Total nonoperating revenues (expenses) 72,756 (132,679)
CHANGE IN NET POSITION 15,128,647 16,274,751
Net position at beginning of period 29,531,070 13,256,319
Net position at end of period 44,659,717$ 29,531,070$

MARIN CLEAN ENERGY
12
The accompanying notes are an integral part of these financial statements
STATEMENTS OF CASH FLOWS
FISCAL YEARS ENDED MARCH 31, 2017 AND 2016
2017 2016
CASH FLOWS FROM OPERATING ACTIVITIES
Receipts from electricity sales 173,584,288$ 146,949,614$
Public purpose program receipts 3,370,343 291,375
Tax and surcharge receipts from customers 4,209,577 4,081,848
Payments received from other revenue sources 303,770 926,607
Payments received from security deposits with energy suppliers 525,000 -
Payments to purchase electricity (147,416,447) (122,324,217)
Payments for contract services (7,660,258) (6,560,471)
Payments for staff compensation (4,742,015) (3,312,945)
Payments for general and administration (1,117,386) (1,080,328)
Tax and surcharge payments to other governments (4,177,036) (3,765,527)
Return of security deposits to energy suppliers (420,000) -
Other cash payments - (41,598)
Net cash provided (used) by operating activities 16,459,836 15,164,358
CASH FLOWS FROM NON-CAPITAL
FINANCING ACTIVITIES
Return of financing reserve - 598,200
Transfer to restricted cash (553,057) (1,659,164)
Principal payments of notes payable to bank - (2,024,036)
Interest and related expenses (32,515) (144,858)
Net cash provided (used) by non-capital
financing activities (585,572) (3,229,858)
CASH FLOWS FROM CAPITAL AND RELATED
FINANCING ACTIVITIES
Acquisition of nondepreciable assets (901,806) -
Acquisition of capital assets (119,824) (421,261)
Net cash provided (used) by capital and related
financing activities (1,021,630) (421,261)
CASH FLOWS FROM INVESTING ACTIVITIES
Interest income 106,412 9,895
Net change in cash and cash equivalents 14,959,046 11,523,134
Cash and cash equivalents at beginning of year 21,696,949 10,173,815
Cash and cash equivalents at end of period 36,655,995$ 21,696,949$

MARIN CLEAN ENERGY
13
The accompanying notes are an integral part of these financial statements
STATEMENTS OF CASH FLOWS
(CONTINUED)
FISCAL YEARS ENDED MARCH 31, 2017 AND 2016
2017 2016
Operating income 15,055,891$ 16,407,430$
Adjustments to reconcile operating income to net
cash provided (used) by operating activities
Depreciation expense 92,646 76,607
Revenue reduced for uncollectible accounts 1,112,000 740,000
(Increase) decrease in net accounts receivable (4,634,712) (2,428,706)
(Increase) decrease in energy settlements receivable (1,694,749) -
(Increase) decrease in other receivables 377,754 59,811
(Increase) decrease in accrued revenue (2,582,232) (854,376)
(Increase) decrease in prepaid expenses 321,032 (893,221)
(Increase) decrease in other assets and deposits (685,571) (54,327)
Increase (decrease) in accounts payable (60,165) (15,240)
Increase (decrease) in accrued cost of electricity 6,976,461 2,692,544
Increase (decrease) in other accrued liabilities 240,994 105,697
Increase (decrease) in security deposits from energy suppliers 105,000 -
Increase (decrease) in user taxes due to other governments 32,541 316,321
Increase (decrease) in advances from public purpose programs 1,802,946 (988,182)
Net cash provided (used) by operating activities 16,459,836$ 15,164,358$
RECONCILIATION OF OPERATING INCOME TO NET
CASH PROVIDED (USED) BY OPERATING ACTIVITIES

MARIN CLEAN ENERGY
NOTES TO THE FINANCIAL STATEMENTS
YEARS ENDED MARCH 31, 2017 AND 2016
14
1. SUMMARY OF SIGNIFICANT ACCOUNTING POLICIES
REPORTING ENTITY
Marin Clean Energy (MCE) is a California joint powers authority created on December 19,
2008. As of March 31, 2017 parties to its Joint Powers Agreement consist of the following
local governments: the Counties of Marin and Napa, the cities of American Canyon,
Belvedere, Benicia, Calistoga, El Cerrito, Lafayette, Larkspur, Mill Valley, Napa, Novato,
Richmond, San Pablo, San Rafael, Sausalito, St. Helena, and Walnut Creek and the towns of
Corte Madera, Fairfax, Ross, San Anselmo, Tiburon, and Yountville (collectively, “the
Parties”). MCE is separate from and derives no financial support from its members. MCE
is governed by a Board of Directors whose membership is composed of elected officials
representing each of the parties.
MCE’s mission is to address climate change by reducing energy related greenhouse gas
emissions through renewable energy supply and energy efficiency at stable and competitive
rates for customers while providing local economic and workforce benefits. MCE provides
electric service to retail customers as a Community Choice Aggregation Program under the
California Public Utilities Code Section 366.2.
MCE began the delivery of electricity and energy efficiency programs in May 2010 and
April, 2013 respectively. Electricity is acquired from commercial suppliers and delivered
through existing physical infrastructure and equipment managed by the California
Independent System Operator and Pacific Gas and Electric Company. The Energy
Efficiency Program supports the development, coordination and implementation of energy
efficiency programs in and around MCE’s service area. The Energy Efficiency Program is
supported by rate-payer funds regulated by the California Public Utilities Commission.
BASIS OF ACCOUNTING
MCE’s financial statements are prepared in accordance with generally accepted accounting
principles (GAAP). The Governmental Accounting Standards Board (GASB) is responsible
for establishing GAAP for state and local governments through its pronouncements.

MARIN CLEAN ENERGY
NOTES TO THE FINANCIAL STATEMENTS
YEARS ENDED MARCH 31, 2017 AND 2016
15
1. SUMMARY OF SIGNIFICANT ACCOUNTING POLICIES (continued)
MCE’s operations are accounted for as a governmental enterprise fund, and are reported
using the economic resources measurement focus and the accrual basis of accounting –
similar to business enterprises. Accordingly, revenues are recognized when they are earned
and expenses are recognized at the time liabilities are incurred. Enterprise fund type
operating statements present increases (revenues) and decreases (expenses) in total net
position. Reported net position is segregated into three categories – net investment in capital
assets, restricted, and unrestricted.
When both restricted and unrestricted resources are available for use, it is the MCE’s policy
to use restricted resources first, then unrestricted resources as they are needed.
CASH AND CASH EQUIVALENTS
For purpose of the Statements of Cash Flows, MCE defines cash and cash equivalents to
include cash on hand, demand deposits, and short-term investments. Amounts restricted for
debt service and collateral for energy efficiency loan program are not considered cash and
cash equivalents. These restricted balances are presented separately in the Statement of Net
Position.
CAPITAL ASSETS AND DEPRECIATION
MCE’s policy is to capitalize furniture and equipment valued over $500 that is expected to
be in service for over one year. Depreciation is computed according to the straight-line
method over estimated useful lives of three years for electronic equipment and seven years
for furniture. Leasehold improvements are depreciated over 10 years.
OPERATING AND NON-OPERATING REVENUE
Operating revenues consists of revenue from the sale of electricity to customers and revenue
related to the Energy Efficiency Program. Other revenues primarily consist of payments
from energy suppliers that result from delays in energy deliveries. Interest income is
considered “non-operating revenue”.
REVENUE RECOGNITION
MCE recognizes revenue on the accrual basis. This includes invoices issued to customers
during the reporting period and electricity estimated to have been delivered but not yet
billed. Management estimates that a portion of the billed amounts will not be collected.
Accordingly, an allowance has been recorded.

MARIN CLEAN ENERGY
NOTES TO THE FINANCIAL STATEMENTS
YEARS ENDED MARCH 31, 2017 AND 2016
16
1. SUMMARY OF SIGNIFICANT ACCOUNTING POLICIES (continued)
ELECTRICAL POWER PURCHASED
During the normal course of business MCE purchases electrical power from numerous
suppliers. Electricity costs include the cost of energy and ancillary services arising from
bilateral contracts with energy suppliers as well as generation credits, and load and other
charges arising from MCE’s participation in the California Independent System Operator’s
centralized market. The cost of electricity and ancillary services are recognized as “Cost of
Electricity” in the Statements of Revenues, Expenses and Changes in Net Position.
To comply with the State of California’s Renewable Portfolio Standards (RPS) and self-
imposed benchmarks, MCE acquires RPS eligible renewable energy evidenced by
Renewable Energy Certificates (Certificates) recognized by the Western Renewable Energy
Generation Information System (WREGIS). MCE obtains Certificates with the intent to
retire them, and does not sell or build surpluses of Certificates. An expense is recognized at
the point that the cost of the RPS eligible energy is due and payable to the supplier. MCE is
in compliance with external mandates and self-imposed benchmarks.
STAFFING COSTS
MCE pays employees semi-monthly and fully pays its obligation for health benefits and
contributions to its defined contribution retirement plan each month. MCE is not obligated
to provide post-employment healthcare or other fringe benefits and, accordingly, no related
liability is recorded in these financial statements.
INCOME TAXES
MCE is a joint powers authority under the provision of the California Government Code,
and is not subject to federal or state income or franchise taxes.
ESTIMATES
The preparation of financial statements in conformity with accounting principles generally
accepted in the United States of America requires management to make estimates and
assumptions that affect certain reported amounts and disclosures. Accordingly, actual
results could differ from those estimates.
RECLASSIFICATIONS
Certain amounts in the prior-year financial statements have been reclassified for
comparative purposes to conform to the presentation of the current-year financial
statements.

MARIN CLEAN ENERGY
NOTES TO THE FINANCIAL STATEMENTS
YEARS ENDED MARCH 31, 2017 AND 2016
17
2. CASH AND CASH EQUIVALENTS
MCE maintains its cash in both interest-bearing and non-interest-bearing demand and term
deposit accounts at River City Bank of Sacramento, California. MCE’s deposits with River
City Bank are subject to California Government Code Section 16521 which requires that
River City Bank collateralize public funds in excess of the FDIC limit of $250,000 by
110%. MCE monitors its risk exposure to River City Bank on an ongoing basis. MCE’s
Investment Policy permits the investment of funds in depository accounts, certificates of
deposit and the Local Agency Investment Fund (LAIF) program operated by the California
State Treasury.
3. ACCOUNTS RECEIVABLE
Accounts receivable balances were as follows:
2017 2016
Accounts receivable from customers 19,952,298$ 15,317,586$
Allowance for uncollectible accounts (4,212,000) (3,100,000)
Net accounts receivable 15,740,298$ 12,217,586$
The majority of account collections occur within the first few months following customer
invoicing. MCE estimates that a portion of the billed accounts will not be collected. MCE
continues collection efforts on accounts in excess of de minimis balances regardless of the
age of the account. Although collection success generally decreases with the age of the
receivable, MCE continues to have success collecting older accounts. The allowance for
uncollectible accounts at the end of a period includes amounts billed during the current and
prior fiscal years.
4. ENERGY SETTLEMENTS RECEIVABLE
During fiscal 2016/17 MCE entered into a contract to receive generation scheduling and
other services from a registered, California Independent System Operator (CAISO)
scheduling coordinator. Generation scheduling had previously been performed under a full
services contract with an energy supplier and accrued settlements receivable were netted
from accrued liabilities as of March 31, 2016 in accordance with the contract terms. Energy
settlements due from the scheduling coordinator were $1.7 million as of March 31, 2017.

MARIN CLEAN ENERGY
NOTES TO THE FINANCIAL STATEMENTS
YEARS ENDED MARCH 31, 2017 AND 2016
18
5. OTHER CURRENT ASSETS AND DEPOSITS
During fiscal 2016/17 MCE acquired assets to support the development of a local renewable
energy project located in Richmond, California (MCE Solar One). These assets were
reported in other current assets and deposits in the Statements of Net Position and in the
Statements of Cash Flows as an acquisition of nondepreciable capital assets. These assets
were sold to a developer in May 2017 who will build, own and operate MCE Solar One and
sell power to MCE once the project achieves commercial operation. Also included in this
account are security deposits paid by MCE pursuant to agreements that expire in less than
twelve months.
6. CAPITAL ASSETS
Changes in depreciable capital assets were as follows:
Furniture & Leasehold Accumulated
Equipment Improvements Depreciation Net
Balances at March 31, 2015 152,252$ 331,392$ (76,018)$ 407,626$
Additions 85,591 125,589 (76,607) 134,573
Balances at March 31, 2016 237,843 456,981 (152,625) 542,199
Additions 96,983 25,130 (92,646) 29,467
Balances at March 31, 2017 334,826$ 482,111$ (245,271)$ 571,666$
7. PUBLIC PURPOSE PROGRAMS
MCE administers ratepayer-funded energy efficiency programs regulated by the Public
Utilities Commission of the State of California (CPUC). Funds received are not recognized
as revenue until they are expended for designated purposes. Total funding received for this
Program during the fiscal year 2017 was $2,722,000, and $1,066,000 was spent and earned.
In fiscal year 2016, funding received was $172,000 and $1,213,000 was spent and earned.
The Energy Efficiency Program receives additional funding under the Gas Public Purpose
Program that is not received in advance. Revenue of $268,000 and $332,000 was recognized
under the Gas Public Purpose Program in fiscal years 2017 and 2016, respectively.

MARIN CLEAN ENERGY
NOTES TO THE FINANCIAL STATEMENTS
YEARS ENDED MARCH 31, 2017 AND 2016
19
8. DEBT
NOTES PAYABLE
During the fiscal year 2015/16, MCE retired bank notes of $2,024,036 ahead of schedule.
MCE incurred no debt during fiscal 2016/17 and had no debt as of March 31, 2017.
LINE OF CREDIT AND LETTERS OF CREDIT
MCE entered into a non-revolving, $15,000,000 credit agreement with River City Bank
(RCB) in August 2015 that may be used for short term borrowing and to issue standby
Letters of Credit used for performance security. The credit agreement was amended in May
2016 to a revolving credit agreement and the borrowing limit was increased to $20,000,000.
RCB requires collateral for the line of credit of $2.2 million which is reported as restricted
cash and restricted net position. The agreement expires on August 30, 2017. Management is
currently negotiating an amendment to the credit agreement that would extend the term of
the agreement and include other changes.
During fiscal 2015/16, MCE arranged to post performance security in the form of standby
Letters of Credit totaling $7,300,000 to two suppliers. As of March 31, 2016, MCE had not
drawn any cash on the line of credit. During fiscal 2016/17 suppliers returned all issued and
outstanding standby Letters of Credit to MCE. MCE arranged to issue no new Letters of
Credit in fiscal 2016/17 and has no standby Letters of Credit or amounts outstanding under
its credit agreement as of March 31, 2017.
Fees related to opening and renewal of the line of credit and posting the letters of credit are
reported as interest and related expenses.
9. DEFINED CONTRIBUTION RETIREMENT PLAN
The Marin Clean Energy Plan (Plan) is a defined contribution retirement plan established by
MCE to provide benefits at retirement to its employees. The Plan is administered by
Nationwide Retirement Solutions. As of March 31, 2017, there were 43 plan members.
MCE is required to contribute 10% of annual covered payroll to the Plan and contributed
$394,000 and $257,000 during the years ended March 31, 2017 and 2016, respectively. The
Plan includes vesting provisions intended to encourage employee retention. Plan provisions
and contribution requirements are established and may be amended by the Board of
Directors.

MARIN CLEAN ENERGY
NOTES TO THE FINANCIAL STATEMENTS
YEARS ENDED MARCH 31, 2017 AND 2016
20
10. RISK MANAGEMENT
MCE is exposed to various risks of loss related to torts; theft of, damage to, and destruction
of assets; and errors and omissions. During the year, MCE purchased insurance policies
from investment grade commercial carriers to mitigate risks that include those associated
with earthquakes, theft, general liability, errors and omissions, and property damage.
MCE maintains risk management guidelines, procedures and systems that help mitigate
credit, liquidity, market, operating, regulatory and other risks that arise from participation in
the California energy market.
Credit guidelines include a preference for transacting with investment grade counterparties,
evaluating counterparties’ financial condition and assigning credit limits as applicable.
These credit limits are established based on risk and return considerations under terms
customarily available in the industry. In addition, MCE enters into netting arrangements
whenever possible and where appropriate obtains collateral and other performance
assurances from counter parties.
11. PURCHASE COMMITMENTS
POWER AND ELECTRIC CAPACITY
In the ordinary course of business, MCE enters into various power purchase agreements in
order to acquire renewable and other energy and electric capacity. The price and volume of
purchased power may be fixed or variable. Variable pricing is generally based on the market
price of either natural gas or electricity at the date of delivery. Variable volume is generally
associated with contracts to purchase energy from as-available resources such as solar, wind
and hydro-electric facilities.
MCE enters into power purchase agreements in order to comply with state law and
voluntary targets for renewable and greenhouse gas (GHG) free products and to ensure
stable and competitive electric rates for its customers.
MARIN CLEAN ENERGY
NOTES TO THE FINANCIAL STATEMENTS
YEARS ENDED MARCH 31, 2017 AND 2016
21
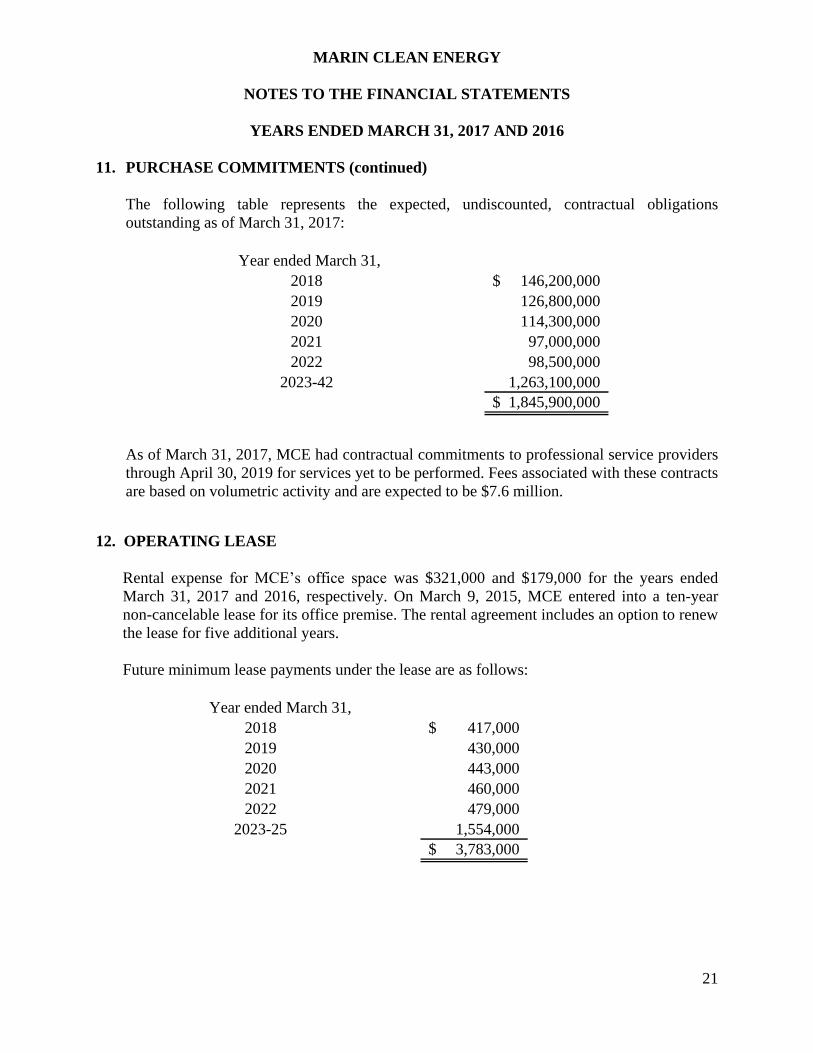
11. PURCHASE COMMITMENTS (continued)
The following table represents the expected, undiscounted, contractual obligations
outstanding as of March 31, 2017:
Year ended March 31,
2018 146,200,000$
2019 126,800,000
2020 114,300,000
2021 97,000,000
2022 98,500,000
2023-42 1,263,100,000
1,845,900,000$
As of March 31, 2017, MCE had contractual commitments to professional service providers
through April 30, 2019 for services yet to be performed. Fees associated with these contracts
are based on volumetric activity and are expected to be $7.6 million.
12. OPERATING LEASE
Rental expense for MCE’s office space was $321,000 and $179,000 for the years ended
March 31, 2017 and 2016, respectively. On March 9, 2015, MCE entered into a ten-year
non-cancelable lease for its office premise. The rental agreement includes an option to renew
the lease for five additional years.
Future minimum lease payments under the lease are as follows:
Year ended March 31,
2018 417,000$
2019 430,000
2020 443,000
2021 460,000
2022 479,000
2023-25 1,554,000
3,783,000$