financial statements - kamux.com · shares and share ownership 4.1 capital management and net...
TRANSCRIPT
Kamux is a retail chain specialising in used car sales
FINANCIAL INFORMATION
FINANCIAL STATEMENTS
1 2KAMUX CORPORATION ANNUAL REPORT 2017

REPORT BY THE BOARD OF DIRECTORS 2017 6Shares and share ownership 12
Key performance measures 15
Calculation of key figures and alternative performance measures 17
PRIMARY STATEMENTS OF THE CONSOLIDATED FINANCIAL STATEMENTS 19Consolidated statements of comprehensive income 20
Consolidated balance sheet 21
Consolidated statements of changes in equity 22
Consolidated statements of cash flows 23
1 BASIS OF PREPARATION AND INFORMATION ON KAMUX 241.1 Basis of preparation 25
1.2 Short presentation of Kamux 26
2 KEY PERFORMANCE METRICS OF KAMUX GROUP 272.1 Results by segment 28
2.2 Revenue 30
2.3 Repair Costs 32
2.4 Expenses 33
2.5 Income taxes 35
2.6 Earnings per share 36
3 NET WORKING CAPITAL 373.1 Inventory 38
3.2 Trade and other receivables 39
3.3 Trade and other payables 40
CONTENTS
4 NET DEBT AND CONTINGENCIES 414.1 Capital management and net debt 42
4.2 Finance costs 45
4.3 Lease obligations and commitments 46
5 OTHER NOTES 475.1 Group structure and consolidation 48
5.2 Intangible assets and property, plant and equipment 49
5.3 Related party transactions 51
5.4 Share capital and reserves 54
5.5 Deferred taxes 55
5.6 Events after the reporting date 56
5.7 New and forthcoming IFRS standards 57
PARENT COMPANY FINANCIAL STATEMENTS 59Parent company income statement (FAS) 60
Parent company balance sheet (FAS) 61
Parent company cash flow statement (FAS) 63
Accounting principals of the parent company financial statements 64
Notes to the parent company’s financial statements 65
SIGNATURES FOR THE REPORT BY THE BOARD OF 70
DIRECTORS AND THE FINANCIAL STATEMENTS
AUDITOR’S REPORT 71
FINANCIAL STATEMENTS
The Financial Statements are published in Finnish and English.In case of doubt, the Finnish version is authoritative
3 KAMUX CORPORATION ANNUAL REPORT 2017 4
REPORT BY THE BOARD OF DIRECTORS AND CONSOLIDATED FINANCIAL STATEMENTS AS OF DECEMBER 31, 2017
REPORT BY THE BOARD OF DIRECTORS 2017
Kamux’s (Company ID 2442327-8) business is based on an effective integrated business model in the sale of used cars. Kamux’s goal is to continuously develop its operations and services to better meet customers needs. In the presentation of consolidated financial statements, Kamux also focuses on information relevant to the users of financial statements and strives to report Kamux’s financial performance in 2017 and 2016 clearly and concisely. In addition to primary statements the consolidated financial statements include five sections: Basis of Preparation and Information on Kamux, Key Perfor-mance Metrics of Kamux Group, Net Working Capital, Net Debt and Contingencies and Other Notes. Each part also ex-plains related significant accounting principles. This manner of presenting information aims at providing the reader with a clear understanding of the Group’s financial position and on how the applied accounting policies impact the figures pre-sented in the financial statements.
KAMUX’S OPERATING ENVIRONMENTKamux is a retail chain specialising in used car sales. Kamux had 41 car showrooms in Finland, 10 in Swe-den and 2 in Germany as of December 31, 2017.
The development and growth of the used car market is most affected by general economic con-ditions, the development of the population and urbanization. Consumer behavior and consumers’ willingness to own a car have changed noticeably in recent years. However, the impacts of the shar-ing economy and new forms of mobility on the used car market are expected to be small. Political debate on possible emission limitations and bans, car or fuel taxes and increased safety requirements is ongoing in Europe. These factors, if realized, can have an impact on the development of the used car market.
In 2017 the market situation in Kamux’s oper-ating countries varied. In Finland the year was a challenging one for car sales. In the beginning of the year, the car taxation issue, which was part of the road transport report published by the Ministry of Transport and Communications, and the public fuel debate caused temporary uncertainty among consumers. This lead to increasing inventories of used cars, impacting pricing and the competitive situation in the marketplace. On the other hand, economic recovery has increased consumer con-fidence, especially in the latter half of the year, and the overall used car market grew slightly in Finland in 2017.
The market for used cars in Sweden decreased slightly in 2017. In Sweden, the structure of the market differs from Finland in that the consumer to consumer share of the total used car market is higher. There is no comparable nationwide retail chain specializing in the sale of used cars. Kamux’s market share in Sweden is only about half a per cent, and the company therefore has abundant growth opportunities.
During the year, the German media discussed diesel emissions and restricting the use of older emission class diesel cars in the centers of certain major cities, in which the air quality is a concern. In Germany, the proportion of diesel cars in 2017 was over 30% of all passenger cars, or about 15 million cars. The number of vehicles powered by other
power sources than gasoline or diesel fuel was still below 2% in 2017. The German used car market de-clined slightly in 2017.
GROUP REVENUE AND PROFIT IN 2017Revenue increased by 12.4% compared to the pre-vious year and amounted to EUR 454.9 million (404.8). The increase in revenue was driven main-ly by the opening of new showrooms. The growth was fully organic. The number of cars sold by Kamux in Finland, Sweden and Germany amount-ed to 40,957 (36,290). In connection with the sale of used cars Kamux offers its customers commis-sion-based services such as insurance and financ-ing services, and a liability extension, Kamux Plus, that supplements the seller’s statutory liability. Kamux’s integrated services revenue was EUR 22.8 million (19.3).
The adjusted operating profit increased by 3.4% and amounted to EUR 18.6 million (18.0), or 4.1% (4.4) of revenue. The adjustment items to the operating profit totaled EUR 2.4 million (2.3) for 2017. The adjustment items include EUR 1.2 million of expenses related to Kamux’s listing, EUR 0.7 million related to strategic planning and implemen-tation of the strategy, and EUR 0.4 million related to geographical expansion. In the comparison pe-riod, the adjustments also included a cash-settled share-based payment of EUR 0.3 million related to redemption of treasury shares.
Kamux’s operating profit increased by 3.6% as compared to the previous year, amounting to EUR 16.2 million (15.7).
Net financial items were EUR -0.8 million (-1.0).The result before taxes amounted to EUR 15.5
million (14.6). Taxes amounted to EUR 3.8 million (3.6). The effective tax rate for the financial year is 24% (25%). Profit for the period amounted to EUR 11.7 million (11.0).
The basic earnings per share amounted to EUR 0.30 (0.29).
SEGMENTSFinland 2017Revenue increased by 8.5% compared to the previ-ous year, amounting to EUR 372.4 million (343.2). The number of cars sold during 2017 increased
5 KAMUX CORPORATION ANNUAL REPORT 2017 6
REPORT BY THE BOARD OF DIRECTORS

by 2,973, or 9.5% compared to the previous year, amounting to 34,348 (31,375). The growth was mainly due to the sales of the new showrooms.
Integrated services revenue increased to EUR 20.6 million (17.7) during 2017, or 5.5% of revenue (5.2). Operating profit increased by 4.0% com-pared to the previous year, amounting to EUR 23.1 million (22.2), or 6.2% of the revenue (6.5).
During 2017, Kamux opened 5 new showrooms in Finland: Turku in February, Espoo Koskelo and Iisalmi in May, Espoo Olarinluoma in August and Kaarina in November. We achieved a significant milestone in November by establishing a Kamux Green shop-in-shop in Helsinki’s Konala showroom. The shop-in-shop has strong expertise in the sales of hybrid, electric, natural gas and ethanol cars. In addition, Kamux expanded its operations in Lahti utility vehicle showroom in July, in Vantaa Airport showroom in August and in Kuopio in October with the opening of a new utility vehicle point to com-plement the Kuopio showroom.
Sweden 2017Revenue increased by 20.2% compared to the pre-vious year, amounting to EUR 73.2 million (60.9). The number of cars sold during 2017 increased by 686 or 16.7%, and amounted to 4,784 (4,098). The growth was mainly due to the opening of a new showroom in July 2016 and the actions taken to further develop the operations in Sweden.
Integrated services revenue increased to EUR 1.8 million (1.4), or 3.0% (2.8) of the total external revenue. Operating loss decreased compared to the previous year, amounting to EUR -0.1 million (-1.5).
In June 2017, Kamux expanded its showroom in Örebro and in December Kamux opened a new showroom in Karlstad. In July Kamux signed a new lease agreement in Jönköping. The new showroom was taken into use in the beginning of 2018 and allows the car offering to nearly triple in Jönköping.
Robin Toss started as Country Director, Sweden on January 1, 2018. Mr. Toss has previously worked in several positions at McDonald’s in Sweden and Finland and has excellent competences in chain management, building a retail network and busi-ness development.
Germany 2017Revenue increased by 110.4% compared to the pre-vious year, amounting to EUR 22.8 million (10.8).
The number of cars sold during 2017 increased by 1,008 or 123.4% compared to the previous year, amounting to 1,825 (817). The growth was mainly due to the new showroom opened in December 2016.
Integrated services revenue increased to EUR 0.5 million (0.1), or 2.2% (1.3) of the total external reve-nue. Operating loss increased compared to the pre-vious year, amounting to EUR -1.9 million (-0.7). The increase in the operating loss was mainly due to the increase in expenses as the company builds the or-ganization for future growth.
The main event in Germany during 2017 was the official opening in January 2017 of the showroom in Nedderfeld, which started its operations in December 2016. In October, Kamux appointed Oliver Michels as Country Director for Kamux Germany and Managing Director for Kamux Auto GmbH. Michels has previ-ously worked as a Managing Director at GARPA and Orlen Deutschland and as a strategy consultant. Mr. Michels has experience in retail chain expansion, de-fining customer journeys, building up operations, and acquiring new customer segments. Mr. Michels start-ed his duties in January 2018.
CONSOLIDATED BALANCE SHEET AND FINANCIAL POSITIONThe group’s consolidated balance sheet total amount-ed to EUR 103.0 million as of December 31, 2017 (78.4), of which total equity amounted to EUR 58.9 million (28.9). The amount of net debt was EUR 7.3 million (30.9). Non-current bank loans amounted to EUR 22.4 million (25.4). The balance sheet of the company is strong, allowing business growth in line with our strategy.
In 2017, the company issued a total of 117,622 new shares in share issues directed to the company’s new key employee and the new members of the Board of Directors, resulting in gross proceeds of EUR 0.7 mil-lion to the company.
In May 2017, Kamux was listed on the Nasdaq Helsinki main market. Kamux issued 2,852,853 new shares in the initial public offering. Gross proceeds from the issue amounted to EUR 20.5 million. A total of EUR 0.8 million, net of taxes of related expenses was deducted from the gross proceeds.
Kamux has entered into a five-year loan facility agreement of EUR 50 million with Nordea Bank AB (publ), Finnish Branch. The facility agreement was amended in April 2017 and now includes a five-year term loan of EUR 30 million and a revolving credit fa-cility of EUR 20 million. Of the revolving credit facility,
EUR 10.0 million is available as a multi-currency fa-cility, which Kamux entered into in December 2016. The term loan of EUR 30 million is currently repaid in bi-annual installments of EUR 1.5 million. In addition to the revolving facility, Kamux has a lease guarantee facility of EUR 0.4 million.
Net working capital amounted to EUR 49.5 mil-lion as of December 31, 2017 (43.3). Value of inventory amounted to EUR 55.2 million (47.9).
Kamux’s cash flow from operating activities during year 2017 amounted to EUR 6.5 million (-1.1). Cash and cash equivalents at the end of the period amounted to EUR 18.1 million (0.7).
Equity ratio at the end of the period was 57.2% (36.9). Return on capital employed was 17.2% (22.5) and return on equity was 26.6% (43.8).
CAPITAL EXPENDITURE, RESEARCH AND DEVELOPMENT Kamux’s capital expenditure for 2017 amounted to EUR 1.2 million (2.1), consisting mainly of IT systems and ordinary maintenance in the showrooms. Kamux’s research and development costs are mainly related to further development of the company’s retail concept and improving its business processes.
During 2017, Kamux invested in matters related to the opening of new showrooms, such as refurbish-ments, equipment and fixtures, as well as in digitali-zation projects, such as CRM/ERP systems, analytics, data management and financial administration sys-tems. The company financed these investments with the existing cash and cash equivalents, and cash flow from operations.
BOARD OF DIRECTORSKamux’s Board of Directors consisted of the follow-ing members at the beginning of 2017: Matti Virtanen, Inka Mero, David Nuutinen, Jokke Paananen and Vesa Uotila.
New members were elected and joined the Board during 2017: Reija Laaksonen on March 10, and Harri Sivula on May 12.
Inka Mero’s Board membership ended on April 12, 2017 at the Annual General Meeting.
MANAGEMENT TEAMKamux Management Team consisted of the follow-ing members in the beginning of 2017: CEO Juha Kalliokoski, CFO Tapio Arimo, Communications and Marketing Director Satu Heikkilä, HR Director Tommi Iiskonmäki, Purchasing Director Jyri Kalliola, Business
Development Manager Ismo Kiviniemi and Finland Country Director Jussi Mäkinen.
On February 1, 2017 Jyri Kalliola started as Op-erations Director, Kamux Germany and left the Kamux Management Team. Ismo Kiviniemi left the Kamux Management Team on February 28, 2017. New members who joined the Kamux Manage-ment Team in 2017 were Tero Törmänen, who start-ed as Purchasing Director on February 1, 2017, and Olli Kilpi, who started as Director of International Business on May 2, 2017.
PERSONNELKamux’s number of employees on December 31, 2017 was 597 (552), including all active full-time and part-time employees. The number of person-nel in the Group converted to full-time equivalent (FTE) employees was 418 (343). The Group’s total number of personnel grew by 75 FTEs during the year. The growth in the number of personnel is due to the opening of new showrooms in Finland, Swe-den and Germany, as well as the increase of staff in existing showrooms and head-office.
The average number of FTE employees was divided by country as follows:
During 2017, induction and additional training was given especially for employees in the customer in-terface in all countries.
CORPORATE RESPONSIBILITYIn autumn 2017, Kamux defined the material cor-porate responsibility themes of its operations. The materiality definition was based on information gathered from Kamux’s management, personnel and stakeholder groups in a Management Team workshop and stakeholder interviews. The criteria used for the themes were the economic impacts of operations, including risks and possibilities, en-vironmental impact, and the impacts on people. Kamux’s material responsibility themes are Code
2017 2016
Finland 334 280
Sweden 59 47
Germany 26 16
2017 2016
Employees December 31 597 552
FTE employees on average 418 343
Wages and salaries (EUR million)
17.6 16.0
TILINPAATOS
7 KAMUX CORPORATION ANNUAL REPORT 2017 8
REPORT BY THE BOARD OF DIRECTORS

of Conduct, fair and rewarding employer, excellent customer experience, profitable growth and rea-sonable use of resources.
Code of Conduct Our operations are guided by Kamux’s ethical guidelines, the Code of Conduct, in all situations. Defined in 2017, the Code of Conduct instructs all Kamux employees in their daily work and opera-tions. The Code of Conduct is available in Finnish, English, Swedish, and German. The Code of Con-duct applies to Kamux’s cooperation with our sup-pliers as well. We require that our suppliers com-ply with good business practices. This principle, among others, has been incorporated into our pro-curement guidelines drafted in 2017. Each Kamux employee has the possibility to report suspected infringements of rules, regulations, and the Code of Conduct through a whistleblowing channel. No reports were made through the whistleblowing channel in 2017.
Fair and rewarding employerKamux’s enthusiastic, committed and skilled per-sonnel form the foundation of our operations. Free-dom, as well as responsibility, are important values at Kamux. Committed and motivated personnel is the key to success in the competitive car retail in-dustry. Kamux is a fair workplace, which makes systematic investments in the well-being, training, and safety of its personnel. We want to offer our employees the possibility to do their best, grow and further develop their careers. Employee commit-ment is supported by offering career development possibilities, training, and motivating compensation.
Excellent customer experience Kamux wants to meet customer expectations
through open and honest communication based on accurate information. Kamux actively monitors customer satisfaction and customer promise vs. customer experiences. Kamux also finds it impor-tant that possible claims are handled appropriately, openly, with a schedule that is reasonable for all parties, and in accordance with Kamux’s internal rules.
Profitable growth Kamux is committed to profitable growth. Acting responsibly in all business areas is one of the ena-blers of growth and profitability and supports the
company in reaching its financial targets.
Reasonable use of resources Kamux aims to actively decrease the environmental impact of its operations. Kamux’s environmental im-pact consists mainly of transfers of cars and people between our car showrooms, the consequent car fuel consumption, as well as car service and repair. Kamux strives to maintain energy consumption at a reasona-ble level while considering safety aspects in our show-rooms. We also aim to minimize the amount of waste resulting from our operations. Kamux’s ability to af-fect the climate impact of the cars it sells is very lim-ited and measuring it is challenging. The majority of climate impacts of the cars sold by Kamux are created during their manufacturing and use. The average CO2 emissions of the cars sold by Kamux was 166 g/km in 2017, and 173 g/km in 2016. Purchases are made in ac-cordance with Kamux’s procurement guidelines. The criteria for purchases is affordability, service, speed, quality, and reliability.
RISK MANAGEMENTThe aim of risk management is to ensure the keeping of customer promises, profit development, the abil-ity to pay dividends, shareholder value, responsible operating practices and the continuity of business. Kamux has harmonized and efficient methods to identify, assess and manage risks and their conse-quences. Kamux complies with the internal control and risk management principles approved by the company’s Board of Directors.
Risk management is a systematic activity, the pur-pose of which is to guarantee comprehensive and ap-propriate identification, assessment, management and monitoring of risks. It is an essential part of Kamux’s planning and management process, decision-making, daily leadership, operations and supervision and re-porting procedures. Risks are assessed and managed in a business-oriented fashion and comprehensively. This means that the key risks are identified, assessed, man-aged, monitored and reported on systematically as part of the business.
Kamux only takes conscious and calculated risks in expanding its business, strengthening its market posi-tion and creating new business. In assessing the risks, the company takes into account not only economic aspects but also the impact on people, the environ-ment and reputation. Kamux creates a safe working environment for employees and minimizes the poten-tial for crime or misconduct. The company secures
business-critical operations and the resources need-ed to ensure continuity. Kamux prepares for the re-alization of risks, for example, by maintaining ade-quate insurance coverage and information security.
The Group’s CEO and other members of the Management Team each have their own respon-sibility areas. The Management Team regularly re-ports to the Board on risks and risk management actions. The Board reviews most significant risks, measures to manage them, and assesses the ef-fectiveness of risk management. The CFO is re-sponsible for the coordination of risk management. Kamux has created common operating principles in its Code of Conduct, which is available in Finnish, Swedish, German and English. The Code of Con-duct is one part of pre-emptive risk management.
Kamux considers its most significant risks to be:
Economic risks and general competitive situation General economic conditions may have an adverse effect on the used car retail market in which Kamux operates. The risk is managed by closely monitoring the general economic development and its impact on Kamux’s business. Other risks related to the econ-omy include interest rate, financing and tax risks, which are monitored and mitigated as described in the Group’s Treasury Policy.
The used car retail market is highly fragmented, and Kamux’s competitors range from large nation-wide brand dealerships to private individuals in all of its geographical markets. Kamux responds to tightening competition through continuous compet-itive situation assessment and development of the Kamux concept.
Changes or expected changes in car taxes also affect the demand for used cars, especially in Fin-land, where car taxes form a significant part of the car’s price. Political debate or political decisions about possible emission limitations and bans, car- or fuel taxes and increased safety requirements may, if implemented, affect the development of the used car market.
Reputation riskKamux’s brand and reputation among customers and other stakeholders are important factors of suc-cess. Kamux works to minimize reputation risk by monitoring the development of customer satisfac-tion, maintaining high customer service levels and operating in a responsible way.
Personnel riskSkilled employees deliver Kamux’s performance. Kamux’s human resource strategy identifies em-ployees as the most important resource of the Group, and employees are instrumental in achieving set business goals. Managing personnel growth has been identified as a risk. Personnel risk is minimized through a systematic recruitment process, tracking and developing employee satisfaction and well-be-ing, training and a rewarding incentive system.
Failures in IT systems and processing of custom-er confidential informationKamux’s IT systems are especially important and cover all key business areas such as customer infor-mation, inventory monitoring, logistics, human re-sources, finance and other administrative systems. Kamux collects, processes and retains confidential customer information in connection with its normal business. The business premises and systems of Kamux and its external service providers may be exposed to risks related to unauthorized use, mis-use, employee mistakes or misconduct, comput-er viruses, hacker attacks or other similar threats. Kamux aims to prevent failures by means defined in its information security strategy.
DECISIONS OF THE ANNUAL GENERAL MEETING AND AUTHORIZATIONSKamux’s Annual General Meeting on April 12, 2017 approved the financial statements and discharged the members of the Board of Directors and the CEO from liability for the financial year 2016. The Annu-al General Meeting re-elected Matti Virtanen, Reija Laaksonen, David Nuutinen, Jokke Paananen and Vesa Uotila as members of the Board. In addition, it was noted that Harri Sivula’s election to the Board of Directors was contingent on the execution of the in-itial public offering, and came into effect when trad-ing in the company’s share began on the pre-list of Nasdaq Helsinki on May 12, 2017. Matti Virtanen was elected as Chairman of the Board. The Annual Gen-eral Meeting appointed PricewaterhouseCoopers Oy as its auditor for the financial year ending Decem-ber 31, 2017. PricewaterhouseCoopers Oy appointed Janne Rajalahti, APA, as the principal auditor.
The Annual General Meeting decided on a div-idend of EUR 0.06 per share outstanding at the time of the decision to be paid out from distributa-ble earnings in 2016. The total dividend of EUR 2.2 million was paid on April 25, 2017.
TILINPAATOS
9 KAMUX CORPORATION ANNUAL REPORT 2017 10
REPORT BY THE BOARD OF DIRECTORS
The Annual General Meeting authorized Kamux’s Board of Directors to resolve on a directed share is-sue. Based on the authorization, new and/or existing shares may be issued in deviation from the share-holders’ pre-emptive rights in one or more occasions, such that the total number of shares issued may not exceed 300,000. Shares may also be issued without consideration. The issued shares may be used for re-warding Kamux’s key employees under the company’s share-based incentive plan. The Board of Directors is authorized to decide on other terms of the share issue. The share issue authorization is valid until December 31, 2019.
On May 3, 2016, the company’s shareholders unani-mously authorized the Board of Directors to resolve on a directed share issue against a consideration. Based on the authorization, a maximum of 6,000,000 new shares may be issued deviating from the shareholders’ pre-emptive rights on one or more occasions. The au-thorization granted to the company’s Board of Direc-tors was in effect until June 30, 2017, and it revoked the share issue authorization granted by the General Meeting of the Shareholders on December 22, 2015. Based on the authorization mentioned above, the company’s Board of Directors resolved on an issue of new shares on May 11, 2017. The company issued a to-tal of 2,852,853 new shares in the share issue, and the number of the shares increased to 41,307,156 shares.
On December 13, 2017, the Board of Directors approved a share-based incentive scheme for the Group’s key personnel for year 2018. Information on the scheme was published with a separate stock ex-change release on December 13, 2017.
SHARE ISSUANCESOn January 30, 2017, the company issued a total of 52,174 new shares in a share issue directed to a new member of the company’s management. The shares were registered in the Finnish Trade Register on Feb-ruary 14, 2017.
On March 27, 2017, the company issued a total of 39,348 new shares in a share issue directed to the new members of the company’s Board of Directors. The shares were registered in the Finnish Trade Reg-ister on April 20, 2017.
The company issued a total of 26,100 new shares in a share issue directed to the company’s new member of the company’s management. The shares were registered in the Finnish Trade Register on April 26, 2017.
TREASURY SHARESAt the end of the financial year, Kamux had 1,319,862 treasury shares (1,319,862) corresponding to 3% (3%) of all shares.
PROPOSAL OF THE BOARD OF DIRECTORS FOR DISTRIBUTION OF PROFITOn December 31, 2017 Kamux Corporation’s distribut-able earnings were EUR 59,451,130.13 of which profit for the year was EUR 10,870,433.41. The Board of Di-rectors proposes a dividend of EUR 0.12 per share to be distributed and that the other distributable earn-ings be held in unrestricted equity (for the year 2016 a dividend of EUR 0.06 per share was distributed).
EVENTS AFTER THE FINANCIAL YEARKamux appointed M.Sc. (Pol), Mikko-Heikki Inkeroin-en as Chief Digital Officer (CDO) and member of the Management Team. Mr. Inkeroinen is responsible for the company’s digital business development, end-to-end customer experience and marketing. Mr. Inkeroin-en joined Kamux from Power International AS, where he was Head of Digital Commerce. Mr. Inkeroinen is an expert in consumer and digital businesses and his task is to develop Kamux’s digital services and cus-tomer experience in line with our strategy. Mr. Inkeroi-nen started in his position on February 24, 2018.
At the beginning of 2018, Robin Toss started as the Country Director of Sweden and Oliver Michels as the Country Director of Germany.
On January 2, Kamux opened a showroom in new-er, larger premises in Jönköping in Sweden. Kamux opened its 42nd store in Finland in Savonlinna in Feb-ruary 2018.
ESTIMATE OF FUTURE DEVELOPMENTKamux’s medium-term target is to achieve revenues of at least EUR 700 million and an operating profit margin of 4-5% in 2019.
RELATED PARTY LOANS AND LIABILITIESThe company has not issued loans to related parties. Related party transactions are presented in Note 5.3 to the consolidated financial statements.
Hämeenlinna March 8, 2018Kamux CorporationBoard of Directors
SHARES AND SHARE OWNERSHIP
KAMUX’S INITIAL PUBLIC OFFERINGOn May 2, 2017, Kamux applied for listing of its shares on the Nasdaq Helsinki main market and arranged an initial public offering (IPO). Prior to the IPO, the company’s shares have not been trad-ed on a regulated marketplace. Kamux’s shares were offered to individuals and entities in Finland, Kamux employees and institutional investors in Fin-land and internationally. The final subscription price of the shares in the IPO was EUR 7.20 per share, and the company received more than 1,200 new shareholders in the IPO. The total number of shares in the company rose to 41,307,156 shares. The pur-pose of the listing was to support Kamux’s growth strategy and internationalization and to increase the visibility of Kamux in Finland and abroad, both among the public and as an employer.
Trading in Kamux’s shares commenced on the Nasdaq Helsinki pre-list on May 12, 2017 and on the main market on May 16, 2017. Kamux raised around EUR 20.5 million of gross proceeds in the IPO. The listing consisted of the sale of new shares, and the sale of shares of Intera Partners and certain other shareholders of Kamux.
SHAREKamux’s share capital at the end of the financial year was EUR 80,000 and the number of shares was 41,307,156. The company has one class of shares and each share has one vote at the compa-
ny’s general meeting. The company owns 1,319,862 of its own shares, i.e. 3.2 per cent of the shares. During the financial year, a total of 16,531,609 Kamux shares were traded on the Nasdaq Helsin-ki marketplace. The highest trading price for the financial year was EUR 9.00 and the lowest EUR 6.40. The closing price of the share on the last trad-ing day on December 29, 2017 was EUR 7.05. The trade volume weighted average price of the Kamux share during the year was EUR 7.34. The market value of the share capital without treasury shares was EUR 281.9 million at the end of the year. The trading symbol on the Nasdaq Helsinki main mar-ket is KAMUX, and Kamux is classified as a medi-um-sized company in the Retail sector.
SHAREHOLDERS AND FLAGGINGAt the end of 2017, the number of registered share-holders was 1,462 (including 6 nominee registered shareholders). Kamux’s largest shareholders on December 31, 2017 were Intera Fund II Ky (29.38%), Kalliokoski Juha Antero (14.09%) and Elo Mutual Pension Insurance Company (6.95%).
In accordance with the rules of the Securities Market Act, shareholders of publicly listed com-panies must notify both the Financial Supervisory Authority and the listing company of changes in their holdings. In 2017 Kamux received no flagging announcements.
REPORT BY THE BOARD OF DIRECTORS
11 KAMUX CORPORATION ANNUAL REPORT 2017 12

LARGEST SHAREHOLDERS DECEMBER 31, 2017 Share ownership % of shares
1 Intera Fund II Ky 11,748,596 29.38
2 Kalliokoski Juha Antero 5,635,500 14.09
3 Elo Mutual Pension Insurance Company 2,777,778 6.95
4 Etera Mutual Pension Insurance Company 1,388,889 3.47
5 Kalliola Jyri 1,365,000 3.41
6 Mäkinen Jussi Antero 1,365,000 3.41
7 Fondita Nordic Micro Cap Placeringsfond 1,225,000 3.06
8 Investment fund Aktia Capital 1,150,000 2.88
9 OP-Suomi Arvo – investment fund 1,127,876 2.82
10 Ilmarinen Mutual Pension Insurance Company 600,000 1.50
11 OP-Suomi Pienyhtiöt –investment fund 473,005 1.18
12 Pelkonen Henri Tapio 409,500 1.02
13 Salmela Jussi Pekka 409,500 1.02
14 Blueberry Capital Oy 276,038 0.69
15 Ahonen Ari Juhani 273,000 0.68
16 Kemppainen Jorma Petteri 273,000 0.68
17 Mänty Tero Juho 273,000 0.68
18 Pihlaja Ari Kalevi 273,000 0.68
19 Investment fund Aktia Nordic Small Cap 250,000 0.63
20 Fondita Equity Spice –investment fund 197,889 0.49
20 largest shareholders in total 31,491,571 78.75
Excludes nominee registered shares and treas-ury shares. As of December 31, 2017, Kamux held 1,319,862 treasury shares.
Kamux has received the following notifications of nominee registered owners on December 31, 2017: Investment funds managed by Swedbank
Robur owned a total of 2,784,487 shares, corre-sponding to 6,96% of the outstanding shares and votes of the company, and family Dan Sten Olsson and trust owned a total of 1,060,000 Kamux shares, corresponding to 2.65% of the outstanding shares and votes of the company.
Includes only book-entry registered shareholders in Finland. The distribution of shareholdings is thus not illustrative of the distribution of the entire shareholding in the company.
Includes treasury shares held by Kamux.
OWNERSHIP BY SECTOR, DECEMBER 31, 2017 Owners % of owners Shares % of shares
Foreign owners 5 0.34 4,625 0.01
Households 1,369 93.64 11,826,727 33.91
Government entities 4 0.27 4,767,167 13.67
Financial and insurance institutions 15 1.03 16,422,058 47.08
Non-profit organizations 2 0.14 6,100 0.02
Companies and home associations 67 4.58 1,851,343 5.31
Total 1,462 100.00 34,878,020 100.00
OWNERSHIP DISTRIBUTION BY SIZE, DECEMBER 31, 2017
Shares Owners % of owners Shares % of shares
1-100 500 34.20 24,744 0.06
101-500 613 41.93 163,575 0.40
501-1 000 145 9.92 112,780 0.27
1 001-5 000 112 7.66 241,392 0.58
5 001-10 000 29 1.98 218,474 0.53
10 001-50 000 33 2.26 733,023 1.77
50 001-100 000 5 0.34 297,284 0.72
100 001-500 000 12 0.82 3,402,719 8.24
500 001- 13 0.89 36,113,165 87.43
Total 1,462 99.59 41,307,156 100.00
SHARES AND SHARE OWNERSHIP
13 KAMUX CORPORATION ANNUAL REPORT 2017 14

KEY PERFORMANCE MEASURES
Statement of comprehensive income 2017 2016 2015Revenue 454.9 404.8 309.9
revenue growth, % 12.4 % 30.6 % 44.2 %
Gross profit 53.8 49.2 38.1
as percentage of revenue, % 11.8 % 12.2 % 12.3 %
Earnings before interest, tax,
depreciation and amortization (EBITDA) 17.3 16.5 16.1
as percentage of revenue, % 3.8 % 4.1 % 5.2 %
Operating profit (EBIT) 16.2 15.7 15.5
as percentage of revenue, % 3.6 % 3.9 % 5.0 %
Adjusted operating profit 18.6 18.0 16.0
as percentage of revenue, % 4.1 % 4.4 % 5.2 %
Balance sheet Equity 58.9 28.9 21.3
Non-current liabilities 22.8 25.8 18.0
Current liabilities 21.3 23.7 19.4
Balance sheet total 103.0 78.4 58.7
Net debt 7.3 30.9 24.4
Net working capital 49.5 43.3 30.6
Inventories 55.2 47.9 36.2
Other information Number of cars sold 40,957 36,290 28,515
Gross profit per sold car 1,314 1,357 1,337
Sales growth of like-for-like showrooms, % -4.9 % 12.2 % 13.9 %
Inventory turnover, days 46.8 43.1 38.6
Capital expenditures 1.2 2.1 0.9
Average number of employees during the period 418 343 406
Key figures
Return on equity (ROE), % 26.6 % 43.8 % 67.7 %
Return on capital employed (ROI), % 17.2 % 22.5 % 30.6 %
Equity ratio, % 57.2 % 36.9 % 36.3 %
Gearing, % 12.3 % 107.0 % 114.2 %
Per share data 2017 2016 2015Earnings per share, basic, € 0.30 0.29 0.30
Cash flows from operating activities per share, € 0.17 -0.03 -0.01
Shareholders’ equity per share, € 1.43 0.75 0.57
Dividend per share, € 0.12* 0.06 0.04
Payout ratio, % 39.9 % 20.5 % 13.3 %
Effective dividend yield, % 1.7 % NA NA
Price/earnings (P/E) ratio 23.5 NA NA
Highest share price, € 9.00 NA NA
Lowest share price, € 6.40 NA NA
Share price on December 31, € 7.05 NA NA
Market capitalization of share stock, € million 281.9** NA NA
Turnover of shares, total, kpcs 16,532 NA NA
Relative turnover of shares, total, % 41.3 % NA NA
Average no. of shares (1,000 shares), basic** 38,937 37,566 38,253
Average no. of shares (1,000 shares), diluted** 38,941 37,635 38,459
Total no. of shares (1,000 shares) on December 31** 39,987 37,017 37,614
*Proposal of the Board of Directors to the Annual General Meeting**Excluding treasury shares
KEY PERFORMANCE MEASURES
15 KAMUX CORPORATION ANNUAL REPORT 2017 16

Kamux presents alternative performance meas-ures as additional information to performance measures presented in the consolidated income statement, consolidated statement of financial po-sition and consolidated statement of cash flows prepared in accordance with IFRS. In Kamux’s view, the alternative performance measures pro-vide significant additional information related to Kamux’s results of operations, financial position and cash flows, and they are widely utilized by an-
CALCULATION OF KEY FIGURES AND ALTERNATIVE PERFORMANCE MEASURES
CALCULATION OF KEY FIGURES
alysts, investors and other parties.The alternative performance measures should
not be considered separately from measures under IFRS or as substitutes for corresponding measures under IFRS. All companies do not calculate alter-native performance measures in a uniform way and therefore the alternative performance meas-ures presented by Kamux may not be comparable with similarly named measures presented by other companies.
RECONCILIATION OF ADJUSTED OPERATING PROFIT
EUR million 2017 2016
Operating profit (EBIT) 16.2 15.7
Costs relating to the listing 1.2 1.2
Strategic investigations 0.7 0.6
Special items relating to
geographical expansion
0.4 0.2
Share-based payments - 0.3
Total adjustment items 2.4 2.3
Adjusted operating profit 18.6 18.0
Gross profit = Revenue + Other operating income – Materials and services
Earnings before interest, tax, depreciation, and amortization (EBITDA) = Operating profit + Depreciation and amortization
Adjusted operating profit (EBIT) = Operating profit adjusted for costs relating to the listing, special items relating to strategic planning and strategy implementation, special items relating to geographical expansion of business and cash-settled share-based payments related to redemption of treasury shares.
Net debt = Non-current borrowings + Current borrowings – Cash and cash equivalents
Financial debt = Non-current borrowings + Current borrowings
Like-for-like showroom revenue growth =
New showrooms are included in the calculation when they have been open for 13 months and, therefore, the first time the showroom is included in the measure is its 25th operating month.
Inventory turnover =
Return on equity (ROE), % =
Return on capital employed (ROI), % =
Equity ratio, % =
Gearing, % =
Earnings per share, basic =
Net working capital = Inventories + Trade and other receivables + Current income tax receivables – Trade and other payables – Current income tax liabilities – Non-current and current provisions
Dividend per share, EUR = Dividend per share approved by the Annual General Meeting with respect to the most recent year, the Board’s proposal to the AGM
Payout ratio, % =
Effective dividend yield, % =
Price/earnings (P/E) ratio = Final quotation at close of period adjusted for share issue
Share of EPS belonging to parent company owners
Shareholders´equity per share, EUR = Equity attributable to equity holders of the parent
Basic number of shares at the end of period adjusted for share issue
Market capitalization of share stock, EUR = Number of shares x closing price at the end of period
For the year ended December 31,
365 *
100 *
100 *
100 *
100 *
100 *
100 *
-1 )Like-for-like showroom car sales
Inventories (average for 12 months)
Profit for the period (rolling 12 months)
Profit for the period + Finance costs (rolling 12 months)
Equity
Net debt
Dividend/share
Dividend/share adjusted for share issue
Profit for the period (attributable to owners of the Company)
Like-for-like showroom car sales in the previous year
Materials and services (rolling 12 months)
Equity (average for 12 months)
Equity + Financial debt (average for 12 months)
Balance sheet total – Advance payments received
Equity
Share of EPS belonging to parent company owners
Final quotation at close of period adjusted for share issue
Weighted average number of outstanding shares adjusted for share issue for the period
KEY PERFORMANCE MEASURES
17 KAMUX CORPORATION ANNUAL REPORT 2017 18

PRIMARY STATEMENTS OF THE CONSOLIDATED FINANCIAL STATEMENTS
CONSOLIDATED STATEMENTS OF COMPREHENSIVE INCOME
CONSOLIDATED BALANCE SHEETS
CONSOLIDATED STATEMENTS OF CHANGES IN EQUITY
CONSOLIDATED STATEMENTS OF CASH FLOWS
CONSOLIDATED STATEMENTS OF COMPREHENSIVE INCOME
EUR million Note 2017 2016Revenue 2.2 454.9 404.8Other operating income 2.2 0.7 1.1
Materials and services 2.3, 2.4 -401.7 -356.6
Personnel costs 2.4 -21.7 -19.9
Other operating expenses 2.4 -14.8 -12.8
Depreciation and amortization 2.4 -1.1 -0.8
Operating profit 16.2 15.7Finance costs 4.2 -0.8 -1.0
Profit before income tax 15.5 14.6Income tax 2.5 -3.8 -3.6
Profit for the period 11.7 11.0
Other comprehensive income Items that maybe subsequently reclassified to profit or loss
Translation differences -0.0 0.0
Other comprehensive income for the period, net of tax -0.0 0.0Total comprehensive income for the period 11.7 11.0
Profit for the period attributable to
owners of the Company 11.7 11.0
Total comprehensive income for the period attributable to
owners of the Company 11.7 11.0
Earnings per share for profit attributable to owners of the Company 2.6
Earnings per share, basic and diluted, EUR 0.30 0.29
The above consolidated statements of comprehensive income should be read in conjunction with the
accompanying notes.
For the year ended December 31,
FINANCIAL STATEMENTS
19 KAMUX CORPORATION ANNUAL REPORT 2017 20
CONSOLIDATED BALANCE SHEETS CONSOLIDATED STATEMENTS OF CHANGES IN EQUITY
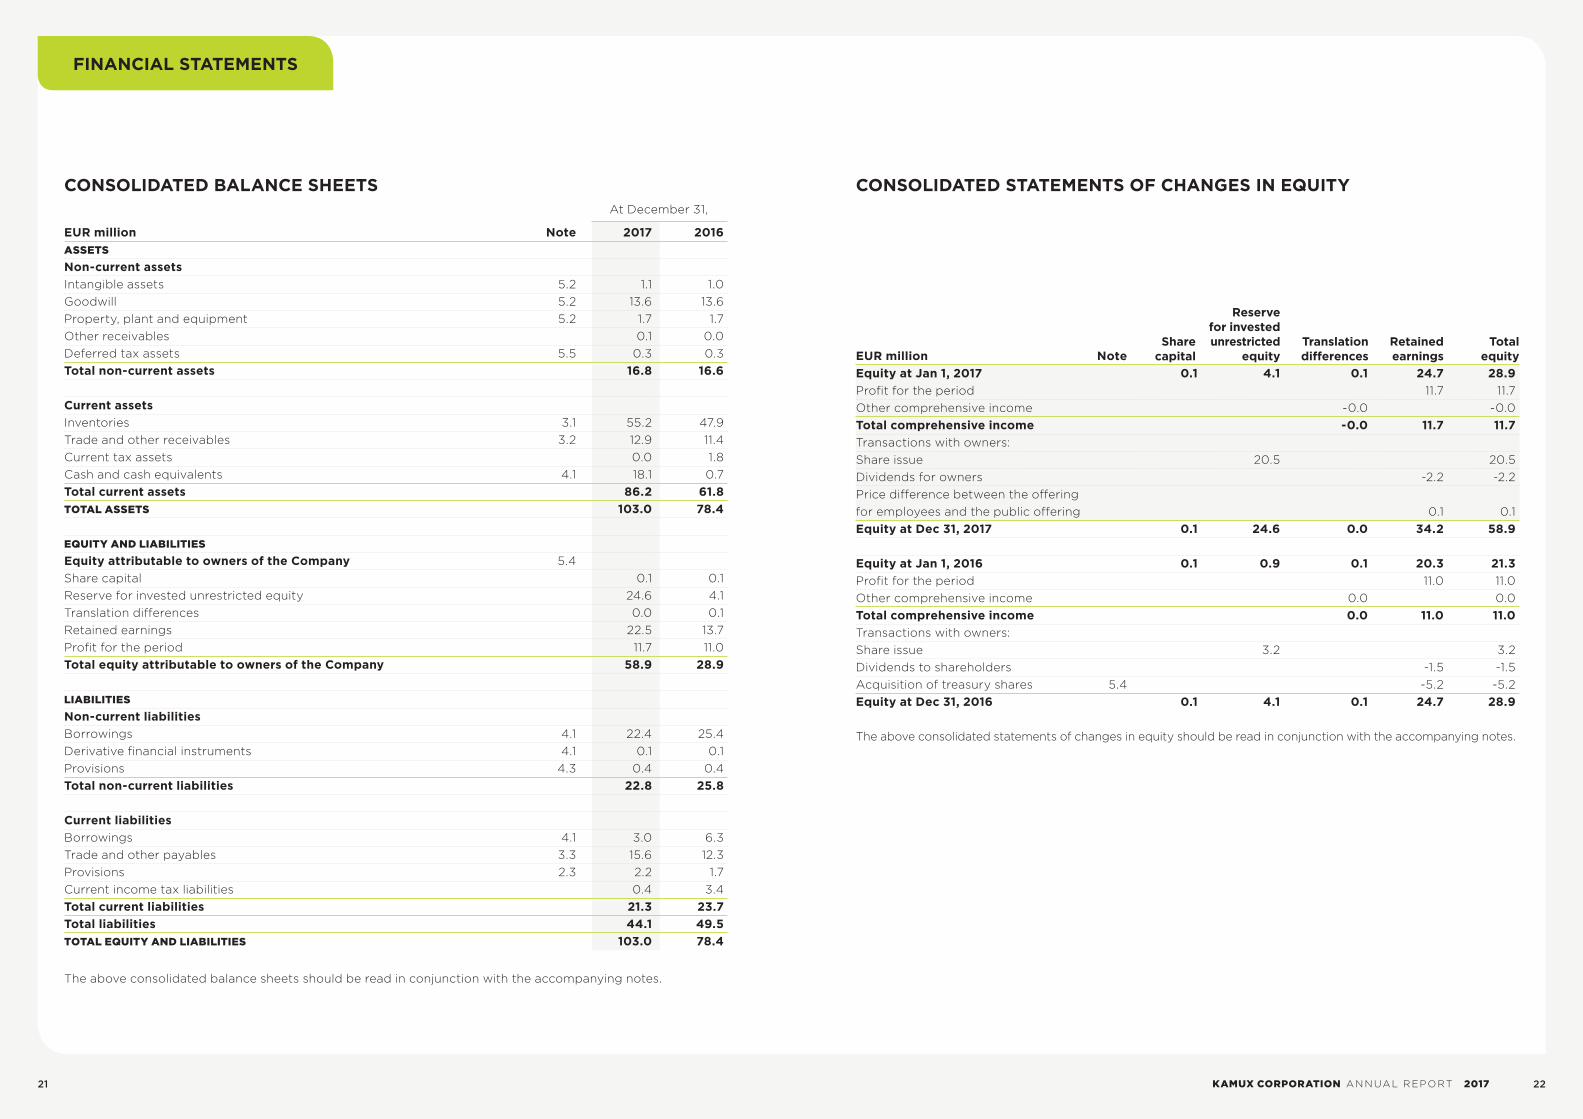
EUR million Note 2017 2016ASSETS Non-current assets Intangible assets 5.2 1.1 1.0Goodwill 5.2 13.6 13.6Property, plant and equipment 5.2 1.7 1.7Other receivables 0.1 0.0Deferred tax assets 5.5 0.3 0.3Total non-current assets 16.8 16.6 Current assets Inventories 3.1 55.2 47.9Trade and other receivables 3.2 12.9 11.4Current tax assets 0.0 1.8Cash and cash equivalents 4.1 18.1 0.7Total current assets 86.2 61.8TOTAL ASSETS 103.0 78.4 EQUITY AND LIABILITIES Equity attributable to owners of the Company 5.4 Share capital 0.1 0.1Reserve for invested unrestricted equity 24.6 4.1Translation differences 0.0 0.1Retained earnings 22.5 13.7Profit for the period 11.7 11.0Total equity attributable to owners of the Company 58.9 28.9 LIABILITIES Non-current liabilities Borrowings 4.1 22.4 25.4Derivative financial instruments 4.1 0.1 0.1Provisions 4.3 0.4 0.4Total non-current liabilities 22.8 25.8 Current liabilities Borrowings 4.1 3.0 6.3Trade and other payables 3.3 15.6 12.3Provisions 2.3 2.2 1.7Current income tax liabilities 0.4 3.4Total current liabilities 21.3 23.7Total liabilities 44.1 49.5TOTAL EQUITY AND LIABILITIES 103.0 78.4
The above consolidated balance sheets should be read in conjunction with the accompanying notes.
EUR million Note Equity at Jan 1, 2017 0.1 4.1 0.1 24.7 28.9Profit for the period 11.7 11.7Other comprehensive income -0.0 -0.0Total comprehensive income -0.0 11.7 11.7Transactions with owners: Share issue 20.5 20.5Dividends for owners -2.2 -2.2Price difference between the offering for employees and the public offering 0.1 0.1Equity at Dec 31, 2017 0.1 24.6 0.0 34.2 58.9 Equity at Jan 1, 2016 0.1 0.9 0.1 20.3 21.3Profit for the period 11.0 11.0Other comprehensive income 0.0 0.0Total comprehensive income 0.0 11.0 11.0Transactions with owners: Share issue 3.2 3.2Dividends to shareholders -1.5 -1.5Acquisition of treasury shares 5.4 -5.2 -5.2Equity at Dec 31, 2016 0.1 4.1 0.1 24.7 28.9
The above consolidated statements of changes in equity should be read in conjunction with the accompanying notes.
At December 31,
Share capital
Reserve for invested unrestricted
equityTranslation differences
Retained earnings
Total equity
FINANCIAL STATEMENTS
21 KAMUX CORPORATION ANNUAL REPORT 2017 22

CONSOLIDATED STATEMENTS OF CASH FLOWS
EUR million Note 2017 2016Cash flows from operating activities Profit for the period 11.7 11.0Adjustments for:
Depreciation and amortization 2.4 1.1 0.8Finance costs 4.2 0.8 1.0Change in provisions 2.3, 4.3 0.6 0.8Write-down of inventories 3.1 -0.1 0.3Income taxes 2.5 3.8 3.6Other non-cash items 0.1 0.1
Changes in working capital: Change in trade receivables and other receivables 3.2 -1.6 -5.1Change in trade payables and other payables 3.3 3.4 2.7Change in inventories 3.1 -7.3 -12.2
Interests paid -0.5 -0.7Other financial items, net -0.1 -0.2Income taxes paid -5.1 -3.2Net cash inflow (outflow) from operating activities 6.5 -1.1 Cash flows from investing activities Investments in property, plant and equipment -0.6 -1.5Investments in intangible assets -0.6 -0.7Net cash inflow (outflow) from investing activities -1.2 -2.1 Cash flows from financing activities Proceeds from share issues 5.4 20.5 3.2Purchase of treasury shares 5.4 - -5.2Proceeds from bank loans 4.1 - 43.4Repayments of bank loans 4.1 -6.3 -36.9Dividends paid -2.2 -1.5Net cash inflow (outflow) from financing activities 12.0 3.1 Net decrease/increase in cash and cash equivalents 17.3 -0.1Cash and cash equivalents at the beginning of the period 0.7 0.8Effects of exchange rate changes on cash and cash equivalents 0.1 -0.0Cash and cash equivalents at the end of period 18.1 0.7
The above consolidated statements of cash flow should be read in conjunction with the accompanying notes.
For the year ended December 31,
1 BASIS OF PREPARATION AND INFORMATION ON KAMUX
BASIS OF PREPARATION
SHORT PRESENTATION OF KAMUX
FINANCIAL STATEMENTS
23 KAMUX CORPORATION ANNUAL REPORT 2017 24

1.1 BASIS OF PREPARATION 1.2 SHORT PRESENTATION OF KAMUX
GENERAL INFORMATIONThese are the financial statements of Kamux Cor-poration (the “Company”) and its subsidiaries (to-gether referred as “Kamux”, or “Group”). Kamux is a rapidly grown retail chain operating in Finland, Sweden and Germany specialising in used car sales.
The parent company’s company ID is 2442327-8, domicile is Hämeenlinna and the registered ad-dress of the head office is Parolantie 66 A, 13130 Hämeenlinna.
The Company’s Board of Directors has ap-proved these financial statements at its meeting on March 8, 2018.
According to the Finnish Companies Act, share-holders have the opportunity to approve or reject the financial statements at the General Meeting of Shareholders held after publication. It is also possi-ble to amend the financial statements at the Gen-eral Meeting of Shareholders.
BASIS OF PREPARATION The consolidated financial statements have been prepared in accordance with International Finan-cial Reporting Standards (IFRS) as adopted by the European Union, conforming to the IAS standards and IFRS standards as well as IFRIC interpretations applicable as of December 31, 2017. The notes to the financial statements also comply with Finnish accounting and corporate legislation complement-ing the IFRS standards.
Assets and liabilities are measured at cost, except for derivative instruments that are meas-ured at fair value through profit or loss. Financial statements are presented in millions of euros. The figures presented in the financial statements are rounded and therefore the sum of individual fig-ures may differ from the presented sum figure.
The Company’s functional currency is euro,
which is also the reporting currency for the Com-pany and the Group. This means that financial statements are presented in euros.In addition to primary statements the consolidated financial statements are divided into five sections: Basis of Preparation and Information on Kamux, Key Performance Metrics of Kamux Group, Net Working Capital, Net Debt and Contingencies and Other Notes. Each section includes related signifi-cant accounting policies.
ACCOUNTING ESTIMATES AND JUDGMENTS IN THE FINANCIAL STATEMENTSPreparing the financial statements in accordance with IFRS requires management to make account-ing estimates and judgments as well as assump-tions that influence the application of the account-ing policies and the carrying amounts of assets, liabilities, revenue and expenses. Actual outcomes may differ from these estimates and judgments.
Estimates and judgments are regularly re-viewed. Changes in estimates are reported in the period in which the change is made if the change affects only that period, or in the period in which the change is made and in future periods if the change affects both the current and future peri-ods.
Assumptions underlying management’s esti-mates can be found in the following notes to the financial statements:
Kamux is a rapidly grown retail chain operating in Finland, Sweden and Germany and specialising in used car sales. The first Kamux car showroom began operations in Finland in 2003 and as of December 31, 2017, Kamux had 41 showrooms in Finland, 10 in Sweden and 2 in Germany. Since its incorporation, Kamux has sold more than 160,000 used cars.
Kamux’s CEO Juha Kalliokoski founded Kamux in 2003 by opening its first car showroom in Hämeenlinna, where Kamux’s head office is still lo-cated. Kamux opened its second car showroom in 2006 and by 2010 it had expanded its network to 14 car showrooms in Finland. In 2010 Kamux start-ed to offer integrated services to its customers. In 2011 Finnish private equity investor Intera Partners acquired control of Kamux with the existing man-agement staying as company shareholders. Intera’s aim was to provide Kamux with additional resourc-es and know-how for expanding operations in Fin-land and abroad. Kamux expanded into Sweden in late 2012 and into Germany in December 2015.
Kamux’s business is based on a combination of car showrooms and online presence, professional procurement of used cars, low fixed costs, rapid inventory turnover and sales of integrated services. Kamux’s business model makes it possible to offer affordable used cars, and Kamux’s aim is to con-tinuously develop its operations to better address customers’ needs. Kamux offers its customers fi-nancing products from third party service provid-ers at all of its car showrooms in Finland, Sweden and Germany. In addition, Kamux offers insurance products and a liability extension product for car repair costs, Kamux Plus, in Finland and Sweden. A key component of Kamux’s customer service con-cept is the home delivery, under which the car is
delivered to a location agreed with the customer and, if necessary, the possible trade-in car is si-multaneously picked up. In February 2017 Kamux opened its online store in Finland.
Kamux acquires used cars from car auctions, leasing companies, other car dealers, financing companies, importers, private individuals, and oth-er sources. The majority of the used cars sold by Kamux are acquired from its customers as part of trade-in car sales. All of Kamux’s car sales person-nel in Finland buy cars, and each of Kamux’s car showrooms has set purchasing targets. In Sweden and Germany, pricing of purchased cars is the re-sponsibility of the sourcing teams in these countries operating under the purchasing director. In addi-tion, Kamux has a separate sourcing organization, which is responsible for acquiring cars at car auc-tions, among others. Kamux aims to align its own and its employees’ interests through its incentive scheme. The sales personnel’s incentive scheme takes into account sales, car procurements, car trade-ins and the sales of integrated services when determining the amount of remuneration.
Kamux’s entire car selection is available to all of its sales personnel at all Kamux’s car showrooms in Finland as well as nationwide in Sweden and Ger-many. If needed, Kamux relocates a car from one car showroom or country to another once the sale is agreed upon. In 2017, 28 percent and in 2016, 27 percent of the cars sold by Kamux’s were cross-sold through another Kamux car showroom. The size of the car selection at each of Kamux’s car showrooms in Finland and Sweden varies between approximately 50 and 150 used cars available for sale, and at its car showrooms in Germany, Kamux aims to have a selection of approximately 150 to 300 used cars available for sale.
Source of uncertainty and managerial judgments
Note
Repair liability costs 2.3
Valuation of used cars 3.1
Goodwill 5.2
Management holdings 5.3
FINANCIAL STATEMENTS
25 KAMUX CORPORATION ANNUAL REPORT 2017 26
2 KEY PERFORMANCE METRICS OF KAMUX GROUP
RESULTS BY SEGMENT
REVENUE
REPAIR COSTS
EXPENSES
INCOME TAXES
EARNINGS PER SHARE
2.1 RESULTS BY SEGMENT
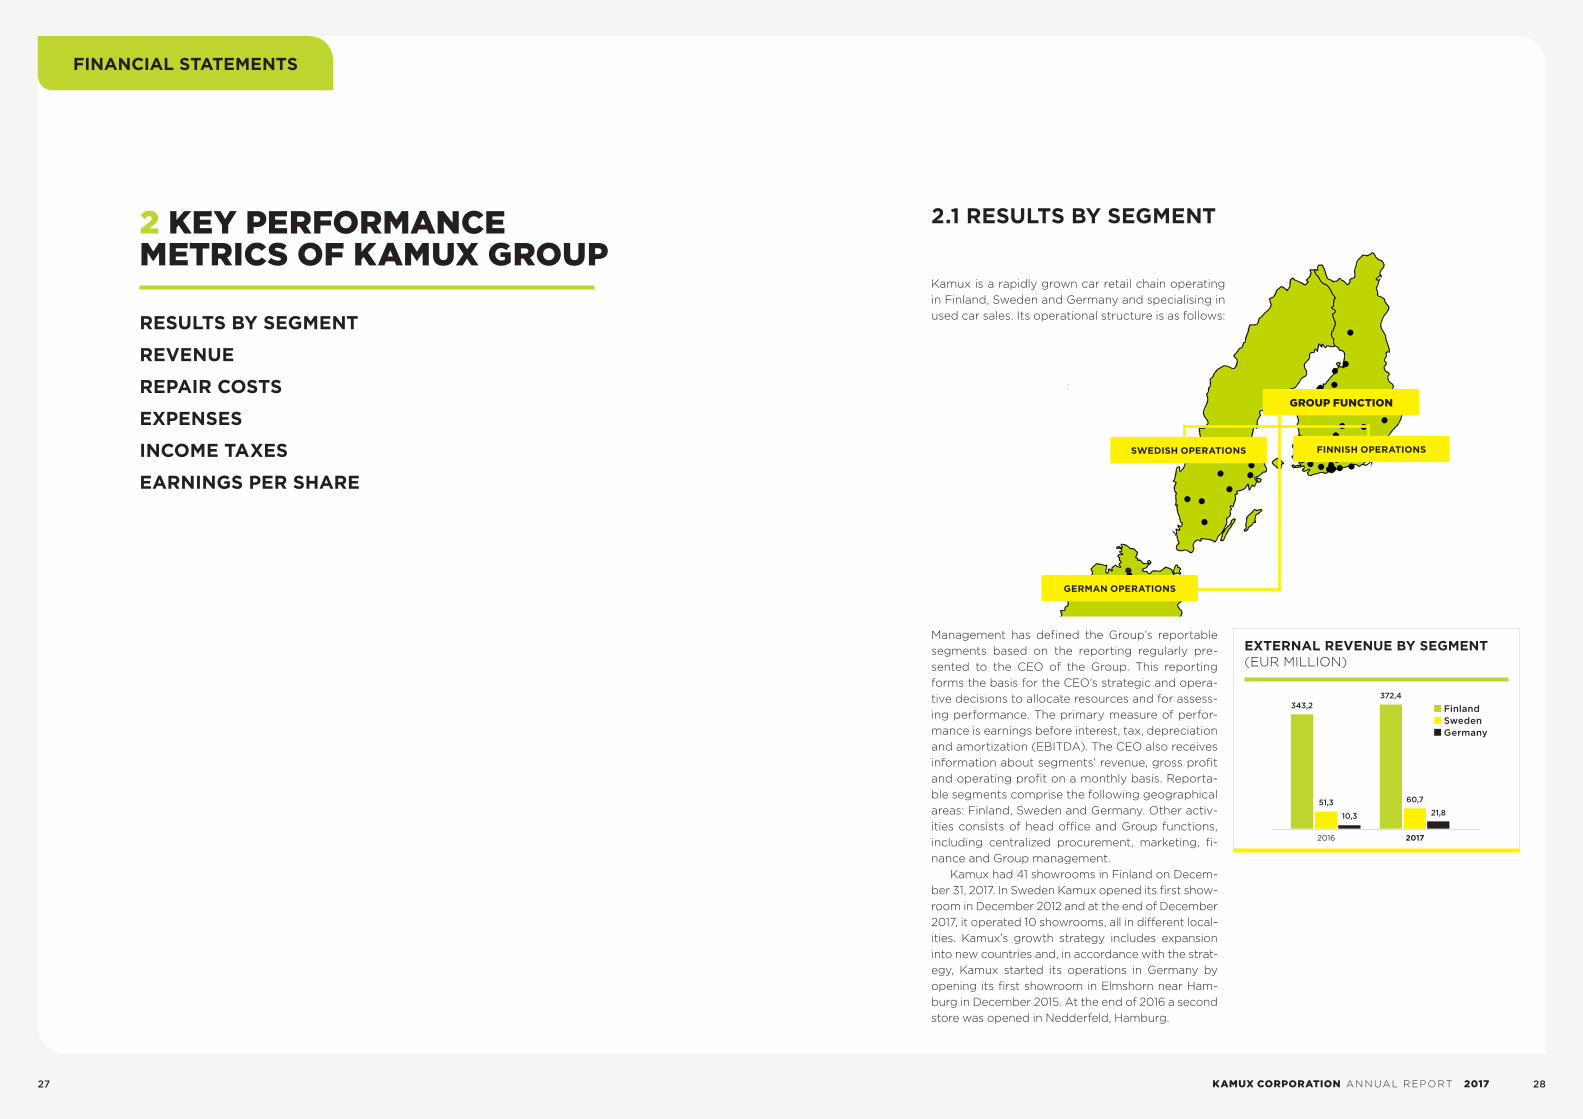
Kamux is a rapidly grown car retail chain operating in Finland, Sweden and Germany and specialising in used car sales. Its operational structure is as follows:
Management has defined the Group’s reportable segments based on the reporting regularly pre-sented to the CEO of the Group. This reporting forms the basis for the CEO’s strategic and opera-tive decisions to allocate resources and for assess-ing performance. The primary measure of perfor-mance is earnings before interest, tax, depreciation and amortization (EBITDA). The CEO also receives information about segments’ revenue, gross profit and operating profit on a monthly basis. Reporta-ble segments comprise the following geographical areas: Finland, Sweden and Germany. Other activ-ities consists of head office and Group functions, including centralized procurement, marketing, fi-nance and Group management.
Kamux had 41 showrooms in Finland on Decem-ber 31, 2017. In Sweden Kamux opened its first show-room in December 2012 and at the end of December 2017, it operated 10 showrooms, all in different local-ities. Kamux’s growth strategy includes expansion into new countries and, in accordance with the strat-egy, Kamux started its operations in Germany by opening its first showroom in Elmshorn near Ham-burg in December 2015. At the end of 2016 a second store was opened in Nedderfeld, Hamburg.
EXTERNAL REVENUE BY SEGMENT (EUR MILLION)
343,2
51,3
2016 2017
10,3
372,4
60,7
21,8
Finland Sweden Germany
GROUP FUNCTION
GERMAN OPERATIONS
SWEDISH OPERATIONS FINNISH OPERATIONS
FINANCIAL STATEMENTS
27 KAMUX CORPORATION ANNUAL REPORT 2017 28

ACCOUNTING POLICYSegment revenue and expenses are items directly attrib-utable to the operating segment. Certain expenses such as centralized procurement are allocated to the segments on a reliable basis in the internal management reporting. Other activities comprise Group level operations that are not directly employed by the individual segment in its op-erating activities. Sales between segments are carried out on arm’s length and eliminated on consolidation. Segment reporting is based on the Group’s IFRS reporting.
2.2 REVENUE
Kamux’s business consists of retail and wholesale sales of used cars in Finland, Sweden and Germany and of integrated services sold to consumer and corporate customers. Sales are based on the net-work of physical showrooms and efficient online showrooms in Kamux’s websites in these countries. Kamux offers a home delivery service, in which Kamux delivers the car to the place agreed with the client. The car delivered to the customer’s home has a 14-day right of return. Kamux also sells used cars in auctions.
Kamux offers its customers financing and insur-ance products provided by third parties in connec-tion with the sale of the used car. The credit and insurance risks for these products are borne by fi-nance and insurance companies. Kamux is entitled to financing fees and insurance commissions from its sales of these products. Parts of the fees are contingent on the continuation of the agreement between the finance company and the client.
In addition, Kamux offers its customers a Kamux Plus –service, which extends the seller’s statutory liability for defects. Kamux repairs predefined car defects that are detected within 12 months of the purchase of a car or until 17,500 driven kilometers, depending on which threshold is reached first. Kamux Plus is part of the car sales contract and it will therefore be taken into account when deter-mining the sales price of a car.
>>Read more about the Kamux Plus -service in note 2.3.
Revenue from sales of used cars was EUR 432.0 million, or 95 percent of total revenue during the financial year 2017. In 2016 such revenue was EUR 385.5 million, or 95 percent of total revenue.
Financing fees and insurance commissions amounted to EUR 19.2 million during 2017, com-prising 4 percent of total revenue. In 2016 fees and commissions were EUR 15.8 million or 4 percent of total revenue. Revenue from sales of the Kamux Plus service was EUR 3.6 million for the year ended December 31, 2017, and EUR 3.5 million in 2016.
External revenue generated in Finland was EUR 372.4 million and represented 82 percent of total Group revenue during 2017. In 2016 corresponding revenue was EUR 343.2 million, or 85 percent of total Group revenue. In Sweden external revenue amounted to EUR 60.7 million during 2017, and to EUR 51.3 million during 2016. In Germany external revenue amounted to EUR 21.8 million during 2017 and to EUR 10.3 million during 2016.
Other operating income includes rental income from premises, insurance compensations and car tax refunds.
>>Read more about segment revenue in note 2.1.
REVENUE (EUR MILLION)
EUR million Finland Sweden Germany Eliminations Group2017
Revenue 372.4 73.2 22.8 468.4 -13.5 454.9internal 12.5 1.0 13.5 -13.5
external 372.4 60.7 21.8 454.9 454.9
Gross profit 46.4 5.9 1.5 53.8 53.8EBITDA 23.9 0.1 -1.8 22.2 -4.9 17.3Depreciation and amortization -0.8 -0.1 -0.1 -1.1 -0.0 -1.1
Operating profit 23.1 -0.1 -1.9 21.1 -4.9 16.2Finance costs -0.8
Profit before income tax 15.5
EUR million Finland Sweden Germany Eliminations Group2016
Revenue 343.2 60.9 10.8 414.9 -10.1 404.8internal 9.6 0.6 10.1 -10.1
external 343.2 51.3 10.3 404.8 404.8
Gross profit 44.1 4.3 0.8 49.2 49.2EBITDA 22.8 -1.3 -0.7 20.8 -4.3 16.5Depreciation and amortization -0.6 -0.1 -0.0 -0.8 -0.0 -0.8
Operating profit 22.2 -1.5 -0.7 20.0 -4.3 15.7Finance costs -1.0
Profit before income tax 14.6
404,8
454,9
2016 2017
Segments total
Segments total
Group functions
Group functions
DEFINITION OF KEY MEASURES
Gross profit Revenue + Other operating income – Materials and services
EBITDA Operating profit + depreciation and amortization
Operating profit Profit for the period + income tax + net finance costs
Of the Group’s non-current assets, except for deferred tax assets, EUR 15.2 million as of December 31, 2017 (EUR 15.0 million as of December 31, 2016) were located in Finland. The corresponding amounts for Sweden were EUR 0.4 million as of December 31, 2017 (EUR 0.4 million as of December 31, 2016) and for Germany EUR 0.9 million as of December 31, 2017 (EUR 0.9 million as of December 31, 2016).
REVENUEEUR million 2017 2016Sales of used cars 432.0 385.5
Financing fees and
Insurance commissions 19.2 15.8
Sales of Kamux Plus 3.6 3.5
Total 454.9 404.8
For the year ended December 31,
FINANCIAL STATEMENTS
29 KAMUX CORPORATION ANNUAL REPORT 2017 30

ACCOUNTING POLICYThe sales of used cars are recognized as revenue upon delivery of the car to the customer. At the time of delivery, the customer pays the sales price by cash or the finance company provides Kamux an approved credit decision as a payment for the sales price. Home delivered cars have a 14-day right of return. Revenue on home delivered cars is recognized when the right of return has expired. Insurance commissions from insurance companies are recognized as revenue when the service is rendered, i.e. when the insurance contract is signed with the customer and Kamux is entitled to a commission fee in accordance with its agency contract.Financing fees from finance companies comprise fixed withdrawal and invoicing fees, variable interest fees and annual bonus fees. Fees are recognized as revenue on an accrual basis when the contract is signed with the customer or during the term of the agreement when Kamux is entitled to a payment from the finance company. The Kamux Plus service is recognized as revenue on a straight-line basis over the 12 months war-ranty period. Revenue from sales is recognized according to the fair value of the sold car, net of discounts and value added taxes.
ACCOUNTING POLICYEstimated repair liability cost is recognized as repair liability provision when the car is sold. The amount of repair liability provision is based on historical statistics about real-ized repair liability costs and the estimated trend of repair liability costs.
SOURCES OF UNCERTAINTY AND MANAGERIAL JUDGMENTSRepair liability provision is recognized based on the actual repair costs and the estimate on the development of repair liability costs. There is uncertainty between actual and es-timated repair liability costs because repair liability costs may not necessarily be realized as predicted. Typically repair liability costs are realized frontloaded during the repair liability period. Estimates and assumptions are reviewed quarterly. Differences between actual and estimated repair liability costs may impact the provision amounts recog-nized in future periods.
2.3 REPAIR COSTS
Kamux’s customer service and customer satisfac-tion strategy are based on offering used cars that are high-quality and reconditioned. Any deficien-cies in the cars are disclosed to the customer dur-ing the sale process.
Used cars include the seller’s statutory repair lia-bility. In Finland, Sweden and Germany a car dealer has a liability to repair undisclosed defects that be-come apparent within six months after the purchase of the car (unless Kamux can prove that the defects arose subsequent to the sale). After six months, the burden of proof is transferred from Kamux to the customer.
In addition to the statutory repair liability, Kamux offers its customers the Kamux Plus service, which extends the seller’s liability for defects. Kamux re-pairs predefined defects that are detected within 12 months following the purchase of the car or within 17,500 driving kilometers, whichever comes first.
Repair liability provision amounted to EUR 2.0 mil-lion as at December 31, 2017 and EUR 1.7 million as at December 31, 2016. Repair- and maintenance costs have increased concurrently as the sales vol-umes have grown. Repair- and maintenance costs amounted to EUR 13.7 million during the financial year 2017, and to EUR 12.7 million during the finan-cial year 2016. The repair liability provision is ex-pected to be used in the following 12 months. Re-pair liability costs and other repair and maintenance costs are reported in “materials and services” in the consolidated statement of comprehensive income
REPAIR LIABILITY PROVISION (EUR MILLION)
CARS SOLD & REPAIR AND MAINTENANCE COSTS
1,7
2,0
2016 2017
12,7
36 29040 957
13,7
2016 2017
Cars sold (pcs, unaudited) Repair and maintenance costs (EUR million)
FINANCIAL STATEMENTS
31 KAMUX CORPORATION ANNUAL REPORT 2017 32

2.4 EXPENSES
EUR million 2017 2016Materials and services Purchases during the period 409.1 368.1Change in inventories -7.4 -11.9External services 0.1 0.4Total 401.7 356.6 Personnel costs Wages and salaries 17.6 16.0Pension costs 2.4 2.3Other employee benefit expenses 1.6 1.7Total 21.7 19.9 Other operating expenses Rents and lease costs 6.3 4.8Marketing and advertising expenses 2.6 2.5Other administrative expenses 5.9 5.5Total 14.8 12.8 Auditors’ fees (included in other administrative expenses above) Audit fees 0.1 0.2Other audit-related services 0.5 0.6Total 0.6 0.7 Depreciation and amortization by class Intangible assets 0.5 0.3Property, plant and equipment 0.6 0.5Total 1.1 0.8
For the year ended December 31,
MATERIALS AND SERVICESKamux purchases most of its used cars as trade-in cars. Kamux also acquires cars from private indi-viduals, car auctions, leasing companies, finance companies, other car dealers, importers and oth-er sources. Materials and services include the cost to acquire used cars and the reconditioning and transportation costs associated with preparing cars for sale. It also includes repair costs associated with repair liability and change in inventories.
PERSONNEL COSTSKamux’s average number of full-time equivalent employees was 418 during the financial period 2017 and 343 in 2016. Employee remuneration is based on fixed and variable salary. The proportionate share of the variable compensation is significant and is based on the achievement of individually de-termined sales targets. In addition, some employ-ees have car allowance, telephone allowance and internet access at home.
Kamux’s pension arrangements are classified as defined contribution plans. The Finnish statuto-ry pension plan under TyEL is arranged through in-surance companies and provides pension benefits based on the years of employment and earnings. The retirement age of the old-age pension under TyEL is 63–68 years. Employees in Sweden and Germany belong to defined contribution plans. In Sweden, retirement age is 61-67 years, and in Ger-many 65-67 years.
In defined contribution plans, insurance contribu-tions are paid to insurance companies and rec-ognized as an expense in the financial period the charge relates to. There are no other payment obli-gations in the defined contributions plans.
Other employee benefit expenses include EUR 0.1 million recorded as share-based payment from the price difference between the personnel offer-ing and the public offering on the Nasdaq Helsinki main market in 2017, and EUR 0,3 million of share-based compensation recognized as an expense in connection with the redemption of own shares during 2016.
>> Read more about the management’s wages and remuneration in note 5.3.
RENTS AND LEASE COSTSRents and lease costs consist of rental payments for showrooms and office space and related costs such as heating, cleaning and electricity. All Kamux’s lease agreements are classified as oper-ating leases with fixed rental periods and rents are expensed evenly over the rental period. Contracts are either cancellable or fixed-term of 1-10 years.
>> Read more about leasing obligations in note 4.3.
FINANCIAL STATEMENTS
33 KAMUX CORPORATION ANNUAL REPORT 2017 34

2.5 INCOME TAXES 2.6 EARNINGS PER SHARE
EUR million 2017 2016Current tax 3.8 3.7Tax on previous years -0.0 -0.0Change in deferred tax assets and liabilities -0.0 -0.1Total 3.8 3.6 Reconciliation of income tax expense Profit before income tax expense 15.5 14.6Tax calculated at the Finnish tax rate* 3.1 2.9Non-deductible expenses 0.0 0.2Difference in foreign tax rates -0.3 -0.1Tax losses carried forward for which a deferred tax asset has not been recognized 0.9 0.6Other temporary differences for which a deferred tax asset has not been recognized -0.0 0.1Other items - -0.0Income tax expense 3.8 3.6
*Tax rate 20% in 2017 and 2016. >>Read more about deferred tax balances in note 5.5.
2017 2016Profit for the period attributable to owners of the Company (EUR million) 11.7 11.0Weighted average number of shares outstanding during the period, basic, in thousands of shares 38,937 37,566Earnings per share, basic (EUR) 0.30 0.29 Impact of unregistered share issue on number of shares 5 69
Weighted average number of shares outstanding during the period, fully diluted, in thousands of shares 38,941 37,635Earnings per share, fully diluted (EUR) 0.30 0.29
For the year ended December 31,
For the year ended December 31,
ACCOUNTING POLICYIncome taxes for the period include current and deferred taxes. Current income tax is the tax to be paid or received with respects to the current financial year, with the ap-plication of tax rates that have been enacted or substan-tively enacted by the balance sheet date. Current income taxes are calculated on the basis of the tax regulations prevailing in the countries in which Kamux operates and generate taxable income. Current tax also includes ad-justments for current income tax attributable to earlier periods.
Deferred taxes are recognized on temporary differ-ences that arise between the taxable value and carrying value of assets and liabilities. Deferred tax assets are rec-ognized to the extent that it is probable that they will be utilized against taxable income
ACCOUNTING POLICYBasic EPS is calculated by dividing the consolidated profit for the period attributable to the owners of the Company with the weighted average number of shares outstanding during the year excluding the treasury shares.
Diluted EPS is calculated on the same basis as Basic EPS except that it reflects the impact of any potential commitments the Group has to issue shares in the future.
FINANCIAL STATEMENTS
35 KAMUX CORPORATION ANNUAL REPORT 2017 36
3 NET WORKING CAPITAL
INVENTORY
TRADE AND OTHER RECEIVABLES
TRADE AND OTHER PAYABLES
ACCOUNTING POLICYInventory is measured at lower of cost and net realizable value. The cost of an individ-ual car included in the inventory balance is determined using the purchase price for the car including directly attributable repair costs for reconditioning the car for selling purposes.
At each reporting date, a detailed review for net realizable value is executed for cars that have been in inventory for more than 90 days. Any adjustments to net realizable value are recognized as expenses in profit or loss.
SOURCES OF UNCERTAINTY AND MANAGERIAL JUDGMENTSThe estimated selling price of the car (net re-alizable value) at the reporting date is deter-mined based on the managerial judgment, market information and historical data. If the estimated selling price of the car is lower than the cost, the inventory value for the car will be written down.
3.1 INVENTORY
Due to its effective process to acquire used cars, Kamux is able to offer a broad collection of differ-ent car brands at competitive prices. Kamux ac-quires cars from car auctions, leasing companies, other car dealers, finance companies, importers, private persons and other sources. Kamux pur-chases most of the used cars from customers as trade-in cars as part of the used car sale. Inventory is located in different showrooms. Every salesman is able to sell used cars from all Kamux’s show-rooms utilizing the Group-wide inventory informa-tion. Inventory management is well organized and advanced IT-systems are utilized to achieve an op-timal balance between cars in inventory and quick inventory turnover.
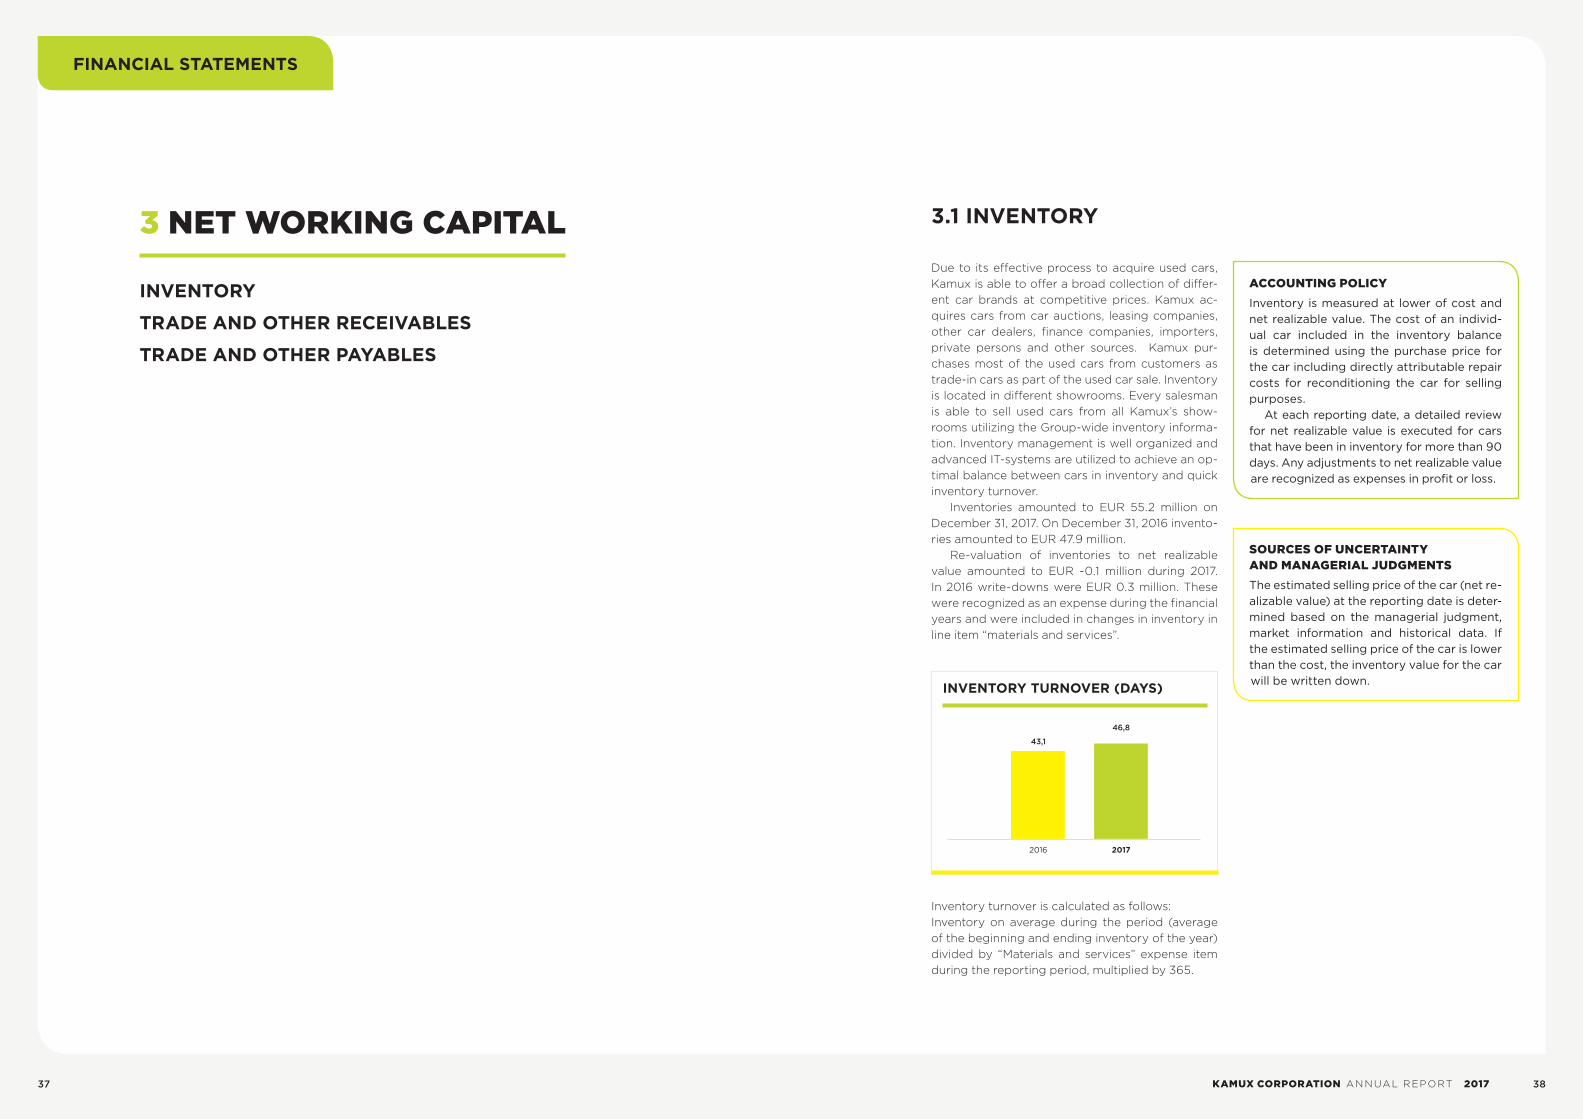
Inventories amounted to EUR 55.2 million on December 31, 2017. On December 31, 2016 invento-ries amounted to EUR 47.9 million.
Re-valuation of inventories to net realizable value amounted to EUR -0.1 million during 2017. In 2016 write-downs were EUR 0.3 million. These were recognized as an expense during the financial years and were included in changes in inventory in line item “materials and services”.
INVENTORY TURNOVER (DAYS)
Inventory turnover is calculated as follows:Inventory on average during the period (average of the beginning and ending inventory of the year) divided by “Materials and services” expense item during the reporting period, multiplied by 365.
43,1
46,8
2016 2017
FINANCIAL STATEMENTS
37 KAMUX CORPORATION ANNUAL REPORT 2017 38

3.2 TRADE AND OTHER RECEIVABLES 3.3 TRADE AND OTHER PAYABLES
EUR million 2017 2016Trade receivables 9.6 7.8Prepaid expenses and accrued income 2.3 1.9Other receivables 1.0 1.8Total 12.9 11.4 Material items included in prepaid expenses and accrued income Insurance and finance commission fees 1.8 1.3Other 0.6 0.6Total 2.3 1.9
EUR million 2017 2016Trade payables* 8.5 5.6Accrued expenses and deferred income 4.8 4.9Other 2.3 1.7Total 15.6 12.3 Material items included in accrued expenses and deferred income Accrued salaries 2.9 2.8Accrued interests 0.0 0.0Other accrued expenses** 1.9 2.1Total 4.8 4.9
At December 31, At December 31,
TRADE RECEIVABLES AND CREDIT RISKTrade receivables consist mainly of receivables from finance companies, with the exception of in-significant amounts of receivables from individual customers to whom Kamux has sold a car with a short-term payment period. Generally, receiva-bles originate when there is a temporary time lag between the approved credit decision (i.e. when revenue is recognized) and a payment is made by the finance company. However, once the finance company has approved the credit application of Kamux’s customer, the credit risk of the car sale is borne by the finance company.
Kamux has a temporary credit risk from finance companies between the approved credit decision and payment. The Company mitigates the credit risk by dealing with highly rated finance company counterparties.
Impairment losses recognized in profit or loss amounted to EUR 0.2 million during the year 2017. In 2016 impairment losses were EUR 0.4 million.
* Trade payables also include short term car financing-related loans transferred to Kamux in connection with the purchases of the trade-in cars of EUR 1.0 million as of December 31, 2017 and EUR 0.9 million as of December 31, 2016. Loans to the finance companies are paid within a short period after the purchase of the car.
** Other accrued expenses relate to deferred revenue from sales of Kamux Plus as of December 31, 2017 and 2016.
Carrying values of trade and other payables correspond to their fair values due to the short-term nature of these payables.
FINANCIAL STATEMENTS
39 KAMUX CORPORATION ANNUAL REPORT 2017 40

4 NET DEBT AND CONTINGENCIES
CAPITAL MANAGEMENT AND NET DEBT
FINANCE COSTS
LEASE OBLIGATIONS AND COMMITMENTS
4.1 CAPITAL MANAGEMENT AND NET DEBT
CAPITAL MANAGEMENTThe Group’s objective when managing capital (net debt and total equity) is to ensure the continuity of its operations and maintain optimal returns to shareholders. Management aims to maintain an op-timal capital and funding structure that ensures the lowest cost of capital available to the Group.
>>Read more about equity in note 5.4.
In order to maintain or adjust its capital structure, the Group may adjust the amount of dividends paid to shareholders or issue new shares. The Group
monitors capital on the basis of net debt and eq-uity. Net debt is calculated as borrowings (“current and non-current borrowings” in the consolidated balance sheet) less cash and cash equivalents.
NET DEBTThe Group borrows money from financial institu-tions in the form of bank loans and bank overdrafts. The Group’s loans have floating interest rates and the Group may use interest rate swaps to limit the interest rate risk related to floating interest rates of the loans.
EUR million 2017 2016Non-current Bank loans 22.4 25.4Total non-current borrowings 22.4 25.4Current Bank loans 3.0 5.0Bank overdrafts - 1.3Total current borrowings 3.0 6.3Total borrowings 25.4 31.7Less cash and cash equivalents -18.1 -0.7Net debt 7.3 30.9
BORROWINGS AND NET DEBT
ACCOUNTING POLICY - BORROWINGS
Bank loans are measured initially at fair val-ue, net of transaction costs. Bank loans are subsequently carried at amortized cost. In-terest expenses and transaction costs are amortized over the term of the loan and recognized as finance cost using an effec-tive interest rate method. Borrowings are derecognized when the loan has been re-paid or liability has been extinguished for example in connection with refinancing.
BORROWINGS AND DERIVATIVESAs of December 31, 2017, borrowings consisted of a EUR 25.4 million five-year term loan, which has semiannual repayments of EUR 1.5 million in March and September. The loans mature on March 31, 2021.
At December 31,
FINANCIAL STATEMENTS
41 KAMUX CORPORATION ANNUAL REPORT 2017 42
ACCOUNTING POLICY - DERIVATIVESFinancial assets and liabilities recorded at fair value through profit and loss consist of derivatives. Derivatives are measured and recognized in the balance sheet according to their fair value at the trade date. Subse-quent fair value changes of open derivatives are recognized directly in the finance income and finance costs in the statement of com-prehensive income. The Group’s derivatives consist of interest rate swaps used to hedge interest rate risk, and foreign exchange de-rivatives to hedge foreign exchange rate risk. These derivatives are not subject to hedge accounting.
Fair values for Kamux’s borrowings are determined by discounting the estimated cash flows to be paid at the market rate of the reporting date, consider-ing the risk premium. Different terms and condi-tions of the loans (maturity, subordination, collat-eral) are taken into account in the measurement. Bank loans are classified as Level 2 in the fair value hierarchy due to the use of unobservable inputs, including Kamux’s own estimates for risk premium.
Derivatives consist of interest rate swaps and foreign exchange forwards. These derivatives are included in Level 2 and their fair value is calculated as the present value of the estimated future cash flows based on observable yield curves. On De-cember 31, 2017 Kamux had no open interest rate swaps. Nominal values of open interest rate swaps was EUR 6.5 million on December 31, 2016. The nominal values of open foreign exchange forwards was EUR 7.2 million on December 31, 2017 and EUR 3.1 million on December 31, 2016.
RISKS ASSOCIATED WITH NET DEBT
Liquidity risk Management of liquidity risk aims at to ensure that Kamux is able to meet its finance obligations. Kamux’s financing requirement is covered by both optimizing of operating activities and external fi-nancing in order to ensure that Kamux has continu-ally sufficient liquidity or has access to an adequate amount of committed credit facilities. Liquidity risks are monitored and managed centrally in the Group’s finance department where the availability of financ-ing is managed daily based on rolling forecasts.
The maturity of financial liabilities is monitored regularly. As of December 31, 2017 Kamux had cash and cash equivalents of EUR 18.1 million and as of December 31, 2016, EUR 0.7 million. In addition, Kamux has access to unused credit facilities and bank overdrafts of EUR 20.0 million as of December 31, 2017 and EUR 6.7 million as of December 31, 2016.
Kamux has entered into a five-year loan facility agreement of EUR 50 million with Nordea Bank AB (publ), Finnish Branch. The facility agreement was amended in April 2017 and it includes a five-year term loan of EUR 30 million and a revolving credit facility of EUR 20 million. Of the revolving credit fa-cility, EUR 10.0 million is available as a multi-currency facility that Kamux entered into in December 2016. The term loan of EUR 30 million is currently repaid in bi-annual installments of EUR 1.5 million. In addition to the revolving facility, Kamux has a lease guarantee facility of EUR 0.4 million.
Loans from the financial institutions include the following covenants: net debt in proportion to ad-justed EBITDA, equity as a portion of the balance sheet total and inventory turnover. The interest mar-gin is variable and depends on the ratio of net debt and adjusted EBITDA. Kamux has given business mortgages amounting to EUR 104.0 million as of December 31, 2017 as a security for the loans from financial institutions. In addition, the Company has given an unlimited general guarantee on behalf of the subsidiaries in Finland, Sweden and Germany and pledged the shares of the Finnish, Swedish and German subsidiaries.
According to specific terms and conditions of the bank loan agreements, the most significant transac-tions require a prior written approval by the financial institution, including ordinary terms and conditions protecting the creditor.
Interest rate risk The Group’s bank loans comprise of long term float-ing rate loans and interest bearing credit limit facili-ties. Due to the Euribor-tied loans, Kamux is subject to the cash flow risk arising from floating rate loans.
To manage the interest rate risk, Kamux uses in-terest rate swaps in order to reduce the cash flow risk arising from floating rate loans. With this course of action, Kamux aims to limit the impact of interest rate volatility in the Group’s finance costs to accept-able levels.
Effective interest rates of bank loans were 1.4%-1.5% at the end of 2017 and 1.4%-1.5% at the end of 2016.
Based on the sensitivity analysis, if interest rates had been 1.0 percentage points higher with all oth-er variables held constant, the recalculated post-tax profit for the period and equity would have been EUR 0.2 million smaller in 2017 and EUR 0.1 million smaller in 2016. Interest rate sensitivity has been calculated by shifting the interest curve by 1.0 per-centage points (due to low market interest environ-ment the lower scenario has not been presented). The interest position includes all external variable rate loans and interest rate swaps.
Foreign exchange riskKamux is mainly exposed to transaction risk related to the Swedish krona and the risk that arises when the parent company’s investments in the Swedish subsidiaries are translated into euros.
Foreign exchange risk relating to Swedish op-erations arises basically from intra-Group finance transactions and trade payables from Swedish sub-sidiaries incurred in operating activities between the Group companies. Foreign exchange risk is not significant for the Group and these items are hedged as needed by using foreign exchange de-rivatives.
The remainder of the Group’s income and ex-
EUR million Less than 3 months 3 months - 1 year 1-2 years 2-3 years 3-4 years 4-5 years More than 5 years
Dec 31, 2017 Loans 1.6 1.7 3.3 3.3 16.6 - -Accounts payables 8.5 - - - - - -Derivatives -0.1 -0.0 - - - - - Dec 31, 2016 Loans 5.0 0.4 0.5 0.5 0.5 27.1 -Accounts payables 5.6 - - - - - -Derivatives -0.0 0.1 - - - - -
Maturity table for financial liabilities
penses are generated almost exclusively in euros. According to the Company’s treasury policy, all in-tercompany financing is issued in the subsidiary’s functional currency.
The Group’s net investment in companies out-side the Eurozone consists of subsidiary invest-ments in Sweden. Foreign exchange risk associat-ed with the net investment is not hedged.
Foreign exchange risk position includes debts denominated in Swedish krona of Group compa-nies and loan receivables from Swedish subsidiar-ies. Krona denominated intra-group items, which are exposed to foreign exchange risk, translated at the rate of the balance sheet date were EUR 9.6 million as of December 31, 2017 and EUR 10.2 mil-lion as of December 31, 2016. Based on the sensi-tivity analysis, if the weakening or strengthening of the Swedish krona against euro had been 10 per-cent, the recalculated post-tax profit for the period and equity would have been EUR 0.7 million in 2017 and EUR 0.7 million in 2016 higher or lower.
Credit and counterparty riskCredit risk refers to the risk that a counterparty will default on its contractual obligations resulting in a financial loss to the Company. Kamux considers all of its material counterparties to be creditworthy as they represent large and well-established financial institutions. Kamux’s exposure to credit risk is con-tinuously monitored, in particular, if agreed pay-ments are delayed.
>>Read more about credit risk related to trade and other receivables in note 3.2.
The credit risk on cash and cash equivalents is lim-ited because the counterparties are banks with high credit-ratings assigned by international cred-it-rating agencies. To spread the credit risk, Kamux deposits its cash reserves with different banks.
FINANCIAL STATEMENTS
43 KAMUX CORPORATION ANNUAL REPORT 2017 44
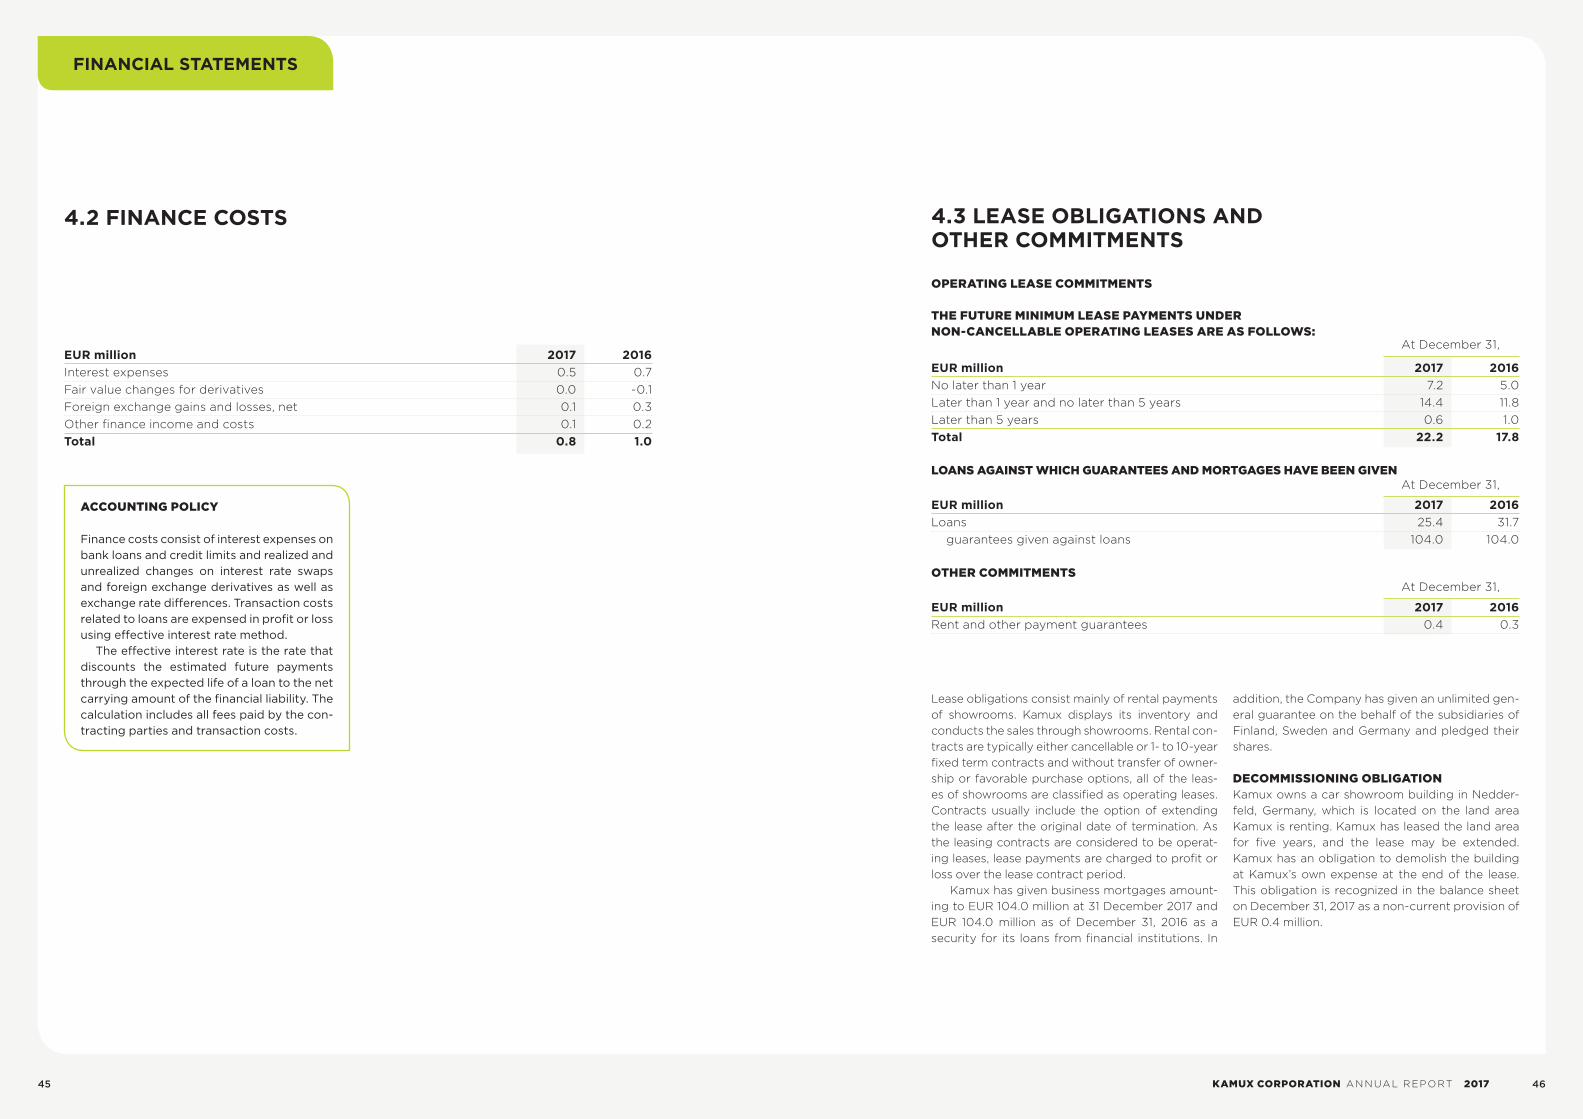
4.2 FINANCE COSTS 4.3 LEASE OBLIGATIONS AND OTHER COMMITMENTS
EUR million 2017 2016Interest expenses 0.5 0.7Fair value changes for derivatives 0.0 -0.1Foreign exchange gains and losses, net 0.1 0.3Other finance income and costs 0.1 0.2Total 0.8 1.0
ACCOUNTING POLICY
Finance costs consist of interest expenses on bank loans and credit limits and realized and unrealized changes on interest rate swaps and foreign exchange derivatives as well as exchange rate differences. Transaction costs related to loans are expensed in profit or loss using effective interest rate method.
The effective interest rate is the rate that discounts the estimated future payments through the expected life of a loan to the net carrying amount of the financial liability. The calculation includes all fees paid by the con-tracting parties and transaction costs.
EUR million 2017 2016No later than 1 year 7.2 5.0Later than 1 year and no later than 5 years 14.4 11.8Later than 5 years 0.6 1.0Total 22.2 17.8 LOANS AGAINST WHICH GUARANTEES AND MORTGAGES HAVE BEEN GIVEN EUR million 2017 2016Loans 25.4 31.7
guarantees given against loans 104.0 104.0 OTHER COMMITMENTS EUR million 2017 2016Rent and other payment guarantees 0.4 0.3
OPERATING LEASE COMMITMENTS
THE FUTURE MINIMUM LEASE PAYMENTS UNDER NON-CANCELLABLE OPERATING LEASES ARE AS FOLLOWS:
At December 31,
At December 31,
Lease obligations consist mainly of rental payments of showrooms. Kamux displays its inventory and conducts the sales through showrooms. Rental con-tracts are typically either cancellable or 1- to 10-year fixed term contracts and without transfer of owner-ship or favorable purchase options, all of the leas-es of showrooms are classified as operating leases. Contracts usually include the option of extending the lease after the original date of termination. As the leasing contracts are considered to be operat-ing leases, lease payments are charged to profit or loss over the lease contract period.
Kamux has given business mortgages amount-ing to EUR 104.0 million at 31 December 2017 and EUR 104.0 million as of December 31, 2016 as a security for its loans from financial institutions. In
addition, the Company has given an unlimited gen-eral guarantee on the behalf of the subsidiaries of Finland, Sweden and Germany and pledged their shares.
DECOMMISSIONING OBLIGATIONKamux owns a car showroom building in Nedder-feld, Germany, which is located on the land area Kamux is renting. Kamux has leased the land area for five years, and the lease may be extended. Kamux has an obligation to demolish the building at Kamux’s own expense at the end of the lease. This obligation is recognized in the balance sheet on December 31, 2017 as a non-current provision of EUR 0.4 million.
At December 31,
FINANCIAL STATEMENTS
45 KAMUX CORPORATION ANNUAL REPORT 2017 46

5 OTHER NOTES
GROUP STRUCTURE AND CONSOLIDATION
INTANGIBLE ASSETS AND PROPERTY, PLANT AND EQUIPMENT
RELATED PARTY TRANSACTIONS
SHARE CAPITAL AND RESERVES
DEFERRED TAXES
EVENTS AFTER THE REPORTING DATE
NEW AND FORTHCOMING IFRS STANDARDS
5.1 GROUP STRUCTURE AND CONSOLIDATION
SUBSIDIARIES The consolidated financial statements include parent company and its subsidiaries. Subsidiaries refers to entities of which Kamux Group has con-trol. Control exists, when the Group is exposed, or has rights, to variable returns from its involvement with the investee and has the ability to affect those returns through its power over the investee. Sub-
sidiaries are consolidated from the date of acqui-sition, being the date on which the Group obtains control or if the subsidiaries have been founded by the Company, from the date of the inception of the subsidiary. Subsidiaries are consolidated until the date that control ceases.
Group’s subsidiaries as of December 31, 2017 and December 31, 2016 were as follows:
Intra-Group receivables and liabilities, income or expenses and unrealized profits or losses arising from Intra-Group transactions between the Group companies and intra-Group profit sharing are elim-inated in their entirety when preparing the consol-idated accounts.
Assets and liabilities in Swedish subsidiaries are translated into euro at the rate prevailing on the bal-ance sheet date. Income and expenses in Swedish subsidiaries are translated into euro using an av-erage rate. Translation differences that arise when translating the financial statements of subsidiaries
are recognized in other comprehensive income and accumulated in a separate component of equity, called translation differences.
Foreign currency denominated transactions are translated into the functional currency using the ex-change rates prevailing at the dates of the transac-tions or if items have been revalued, at the measure-ment dates exchange rates. Foreign exchange gains and losses arising in respect of business operations, such as sales and purchases, are recognized in EBIT. Foreign exchange differences arising from financing transactions are recognized in finance costs.
Parent company Principal activitiesKamux Corporation Finland Holding company Subsidiaries Kamux Suomi Oy Finland 100 Sales of used carsSuomen Autorahaksi Oy Finland 100 Dormant companyKMX Holding AB Sweden 100 Holding companyKamux AB Sweden 100 Sales of used carsKamux Auto GmbH Germany 100 Sales of used cars
Country of incorporation
Parent and Group ownership (%)
Subsidiaries have share capital consisting solely of ordinary shares that are held directly by the Group, and the proportion of ownership interests equals the voting rights held by the Group. The country of in-corporation of registration is also their principal place of business.
FINANCIAL STATEMENTS
47 KAMUX CORPORATION ANNUAL REPORT 2017 48

5.2 INTANGIBLE ASSETS AND PROPERTY, PLANT AND EQUIPMENT
GOODWILLGoodwill is an intangible asset with indefinite useful life.Goodwill in the balance sheet formed when the parent company, a company established by Intera Fund II Ky, acquired Kamux Oy and its subsidiaries on December 7, 2011. The amount of goodwill was EUR 13.6 million as of December 31, 2017 and 2016. Goodwill is entirely allocated to the operating seg-ment of Finland.
The Group performs impairment tests annually. The recoverable amount of goodwill related to Fin-land is based on fair value less costs of disposal (FV-LCD), which is determined using a discounted cash flow model. Key estimates used to determine the recoverable amount include sales growth rate, cost development and the post-tax discount rate. Inputs used in the discounted cash flow model are inputs that are not based on observable market data (Level 3 inputs). Calculations are based on 5 years’ cash flow projections approved by the management. Long-term growth rate was estimated to be 1% and post-tax discount rate was defined at 9.0% (2016 10.4%). In addition, management reviews observable market data of comparable entities, for example, EBITDA multiples to assess whether there is a significant dif-ference between FLVCD of the group of CGUs tested and comparable entities market data, which would require Kamux to make changes to the assumptions used in goodwill impairment testing.
As part of the performance review, management has performed sensitivity analyses around the key parameters and the result suggests that a situation in which the carrying value of goodwill and other assets under impairment testing would exceed the recover-able amount is unlikely. Changed parameters used in the sensitivity analyses for 2017 and 2016 impair-ment testing were:
• 20% decrease in the annual sales growth rate• 20% decrease in EBIT margin of the financial year• Long term growth rate of 0%• Post-tax discount rate of 15%
The sensitivity analyses did not indicate impair-ment when the parameters above were changed one at a time or all at the same time.
OTHER INTANGIBLE ASSETSKamux has capitalized development costs and in-tangible rights related to different IT systems as other intangible assets. Kamux has invested in a tai-lor-made CRM system which is one of the key ena-blers of Kamux’s effective selling process and cost efficient inventory management. Microsoft Ax is a system for enterprise resource planning (ERP) and accounting, and it connects Kamux’s inventory man-agement and accounting. In 2016, Kamux invested in Basware’s FPM system, which was implemented in the beginning of 2017. The capitalized costs con-sist of external service provider invoices and license fees.
ACCOUNTING POLICY – GOODWILL AND OTHER INTANGIBLE ASSETSGoodwill is an intangible asset with indefinite useful life. Goodwill is not amortized but test-ed for impairment at least annually, or when-ever there is an indication that its carrying val-ue would not be recoverable.
Management has determined that each showroom represents a separate cash gen-erating unit (CGU). The impairment review is carried out for the group of cash generating units representing the geographical area of Finland which is the level at which goodwill is monitored by management (read more in Sources of uncertainty and managerial judge-ments – Goodwill).
Other intangible assets, which are sepa-rately identifiable and can be sold separately comprise development costs of IT software and intangible rights. Other intangible assets are amortized on a straight-line basis over the estimated useful life of 3 years.
SOURCES OF UNCERTAINTY AND MANAGERIAL JUDGMENTS - GOODWILLManagement makes significant estimates and judgments in determining the level at which the goodwill is tested and whether there are any indications of impairment.
The goodwill in the Kamux’s balance sheet arose in December 2011 when the par-ent company, a company established by In-tera Fund II Ky, acquired Kamux Oy and its subsidiaries. At the time of the acquisition, Kamux operated in Finland through five subsidiaries, including 16 showrooms. The Management views that the excess of the purchase price over the acquired net as-sets was paid for the business and business concept as a whole and therefore considers that goodwill should be tested at the level of group of CGU’s which is Finland.
The forecasted cash flows are based on the Group’s past performance and manage-ment’s best estimate of future sales, cost de-velopment, general market conditions and applicable income tax rates.
Management tests the effects of changes to significant estimates used in forecasts by sensitivity analyses in a way described in the section “Goodwill”.
PROPERTY, PLANT AND EQUIPMENT Property, plant and equipment comprise of office furniture, machinery and equipment and capital-ized renovation as well as modernization expenses which are depreciated on a straight line basis over the estimated useful life of 3-5 years. Property, plant and equipment also includes the car show-room building in Nedderfeld, Germany, which was acquired in 2016.
FINANCIAL STATEMENTS
49 KAMUX CORPORATION ANNUAL REPORT 2017 50
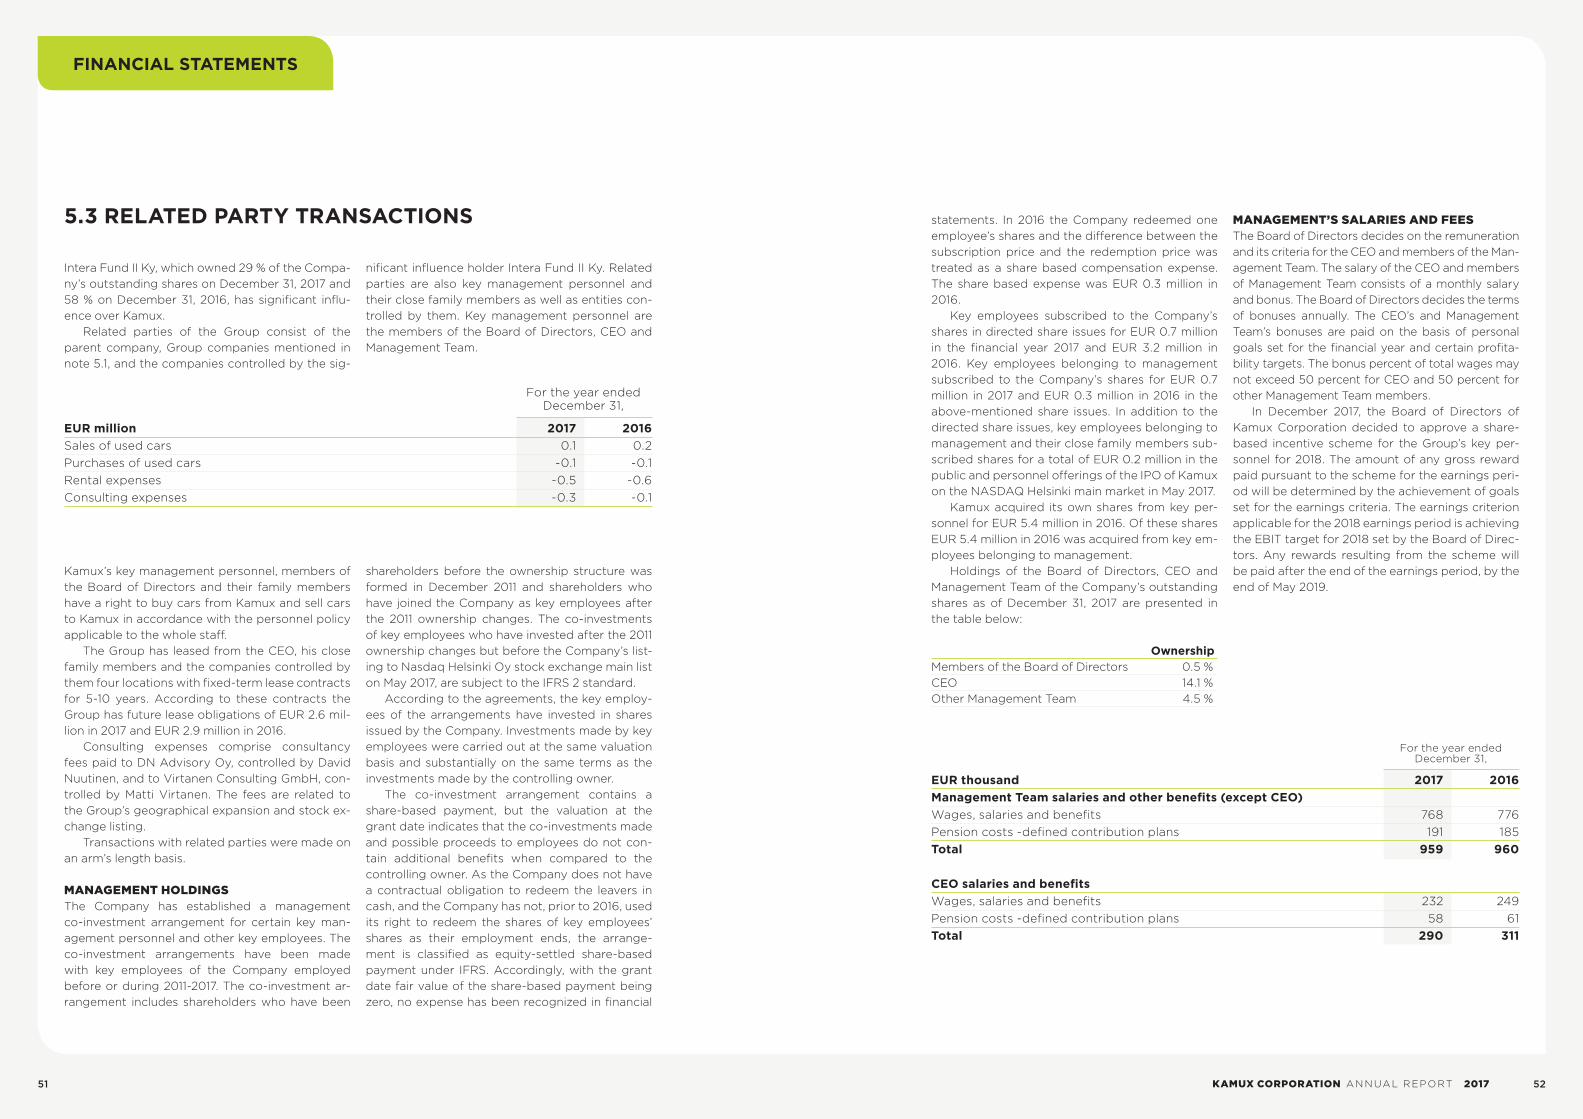
5.3 RELATED PARTY TRANSACTIONS
Intera Fund II Ky, which owned 29 % of the Compa-ny’s outstanding shares on December 31, 2017 and 58 % on December 31, 2016, has significant influ-ence over Kamux.
Related parties of the Group consist of the parent company, Group companies mentioned in note 5.1, and the companies controlled by the sig-
nificant influence holder Intera Fund II Ky. Related parties are also key management personnel and their close family members as well as entities con-trolled by them. Key management personnel are the members of the Board of Directors, CEO and Management Team.
Kamux’s key management personnel, members of the Board of Directors and their family members have a right to buy cars from Kamux and sell cars to Kamux in accordance with the personnel policy applicable to the whole staff.
The Group has leased from the CEO, his close family members and the companies controlled by them four locations with fixed-term lease contracts for 5-10 years. According to these contracts the Group has future lease obligations of EUR 2.6 mil-lion in 2017 and EUR 2.9 million in 2016.
Consulting expenses comprise consultancy fees paid to DN Advisory Oy, controlled by David Nuutinen, and to Virtanen Consulting GmbH, con-trolled by Matti Virtanen. The fees are related to the Group’s geographical expansion and stock ex-change listing.
Transactions with related parties were made on an arm’s length basis.
MANAGEMENT HOLDINGSThe Company has established a management co-investment arrangement for certain key man-agement personnel and other key employees. The co-investment arrangements have been made with key employees of the Company employed before or during 2011-2017. The co-investment ar-rangement includes shareholders who have been
shareholders before the ownership structure was formed in December 2011 and shareholders who have joined the Company as key employees after the 2011 ownership changes. The co-investments of key employees who have invested after the 2011 ownership changes but before the Company’s list-ing to Nasdaq Helsinki Oy stock exchange main list on May 2017, are subject to the IFRS 2 standard.
According to the agreements, the key employ-ees of the arrangements have invested in shares issued by the Company. Investments made by key employees were carried out at the same valuation basis and substantially on the same terms as the investments made by the controlling owner.
The co-investment arrangement contains a share-based payment, but the valuation at the grant date indicates that the co-investments made and possible proceeds to employees do not con-tain additional benefits when compared to the controlling owner. As the Company does not have a contractual obligation to redeem the leavers in cash, and the Company has not, prior to 2016, used its right to redeem the shares of key employees’ shares as their employment ends, the arrange-ment is classified as equity-settled share-based payment under IFRS. Accordingly, with the grant date fair value of the share-based payment being zero, no expense has been recognized in financial
EUR million 2017 2016Sales of used cars 0.1 0.2Purchases of used cars -0.1 -0.1Rental expenses -0.5 -0.6Consulting expenses -0.3 -0.1
EUR thousand 2017 2016Management Team salaries and other benefits (except CEO) Wages, salaries and benefits 768 776Pension costs -defined contribution plans 191 185Total 959 960 CEO salaries and benefits Wages, salaries and benefits 232 249Pension costs -defined contribution plans 58 61Total 290 311
For the year ended December 31,
For the year ended December 31,
statements. In 2016 the Company redeemed one employee’s shares and the difference between the subscription price and the redemption price was treated as a share based compensation expense. The share based expense was EUR 0.3 million in 2016.
Key employees subscribed to the Company’s shares in directed share issues for EUR 0.7 million in the financial year 2017 and EUR 3.2 million in 2016. Key employees belonging to management subscribed to the Company’s shares for EUR 0.7 million in 2017 and EUR 0.3 million in 2016 in the above-mentioned share issues. In addition to the directed share issues, key employees belonging to management and their close family members sub-scribed shares for a total of EUR 0.2 million in the public and personnel offerings of the IPO of Kamux on the NASDAQ Helsinki main market in May 2017.
Kamux acquired its own shares from key per-sonnel for EUR 5.4 million in 2016. Of these shares EUR 5.4 million in 2016 was acquired from key em-ployees belonging to management.
Holdings of the Board of Directors, CEO and Management Team of the Company’s outstanding shares as of December 31, 2017 are presented in the table below:
Ownership
Members of the Board of Directors 0.5 %CEO 14.1 %Other Management Team 4.5 %
MANAGEMENT’S SALARIES AND FEESThe Board of Directors decides on the remuneration and its criteria for the CEO and members of the Man-agement Team. The salary of the CEO and members of Management Team consists of a monthly salary and bonus. The Board of Directors decides the terms of bonuses annually. The CEO’s and Management Team’s bonuses are paid on the basis of personal goals set for the financial year and certain profita-bility targets. The bonus percent of total wages may not exceed 50 percent for CEO and 50 percent for other Management Team members.
In December 2017, the Board of Directors of Kamux Corporation decided to approve a share-based incentive scheme for the Group’s key per-sonnel for 2018. The amount of any gross reward paid pursuant to the scheme for the earnings peri-od will be determined by the achievement of goals set for the earnings criteria. The earnings criterion applicable for the 2018 earnings period is achieving the EBIT target for 2018 set by the Board of Direc-tors. Any rewards resulting from the scheme will be paid after the end of the earnings period, by the end of May 2019.
FINANCIAL STATEMENTS
51 KAMUX CORPORATION ANNUAL REPORT 2017 52
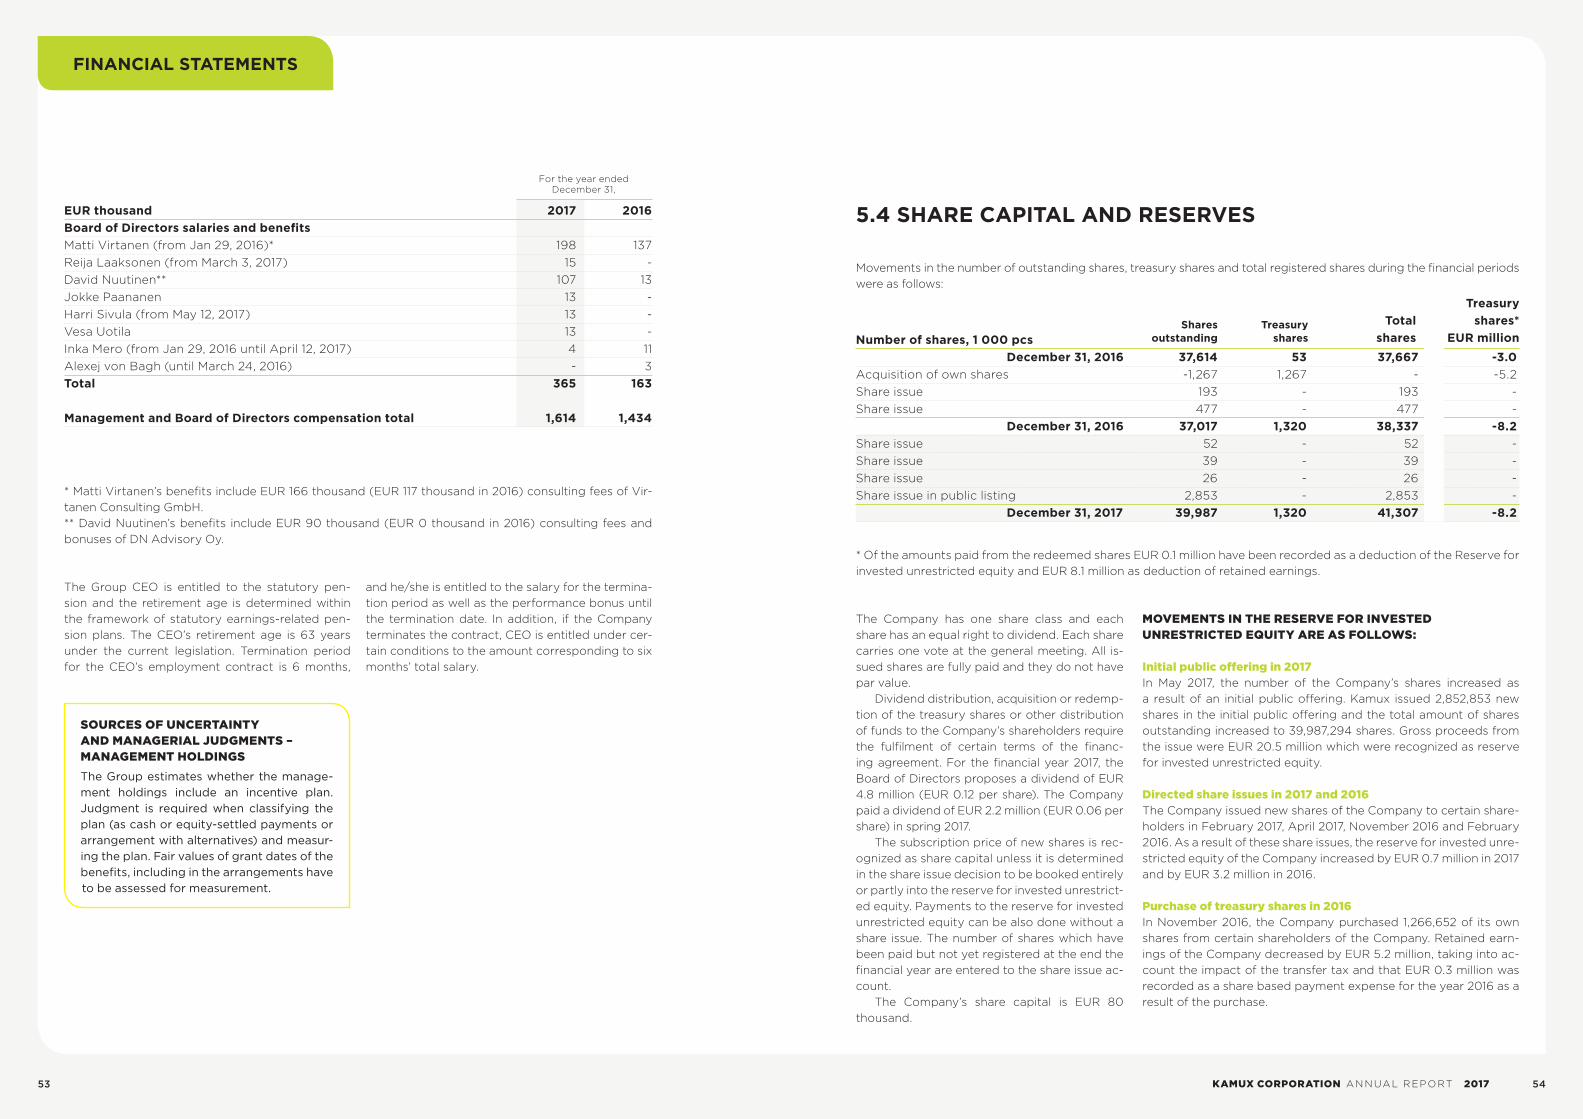
EUR thousand 2017 2016Board of Directors salaries and benefits Matti Virtanen (from Jan 29, 2016)* 198 137Reija Laaksonen (from March 3, 2017) 15 -David Nuutinen** 107 13Jokke Paananen 13 -Harri Sivula (from May 12, 2017) 13 -Vesa Uotila 13 -Inka Mero (from Jan 29, 2016 until April 12, 2017) 4 11Alexej von Bagh (until March 24, 2016) - 3Total 365 163 Management and Board of Directors compensation total 1,614 1,434
For the year ended December 31,
* Matti Virtanen’s benefits include EUR 166 thousand (EUR 117 thousand in 2016) consulting fees of Vir-tanen Consulting GmbH.** David Nuutinen’s benefits include EUR 90 thousand (EUR 0 thousand in 2016) consulting fees and bonuses of DN Advisory Oy.
The Group CEO is entitled to the statutory pen-sion and the retirement age is determined within the framework of statutory earnings-related pen-sion plans. The CEO’s retirement age is 63 years under the current legislation. Termination period for the CEO’s employment contract is 6 months,
and he/she is entitled to the salary for the termina-tion period as well as the performance bonus until the termination date. In addition, if the Company terminates the contract, CEO is entitled under cer-tain conditions to the amount corresponding to six months’ total salary.
MOVEMENTS IN THE RESERVE FOR INVESTED UNRESTRICTED EQUITY ARE AS FOLLOWS:
Initial public offering in 2017In May 2017, the number of the Company’s shares increased as a result of an initial public offering. Kamux issued 2,852,853 new shares in the initial public offering and the total amount of shares outstanding increased to 39,987,294 shares. Gross proceeds from the issue were EUR 20.5 million which were recognized as reserve for invested unrestricted equity.
Directed share issues in 2017 and 2016The Company issued new shares of the Company to certain share-holders in February 2017, April 2017, November 2016 and February 2016. As a result of these share issues, the reserve for invested unre-stricted equity of the Company increased by EUR 0.7 million in 2017 and by EUR 3.2 million in 2016.
Purchase of treasury shares in 2016In November 2016, the Company purchased 1,266,652 of its own shares from certain shareholders of the Company. Retained earn-ings of the Company decreased by EUR 5.2 million, taking into ac-count the impact of the transfer tax and that EUR 0.3 million was recorded as a share based payment expense for the year 2016 as a result of the purchase.
SOURCES OF UNCERTAINTY AND MANAGERIAL JUDGMENTS – MANAGEMENT HOLDINGSThe Group estimates whether the manage-ment holdings include an incentive plan. Judgment is required when classifying the plan (as cash or equity-settled payments or arrangement with alternatives) and measur-ing the plan. Fair values of grant dates of the benefits, including in the arrangements have to be assessed for measurement.
5.4 SHARE CAPITAL AND RESERVES
Movements in the number of outstanding shares, treasury shares and total registered shares during the financial periods were as follows:
* Of the amounts paid from the redeemed shares EUR 0.1 million have been recorded as a deduction of the Reserve for invested unrestricted equity and EUR 8.1 million as deduction of retained earnings.
Number of shares, 1 000 pcs December 31, 2016 37,614 53 37,667 -3.0
Acquisition of own shares -1,267 1,267 - -5.2Share issue 193 - 193 -Share issue 477 - 477 -
December 31, 2016 37,017 1,320 38,337 -8.2Share issue 52 - 52 -Share issue 39 - 39 -Share issue 26 - 26 -Share issue in public listing 2,853 - 2,853 -
December 31, 2017 39,987 1,320 41,307 -8.2
Shares outstanding
Treasury
sharesTotal
shares
Treasury shares*
EUR million
The Company has one share class and each share has an equal right to dividend. Each share carries one vote at the general meeting. All is-sued shares are fully paid and they do not have par value.
Dividend distribution, acquisition or redemp-tion of the treasury shares or other distribution of funds to the Company’s shareholders require the fulfilment of certain terms of the financ-ing agreement. For the financial year 2017, the Board of Directors proposes a dividend of EUR 4.8 million (EUR 0.12 per share). The Company paid a dividend of EUR 2.2 million (EUR 0.06 per share) in spring 2017.
The subscription price of new shares is rec-ognized as share capital unless it is determined in the share issue decision to be booked entirely or partly into the reserve for invested unrestrict-ed equity. Payments to the reserve for invested unrestricted equity can be also done without a share issue. The number of shares which have been paid but not yet registered at the end the financial year are entered to the share issue ac-count.
The Company’s share capital is EUR 80 thousand.
FINANCIAL STATEMENTS
53 KAMUX CORPORATION ANNUAL REPORT 2017 54

5.5 DEFERRED TAX
EUR million2017
Deferred tax assets Provisions and accrued expenses 0.3 0.0 0.3Derivative instruments 0.0 -0.0 -Depreciation and amortization - 0,0 0,0Total 0.3 0.0 0.3 Deferred tax liabilities Loans from financial institutions 0.0 -0.0 0.0Total 0.0 -0.0 0.0Total net 0.3 0.0 0.3
2016 Deferred tax assets Provisions and accrued expenses 0.2 0.1 0.3Derivative instruments 0.0 - 0.0Total 0.2 0.1 0.3 Deferred tax liabilities Loans from financial institutions 0.0 0.0 0.0Total 0.0 0.0 0.0Total net 0.2 0.1 0.3
January 1,Recognized through
profit or loss December 31,
Deferred tax assets and liabilities are offset only when there is a legally enforceable right to offset current tax assets against current tax liabilities and when the deferred taxes relate to the taxes collected by the same fiscal authority. In Sweden, the Group had unused tax losses EUR 4.9 million as of December 31, 2017 and EUR 4.0 million as of December 31, 2016 and in Germany the Group had unused tax losses EUR 3.2 million as of December 31, 2017 and EUR 0.9 million as of December 31, 2016, for which no deferred tax asset has been recognized due to the operating losses of the early phase of operations. These losses will not expire under the current tax regulations.
ACCOUNTING POLICY – DEFERRED TAX BALANCES
Deferred tax is recognized on temporary differ-ences arising between the tax bases of assets and liabilities and their carrying amounts in the consolidated financial statements. Deferred tax is determined using tax rates (and laws) that have been enacted or substantively enacted by the balance sheet date and are expected to ap-ply when the related deferred tax asset is real-ized or the deferred tax liability is settled.
Deferred tax liabilities are recognized for all taxable temporary differences, except for de-ferred tax liability where the timing of the rever-sal of the temporary difference is controlled by the Group and it is probable that the temporary difference will not reverse in the foreseeable
future. Deferred tax assets are recognized on deductible temporary differences only to the extent that it is probable the temporary differ-ence will reverse in the future and there is suffi-cient taxable profit available against which the temporary difference can be utilized.
Deferred tax assets and liabilities are offset when there is a legally enforceable right to off-set current tax assets against current tax liabil-ities and when the deferred taxes assets and liabilities relate to income taxes levied by the same taxation authority on either the same tax-able entity or different taxable entities where there is an intention to settle the balances on a net basis.
5.6 EVENTS AFTER THE REPORTING DATE
Kamux appointed M.Sc. (Pol), Mikko-Heikki Inker-oinen as Chief Digital Officer (CDO) and member of the Management Team. Mr. Inkeroinen is re-sponsible for the Company’s digital business de-velopment, end-to-end customer experience and marketing. Mr. Inkeroinen joined Kamux from Pow-er International AS, where he was Head of Digital Commerce. Mr. Inkeroinen is an expert in consumer and digital businesses, and his task is to develop Kamux’s digital services and customer experience
in line with our strategy. Mr. Inkeroinen started in his position on February 24, 2018.
At the beginning of 2018, Robin Toss started as the Country Director of Sweden and Oliver Michels as the Country Director of Germany.
On January 2, Kamux opened a showroom in newer, larger premises in Jönköping in Sweden. Kamux opened its 42nd showroom in Finland in Savonlinna in February 2018.
FINANCIAL STATEMENTS
55 KAMUX CORPORATION ANNUAL REPORT 2017 56
5.7 NEW AND FORTHCOMING IFRS STANDARDS
Kamux has not yet applied the following new and amended standards and interpretations already is-sued but not endorsed by the European Union. The Group will adopt them as of the effective date or, if the date is other than the first day of the financial year, from the beginning of the subsequent finan-cial year.
IFRS 9 Financial instruments and associated amendments to various other standardsIFRS 9 “Financial Instruments” replaces the multi-ple classification and measurement models in IAS 39 and it will bring changes to classification and measurement of financial assets their impairment assessment hedge accounting.
A debt instrument is measured at amortized cost only if the objective of the business model is to hold the financial asset for the collection of the contractual cash flows, and the contractual cash flows under the instrument solely represent payments of principal and interest. All other debt and equity instruments, including investments in complex debt instruments and equity investments, must be recognized at fair value.
All fair value movements on financial assets are taken through the statement of profit or loss, ex-cept for equity investments that are not held for trading, which may be recorded in the statement of profit or loss or in reserves (without subsequent recycling to profit or loss). In addition debt instru-ments can be classified at fair value through other comprehensive income according to entity’s busi-ness model.
According to the analysis prepared by Kamux, the adoption of IFRS 9 does not have a significant impact on the classification of its financial assets due to the fact that the Company does not have investments in securities or bonds at the moment.
Impairment of financial asset will be based on new expected credit loss method. The significant financial assets of Kamux are trade receivables arising from normal business operations. For these trade receivables the group will apply a simplified provision matrix approach that is permitted by the standard. According to this approach, a loss is rec-
ognized by using the provision matrix, except for situations where financial assets are assessed to be impaired due to credit risk. The Group does not expect the adoption of the new credit loss method to have a significant impact due to the historically small amount of credit losses.
The new hedge accounting rules align hedge accounting more closely with common risk man-agement practices.
The Group does not expect the amendments to increase applying hedge accounting in the Group, but as a general rule, it will be easier to apply hedge accounting going forward due to inter alia only prospective effectiveness assessment is re-quired and the risk component can be designated as a hedged item.
The new standard also introduces expanded disclosure requirements and changes in presenta-tion. IFRS 9 is effective from January 1, 2018, which is also the initial application date for Kamux Group.
IFRS 15 Revenue from Contracts with Customers and associated amendments to various other standardsA new standard for the recognition of revenue, IFRS 15 Revenue from Contracts with Custom-ers, will replace IAS 18, which covers contracts for goods and services and IAS 11, which covers con-struction contracts. The new standard includes a five-step model, by which sales revenue is recog-nized when control of a good or service is trans-ferred to a customer. Revenue is recognized in an amount that reflects the consideration to which the entity expects to be entitled in exchange for those goods or services.
The Company has prepared an assessment about the effects of the adoption of IFRS 15 standard.
Kamux’s business consists of retail and whole-sale sales of used cars and integrated services sold to consumer and corporate customers. These goods and services have been identified in accord-ance with IFRS 15 as separate performance obli-gations.
In accordance with the Group’s assessment, the adoption of the standard will have an effect on the
different streams of net sales as follows:In the sales of used cars, the customer obtains
control over the sold product at the time of deliv-ery of the car and the adoption of the standard does not have a material effect on the timing of obtaining control.
Regarding Kamux Plus -service which extends the seller’s statutory liability for defects the adop-tion of the standard is assessed to have no material effect.
The analysis prepared by the Group shows that, in both under the present and new standard, the Group operates as an agent towards the customer regarding the finance and insurance products from third parties. Kamux shows the income derived from the sales of third-party finance and insurance products as net amount in its net sales at the time it has fulfilled its obligations from providing the services. In accordance with the Group’s assess-ment, the adoption of the new standard does not have material effects on the variable contingencies derived from sales of third party finance services.
The management assesses that the adoption of the new standard will not have a material effect on the consolidated financial statements regarding the timing or amount of net sales to be recognized. However, adoption of the standard may have an effect on the consolidated financial statements through the new disclosure requirements.
The standard is effective for accounting pe-riods beginning on or after January 1, 2018. The Group plans to adopt the IFRS 15 standard on Jan-uary 1, 2018 by using the method of retrospective application. Adoption of the standard will increase the amount of disclosures.
IFRS 16 Leases and associated amendments to various other standardsIFRS 16 will primarily affect accounting of lessees and will result in the recognition of almost all leas-es on the balance sheet. The standard removes the current distinction between operating and financ-ing leases and requires recognition of an asset (the right to use the leased item) and a financial liabil-ity to pay rentals for virtually all lease contracts. An optional exemption exists for short-term and low-value leases.
Currently, future lease payments are presented in the notes as operating lease commitments at their nominal value. The currently reported operat-
ing lease commitments of Kamux totaled EUR 22.2 million (see Note 4.3.) on December 31, 2017.
Kamux’s statement of comprehensive income will also be affected, because in the new method the total expense is typically higher in the earlier years of a lease and lower in later years. Additional-ly, lease payment in operating expenses will be re-placed with interest and depreciation, so key met-rics like EBITDA and operating profit will change.
Operating cash flow will be higher, as cash pay-ments for the principal portion of the lease liability are classified within financing activities. Only that part of the payments which reflects interest can continue to be presented as operating cash flow. Kamux has prepared a preliminary assessment of the total effects of adopting IFRS 16 standard in its consolidated financial statements and will update this assessment during 2018. Taking into consid-eration that Kamux has leased many showrooms and office premises from third parties for peri-ods longer than one year and by cancellable con-tracts, the standard will have a significant effect on Kamux’s consolidated financial statements. Kamux expects that the amount of leased assets and cor-respondent lease liabilities will increase significant-ly. In addition, the related rental costs are classified as depreciation and finance costs.
The standard is effective for accounting peri-ods beginning on or after January 1, 2019. Kamux will adopt the standard on its effective date.
FINANCIAL STATEMENTS
57 KAMUX CORPORATION ANNUAL REPORT 2017 58

PARENT COMPANY FINANCIAL STATEMENTS
PARENT COMPANY INCOME STATEMENT (FAS)
EUR million 2017 2016 REVENUE 3.0 2.4Other operating income - 0.0
Personnel expenses
Salaries and fees -1.1 -0.8
Social security expenses
Pension expenses -0.2 -0.2
Other social security expenses -0.0 -0.0
Total personnel expenses -1.3 -1.0 Depreciation and amortization
Depreciation and amortization according to plan -0.0 -0.0
Other operating expenses -4.4 -3.0 Total expenses -5.7 -4.0
OPERATING PROFIT -2.7 -1.7
Financial income and expenses
Interest and other financial income
From Group companies 2.4 1.3
From other 1.0 0.2
Total 3.4 1.5
Interest and other financial expenses
To Group companies - -0.1
To other -1.6 -1.2
Total -1.6 -1.3
Total financial income and expenses 1.7 0.2
LOSS BEFORE APPROPRIATIONS AND TAXES -0.9 -1.4
Appropriations
Group contributions received 14.5 18.7
Total appropriations 14.5 18.7
Direct taxes -2.7 -3.5
PROFIT FOR THE FINANCIAL YEAR 10.9 13.8
For the year ended December 31,
FINANCIAL STATEMENTS
59 KAMUX CORPORATION ANNUAL REPORT 2017 60

PARENT COMPANY BALANCE SHEET (FAS)
EUR million 2017 2016
ASSETS
NON-CURRENT ASSETS
Intangible assets
Intangible rights 0.1 0.0
Total 0.1 0.0Investments
Investments in subsidiaries 29.2 26.2
Total 29.2 26.2
CURRENT ASSETS
Non-current receivable
Non-current receivables from Group companies 33.9 14.2
Total 33.9 14.2
Current receivables
Receivables from Group companies 33.2 34.0
Other receivables 0.1 0.2
Prepaid expenses and accrued income 0.1 0.0
Total 33.4 34.3Cash at hand and in banks 17.4 0.0
TOTAL ASSETS 114.1 74.7
EUR million 2017 2016
LIABILITIES AND EQUITY
Equity
Share capital 0.1 0.1
Invested non-restricted equity reserve 25.2 4.1
Retained earnings 23.3 11.8
Profit for the year 10.9 13.8
Total 59.5 29.7Liabilities
Non-current liabilities
Loans from financial institutions 22.5 25.5
Derivatives - 0.1
Liabilities to Group companies 4.7 4.8
Current liabilities
Interest-bearing
Loans from financial institutions 3.0 6.3
Liabilities to Group companies 23.6 3.3
Non-interest-bearing
Trade payables 0.2 0.2
Liabilities to Group companies 0.2 1.0
Other current liabilities 0.0 0.0
Accrued expenses and deferred income 0.3 3.7
Total 54.6 45.0
TOTAL LIABILITIES AND EQUITY 114.1 74.7
At December 31, At December 31,
FINANCIAL STATEMENTS
61 KAMUX CORPORATION ANNUAL REPORT 2017 62

PARENT COMPANY CASH FLOW STATEMENT (FAS)
EUR million 2017 2016
Profit for the financial year 10.9 13.8
Adjustments:
Financial income and expenses -1.7 -0.2
Group contributions received -14.5 -18.7
Depreciation and amortization 0.0 0.0
Direct taxes 2.7 3.5
Change in net working capital:
Change in trade and other receivables 0.0 -0.2
Change in trade and other payables -0.7 0.7
Interests paid and payments on other operating expenses -0.6 -0.8
Interests received 0.0 0.0
Taxes paid -6.1 -2.7
Net cash from/in operating activities (A) -10.0 -4.7
Payments for property, plant and equipment and intangible assets (-) -0.0 -0.0
Investments in subsidiaries -3.0 -0.5
Net cash from/in investing activities (B) -3.1 -0.5
Repayments of bank loans -6.3 -29.4
Proceeds from bank loans - 40.6
Net change of intra-group receivables and payables 17.9 -2.4
Dividends paid -2.2 -1.5
Purchase of treasury shares - -5.5
Proceeds from share issues 21.1 3.2
Net cash from/in financing activities (C) 30.5 5.0
Change in cash (A+B+C) 17.4 -0.2
Cash at hand and in bank at the beginning of the financial year 0.0 0.2
Cash at hand and in bank at the end of the financial year 17.4 0.0
ACCOUNTING PRINCIPLES OF THE PARENT COMPANY FINANCIAL STATEMENTS
GENERAL INFORMATIONThe financial statements of Kamux Corporation are prepared in accordance with Finnish Account-ing Standards (FAS). The accounting principles of the consolidated financial statements are applied to the appropriate extent in the preparation of the Company’s financial statements. In the following paragraphs are described the accounting princi-ples of the parent company to the extent they dif-fer from the accounting principles for the consoli-dated financial statements.
REVENUERevenue of the Company consists of intra-group management fees.
INTRA-GROUP RECEIVABLES AND LIABILITIES Intra-group receivables and liabilities of the Com-pany consist of intra-group transactions. Receiva-
bles are recognized in the balance sheet at lower of their nominal value and their probable value, whichever is lower. Liabilities are measured at their nominal value. Interest income and expenses relat-ing to receivables and liabilities are recognized on accrual basis and accrued to the financial year on the basis of the time period.
LOANS AND INTEREST EXPENSESLoans from banks are recognized at their nominal value. Transaction costs related to loans are ex-pensed at the time of taking out a loan. Interest ex-penses of the loans are recognized in the income statement on accrual basis and accrued to the fi-nancial year on the basis of the time period.
DEFERRED TAX ASSETSThe Company does not recognize deferred tax assets in the financial statements of the parent company.
For the year ended December 31,
FINANCIAL STATEMENTS
63 KAMUX CORPORATION ANNUAL REPORT 2017 64
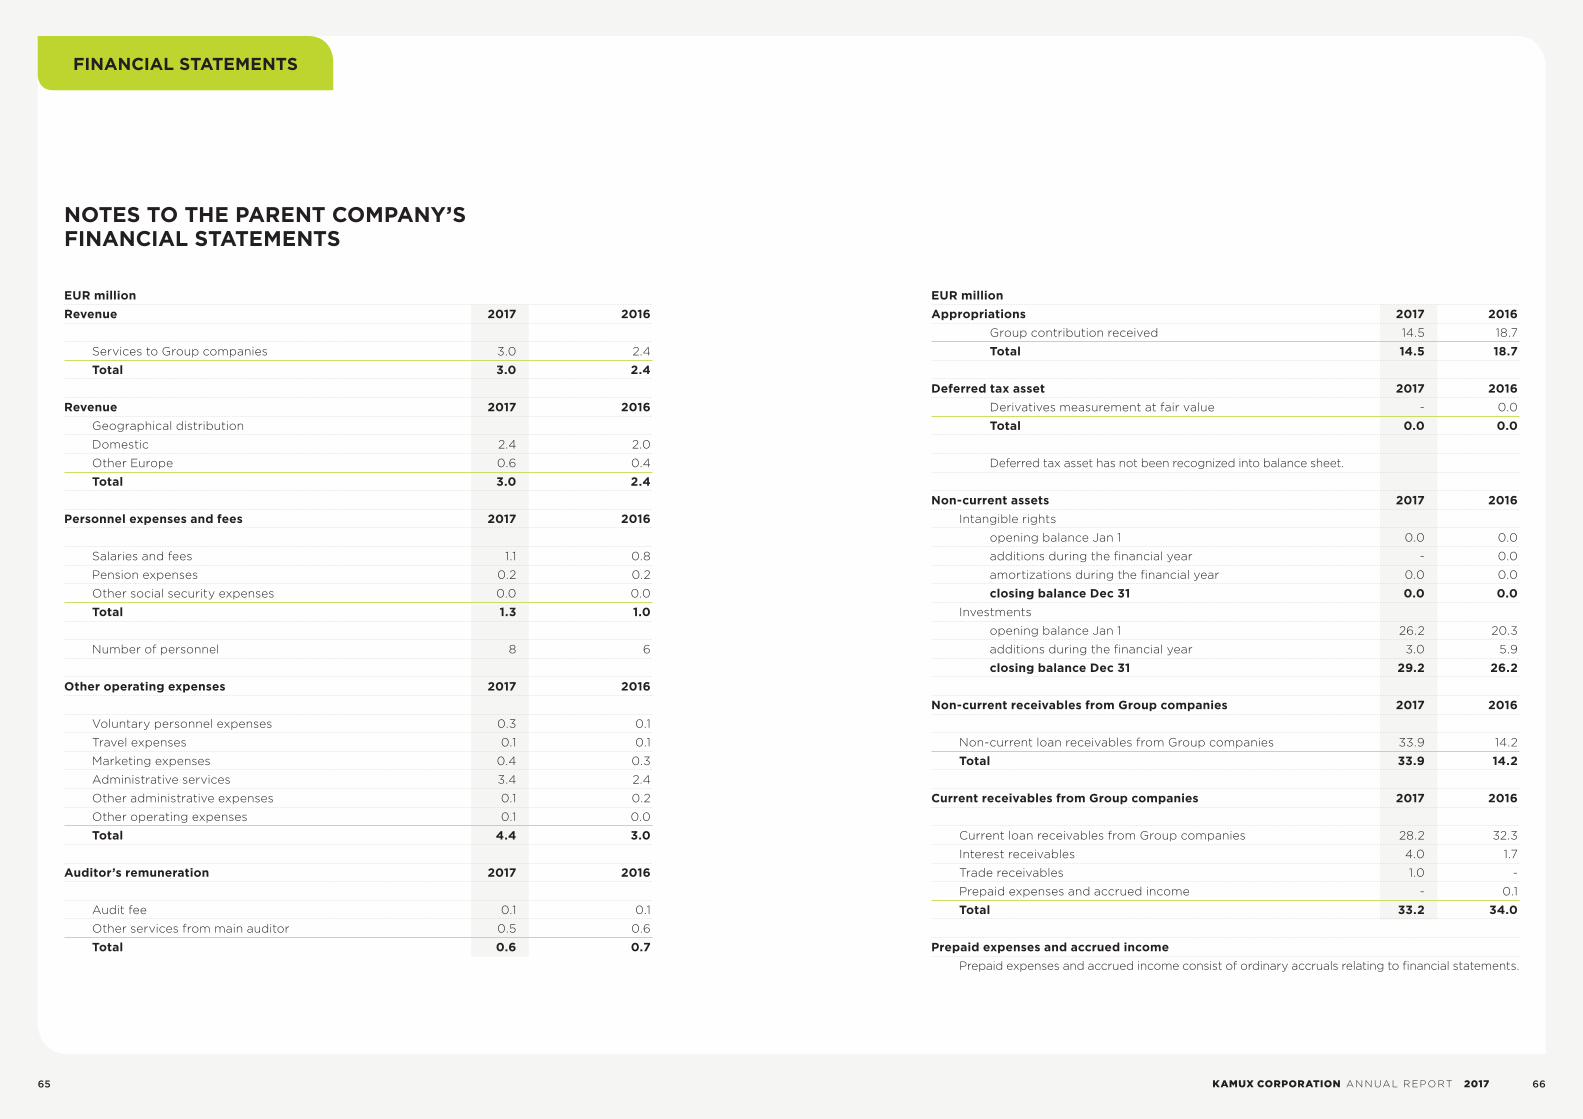
NOTES TO THE PARENT COMPANY’S FINANCIAL STATEMENTS
EUR million Revenue 2017 2016
Services to Group companies 3.0 2.4
Total 3.0 2.4
Revenue 2017 2016 Geographical distribution
Domestic 2.4 2.0
Other Europe 0.6 0.4
Total 3.0 2.4
Personnel expenses and fees 2017 2016
Salaries and fees 1.1 0.8
Pension expenses 0.2 0.2
Other social security expenses 0.0 0.0
Total 1.3 1.0
Number of personnel 8 6
Other operating expenses 2017 2016
Voluntary personnel expenses 0.3 0.1
Travel expenses 0.1 0.1
Marketing expenses 0.4 0.3
Administrative services 3.4 2.4
Other administrative expenses 0.1 0.2
Other operating expenses 0.1 0.0
Total 4.4 3.0
Auditor’s remuneration 2017 2016
Audit fee 0.1 0.1
Other services from main auditor 0.5 0.6
Total 0.6 0.7
EUR million Appropriations 2017 2016 Group contribution received 14.5 18.7
Total 14.5 18.7
Deferred tax asset 2017 2016 Derivatives measurement at fair value - 0.0
Total 0.0 0.0
Deferred tax asset has not been recognized into balance sheet.
Non-current assets 2017 2016 Intangible rights
opening balance Jan 1 0.0 0.0
additions during the financial year - 0.0
amortizations during the financial year 0.0 0.0
closing balance Dec 31 0.0 0.0 Investments
opening balance Jan 1 26.2 20.3
additions during the financial year 3.0 5.9
closing balance Dec 31 29.2 26.2
Non-current receivables from Group companies 2017 2016
Non-current loan receivables from Group companies 33.9 14.2
Total 33.9 14.2
Current receivables from Group companies 2017 2016
Current loan receivables from Group companies 28.2 32.3
Interest receivables 4.0 1.7
Trade receivables 1.0 -
Prepaid expenses and accrued income - 0.1
Total 33.2 34.0
Prepaid expenses and accrued income Prepaid expenses and accrued income consist of ordinary accruals relating to financial statements.
FINANCIAL STATEMENTS
65 KAMUX CORPORATION ANNUAL REPORT 2017 66

EUR million Shares 2017 2016
Group companies
Kamux Suomi Oy 100 % 100 %
Suomen Autorahaksi Oy (100 %)
KMX Holding AB 100 % 100 %
Kamux AB (100 %)
Kamux Auto GmbH 100 % 100 %
Changes in equity during the financial year 2017 2016
Share capital on Jan 1 0.1 0.1
Share capital on Dec 31 0.1 0.1
Invested non-restricted equity reserve on Jan 1 4.1 0.9
Share issue 21.1 3.2
Invested non-restricted equity reserve on Dec 31 25.2 4.1
Retained earnings on Jan 1 25.6 18.7
Dividend distribution -2.2 -1.5
Acquisition of treasury shares - -5.5
Retained earnings on Dec 31 23.3 11.8
Profit/loss for the financial year 10.9 13.8
Total equity 59.5 29.7
Distributable earnings Dec 31 2017 2016
Retained earnings 23.3 11.8
Profit for the financial year 10.9 13.8
Invested non-restricted equity fund 25.2 4.1
Total 59.5 29.7
EUR million Loans from financial institutions 2017 2016
Nordea Pankki Suomi Oyj
Instalments to be paid within one year 3.0 6.3
Instalments to be paid after one year 22.5 25.5
Total 25.5 31.8
Other liabilities 2017 2016
Current other liabilities 0.0 0.0
Total 0.0 0.0
Non-current loans to Group companies 2017 2016
Non-current loan liabilities to Group companies 4.7 4.8
Total 4.7 4.8
Current loans to Group companies 2017 2016
Current loans to Group companies 23.6 3.3
Accrued expenses and deferred income 0.2 1.0
Total 23.9 4.4
Accrued expenses and deferred income 2017 2016
Personnel expenses 0.2 0.2
Taxes 0.0 3.4
Other 0.1 0.0
Total 0.3 3.7
Derivatives 2017 2016
Interest rate swap, nominal value of underlying instrument - 6.5
Interest rate swap, fair value - -0.1
Total - 6.4
Measurement at fair value through profit or loss 0.1 0.1
FINANCIAL STATEMENTS
67 KAMUX CORPORATION ANNUAL REPORT 2017 68

EUR millionPledges and guarantees 31.12.2017 31.12.2016
Loans 35.5 31.0
Amount in use 25.5 30.5
Guarantees given on loans
General guarantee
Business mortgages
Total bearer bonds 26.0 26.0
Special guarantee
Business mortgages
Total bearer bonds 26.0 26.0
Pledged subsidiary shares
Total shares of Kamux Auto GmbH
Total shares of KMX Holding Ab
Total shares of Kamux Suomi Oy
Kamux Oyj has given non-restricted general guarantee on behalf of its subsidiaries
in Finland, Sweden and Germany and pledged the shares of these subsidiaries.
SIGNATURES FOR THE REPORT BY THE BOARD OF DIRECTORS AND THE FINANCIAL STATEMENTS
Hämeenlinna, March 8, 2018
Matti Virtanen Reija Laaksonen David NuutinenChairman of the Board Member of the Board Member of the Board
Jokke Paananen Harri Sivula Vesa Uotila Member of the Board Member of the Board Member of the Board
Juha Kalliokoski CEO
The Auditor’s Note
A report on the audit performed has been issued today.
Helsinki, March 8, 2018
PricewaterhouseCoopers OyAuthorized Public Accountants
Janne RajalahtiAuthorized Public Accountant
At December 31,
FINANCIAL STATEMENTS
69 KAMUX CORPORATION ANNUAL REPORT 2017 70

AUDITOR’S REPORT (TRANSLATION OF THE FINNISH ORIGINAL)
To the Annual General Meeting of Kamux Oyj
REPORT ON THE AUDIT OF THE FINANCIAL STATEMENTS OPINION
In our opinion • the consolidated financial statements give a true and fair view of the group’s financial position and fi-nancial performance and cash flows in accordance with International Financial Reporting Standards (IFRS) as adopted by the EU• the financial statements give a true and fair view of the parent company’s financial performance and financial position in accordance with the laws and regulations governing the preparation of the finan-cial statements in Finland and comply with statuto-ry requirements.
Our opinion is consistent with the additional report to the Board.
What we have auditedWe have audited the financial statements of Kamux Oyj (business identity code 2442327-8) for the year ended 31 December 2017. The financial statements com-prise:• the consolidated balance sheet, statement of comprehensive income, statement of changes in equity, statement of cash flows and notes, includ-ing a summary of significant accounting policies• the parent company’s balance sheet, income statement, statement of cash flows and notes.
BASIS FOR OPINION We conducted our audit in accordance with good auditing practice in Finland. Our responsibilities un-der good auditing practice are further described in the Auditor’s Responsibilities for the Audit of the Financial Statements section of our report.We believe that the audit evidence we have ob-tained is sufficient and appropriate to provide a ba-sis for our opinion.
IndependenceWe are independent of the parent company and of the group companies in accordance with the ethical requirements that are applicable in Finland and are relevant to our audit, and we have fulfilled our other ethical responsibilities in accordance with these requirements.
To the best of our knowledge and belief, the non-audit services that we have provided to the parent company and to the group companies are in accordance with the applicable law and regula-tions in Finland and we have not provided non-au-dit services that are prohibited under Article 5(1) of Regulation (EU) No 537/2014. The non-audit ser-vices that we have provided are disclosed in note 2.4 to the Financial Statements.
As part of designing our audit, we determined ma-teriality and assessed the risks of material misstate-ment in the financial statements. In particular, we considered where management made subjective judgements; for example, in respect of significant accounting estimates that involved making as-sumptions and considering future events that are inherently uncertain.
MaterialityThe scope of our audit was influenced by our appli-cation of materiality. An audit is designed to obtain reasonable assurance whether the financial state-ments are free from material misstatement. Mis-
statements may arise due to fraud or error. They are considered material if individually or in aggre-gate, they could reasonably be expected to influ-ence the economic decisions of users taken on the basis of the financial statements.
Based on our professional judgement, we de-termined certain quantitative thresholds for mate-riality, including the overall group materiality for the consolidated financial statements as set out in the table below. These, together with qualitative consid-erations, helped us to determine the scope of our audit and the nature, timing and extent of our audit procedures and to evaluate the effect of misstate-ments on the financial statements as a whole.
How we tailored our group audit scopeWe tailored the scope of our audit, taking into ac-count the structure of the group, the accounting processes and controls, and the industry in which the group operates.
Our audit procedures covered all the significant countries and locations of Kamux group. The focus of our audit procedures has been on the most sig-nificant components in Finland and Sweden where we performed the full scope audit because of the magnitude and risk of the component in question. For the remaining components, we performed al-ternative procedures to ensure that there is no risk of material misstatement in the consolidated finan-cial statements.
KEY AUDIT MATTERS Key audit matters are those matters that, in our pro-fessional judgment, were of most significance in our audit of the financial statements of the current pe-riod. These matters were addressed in the context of our audit of the financial statements as a whole, and in forming our opinion thereon, and we do not provide a separate opinion on these matters.
As in all of our audits, we also addressed the risk of management override of internal controls, including among other matters consideration of whether there was evidence of bias that represent-ed a risk of material misstatement due to fraud.
OUR AUDIT APPROACHOverview• Overall group materiality: € 2.600.000, which represents a combination of adjusted profit before tax and revenue.• Our audit procedures covered all the significant countries and locations of Kamux group. The focus of our audit procedures has been on the most sig-nificant components in Finland and Sweden. • Valuation of inventory• Accuracy of the repair liability provision
Overall group materiality € 2,6 million
How we determined it Average of 5% of adjusted profit before taxes and 1% of the total reve-nues. Both of the benchmarks were equally weighted when determin-ing the overall group materiality.
Rationale for the materiality benchmark applied
The company is in a development phase and its strategy focuses on the increase of revenues. As the benchmark for the determination of the materiality, we chose the combination of revenue and adjusted profit before taxes. Based on our understanding the readers of the fi-nancial statements use these parameters when evaluating the perfor-mance of the group. As thresholds, we chose to use 1% of the revenues and 5% of the adjusted profit before taxes, which are within generally accepted thresholds according to auditing standards.
AUDITOR’S REPORT
71 KAMUX CORPORATION ANNUAL REPORT 2017 72

Key audit matter in the audit of the group How our audit addressed the key audit matter
Valuation of inventorySee note 3.1 in the financial statements
The inventory is valued to the lower of acquisition cost or net realisable value. The acquisition cost of individual cars included in the inventory, is deter-mined based on the purchase price including direct-ly attributable repair costs for reconditioning the car for selling purposes.
For the financial statements, the company eval-uates the cars included over 90 days in the inven-tory. The impairment recorded is the value of cars according to net realisable value.
The valuation of inventory is considered a key au-dit matter because of the magnitude of the invento-ry and the management judgement included in the valuation.
Our audit procedures included understanding and evaluating the processes and controls for the valuation of inventory.
As part of our audit procedures, we evaluated the appropriateness of the accounting policies applied by the company for the inventory valuation.
We reviewed the management’s detailed estimate for the need of adjustment for inventory valuation for financial statements. We evaluated the accuracy of re-corded adjustment compared to company’s account-ing policy, sales occurred after the year-end and other identified circumstances.
We tested the acquisition cost of the cars included in the inventory for year-end 2017 on a sample basis. We compared the inventory value for selected cars to purchase price for the car including directly attribut-able repair costs for reconditioning the car for selling purposes.
We tested the net realisable value of the cars includ-ed in the inventory for year-end 2017 on a sample basis. We compared the inventory value for selected cars to sales price in 2018..
Accuracy of the repair liability provisionSee note 2.3 in the financial statements
Estimated repair liability is recognised as repair liability provision when a car is sold. The amount of repair liability provision is based on historical statis-tics about realised liability costs and the estimated trend of repair liability costs.
Accuracy of the provision for repair costs is con-sidered as a key audit matter because of the signif-icant management judgement included in the ac-counting of the provision.
We evaluated the accuracy of the repair liability provi-sion by comparing the estimate prepared by manage-ment to actual historical costs. We reconciled the re-corded repair liability provision to calculation prepared by management.
In addition, we inquired of the management, if there were any circumstances, which would require changes to estimated trend of repair liability costs.
We also audited the payments made in 2018 to gain comfort that there are no significant costs occurred which should have been taken into consideration when calculating the provision.
We have no key audit matters to report with re-spect to our audit of the parent company financial statements.
There are no significant risks of material mis-statement referred to in Article 10(2c) of Regula-tion (EU) No 537/2014 with respect to the consoli-dated financial statements or the parent company financial statements.
RESPONSIBILITIES OF THE BOARD OF DIRECTORS AND THE MANAGING DIRECTOR FOR THE FINANCIAL STATEMENTSThe Board of Directors and the Managing Director are responsible for the preparation of consolidated financial statements that give a true and fair view in accordance with International Financial Report-ing Standards (IFRS) as adopted by the EU, and of financial statements that give a true and fair view in accordance with the laws and regulations govern-ing the preparation of financial statements in Fin-land and comply with statutory requirements. The Board of Directors and the Managing Director are also responsible for such internal control as they determine is necessary to enable the preparation of financial statements that are free from material misstatement, whether due to fraud or error.
In preparing the financial statements, the Board of Directors and the Managing Director are respon-sible for assessing the parent company’s and the group’s ability to continue as a going concern, disclosing, as applicable, matters relating to go-ing concern and using the going concern basis of accounting. The financial statements are prepared using the going concern basis of accounting unless there is an intention to liquidate the parent compa-ny or the group or to cease operations, or there is no realistic alternative but to do so.
AUDITOR’S RESPONSIBILITIES FOR THE AUDIT OF THE FINANCIAL STATEMENTSOur objectives are to obtain reasonable assurance about whether the financial statements as a whole are free from material misstatement, whether due to fraud or error, and to issue an auditor’s report that includes our opinion. Reasonable assurance is a high level of assurance, but is not a guarantee that an audit conducted in accordance with good auditing practice will always detect a material mis-statement when it exists. Misstatements can arise from fraud or error and are considered material if, individually or in the aggregate, they could reason-ably be expected to influence the economic deci-sions of users taken on the basis of these financial statements.
As part of an audit in accordance with good au-diting practice, we exercise professional judgment and maintain professional skepticism throughout the audit. We also:
• Identify and assess the risks of material misstate-ment of the financial statements, whether due to fraud or error, design and perform audit proce-dures responsive to those risks, and obtain audit evidence that is sufficient and appropriate to pro-vide a basis for our opinion. The risk of not detect-ing a material misstatement resulting from fraud is higher than for one resulting from error, as fraud may involve collusion, forgery, intentional omis-sions, misrepresentations, or the override of inter-nal control.• Obtain an understanding of internal control rel-evant to the audit in order to design audit proce-dures that are appropriate in the circumstances, but not for the purpose of expressing an opinion on the effectiveness of the parent company’s or the group’s internal control. • Evaluate the appropriateness of accounting pol-icies used and the reasonableness of accounting estimates and related disclosures made by man-agement.• Conclude on the appropriateness of the Board of Directors’ and the Managing Director’s use of the going concern basis of accounting and based on the audit evidence obtained, whether a mate-rial uncertainty exists related to events or condi-tions that may cast significant doubt on the parent company’s or the group’s ability to continue as a going concern. If we conclude that a material un-certainty exists, we are required to draw attention in our auditor’s report to the related disclosures in the financial statements or, if such disclosures are inadequate, to modify our opinion. Our conclusions are based on the audit evidence obtained up to the date of our auditor’s report. However, future events or conditions may cause the parent company or the group to cease to continue as a going concern.• Evaluate the overall presentation, structure and content of the financial statements, including the dis-closures, and whether the financial statements repre-sent the underlying transactions and events so that the financial statements give a true and fair view.• Obtain sufficient appropriate audit evidence re-garding the financial information of the entities or business activities within the group to express an opinion on the consolidated financial statements. We are responsible for the direction, supervision and performance of the group audit. We remain solely responsible for our audit opinion.We communicate with those charged with govern-
AUDITOR’S REPORT
73 KAMUX CORPORATION ANNUAL REPORT 2017 74

ance regarding, among other matters, the planned scope and timing of the audit and significant audit findings, including any significant deficiencies in in-ternal control that we identify during our audit.
We also provide those charged with govern-ance with a statement that we have complied with relevant ethical requirements regarding independ-ence, and to communicate with them all relation-ships and other matters that may reasonably be thought to bear on our independence, and where applicable, related safeguards.
From the matters communicated with those charged with governance, we determine those matters that were of most significance in the au-dit of the financial statements of the current pe-riod and are therefore the key audit matters. We describe these matters in our auditor’s report un-less law or regulation precludes public disclosure about the matter or when, in extremely rare cir-cumstances, we determine that a matter should not be communicated in our report because the adverse consequences of doing so would reason-ably be expected to outweigh the public interest benefits of such communication.
OTHER REPORTING REQUIREMENTS
APPOINTMENTWe were first appointed as auditors by the annual general meeting on 9 October 2015. Our appoint-ment represents a total period of uninterrupted en-gagement of three years.
OTHER INFORMATION The Board of Directors and the Managing Director are responsible for the other information. The oth-er information comprises the report of the Board of Directors and the information included in the Annual Report, but does not include the financial statements and our auditor’s report thereon. We have obtained the report of the Board of Directors prior to the date of this auditor’s report and the An-nual Report is expected to be made available to us after that date.
Our opinion on the financial statements does not cover the other information.
In connection with our audit of the financial statements, our responsibility is to read the other information identified above and, in doing so, con-sider whether the other information is materially
inconsistent with the financial statements or our knowledge obtained in the audit, or otherwise ap-pears to be materially misstated. With respect to the report of the Board of Directors, our responsi-bility also includes considering whether the report of the Board of Directors has been prepared in ac-cordance with the applicable laws and regulations.
IN OUR OPINION• the information in the report of the Board of Di-rectors is consistent with the information in the fi-nancial statements• the report of the Board of Directors has been pre-pared in accordance with the applicable laws and regulations.
If, based on the work we have performed on the other information that we obtained prior to the date of this auditor’s report, we conclude that there is a material misstatement of this other in-formation, we are required to report that fact. We have nothing to report in this regard.
Helsinki 8 March 2018
PricewaterhouseCoopers OyAuthorised Public Accountants
Janne RajalahtiAuthorised Public Accountant (KHT)
AUDITOR’S REPORT
75 KAMUX CORPORATION ANNUAL REPORT 2017 76
KAMUX CORPORATION | PAROLANTIE 66A | 13130 HÄMEENLINNA | WWW.KAMUX.COM