financial statements group financial statements al statements609352c9-f8d6-4180-b7ac... ·...
TRANSCRIPT

Financial statements Group financial statements
AL STATEMENTS
192 Swiss Re 2018 Financial Report
For the years ended 31 December
USD millions Note 2017 2018
Revenues Gross premiums written 4 34 775 36 406
Net premiums written 4 32 316 34 042 Change in unearned premiums 803 –167
Premiums earned 3 33 119 33 875 Fee income from policyholders 3 586 586 Net investment income – non-participating business1 7 3 708 4 075 Net realised investment gains/losses – non-participating business2 7 1 727 65 Net investment result – unit-linked and with-profit business 7 3 315 –1 593 Other revenues 32 39
Total revenues 42 487 37 047
Expenses Claims and claim adjustment expenses 3 –16 730 –14 855 Life and health benefits 3 –11 083 –11 769 Return credited to policyholders –3 298 1 033 Acquisition costs 3 –6 977 –6 919 Operating expenses –3 308 –3 432
Total expenses before interest expenses –41 396 –35 942
Income before interest and income tax expense 1 091 1 105 Interest expenses –566 –555
Income before income tax expense 525 550 Income tax expense 13 –132 –69
Net income before attribution of non-controlling interests 393 481
Income/loss attributable to non-controlling interests 5 –19
Net income after attribution of non-controlling interests 398 462
Interest on contingent capital instruments, net of tax –67 –41
Net income attributable to common shareholders 331 421
Earnings per share in USD Basic 12 1.03 1.37 Diluted 12 1.03 1.37
Earnings per share in CHF3 Basic 12 1.02 1.34 Diluted 12 1.01 1.34
1 Total impairments for the years ended 31 December of USD 46 million in 2017 and nil in 2018, respectively, were fully recognised in earnings. 2 Total impairments for the years ended 31 December of USD 57 million in 2017 and USD 16 million 2018, respectively, were fully recognised in earnings. 3 The translation from USD to CHF is shown for informational purposes only and has been calculated using the Group’s average exchange rates.
The accompanying notes are an integral part of the Group financial statements.

Swiss Re 2018 Financial Report 193
For the years ended 31 December
USD millions 2017 2018
Net income before attribution of non-controlling interests 393 481 Other comprehensive income, net of tax:
Change in net unrealised investment gains/losses 287 –2 389 Change in other-than-temporary impairment 3 –1 Change in cash flow hedges –3 15 Change in foreign currency translation 526 –408 Change in adjustment for pension benefits 315 –4 Impact of sale to non-controlling shareholder –259 Other comprehensive income attributable to non-controlling interests 72
Total comprehensive income before attribution of non-controlling interests 1 521 –2 493
Interest on contingent capital instruments, net of tax –67 –41 Comprehensive income attributable to non-controlling interests 5 –91
Total comprehensive income attributable to common shareholders 1 459 –2 625
The accompanying notes are an integral part of the Group financial statements.

Financial statements Group financial statements
AL STATEMENTS
194 Swiss Re 2018 Financial Report
For the years ended 31 December
2017 Net unrealised
investment Other-than-
temporary Cash flow Foreign
currency Adjustment for pension
Credit risk of financial liabilities at
Accumulated other comprehensive
USD millions gains/losses1 impairment1 hedges1 translation1, 2 benefits3 fair value option income
Balance as of 1 January 4 459 –5 –7 –6 074 –1 135 0 –2 762 Change during the period 2 755 4 30 347 348 3 484 Amounts reclassified out of accumulated other comprehensive income –2 372 1 –33 –17 43 –2 378 Tax –96 –2 196 –76 22
Balance as of period end 4 746 –2 –10 –5 548 –820 0 –1 634
2018 Net unrealised
investment Other-than-
temporary Cash flow Foreign
currency Adjustment for pension
Credit risk of financial liabilities at
Accumulated other comprehensive
USD millions gains/losses1 impairment1 hedges1 translation1, 2 benefits3 fair value option income
Balance as of 1 January 4 746 –2 –10 –5 548 –820 0 –1 634 Impact of sale to non-controlling shareholder –325 1 52 13 –259 Impact of Accounting Standards Updates4 –127 –17 5 –139 Change during the period –3 129 –1 25 –303 –75 –3 483 Amounts reclassified out of accumulated other comprehensive income 154 –10 8 68 220 Tax 586 –113 3 476
Balance as of period end 1 905 –3 6 –5 904 –828 5 –4 819
1 Reclassification adjustment included in net income is presented in “Net realised investment gains/losses – non-participating business”. 2 Reclassification adjustment is limited to translation gains and losses realised upon sale or upon complete or substantially complete liquidation of an investment in a foreign entity. 3 Reclassification adjustment included in net income is presented in “Operating expenses”. 4 Impact of ASU 2018-02, ASU 2016-16 and ASU 2016-01. Please refer to Note 1 for more details.
The accompanying notes are an integral part of the Group financial statements.
RECLASSIFICATION OUT OF ACCUMULATED OTHER COMPREHENSIVE INCOME

Swiss Re 2018 Financial Report 195
This page is intentionally left blank.

Financial statements Group financial statements
AL STATEMENTS
196 Swiss Re 2018 Financial Report
As of 31 December
USD millions Note 2017 2018
Investments 7, 8, 9 Fixed income securities:
Available-for-sale (including 12 969 in 2017 and 11 502 in 2018 subject to securities lending and repurchase agreements) (amortised cost: 2017: 93 278; 2018: 89 673) 99 248 92 538 Trading (including 1 761 in 2017 and 2 599 in 2018 subject to securities lending and repurchase agreements) 2 538 3 414
Equity securities: Available-for-sale (including 277 in 2017 subject to securities lending and repurchase agreements) (cost: 2017: 3 544)1 3 862 Trading1 3 At fair value through earnings (including 480 in 2018 subject to securities lending and repurchase agreements)1 3 036
Policy loans, mortgages and other loans 4 110 4 542 Investment real estate 2 220 2 411 Short-term investments (including 411 in 2017 and 552 in 2018 subject to securities lending and repurchase agreements) 4 846 5 417 Other invested assets 9 904 6 398 Investments for unit-linked and with-profit business (including fixed income securities trading: 5 209 in 2017 and 4 938 in 2018, equity securities trading: 28 783 in 2017, equity securities at fair value through earnings: 23 123 in 2018) 35 166 29 546
Total investments 161 897 147 302
Cash and cash equivalents (including 322 in 2017 and 717 in 2018 subject to securities lending, and 1 878 in 2017 and 1 175 in 2018 backing unit-linked and with-profit contracts) 6 806 5 985 Accrued investment income 1 095 1 052 Premiums and other receivables 13 834 13 789 Reinsurance recoverable on unpaid claims and policy benefits 7 942 7 058 Funds held by ceding companies 9 155 9 009 Deferred acquisition costs 6 6 871 8 217 Acquired present value of future profits 6 1 989 1 818 Goodwill 4 172 4 071 Income taxes recoverable 378 526 Deferred tax assets 13 4 817 5 411 Other assets 3 570 3 332
Total assets 222 526 207 570
1 Change due to ASU 2016-01. Please refer to Note 1 for more details.
The accompanying notes are an integral part of the Group financial statements.
ASSETS

Swiss Re 2018 Financial Report 197
USD millions Note 2017 2018
Liabilities Unpaid claims and claim adjustment expenses 5 66 795 67 446 Liabilities for life and health policy benefits 8 42 561 39 593 Policyholder account balances 37 537 31 938 Unearned premiums 11 769 11 721 Funds held under reinsurance treaties 3 109 3 224 Reinsurance balances payable 1 036 920 Income taxes payable 679 597 Deferred and other non-current tax liabilities 13 6 975 6 471 Short-term debt 11 433 1 633 Accrued expenses and other liabilities 7 7 190 6 798 Long-term debt 11 10 148 8 502
Total liabilities 188 232 178 843
Equity Contingent capital instruments 750 Common shares, CHF 0.10 par value
2017: 349 452 281; 2018: 338 619 465 shares authorised and issued 33 32 Additional paid-in capital 368 496 Treasury shares, net of tax –1 842 –2 291 Accumulated other comprehensive income:
Net unrealised investment gains/losses, net of tax 4 746 1 905 Other-than-temporary impairment, net of tax –2 –3 Cash flow hedges, net of tax –10 6 Foreign currency translation, net of tax –5 548 –5 904 Adjustment for pension and other post-retirement benefits, net of tax –820 –828 Credit risk of financial liabilities at fair value option, net of tax 5
Total accumulated other comprehensive income –1 634 –4 819 Retained earnings 36 449 34 512
Shareholders’ equity 34 124 27 930
Non-controlling interests 170 797
Total equity 34 294 28 727
Total liabilities and equity 222 526 207 570
The accompanying notes are an integral part of the Group financial statements.
LIABILITIES AND EQUITY

Financial statements Group financial statements
AL STATEMENTS
198 Swiss Re 2018 Financial Report
For the years ended 31 December
USD millions 2017 2018
Contingent capital instruments Balance as of 1 January 1 102 750 Changes during the period –352 –750 Balance as of period end 750 0
Common shares Balance as of 1 January 34 33 Cancellation of shares bought back –1 –1 Balance as of period end 33 32
Additional paid-in capital Balance as of 1 January 341 368 Impact of sale to non-controlling shareholder1 34 123 Contingent capital instrument issuance costs 8 11 Cancellation of shares bought back –85 Share-based compensation –14 –6 Realised gains/losses on treasury shares2 –1 85 Balance as of period end 368 496
Treasury shares, net of tax Balance as of 1 January –1 763 –1 842 Purchase of treasury shares –1 161 –1 454 Cancellation of shares bought back 1 006 1 032 Issuance of treasury shares, including share-based compensation to employees2 76 –27 Balance as of period end –1 842 –2 291
Net unrealised investment gains/losses, net of tax Balance as of 1 January 4 459 4 746 Impact of sale to non-controlling shareholder1 –325 Impact of ASU 2018-023 176 Impact of ASU 2016-163 44 Impact of ASU 2016-013 –347 Changes during the period 287 –2 389 Balance as of period end 4 746 1 905
Other-than-temporary impairment, net of tax Balance as of 1 January –5 –2 Changes during the period 3 –1 Balance as of period end –2 –3
Cash flow hedges, net of tax Balance as of 1 January –7 –10 Impact of sale to non-controlling shareholder1 1 Changes during the period –3 15 Balance as of period end –10 6
The accompanying notes are an integral part of the Group financial statements.

Swiss Re 2018 Financial Report 199
USD millions 2017 2018
Foreign currency translation, net of tax Balance as of 1 January –6 074 –5 548 Impact of sale to non-controlling shareholder1 52 Changes during the period 526 –408 Balance as of period end –5 548 –5 904
Adjustment for pension and other post-retirement benefits, net of tax Balance as of 1 January –1 135 –820 Impact of sale to non-controlling shareholder1 13 Impact of ASU 2018-023 –17 Changes during the period 315 –4 Balance as of period end –820 –828
Credit risk of financial liabilities at fair value option, net of tax Balance as of 1 January 0 0 Impact of ASU 2016-013 5 Balance as of period end 0 5
Retained earnings Balance as of 1 January 38 682 36 449 Net income after attribution of non-controlling interests 398 462 Interest on contingent capital instruments, net of tax –67 –41 Dividends on common shares –1 559 –1 592 Cancellation of shares bought back –1 005 –946 Impact of ASU 2018-023 –159 Impact of ASU 2016-163 –3 Impact of ASU 2016-013 342 Balance as of period end 36 449 34 512
Shareholders’ equity 34 124 27 930
Non-controlling interests Balance as of 1 January 82 170 Transactions with non-controlling interests 93 688 Income/loss attributable to non-controlling interests –5 19 Other comprehensive income attributable to non-controlling interests
Change in net unrealised investment gains/losses 191 Change in foreign currency translation –109 Other –10
Dividends to non-controlling interests –152 Balance as of period end 170 797
Total equity 34 294 28 727
1 In 2018, MS&AD Insurance Group Holdings Inc (MS&AD) acquired a 15% non-controlling interest in ReAssure, a subsidiary of the Group. 2 In 2018, the Group performed a review of the carrying values of treasury shares, resulting in an increase of USD 65 million in treasury shares and a corresponding increase of the same amount in additional paid-in capital. The reclassification has no impact on net income or net equity of the Group.
3 Impact of Accounting Standards Update. Please refer to Note 1 for more details.
The accompanying notes are an integral part of the Group financial statements.

Financial statements Group financial statements
AL STATEMENTS
200 Swiss Re 2018 Financial Report
For the years ended 31 December
USD millions 2017 2018
Cash flows from operating activities Net income attributable to common shareholders 331 421 Add net income/loss attributable to non-controlling interests –5 19 Adjustments to reconcile net income to net cash provided/used by operating activities:
Depreciation, amortisation and other non-cash items 542 331 Net realised investment gains/losses –4 048 2 530 Income from equity-accounted investees, net of dividends received 70 4 Change in:
Technical provisions and other reinsurance assets and liabilities, net 5 739 –1 796 Funds held by ceding companies and under reinsurance treaties –276 212 Reinsurance recoverable on unpaid claims and policy benefits 61 656 Other assets and liabilities, net –386 –421 Income taxes payable/recoverable –606 –682 Trading positions, net –119 298
Net cash provided/used by operating activities 1 303 1 572
Cash flows from investing activities Fixed income securities:
Sales 43 904 44 679 Maturities 5 537 5 159 Purchases –52 696 –49 816 Net purchases/sales/maturities of short-term investments 6 459 –761
Equity securities: Sales 7 421 1 908 Purchases –7 113 –1 578
Securities purchased/sold under agreement to resell/repurchase, net –1 042 3 464 Cash paid/received for acquisitions/disposals and reinsurance transactions, net 36 –11 Net purchases/sales/maturities of other investments –2 103 –869 Net purchases/sales/maturities of investments held for unit-linked and with-profit business 2 356 1 288
Net cash provided/used by investing activities 2 759 3 463
Cash flows from financing activities Policyholder account balances, unit-linked and with-profit business:
Deposits 565 557 Withdrawals –2 821 –2 939
Issuance/repayment of long-term debt –270 346 Issuance/repayment of short-term debt –1 221 –428 Issuance/repayment of contingent capital instrument –352 –750 Purchase/sale of treasury shares –1 142 –1 446 Dividends paid to shareholders –1 559 –1 592 Dividends paid to non-controlling interests –152 Transactions with non-controlling interests 811
Net cash provided/used by financing activities –6 800 –5 593
The accompanying notes are an integral part of the Group financial statements.

Swiss Re 2018 Financial Report 201
USD millions 2017 2018
Total net cash provided/used –2 738 –558 Effect of foreign currency translation 533 –263
Change in cash and cash equivalents –2 205 –821 Cash and cash equivalents as of 1 January 9 011 6 806
Cash and cash equivalents as of 31 December 6 806 5 985
Interest paid was USD 655 million and USD 631 million (thereof USD 49 million and USD 43 million for letter of credit fees) for 2017 and 2018, respectively. Tax paid was USD 720 million and USD 740 million for 2017 and 2018, respectively. Cash and cash equivalents include restricted cash and restricted cash equivalents, for instance pledged cash and cash equivalents (please refer to Note 7, “Investments“).
The accompanying notes are an integral part of the Group financial statements.

Financial statements Notes to the Group financial statements
202 Swiss Re 2018 Financial Report
1 Organisation and summary of significant accounting policies Nature of operations The Swiss Re Group, which is headquartered in Zurich, Switzerland, comprises Swiss Re Ltd (the parent company) and its subsidiaries (collectively, the “Swiss Re Group” or the ”Group”). The Swiss Re Group is a wholesale provider of reinsurance, insurance and other insurance-based forms of risk transfer. Working through brokers and a network of offices around the globe, the Group serves a client base made up of insurance companies, mid- to large-sized corporations and public-sector clients.
Basis of presentation The accompanying consolidated financial statements have been prepared in accordance with accounting principles generally accepted in the United States of America (US GAAP) and comply with Swiss law. All significant intra-group transactions and balances have been eliminated on consolidation.
In the half-year 2018 report, the impact of the Accounting Standard Updates (ASUs) 2016-01, 2016-16 and 2018-02 was reflected in the Group’s statement of comprehensive income. In the year-end 2018 report, the Group revised the presentation and presented the statement of comprehensive income without the impact of these ASUs totalling USD –139 million. The revision had no impact on the Group’s financial position, net income and cash flow. Please refer to the subsection ”Adoption of new accounting standards” for more details about the ASUs.
Principles of consolidation The Group’s financial statements include the consolidated financial statements of Swiss Re Ltd and its subsidiaries. Voting entities which Swiss Re Ltd directly or indirectly controls through holding a majority of the voting rights are consolidated in the Group’s accounts. Variable interest entities (VIEs) are consolidated when the Swiss Re Group is the primary beneficiary. The Group is the primary beneficiary when it has power over the activities that impact the VIE’s economic performance and at the same time has the obligation to absorb losses or the right to receive benefits that could potentially be significant to the VIE. Companies which the Group does not control, but over which it directly or indirectly exercises significant influence, are accounted for using the equity method or the fair value option and are included in other invested assets. The Swiss Re Group’s share of net profit or loss in investments accounted for under the equity method is included in net investment income. Equity and net income of these companies are adjusted as necessary to be in line with the Group’s accounting policies. The results of consolidated subsidiaries and investments accounted for using the equity method are included in the financial statements for the period commencing from the date of acquisition.
Use of estimates in the preparation of financial statements The preparation of financial statements requires management to make significant estimates and assumptions that affect the reported amounts of assets, liabilities, revenues and expenses as well as the related disclosure, including contingent assets and liabilities. The Swiss Re Group’s liabilities for unpaid claims and claim adjustment expenses and policy benefits for life and health include estimates for premium, claim and benefit data not received from ceding companies at the date of the financial statements. In addition, the Group uses certain financial instruments and invests in securities of certain entities for which exchange trading does not exist. The Group determines these estimates based on historical information, actuarial analyses, financial modelling and other analytical techniques. Actual results could differ significantly from the estimates described above.
Foreign currency remeasurement and translation Transactions denominated in foreign currencies are remeasured to the respective subsidiary’s functional currency at average exchange rates. Monetary assets and liabilities are remeasured to the functional currency at closing exchange rates, whereas non-monetary assets and liabilities are remeasured to the functional currency at historical rates. Remeasurement gains and losses on monetary assets and liabilities and trading securities are reported in earnings. Remeasurement gains and losses on available-for-sale securities, investments in consolidated subsidiaries and investments accounted for using the equity method are reported in shareholders’ equity.
Swiss Re 2018 Financial Report 203
For consolidation purposes, assets and liabilities of subsidiaries with functional currencies other than US dollars are translated from the functional currency to US dollars at closing rates. Revenues and expenses are translated at average exchange rates. Translation adjustments are reported in shareholders’ equity.
Valuation of financial assets The fair value of the majority of the Group’s financial instruments is based on quoted prices in active markets or observable inputs. These instruments include government and agency securities, commercial paper, most investment-grade corporate debt, most high-yield debt securities, exchange-traded derivative instruments, most mortgage- and asset-backed securities and listed equity securities. In markets with reduced or no liquidity, spreads between bid and offer prices are normally wider compared to spreads in highly liquid markets. Such market conditions affect the valuation of certain asset classes of the Group, such as some asset-backed securities as well as certain derivative structures referencing such asset classes.
The Group considers both the credit risk of its counterparties and own risk of non-performance in the valuation of derivative instruments and other over-the-counter financial assets. In determining the fair value of these financial instruments, the assessment of the Group’s exposure to the credit risk of its counterparties incorporates consideration of existing collateral and netting arrangements entered into with each counterparty. The measure of the counterparty credit risk is estimated with incorporation of the observable credit spreads, where available, or credit spread estimates derived based on the benchmarking techniques where market data is not available. The impact of the Group’s own risk of non-performance is analysed in the manner consistent with the aforementioned approach, with consideration of the Group’s observable credit spreads. The value representing such risk is incorporated into the fair value of the financial instruments (primarily derivatives), in a liability position as of the measurement date. The change in this adjustment from period to period is reflected in realised gains and losses in the income statement.
For assets or derivative structures at fair value, the Group uses market prices or inputs derived from market prices. A separate internal price verification process, independent of the trading function, provides an additional control over the market prices or market input used to determine the fair values of such assets. Although management considers that appropriate values have been ascribed to such assets, there is always a level of uncertainty and judgement over these valuations. Subsequent valuations could differ significantly from the results of the process described above. The Group may become aware of counterparty valuations, either directly through the exchange of information or indirectly, for example through collateral demands. Any implied differences are considered in the independent price verification process and may result in adjustments to initially indicated valuations. As of 31 December 2018, the Group had not provided any collateral on financial instruments in excess of its own market value estimates.
Investments The Group’s investments in fixed income securities are classified as available-for-sale (AFS) or trading. Fixed income securities AFS are carried at fair value, based on quoted market prices, with the difference between the applicable measure of cost and fair value being recognised in shareholders’ equity. Trading fixed income securities are carried at fair value with unrealised gains and losses recognised in earnings. A trading classification is used for securities that are bought and held principally for the purpose of selling them in the near term.
For fixed income securities AFS that are other-than-temporary impaired and for which there is not an intention to sell, the impairment is separated into (i) the estimated amount relating to credit loss, and (ii) the amount relating to all other factors. The estimated credit loss amount is recognised in earnings, with the remainder of the loss amount recognised in other comprehensive income. In cases where there is an intention or requirement to sell and the fair value is lower than cost expressed in functional currency terms, the cost of fixed income securities AFS is reduced to fair value, with a corresponding charge to realised investment losses. Subsequent recoveries are not recognised in earnings.
Equity investments are carried at fair value with unrealised gains and losses recognised in earnings, with the exception of equity method investments and investments that result in consolidation.
Interest on fixed income securities is recorded in net investment income when earned and is adjusted for the amortisation of any purchase premium or discount. Dividends on equity securities are recognised as investment income on the ex-dividend date. Realised gains and losses on sales are included in earnings and are calculated using the specific identification method.
Policy loans, mortgages and other loans are carried at amortised cost. Interest income is recognised in accordance with the effective yield method.
Investment in real estate that the Group intends to hold for the production of income is carried at depreciated cost, net of any write-downs for impairment in value. Depreciation on buildings is recognised on a straight-line basis over the estimated useful life of the asset. Land is recognised at cost and not depreciated. Impairment in value is recognised if the sum of the estimated future undiscounted cash flows from the use of the real estate is lower than its carrying value. The impairment loss is measured as the amount by which the asset’s carrying amount exceeds its fair value and is recognised in realised investment losses. Depreciation

Financial statements Notes to the Group financial statements
204 Swiss Re 2018 Financial Report
and other related charges or credits are included in net investment income. Investment in real estate held for sale is carried at the lower of cost or fair value, less estimated selling costs, and is not depreciated. Reductions in the carrying value of real estate held for sale are included in realised investment losses.
Short-term investments are measured at fair value with changes in fair value recognised in net income. The Group considers highly liquid investments with a remaining maturity at the date of acquisition of one year or less, but greater than three months, to be short-term investments.
Other invested assets include affiliated companies, equity accounted companies, derivative financial instruments, collateral receivables, securities purchased under agreement to resell, deposits and time deposits, and investments without readily determinable fair value (including limited partnership investments). Investments in limited partnerships where the Group’s interest equals or exceeds 3% are accounted for using the equity method. Investments in limited partnerships where the Group’s interest is below 3% and equity investments in corporate entities which are not publicly traded are accounted for at estimated fair value with changes in fair value recognised in earnings.
The Group enters into securities lending arrangements under which it loans certain securities in exchange for collateral and receives securities lending fees. The Group’s policy is to require collateral, consisting of cash or securities, equal to at least 102% of the carrying value of the securities loaned. In certain arrangements, the Group may accept collateral of less than 102% if the structure of the overall transaction offers an equivalent level of security. Cash received as collateral is recognised along with an obligation to return the cash. Securities received as collateral that can be sold or repledged are also recognised along with an obligation to return those securities. Securities lending fees are recognised over the term of the related loans.
Derivative financial instruments and hedge accounting The Group uses a variety of derivative financial instruments including swaps, options, forwards and exchange-traded financial futures for the Group’s trading and hedging strategy in line with the overall risk management strategy. Derivative financial instruments are primarily used as a means of managing exposure to price, foreign currency and/or interest rate risk on planned or anticipated investment purchases, existing assets or existing liabilities and also to lock in attractive investment conditions for funds which become available in the future. The Group recognises all of its derivative instruments on the balance sheet at fair value. Changes in fair value on derivatives that are not designated as hedging instruments are recorded in income.
If the derivative is designated as a hedge of the fair value of assets or liabilities, changes in the fair value of the derivative are recognised in earnings, together with changes in the fair value of the related hedged item. If the derivative is designated as a hedge of the variability in expected future cash flows related to a particular risk, changes in the fair value of the derivative are reported in other comprehensive income until the hedged item is recognised in earnings. The ineffective portion of the hedge is recognised in earnings. When hedge accounting is discontinued on a cash flow hedge, the net gain or loss remains in accumulated other comprehensive income and is reclassified to earnings in the period in which the formerly hedged transaction is reported in earnings. When the Group discontinues hedge accounting because it is no longer probable that a forecasted transaction will occur within the required time period, the derivative continues to be carried on the balance sheet at fair value, and gains and losses that were previously recorded in accumulated other comprehensive income are recognised in earnings.
The Group recognises separately derivatives that are embedded within other host instruments if the economic characteristics and risks are not clearly and closely related to the economic characteristics and risks of the host contract and if it meets the definition of a derivative if it were a free-standing contract.
Derivative financial instrument assets are generally included in other invested assets and derivative financial instrument liabilities are generally included in accrued expenses and other liabilities.
The Group also designates non-derivative and derivative monetary financial instruments as hedges of the foreign currency exposure of its net investment in certain foreign operations. From the inception of the hedging relationship, remeasurement gains and losses on the designated non-derivative and derivative monetary financial instruments and translation gains and losses on the hedged net investment are reported as translation gains and losses in shareholders’ equity.
Cash and cash equivalents Cash and cash equivalents include cash on hand, short-term deposits, certain short-term investments in money market funds and highly liquid debt instruments with a remaining maturity at the date of acquisition of three months or less.
Deferred acquisition costs The Group incurs costs in connection with acquiring new and renewal reinsurance and insurance business. Some of these costs, which consist primarily of commissions, are deferred as they are directly related to the successful acquisition of such business.
Deferred acquisition costs for short-duration contracts are amortised in proportion to premiums earned. Future investment income is considered in determining the recoverability of deferred acquisition costs for short-duration contracts. Deferred acquisition costs

Swiss Re 2018 Financial Report 205
for long-duration contracts are amortised over the life of underlying contracts. Deferred acquisition costs for universal-life and similar products are amortised based on the present value of estimated gross profits. Estimated gross profits are updated quarterly.
Modifications of insurance and reinsurance contracts The Group accounts for modifications of insurance and reinsurance contracts that result in a substantially unchanged contract as a continuation of the replaced contract. The associated deferred acquisition costs and present value of future profits (PVFP) will continue to be amortised. The Group accounts for modifications of insurance and reinsurance contracts that result in a substantially changed contract as an extinguishment of the replaced contract. The associated deferred acquisition costs or PVFP are written off immediately through income and any new deferrable costs associated with the replacement contract are deferred.
Business combinations The Group applies the acquisition method of accounting for business combinations. This method allocates the cost of the acquired entity to the assets and liabilities assumed based on their estimated fair values at the date of acquisition.
Life Capital closed blocks of business can be acquired in different legal forms, either through an acquisition of an entity’s share capital or through a reinsurance transaction. The Group’s policy is to treat these transactions consistently regardless of the legal form of the acquisition. Accordingly, the Group records the acquired assets and liabilities directly to the balance sheet. Premiums, life and health benefits and other income statement items are not recorded in the income statement on the date of the acquisition.
The underlying assets and liabilities acquired are subsequently accounted for according to the relevant US GAAP guidance. This includes specific requirements applicable to subsequent accounting for assets and liabilities recognised as part of the acquisition method of accounting, including present value of future profits, goodwill and other intangible assets.
Acquired present value of future profits The acquired present value of future profits (PVFP) of business in force is recorded in connection with the acquisition of life and health business. The initial value is calculated as the difference between established reserves, which are set up in line with US GAAP accounting policies and assumptions of the Group, and their fair value at the acquisition date. The resulting PVFP, which could be positive or negative, is amortised on a constant yield basis over the expected revenue recognition period of the business acquired, generally over periods ranging up to 30 years, with the accrual of interest added to the unamortised balance at the earned rate. Amortisation and accrual of interest are recognised in acquisition costs. The earned rate corresponds to either the current earned rate or the original earned rate depending on the business written. The rate is consistently applied for the entire life of the applicable business. For universal-life and similar products, PVFP is amortised in line with estimated gross profits, which are updated quarterly. The carrying value of PVFP is reviewed periodically for indicators of impairment in value. Adjustments to PVFP reflecting impairment in value are recognised in acquisition costs during the period in which the determination of impairment is made, or in other comprehensive income for shadow loss recognition.
Goodwill The excess of the purchase price of acquired businesses over the estimated fair value of net assets acquired is recorded as goodwill, which is reviewed periodically for indicators of impairment in value. Adjustments to reflect impairment in value are recognised in earnings in the period in which the determination of impairment is made.
Other assets Other assets include deferred expenses on retroactive reinsurance, prepaid reinsurance premiums, receivables related to investing activities, real estate for own use, other classes of property, plant and equipment, accrued income, certain intangible assets and prepaid assets.
The excess of estimated liabilities for claims and claim adjustment expenses payable over consideration received in respect of retroactive property and casualty reinsurance contracts is recorded as a deferred expense. The deferred expense on retroactive reinsurance contracts is amortised through earnings over the expected claims-paying period.
Real estate for own use as well as other classes of property, plant and equipment are carried at depreciated cost. Depreciation on buildings is recognised on a straight-line basis over the estimated useful life. Land is recognised at cost and not depreciated.
Capitalised software costs External direct costs of materials and services incurred to develop or obtain software for internal use, payroll and payroll-related costs for employees directly associated with software development and interest cost incurred while developing software for internal use are capitalised and amortised on a straight-line basis through earnings over the estimated useful life.
Income taxes Deferred income tax assets and liabilities are recognised based on the difference between financial statement carrying amounts and the corresponding income tax bases of assets and liabilities using enacted income tax rates and laws. A valuation allowance is

Financial statements Notes to the Group financial statements
206 Swiss Re 2018 Financial Report
recorded against deferred tax assets when it is deemed more likely than not that some or all of the deferred tax assets may not be realised.
The Group recognises the effect of income tax positions only if sustaining those positions is more likely than not. Changes in recognition or measurement are reflected in the period in which a change in judgement occurs.
The Group releases stranded tax effects for unrealised gains/losses on AFS securities to earnings on a straight-line basis over the average duration of the relevant AFS portfolio as an approximation of when the individual securities within the portfolio are sold or mature. For adjustment for pension and other post-retirement benefits, stranded tax effects are released to earnings when the relevant pension plan is terminated. For foreign currency translation, stranded tax effects are released to earnings in line with the recycling of the underlying foreign currency translation amounts.
Unpaid claims and claim adjustment expenses Liabilities for unpaid claims and claim adjustment expenses for property and casualty and life and health insurance and reinsurance contracts are accrued when insured events occur and are based on the estimated ultimate cost of settling the claims, using reports and individual case estimates received from ceding companies. A provision is also included for claims incurred but not reported, which is developed on the basis of past experience adjusted for current trends and other factors that modify past experience. The establishment of the appropriate level of reserves is an inherently uncertain process involving estimates and judgements made by management, and therefore there can be no assurance that ultimate claims and claim adjustment expenses will not exceed the loss reserves currently established. These estimates are regularly reviewed, and adjustments for differences between estimates and actual payments for claims and for changes in estimates are reflected in income in the period in which the estimates are changed or payments are made.
The Group does not discount liabilities arising from prospective property and casualty insurance and reinsurance contracts, including liabilities which are discounted for US statutory reporting purposes. Liabilities arising from property and casualty insurance and reinsurance contracts acquired in a business combination are initially recognised at fair value in accordance with the acquisition method of accounting.
The Group does not discount life and health claim reserves except for disability income claims in payment and mortality claims paid out in the form of an annuity. These claims are recognised at the estimated present value of the remaining ultimate net costs of the incurred claims. Experience features which are directly linked to a reinsurance asset or liability are classified in a manner that is consistent with the presentation of that asset or liability.
Liabilities for life and health policy benefits Liabilities for life and health policy benefits from reinsurance business are generally calculated using the net level premium method, based on assumptions as to investment yields, mortality, withdrawals, lapses and policyholder dividends. Assumptions are set at the time the contract is issued or, in the case of contracts acquired by purchase, at the purchase date. The assumptions are based on projections from past experience, making allowance for possible adverse deviation. Interest rate assumptions for life and health (re)insurance benefit liabilities are based on estimates of expected investment yields. Assumed mortality rates are generally based on experience multiples applied to the actuarial select and ultimate tables based on industry experience.
Liabilities for life and health policy benefits are increased with a charge to earnings if it is determined that future cash flows, including investment income, are insufficient to cover future benefits and expenses. Where assets backing liabilities for policy benefits are held as AFS, these liabilities for policyholder benefits are increased by a shadow adjustment, with a charge to other comprehensive income, where future cash flows at market rates are insufficient to cover future benefits and expenses.
Policyholder account balances Policyholder account balances relate to universal-life-type contracts and investment contracts.
Universal-life-type contracts are long-duration insurance contracts, providing either death or annuity benefits, with terms that are not fixed and guaranteed.
Investment contracts are long-duration contracts that do not incorporate significant insurance risk, ie there is no mortality and morbidity risk, or the mortality and morbidity risk associated with the insurance benefit features offered in the contract is of insignificant amount or remote probability. Amounts received as payment for investment contracts are reported as policyholder account balances. Related assets are included in general account assets except for investments for unit-linked and with-profit business, which are presented in a separate line item on the face of the balance sheet.
Amounts assessed against policyholders for mortality, administration and surrender are shown as fee income. Amounts credited to policyholders are shown as interest credited to policyholders. Investment income and realised investment gains and losses
Swiss Re 2018 Financial Report 207
allocable to policyholders are included in net investment income and net realised investment gains/losses except for unit-linked and with-profit business, which is presented in a separate line item on the face of the income statement.
Unit-linked and with-profit business are presented together as they are similar in nature. For unit-linked contracts, the investment risk is borne by the policyholder. For with-profit contracts, the majority of the investment risk is also borne by the policyholder, although there are certain guarantees that limit the downside risk for the policyholder, and a certain proportion of the returns may be retained by Swiss Re Group (typically 10%). Additional disclosures are provided in Note 7.
Funds held assets and liabilities On the asset side, funds held by ceding companies consist mainly of amounts retained by the ceding company for business written on a funds withheld basis. In addition, the account also includes amounts arising from the application of the deposit method of accounting to ceded retrocession or reinsurance contracts.
On the liability side, funds held under reinsurance treaties consist mainly of amounts arising from the application of the deposit method of accounting to inward insurance and reinsurance contracts. In addition, the account also includes amounts retained from ceded business written on a funds withheld basis.
Funds withheld assets are assets that would normally be paid to the Group but are withheld by the cedent to reduce a potential credit risk or to retain control over investments. In case of funds withheld liabilities, it is the Group that withholds assets related to ceded business in order to reduce its credit risk or retain control over the investments.
The deposit method of accounting is applied to insurance and reinsurance contracts that do not indemnify the ceding company or the Group against loss or liability relating to insurance risk. Under the deposit method of accounting, the deposit asset or liability is initially measured based on the consideration paid or received. For contracts that transfer neither significant timing nor underwriting risk, and contracts that transfer only significant timing risk, changes in estimates of the timing or amounts of cash flows are accounted for by recalculating the effective yield. The deposit is then adjusted to the amount that would have existed had the new effective yield been applied since the inception of the contract. The revenue and expense recorded for such contracts is included in net investment income. For contracts that transfer only significant underwriting risk, once a loss is incurred, the deposit is adjusted by the present value of the incurred loss. At each subsequent balance sheet date, the portion of the deposit attributable to the incurred loss is recalculated by discounting the estimated future cash flows. The resulting changes in the carrying amount of the deposit are recognised in claims and claim adjustment expenses.
Funds withheld balances are presented together with assets and liabilities arising from the application of the deposit method because of their common deposit-type character.
Shadow adjustments Shadow adjustments are recognised in other comprehensive income reflecting the offset of adjustments to deferred acquisition costs and PVFP, typically related to universal-life-type contracts, and policyholder liabilities. The purpose is to reflect the fact that certain amounts recorded as unrealised investment gains and losses within shareholders’ equity will ultimately accrue to policyholders and not shareholders.
Shadow loss recognition testing becomes relevant in low interest rate environments. The test considers whether the hypothetical sale of AFS securities and the reinvestment of proceeds at lower yields would lead to negative operational earnings in future periods, thereby causing a loss recognition event. For shadow loss recognition testing, the Group uses current market yields to determine best estimate US GAAP reserves rather than using locked-in or current book yields. If the unlocked best estimate US GAAP reserves based on current market rates are in excess of reserves based on locked-in or current book yields, a shadow loss recognition reserve is set up. These reserves are recognised in other comprehensive income and do not impact net income. In addition, shadow loss recognition reserves can reverse up to the amount of losses recognised due to past loss events.
Premiums Property and casualty reinsurance premiums are recorded when written and include an estimate for written premiums receivable at period end. Premiums earned are generally recognised in income over the contract period in proportion to the amount of reinsurance provided. Unearned premiums consist of the unexpired portion of reinsurance provided. Life reinsurance premiums are earned when due. Related policy benefits are recorded in relation to the associated premium or gross profits so that profits are recognised over the expected lives of the contracts.
Life and health reinsurance premiums for group coverages are generally earned over the term of the coverage. For group contracts that allow experience adjustments to premiums, such premiums are recognised as the related experience emerges.
Reinstatement premiums are due where coverage limits for the remaining life of the contract are reinstated under pre-defined contract terms. The recognition of reinstatement premiums as written depends on individual contract features. Reinstatement premiums are either recognised as written at the time a loss event occurs or in line with the recognition pattern of premiums
Financial statements Notes to the Group financial statements
208 Swiss Re 2018 Financial Report
written of the underlying contract. The accrual of reinstatement premiums is based on actuarial estimates of ultimate losses. Reinstatement premiums are generally earned in proportion to the amount of reinsurance provided.
Insurance and reinsurance ceded The Group uses retrocession arrangements to increase its aggregate underwriting capacity, to diversify its risk and to reduce the risk of catastrophic loss on reinsurance assumed. The ceding of risks to retrocessionaires does not relieve the Group of its obligations to its ceding companies. The Group regularly evaluates the financial condition of its retrocessionaires and monitors the concentration of credit risk to minimise its exposure to financial loss from retrocessionaires’ insolvency. Premiums and losses ceded under retrocession contracts are reported as reductions of premiums earned and claims and claim adjustment expenses. Amounts recoverable for ceded short- and long-duration contracts, including universal-life-type and investment contracts, are reported as assets in the accompanying consolidated balance sheet.
The Group provides reserves for uncollectible amounts on reinsurance balances ceded, based on management’s assessment of the collectability of the outstanding balances.
Receivables Premium and claims receivables which have been invoiced are accounted for at face value. Together with assets arising from the application of the deposit method of accounting that meet the definition of financing receivables they are regularly assessed for impairment. Evidence of impairment is the age of the receivable and/or any financial difficulties of the counterparty. Allowances are set up on the net balance, meaning all balances related to the same counterparty are considered. The amount of the allowance is set up in relation to the time a receivable has been due and any financial difficulties of the debtor, and can be as high as the outstanding net balance.
Pensions and other post-retirement benefits The Group accounts for its pension and other post-retirement benefit costs using the accrual method of accounting. Amounts charged to expense are based on periodic actuarial determinations.
Share-based payment transactions As of 31 December 2018, the Group has a Leadership Performance Plan, restricted shares and a Global Share Participation Plan. These plans are described in more detail in Note 15. The Group accounts for share-based payment transactions with employees using the fair value method. Under the fair value method, the fair value of the awards is recognised in earnings over the vesting period.
For share-based compensation plans which are settled in cash, compensation costs are recognised as liabilities, whereas for equity-settled plans, compensation costs are recognised as an accrual to additional paid-in capital within shareholders’ equity.
Treasury shares Treasury shares are reported at cost in shareholders’ equity.
Earnings per common share Basic earnings per common share are determined by dividing net income available to shareholders by the weighted average number of common shares entitled to dividends during the year. Diluted earnings per common share reflect the effect on earnings and average common shares outstanding associated with dilutive securities.
Subsequent events Subsequent events for the current reporting period have been evaluated up to 13 March 2019. This is the date on which the financial statements are available to be issued.
Adoption of new accounting standards In May 2014, the Financial Accounting Standards Board (FASB) issued Accounting Standards Update (ASU) 2014-09, “Revenue from Contracts with Customers”, which creates topic 606, “Revenue from Contracts with Customers”. ASU 2014-09 outlines the principles that an entity should follow to provide useful information about the amount, timing and uncertainty of revenue and cash flows arising from contracts with its customers. The standard requires an entity to depict the transfer of promised goods or services to customers in an amount that reflects the consideration to which the entity expects to be entitled in exchange for those goods or services. Insurance contracts and financial instruments are not in the scope of the new standard. The Group adopted ASU 2014-09 on 1 January 2018 together with the following ASUs related to topic 606: ASU 2016-08 “Principal versus Agent Considerations (Reporting Revenue Gross versus Net)”, ASU 2016-10 “Identifying Performance Obligations and Licensing”, ASU 2016-12 “Narrow-Scope Improvements and Practical Expedients” and ASU 2016-20 “Technical Corrections and Improvements to Topic 606”. The retrospective adoption of ASU 2014-09 and related ASUs did not have a material impact on the Group’s financial statements.

Swiss Re 2018 Financial Report 209
In January 2016, the FASB issued ASU 2016-01, “Recognition and Measurement of Financial Assets and Financial Liabilities”, an update to subtopic 825-10, “Financial Instruments – Overall”. The ASU requires the Group to carry investments in equity securities, including partnerships, unincorporated joint ventures and limited liability companies at fair value through earnings, with the exception of equity method investments, investments that result in consolidation or investments for which the measurement alternative has been elected. The Group did not elect the measurement alternative for any of its investments. For financial liabilities to which the fair value option has been applied, the ASU requires an entity to separately present the change in fair value attributable to instrument-specific credit risk in other comprehensive income (OCI) rather than in net income. In addition, the ASU requires an entity to assess whether a valuation allowance is needed on a deferred tax asset (DTA) related to fixed income securities available-for-sale in combination with the entity’s other DTAs rather than separately from other DTAs. The Group adopted ASU 2016-01 on 1 January 2018 together with ASU 2018-03, “Technical Corrections and Improvements to Financial Instruments – Overall (Subtopic 825-10)”. The opening balance sheet impact from the adoption was a reclassification within shareholders’ equity from net unrealised investment gains, net of tax, to retained earnings of USD 347 million. In addition, USD 5 million were reclassified from retained earnings to credit risk of financial liabilities at fair value option, net of tax. These reclassifications can be found in the statement of shareholders’ equity. The impact on pre-tax earnings in 2018 due to the adoption of ASU 2016-01 was an estimated net realised investment loss of USD 599 million.
In August 2016, the FASB issued ASU 2016-15, “Classification of Certain Cash Receipts and Cash Payments”, a consensus of the FASB Emerging Issues Task Force (EITF) to topic 230, “Statement of Cash Flows”. ASU 2016-15 provides guidance on eight issues related to the presentation and classification of cash receipts and cash payments in the statement of cash flows with the objective of reducing existing diversity in practice. The Group adopted ASU 2016-15 retrospectively on 1 January 2018. The adoption did not have a material impact on the Group’s statement of cash flows.
In October 2016, the FASB issued ASU 2016-16, “Intra-Entity Transfers of Assets Other Than Inventory”, an update to topic 740, “Income Taxes”. This ASU amends the former guidance which prohibited the recognition of current and deferred income taxes for an intra-entity asset transfer until the asset had been sold to an outside party. This new standard requires that an entity recognises the income tax consequences of an intra-entity transfer of an asset other than inventory when the transfer occurs. The Group adopted ASU 2016-16 on 1 January 2018 on a modified retrospective basis through a cumulative-effect adjustment directly to retained earnings as of the adoption date. The adoption resulted in an increase of net unrealised investment gains/losses, net of tax, of USD 44 million against a reduction of deferred tax of USD 41 million and retained earnings of USD 3 million. The movements in equity related to the adoption of ASU 2016-16 can be found in the statement of shareholders’ equity. The impact on earnings in 2018 due to the adoption of ASU 2016-16 was a tax benefit of USD 68 million.
In November 2016, the FASB issued ASU 2016-18, ‘‘Restricted Cash’’, a consensus of the FASB EITF to topic 230, ‘‘Statement of Cash Flows’’. The update requires that the statement of cash flows explains the change during the period in the total of cash, cash equivalents and restricted cash and restricted cash equivalents. Restricted cash and restricted cash equivalents should be included with cash and cash equivalents when reconciling the beginning-of-period and end-of-period total amounts shown on the statement of cash flows. The Group adopted ASU 2016-18 retrospectively on 1 January 2018. The adoption did not have a material impact on the Group’s financial statements.
In February 2017, the FASB issued ASU 2017-05, ‘‘Clarifying the Scope of Asset Derecognition Guidance and Accounting for Partial Sales of Nonfinancial Assets’’, an update to subtopic 610-20, ‘‘Other Income --- Gains and Losses from the Derecognition of Nonfinancial Assets’’. This update clarifies and provides guidance on the scope of subtopic 610-20 including financial assets meeting the definition of an in-substance non-financial asset. The Group adopted ASU 2017-05 retrospectively on 1 January 2018. The adoption did not have an impact on the Group’s financial statements.
In March 2017, the FASB issued ASU 2017-07, “Improving the Presentation of Net Periodic Pension Cost and Net Periodic Postretirement Benefit Cost’’, an update to topic 715, “Compensation – Retirement Benefits”. The amendments in this update require that an employer separates other components of net benefit cost from the service cost component and presents these components outside a subtotal of income from operations, if one is presented. Further, the ASU only allows the service cost component of net benefit cost to be capitalised. The Group adopted ASU 2017-07 retrospectively on 1 January 2018. The adoption did not have a material impact on the Group’s financial statements.
In May 2017, the FASB issued ASU 2017-09, “Scope of Modification Accounting’’, an update to topic 718, “Compensation – Stock Compensation”. The amendments in this update provide guidance about which changes to the terms or conditions of a share-based payment award require to apply modification accounting under topic 718. The Group adopted ASU 2017-09 on 1 January 2018. The adoption did not have an impact on the Group’s financial statements.
In February 2018, the FASB issued ASU 2018-02, “Reclassification of Certain Tax Effects from Accumulated Other Comprehensive Income”, an update to topic 220, “Income Statement – Reporting Comprehensive Income”. The ASU allows a reclassification from accumulated other comprehensive income to retained earnings of stranded tax effects resulting from the Tax Cuts and Jobs Act. The Group early adopted ASU 2018-02 on 1 January 2018. The adoption resulted in a reclassification within shareholders’ equity

Financial statements Notes to the Group financial statements
210 Swiss Re 2018 Financial Report
of USD 159 million of stranded tax charges from accumulated other comprehensive income to retained earnings. The reclassification can be found in the statement of shareholders’ equity.
Future adoption of new accounting standards In February 2016, the FASB issued ASU 2016-02 “Leases”, which creates topic 842, “Leases”. The core principle of topic 842 is that a lessee should recognise the assets and liabilities that arise from leases. A lessee should recognise in the statement of financial position a liability to make lease payments (the lease liability) and a right-of-use asset representing the right to use the underlying asset for the lease term. This accounting treatment applies to finance leases and operating leases. The accounting applied by a lessor is largely unchanged from that applied under the current guidance. The Group will adopt this ASU on 1 January 2019. The expected impact from the adoption is a net balance sheet gross-up of approximately USD 0.5 billion. Further, deferred gains carried on the balance sheet and amortised over time under the existing sale-leaseback guidance (estimated to be approximately USD 97 million as of 1 January 2019) will be released as a cumulative-effect adjustment to opening retained earnings as of 1 January 2019.
In June 2016, the FASB issued ASU 2016-13, “Measurement of Credit Losses”, an update to topic 326, “Financial Instruments – Credit Losses”. ASU 2016-13 replaces the incurred loss impairment methodology in current US GAAP with a methodology that reflects expected credit losses. For financial instruments that are measured at amortised cost and available-for-sale debt securities, the standard requires that an entity recognises its estimate of expected credit losses as an allowance. The ASU is effective for annual and interim periods beginning after 15 December 2020. Early adoption is permitted. The Group is currently assessing the impact of the new requirements.
In January 2017, the FASB issued ASU 2017-04, “Simplifying the Test for Goodwill Impairment”, an update to topic 350, “Intangibles – Goodwill and Other”. This ASU simplifies the subsequent measurement of goodwill and eliminates Step 2 from the goodwill impairment test. In computing the implied fair value of goodwill under Step 2, an entity has to perform procedures to determine the fair value at the impairment testing date of its assets and liabilities (including unrecognised assets and liabilities) following the procedure that would be required in determining the fair value of assets acquired and liabilities assumed in a business combination. Instead, under the amendments in this update, an entity should perform its regular goodwill impairment test by comparing the fair value of a reporting unit with its carrying amount. An entity should recognise an impairment charge for the amount by which the carrying amount exceeds the reporting unit’s fair value; however, the loss recognised should not exceed the total amount of goodwill allocated to that reporting unit. The new requirements are effective for goodwill impairment tests in annual and interim periods beginning after 15 December 2020. Early adoption of the ASU is permitted. The Group is currently assessing the impact of the new requirements.
In August 2018, the FASB issued ASU 2018-12, “Targeted Improvements to the Accounting for Long-Duration Contracts”, an update to topic 944, “Financial Services—Insurance“. This ASU requires that the cash flows and net premium ratio will be updated for changes in insurance assumptions (eg mortality, morbidity, terminations) when measuring the liability for future policy benefits for non-participating traditional and limited-payment insurance and reinsurance contracts. The effect of updating cash flow assumptions will be measured on a retrospective catch-up basis and presented separately from the ongoing policyholder benefit expense in the statement of operations in the period the update is made. There will no longer be a provision for adverse deviation. In addition, the discount rate used to reflect the time value of money in the calculation of the liability for future policy benefits will be standardised. An upper-medium-grade fixed-income instrument yield will be required, which differs from the current requirement to use a discount rate reflecting expected investment yields. Further, a locked-in rate will be used in the periodic calculation of the net premium ratio and accretion of interest on the liability for income statement purposes. For balance sheet remeasurement purposes, the discount rate will be updated at each reporting date, with the effect of discount rate changes on the liability recorded immediately in OCI. The ASU requires deferred acquisition costs (DAC) relating to most long-duration contracts to be amortised on a constant basis over the expected term of the contract, and the resulting amortisation amount should not be a function of revenue or profit. The new standard also introduces a new category called market risk benefits, which are features that protect the contract holder from capital market risk and expose the insurer to that risk. These features have to be measured at fair value, with changes in own credit risk recognised in OCI, and presented separately in the primary financial statements. The ASU also requires significant additional disclosures, including disaggregated roll forwards of the liability for future policy benefits, policyholder account balances, market risk benefits and DAC. The ASU is effective for annual and interim periods beginning after 15 December 2020. Early adoption of the amendments is permitted. The new guidance relating to measurement of the traditional and limited-payment contract liabilities and DAC amortisation has to be adopted under a modified retrospective transition approach, with an option to elect a full retrospective transition if certain criteria are met. Under the modified retrospective approach, for contracts in force at the transition date, an entity would continue to use the existing locked-in investment yield interest rate assumptions to calculate the net premium ratio. However, for balance sheet measurement purposes, policyholder liabilities are discounted at the upper-medium-grade fixed-income instrument yield at the transition date, with the impact of the change recognised against accumulated OCI. The Group is currently assessing the impact of the new requirements.

Swiss Re 2018 Financial Report 211
2 Information on business segments The Group provides reinsurance and insurance throughout the world through its business segments. The business segments are determined by the organisational structure and by the way in which management reviews the operating performance of the Group.
The Group presents four core operating business segments: Property & Casualty Reinsurance, Life & Health Reinsurance, Corporate Solutions and Life Capital. The presentation of each segment’s balance sheet is closely aligned to the segment legal entity structure. The assignment of assets and liabilities for entities that span more than one segment is determined by considering local statutory requirements, legal and other constraints, the economic view of duration and currency requirements of the reinsurance business written and the capacity of the segments to absorb risks. Interest expense is based on the segment’s capital funding position. The tax impact of a segment is derived from the legal entity tax obligations and the segmentation of the pre-tax result. While most of the tax items can be directly attributed to individual segments, the tax which impacts two or more segments is allocated to the segments on a reasonable basis. Property & Casualty Reinsurance and Life & Health Reinsurance share the same year-to-date effective tax rate as both business segments belong to the Reinsurance Business Unit.
Accounting policies applied by the business segments are in line with those described in the summary of significant accounting policies (please refer to Note 1).
The Group operating segments are outlined below.
Property & Casualty Reinsurance and Life & Health Reinsurance Reinsurance consists of two segments, Property & Casualty and Life & Health. The Reinsurance Business Unit operates globally, both through brokers and directly with clients, and provides a large range of solutions for risk and capital management. Clients include stock and mutual insurance companies as well as public sector and governmental entities. In addition to traditional reinsurance solutions, Reinsurance offers insurance-linked securities and other insurance-related capital market products in both Property & Casualty and Life & Health.
Property & Casualty includes the business lines property, casualty (including motor) and specialty. Life & Health includes the life and health lines of business.
Corporate Solutions Corporate Solutions offers innovative insurance capacity to mid-sized and large multinational corporations across the globe. Offerings range from standard risk transfer covers and multi-line programmes to customised solutions tailored to the needs of clients. Corporate Solutions serves customers from over 50 offices worldwide.
Life Capital Life Capital manages Swiss Re’s primary life and health business. It encompasses the closed and open life and health insurance books, including the ReAssure business and the primary life and health insurance business comprising elipsLife and iptiQ. Through ReAssure, Swiss Re acquires closed blocks of inforce life and health insurance business, either through reinsurance or corporate acquisition, and typically assumes responsibility for administering the underlying policies. The administration of the business may be managed directly or, where appropriate, in partnership with a third party. In the open books business, elipsLife, the Group life and health insurance business, offers solutions to pension funds, corporates and affinity groups through an intermediated business to business to consumer (“B2B2C”) model. The iptiQ business, primarily the individual life and health business, partners with distributors and enables individuals to address their protection needs on a white labelled basis.
Group items Items not allocated to the business segments are included in the “Group items” column, which encompasses Swiss Re Ltd, the Group’s ultimate parent company, the former Legacy business in run-off, Principal Investments and certain Treasury units. Swiss Re Ltd charges trademark licence fees to the business segments which are reported as other revenues. Certain administrative expenses of the corporate centre functions that are not recharged to the operating segments are reported as Group items.
Consolidation Segment information is presented net of external and internal retrocession and other intra-group arrangements. The Group total is obtained after elimination of intra-group transactions in the “Consolidation” column. This includes significant intra-group reinsurance arrangements, recharge of trademark licence fees and intersegmental funding.

Financial statements Notes to the Group financial statements
212 Swiss Re 2018 Financial Report
a) Business segments – income statement For the year ended 31 December
2017 Property & Casualty Reinsurance
Life & Health Reinsurance
Corporate Solutions Life Capital Group items Consolidation Total USD millions
Revenues Gross premiums written 16 544 13 313 4 193 1 761 –1 036 34 775
Net premiums written 16 031 11 826 3 600 859 32 316 Change in unearned premiums 636 25 51 91 803
Premiums earned 16 667 11 851 3 651 950 33 119 Fee income from policyholders 129 457 586 Net investment income – non-participating business 1 017 1 308 161 1 193 184 –155 3 708 Net realised investment gains/losses – non-participating business 613 591 128 133 262 1 727 Net investment result – unit-linked and with-profit business 81 3 234 3 315 Other revenues 48 3 5 2 359 –385 32
Total revenues 18 345 13 963 3 945 5 969 805 –540 42 487
Expenses Claims and claim adjustment expenses –13 172 –3 558 –16 730 Life and health benefits –9 211 –1 872 –11 083 Return credited to policyholders –119 –3 179 –3 298 Acquisition costs –4 253 –2 064 –554 –106 –6 977 Operating expenses –1 159 –754 –759 –514 –474 352 –3 308
Total expenses before interest expenses –18 584 –12 148 –4 871 –5 671 –474 352 –41 396
Income/loss before interest and income tax expense/benefit –239 1 815 –926 298 331 –188 1 091 Interest expenses –280 –315 –23 –35 –101 188 –566
Income/loss before income tax expense/benefit –519 1 500 –949 263 230 0 525 Income tax expense/benefit 125 –360 203 –102 2 –132
Net income/loss before attribution of non-controlling interests –394 1 140 –746 161 232 0 393
Income/loss attributable to non-controlling interests 5 5
Net income/loss after attribution of non-controlling interests –394 1 140 –741 161 232 0 398
Interest on contingent capital instruments, net of tax –19 –48 –67
Net income/loss attributable to common shareholders –413 1 092 –741 161 232 0 331
Claims ratio in % 79.0 97.4 82.3 Expense ratio in % 32.5 36.0 33.1 Combined ratio in % 111.5 133.4 115.4 Management expense ratio in % 5.7 Net operating margin in % –1.3 13.1 –23.5 10.9 2.8
Swiss Re 2018 Financial Report 213
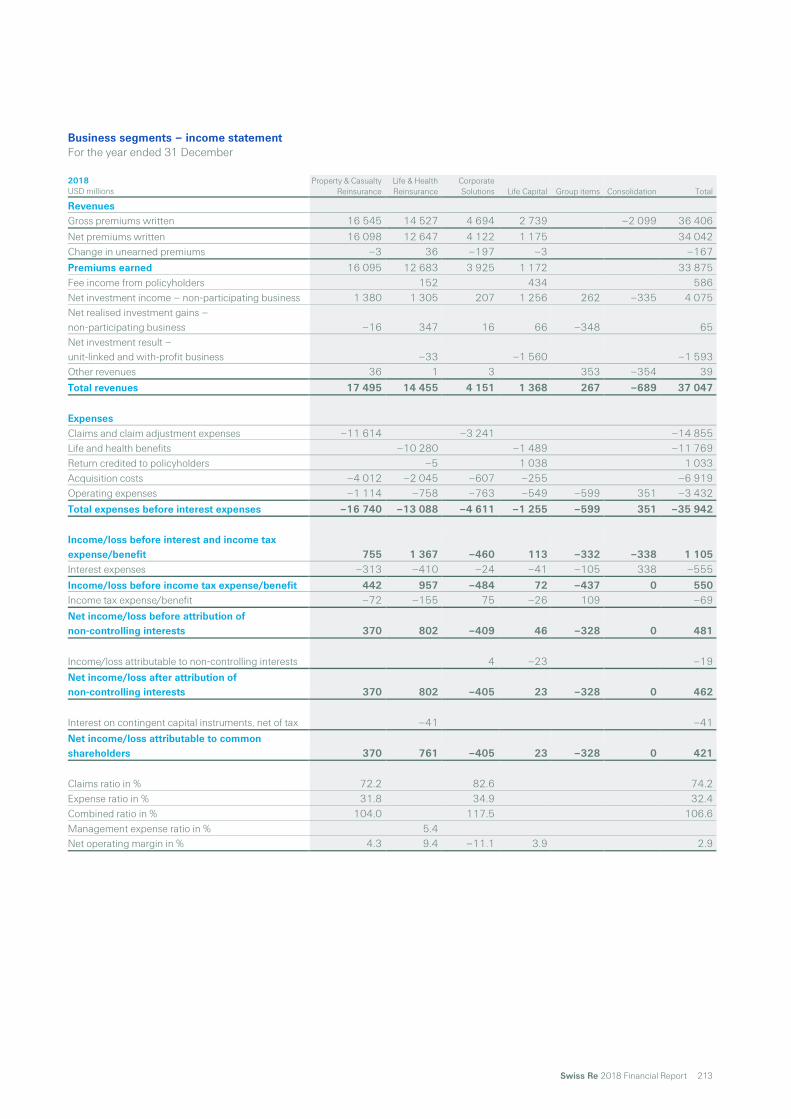
Business segments – income statement For the year ended 31 December
2018 Property & Casualty Reinsurance
Life & Health Reinsurance
Corporate Solutions Life Capital Group items Consolidation Total USD millions
Revenues Gross premiums written 16 545 14 527 4 694 2 739 –2 099 36 406
Net premiums written 16 098 12 647 4 122 1 175 34 042 Change in unearned premiums –3 36 –197 –3 –167
Premiums earned 16 095 12 683 3 925 1 172 33 875 Fee income from policyholders 152 434 586 Net investment income – non-participating business 1 380 1 305 207 1 256 262 –335 4 075 Net realised investment gains – non-participating business –16 347 16 66 –348 65 Net investment result – unit-linked and with-profit business –33 –1 560 –1 593 Other revenues 36 1 3 353 –354 39
Total revenues 17 495 14 455 4 151 1 368 267 –689 37 047
Expenses Claims and claim adjustment expenses –11 614 –3 241 –14 855 Life and health benefits –10 280 –1 489 –11 769 Return credited to policyholders –5 1 038 1 033 Acquisition costs –4 012 –2 045 –607 –255 –6 919 Operating expenses –1 114 –758 –763 –549 –599 351 –3 432
Total expenses before interest expenses –16 740 –13 088 –4 611 –1 255 –599 351 –35 942
Income/loss before interest and income tax expense/benefit 755 1 367 –460 113 –332 –338 1 105 Interest expenses –313 –410 –24 –41 –105 338 –555
Income/loss before income tax expense/benefit 442 957 –484 72 –437 0 550 Income tax expense/benefit –72 –155 75 –26 109 –69
Net income/loss before attribution of non-controlling interests 370 802 –409 46 –328 0 481
Income/loss attributable to non-controlling interests 4 –23 –19
Net income/loss after attribution of non-controlling interests 370 802 –405 23 –328 0 462
Interest on contingent capital instruments, net of tax –41 –41
Net income/loss attributable to common shareholders 370 761 –405 23 –328 0 421
Claims ratio in % 72.2 82.6 74.2 Expense ratio in % 31.8 34.9 32.4 Combined ratio in % 104.0 117.5 106.6 Management expense ratio in % 5.4 Net operating margin in % 4.3 9.4 –11.1 3.9 2.9

Financial statements Notes to the Group financial statements
214 Swiss Re 2018 Financial Report
Business segments – balance sheet As of 31 December
2017 Property & Casualty Reinsurance
Life & Health Reinsurance
Corporate Solutions Life Capital Group items Consolidation Total USD millions
Assets Fixed income securities 34 189 32 642 8 356 26 528 71 101 786 Equity securities 1 893 945 455 32 540 3 865 Other investments 14 460 3 212 191 2 697 5 530 –9 856 16 234 Short-term investments 1 608 996 482 1 711 49 4 846 Investments for unit-linked and with-profit business 585 34 581 35 166 Cash and cash equivalents 1 334 1 595 654 2 959 264 6 806 Deferred acquisition costs 2 146 4 234 454 37 6 871 Acquired present value of future profits 921 1 068 1 989 Reinsurance recoverable 2 541 4 638 5 737 5 200 –10 174 7 942 Other reinsurance assets 10 293 10 669 2 477 7 666 2 –8 118 22 989 Goodwill 1 944 1 873 213 142 4 172 Other 10 067 2 249 1 717 2 100 1 819 –8 092 9 860
Total assets 80 475 64 559 20 736 84 721 8 275 –36 240 222 526
Liabilities Unpaid claims and claim adjustment expenses 45 276 12 129 11 818 2 308 –4 736 66 795 Liabilities for life and health policy benefits 18 230 279 29 491 –5 439 42 561 Policyholder account balances 1 574 35 963 37 537 Other reinsurance liabilities 10 245 5 528 4 177 4 410 2 –8 448 15 914 Short-term debt 807 4 766 904 60 –6 104 433 Long-term debt 3 500 6 914 497 1 603 –2 366 10 148 Other 9 891 7 197 1 411 2 954 2 538 –9 147 14 844
Total liabilities 69 719 56 338 18 182 77 633 2 600 –36 240 188 232
Shareholders’ equity 10 755 8 221 2 385 7 088 5 675 0 34 124
Non-controlling interests 1 169 170
Total equity 10 756 8 221 2 554 7 088 5 675 0 34 294
Total liabilities and equity 80 475 64 559 20 736 84 721 8 275 –36 240 222 526

Swiss Re 2018 Financial Report 215
Business segments – balance sheet As of 31 December
2018 Property & Casualty Reinsurance
Life & Health Reinsurance
Corporate Solutions Life Capital Group items Consolidation Total USD millions
Assets Fixed income securities 35 968 29 158 8 157 22 637 32 95 952 Equity securities 1 776 670 180 69 341 3 036 Other investments 13 298 3 200 132 2 550 6 447 –12 276 13 351 Short-term investments 2 547 1 174 451 1 207 38 5 417 Investments for unit-linked and with-profit business 424 29 122 29 546 Cash and cash equivalents 1 651 1 705 796 1 605 228 5 985 Deferred acquisition costs 2 156 4 784 488 789 8 217 Acquired present value of future profits 804 1 014 1 818 Reinsurance recoverable 2 345 4 359 5 486 4 914 –10 046 7 058 Other reinsurance assets 9 715 9 304 2 461 6 859 –5 541 22 798 Goodwill 1 908 1 823 206 134 4 071 Other 8 798 4 169 2 108 1 823 1 752 –8 329 10 321
Total assets 80 162 61 574 20 465 72 723 8 838 –36 192 207 570
Liabilities Unpaid claims and claim adjustment expenses 45 659 12 192 11 929 2 601 1 –4 936 67 446 Liabilities for life and health policy benefits 17 888 501 26 314 –5 110 39 593 Policyholder account balances 1 356 30 582 31 938 Other reinsurance liabilities 10 331 4 162 3 816 3 365 3 –5 812 15 865 Short-term debt 2 735 5 075 238 –6 415 1 633 Long-term debt 2 402 7 749 798 1 515 552 –4 514 8 502 Other 9 551 6 878 1 483 2 342 3 017 –9 405 13 866
Total liabilities 70 678 55 300 18 527 66 957 3 573 –36 192 178 843
Shareholders’ equity 9 483 6 274 1 795 5 113 5 265 0 27 930
Non-controlling interests 1 143 653 797
Total equity 9 484 6 274 1 938 5 766 5 265 0 28 727
Total liabilities and equity 80 162 61 574 20 465 72 723 8 838 –36 192 207 570

Financial statements Notes to the Group financial statements
216 Swiss Re 2018 Financial Report
b) Property & Casualty Reinsurance business segment – by line of business For the year ended 31 December
2017 USD millions Property Casualty Specialty Unallocated Total
Revenues Gross premiums written 6 505 7 715 2 324 16 544
Net premiums written 6 115 7 665 2 251 16 031 Change in unearned premiums 140 435 61 636
Premiums earned 6 255 8 100 2 312 16 667 Net investment income 1 017 1 017 Net realised investment gains/losses 613 613 Other revenues 48 48
Total revenues 6 255 8 100 2 312 1 678 18 345
Expenses Claims and claim adjustment expenses –5 635 –6 041 –1 496 –13 172 Acquisition costs –1 228 –2 414 –611 –4 253 Operating expenses –636 –356 –167 –1 159
Total expenses before interest expenses –7 499 –8 811 –2 274 0 –18 584
Income/loss before interest and income tax expense –1 244 –711 38 1 678 –239 Interest expenses –280 –280
Income/loss before income tax expense –1 244 –711 38 1 398 –519
Claims ratio in % 90.1 74.6 64.7 79.0 Expense ratio in % 29.8 34.2 33.7 32.5 Combined ratio in % 119.9 108.8 98.4 111.5

Swiss Re 2018 Financial Report 217
Property & Casualty Reinsurance business segment – by line of business For the year ended 31 December
2018 Property Casualty Specialty Unallocated Total USD millions
Revenues Gross premiums written 6 403 7 595 2 547 16 545
Net premiums written 6 047 7 548 2 503 16 098 Change in unearned premiums –18 116 –101 –3
Premiums earned 6 029 7 664 2 402 16 095 Net investment income 1 380 1 380 Net realised investment gains/losses –16 –16 Other revenues 36 36
Total revenues 6 029 7 664 2 402 1 400 17 495
Expenses Claims and claim adjustment expenses –4 284 –5 860 –1 470 –11 614 Acquisition costs –1 189 –2 228 –595 –4 012 Operating expenses –547 –388 –179 –1 114
Total expenses before interest expenses –6 020 –8 476 –2 244 0 –16 740
Income/loss before interest and income tax expense 9 –812 158 1 400 755 Interest expenses –313 –313
Income/loss before income tax expense 9 –812 158 1 087 442
Claims ratio in % 71.1 76.5 61.2 72.2 Expense ratio in % 28.8 34.1 32.2 31.8 Combined ratio in % 99.9 110.6 93.4 104.0

Financial statements Notes to the Group financial statements
218 Swiss Re 2018 Financial Report
c) Life & Health Reinsurance business segment – by line of business For the year ended 31 December
2017 Life Health Unallocated Total USD millions
Revenues Gross premiums written 9 525 3 788 13 313
Net premiums written 8 138 3 688 11 826 Change in unearned premiums 79 –54 25
Premiums earned 8 217 3 634 11 851 Fee income from policyholders 129 129 Net investment income – non-participating business 1 023 285 1 308 Net realised investment gains/losses – non-participating business 57 –1 535 591 Net investment result – unit-linked and with-profit business 81 81 Other revenues 3 3
Total revenues 9 510 3 918 535 13 963
Expenses Life and health benefits –6 491 –2 720 –9 211 Return credited to policyholders –119 –119 Acquisition costs –1 432 –632 –2 064 Operating expenses –533 –221 –754
Total expenses before interest expenses –8 575 –3 573 0 –12 148
Income before interest and income tax expense 935 345 535 1 815 Interest expenses –315 –315
Income before income tax expense 935 345 220 1 500
Management expense ratio in % 5.7 5.6 5.7 Net operating margin1 in % 9.9 8.8 13.1
1 Net operating margin is calculated as ”Income before interest and income tax expense” divided by ”Total revenues” excluding ”Net investment result – unit-linked and with-profit business”.

Swiss Re 2018 Financial Report 219
Life & Health Reinsurance business segment – by line of business For the year ended 31 December
2018 Life Health Unallocated Total USD millions
Revenues Gross premiums written 10 356 4 171 14 527
Net premiums written 8 606 4 041 12 647 Change in unearned premiums 29 7 36
Premiums earned 8 635 4 048 12 683 Fee income from policyholders 152 152 Net investment income – non-participating business 1 001 304 1 305 Net realised investment gains/losses – non-participating business 59 –4 292 347 Net investment result – unit-linked and with-profit business –33 –33 Other revenues 1 1
Total revenues 9 815 4 348 292 14 455
Expenses Life and health benefits –7 128 –3 152 –10 280 Return credited to policyholders –5 –5 Acquisition costs –1 449 –596 –2 045 Operating expenses –513 –245 –758
Total expenses before interest expenses –9 095 –3 993 0 –13 088
Income before interest and income tax expense 720 355 292 1 367 Interest expenses –410 –410
Income/loss before income tax expense 720 355 –118 957
Management expense ratio in % 5.2 5.6 5.4 Net operating margin1 in % 7.3 8.2 9.4
1 Net operating margin is calculated as ”Income before interest and income tax expense” divided by ”Total revenues” excluding ”Net investment result – unit-linked and with-profit business”.

Financial statements Notes to the Group financial statements
220 Swiss Re 2018 Financial Report
d) Net premiums earned and fee income from policyholders by geography Net premiums earned and fee income from policyholders by region for the years ended 31 December
USD millions 2017 2018
Americas 16 101 16 075 Europe (including Middle East and Africa) 10 546 11 044 Asia-Pacific 7 058 7 342
Total 33 705 34 461
Net premiums earned and fee income from policyholders by country for the years ended 31 December
USD millions 2017 2018
United States 13 509 13 519 United Kingdom 3 382 3 487 Australia 2 095 2 061 China 1 933 1 644 Japan 1 168 1 426 Germany 1 258 1 226 Canada 1 137 1 209 Switzerland 886 952 Netherlands 502 837 France 730 789 Ireland 673 685 Other 6 432 6 626
Total 33 705 34 461
Net premiums earned and fee income from policyholders are allocated by country, based on the underlying contract.

Swiss Re 2018 Financial Report 221
3 Insurance information Premiums earned and fees assessed against policyholders For the years ended 31 December
2017 Property & Casualty Reinsurance
Life & Health Reinsurance
Corporate Solutions Life Capital Total USD millions
Premiums earned, thereof: Direct 55 3 229 1 465 4 749 Reinsurance 16 901 12 829 862 128 30 720 Intra-group transactions (assumed and ceded) 137 315 –137 –315 0
Premiums earned before retrocession to external parties 17 038 13 199 3 954 1 278 35 469
Retrocession to external parties –371 –1 348 –303 –328 –2 350
Net premiums earned 16 667 11 851 3 651 950 33 119
Fee income from policyholders, thereof:
Direct 362 362 Reinsurance 130 95 225
Gross fee income before retrocession to external parties 130 457 587
Retrocession to external parties –1 –1
Net fee income 0 129 0 457 586
2018 Property & Casualty Reinsurance
Life & Health Reinsurance
Corporate Solutions Life Capital Total USD millions
Premiums earned, thereof: Direct 67 3 429 2 053 5 549 Reinsurance 16 314 13 358 916 110 30 698 Intra-group transactions (assumed and ceded) 161 577 –161 –577 0
Premiums earned before retrocession to external parties 16 475 14 002 4 184 1 586 36 247
Retrocession to external parties –380 –1 319 –259 –414 –2 372
Net premiums earned 16 095 12 683 3 925 1 172 33 875
Fee income from policyholders, thereof:
Direct 337 337 Reinsurance 153 97 250
Gross fee income before retrocession to external parties 153 434 587
Retrocession to external parties –1 –1
Net fee income 0 152 0 434 586

Financial statements Notes to the Group financial statements
222 Swiss Re 2018 Financial Report
Claims and claim adjustment expenses For the year ended 31 December
2017 Property & Casualty Reinsurance
Life & Health Reinsurance
Corporate Solutions Life Capital Total USD millions
Claims paid, thereof: Gross claims paid to external parties –9 866 –9 505 –2 571 –3 170 –25 112 Intra-group transactions (assumed and ceded) –177 –226 177 226 0
Claims before receivables from retrocession to external parties –10 043 –9 731 –2 394 –2 944 –25 112
Retrocession to external parties 279 1 162 192 357 1 990
Net claims paid –9 764 –8 569 –2 202 –2 587 –23 122
Change in unpaid claims and claim adjustment expenses; life and health benefits, thereof:
Gross – with external parties –3 791 –533 –1 016 727 –4 613 Intra-group transactions (assumed and ceded) 365 –53 –365 53 0
Unpaid claims and claim adjustment expenses; life and health benefits before impact of retrocession to external parties –3 426 –586 –1 381 780 –4 613
Retrocession to external parties 18 –56 25 –65 –78
Net unpaid claims and claim adjustment expenses; life and health benefits –3 408 –642 –1 356 715 –4 691
Claims and claim adjustment expenses; life and health benefits –13 172 –9 211 –3 558 –1 872 –27 813
Acquisition costs For the year ended 31 December
2017 Property & Casualty Reinsurance
Life & Health Reinsurance
Corporate Solutions Life Capital Total USD millions
Acquisition costs, thereof: Gross acquisition costs with external parties –4 297 –2 277 –621 –155 –7 350 Intra-group transactions (assumed and ceded) –19 –12 19 12 0
Acquisition costs before impact of retrocession to external parties –4 316 –2 289 –602 –143 –7 350
Retrocession to external parties 63 225 48 37 373
Net acquisition costs –4 253 –2 064 –554 –106 –6 977

Swiss Re 2018 Financial Report 223
Claims and claim adjustment expenses For the year ended 31 December
2018 Property & Casualty Reinsurance
Life & Health Reinsurance
Corporate Solutions Life Capital Total USD millions
Claims paid, thereof: Gross claims paid to external parties –10 802 –10 346 –3 150 –3 454 –27 752 Intra-group transactions (assumed and ceded) –209 –408 209 408 0
Claims before receivables from retrocession to external parties –11 011 –10 754 –2 941 –3 046 –27 752
Retrocession to external parties 748 1 214 444 501 2 907
Net claims paid –10 263 –9 540 –2 497 –2 545 –24 845
Change in unpaid claims and claim adjustment expenses; life and health benefits, thereof:
Gross – with external parties –1 251 –629 –261 1 031 –1 110 Intra-group transactions (assumed and ceded) 294 –78 –294 78 0
Unpaid claims and claim adjustment expenses; life and health benefits before impact of retrocession to external parties –957 –707 –555 1 109 –1 110
Retrocession to external parties –394 –33 –189 –53 –669
Net unpaid claims and claim adjustment expenses; life and health benefits –1 351 –740 –744 1 056 –1 779
Claims and claim adjustment expenses; life and health benefits –11 614 –10 280 –3 241 –1 489 –26 624
Acquisition costs For the year ended 31 December
2018 Property & Casualty Reinsurance
Life & Health Reinsurance
Corporate Solutions Life Capital Total USD millions
Acquisition costs, thereof: Gross acquisition costs with external parties –4 073 –2 211 –660 –364 –7 308 Intra-group transactions (assumed and ceded) –4 –58 4 58 0
Acquisition costs before impact of retrocession to external parties –4 077 –2 269 –656 –306 –7 308
Retrocession to external parties 65 224 49 51 389
Net acquisition costs –4 012 –2 045 –607 –255 –6 919

Financial statements Notes to the Group financial statements
224 Swiss Re 2018 Financial Report
Reinsurance recoverable on unpaid claims and policy benefits As of 31 December 2017 and 2018, the Group had a reinsurance recoverable of USD 7 942 million and USD 7 058 million, respectively. The concentration of credit risk is regularly monitored and evaluated. The reinsurance programme with Berkshire Hathaway and subsidiaries accounted for 34% and 29% of the Group’s reinsurance recoverable as of year-end 2017 and 2018, respectively.
Reinsurance receivables Reinsurance receivables as of 31 December were as follows:
USD millions 2017 2018
Premium receivables invoiced 3 135 3 041 Receivables invoiced from ceded re/insurance business 427 445 Assets arising from the application of the deposit method of accounting and meeting the definition of financing receivables 147 124 Recognised allowance –71 –58
Policyholder dividends Policyholder dividends are recognised as an element of policyholder benefits. The relative percentage of participating insurance of the life and health policy benefits in 2017 and 2018 was 10% and 9%, respectively. The amount of policyholder dividend expense in 2017 and 2018 was USD 194 million and USD 245 million, respectively. The Group revised the presentation of policyholder dividend expense. Comparative information for 2017 has been adjusted accordingly.

Swiss Re 2018 Financial Report 225
This page is intentionally left blank.

Financial statements Notes to the Group financial statements
226 Swiss Re 2018 Financial Report
4 Premiums written For the years ended 31 December
2017 Property & Casualty Reinsurance
Life & Health Reinsurance
Corporate Solutions Life Capital Consolidation Total USD millions
Gross premiums written, thereof: Direct 55 3 279 1 489 4 823 Reinsurance 16 290 12 732 802 128 29 952 Intra-group transactions (assumed) 254 526 112 144 –1 036 0
Gross premiums written 16 544 13 313 4 193 1 761 –1 036 34 775 Intra-group transactions (ceded) –112 –144 –254 –526 1 036 0
Gross premiums written before retrocession to external parties 16 432 13 169 3 939 1 235 34 775
Retrocession to external parties –401 –1 343 –339 –376 –2 459
Net premiums written 16 031 11 826 3 600 859 0 32 316
2018 Property & Casualty Reinsurance
Life & Health Reinsurance
Corporate Solutions Life Capital Consolidation Total USD millions
Gross premiums written, thereof: Direct 67 3 648 2 055 5 770 Reinsurance 16 269 13 310 947 110 30 636 Intra-group transactions (assumed) 276 1 150 99 574 –2 099 0
Gross premiums written 16 545 14 527 4 694 2 739 –2 099 36 406 Intra-group transactions (ceded) –99 –574 –276 –1 150 2 099 0
Gross premiums written before retrocession to external parties 16 446 13 953 4 418 1 589 36 406
Retrocession to external parties –348 –1 306 –296 –414 –2 364
Net premiums written 16 098 12 647 4 122 1 175 0 34 042

Swiss Re 2018 Financial Report 227
5 Unpaid claims and claim adjustment expenses A reconciliation of the opening and closing reserve balances for unpaid claims and claim adjustment expenses for the years ended 31 December is presented as follows:
USD millions 2017 2018
Balance as of 1 January 57 355 66 795 Reinsurance recoverable −4 044 −4 458 Deferred expense on retroactive reinsurance −211 −240
Net balance as of 1 January 53 100 62 097
Incurred related to:
Current year1 28 827 27 457 Prior year1 −534 42
Amortisation of deferred expense on retroactive reinsurance and impact of commutations −5 −41
Total incurred 28 288 27 458
Paid related to:
Current year −8 859 −9 344 Prior year −14 263 −15 501
Total paid −23 122 −24 845
Foreign exchange 2 653 −1 748 Effect of acquisitions, disposals, new retroactive reinsurance and other items 1 178 709
Net balance as of period end 62 097 63 671
Reinsurance recoverable 4 458 3 606 Deferred expense on retroactive reinsurance 240 169
Balance as of period end 66 795 67 446
1 The Group revised its methodology for determining the prior-year net claims and claim adjustment expenses development on a certain health business. Comparative information for 2017 has been amended accordingly.
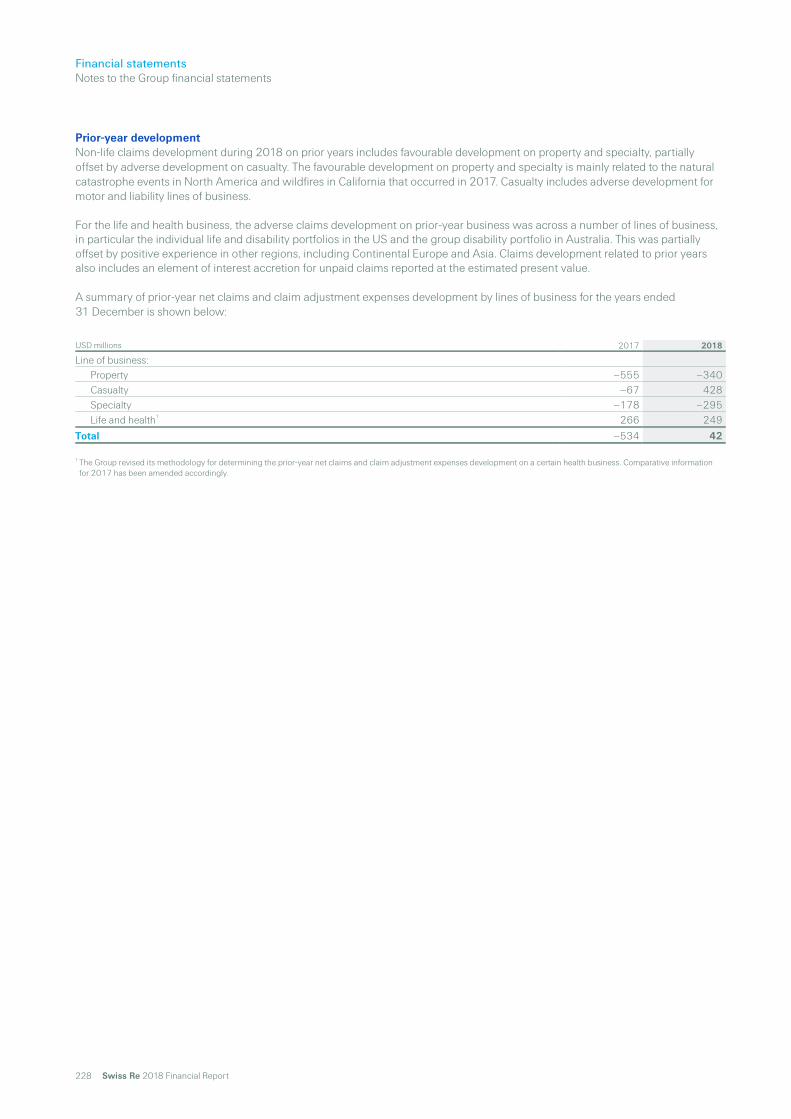
Financial statements Notes to the Group financial statements
228 Swiss Re 2018 Financial Report
Prior-year development Non-life claims development during 2018 on prior years includes favourable development on property and specialty, partially offset by adverse development on casualty. The favourable development on property and specialty is mainly related to the natural catastrophe events in North America and wildfires in California that occurred in 2017. Casualty includes adverse development for motor and liability lines of business.
For the life and health business, the adverse claims development on prior-year business was across a number of lines of business, in particular the individual life and disability portfolios in the US and the group disability portfolio in Australia. This was partially offset by positive experience in other regions, including Continental Europe and Asia. Claims development related to prior years also includes an element of interest accretion for unpaid claims reported at the estimated present value. A summary of prior-year net claims and claim adjustment expenses development by lines of business for the years ended 31 December is shown below:
1 The Group revised its methodology for determining the prior-year net claims and claim adjustment expenses development on a certain health business. Comparative information for 2017 has been amended accordingly.
USD millions 2017 2018
Line of business: Property –555 –340 Casualty –67 428 Specialty –178 –295 Life and health1 266 249
Total –534 42
Swiss Re 2018 Financial Report 229
US asbestos and environmental claims exposure The Group’s obligation for claims payments and claims settlement charges also includes obligations for long-latent injury claims arising out of policies written prior to 1986, in particular in the area of US asbestos and environmental liability.
At the end of 2018, the Group carried net reserves for US asbestos and environmental liabilities equal to USD 1 860 million. During 2018, the Group incurred net losses of USD 141 million and paid net against these liabilities of USD 111 million. Incurred claims include a settlement with one cedent on reported asbestos and environmental claims.
Estimating ultimate asbestos and environmental liabilities is particularly complex for a number of reasons, relating in part to the long period between exposure and manifestation of claims and in part to other factors, which include risks and lack of predictability inherent in complex litigation, changes in projected costs to resolve and in the projected number of asbestos and environmental claims, the effect of bankruptcy protection, insolvencies and changes in the legal, legislative and regulatory environment. As a result, the Group believes that projection of exposures for asbestos and environmental claims is subject to far less predictability relative to non-environmental and non-asbestos exposures. Management believes that its reserves for asbestos and environmental claims are appropriately established based upon known facts and the current state of the law. However, reserves are subject to revision as new information becomes available and as claims develop. Additional liabilities may arise for amounts in excess of reserves, and the Group’s estimate of claims and claim adjustment expenses may change. Any such additional liabilities or increases in estimates cannot be reasonably estimated in advance but could result in charges that could be material to operating results.

Financial statements Notes to the Group financial statements
230 Swiss Re 2018 Financial Report
Short duration contract unpaid claims and claim adjustment expenses Basis of presentation for claims development information This section of the note provides claims development information on an accident year basis.
Claims development information and information on reserves for claims relating to insured events that have occurred but have not yet been reported or not enough reported (“IBNR”) are generally presented by line of business for individually significant categories. Starting from a line of business split, additional aggregation or disaggregation is provided where appropriate, necessary and practicable (“disaggregation categories”). For instance, Reinsurance liability and motor lines of business are further disaggregated into proportional and non-proportional treaty types to provide more specific information on claims development, whereas specialty is shown as one distinct category.
In the Property & Casualty Reinsurance and Corporate Solutions segments, all contracts that transfer significant insurance risk are included in scope to the extent they can be allocated to a disaggregation category. For many reinsurance contracts, proportional contracts in particular, ceding companies do not report losses by accident year. In these cases, the Group has allocated reported losses by underwriting year to accident year to produce the accident year tables. Similarly, IBNR is calculated on an underwriting year basis and then the liabilities are allocated to accident year.
In the Life & Health Reinsurance segment, contracts classified as short duration include group life business, certain types of disability and long-term care contracts, group accident, health coverage including critical illness and medical expenses. The Group provides claims development information for Life & Health Reinsurance where reported accident year information is available and there is potential for claims development. This primarily applies to the Group‘s disability lines classified as short duration. This business is generally considered to have relatively higher claims estimation uncertainty than other life and health lines such as group life, due to longer claims development periods.
In the Life Capital segment, short duration contracts include mainly disability medical expenses business. The Group provides no claims development information for Life Capital as its short duration reserves are not material.
Amounts shown in the claims development tables are net of external retrocession and retrocession between business segments to the extent a retrocession program can be allocated to a disaggregation category. Ceded retroactive reinsurance is not included in the claims development table if it cannot be allocated on a reasonable basis to the disaggregation categories used to present claims development information.
Claims development information and information on IBNR reserves are shown on a nominal basis, also for cases where the Group discounts claims liabilities for measurement under US GAAP. Information is shown per accident year and by reporting period. The number of years shown in the claims development tables differs by business segment:
For Property & Casualty Reinsurance and for Life & Health Reinsurance long-tail, the Group discloses data for ten accident years and reporting periods.
The Corporate Solutions business segment was created in 2012. Therefore, seven accident years and reporting periods are shown for this business unit. All but an immaterial portion of claims arising from accident years prior to 2012 relate to accident years which are over ten years ago and therefore out of the required range of disclosure. Business ceded to Property & Casualty Reinsurance prior to 2012 is included in the net claims development information reported by this segment.
The current reporting period estimate of net claims liabilities for accident years older than the number of years shown in the claims development tables is presented as a total after disclosure of cumulative paid claims.
The information presented in claims development tables is presented at current balance sheet foreign exchange rates as of the date of these financial statements to permit an analysis of claims development excluding the impact of foreign exchange movements.
Some of the information provided in the following tables, is Required Supplementary Information (RSI) under US GAAP. Therefore it does not form part of these consolidated audited financial statements. Claims development information for all periods except the current reporting period and any information derived from it – including average annual percentage payout of claims incurred – is considered RSI and is identified as RSI in the tables presented.
Swiss Re 2018 Financial Report 231
Methodology for determining the presented amounts of liabilities for IBNR claims The liability for unpaid claims and claim adjustment expenses is based on an estimate of the ultimate cost of settling the claims based on both information reported to us by ceding companies and internal estimates.
Non-life re/insurance contracts For reinsurance business, cedents report their case reserves and their estimated IBNR to the Group. The Group develops and recognises its own estimate of IBNR claims, which includes circumstances in which the cedent has not reported any claims to the Group or where the Group‘s estimate of reserves needed to cover reported claims differs from the amounts reported by cedents. For reinsurance business, case reserves and estimated IBNR reported by cedents to the Group have been accounted for as case reserves in previous years. For the year-end 2018, IBNR reported by cedents are presented together with the Group's own estimate of IBNR as IBNR in the claims development tables. Reserving for insurance business is performed similarly, except that the Group estimates case reserves as well. Reserving is done on portfolio or contract level depending on the features of the contract:
For business reviewed on a portfolio level, the expected ultimate losses are set for most lines and types of business based on analysis performed using standard actuarial techniques. In general, contracts are aggregated into portfolios by combining contracts with similar features.
In most cases, these standard actuarial techniques encompass a number of loss development factor techniques applied to claim tables of paid and reported losses. Other actuarial techniques may be applicable to specific categories. For instance, the analysis of frequency and severity could be applied in all disaggregation categories. Life contingency techniques for projecting regular payments related to bodily injury claims are applied to motor proportional, motor non-proportional, liability proportional, liability non-proportional, accident and health and similar Corporate Solutions lines, where the information is available. In some cases, techniques specific to the projection of future payments for specific risks such as asbestos or pollution claims are applied to both proportional and non-proportional liability claims, also in Corporate Solutions (see also separate section “US asbestos and environmental claims exposure” on page 229).
Contract-level reserving is based on standard actuarial techniques but requires more detailed contract, pricing, claim and exposure information than required for the business reviewed on a portfolio level.
In addition, the following applies to all non-life re/insurance business:
For the most recent underwriting years, reliance may be made on the Group‘s costing and underwriting functions for the initial estimates of claims, although the initial reserving estimates may differ from these pricing estimates if there is good reason to believe losses are likely to emerge higher or lower, and in light of the limited claims experience to date. Reviews of those initial estimates are performed regularly, forming a basis for adjustments on both the current and prior underwriting years.
The reserving process considers any information available in respect of either a specific case or a large loss event and the impact of any unusual features in the technical accounting of information provided by cedents.
Life and health re/insurance contracts For the Life & Health Reinsurance long tail business, the liability for IBNR claims includes provision for “not yet reported claims” expected to have been incurred in respect of both already processed and not yet processed reinsurance accounts and generally includes provisions for the cost of claims on disability contracts that currently are within their deferred period. The IBNR reserving calculations have been made using appropriate techniques, such as chain ladder and/or Bornhuetter-Ferguson approaches, depending upon the level of detail available and the assumed level of development of the claim. For certain lines of business, IBNR claims reserves include reported but not admitted claims, allowing for expected rates of decline for these claims.
Claims frequency information Claims frequency information is not available for the disaggregation categories of Property & Casualty Reinsurance, as cedents do not report claims frequency information to the Group for most of the assumed reinsurance contract types. These contracts are to be found in all disaggregation categories presented.
Life & Health Reinsurance reports claims frequency information based on individual incidence. The number of reported claims is the actual number of claims booked. For Group income protection business, claims with multiple payments in a year are counted as one claim with the corresponding amount annualised. Claims that are reported but not admitted are included in the claim count.
For Corporate Solutions, claims frequency is displayed for direct business only, as individual claims information is generally not available for assumed and ceded business. Claims are counted individually per contract to produce the claims frequency table. For some direct business, summary reports are received and multiple claims are booked under a single claim code; this is usually done at a program, policy year, state, country and/or line of business level of detail. This approach may be applied to business which has a high volume of claim counts, but with only minor claims dollars associated with each claim.

Financial statements Notes to the Group financial statements
232 Swiss Re 2018 Financial Report
Property & Casualty Reinsurance – Property Incurred claims and allocated claim adjustment expenses, net of reinsurance
USD millions Reporting year
Accident year 2009 2010 2011 2012 2013 2014 2015 2016 2017 2018 thereof
IBNR
2009 2 341 2 356 2 237 2 194 2 172 2 170 2 168 2 170 2 141 2 148 12 2010 2 521 2 469 2 338 2 357 2 441 2 483 2 590 2 563 2 523 29 2011 4 303 4 354 4 168 4 222 4 174 4 169 4 187 4 224 13 2012 2 696 2 524 2 324 2 281 2 252 2 236 2 237 8 2013 3 130 3 146 2 972 2 887 2 865 2 849 1 2014 2 732 2 572 2 393 2 361 2 358 4 2015 2 830 2 764 2 594 2 562 67 2016 3 902 3 627 3 333 40 2017 RSI 6 032 5 937 598
2018 4 656 2 604
Total 32 827 3 376
Cumulative claims paid and allocated claim adjustment expenses, net of reinsurance
USD millions Reporting year
Accident year 2009 2010 2011 2012 2013 2014 2015 2016 2017 2018
2009 559 1 608 1 924 2 026 2 076 2 097 2 107 2 118 2 103 2 110 2010 389 1 511 1 805 1 914 2 110 2 263 2 405 2 448 2 461 2011 671 2 394 3 197 3 635 3 917 4 018 4 138 4 159 2012 239 1 591 1 981 2 101 2 144 2 164 2 175 2013 541 1 999 2 504 2 698 2 758 2 780 2014 464 1 708 2 089 2 218 2 262 2015 467 1 654 2 172 2 338 2016 636 2 210 2 842 2017 RSI 980 3 672
2018 634
Total 25 433
All liabilities before 2009 139
Liabilities for claims and claim adjustment expenses, net of reinsurance 7 533
Average annual percentage payout of incurred claims by age, net of reinsurance
Years 1 2 3 4 5 6 7 8 9 10
Property (RSI) 17.4% 48.6% 17.0% 6.2% 3.8% 2.2% 2.4% 0.9% -0.1% 0.3%
The liability for unpaid claims and claim adjustment expenses for property in Property & Casualty Reinsurance shows positive development on most recent accident years. Claims in accident year 2011 were at a high level due to several large natural catastrophes including the earthquake and tsunami in Japan, the earthquakes in Christchurch, New Zealand, and floods in Thailand. The 2017 accident year claims incurred are higher due to natural catastrophes, mainly stemming from cyclone Debbie, hurricanes Harvey, Irma and Maria in the Americas, the two earthquakes in Mexico and the wildfires in California. The 2018 accident year claims incurred are lower than 2017 but include a higher level of natural catastrophes than 2012 to 2016.

Swiss Re 2018 Financial Report 233
Property & Casualty Reinsurance – Liability, proportional Incurred claims and allocated claim adjustment expenses, net of reinsurance
USD millions Reporting year
Accident year 2009 2010 2011 2012 2013 2014 2015 2016 2017 2018 thereof
IBNR
2009 726 861 980 937 932 910 921 930 926 880 38 2010 835 982 921 901 897 901 889 854 829 82 2011 639 696 720 668 625 621 598 584 77 2012 519 603 559 530 503 505 487 71 2013 727 750 757 752 757 747 135 2014 994 984 996 980 969 277 2015 1 264 1 312 1 397 1 467 606 2016 1 709 1 737 1 759 899 2017 RSI 1 964 2 072 1 483
2018 1 898 1 714
Total 11 692 5 382
Cumulative claims paid and allocated claim adjustment expenses, net of reinsurance
USD millions Reporting year
Accident year 2009 2010 2011 2012 2013 2014 2015 2016 2017 2018
2009 -60 88 241 365 478 586 635 682 717 720 2010 28 159 317 408 516 612 661 681 707 2011 2 107 180 249 335 381 399 428 2012 13 115 182 240 294 328 364 2013 14 126 232 347 418 493 2014 23 157 291 400 546 2015 34 209 400 627 2016 46 223 497 2017 RSI 50 252
2018 52
Total 4 686
All liabilities before 2009 908
Liabilities for claims and claim adjustment expenses, net of reinsurance 7 914
Average annual percentage payout of incurred claims by age, net of reinsurance
Years 1 2 3 4 5 6 7 8 9 10
Liability, proportional (RSI) 1.4% 14.7% 14.9% 13.0% 12.7% 9.8% 5.5% 4.2% 3.6% 0.3%
The increase in the incurred losses for accident years 2013 to 2018 is driven by volume increases of business being written. The increases in the incurred losses in reporting year 2018 for accident years 2015 to 2017 are driven by US business. In line with the Group‘s policy, cash flows under loss portfolio transfers are reported through claims paid. For longer-tailed lines and depending on the business volume written, timing of cash flows can lead to net inward payments across the whole portfolio in the first development year of the contract for some accident years.

Financial statements Notes to the Group financial statements
234 Swiss Re 2018 Financial Report
Property & Casualty Reinsurance – Liability, non-proportional Incurred claims and allocated claim adjustment expenses, net of reinsurance
USD millions Reporting year
Accident year 2009 2010 2011 2012 2013 2014 2015 2016 2017 2018 thereof
IBNR
2009 509 520 426 425 385 351 327 313 311 304 27 2010 521 436 400 375 354 333 324 311 315 39 2011 401 430 467 426 382 349 336 332 56 2012 329 347 308 280 259 251 241 59 2013 406 388 353 298 270 252 89 2014 432 437 405 362 342 146 2015 1 754 1 793 1 762 1 787 199 2016 585 540 524 250 2017 RSI 494 508 326
2018 450 428
Total 5 055 1 619
Cumulative claims paid and allocated claim adjustment expenses, net of reinsurance
USD millions Reporting year
Accident year 2009 2010 2011 2012 2013 2014 2015 2016 2017 2018
2009 –14 12 32 55 93 155 178 186 195 202 2010 1 11 35 52 87 104 123 158 160 2011 1 9 65 111 138 145 168 181 2012 –4 11 35 53 84 106 136 2013 –2 11 36 59 82 118 2014 –2 8 40 73 118 2015 0 89 193 345 2016 13 145 106 2017 RSI –2 18
2018 –1
Total 1 383
All liabilities before 2009 5 179
Liabilities for claims and claim adjustment expenses, net of reinsurance 8 851
Average annual percentage payout of incurred claims by age, net of reinsurance
Years 1 2 3 4 5 6 7 8 9 10
Liability, non-proportional (RSI) -0.5% 7.0% 7.3% 8.8% 11.1% 10.3% 8.2% 5.9% 1.8% 2.3%
The increase in incurred losses for accident year 2015 compared to other years is due to an increase in volume of business written. Liabilities before 2009 include reserves for historic US Asbestos and Environmental losses. In line with the Group‘s policy, cash flows under loss portfolio transfers are reported through claims paid. For longer-tailed lines and depending on the business volume written, timing of cash flows can lead to net inward payments across the whole portfolio in the first development year of the contract for some accident years.
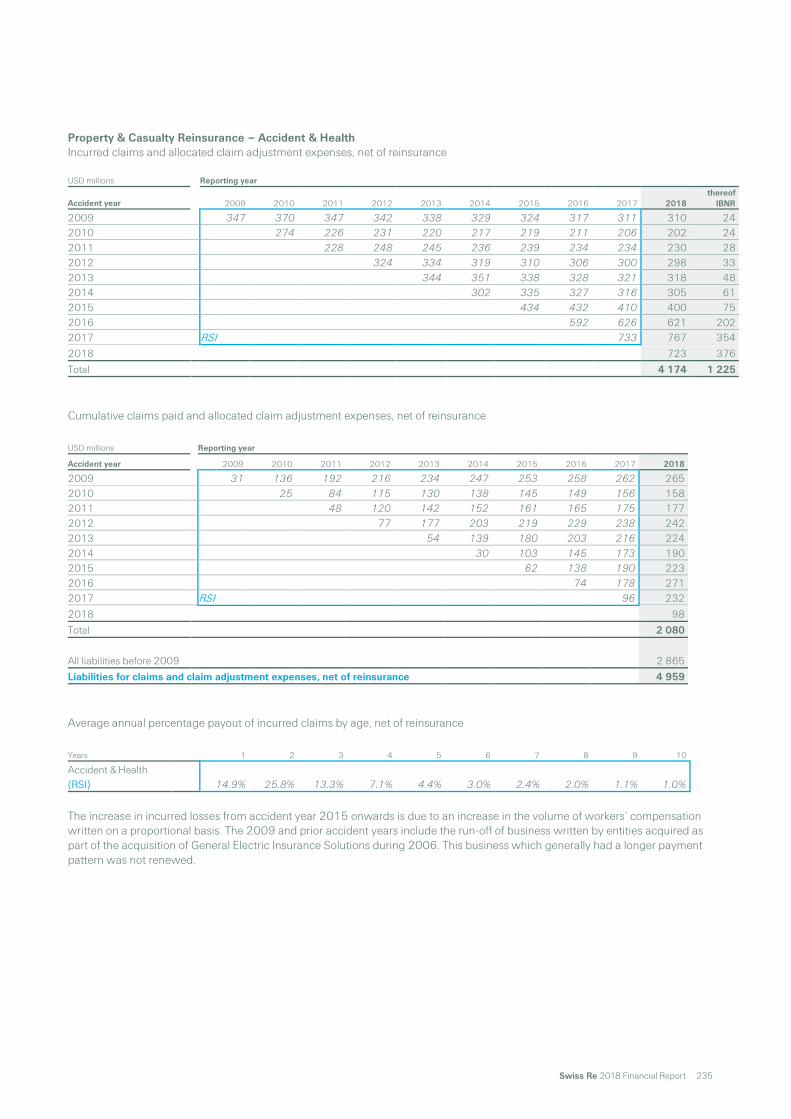
Swiss Re 2018 Financial Report 235
Property & Casualty Reinsurance – Accident & Health Incurred claims and allocated claim adjustment expenses, net of reinsurance
USD millions Reporting year
Accident year 2009 2010 2011 2012 2013 2014 2015 2016 2017 2018 thereof
IBNR
2009 347 370 347 342 338 329 324 317 311 310 24 2010 274 226 231 220 217 219 211 206 202 24 2011 228 248 245 236 239 234 234 230 28 2012 324 334 319 310 306 300 298 33 2013 344 351 338 328 321 318 48 2014 302 335 327 316 305 61 2015 434 432 410 400 75 2016 592 626 621 202 2017 RSI 733 767 354
2018 723 376
Total 4 174 1 225
Cumulative claims paid and allocated claim adjustment expenses, net of reinsurance
USD millions Reporting year
Accident year 2009 2010 2011 2012 2013 2014 2015 2016 2017 2018
2009 31 136 192 216 234 247 253 258 262 265 2010 25 84 115 130 138 145 149 156 158 2011 48 120 142 152 161 165 175 177 2012 77 177 203 219 229 238 242 2013 54 139 180 203 216 224 2014 30 103 145 173 190 2015 62 138 190 223 2016 74 178 271 2017 RSI 96 232
2018 98
Total 2 080
All liabilities before 2009 2 865
Liabilities for claims and claim adjustment expenses, net of reinsurance 4 959
Average annual percentage payout of incurred claims by age, net of reinsurance
Years 1 2 3 4 5 6 7 8 9 10
Accident & Health (RSI) 14.9% 25.8% 13.3% 7.1% 4.4% 3.0% 2.4% 2.0% 1.1% 1.0%
The increase in incurred losses from accident year 2015 onwards is due to an increase in the volume of workers‘ compensation written on a proportional basis. The 2009 and prior accident years include the run-off of business written by entities acquired as part of the acquisition of General Electric Insurance Solutions during 2006. This business which generally had a longer payment pattern was not renewed.

Financial statements Notes to the Group financial statements
236 Swiss Re 2018 Financial Report
Property & Casualty Reinsurance – Motor, proportional Incurred claims and allocated claim adjustment expenses, net of reinsurance
USD millions Reporting year
Accident year 2009 2010 2011 2012 2013 2014 2015 2016 2017 2018 thereof
IBNR
2009 650 646 711 736 723 719 721 719 718 716 –5 2010 591 652 691 697 695 697 697 695 695 –1 2011 998 994 965 922 925 924 922 914 –23 2012 1 487 1 477 1 461 1 449 1 440 1 438 1 435 28 2013 1 554 1 528 1 535 1 509 1 502 1 497 14 2014 1 996 1 959 1 958 1 941 1 931 –2 2015 1 916 1 916 1 920 1 924 25 2016 2 478 2 594 2 644 147 2017 RSI 2 373 2 391 476
2018 2 032 1 149
Total 16 179 1 808
Cumulative claims paid and allocated claim adjustment expenses, net of reinsurance
USD millions Reporting year
Accident year 2009 2010 2011 2012 2013 2014 2015 2016 2017 2018
2009 141 385 585 619 631 682 691 693 696 699 2010 198 453 537 573 651 660 669 673 676 2011 266 670 852 885 904 913 921 924 2012 474 1 104 1 265 1 314 1 345 1 366 1 378 2013 573 1 170 1 352 1 397 1 428 1 444 2014 738 1 468 1 714 1 790 1 826 2015 795 1 440 1 682 1 783 2016 821 1 816 2 163 2017 RSI 759 1 526
2018 624
Total 13 043
All liabilities before 2009 322
Liabilities for claims and claim adjustment expenses, net of reinsurance 3 458
Average annual percentage payout of incurred claims by age, net of reinsurance
Years 1 2 3 4 5 6 7 8 9 10
Motor, proportional (RSI) 32.2% 37.8% 15.2% 4.2% 3.5% 2.4% 1.1% 0.4% 0.4% 0.4%
The increase in the incurred losses from accident year 2010 onwards is driven by new business volume across all regions. Proportional motor business includes both longer-tailed liability business and shorter-tailed hull business.
The negative IBNRs are due to overstated case reserves, mainly on the German business, and accident year 2011 includes the effects of an outwards proportional contract in inwards non-proportional business.

Swiss Re 2018 Financial Report 237
Property & Casualty Reinsurance – Motor, non-proportional Incurred claims and allocated claim adjustment expenses, net of reinsurance
USD millions Reporting year
Accident year 2009 2010 2011 2012 2013 2014 2015 2016 2017 2018 thereof
IBNR
2009 375 390 283 284 270 275 269 267 259 261 66 2010 325 288 283 269 262 255 246 243 245 33 2011 407 445 424 422 407 401 390 416 107 2012 332 349 329 313 315 298 307 65 2013 432 454 457 440 427 432 70 2014 408 441 436 435 428 88 2015 388 409 445 441 118 2016 470 585 549 199 2017 RSI 579 611 276
2018 489 392
Total 4 179 1 414
Cumulative claims paid and allocated claim adjustment expenses, net of reinsurance
USD millions Reporting year
Accident year 2009 2010 2011 2012 2013 2014 2015 2016 2017 2018
2009 1 39 58 70 83 96 107 117 121 125 2010 5 22 48 67 83 100 113 120 130 2011 -10 20 56 79 103 117 133 144 2012 2 25 50 85 111 136 157 2013 7 85 149 194 220 248 2014 4 60 104 144 187 2015 –1 34 92 157 2016 8 65 127 2017 RSI 9 59
2018 4
Total 1 338
All liabilities before 2009 2 877
Liabilities for claims and claim adjustment expenses, net of reinsurance 5 718
Average annual percentage payout of incurred claims by age, net of reinsurance
Years 1 2 3 4 5 6 7 8 9 10
Motor, non-proportional (RSI) 0.7% 10.4% 10.5% 9.1% 7.0% 6.0% 5.1% 3.1% 2.8% 1.5%
Claims development in non-proportional motor business is considered long-tailed as it is dominated by liability exposures leading to bodily injury claims which pay out for the lifetime of the claimant.
For accident year 2011, negative claims paid in the first year are due to the commutation of an external retrocession on acquired retroactive business.
In line with the Group‘s policy, cash flows under loss portfolio transfers are reported through claims paid. For longer-tailed lines and depending on the business volume written, timing of cash flows can lead to net inward payments across the whole portfolio in the first development year of the contract for some accident years.

Financial statements Notes to the Group financial statements
238 Swiss Re 2018 Financial Report
Property & Casualty Reinsurance – Specialty Incurred claims and allocated claim adjustment expenses, net of reinsurance
USD millions Reporting year
Accident year 2009 2010 2011 2012 2013 2014 2015 2016 2017 2018 thereof
IBNR
2009 1 542 1 673 1 485 1 416 1 384 1 361 1 346 1 330 1 303 1 293 2 2010 1 229 1 241 1 186 1 160 1 141 1 110 1 088 1 090 1 081 21 2011 1 292 1 270 1 185 1 102 1 148 1 144 1 159 1 152 8 2012 959 1 019 1 040 1 021 1 021 1 008 994 15 2013 1 095 1 021 981 945 935 912 34 2014 1 108 1 100 999 972 956 60 2015 1 237 1 219 1 205 1 196 116 2016 1 286 1 274 1 228 221 2017 RSI 1 613 1 535 501
2018 1 646 1 194
Total 11 993 2 172
Cumulative claims paid and allocated claim adjustment expenses, net of reinsurance
USD millions Reporting year
Accident year 2009 2010 2011 2012 2013 2014 2015 2016 2017 2018
2009 209 659 910 1 011 1 085 1 143 1 181 1 205 1 218 1 230 2010 197 467 659 759 837 952 973 992 1 004 2011 165 561 778 881 931 967 1 031 1 054 2012 127 444 679 770 827 869 903 2013 148 417 600 710 765 801 2014 173 409 590 688 744 2015 135 387 692 853 2016 143 477 722 2017 RSI 181 580
2018 185
Total 8 076
All liabilities before 2009 658
Liabilities for claims and claim adjustment expenses, net of reinsurance 4 575
Average annual percentage payout of incurred claims by age, net of reinsurance
Years 1 2 3 4 5 6 7 8 9 10
Specialty (RSI) 14.2% 28.3% 20.5% 10.1% 5.8% 5.3% 3.5% 1.9% 1.1% 0.9%
This category contains several individual large losses on marine, aviation and space lines, including the Costa Concordia event in accident year 2012. The 2017 accident year claims incurred is higher due to natural catastrophes mainly stemming from hurricanes Harvey, Irma and Maria in the Americas which have reduced in reporting year 2018. The 2018 accident year claims incurred include natural catastrophes and man-made losses.

Swiss Re 2018 Financial Report 239
Corporate Solutions Incurred claims and allocated claim adjustment expenses, net of reinsurance
USD millions Reporting year
Accident year 2012 2013 2014 2015 2016 2017 2018 thereof IBNR
Cumulative number of
reported claims (in nominals)
2012 1 294 1 223 1 148 1 116 1 112 1 157 1 151 55 12 805 2013 1 593 1 574 1 504 1 421 1 407 1 408 106 25 901 2014 1 826 1 769 1 700 1 675 1 675 215 21 085 2015 1 885 2 052 2 091 2 091 297 17 060 2016 2 011 2 217 2 165 460 15 959 2017 RSI 3 005 3 232 864 18 121
2018 2 697 1 276 11 667
Total 14 419 3 273 122 598
Cumulative claims paid and allocated claim adjustment expenses, net of reinsurance
USD millions Reporting year
Accident year 2012 2013 2014 2015 2016 2017 2018
2012 182 554 714 808 896 967 1 000 2013 272 666 935 1 091 1 158 1 236 2014 271 826 1 117 1 251 1 349 2015 350 907 1 293 1 501 2016 372 1 194 1 421 2017 RSI 382 1 504
2018 416
Total 8 427
All liabilities before 2012 482
Liabilities for claims and claim adjustment expenses, net of reinsurance 6 474
Average annual percentage payout of incurred claims by age, net of reinsurance
Years 1 2 3 4 5 6 7
Corporate Solutions (RSI) 16.1% 32.1% 15.9% 9.3% 6.1% 5.9% 2.9%
The claims incurred increased due to general volume growth for all accident years. Incurred claims on accident years 2016 and 2017 increased due to large man-made losses as well as adverse prior year development, in particularly in casualty North America. Accident years 2017 and 2018 were significantly impacted by multiple severe large man-made losses, hurricanes in North America and the California wildfires.
Change in claim counts in 2013 and 2014 relate mostly to agriculture business written in 2013, leading to high claim counts in those years. For accident year 2017, a portion of the Accident & Health business from the IHC acquisition moved from assumed reinsurance to direct business which is driving the increase in direct claim counts in that year relative to accident year 2016.

Financial statements Notes to the Group financial statements
240 Swiss Re 2018 Financial Report
Life & Health Reinsurance, long tail Incurred claims and allocated claim adjustment expenses, net of reinsurance
USD millions Reporting year
Accident year 2009 2010 2011 2012 2013 2014 2015 2016 2017 2018 thereof
IBNR
Cumulative number of
reported claims (in nominals)
2009 148 154 146 147 147 169 168 169 163 164 16 4 305 2010 184 185 181 204 204 216 191 187 190 20 4 722 2011 210 219 277 289 302 281 275 276 29 6 621 2012 260 347 350 374 339 341 338 29 9 069 2013 468 460 458 423 422 424 33 11 528 2014 458 418 398 399 422 51 13 134 2015 391 424 409 410 64 15 528 2016 411 426 413 126 12 106 2017 RSI 419 424 208 11 126
2018 389 297 3 677
Total 3 450 873 91 816
Cumulative claims paid and allocated claim adjustment expenses, net of reinsurance
USD millions Reporting year
Accident year 2009 2010 2011 2012 2013 2014 2015 2016 2017 2018
2009 7 36 54 67 75 83 88 96 102 108 2010 8 39 61 78 91 102 111 119 125 2011 18 59 96 120 140 160 175 188 2012 26 84 134 171 203 225 243 2013 36 117 178 237 276 302 2014 31 104 190 250 285 2015 34 102 181 229 2016 13 83 152 2017 RSI 11 72
2018 11
Total 1 715
All liabilities before 2009 230
Liabilities for claims and claim adjustment expenses, net of reinsurance 1 965
Average annual percentage payout of incurred claims by age, net of reinsurance
Years 1 2 3 4 5 6 7 8 9 10
Life & Health Reinsurance, long tail (RSI) 5.5% 16.7% 15.2% 10.9% 7.7% 6.1% 4.6% 4.6% 3.4% 3.7%
In the reporting year 2013, the Group significantly strengthened IBNR claims liabilities in Australia for some lines of business. In addition, for 2013 and 2014 the effect of business volume increases is discernible as well. In 2018 the first year incurred claims are below 2017 due to lower volume in Australia.
Swiss Re 2018 Financial Report 241
Reconciliation of gross liability for unpaid claims and claim adjustment expenses The following table reconciles the Group‘s net outstanding liabilities to the gross liabilities for unpaid claims and claim adjustment expenses.
The net outstanding liabilities correspond to the total liabilities for unpaid claims and claim adjustment expenses, net of reinsurance for each disaggregation category.
Other short duration contract lines includes reserves for business that is not material to the Group and where accident year information is not available. For Life & Health Reinsurance, in certain markets, cedents do not provide sufficient information to reinsurers to split claims incurred and claims paid by accident year. This is based on existing market practice. For these markets, an assessment of available information from other sources was made along with investigating approximations that could be used to provide claims development information by accident year. However, these alternate sources and estimates, based on currently available data and methods, could not be used to generate meaningful and representative accident year information and therefore have been excluded from disclosure. Other short duration contract lines also contain other treaties from Property & Casualty Reinsurance and Corporate Solutions which could not be allocated on a consistent basis to disaggregation categories or specific accident years.
For details on consolidation please refer to Note 2.

Financial statements Notes to the Group financial statements
242 Swiss Re 2018 Financial Report
For the year ended 31 December
USD millions 2018
Net outstanding liabilities Property & Casualty Reinsurance
Property 7 533 Liability, proportional 7 914 Liability, non-proportional 8 851 Accident & Health 4 959 Motor, proportional 3 458 Motor, non-proportional 5 718 Specialty 4 575
Corporate Solutions 6 474 Life & Health Reinsurance, long tail 1 965
Total net undiscounted outstanding liabilities excluding other short duration contract lines and before unallocated reinsurance recoverable 51 447 Discounting impact on (Life & Health Reinsurance) short duration contracts –291 Impact of acquisition accounting –554
Total net discounted outstanding liabilities excluding other short duration contract lines and before unallocated reinsurance recoverable 50 602 Other short duration contract lines 2 802
Total net discounted outstanding short duration liabilities 53 404
Allocated reinsurance recoverables on unpaid claims: Property & Casualty Reinsurance
Property 571 Liability, proportional 324 Liability, non-proportional 266 Accident & Health 215 Motor, proportional 76 Motor, non-proportional 237 Specialty 594
Corporate Solutions 4 160 Consolidation –4 113 Impact of acquisition accounting –111 Other short duration contract lines 649
Total short duration reinsurance recoverable on outstanding liabilities 2 868
Exclusions: Unallocated claim adjustment expenses 994 Long duration contracts 10 180
Total other reconciling items 11 174
Total unpaid claims and claim adjustment expenses 67 446

Swiss Re 2018 Financial Report 243
Discounting information The following disclosure covers the discounting impact for the disaggregation categories included in the claims development information. Discounting information for Life & Health Reinsurance long tail as of 31 December was as follows:
USD millions 2017 2018
Carrying amount of discounted claims 1 262 1 223 Aggregate amount of the discount –291 –291 Interest accretion1 28 35 Range of interest rates 2.9% –3.6% 3.0% –3.6%
1 Interest accretion is shown as part of “Life and health benefits” in the income statement.
Please refer to Note 1 for more details about the Group‘s discounting approach for unpaid claims and claim adjustment expenses.

Financial statements Notes to the Group financial statements
244 Swiss Re 2018 Financial Report
6 Deferred acquisition costs (DAC) and acquired present value of future profits (PVFP)
As of 31 December, the DAC were as follows:
2017 Property & Casualty Life & Health Corporate USD millions Reinsurance Reinsurance Solutions Life Capital Total
Opening balance as of 1 January 2 280 3 465 444 11 6 200 Deferred 4 068 1 294 553 71 5 986 Effect of acquisitions/disposals and retrocessions –5 2 5 2 Amortisation –4 255 –508 –549 –67 –5 379 Effect of foreign currency translation and other changes 53 –12 4 17 62
Closing balance 2 146 4 234 454 37 6 871
2018 Property & Casualty Life & Health Corporate USD millions Reinsurance Reinsurance Solutions Life Capital Total
Opening balance as of 1 January 2 146 4 234 454 37 6 871 Deferred 4 048 1 235 634 978 6 895 Amortisation –4 012 –496 –595 –187 –5 290 Effect of foreign currency translation and other changes –26 –189 –5 –39 –259
Closing balance 2 156 4 784 488 789 8 217
Retroceded DAC may arise on retrocession of reinsurance portfolios, including reinsurance undertaken as part of a securitisation. The associated potential retrocession recoveries are determined by the nature of the retrocession agreements and by the terms of the securitisation.

Swiss Re 2018 Financial Report 245
As of 31 December, the PVFP was as follows:
Life & Health Reinsurance Life Capital Total 2017 Positive Negative USD millions PVFP PVFP Total
Opening balance as of 1 January 966 1 558 –521 1 037 2 003 Amortisation –135 –143 45 –98 –233 Interest accrued on unamortised PVFP 52 102 –17 85 137 Effect of change in unrealised gains/losses –1 –1 –1 Effect of foreign currency translation 38 96 –51 45 83
Closing balance 921 1 612 –544 1 068 1 989
Life & Health Reinsurance Life Capital Total 2018 Positive Negative USD millions PVFP PVFP Total
Opening balance as of 1 January 921 1 612 –544 1 068 1 989 Amortisation –140 –170 40 –130 –270 Interest accrued on unamortised PVFP 45 107 –17 90 135 Effect of change in unrealised gains/losses 18 18 18 Effect of foreign currency translation –22 –62 30 –32 –54
Closing balance 804 1 505 –491 1 014 1 818
Retroceded PVFP may arise on retrocession of reinsurance portfolios, including reinsurance undertaken as part of a securitisation. The associated potential retrocession recoveries are determined by the nature of the retrocession agreements and by the terms of the securitisation.
The percentage of PVFP which is expected to be amortised in each of the next five years is 14%, 13%, 12%, 11% and 10%.
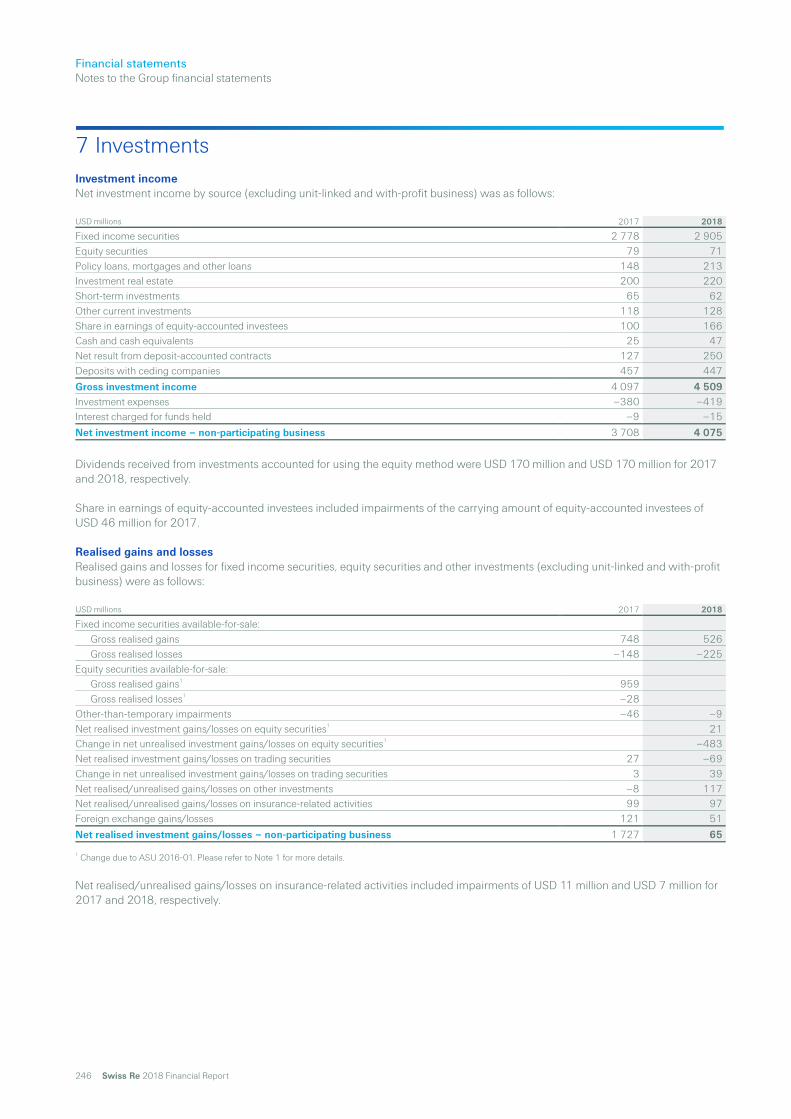
Financial statements Notes to the Group financial statements
246 Swiss Re 2018 Financial Report
7 Investments Investment income Net investment income by source (excluding unit-linked and with-profit business) was as follows:
USD millions 2017 2018
Fixed income securities 2 778 2 905 Equity securities 79 71 Policy loans, mortgages and other loans 148 213 Investment real estate 200 220 Short-term investments 65 62 Other current investments 118 128 Share in earnings of equity-accounted investees 100 166 Cash and cash equivalents 25 47 Net result from deposit-accounted contracts 127 250 Deposits with ceding companies 457 447
Gross investment income 4 097 4 509 Investment expenses –380 –419 Interest charged for funds held –9 –15
Net investment income – non-participating business 3 708 4 075
Dividends received from investments accounted for using the equity method were USD 170 million and USD 170 million for 2017 and 2018, respectively.
Share in earnings of equity-accounted investees included impairments of the carrying amount of equity-accounted investees of USD 46 million for 2017.
Realised gains and losses Realised gains and losses for fixed income securities, equity securities and other investments (excluding unit-linked and with-profit business) were as follows:
USD millions 2017 2018
Fixed income securities available-for-sale: Gross realised gains 748 526 Gross realised losses –148 –225
Equity securities available-for-sale: Gross realised gains1 959 Gross realised losses1 –28
Other-than-temporary impairments –46 –9 Net realised investment gains/losses on equity securities1 21 Change in net unrealised investment gains/losses on equity securities1 –483 Net realised investment gains/losses on trading securities 27 –69 Change in net unrealised investment gains/losses on trading securities 3 39 Net realised/unrealised gains/losses on other investments –8 117 Net realised/unrealised gains/losses on insurance-related activities 99 97 Foreign exchange gains/losses 121 51
Net realised investment gains/losses – non-participating business 1 727 65
1 Change due to ASU 2016-01. Please refer to Note 1 for more details.
Net realised/unrealised gains/losses on insurance-related activities included impairments of USD 11 million and USD 7 million for 2017 and 2018, respectively.

Swiss Re 2018 Financial Report 247
Investment result – unit-linked and with-profit business For unit-linked contracts, the investment risk is borne by the policyholder. For with-profit contracts, the majority of the investment risk is also borne by the policyholder, although there are certain guarantees that limit the downside risk for the policyholder, and a certain proportion of the returns may be retained by the Group (typically 10%).
Net investment result on unit-linked and with-profit business credited to policyholders was as follows:
2017 2018 USD millions Unit-linked With-profit Unit-linked With-profit
Investment income – fixed income securities 69 120 68 120 Investment income – equity securities 705 69 715 72 Investment income – other 20 11 17 10
Total investment income – unit-linked and with-profit business 794 200 800 202
Realised gains/losses – fixed income securities –12 12 –61 –140 Realised gains/losses – equity securities 2 094 191 –2 124 –257 Realised gains/losses – other 28 8 –14 1
Total realised gains/losses – unit-linked and with-profit business 2 110 211 –2 199 –396
Total net investment result – unit-linked and with-profit business 2 904 411 –1 399 –194
Impairment on fixed income securities related to credit losses Other-than-temporary impairments for debt securities are bifurcated between credit and non-credit components, with the credit component recognised through earnings and the non-credit component recognised in other comprehensive income. The credit component of other-than-temporary impairments is defined as the difference between a security’s amortised cost basis and the present value of expected cash flows. Methodologies for measuring the credit component of impairment are aligned to market observer forecasts of credit performance drivers. Management believes that these forecasts are representative of median market expectations.
For securitised products, cash flow projection analysis is conducted by integrating forward-looking evaluation of collateral performance drivers, including default rates, prepayment rates and loss severities and deal-level features, such as credit enhancement and prioritisation among tranches for payments of principal and interest. Analytics are differentiated by asset class, product type and security-level differences in historical and expected performance. For corporate bonds and hybrid debt instruments, an expected loss approach based on default probabilities and loss severities expected in the current and forecasted economic environment is used for securities identified as credit-impaired to project probability-weighted cash flows. Expected cash flows resulting from these analyses are discounted, and the present value is compared to the amortised cost basis to determine the credit component of other-than-temporary impairments.
A reconciliation of other-than-temporary impairments related to credit losses recognised in earnings was as follows:
USD millions 2017 2018
Balance as of 1 January 97 91 Credit losses for which an other-than-temporary impairment was not previously recognised 14 5 Reductions for securities sold during the period –24 –12 Increase of credit losses for which an other-than-temporary impairment has been recognised previously, when the Group does not intend to sell, or more likely than not will not be required to sell before recovery 4 2 Impact of increase in cash flows expected to be collected –4 –4 Impact of foreign exchange movements 4 –2
Balance as of 31 December 91 80

Financial statements Notes to the Group financial statements
248 Swiss Re 2018 Financial Report
Investments available-for-sale Amortised cost or cost, estimated fair values and other-than-temporary impairments of fixed income securities classified as available-for-sale as of 31 December were as follows:
2017 Amortised cost Gross
unrealised Gross
unrealised
Other-than-temporary impairments
recognised in other Estimated USD millions or cost gains losses comprehensive income fair value
Debt securities issued by governments and government agencies:
US Treasury and other US government corporations and agencies 14 397 273 –152 14 518 US Agency securitised products 5 884 18 –66 5 836 States of the United States and political subdivisions of the states 1 620 108 –7 1 721 United Kingdom 8 699 1 378 –31 10 046 Germany 3 193 239 –22 3 410 Canada 3 969 543 –30 4 482 France 2 015 252 –10 2 257 Australia 2 065 16 –4 2 077 Other 7 655 318 –76 7 897
Total 49 497 3 145 –398 52 244 Corporate debt securities 39 510 3 218 –136 42 592 Mortgage- and asset-backed securities 4 271 162 –19 –2 4 412
Fixed income securities available-for-sale 93 278 6 525 –553 –2 99 248
Equity securities available-for-sale 3 544 365 –47 3 862
2018 Amortised cost Gross
unrealised Gross
unrealised
Other-than-temporary impairments
recognised in other Estimated USD millions or cost gains losses comprehensive income fair value
Debt securities issued by governments and government agencies:
US Treasury and other US government corporations and agencies 12 144 218 –156 12 206 US Agency securitised products 6 416 18 –130 6 304 States of the United States and political subdivisions of the states 1 584 55 –19 1 620 United Kingdom 7 837 1 085 –74 8 848 Germany 2 723 229 –7 2 945 Canada 2 721 192 –29 2 884 France 1 723 205 –6 1 922 Australia 1 658 14 –3 1 669 Other 9 026 273 –135 9 164
Total 45 832 2 289 –559 47 562 Corporate debt securities 39 630 1 617 –542 40 705 Mortgage- and asset-backed securities 4 211 117 –56 –1 4 271
Fixed income securities available-for-sale 89 673 4 023 –1 157 –1 92 538
The “Other-than-temporary impairments recognised in other comprehensive income” column includes only securities with a credit-related loss recognised in earnings. Subsequent recovery in fair value of securities previously impaired in other comprehensive income is also presented in the “Other-than-temporary impairments recognised in other comprehensive income” column.

Swiss Re 2018 Financial Report 249
Unrealised losses on securities available-for-sale The following table shows the fair value and unrealised losses of the Group’s fixed income securities, aggregated by investment category and length of time that individual securities were in a continuous unrealised loss position as of 31 December 2017 and 2018.
Less than 12 months 12 months or more Total 2017 Unrealised Unrealised Unrealised USD millions Fair value losses Fair value losses Fair value losses
Debt securities issued by governments and government agencies:
US Treasury and other US government corporations and agencies 9 742 113 1 825 39 11 567 152 US Agency securitised products 3 773 37 1 029 29 4 802 66 States of the United States and political subdivisions of the states 304 4 120 3 424 7 United Kingdom 1 161 18 301 13 1 462 31 Germany 722 19 44 3 766 22 Canada 1 766 29 276 1 2 042 30 France 214 8 7 2 221 10 Australia 1 118 3 74 1 1 192 4 Other 2 813 54 451 22 3 264 76
Total 21 613 285 4 127 113 25 740 398 Corporate debt securities 6 299 102 1 040 34 7 339 136 Mortgage- and asset-backed securities 1 617 14 421 7 2 038 21
Total 29 529 401 5 588 154 35 117 555
Less than 12 months 12 months or more Total 2018 Unrealised Unrealised Unrealised USD millions Fair value losses Fair value losses Fair value losses
Debt securities issued by governments and government agencies:
US Treasury and other US government corporations and agencies 1 157 33 6 170 123 7 327 156 US Agency securitised products 1 013 11 3 710 119 4 723 130 States of the United States and political subdivisions of the states 108 2 518 17 626 19 United Kingdom 1 372 47 442 27 1 814 74 Germany 109 4 156 3 265 7 Canada 549 8 855 21 1 404 29 France 381 5 15 1 396 6 Australia 509 2 21 1 530 3 Other 2 280 68 1 149 67 3 429 135
Total 7 478 180 13 036 379 20 514 559 Corporate debt securities 12 135 275 6 334 267 18 469 542 Mortgage- and asset-backed securities 1 111 15 1 718 42 2 829 57
Total 20 724 470 21 088 688 41 812 1 158
As of 31 December 2017, USD 40 million of the gross unrealised loss on equity securities available-for-sale relates to declines in value for less than 12 months and USD 7 million to declines in value for more than 12 months.

Financial statements Notes to the Group financial statements
250 Swiss Re 2018 Financial Report
Maturity of fixed income securities available-for-sale The amortised cost or cost and estimated fair values of investments in fixed income securities available-for-sale by remaining maturity are shown below. Fixed maturity investments are assumed not to be called for redemption prior to the stated maturity date. As of 31 December 2017 and 2018, USD 17 742 million and USD 18 601 million, respectively, of fixed income securities available-for-sale were callable.
2017 2018 USD millions
Amortised cost or cost
Estimated fair value
Amortised cost or cost
Estimated fair value
Due in one year or less 7 399 7 410 10 449 10 379 Due after one year through five years 29 459 29 724 24 547 24 614 Due after five years through ten years 15 921 16 652 16 183 16 471 Due after ten years 36 550 41 370 34 749 37 262 Mortgage- and asset-backed securities with no fixed maturity 3 949 4 092 3 745 3 812
Total fixed income securities available-for-sale 93 278 99 248 89 673 92 538
Investments trading and at fair value through earnings The carrying amounts of fixed income securities classified as trading and equity securities classified as trading and at fair value through earnings (excluding unit-linked and with-profit business) as of 31 December were as follows:
USD millions 2017 2018
Debt securities issued by governments and government agencies 2 414 3 314 Corporate debt securities 38 37 Mortgage- and asset-backed securities 86 63
Fixed income securities trading – non-participating business 2 538 3 414
Equity securities trading – non-participating business1 3
Equity securities at fair value through earnings – non-participating business1 3 036
1 Change due to ASU 2016-01. Please refer to Note 1 for more details.
Investments held for unit-linked and with-profit business The carrying amounts of investments held for unit-linked and with-profit business as of 31 December were as follows:
2017 2018 USD millions Unit-linked With-profit Unit-linked With-profit
Fixed income securities trading 2 105 3 104 2 253 2 685 Equity securities trading1 26 582 2 201 Equity securities at fair value through earnings1 21 326 1 797 Investment real estate 543 281 537 230 Other 286 64 702 16
Total investments for unit-linked and with-profit business 29 516 5 650 24 818 4 728
1 Change due to ASU 2016-01. Please refer to Note 1 for more details.
Mortgage, policy and other loans and investment real estate As of 31 December, the carrying and respective fair values of investments in mortgage, policy and other loans and investment real estate (excluding unit-linked and with-profit business) were as follows:
2017 2018 USD millions Carrying value Fair value Carrying value Fair value
Policy loans 94 94 84 84 Mortgage loans 2 665 2 674 2 890 2 882 Other loans 1 351 1 367 1 568 1 587 Investment real estate 2 220 4 099 2 411 4 307
Depreciation expense related to investment real estate was USD 49 million and USD 57 million for 2017 and 2018, respectively. Accumulated depreciation on investment real estate totalled USD 585 million and USD 609 million as of 31 December 2017 and 2018, respectively.
Substantially all mortgage, policy and other loan receivables are secured by buildings, land or the underlying policies.

Swiss Re 2018 Financial Report 251
Other financial assets and liabilities by measurement category As of 31 December 2017 and 2018, ‘‘Other invested assets’’ and ‘‘Accrued expenses and other liabilities’’ by measurement category were as follows:
2017
Investments measured at net
asset value as Amortised USD millions Fair value practical expedient cost or cost Equity-accounted Not in scope1 Total
Other invested assets Derivative financial instruments 527 527 Reverse repurchase agreements 3 058 3 058 Securities lending/borrowing 776 1 065 1 841 Equity-accounted investments 446 2 446 2 892 Other 63 828 695 1 586
Other invested assets 1 812 828 4 818 2 446 0 9 904
Accrued expenses and other liabilities
Derivative financial instruments 582 582 Repurchase agreements 160 160 Securities lending 778 51 829 Securities sold short 1 947 1 947 Other 835 2 837 3 672
Accrued expenses and other liabilities 3 307 0 1 046 0 2 837 7 190
2018
Investments measured at net
asset value as Amortised USD millions Fair value practical expedient cost or cost Equity-accounted Not in scope1 Total
Other invested assets Derivative financial instruments 564 564 Reverse repurchase agreements 1 051 1 051 Securities lending/borrowing 302 11 313 Equity-accounted investments 312 2 660 2 972 Other 52 812 634 1 498
Other invested assets 1 230 812 1 696 2 660 0 6 398
Accrued expenses and other liabilities
Derivative financial instruments 582 582 Repurchase agreements 581 581 Securities lending 301 59 360 Securities sold short 1 538 1 538 Other 1 077 2 660 3 737
Accrued expenses and other liabilities 2 421 0 1 717 0 2 660 6 798
1 Amounts do not relate to financial assets or liabilities.

Financial statements Notes to the Group financial statements
252 Swiss Re 2018 Financial Report
Offsetting of derivatives, financial assets and financial liabilities Offsetting of derivatives, financial assets and financial liabilities as of 31 December was as follows:
Gross amounts of Net amounts of financial Related financial 2017 recognised Collateral set-off assets presented instruments not set-off USD millions financial assets in the balance sheet in the balance sheet in the balance sheet Net amount
Derivative financial instruments – assets 1 710 –1 176 534 534 Reverse repurchase agreements 6 053 –2 995 3 058 –3 058 0 Securities borrowing 1 589 –524 1 065 –1 065 0
Total 9 352 –4 695 4 657 –4 123 534
Gross amounts of Net amounts of financial Related financial 2017 recognised Collateral set-off liabilities presented instruments not set-off USD millions financial liabilities in the balance sheet in the balance sheet in the balance sheet Net amount
Derivative financial instruments – liabilities –1 924 1 342 –582 49 –533 Repurchase agreements –2 631 2 471 –160 160 0 Securities lending –1 878 1 049 –829 765 –64
Total –6 433 4 862 –1 571 974 –597
Gross amounts of Net amounts of financial Related financial 2018 recognised Collateral set-off assets presented instruments not set-off USD millions financial assets in the balance sheet in the balance sheet in the balance sheet Net amount
Derivative financial instruments – assets 1 620 –1 052 568 568 Reverse repurchase agreements 4 285 –3 234 1 051 –1 051 0 Securities borrowing 110 –99 11 –11 0
Total 6 015 –4 385 1 630 –1 062 568
Gross amounts of Net amounts of financial Related financial 2018 recognised Collateral set-off liabilities presented instruments not set-off USD millions financial liabilities in the balance sheet in the balance sheet in the balance sheet Net amount
Derivative financial instruments – liabilities –1 505 923 –582 21 –561 Repurchase agreements –3 334 2 753 –581 581 0 Securities lending –940 580 –360 339 –21
Total –5 779 4 256 –1 523 941 –582
Collateral pledged or received between two counterparties with a master netting arrangement in place, but not subject to balance sheet netting, is disclosed at fair value. The fair values represent the gross carrying value amounts at the reporting date for each financial instrument received or pledged by the Group. Management believes that master netting agreements provide for legally enforceable set-off in the event of default, which substantially reduces credit exposure. Upon occurrence of an event of default, the non-defaulting party may set off the obligation against collateral received regardless if it has been offset on the balance sheet prior to the defaulting event. The net amounts of the financial assets and liabilities presented on the balance sheet were recognised in “Other invested assets”, “Investments for unit-linked and with-profit business” and “Accrued expenses and other liabilities”.
Assets pledged As of 31 December 2017 and 2018, investments with a carrying value of USD 7 384 million and USD 5 776 million, respectively, were on deposit with regulatory agencies in accordance with local requirements, of which USD 147 million and USD 277 million, respectively, were cash and cash equivalents. As of 31 December 2017 and 2018, investments with a carrying value of USD 12 209 million and USD 12 959 million, respectively, were placed on deposit or pledged to secure certain reinsurance liabilities, including pledged investments in subsidiaries, of which USD 247 million and USD 404 million, respectively, were cash and cash equivalents. Cash and cash equivalents pledged include some instances where cash is legally restricted from usage or withdrawal.
As of 31 December 2017 and 2018, securities of USD 15 740 million and USD 15 850 million, respectively, were transferred to third parties under securities lending transactions and repurchase agreements on a fully collateralised basis. Corresponding liabilities of USD 989 million and USD 941 million, respectively, were recognised in accrued expenses and other liabilities for the obligation to return collateral that the Group has the right to sell or repledge.
As of 31 December 2017 and 2018, a real estate portfolio with a carrying value of USD 192 million and USD 191 million, respectively, served as collateral for a credit facility, allowing the Group to withdraw funds up to CHF 500 million.

Swiss Re 2018 Financial Report 253
Collateral accepted which the Group has the right to sell or repledge As of 31 December 2017 and 2018, the fair value of the equity securities, government and corporate debt securities received as collateral was USD 7 476 million and USD 4 239 million, respectively. Of this, the amount that was sold or repledged as of 31 December 2017 and 2018 was USD 1 981 million and USD 1 721 million, respectively. The sources of the collateral are securities borrowing, reverse repurchase agreements and derivative transactions.
Recognised gross liability for the obligation to return collateral that the Group has the right to sell or repledge As of 31 December 2017 and 2018, the gross amounts of liabilities related to repurchase agreements and securities lending by the class of securities transferred to third parties and by the remaining maturity are shown below. The liabilities are recognised for the obligation to return collateral that the Group has the right to sell or repledge.
Remaining contractual maturity of the agreements 2017 Overnight and
continuous Greater than
90 days Total USD millions Up to 30 days 30–90 days
Repurchase agreements Debt securities issued by governments and government agencies 31 2 091 354 139 2 615 Corporate debt securities 16 16
Total repurchase agreements 31 2 107 354 139 2 631
Securities lending Debt securities issued by governments and government agencies 244 567 614 442 1 867 Corporate debt securities 6 6 Equity securities 5 5
Total securities lending 255 567 614 442 1 878
Gross amount of recognised liabilities for repurchase agreements and securities lending 4 509
Remaining contractual maturity of the agreements 2018 Overnight and
continuous Greater than
90 days Total USD millions Up to 30 days 30–90 days
Repurchase agreements Debt securities issued by governments and government agencies 149 2 894 100 141 3 284 Corporate debt securities 9 41 50
Total repurchase agreements 158 2 935 100 141 3 334
Securities lending Debt securities issued by governments and government agencies 110 146 242 431 929 Corporate debt securities 7 4 11 Equity securities 0
Total securities lending 117 150 242 431 940
Gross amount of recognised liabilities for repurchase agreements and securities lending 4 274
The programme is structured in a conservative manner within a clearly defined risk framework. Yield enhancement is conducted on a non-cash basis, thereby taking no re-investment risk.

Financial statements Notes to the Group financial statements
254 Swiss Re 2018 Financial Report
8 Fair value disclosures Fair value, as defined by the Fair Value Measurements and Disclosures Topic, is the price that would be received to sell an asset or paid to transfer a liability in an orderly transaction between market participants at the measurement date.
The Fair Value Measurements and Disclosures Topic requires all assets and liabilities that are measured at fair value to be categorised within the fair value hierarchy. This three-level hierarchy is based on the observability of the inputs used in the fair value measurement. The levels of the fair value hierarchy are defined as follows:
Level 1 inputs are quoted prices in active markets for identical assets or liabilities that the Group has the ability to access. Level 1 inputs are the most persuasive evidence of fair value and are to be used whenever possible.
Level 2 inputs are market-based inputs that are directly or indirectly observable, but not considered level 1 quoted prices. Level 2 inputs consist of (i) quoted prices for similar assets or liabilities in active markets; (ii) quoted prices for identical assets or liabilities in non-active markets (eg markets which have few transactions and where prices are not current or price quotations vary sub-stantially); (iii) inputs other than quoted prices that are observable (eg interest rates, yield curves, volatilities, prepayment speeds, credit risks and default rates); and (iv) inputs derived from, or corroborated by, observable market data.
Level 3 inputs are unobservable inputs. These inputs reflect the Group’s own assumptions about market pricing using the best internal and external information available.
The types of instruments valued, based on unadjusted quoted market prices in active markets, include most US government and sovereign obligations, active listed equities and most money market securities. Such instruments are generally classified within level 1 of the fair value hierarchy.
The types of instruments that trade in markets that are not considered to be active, but are valued based on quoted market prices, broker or dealer quotations or alternative pricing sources with reasonable levels of price transparency, include most government agency securities, investment-grade corporate bonds, certain mortgage- and asset-backed products, less liquid listed equities and state, municipal and provincial obligations. Such instruments are generally classified within level 2 of the fair value hierarchy.
Exchange-traded derivative instruments typically fall within level 1 or level 2 of the fair value hierarchy, depending on whether they are considered to be actively traded or not.
Certain financial instruments are classified within level 3 of the fair value hierarchy because they trade infrequently and therefore have little or no price transparency. Such instruments include private equity, less liquid corporate debt securities and certain asset-backed securities (ABS). Certain over-the-counter (OTC) derivatives trade in less liquid markets with limited pricing information, and the determination of fair value for these derivatives is inherently more difficult. Such instruments are classified within level 3 of the fair value hierarchy. Pursuant to the election of the fair value option, the Group classifies certain liabilities for life and health policy benefits in level 3 of the fair value hierarchy. When appropriate, valuations are adjusted for various factors such as liquidity, bid/offer spreads and credit considerations. Such adjustments are generally based on available market evidence. In the absence of such evidence, management’s best estimate is used.
The fair values of assets are adjusted to incorporate the counterparty risk of non-performance. Similarly, the fair values of liabilities reflect the risk of non-performance of the Group, captured by the Group’s credit spread. These valuation adjustments from assets and liabilities measured at fair value using significant unobservable inputs are recognised in net realised gains and losses. For 2018, these adjustments were not material. Whenever the underlying assets or liabilities are reported in a specific business segment, the valuation adjustment is allocated accordingly. Valuation adjustments not attributable to any business segment are reported in Group items.
In certain situations, the Group uses inputs to measure the fair value of asset or liability positions that fall into different levels of the fair value hierarchy. In these situations, the Group will determine the appropriate level based on the lowest level input that is significant to the determination of the fair value.

Swiss Re 2018 Financial Report 255
Valuation techniques US government securities typically have quoted market prices in active markets and are categorised as level 1 instruments in the fair value hierarchy. Non-US government holdings are generally classified as level 2 instruments and are valued on the basis of the quotes provided by pricing services, which are subject to the Group’s pricing validation reviews and pricing vendor challenge process. Valuations provided by pricing vendors are generally based on the actual trade information as substantially all of the Group’s non-US government holdings are traded in a transparent and liquid market.
Corporate debt securities mainly include US and European investment-grade positions, which are priced on the basis of quotes provided by third-party pricing vendors and first utilise valuation inputs from actively traded securities, such as bid prices, bid spreads to Treasury securities, Treasury curves and same or comparable issuer curves and spreads. Issuer spreads are determined from actual quotes and traded prices and incorporate considerations of credit/default, sector composition, and liquidity and call features. Where market data is not available, valuations are developed based on the modelling techniques that utilise observable inputs and option-adjusted spreads and incorporate considerations of the security’s seniority, maturity and the issuer’s corporate structure.
Values of mortgage- and asset-backed securities are obtained both from third-party pricing vendors and through quoted prices, some of which may be based on the prices of comparable securities with similar structural and collateral features. Values of certain ABS for which there are no significant observable inputs are developed using benchmarks to similar transactions or indices. For both residential mortgage-backed securities (RMBS) and commercial mortgage-backed securities (CMBS), cash flows are derived based on the transaction-specific information, which incorporates priority in the capital structure, and are generally adjusted to reflect benchmark yields, market prepayment data, collateral performance (default rates and loss severity) for specific vintage and geography, credit enhancements and ratings. For certain RMBS and CMBS with low levels of market liquidity, judgements may be required to determine comparable securities based on the loan type and deal-specific performance. CMBS terms may also incorporate lock-out periods that restrict borrowers from prepaying the loans or provide disincentives to prepay and therefore reduce prepayment risk of these securities, compared to RMBS. The factors specifically considered in valuation of CMBS include borrower-specific statistics in a specific region, such as debt service coverage and loan-to-value ratios, as well as the type of commercial property. Mortgage- and asset-backed securities also includes debt securitised by credit card, student loan and auto loan receivables. Pricing inputs for these securities also focus on capturing, where relevant, collateral quality and performance, payment patterns and delinquencies.
The Group uses third-party pricing vendor data to value agency securitised products, which mainly include collateralised mortgage obligations (CMO) and mortgage-backed government agency securities. The valuations generally utilise observable inputs consistent with those noted above for RMBS and CMBS.
Equity securities held by the Group for proprietary investment purposes are mainly classified in level 1. Securities classified in level 1 are traded on public stock exchanges for which quoted prices are readily available.
The category “Other invested assets” includes the Group’s private equity and hedge fund investments which are made directly or via ownership of funds. Valuation of direct private equity investments requires significant management judgement due to the absence of quoted market prices and the lack of liquidity. Initial valuation is based on the acquisition cost, and is further refined based on the available market information for the public companies that are considered comparable to the Group’s holdings in the private companies being valued, and the private company-specific performance indicators, both historic and projected. Sub-sequent valuations also reflect business or asset appraisals, as well as market transaction data for private and public benchmark companies and the actual companies being valued, such as financing rounds and mergers and acquisitions activity. The Group’s holdings in private equity and hedge funds are generally valued utilising net asset values (NAV), subject to adjustments, as deemed necessary, for restrictions on redemption (lock-up periods and amount limitations on redemptions). These investments are included under investments measured at net asset value as a practical expedient.
The Group holds both exchange-traded and OTC interest rate, foreign exchange, credit and equity derivative contracts for hedging and trading purposes. The fair values of exchange-traded derivatives measured using observable exchange prices are classified in level 1. Long-dated contracts may require adjustments to the exchange-traded prices which would trigger reclassification to level 2 in the fair value hierarchy. OTC derivatives are generally valued by the Group based on the internal models, which are consistent with industry standards and practices, and use both observable (dealer, broker or market consensus prices, spot and forward rates, interest rate and credit curves and volatility indices) and unobservable inputs (adjustments for liquidity, inputs derived from the observable data based on the Group’s judgements and assumptions).

Financial statements Notes to the Group financial statements
256 Swiss Re 2018 Financial Report
The Group’s OTC interest rate derivatives primarily include interest rate swaps, futures, options, caps and floors and are valued based on the cash flow discounting models which generally utilise as inputs observable market yield curves and volatility assumptions.
The Group’s OTC foreign exchange derivatives primarily include forward, spot and option contracts and are generally valued based on the cash flow discounting models, utilising as main inputs observable foreign exchange forward curves.
The Group’s investments in equity derivatives primarily include OTC equity option contracts on single or baskets of market indices and equity options on individual or baskets of equity securities, which are valued using internally developed models (such as the Black-Scholes type option pricing model and various simulation models) calibrated with the inputs, which include underlying spot prices, dividend curves, volatility surfaces, yield curves and correlations between underlying assets.
The Group’s OTC credit derivatives can include index and single-name credit default swaps. Plain vanilla credit derivatives, such as index and single-name credit default swaps, are valued by the Group based on the models consistent with the industry valuation standards for these credit contracts, and primarily utilise observable inputs published by market data sources, such as credit spreads and recovery rates. These valuation techniques warrant classification of plain vanilla OTC derivatives as level 2 financial instruments in the fair value hierarchy.
Governance around level 3 fair valuation The Asset Valuation Committee, endorsed by the Group Executive Committee, has a primary responsibility for governing and over-seeing all of Group’s asset and derivative valuation policies and operating parameters (including level 3 measurements). The Asset Valuation Committee delegates the responsibility for implementation and oversight of consistent application of the Groupʼs pricing and valuation policies to the Pricing and Valuation Committee.
The Pricing and Valuation Committee, which is a joint Risk Management & Finance management control committee, is responsible for the implementation and consistent application of the pricing and valuation policies. Key functions of the Pricing and Valuation Committee include: oversight over the entire valuation process, approval of internal valuation methodologies, approval of external pricing vendors, monitoring of the independent price verification (IPV) process and resolution of significant or complex valuation issues.
A formal IPV process is undertaken monthly by members of the Valuation Risk Management team within a Financial Risk Management function. The process includes monitoring and in-depth analyses of approved pricing methodologies and valuations of the Group’s financial instruments aimed at identifying and resolving pricing discrepancies.
The Risk Management function is responsible for independent validation and ongoing review of the Group’s valuation models. The Product Control group within Finance is tasked with reporting of fair values through the vendor- and model-based valuations, the results of which are also subject to the IPV process.

Swiss Re 2018 Financial Report 257
This page is intentionally left blank.

Financial statements Notes to the Group financial statements
258 Swiss Re 2018 Financial Report
Assets and liabilities measured at fair value on a recurring basis As of 31 December, the fair values of assets and liabilities measured on a recurring basis by level of input were as follows:
Quoted prices in active markets for
identical assets and liabilities
Significant other observable
inputs
Significant unobservable
inputs Impact of
Investments measured at net
asset value as practical 2017
USD millions (level 1) (level 2) (level 3) netting1 expedient Total
Assets Fixed income securities held for proprietary investment purposes 14 013 86 420 1 353 101 786
Debt securities issued by US government and government agencies 14 013 2 392 16 405 US Agency securitised products 5 965 5 965 Debt securities issued by non-US governments and government agencies 32 285 3 32 288 Corporate debt securities 41 287 1 343 42 630 Mortgage- and asset-backed securities 4 491 7 4 498
Fixed income securities backing unit-linked and with-profit business 5 209 5 209 Equity securities held for proprietary investment purposes 3 856 5 4 3 865 Equity securities backing unit-linked and with-profit business 28 770 13 28 783 Short-term investments held for proprietary investment purposes 1 021 3 825 4 846 Short-term investments backing unit-linked and with-profit business 59 59 Derivative financial instruments 50 1 274 386 –1 176 534
Interest rate contracts 4 511 5 520 Foreign exchange contracts 307 307 Equity contracts 43 451 283 777 Credit contracts 1 1 Other contracts 98 98 Contracts backing unit-linked and with-profit business 3 4 7
Investment real estate 198 198 Other invested assets 765 12 509 828 2 114 Funds held by ceding companies 206 206
Total assets at fair value 48 475 97 023 2 450 –1 176 828 147 600
Liabilities Derivative financial instruments –22 –1 423 –479 1 342 –582
Interest rate contracts –2 –395 –1 –398 Foreign exchange contracts –321 –321 Equity contracts –19 –622 –31 –672 Credit contracts –79 –79 Other contracts –447 –447 Contracts backing unit-linked and with-profit business –1 –6 –7
Liabilities for life and health policy benefits –126 –126 Accrued expenses and other liabilities –939 –1 785 –2 724
Total liabilities at fair value –961 –3 208 –605 1 342 –3 432
1 The netting of derivative receivables and derivative payables is permitted when a legally enforceable master netting agreement exists between two counterparties. A master netting agreement provides for the net settlement of all contracts, as well as cash collateral, through a single payment, in a single currency, in the event of default or on the termination of any one contract.

Swiss Re 2018 Financial Report 259
Quoted prices in active markets for
identical assets Significant other
observable Significant
unobservable
Investments measured at net
asset value as 2018 and liabilities inputs inputs Impact of practical USD millions (level 1) (level 2) (level 3) netting1 expedient Total
Assets Fixed income securities held for proprietary investment purposes 11 668 82 906 1 378 95 952
Debt securities issued by US government and government agencies 11 668 2 186 13 854 US Agency securitised products 6 551 6 551 Debt securities issued by non-US governments and government agencies 30 468 3 30 471 Corporate debt securities 39 372 1 370 40 742 Mortgage- and asset-backed securities 4 329 5 4 334
Fixed income securities backing unit-linked and with-profit business 4 938 4 938 Equity securities held for proprietary investment purposes 3 023 13 3 036 Equity securities backing unit-linked and with-profit business 23 111 12 23 123 Short-term investments held for proprietary investment purposes 1 220 4 197 5 417 Short-term investments backing unit-linked and with-profit business 11 11 Derivative financial instruments 11 1 205 404 –1 052 568
Interest rate contracts 6 424 6 436 Foreign exchange contracts 399 399 Equity contracts 1 377 339 717 Credit contracts 0 Other contracts 2 59 61 Contracts backing unit-linked and with-profit business 2 5 7
Investment real estate 166 166 Other invested assets 286 16 364 812 1 478 Funds held by ceding companies 206 206
Total assets at fair value 39 319 93 504 2 312 –1 052 812 134 895
Liabilities Derivative financial instruments –14 –974 –517 923 –582
Interest rate contracts –3 –318 –3 –324 Foreign exchange contracts –169 –169 Equity contracts –8 –484 –43 –535 Credit contracts –1 –1 Other contracts –471 –471 Contracts backing unit-linked and with-profit business –3 –2 –5
Liabilities for life and health policy benefits –119 –119 Accrued expenses and other liabilities –302 –1 538 –1 840
Total liabilities at fair value –316 –2 512 –636 923 –2 541
1 The netting of derivative receivables and derivative payables is permitted when a legally enforceable master netting agreement exists between two counterparties. A master netting agreement provides for the net settlement of all contracts, as well as cash collateral, through a single payment, in a single currency, in the event of default or on the termination of any one contract.

Financial statements Notes to the Group financial statements
260 Swiss Re 2018 Financial Report
Assets and liabilities measured at fair value on a recurring basis using significant unobservable inputs (level 3) As of 31 December, the reconciliations of the fair values of assets and liabilities measured on a recurring basis using significant unobservable inputs were as follows:
Liabilities for life Fixed Other and health 2017 income Equity Derivative Investment invested Total Derivative policy Total USD millions securities securities assets real estate assets assets liabilities benefits liabilities
Assets and liabilities Balance as of 1 January 1 182 4 461 209 496 2 352 –664 –144 –808
Realised/unrealised gains/losses: Included in net income –8 –2 23 19 34 66 202 19 221 Included in other comprehensive income 13 4 16 33 0
Purchases 264 26 290 0 Issuances 0 –84 –84 Sales –59 –45 –49 –44 –197 83 83 Settlements –84 –79 –6 –169 –1 –1 Transfers into level 31 45 45 0 Transfers out of level 31 –89 –2 –91 0 Impact of foreign exchange movements 89 19 13 121 –15 –1 –16
Closing balance as of 31 December 1 353 4 386 198 509 2 450 –479 –126 –605
1 Transfers are recognised at the date of the event or change in circumstances that caused the transfer.
Liabilities for life Fixed Other and health 2018 income Equity Derivative Investment invested Total Derivative policy Total USD millions securities securities assets real estate assets assets liabilities benefits liabilities
Assets and liabilities Balance as of 1 January 1 353 4 386 198 509 2 450 –479 –126 –605
Realised/unrealised gains/losses: Included in net income 67 13 –19 61 44 7 51 Included in other comprehensive income –39 –39 0
Purchases 201 11 212 0 Issuances 0 –159 –159 Sales –7 –8 –33 –129 –177 23 23 Settlements –44 –52 –96 48 48 Transfers into level 31 19 19 –3 –3 Transfers out of level 31 –18 –4 –3 –25 0 Impact of foreign exchange movements –68 –12 –13 –93 9 9
Closing balance as of 31 December 1 378 0 404 166 364 2 312 –517 –119 –636
1 Transfers are recognised at the date of the event or change in circumstances that caused the transfer.
Gains and losses on assets and liabilities measured at fair value on a recurring basis using significant unobservable inputs (level 3) The gains and losses relating to the assets and liabilities measured at fair value using significant unobservable inputs (level 3) for the years ended 31 December were as follows:
USD millions 2017 2018
Gains/losses included in net income for the period 287 112 Whereof change in unrealised gains/losses relating to assets and liabilities still held at the reporting date 226 33

Swiss Re 2018 Financial Report 261
Quantitative information about level 3 fair value measurements Unobservable inputs for major level 3 assets and liabilities as of 31 December were as follows:
2017 2018 USD millions Fair value Fair value Valuation technique Unobservable input Range (weighted average)
Assets Corporate debt securities 1 343 1 370
Infrastructure loans 778 920 Discounted cash flow model Valuation spread 118–250 bps (192 bps) Private placement corporate debt 428 341 Corporate spread matrix Credit spread 131–402 bps (247 bps) Private placement credit tenant leases
46 42 Discounted cash flow model Illiquidity premium 125–150 bps (146 bps)
Derivative equity contracts 283 339 OTC equity option referencing correlated equity indices
283 339 Proprietary option model Correlation –35–40% (2.5%)1
Investment real estate 198 166 Discounted cash flow model Discount rate 5% per annum
Liabilities Derivative equity contracts –31 –43
OTC equity option referencing correlated equity indices
–31 –43 Proprietary option model Correlation –20–40% (10%)1
Other derivative contracts and liabilities for life and health policy benefits
–573 –590
Variable annuity and fair valued –325 –327 Discounted cash flow model Risk margin 4% (n/a) GMDB contracts Volatility 4–42%
Lapse 0.5–33% Mortality adjustment –10–0% Withdrawal rate 0–90%
Swap liability referencing real estate investments
–150 –127 Discounted cash flow model Discount rate 5% per annum
Weather contracts –35 –77 Proprietary option model Risk margin 5–11% (9.3%) Correlation –71–56% (–0.5%) Volatility (power/gas) 28–117% (57.3%) Volatility (temperature) 96–775 (268) HDD/CAT2 Index value (temperature) 800–4366 (2451)
HDD/CAT2
1 Represents average input value for the reporting period. 2 Heating Degree Days (HDD); Cumulative Average Temperature (CAT).

Financial statements Notes to the Group financial statements
262 Swiss Re 2018 Financial Report
Sensitivity of recurring level 3 measurements to changes in unobservable inputs The significant unobservable input used in the fair value measurement of the Group’s infrastructure loans is valuation spread. A significant increase (decrease) in this input in isolation would result in a significantly lower (higher) fair value measurement. The significant unobservable input used in the fair value measurement of the Group’s private placement corporate debt securities is credit spread. A significant increase (decrease) in this input in isolation would result in a significantly lower (higher) fair value measurement. The significant unobservable input used in the fair value measurement of the Group’s private placement credit tenant leases is illiquidity premium. A significant increase (decrease) in this input in isolation would result in a significantly lower (higher) fair value measurement.
The significant unobservable input used in the fair value measurement of the Group’s OTC equity option referencing correlated equity indices is correlation. Where the Group is long correlation risk, a significant increase (decrease) in this input in isolation would result in a significantly higher (lower) fair value measurement. Where the Group is short correlation risk, a significant increase (decrease) in this input in isolation would result in a significantly lower (higher) fair value measurement.
The significant unobservable input used in the fair value measurement of the Group’s investment real estate and swap liability referencing real estate investment is the rate used to discount future cash flows from property sales. A significant increase (decrease) in this input in isolation would result in a significantly lower (higher) fair value measurement.
The significant unobservable inputs used in the fair value measurement of the Group’s variable annuity and fair valued guaranteed minimum death benefit (GMDB) contracts are: risk margin, volatility, lapse, mortality adjustment rate and withdrawal rate. A significant increase (decrease) in isolation in each of the following inputs: risk margin, volatility and withdrawal rate would result in a significantly higher (lower) fair value of the Group’s obligation. A significant increase (decrease) in isolation in a lapse rate for in-the-money contracts would result in a significantly lower (higher) fair value of the Group’s obligation, whereas for out-of-the-money contracts, an isolated increase (decrease) in a lapse assumption would increase (decrease) fair value of the Group’s obligation. Changes in the mortality adjustment rate impact the fair value of the Group’s obligation differently for living-benefit products, compared to death-benefit products. For the former, a significant increase (decrease) in the mortality adjustment rate (ie increase (decrease) in mortality, respectively) in isolation would result in a decrease (increase) in fair value of the Group’s liability. For the latter, a significant increase (decrease) in the mortality adjustment rate in isolation would result in an increase (decrease) in fair value of the Group’s liability.
The significant unobservable inputs used in the fair value measurement of the Group’s weather contracts are risk margin, correlation, volatility and index value. Where the Group has a long position, a significant increase (decrease) in the risk margin input in isolation would result in a significantly higher (lower) fair value measurement. Where the Group has a long volatility or correlation position, a significant increase (decrease) in the correlation and volatility inputs would result in a significantly higher (lower) fair value measurement. Where the Group has a long index position, an increase (decrease) in the index value input in isolation would result in a significantly higher (lower) fair value measurement. Where the Group has a short position, a significant increase (decrease) in the risk margin input in isolation would result in a significantly lower (higher) fair value measurement. Where the Group has a short volatility or correlation position, a significant increase (decrease) in the correlation and volatility inputs would result in a significantly lower (higher) fair value measurement. Where the Group has a short index position, an increase (decrease) in the index value input in isolation would result in a significantly lower (higher) fair value measurement.

Swiss Re 2018 Financial Report 263
Other invested assets measured at net asset value Other invested assets measured at net asset value as of 31 December were as follows:
2017 2018 Unfunded Redemption frequency Redemption USD millions Fair value Fair value commitments (if currently eligible) notice period
Private equity funds 511 504 362 non-redeemable n/a Hedge funds 128 196 redeemable1 45–95 days2 Private equity direct 92 69 non-redeemable n/a Real estate funds 97 43 30 non-redeemable n/a
Total 828 812 392
1 The redemption frequency varies by position. 2 Cash distribution can be delayed for an extended period depending on the sale of the underlyings.
The hedge fund investments employ a variety of strategies, including relative value and event-driven across various asset classes.
The private equity direct portfolio consists of equity and equity-like investments directly in other companies. These investments have no contractual term and are generally held based on financial or strategic intent.
Private equity and real estate funds generally have limitations imposed on the amount of redemptions from the fund during the redemption period due to illiquidity of the underlying investments. Fees may apply for redemptions or transferring of interest to other parties. Distributions are expected to be received from these funds as the underlying assets are liquidated over the life of the fund, which is generally from 10 to 12 years.
The redemption frequency of hedge funds varies depending on the manager as well as the nature of the underlying product. Additionally, certain funds may impose lock-up periods and redemption gates as defined in the terms of the individual investment agreement.
Fair value option The fair value option under the Financial Instruments Topic permits the choice to measure specified financial assets and liabilities at fair value on an instrument-by-instrument basis. The Group elected the fair value option for positions in the following line items:
Other invested assets The Group elected the fair value option for certain investments classified as equity method investees within other invested assets in the balance sheet. The Group applied the fair value option, as the investments are managed on a fair value basis. The changes in fair value of these elected investments are recorded in earnings.
Funds held by ceding companies For operational efficiencies, the Group elected the fair value option for funds held by the cedent under three of its reinsurance agreements. The assets are carried at fair value and changes in fair value are reported as a component of earnings.
Liabilities for life and health policy benefits The Group elected the fair value option for existing GMDB reserves related to certain variable annuity contracts which are classified as universal-life-type contracts. The Group has applied the fair value option, as the equity risk associated with those contracts is managed on a fair value basis and it is economically hedged with derivative options in the market. The liability is carried at fair value and changes in fair value attributable to instrument-specific credit risk are reported on other comprehensive income and all other changes in fair value are reported as a component of earnings.
Other derivative liabilities For operational efficiencies, the Group elected the fair value option on a hybrid financial instrument, where the host contract is a debt instrument and the embedded derivative is pegged to the performance of the fund’s real estate portfolio. The liability is carried at fair value and changes in fair value are reported as a component of earnings. In the balance sheet and the following fair value disclosures, this item is included under ”Accrued expenses and other liabilities”.

Financial statements Notes to the Group financial statements
264 Swiss Re 2018 Financial Report
Assets and liabilities measured at fair value pursuant to election of the fair value option Pursuant to the election of the fair value option for the items described, the balances as of 31 December were as follows:
USD millions 2017 2018
Assets Other invested assets 9 904 6 398
of which at fair value pursuant to the fair value option 446 312 Funds held by ceding companies 9 155 9 009
of which at fair value pursuant to the fair value option 206 206 Liabilities Liabilities for life and health policy benefits –42 561 –39 593
of which at fair value pursuant to the fair value option –126 –119 Accrued expenses and other liabilities –7 190 –6 798
of which at fair value pursuant to the fair value option –150 –127
Changes in fair values for items measured at fair value pursuant to election of the fair value option Gains/losses included in earnings for items measured at fair value pursuant to election of the fair value option including foreign exchange impact for the years ended 31 December were as follows:
USD millions 2017 2018
Other invested assets 36 6 Liabilities for life and health policy benefits 19 6 Accrued expenses and other liabilities 20 –11
Total 75 1
Fair value changes from other invested assets and funds held by ceding companies are reported in “Net investment income – non-participating business”. Fair value changes from the GMDB reserves are shown in “Life and health benefits”. Fair value changes from accrued expenses and other liabilities are reported in “Net realised investment gains/losses – non-participating business“.

Swiss Re 2018 Financial Report 265
Assets and liabilities not measured at fair value but for which the fair value is disclosed Assets and liabilities not measured at fair value but for which the fair value is disclosed as of 31 December were as follows:
Significant Significant other unobservable 2017 observable inputs inputs USD millions (level 2) (level 3) Total
Assets Policy loans 94 94 Mortgage loans 2 674 2 674 Other loans 1 367 1 367 Investment real estate 3 901 3 901
Total assets 0 8 036 8 036
Liabilities Debt –7 607 –5 074 –12 681
Total liabilities –7 607 –5 074 –12 681
Significant Significant other unobservable 2018 observable inputs inputs USD millions (level 2) (level 3) Total
Assets Policy loans 84 84 Mortgage loans 2 882 2 882 Other loans 1 587 1 587 Investment real estate 4 141 4 141
Total assets 0 8 694 8 694
Liabilities Debt –7 576 –4 109 –11 685
Total liabilities –7 576 –4 109 –11 685
Policy loans, other loans and certain mortgage loans are classified as level 3 measurements, as they do not have an active exit market. Some of these positions need to be assessed in conjunction with the corresponding insurance business, whilst the fair value of some other positions does not differ materially from the carrying amount. Considering these circumstances for these positions, the Group presents the carrying amount as an approximation for the fair value. For certain commercial mortgage loans and infrastructure loans, which are included in mortgage loans and other loans respectively, the fair value can be estimated using discounted cash flow models which are based on discount curves and spread inputs that require management’s judgement.
Investments in real estate are fair valued primarily by external appraisers based on proprietary discounted cash flow models that incorporate applicable risk premium adjustments to discount yields and projected market rental income streams based on market-specific data. These fair value measurements are classified in level 3 in the fair value hierarchy.
Debt positions, which are fair valued based on executable broker quotes or the discounted cash flow method using observable inputs, are classified as level 2 measurements. Fair value of the majority of the Group’s level 3 debt positions is judged to approximate carrying value due to the highly tailored nature of the obligation and short-notice termination provisions.

Financial statements Notes to the Group financial statements
266 Swiss Re 2018 Financial Report
9 Derivative financial instruments The Group uses a variety of derivative financial instruments including swaps, options, forwards, credit derivatives and exchange- traded financial futures in its trading and hedging strategies, in line with the Group’s overall risk management strategy. The objectives include managing exposure to price, foreign currency and/or interest rate risk on planned or anticipated investment purchases, existing assets or liabilities, as well as locking in attractive investment conditions for future available funds.
The fair values represent the gross carrying value amounts at the reporting date for each class of derivative contract held or issued by the Group. The gross fair values are not an indication of credit risk, as many over-the-counter transactions are contracted and documented under ISDA master agreements or their equivalent. Management believes that such agreements provide for legally enforceable set-off in the event of default, which substantially reduces credit exposure.

Swiss Re 2018 Financial Report 267
Fair values and notional amounts of derivative financial instruments As of 31 December, the fair values and notional amounts of the derivatives outstanding were as follows:
2017 Notional amount assets/liabilities
Fair value assets
Fair value liabilities
Carrying value assets/liabilities USD millions
Derivatives not designated as hedging instruments Interest rate contracts1 48 904 524 –404 120 Foreign exchange contracts1 16 874 206 –137 69 Equity contracts1 17 135 780 –673 107 Credit contracts 4 194 1 –79 –78 Other contracts 12 432 98 –447 –349
Total 99 539 1 609 –1 740 –131
Derivatives designated as hedging instruments Foreign exchange contracts 12 362 101 –184 –83
Total 12 362 101 –184 –83
Total derivative financial instruments 111 901 1 710 –1 924 –214
Amount offset Where a right of set-off exists –801 801 Due to cash collateral –375 541
Total net amount of derivative financial instruments 534 –582 –48
2018 Notional amount assets/liabilities
Fair value assets
Fair value liabilities
Carrying value assets/liabilities USD millions
Derivatives not designated as hedging instruments Interest rate contracts1 52 719 441 –326 115 Foreign exchange contracts1 19 415 186 –148 38 Equity contracts1 12 493 719 –538 181 Credit contracts 379 –1 –1 Other contracts 11 385 61 –471 –410
Total 96 391 1 407 –1 484 –77
Derivatives designated as hedging instruments Foreign exchange contracts 12 679 213 –21 192
Total 12 679 213 –21 192
Total derivative financial instruments 109 070 1 620 –1 505 115
Amount offset Where a right of set-off exists –623 623 Due to cash collateral –429 300
Total net amount of derivative financial instruments 568 –582 –14
1 During 2018, the Group revised its methodology on the calculation of notional amounts for interest rate derivatives. The revision has no impact on the income statement or balance sheet of the Group. Comparative information for 2017 has been adjusted accordingly.
The notional amounts of derivative financial instruments give an indication of the Group’s volume of derivative activity. The fair value assets are included in “Other invested assets” and “Investments for unit-linked and with-profit business”, and the fair value liabilities are included in “Accrued expenses and other liabilities”. The fair value amounts that were not offset were nil as of 31 December 2017 and 2018.

Financial statements Notes to the Group financial statements
268 Swiss Re 2018 Financial Report
Non-hedging activities The Group primarily uses derivative financial instruments for risk management and trading strategies. Gains and losses of derivative financial instruments not designated as hedging instruments are recorded in “Net realised investment gains/losses — non-participating business” and “Net investment result — unit-linked and with-profit business” in the income statement. For the years ended 31 December, the gains and losses of derivative financial instruments not designated as hedging instruments were as follows:
USD millions 2017 2018
Derivatives not designated as hedging instruments Interest rate contracts 43 –178 Foreign exchange contracts 301 –60 Equity contracts –254 30 Credit contracts –25 –7 Other contracts 287 73
Total gains/losses recognised in income 352 –142
Hedging activities The Group designates certain derivative financial instruments as hedging instruments. The designation of derivative financial instruments is primarily used for overall portfolio and risk management strategies. As of 31 December 2017 and 2018, the following hedging relationships were outstanding:
Fair value hedges The Group enters into foreign exchange swaps to reduce the exposure to foreign exchange volatility for certain fixed income securities. These derivative instruments are designated as hedging instruments in qualifying fair value hedges. Gains and losses on derivative financial instruments designated as fair value hedging instruments are recorded in “Net realised investment gains/losses — non-participating business” in the income statement. For the years ended 31 December, the gains and losses attributable to the hedged risks were as follows:
2017 2018 USD millions
Gains/losses on derivatives
Gains/losses on hedged items
Gains/losses on derivatives
Gains/losses on hedged items
Fair value hedging relationships Foreign exchange contracts –577 577 430 –430
Total gains/losses recognised in income –577 577 430 –430
Cash flow hedges The Group entered into cross-currency swaps to reduce the exposure to foreign exchange volatility for a long-term debt instrument issued in the second quarter of 2016 and a portfolio of foreign currency denominated corporate bonds. These derivative instruments are designated as cash flow hedging instruments.
For the year ended 31 December 2018, the Group recorded a gain of USD 25 million on derivatives in accumulated other comprehensive income. For the year ended 31 December 2018, the Group reclassified a gain of USD 10 million from accumulated other comprehensive income into income.
As of 31 December 2018, the maximum length of time over which the Group hedged its exposure to the variability in future cash flows for forecasted transactions, excluding those forecasted transactions related to the payment of variable interest on existing financial instruments, was eight years.
The Group believes that the net gains and losses associated with cash flow hedges expected to be reclassified from accumulated other comprehensive income within the next twelve months cannot be reasonably estimated as they relate to foreign exchange volatility.
Hedges of the net investment in foreign operations The Group designates derivative and non-derivative monetary financial instruments as hedging the foreign currency exposure of its net investment in certain foreign operations.
For the years ended 31 December 2017 and 2018, the Group recorded an accumulated net unrealised foreign currency remeasurement gain of USD 1 552 million and USD 2 102 million, respectively, in shareholders’ equity. These offset translation gains and losses on the hedged net investment.

Swiss Re 2018 Financial Report 269
Maximum potential loss In consideration of the rights of set-off and the qualifying master netting arrangements with various counterparties, the maximum potential loss as of 31 December 2017 and 2018 was approximately USD 909 million and USD 997 million, respectively. The maximum potential loss is based on the positive market replacement cost assuming non-performance of all counterparties, excluding cash collateral.
Credit risk-related contingent features Certain derivative instruments held by the Group contain provisions that require its debt to maintain an investment-grade credit rating. If the Group’s credit rating were downgraded or no longer rated, the counterparties could request immediate payment, guarantee or an ongoing full overnight collateralisation on derivative instruments in net liability positions.
The total fair value of derivative financial instruments containing credit risk-related contingent features amounted to USD 102 million and USD 108 million as of 31 December 2017 and 2018, respectively. For derivative financial instruments containing credit risk-related contingent features, the Group posted collateral of nil as of 31 December 2017 and 2018, respectively. In the event of a reduction of the Group’s credit rating to below investment grade, a fair value of USD 108 million additional collateral would have had to be posted as of 31 December 2018. The total equals the amount needed to settle the instruments immediately as of 31 December 2018.

Financial statements Notes to the Group financial statements
270 Swiss Re 2018 Financial Report
10 Acquisitions Bradesco Seguros, S.A. On 3 July 2017, the Group and Bradesco Seguros, S.A. (Bradesco) entered into a partnership combining the large commercial risk business of Bradesco with Swiss Re Corporate Solutions Brasil Seguros S.A. (SRCSB). Upon closing this transaction, SRCSB became one of the leading insurers in the commercial large-risk insurance market in Brazil. The acquisition cost was BRL 210 million paid in cash and 40% shares of SRCSB. The transaction includes Bradesco’s related operations, its team of experts and a business portfolio, including existing, new and renewal business.
This transaction strengthens the Group’s position in the Brazilian commercial insurance market by combining two diversified portfolios and securing a sustainable and large distribution channel.

Swiss Re 2018 Financial Report 271
11 Debt and contingent capital instruments The Group enters into long- and short-term debt arrangements to obtain funds for general corporate use and specific transaction financing. The Group defines short-term debt as debt having a maturity at the balance sheet date of not greater than one year and long-term debt as having a maturity of greater than one year. For subordinated debt positions, maturity is defined as the first optional redemption date (notwithstanding that optional redemption could be subject to regulatory consent). Interest expense is classified accordingly.
The Groupʼs debt as of 31 December was as follows:
USD millions 2017 2018
Senior financial debt 433 235 Subordinated financial debt1 637 Contingent capital instruments classified as financial debt1 761
Short-term debt 433 1 633
Senior financial debt 3 781 3 428 Senior operational debt 390 388 Subordinated financial debt1 2 632 1 892 Subordinated operational debt 2 370 2 112 Contingent capital instruments classified as financial debt1 975 682
Long-term debt 10 148 8 502
Total carrying value 10 581 10 135
Total fair value 12 681 11 685
1 Certain items previously described within the disclosure table as subordinated financial debt or convertible debt are now included as contingent capital instruments classified as financial debt. Comparative information for 2017 has been amended accordingly.
As of 31 December 2017 and 2018, operational debt, ie debt related to operational leverage, amounted to USD 2.8 billion (thereof USD 2.4 billion limited- or non-recourse) and USD 2.5 billion (thereof USD 2.1 billion limited- or non-recourse), respectively. Operational leverage is subject to asset/liability matching and is excluded from rating agency financial leverage calculations.
Maturity of long-term debt As of 31 December, long-term debt as reported above had the following maturities:
USD millions 2017 2018
Due in 2019 2 341 0 Due in 2020 197 188 Due in 2021 213 816 Due in 2022 845 817 Due in 2023 897 855 Due after 2023 5 655 5 826
Total carrying value 10 148 8 502

Financial statements Notes to the Group financial statements
272 Swiss Re 2018 Financial Report
Senior long-term debt
Maturity Instrument Issued in Currency Nominal in
millions Interest rate Book value
in USD millions
2021 Syndicated senior bank loans 2018 GBP 468 variable 596 2022 Senior notes 2012 USD 250 2.88% 249 2023 Senior notes 2016 EUR 750 1.38% 853 2024 EMTN 2014 CHF 250 1.00% 253 2026 Senior notes1 1996 USD 397 7.00% 476 2027 EMTN 2015 CHF 250 0.75% 254 2030 Senior notes1 2000 USD 193 7.75% 257 2042 Senior notes 2012 USD 500 4.25% 490 Various Payment undertaking agreements various USD 344 various 388
Total senior long-term debt as of 31 December 2018 3 816
Total senior long-term debt as of 31 December 2017 4 171
1 Assumed in the acquisition of GE Insurance Solutions.
Subordinated long-term debt
Maturity Instrument Issued in Currency Nominal in
millions Interest rate First call in Book value
in USD millions
2042 Subordinated fixed-to-floating rate loan note 2012 EUR 500 6.63% 2022 568 2044 Subordinated fixed rate resettable callable loan note 2014 USD 500 4.50% 2024 498 2057 Subordinated private placement (amortising, limited recourse) 2007 GBP 1 658 5.28% 2 112 Perpetual subordinated fixed-to-floating rate callable loan note 2015 EUR 750 2.60% 2025 826
Total subordinated long-term debt as of 31 December 2018 4 004
Total subordinated long-term debt as of 31 December 20171 5 002
1 Certain items previously described within the disclosure table as subordinated long-term debt are now included as contingent capital instruments classified as long-term debt. Comparative information for 2017 has been amended accordingly.
Contingent capital instruments classified as long-term debt
Maturity Instrument Issued in Currency Nominal in
millions Interest rate First call in Book value
in USD millions
2024 Senior unsecured exchangeable instrument with issuer stock settlement 2018 USD 500 3.25% 494
2045 Subordinated contingent write-off securities 2013 CHF 175 7.50% 2020 188
Total contingent capital instruments classified as long-term debt as of 31 December 2018 682
Total contingent capital instruments classified as long-term debt as of 31 December 20171 975
1 Certain items previously described within the disclosure table as subordinated long-term debt are now included as contingent capital instruments classified as long-term debt. Comparative information for 2017 has been amended accordingly.

Swiss Re 2018 Financial Report 273
Interest expense on long-term debt and contingent capital instruments classified as equity Interest expense on long-term debt for the years ended 31 December was as follows:
USD millions 2017 2018
Senior financial debt 114 100 Senior operational debt 11 11 Subordinated financial debt1 128 108 Subordinated operational debt 114 118 Contingent capital instruments classified as financial debt1 38 38
Total 405 375
1 Certain items previously described within the disclosure table as subordinated financial debt or convertible debt are now included as contingent capital instruments classified as financial debt. Comparative information for 2017 has been amended accordingly.
In addition to the above, interest expense on contingent capital instruments classified as equity was USD 67 million and USD 41 million for the years ended 31 December 2017 and 2018, respectively.
Long-term debt issued in 2018 In June 2018, Swiss Re Ltd issued a six-year senior unsecured exchangeable instrument with issuer stock settlement. The instrument has a face value of USD 500 million, with a fixed coupon of 3.25% per annum payable semi-annually in arrear until the maturity date (13 June 2024). The interest expense was USD 10 million for the year ended 31 December 2018. In limited circumstances, the instrument may be redeemed early, in cash. Noteholders have a put option requiring the issuer to redeem the instrument at par if a delisting, nationalisation or change of control occurs. The higher of the par value and the fair market value of the instrument may be stock-settled, at any time at the option of the issuer, by delivering Swiss Re Ltd shares at a prevailing share price which uses a forward-looking 15 trading day volume-weighted average share price with a 1% discount. If the issuer stock settlement option is exercised at a time when the Groupʼs, or the issuerʼs, regulatory solvency ratio calculated under the Swiss Solvency Test is less than 160%, the prevailing share price is subject to a share price floor of USD 44.3305. After year five, holders of the instrument have the unrestricted option (and prior to year five, a restricted option) to exchange the instrument for Swiss Re Ltd shares at the prevailing exchange price, which is initially set at USD 115.2593, representing a premium of 30% to the reference share price, which used a forward-looking ten trading day volume-weighted average share price commencing on 7 June 2018. The number of Swiss Re Ltd shares to be delivered upon a noteholder-initiated exchange will be determined by dividing the principal amount of the instrument held by such noteholder by the prevailing exchange price at the time. The issuer may elect to settle a noteholder exchange in cash or Swiss Re Ltd shares. The share price floor and the exchange price are subject to customary anti-dilution adjustments. To economically hedge the settlement of a noteholder-initiated exchange (in cash or in Swiss Re Ltd shares), Swiss Re Ltd purchased matching call options in an aggregate amount of USD 500 million with an expiry date of 13 June 2024 on Swiss Re Ltd shares with a portion of the proceeds of the offering through an internal call option entered through Swiss Reinsurance Company Ltd with external banks. Consequently, no new Swiss Re Ltd shares will be issued upon a noteholder-initiated exchange. Both the noteholder-initiated exchange option and the matching call options are accounted as equity within Swiss Re Ltd.
In June 2018, Swiss Re ReAssure Limited entered into a GBP 550 million revolving credit facility with a syndicate of banks. The facility has an expiry date of 26 June 2021. At 29 June 2018, the amount drawn under the facility was GBP 468 235 294. This revolving credit facility replaces the previous GBP 550 million revolving credit facility that Swiss Re ReAssure Limited (formerly known as Swiss Re Admin Re Limited) had entered into in April 2016.
Contingent capital instruments classified as equity In March 2012, Swiss Reinsurance Company Ltd issued a perpetual subordinated capital instrument with issuer stock settlement, a face value of USD 750 million and a fixed coupon of 8.25% per annum. This capital instrument was redeemed on 1 September 2018.

Financial statements Notes to the Group financial statements
274 Swiss Re 2018 Financial Report
12 Earnings per share Most jurisdictions require reinsurers to maintain a minimum amount of capital in excess of the statutory definition of net assets or maintain certain minimum capital and surplus levels. In addition, some jurisdictions place certain restrictions on amounts that may be loaned or transferred to the parent company. The Group’s ability to pay dividends may be restricted by these requirements.
Dividends are declared in Swiss francs. During the years ended 31 December 2017 and 2018, the Group paid dividends per share of CHF 4.85 and CHF 5.00, respectively.
Earnings per share for the years ended 31 December were as follows:
USD millions (except share data) 2017 2018
Basic earnings per share Net income 393 481 Non-controlling interests 5 –19 Interest on contingent capital instruments1 –67 –41
Net income attributable to common shareholders 331 421
Weighted average common shares outstanding 320 811 238 306 841 773
Net income per share in USD 1.03 1.37
Net income per share in CHF2 1.02 1.34
Effect of dilutive securities Change in income available to common shares due to contingent capital instruments1 8 Change in average number of shares due to contingent capital instruments 6 203 404 Change in average number of shares due to employee options 514 803 604 473 Diluted earnings per share Net income assuming debt conversion and exercise of options 331 429 Weighted average common shares outstanding 321 326 041 313 649 650
Net income per share in USD 1.03 1.37
Net income per share in CHF2 1.01 1.34
1 Please refer to Note 11 “Debt and contingent capital instruments”. 2 The translation from USD to CHF is shown for informational purposes only and has been calculated using the Group’s average exchange rates.
At the 153rd Annual General Meeting held on 21 April 2017 and at the 154th Annual General Meeting held on 20 April 2018, the Group’s shareholders authorised the Group Board of Directors to repurchase up to a maximum CHF 1 billion purchase value of the Group’s own shares by way of a public buy-back programme for cancellation purposes prior to the 2018 and 2019 Annual General Meetings, respectively.
The public share buy-back programme approved by the 2017 Annual General Meeting was completed on 16 February 2018. The total number of shares repurchased amounted to 10.8 million, of which 6.3 million and 4.5 million shares were repurchased as of 31 December 2017 and between 1 January and 16 February 2018, respectively. On 20 April 2018, the 154th Annual General Meeting resolved the cancellation of the repurchased 10.8 million shares by way of share capital reduction. The shares were cancelled as of 24 July 2018, after completion of the procedure in respect of a share capital reduction as set forth in Article 732 et seqq. of the Swiss Code of Obligations.
The public share buy-back programme approved by the 2018 Annual General Meeting was completed on 15 February 2019. The total number of shares repurchased amounted to 11.2 million, of which 10 million and 1.2 million shares were repurchased as of 31 December 2018 and between 1 January and 15 February 2019, respectively.
Net of tax expense effects from contingent capital instruments, totalling USD 41 million in 2018, and the potential impact of these instruments on the weighted average number of shares, of 15 625 000 shares, have not been included in the diluted earnings per share calculation because the impact of such an inclusion was antidilutive.

Swiss Re 2018 Financial Report 275
13 Income taxes The Group is generally subject to corporate income taxes based on the taxable net income in various jurisdictions in which it operates. The components of the income tax expense were:
USD millions 2017 2018
Current taxes 727 636 Deferred taxes –595 –567
Income tax expense 132 69
Tax rate reconciliation The following table reconciles the expected tax expense at the Swiss statutory tax rate to the actual tax expense in the accompanying income statement:
USD millions 2017 2018
Income tax at the Swiss statutory tax rate of 21.0% 110 115 Increase (decrease) in the income tax charge resulting from:
Foreign income taxed at different rates 11 122 Impact of foreign exchange movements 71 –64 Tax exempt income/dividends received deduction –51 –61 Change in valuation allowance –77 –92 Non-deductible expenses 57 55 Change in statutory rate –60 25 Change in liability for unrecognised tax benefits including interest and penalties 13 72 Intra-entity transfers 16 –68 Other, net1 42 –35
Total 132 69
1 Other, net includes tax return to tax provision adjustments from various jurisdictions.
For the year ended 31 December 2018, the Group reported a tax charge of USD 69 million on a pre-tax income of USD 550 million, compared to a charge of USD 132 million on a pre-tax income of USD 525 million for 2017. This translates into an effective tax rate in the current and prior-year reporting periods of 12.5% and 25.1%, respectively.
For the year ended 31 December 2018, the tax rate was largely driven by tax benefits from foreign currency translation differences between statutory and US GAAP accounts, the releases of valuation allowances on net operating losses and tax benefits from intra-entity transfers, partially offset by the impact of different rates in various jurisdictions and tax charges from unrecognised tax benefits. The higher rate in the year ended 31 December 2017 was largely driven by tax charges from currency translation differences between statutory and US GAAP accounts, impacts from unrecognised tax benefits and recognition of deferred tax charges from intra-entity transfers, partially offset by tax benefits from US tax law changes.

Financial statements Notes to the Group financial statements
276 Swiss Re 2018 Financial Report
Deferred and other non-current taxes The components of deferred and other non-current taxes were as follows:
USD millions 2017 2018
Deferred tax assets Income accrued/deferred 259 212 Technical provisions 488 560 Pension provisions 313 293 Benefit on loss carryforwards 2 296 2 675 Currency translation adjustments 490 423 Unrealised gains in income 487 424 Other 981 1 212
Gross deferred tax asset 5 314 5 799 Valuation allowance –475 –366 Unrecognised tax benefits offsetting benefits on loss carryforwards –22 –22
Total deferred tax assets 4 817 5 411
Deferred tax liabilities Present value of future profits –322 –294 Income accrued/deferred –473 –199 Investment valuation in income –535 –382 Deferred acquisition costs –918 –1 071 Technical provisions –2 191 –2 264 Unrealised gains on investments –984 –584 Foreign exchange provisions –507 –602 Other –807 –780
Total deferred tax liabilities –6 737 –6 176
Liability for unrecognised tax benefits including interest and penalties –238 –295
Total deferred and other non-current tax liabilities –6 975 –6 471
As of 31 December 2018, the aggregate amount of temporary differences associated with investment in subsidiaries, branches and associates and interests in joint ventures, for which deferred tax liabilities have not been recognised amount to approximately USD 3 billion. In the remote scenario in which these temporary differences were to reverse simultaneously, the resulting tax liabilities would be very limited due to participation exemption rules.
As of 31 December 2018, the Group had USD 11 649 million net operating tax loss carryforwards, expiring as follows: USD 5 million in 2019, USD 17 million in 2020, USD 9 million in 2021, USD 7 million in 2022, USD 7 128 million in 2023 and beyond, and USD 4 483 million never expire.
As of 31 December 2018, the Group had capital loss carryforwards of USD 1 084 million, expiring as follows: USD 3 million in 2020, USD 4 million in 2021, USD 39 million in 2023, and USD 1 038 million never expire.
For the year ended 31 December 2018, net operating tax losses of USD 487 million and net capital tax losses of USD 117 million were utilised.
Income taxes paid in 2017 and 2018 were USD 720 million and USD 740 million, respectively.

Swiss Re 2018 Financial Report 277
Unrecognised tax benefits A reconciliation of the opening and closing amount of gross unrecognised tax benefits (excluding interest and penalties) is as follows:
USD millions 2017 2018
Balance as of 1 January 216 206 Additions based on tax positions related to current year 24 49 Additions based on tax positions related to prior years 16 57 Reductions for tax positions of current year –9 –8 Reductions for tax positions of prior years –12 –15 Statute expiration –9 –19 Settlements –29 –7 Other (including foreign currency translation) 9 –6
Balance as of 31 December 206 257
As of 31 December 2017 and 2018, the amount of gross unrecognised tax benefits within the tabular reconciliation that, if recognised, would affect the effective tax rate were approximately USD 206 million and USD 257 million, respectively.
Interest and penalties related to unrecognised tax benefits are recorded in income tax expense. For the years ended 31 December 2017 and 2018, such expenses were USD 2 million and USD 7 million, respectively. For the years ended 31 December 2017 and 2018, USD 54 million and USD 60 million, respectively, were accrued for the payment of interest (net of tax benefits) and penalties. The accrued interest balance as of 31 December 2018 is included within the deferred and other non-current taxes section reflected above and in the balance sheet.
The balance of gross unrecognised tax benefits as of 31 December 2018 presented in the table above excludes accrued interest and penalties (USD 60 million).
During the year, certain tax positions and audits in Switzerland, Australia and France were effectively settled.
The Group continually evaluates proposed adjustments by taxing authorities. The Group believes that it is reasonably possible (more than remote and less than likely) that the balance of unrecognised tax benefits could increase or decrease over the next 12 months due to settlements or expiration of statutes. However, quantification of an estimated range cannot be made at this time.
The following table summarises jurisdictions and tax years that remain subject to examination:
Australia 2013–2018 Korea 2013–2018
Brazil 2013–2018 Luxembourg 2014–2018
Canada 2011–2018 Malaysia 2009–2018
China 2009–2018 Mexico 2013–2018
Colombia 2012–2018 Netherlands 2014–2018
Denmark 2013–2018 New Zealand 2013–2018
France 2016–2018 Nigeria 2016–2018
Germany 2014–2018 Singapore 2013–2018
Hong Kong 2013–2018 Slovakia 2014–2018
India 2006–2018 South Africa 2014–2018
Ireland 2014–2018 Spain 2014–2018
Israel 2014–2018 Switzerland 2015–2018
Italy 2013–2018 United Kingdom 2008, 2011–2018
Japan 2013–2018 United States 2011–2018

Financial statements Notes to the Group financial statements
278 Swiss Re 2018 Financial Report
14 Benefit plans Defined benefit pension plans and post-retirement benefits The Group sponsors various funded defined benefit pension plans. Employer contributions to the plans are charged to income on a basis which recognises the costs of pensions over the expected service lives of employees covered by the plans. The Group’s funding policy for these plans is to contribute annually at a rate that is intended to maintain a level percentage of compensation for the employees covered. A full valuation is prepared at least every three years.
The Group also provides certain healthcare and life insurance benefits for retired employees and their dependants. Employees become eligible for these benefits when they become eligible for pension benefits.
The measurement date of these plans is 31 December for each year presented.
2017 USD millions Swiss plan Foreign plans Other benefits Total
Benefit obligation as of 1 January 3 916 2 358 369 6 643 Service cost 111 8 4 123 Interest cost 24 69 9 102 Amendments –55 –3 –58 Actuarial gains/losses –57 –48 42 –63 Benefits paid –185 –78 –17 –280 Employee contribution 26 26 Effect of settlement, curtailment and termination 2 –20 –18 Effect of foreign currency translation 166 175 9 350
Benefit obligation as of 31 December 3 948 2 464 413 6 825
Fair value of plan assets as of 1 January 3 532 2 257 0 5 789 Actual return on plan assets 264 167 431 Company contribution 95 61 17 173 Benefits paid –185 –78 –17 –280 Employee contribution 26 26 Effect of settlement, curtailment and termination 2 –20 –18 Effect of foreign currency translation 153 178 331
Fair value of plan assets as of 31 December 3 887 2 565 0 6 452
Funded status –61 101 –413 –373
2018 Swiss plan Foreign plans Other benefits Total USD millions
Benefit obligation as of 1 January 3 948 2 464 413 6 825 Service cost 120 8 5 133 Interest cost 23 68 9 100 Amendments 1 –61 –60 Actuarial gains/losses –43 –81 –25 –149 Benefits paid –202 –91 –18 –311 Employee contribution 25 25 Effect of settlement, curtailment and termination 4 4 Effect of foreign currency translation –43 –99 –4 –146
Benefit obligation as of 31 December 3 832 2 270 319 6 421
Fair value of plan assets as of 1 January 3 887 2 565 0 6 452 Actual return on plan assets –73 –46 –119 Company contribution 162 16 18 196 Benefits paid –202 –91 –18 –311 Employee contribution 25 25 Effect of settlement, curtailment and termination 4 4 Effect of foreign currency translation –43 –108 –151
Fair value of plan assets as of 31 December 3 760 2 336 0 6 096
Funded status –72 66 –319 –325

Swiss Re 2018 Financial Report 279
Amounts recognised in “Other assets” and “Accrued expenses and other liabilities” in the Group’s balance sheet as of 31 December were as follows:
2017 USD millions Swiss plan Foreign plans Other benefits Total
Non-current assets 278 278 Current liabilities –3 –18 –21 Non-current liabilities –61 –174 –395 –630
Net amount recognised –61 101 –413 –373
2018 USD millions Swiss plan Foreign plans Other benefits Total
Non-current assets 238 238 Current liabilities –3 –17 –20 Non-current liabilities –72 –169 –302 –543
Net amount recognised –72 66 –319 –325
Amounts recognised in accumulated other comprehensive income, gross of tax, as of 31 December were as follows:
2017 USD millions Swiss plan Foreign plans Other benefits Total
Net gain/loss 805 375 13 1 193 Prior service cost/credit –115 2 –113
Total 690 377 13 1 080
2018
Swiss plan Foreign plans Other benefits Total USD millions
Net gain/loss 864 393 –12 1 245 Prior service cost/credit –100 3 –61 –158
Total 764 396 –73 1 087
Components of net periodic benefit cost The components of pension and post-retirement cost for the years ended 31 December were as follows:
2017 USD millions Swiss plan Foreign plans Other benefits Total
Service cost (net of participant contributions) 111 8 4 123 Interest cost 24 69 9 102 Expected return on assets –90 –78 –168 Amortisation of:
Net gain/loss 77 35 –1 111 Prior service cost –9 –9
Effect of settlement, curtailment and termination 2 –61 –59
Net periodic benefit cost 115 34 –49 100
2018
Swiss plan Foreign plans Other benefits Total USD millions
Service cost (net of participant contributions) 120 8 5 133 Interest cost 23 68 9 100 Expected return on assets –93 –85 –178 Amortisation of:
Net gain/loss 64 19 83 Prior service cost –15 –15
Effect of settlement, curtailment and termination 4 4
Net periodic benefit cost 103 10 14 127

Financial statements Notes to the Group financial statements
280 Swiss Re 2018 Financial Report
Other changes in plan assets and benefit obligations recognised in other comprehensive income for the years ended 31 December were as follows:
2017 USD millions Swiss plan Foreign plans Other benefits Total
Net gain/loss –231 –137 42 –326 Prior service cost/credit –55 –3 –58 Amortisation of:
Net gain/loss –77 –35 1 –111 Prior service cost 9 9
Effect of settlement, curtailment and termination 61 61 Exchange rate gain/loss recognised during the year 34 34
Total recognised in other comprehensive income, gross of tax –354 –138 101 –391
Total recognised in net periodic benefit cost and other comprehensive income, gross of tax –239 –104 52 –291
2018
Swiss plan Foreign plans Other benefits Total USD millions
Net gain/loss 123 50 –25 148 Prior service cost/credit 1 –61 –60 Amortisation of:
Net gain/loss –64 –19 –83 Prior service cost 15 15
Effect of settlement, curtailment and termination 0 Exchange rate gain/loss recognised during the year –13 –13
Total recognised in other comprehensive income, gross of tax 74 19 –86 7
Total recognised in net periodic benefit cost and other comprehensive income, gross of tax 177 29 –72 134
The estimated net loss and prior service credit for the defined benefit pension plans that will be amortised from accumulated other comprehensive income into net periodic benefit cost in 2019 are USD 56 million and USD 15 million, respectively. The estimated net gain and prior service credit for the other defined post-retirement benefits that will be amortised from accumulated other comprehensive income into net periodic benefit cost in 2019 are USD 2 million and USD 15 million, respectively.
The accumulated benefit obligation (the current value of accrued benefits excluding future salary increases) for pension benefits was USD 6 335 million and USD 6 043 million as of 31 December 2017 and 2018, respectively.
Pension plans with an accumulated benefit obligation in excess of plan assets as of 31 December were as follows:
USD millions 2017 2018
Projected benefit obligation 5 071 4 898 Accumulated benefit obligation 5 025 4 856 Fair value of plan assets 4 834 4 654

Swiss Re 2018 Financial Report 281
Principal actuarial assumptions
Swiss plan Foreign plans weighted average Other benefits weighted average
2017 2018 2017 2018 2017 2018
Assumptions used to determine obligations at the end of the year Discount rate 0.6% 0.8% 2.8% 3.0% 2.1% 2.2% Rate of compensation increase 1.8% 1.8% 3.0% 3.0% 2.1% 2.1% Assumptions used to determine net periodic pension costs for the year ended Discount rate 0.6% 0.6% 2.9% 2.8% 2.4% 2.1% Expected long-term return on plan assets 2.5% 2.5% 3.5% 3.6% Rate of compensation increase 1.8% 1.8% 3.1% 3.0% 2.1% 2.1% Assumed medical trend rates at year end Medical trend – initial rate 5.6% 4.7% Medical trend – ultimate rate 3.8% 3.6% Year that the rate reaches the ultimate trend rate 2021 2021
The expected long-term rates of return on plan assets are based on long-term expected inflation, interest rates, risk premiums and targeted asset category allocations. The estimates take into consideration historical asset category returns.
Assumed healthcare cost trend rates have a significant effect on the amounts reported for the healthcare plans. A one percentage point change in assumed healthcare cost trend rates would have had the following effects for 2018:
USD millions 1 percentage point
increase 1 percentage point
decrease
Effect on total of service and interest cost components 0 0 Effect on post-retirement benefit obligation 18 –15
Plan asset allocation by asset category The actual asset allocation by major asset category for defined benefit pension plans as of the respective measurement dates in 2017 and 2018 was as follows:
Swiss plan allocation Foreign plans allocation 2017 2018 Target allocation 2017 2018 Target allocation
Asset category Equity securities 29% 23% 23% 21% 13% 20% Debt securities 41% 46% 45% 71% 73% 74% Real estate 23% 24% 24% 0% 2% 0% Other 7% 7% 8% 8% 12% 6%
Total 100% 100% 100% 100% 100% 100%
Actual asset allocation is determined by a variety of current economic and market conditions and considers specific asset class risks.
Equity securities include Swiss Re common stock of USD 6 million (0.1% of total plan assets) and USD 4 million (0.1% of total plan assets) as of 31 December 2017 and 2018, respectively.
The Groupʼs pension plan investment strategy is to match the maturity profiles of the assets and liabilities in order to reduce the future volatility of pension expense and funding status of the plans. This involves balancing investment portfolios between equity and fixed income securities. Tactical allocation decisions that reflect this strategy are made on a quarterly basis.

Financial statements Notes to the Group financial statements
282 Swiss Re 2018 Financial Report
Assets measured at fair value For a description of the different fair value levels and valuation techniques see Note 8 “Fair value disclosures”.
Certain items reported as pension plan assets at fair value in the following table are not within the scope of Note 8, namely two positions: real estate and an insurance contract.
Real estate positions classified as level 1 and level 2 are exchange-traded real estate funds where a market valuation is readily available. Real estate reported on level 3 is property-owned by the pension funds. These positions are accounted for at the capitalised income value. The capitalisation based on sustainable recoverable earnings is conducted at interest rates that are determined individually for each property, based on the property’s location, age and condition. If properties are intended for disposal, the estimated selling costs and taxes are recognised in provisions. Sales gains or losses are allocated to income from real estate when the contract is concluded.
The fair value of the insurance contract is based on the fair value of the assets backing the contract.

Swiss Re 2018 Financial Report 283
As of 31 December, the fair values of pension plan assets by level of input were as follows:
Quoted prices in
active markets Significant other Significant Investments
measured 2017 for identical observable unobservable at net asset value as USD millions assets (level 1) inputs (level 2) inputs (level 3) practical expedient Total
Assets Fixed income securities:
Debt securities issued by the US government and government agencies 30 181 211 Debt securities issued by non-US governments and government agencies 1 224 1 224 Corporate debt securities 1 846 10 1 856 Residential mortgage-backed securities 23 23 Commercial mortgage-backed securities 1 1 Agency securitised products 0 Other asset-backed securities 1 1
Equity securities: Equity securities held for proprietary investment purposes 1 141 414 103 1 658
Short-term investments 38 38 Derivative financial instruments –13 –13 Real estate 692 692 Other assets 89 563 652
Total assets at fair value 1 171 3 804 805 563 6 343
Cash 109 109
Total plan assets 1 280 3 804 805 563 6 452
Quoted prices in
active markets Significant other Significant Investments
measured 2018 for identical observable unobservable at net asset value as USD millions assets (level 1) inputs (level 2) inputs (level 3) practical expedient Total
Assets Fixed income securities:
Debt securities issued by the US government and government agencies 32 209 241 Debt securities issued by non-US governments and government agencies 1 227 1 227 Corporate debt securities 1 769 10 1 779 Residential mortgage-backed securities 16 16 Commercial mortgage-backed securities 1 1 Agency securitised products 7 7 Other asset-backed securities 3 3
Equity securities: Equity securities held for proprietary investment purposes 901 308 1 209
Short-term investments 48 48 Derivative financial instruments 10 10 Real estate 721 721 Other assets 91 659 750
Total assets at fair value 933 3 689 731 659 6 012
Cash 84 84
Total plan assets 1 017 3 689 731 659 6 096

Financial statements Notes to the Group financial statements
284 Swiss Re 2018 Financial Report
Assets measured at fair value using significant unobservable inputs (level 3) For the years ended 31 December, the reconciliation of fair value of pension plan assets using significant unobservable inputs were as follows:
2017 USD millions Real estate Other assets Total
Balance as of 1 January 612 106 718 Realised/unrealised gains/losses:
Relating to assets still held at the reporting date 34 –26 8 Relating to assets sold during the period 19 19
Purchases, issuances and settlements 19 11 30 Transfers in and/or out of level 3 0 Impact of foreign exchange movements 27 3 30
Closing balance as of 31 December 692 113 805
2018 USD millions Real estate Other assets Total
Balance as of 1 January 692 113 805 Realised/unrealised gains/losses:
Relating to assets still held at the reporting date 27 –14 13 Relating to assets sold during the period 27 27
Purchases, issuances and settlements 10 –11 –1 Transfers in and/or out of level 3 –103 –103 Impact of foreign exchange movements –8 –2 –10
Closing balance as of 31 December 721 10 731
Expected contributions and estimated future benefit payments The employer contributions expected to be made in 2019 to the defined benefit pension plans are USD 122 million and to the post-retirement benefit plan are USD 17 million.
As of 31 December 2018, the projected benefit payments, which reflect expected future service, not adjusted for transfers in and for employees’ voluntary contributions, are as follows:
USD millions Swiss plan Foreign plans Other benefits Total
2019 214 89 17 320 2020 210 93 17 320 2021 204 96 17 317 2022 200 98 17 315 2023 194 100 18 312 Years 2024–2028 934 532 89 1 555
Defined contribution pension plans The Group sponsors a number of defined contribution plans to which employees and the Group make contributions. The accumulated balances are paid as a lump sum at the earlier of retirement, termination, disability or death. The amount expensed in 2017 and 2018 was USD 81 million and USD 85 million, respectively.

Swiss Re 2018 Financial Report 285
15 Share-based payments As of 31 December 2017 and 2018, the Group had the share-based compensation plans as described below.
The total compensation cost for share-based compensation plans recognised in net income was USD 55 million and USD 47 million in 2017 and 2018, respectively. The related tax benefit was USD 12 million and USD 10 million, respectively.
Restricted shares The Group granted 29 914 and 24 627 restricted shares to selected employees in 2017 and 2018, respectively. Moreover, as an alternative to the Group’s cash bonus programme, 276 483 and 194 536 shares were delivered during 2017 and 2018, respectively, which are generally not subject to forfeiture risk.
A summary of the movements in shares relating to outstanding awards granted under the restricted share plans for the year ended 31 December 2018 is as follows:
Weighted average
grant date fair value in CHF1 Number of shares
Non-vested at 1 January 88 483 844 Granted 96 219 163 Forfeited 87 –462 Vested 88 –322 238
Outstanding as of 31 December 93 380 307
1 Equal to the market price of the shares at grant.

Financial statements Notes to the Group financial statements
286 Swiss Re 2018 Financial Report
Leadership Performance Plan The Leadership Performance Plan (LPP) awards are expected to be settled in shares, and the requisite service as well as the maximum contractual term are three years. For LPP 2015, LPP 2016, LPP 2017 and LPP 2018 awards, an additional two-year holding period applies for all members of the Group EC and other key executives. At grant date, the award is split equally into two underlying components — Restricted Share Units (RSUs) and Performance Share Units (PSUs). The RSUs are measured against a return on equity performance condition and will vest within a range of 0–100%. The PSUs are based on relative total shareholder return, measured against a pre-defined group of peers and will vest within a range of 0–200%. The fair values of both components are measured separately, based on stochastic models.
The fair value assumptions in the grant valuations include market estimates for dividends (and an additional special dividend of CHF 3.00 for the LPP 2015) and the risk-free rate based on the average of the 5-year US Treasury bond rate (for LPP 2015) and the average of the 10-year US Treasury bond rate (for LPP 2016, LPP 2017 and LPP 2018) taken monthly over each year in the performance period. This resulted in risk-free rates between 1.8% and 3.1% for all LPP awards.
For the year ended 31 December 2018, the outstanding units were as follows:
RSUs LPP 2015 LPP 2016 LPP 2017 LPP 2018
Non-vested at 1 January 310 080 348 339 511 141 Granted 353 171 Forfeited –7 395 –25 188 –23 788 –7 914 Vested –302 685
Outstanding as of 31 December 0 323 151 487 353 345 257
Grant date fair value in CHF 67.65 67.91 47.41 70.18
PSUs
Non-vested at 1 January 341 955 472 628 696 804 Granted 286 193 Forfeited –8 150 –34 180 –32 426 –6 413 Vested –333 805
Outstanding as of 31 December 0 438 448 664 378 279 780
Grant date fair value in CHF 61.37 50.04 34.78 86.62
Unrecognised compensation cost As of 31 December 2018, the total unrecognised compensation cost (net of forfeitures) related to non-vested, share-based compensation awards was USD 49 million and the weighted average period over which that cost is expected to be recognised is 1.9 years.
The number of shares authorised for the Group’s share-based payments to employees was 4 411 532 and 4 172 886 as of 31 December 2017 and 2018, respectively. The Group’s policy is to ensure that sufficient treasury shares are available at all times to settle future share-based compensation plans.
Global Share Participation Plan In June 2013, Swiss Re introduced the Global Share Participation Plan, which is a share purchase plan that was rolled out for the benefit of employees of companies within the Group. Swiss Re makes a financial contribution to participants in the plan, by matching the commitment that they make during the plan cycle with additional Swiss Re shares.
If the employee is still employed by Swiss Re at the end of a plan cycle, the employee will receive an additional number of shares equal to 30% of the total number of purchased and dividend shares held at that time. In 2017 and 2018, Swiss Re contributed USD 11 million and USD 11 million to the plans and authorised 162 487 and 197 194 shares as of 31 December 2017 and 2018, respectively.

Swiss Re 2018 Financial Report 287
16 Compensation, participations and loans of members of governing bodies
The disclosure requirements under Swiss Law in respect of compensation and loans to the members of the Board of Directors and of the Group Executive Committee, as well as closely related persons, are detailed in the Compensation Report on pages 165–170 of the Financial Report of the Swiss Re Group.
The disclosure requirements under Swiss Law in respect of participations of members of the Board of Directors and the Group Executive Committee, as well as closely related persons, are detailed on pages 318–319 of the Annual Report of Swiss Re Ltd.

Financial statements Notes to the Group financial statements
288 Swiss Re 2018 Financial Report
17 Related parties The Group defines the following as related parties to the Group: subsidiaries of Swiss Re Ltd, entities in which the Group has significant influence, pension plans, members of the Board of Directors (BoD) and the Group Executive Committee (EC) and their close family members, and entities which are directly and indirectly controlled by members of governing bodies of the Group and their close family members.
As part of the consolidation process, transactions between Swiss Re Ltd and subsidiaries are eliminated in consolidation and are not disclosed in the notes.
As of 31 December 2017 and 2018, the Group’s investment in mortgages and other loans included USD 301 million and USD 373 million, respectively, of loans due from employees, and USD 181 million and USD 212 million, respectively, due from officers. These loans generally consist of mortgages offered at variable and fixed interest rates.
Contributions made to defined benefit pension plans and post-retirement benefit plans are disclosed in Note 14 ‘‘Benefit plans’’. Plan assets of the defined benefit pension plans include Swiss Re common stock of USD 6 million (0.1% of total plan assets) and USD 4 million (0.1% of total plan assets) as of 31 December 2017 and 2018, respectively.
The total number of shares, options and related instruments held by members of the BoD and the Group EC and persons closely related to, amounts to less than 1% of the shares issued by Swiss Re Ltd. None of the members of BoD and the Group EC has any significant business connection with Swiss Re Ltd or any of its Group companies. The Group BoD member Susan L. Wagner is also a board member of BlackRock, Inc. BlackRock, Inc. is acting as external asset manager for the Group.
Share in earnings and dividends received from equity-accounted investees for the years ended 31 December, were as follows:
USD millions 2017 2018
Share in earnings of equity-accounted investees 100 166 Dividends received from equity-accounted investees 170 170

Swiss Re 2018 Financial Report 289
18 Commitments and contingent liabilities Leasing commitments As part of its normal business operations, the Group enters into a number of lease agreements. As of 31 December 2018, such agreements, which are operating leases, total the following obligations for the next five years and thereafter:
USD millions 2018
2019 86 2020 78 2021 63 2022 57 2023 49 After 2023 255
Total operating lease commitments 588
Less minimum non-cancellable sublease rentals 12
Total net future minimum lease commitments 576
Minimum rentals for all operating leases (except those with terms of one month or less that were not renewed) for the years ended 31 December 2017 and 2018 were USD 94 million and USD 86 million, respectively. Sublease rental income for the years ended 31 December 2017 and 2018 was USD 2 million and USD 2 million, respectively.
Other commitments As a participant in limited and other investment partnerships, the Group commits itself to making available certain amounts of investment funding, callable by the partnerships for periods of up to ten years. The total commitments remaining uncalled as of 31 December 2018 were USD 1 954 million.
The Group enters into a number of contracts in the ordinary course of reinsurance and financial services business which, if the Group’s credit rating and/or defined statutory measures decline to certain levels, would require the Group to post collateral or obtain guarantees. The contracts typically provide alternatives for recapture of the associated business.
Legal proceedings In the normal course of business operations, the Group is involved in various claims, lawsuits and regulatory matters. In the opinion of management, the disposition of these matters is not expected to have a material adverse effect on the Group’s business, consolidated financial position, results of operations or cash flows.

Financial statements Notes to the Group financial statements
290 Swiss Re 2018 Financial Report
19 Significant subsidiaries and equity investees
Share capital (millions) Affiliation in % as of
31.12.2018 Method of
consolidation
Europe Germany Swiss Re Germany GmbH, Munich EUR 45 100 f Ireland Ark Life Assurance Company dac, Dublin EUR 19 100 f Jersey ReAssure Holdings Limited, St Helier GBP 0 100 f ReAssure Jersey One Limited, St Helier GBP 1 85 f ReAssure Jersey Two Limited, St Helier GBP 3 100 f Swiss Re ReAssure Limited, St Helier GBP 3 100 f Swiss Re ReAssure Midco Limited, St Helier GBP 0 100 f Liechtenstein Elips Life AG, Triesen CHF 12 100 f Elips Versicherungen AG, Triesen CHF 5 100 f Luxembourg iptiQ Life S.A., Luxembourg EUR 6 100 f Swiss Re Europe Holdings S.A., Luxembourg EUR 105 100 f Swiss Re Europe S.A., Luxembourg EUR 350 100 f Swiss Re Funds (Lux) I, Senningerberg1 EUR 13 271 100 f Swiss Re International SE, Luxembourg EUR 182 100 f Switzerland Swiss Pillar Investments Ltd, Zurich CHF 0 100 f Swiss Re Corporate Solutions Ltd, Zurich CHF 100 100 f Swiss Re Direct Investments Company Ltd, Zurich CHF 0 100 f Swiss Re Investments Company Ltd, Zurich CHF 0 100 f Swiss Re Investments Holding Company Ltd, Zurich CHF 0 100 f Swiss Re Investments Ltd, Zurich CHF 1 100 f Swiss Re Life Capital Ltd, Zurich CHF 0 100 f Swiss Re Life Capital Reinsurance Ltd, Zurich CHF 10 100 f Swiss Re Management Ltd, Adliswil CHF 0 100 f Swiss Re Principal Investments Company Ltd, Zurich CHF 0 100 f Swiss Re Reinsurance Holding Company Ltd, Zurich CHF 0 100 f Swiss Reinsurance Company Ltd, Zurich CHF 34 100 f United Kingdom IptiQ Holdings Limited, Shropshire GBP 0 100 f ReAssure FSH UK Limited, Shropshire GBP 710 100 f ReAssure Group Limited, Shropshire GBP 0 100 f ReAssure Limited, Shropshire GBP 289 100 f Swiss Re Capital Markets Limited, London USD 60 100 f Swiss Re Services Limited, London GBP 2 100 f
1 Net asset value instead of share capital

Swiss Re 2018 Financial Report 291
Share capital (millions) Affiliation in % as of
31.12.2018 Method of
consolidation
Americas and Caribbean Barbados European Finance Reinsurance Company Ltd., Bridgetown USD 5 100 f European International Reinsurance Company Ltd., Bridgetown USD 1 100 f Milvus I Reassurance Limited, Bridgetown USD 481 100 f Bermuda CORE Reinsurance Company Limited, Hamilton USD 0 100 f Brazil Sul America S.A., Rio de Janeiro BRL 3 320 15 e Swiss Re Brasil Resseguros S.A., São Paulo BRL 295 100 f Swiss Re Corporate Solutions Brasil Seguros S.A., São Paulo BRL 318 60 f Cayman Islands FWD Group Ltd, Grand Cayman USD 1 15 e PEP SR I Umbrella L.P., George Town USD 484 100 f Colombia Compañía Aseguradora de Fianzas S.A. Confianza, Bogotá COP 224 003 51 f United States Claret Re Inc., Burlington USD 5 100 f Facility Insurance Holding Corporation, Dallas USD 0 100 f First Specialty Insurance Corporation, Jefferson City USD 5 100 f North American Capacity Insurance Company, Manchester USD 4 100 f North American Elite Insurance Company, Manchester USD 4 100 f North American Specialty Insurance Company, Manchester USD 5 100 f Pecan Re Inc., Burlington USD 5 100 f Pillar RE Holdings LLC, Wilmington USD 0 100 f SR Corporate Solutions America Holding Corporation, Wilmington USD 0 100 f Sterling Re Inc., Burlington USD 213 100 f Swiss Re America Holding Corporation, Wilmington USD 0 100 f Swiss Re Capital Markets Corporation, New York USD 0 100 f Swiss Re Corporate Solutions Global Markets Inc., New York USD 0 100 f Swiss Re Financial Markets Corporation, Wilmington USD 0 100 f Swiss Re Financial Products Corporation, Wilmington USD 0 100 f Swiss Re Life & Health America Holding Company, Wilmington USD 0 100 f Swiss Re Life & Health America Inc., Jefferson City USD 4 100 f Swiss Re Management (US) Corporation, Wilmington USD 0 100 f Swiss Re Risk Solutions Corporation, Wilmington USD 0 100 f Swiss Re Treasury (US) Corporation, Wilmington USD 0 100 f Swiss Reinsurance America Corporation, Armonk USD 10 100 f Washington International Insurance Company, Manchester USD 4 100 f Westport Insurance Corporation, Jefferson City USD 6 100 f
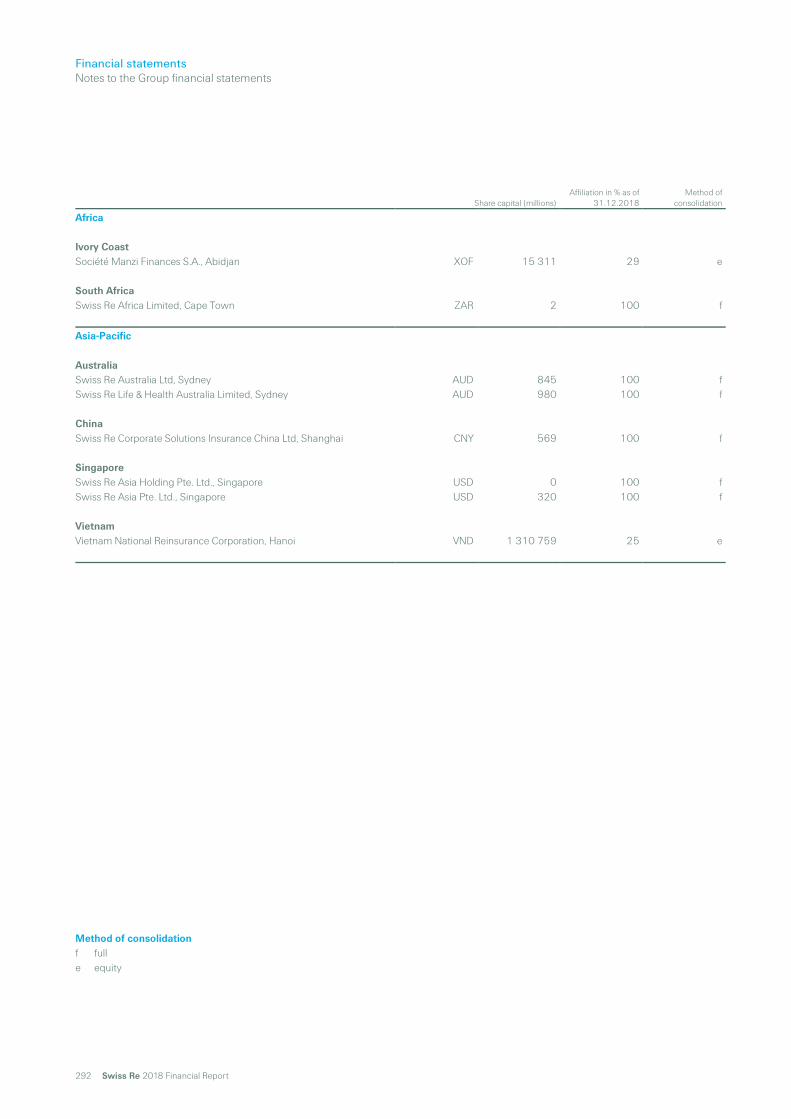
Financial statements Notes to the Group financial statements
292 Swiss Re 2018 Financial Report
Share capital (millions) Affiliation in % as of
31.12.2018 Method of
consolidation
Africa Ivory Coast Société Manzi Finances S.A., Abidjan XOF 15 311 29 e South Africa Swiss Re Africa Limited, Cape Town ZAR 2 100 f
Asia-Pacific Australia Swiss Re Australia Ltd, Sydney AUD 845 100 f Swiss Re Life & Health Australia Limited, Sydney AUD 980 100 f China Swiss Re Corporate Solutions Insurance China Ltd, Shanghai CNY 569 100 f Singapore Swiss Re Asia Holding Pte. Ltd., Singapore USD 0 100 f Swiss Re Asia Pte. Ltd., Singapore USD 320 100 f Vietnam Vietnam National Reinsurance Corporation, Hanoi VND 1 310 759 25 e
Method of consolidation f full e equity
Swiss Re 2018 Financial Report 293
20 Variable interest entities The Group enters into arrangements with variable interest entities (VIEs) in the normal course of business. The involvement ranges from being a passive investor to designing, structuring and managing the VIEs. The variable interests held by the Group arise primarily as a result of the Group’s involvement in certain insurance-linked securitisations, life and health funding transactions, swaps in trusts, debt financing, investment, senior commercial mortgage and infrastructure loans as well as other entities, which meet the definition of a VIE. When analysing whether the entity is a VIE, the Group mainly assesses if (1) the equity is sufficient to finance the entity’s activities without additional subordinated financial support, (2) the equity holders have the right to make significant decisions affecting the entity’s operations and (3) the holders of the voting rights substantively participate in the gains and losses of the entity. When one of these criteria is not met, the entity is considered a VIE and is assessed for consolidation under the VIE section of the Consolidation Topic. The party that has a controlling financial interest is called a primary beneficiary and consolidates the VIE. The party is deemed to have a controlling financial interest if it has both: the power to direct the activities of the VIE that most significantly impact the entity’s economic performance; and the obligation to absorb the entity’s losses that could potentially be significant to the VIE or the right to receive benefits from the
entity that could potentially be significant to the VIE.
For all its variable interests in VIEs, the Group assesses whether it has a controlling financial interest in these entities and, thus, is the primary beneficiary. The Group identifies the activities that most significantly impact the entity’s performance and determines whether the Group has the power to direct those activities. In conducting the analysis, the Group considers the purpose, the design and the risks that the entity was designed to create and pass through to its variable interest holders. Additionally, the Group assesses if it has the obligation to absorb losses or if it has the right to receive benefits of the VIE that could potentially be significant to the entity. If both criteria are met, the Group has a controlling financial interest in the VIE and consolidates the entity.
The Group monitors changes to the facts and circumstances of the existing involvement with legal entities to determine whether they require reconsideration of the entity’s designation as a VIE or voting interest entity. For VIEs, the Group regularly reassesses the primary beneficiary determination.
Insurance-linked securitisations The insurance-linked securitisations transfer pre-existing insurance risk to investors through the issuance of insurance-linked securities. In insurance-linked securitisations, the securitisation vehicle assumes the insurance risk from a sponsor through insurance or derivative contracts. The securitisation vehicle generally retains the issuance proceeds as collateral, which consists of investment-grade securities. The Group does not have potentially significant variable interest in these vehicles and therefore is not a primary beneficiary.
Typically, the variable interests held by the Group arise through ownership of insurance-linked securities, in which case the Group’s maximum loss equals the principal amount of the securities held by the Group.
Life and health funding vehicles The Group participates in certain structured transactions that retrocede longevity and mortality risks to captive reinsurers with an aim to provide regulatory capital credit to a transaction sponsor through creation of funding notes by a separate funding vehicle which is generally considered a VIE. The Group’s participation in these transactions is generally limited to providing contingent funding support via a financial contract with a funding vehicle, which represents a potentially significant variable interest in the funding vehicle. The Group does not have power to direct activities of the funding vehicles and therefore is not a primary beneficiary of the funding vehicles in these transactions. The Group’s maximum exposure in these transactions equals either the total contract notional or outstanding balance of the funding notes issued by the vehicle, depending on the specific contractual arrangements.

Financial statements Notes to the Group financial statements
294 Swiss Re 2018 Financial Report
Swaps in trusts The Group provides interest rate and foreign exchange risk hedges to certain asset securitisation trusts which qualify as VIEs. As the Group’s involvement is limited to interest rate and foreign exchange derivatives, it does not have power to direct any activities of the trusts and therefore does not qualify as primary beneficiary of any of these trusts. These activities are in run-off.
Debt financing vehicles The Group consolidates a debt-financing vehicle created to collateralise reinsurance coverage provided by the Group. The Group manages the asset portfolio in the vehicle and absorbs the variability of the investment return of the vehicle’s portfolio, thereby satisfying both criteria for a controlling financial interest: power over activities most significant to the vehicle’s economic performance and significant economic interest.
Investment vehicles The Group consolidates a real estate investment entity, which holds real estate backing annuities business. The Group is its primary beneficiary, because it has both power over the entity’s investment decisions as well as a significant variable interest in the entity.
The Group’s variable interests in investment partnerships arise through ownership of the limited partner interests. Many investment partnerships are VIEs because the limited partners as a group lack kick-out or participating rights. The Group does not hold the general partner interest in the limited partnerships and therefore does not direct investment activities of the entity. Therefore, the Group lacks power over the relevant activities of the vehicles and, consequently, does not qualify as the primary beneficiary. The Group is exposed to losses when the values of the investments held by the investment vehicles decrease. The Group’s maximum exposure to loss equals the Group’s share of the investment.
The Group is a passive investor in structured securitisation vehicles issuing residential and commercial mortgage-backed securities (RMBS and CMBS, respectively) and other asset-backed securities (ABS). The Group’s investments in RMBS, CMBS and other ABS are passive in nature and do not obligate the Group to provide any financial or other support to the issuer entities. By design, RMBS, CMBS and ABS securitisation entities are not adequately capitalised and therefore considered VIEs. The Group is not the primary beneficiary, because it does not have power to direct most significant activities. These investments are accounted for as available-for-sale as described in the investment note and not included in the tables below.
The Group consolidates an investment vehicle, because the Group holds the entire interest in the entity and makes investment decisions related to the entity. The investment vehicle is a VIE because it is structured as an umbrella company comprised of multiple sub-funds. The majority of the investments held in this vehicle are accounted for as available-for-sale and are disclosed in the investment note and not included in the tables below.
Investment vehicles for unit-linked business Additionally, the Group invests on behalf of the policyholders as a passive investor in a variety of investment funds across various jurisdictions. By design, many of these funds meet a VIE definition. While the Group may have a potentially significant variable interest in some of these entities due to its share of the fund’s total net assets, it never has power over the fund’s investment decisions or unilateral kick-out rights relative to the decision maker.
The Group is not exposed to losses in the aforementioned investment vehicles, as the investment risk is borne by the policyholder.

Swiss Re 2018 Financial Report 295
Senior commercial mortgage and infrastructure loans The Group also invests in structured commercial mortgage and infrastructure loans, which are held for investment.
The commercial mortgage loans are made to non-recourse special purpose entities collateralised with commercial real estate. The entities are adequately capitalised and generally structured as voting interest entities. Occasionally, the borrower entities can be structured as limited partnerships where the limited partners do not have kick-out or participating rights, which results in the VIE designation.
The infrastructure loans are made to non-recourse special purpose entities collateralised with infrastructure project assets. Some borrower entities may have insufficient equity investment at risk, which results in the VIE designation.
The Group does not have power over the activities most significant to the aforementioned borrower entities designated as VIEs and therefore does not consolidate them.
The Group’s maximum exposure to loss from its investments equals the loan outstanding amount.
Other The Group consolidates a vehicle providing reinsurance to its members, because it serves as a decision maker over the entity’s investment and underwriting activities, as well as provides retrocession for the majority of the vehicle’s insurance risk and receives performance-based fees. Additionally, the Group is obligated to provide the vehicle with loans in case of a deficit. The vehicle is a VIE, primarily because its total equity investment at risk is insufficient and the members lack decision-making rights.
The Group did not provide financial or other support to any VIEs during 2018 that it was not previously contractually required to provide.

Financial statements Notes to the Group financial statements
296 Swiss Re 2018 Financial Report
Consolidated VIEs The following table shows the total assets and liabilities in the Group’s balance sheet related to VIEs of which the Group is the primary beneficiary as of 31 December:
USD millions 2017 2018
Fixed income securities available-for-sale 3 974 3 444 Investment real estate 198 166 Short-term investments 62 79 Cash and cash equivalents 14 20 Accrued investment income 34 30 Premiums and other receivables 29 26 Deferred acquisition costs 4 3 Deferred tax assets 41 212 Other assets 15 16
Total assets 4 371 3 996
Unpaid claims and claim adjustment expenses 84 66 Liabilities for life and health policy benefits 1 Unearned premiums 12 8 Reinsurance balances payable 17 15 Deferred and other non-current tax liabilities 133 180 Accrued expenses and other liabilities 174 144 Long-term debt 2 369 2 112
Total liabilities 2 790 2 525
The assets of the consolidated VIEs may only be used to settle obligations of these VIEs and to settle any investors’ ownership liquidation requests. There is no recourse to the Group for the consolidated VIEs’ liabilities. The assets of the consolidated VIEs are not available to the Group’s creditors.

Swiss Re 2018 Financial Report 297
Non-consolidated VIEs The following table shows the total assets and liabilities on the Group’s balance sheet related to VIEs in which the Group held a variable interest but was not the primary beneficiary as of 31 December:
USD millions 2017 2018
Fixed income securities available-for-sale 587 935 Equity securities available-for-sale 700 Equity securities at fair value through earnings 272 Policy loans, mortgages and other loans 1 035 1 313 Other invested assets 1 831 1 953 Investments for unit-linked and with-profit business 9 223 5 999
Total assets 13 376 10 472
Accrued expenses and other liabilities 67 58
Total liabilities 67 58
The following table shows the Group’s assets, liabilities and maximum exposure to loss related to VIEs in which the Group held a variable interest but was not the primary beneficiary as of 31 December:
2017 2018
USD millions Total assets Total
liabilities
Maximum exposure to
loss1 Total assets Total
liabilities
Maximum exposure to
loss1
Insurance-linked securitisations 311 314 447 462 Life and health funding vehicles 27 1 2 052 25 2 174 Swaps in trusts 25 66 –2 76 58 –2 Investment vehicles 2 493 2 494 2 130 2 130 Investment vehicles for unit-linked business 9 223 5 999 Senior commercial mortgage and infrastructure loans 1 297 1 297 1 795 1 795
Total 13 376 67 –2 10 472 58 –2
1 Maximum exposure to loss is the loss the Group would absorb from a variable interest in a VIE in the event that all of the assets of the VIE are deemed worthless. 2 The maximum exposure to loss for swaps in trusts cannot be meaningfully quantified due to their derivative character.
The assets and liabilities for the swaps in trusts represent the positive and negative fair values of the derivatives the Group has entered into with the trusts.

Financial statements Notes to the Group financial statements
298 Swiss Re 2018 Financial Report
21 Subsequent events Investment by MS&AD Insurance Group Holdings Inc into ReAssure In December 2018, Swiss Re reached an agreement with MS&AD Insurance Group Holdings Inc (MS&AD) for a further investment of GBP 315 million into ReAssure. MS&AD increased its 15% minority stake in ReAssure to a total shareholding of 25% as a result of the transaction, which closed on 20 February 2019.
The Group financial statements and related notes presented in this report are not impacted.

Swiss Re 2018 Financial Report 299
Report of the statutory auditor to the General Meeting of
Swiss Re Ltd
Zurich
Report of the statutory auditor on the consolidated financial statements As statutory auditor, we have audited the accompanying consolidated financial statements of Swiss Re Ltd and its subsidiaries (the ‘Company’), which comprise the consolidated balance sheet as of 31 December 2018, and the related consolidated income statement, statement of comprehensive income, statement of shareholders’ equity, statement of cash flows and notes for the year ended 31 December 2018.
Board of Directors’ responsibility The Board of Directors is responsible for the preparation and fair presentation of the consolidated financial statements in accordance with accounting principles generally accepted in the United States of America and the requirements of Swiss law. This responsibility includes designing, implementing and maintaining an internal control system relevant to the preparation and fair presentation of consolidated financial statements that are free from material misstatement, whether due to fraud or error. The Board of Directors is further responsible for selecting and applying appropriate accounting policies and making accounting estimates that are reasonable in the circumstances.
Auditor’s responsibility Our responsibility is to express an opinion on these consolidated financial statements based on our audit. We conducted our audit in accordance with Swiss law, Swiss Auditing Standards and auditing standards generally accepted in the United States of America. Those standards require that we plan and perform the audit to obtain reasonable assurance about whether the consolidated financial statements are free from material misstatement.
An audit involves performing procedures to obtain audit evidence about the amounts and disclosures in the consolidated financial statements. The procedures selected depend on the auditor’s judgement, including the assessment of the risks of material misstatement of the consolidated financial statements, whether due to fraud or error. In making those risk assessments, the auditor considers the internal control system relevant to the Company’s preparation and fair presentation of the consolidated financial statements in order to design audit procedures that are appropriate in the circumstances, but not for the purpose of expressing an opinion on the effectiveness of the Company’s internal control system. An audit also includes evaluating the appropriateness of accounting policies used and the reasonableness of accounting estimates made, as well as evaluating the overall presentation of the consolidated financial statements. We believe that the audit evidence we have obtained is sufficient and appropriate to provide a basis for our audit opinion.
Opinion In our opinion, the accompanying consolidated financial statements present fairly, in all material respects, the financial position of the Company at 31 December 2018, the results of operations and the cash flows for the year then ended in accordance with accounting principles generally accepted in the United States of America and comply with Swiss law.
Other matter Accounting principles generally accepted in the United States of America require that the supplementary information based on the requirements of ASU 2015-09, Disclosures about Short-Duration Contracts, on pages 232 to 240 be presented to supplement the consolidated financial statements. Such information, although not part of the consolidated financial statements, is required by the Financial Accounting Standards Board, which considers it an essential part of financial reporting for placing the consolidated financial statements in an appropriate operational, economic, or historical context. We have applied certain limited procedures to the required supplementary information in accordance with auditing standards generally accepted in the United States of America, which consisted of inquiries of management about the methods of preparing the information and comparing the information for consistency with management’s responses to our inquiries, the consolidated financial statements and other knowledge we obtained during our audit of the consolidated financial statements. We do not express an opinion or provide any assurance on the information because the limited procedures do not provide us with sufficient evidence to express an opinion or provide any assurance.

300 Swiss Re 2018 Financial Report
Report on key audit matters based on the circular 1/2015 of the Federal Audit Oversight Authority Key audit matters are those matters that, in our professional judgement, were of most significance in our audit of the consolidated financial statements of the current period. These matters were addressed in the context of our audit of the consolidated financial statements as a whole and in forming our opinion thereon, and we do not provide a separate opinion on these matters.
How our audit addressed the key audit matter We assessed and tested the design and operating effectiveness of selected key controls around the valuation models for level 2 and 3 investments, including the Company’s independent price verification process. We also tested management’s data integrity and change management controls relating to the valuation models.
In relation to the matters set out opposite, our substantive testing procedures included the following: Challenging the Company’s methodology and assumptions,
in particular, the yield curves, discounted cash flows, perpetual growth rates and liquidity premiums used in the valuation models.
Comparing the assumptions used against appropriate benchmarks and investigating significant differences.
Engaging our own valuation experts to perform independent valuations of selected level 2 and 3 investments.
Based on the work performed, we consider the methodology and assumptions used by management in determining the valuation to be appropriate.
Key audit matter Investment valuation continues to be an area with inherent risk for certain level 2 and 3 investments that have unobservable or interpolated inputs. The risk is not the same for all investment types and is greatest for those listed below. These investments are more difficult to value because quoted prices are not always available and valuation requires complex valuation models:
Fixed income securitised products Fixed income mortgage and asset-backed securities Private placements and infrastructure loans Private equities Derivatives Insurance-related financial products
Unobservable or interpolated inputs used for the valuation of certain level 2 and 3 investments

Swiss Re 2018 Financial Report 301
Key audit matter Valuation of actuarially determined P&C loss reserves involves a high degree of subjectivity and complexity. Reserves for losses and loss adjustment expenses represent estimates of future payments of reported and unreported claims for losses and related expenses at a given date.
Furthermore, on a regular basis, the Company enters into large and/or structured transactions which often have material or complex financial reporting and reserving consequences. The reserving for such transactions is subject to increased risk of error due to the non-routine nature of transactions and the judgemental nature of reserving.
The Company uses a range of actuarial methodologies and methods to estimate these reserves. Actuarially determined P&C loss reserves require significant judgement relating to certain factors and assumptions. Among the most significant reserving assumptions are the A-priori loss ratios, which typically drive the estimates of P&C loss reserves for the most recent contract years. Other key factors and assumptions include, but are not limited to, interest rates, inflation trends, claims trends, regulatory decisions, historical claims information and the growth of exposure.
In particular, loss reserves for ‘long tail’ lines of business (for example, the Liability, US Asbestos and Environmental, Motor Liability and Workers’ Compensation portfolios) are generally more difficult to project. This is due to the protracted period over which claims may be reported as well as the fact that claim settlements are often less frequent but of higher magnitude. Long-tailed lines of business generally rely on many assumptions based on experts’ judgement.
Moreover, not all natural catastrophe events and significant man-made losses can be modelled using traditional actuarial methodologies, which increases the degree of judgement needed in establishing reserves for these events.
How our audit addressed the key audit matter We assessed and tested the design and operating effectiveness of selected key controls relating to the application of the actuarial methodology, data collection and analysis, as well as the processes for determining the assumptions used by management in the valuation of actuarially determined P&C loss reserves.
In relation to the matters set out opposite, our substantive testing procedures included the following, which are applicable for both the standard reserving and large and/or structured transactions:
Testing the completeness and accuracy of underlying data utilised by the Company’s actuaries in estimating P&C loss reserves.
Applying IT audit techniques to analyse claims through the recalculation of claims triangles.
Involving PwC’s internal actuarial specialists to independently test management’s estimates of P&C loss reserves, and evaluate the reasonableness of the methodology and assumptions used by comparing them with recognised actuarial practices and by applying our industry knowledge and experience.
Performing independent projections of selected portfolios. For these portfolios, we compared our calculations of projected reserves with those of the Company taking into account the available corroborating and contrary evidence and challenging management’s assumptions as appropriate.
Assessing the process and related judgements of management in relation to natural catastrophes and other large losses, including using our industry knowledge to assess the reasonableness of market loss estimates and other significant assumptions.
Performing sensitivity tests to determine the impact of selected key assumptions.
Evaluating the appropriateness of any significant adjustments made by management to P&C loss reserve estimates.
Evaluating the appropriateness of the recognition, accounting, and disclosures for large and/or structured transactions
Based on the work performed, we consider the methodologies and assumptions used by management in the valuation of actuarially determined P&C loss reserves to be appropriate.
Valuation of actuarially determined Property & Casualty (‘P&C’) loss reserves

302 Swiss Re 2018 Financial Report
How our audit addressed the key audit matter We assessed and tested the design and operating effectiveness of selected key controls relating to the application of actuarial methodology, data collection and analysis, as well as the processes for determining the assumptions used by management in the valuation of actuarially determined L&H reserves.
In relation to the matters set out opposite, our substantive testing procedures included the following, which are applicable for both the standard reserving and large and/or structured transactions:
Testing the completeness and accuracy of the underlying data by vouching against the source documentation.
Testing the migration of actuarial data from legacy systems and/or spreadsheets to the new actuarial systems for completeness and accuracy.
Involving our life insurance actuarial specialists to perform independent model validation procedures, including detailed testing of models, independent recalculations and back testing.
Challenging the Company’s methodology and methods, focusing on changes to L&H actuarial methodology and methods during the year, by applying our industry knowledge and experience to check whether the methodology and methods are consistent with recognised actuarial practices and reporting requirements.
Evaluating the appropriateness of the recognition, accounting, and disclosures for large and/or structured transactions.
Based on the work performed, we consider that the methodologies and assumptions used by management in the valuation of actuarially determined L&H reserves to be appropriate.
Key audit matter The Company’s valuation of liabilities for L&H policy benefits and policyholder account balances involves complex judgements about future events affecting the business. Actuarial assumptions selected by the Company with respect to interest rates, inflation trends, investment returns, mortality, morbidity, lapse in coverage, longevity, persistency, expenses, stock market volatility and future policyholder behaviour may result in material impacts on the valuation of L&H reserves. The methodology and methods used can also have a material impact on the valuation of actuarially determined L&H reserves.
Furthermore, on a regular basis, the Company enters into large and/or structured transactions which often have material or complex financial reporting and reserving consequences. The reserving for such transactions is subject to increased risk of error due to the non-routine nature of transactions and the judgemental nature of reserving.
The valuation of actuarially determined L&H reserves depends on the use of complex models. The Company continues to migrate actuarial data and models from legacy systems and/or spreadsheets to new actuarial modelling systems. At the same time, management is validating models to ensure that new models are fit for use. Moving from one modelling platform to another is a complex and time-consuming process, frequently taking several years. Any resulting adjustments to reserves need to be assessed in terms of appropriateness and classified as changes in estimates or as an out-of-period adjustment.
Valuation of actuarially determined Life & Health (‘L&H’) reserves

Swiss Re 2018 Financial Report 303
Report on other legal requirements We confirm that we meet the legal requirements on licensing according to the Auditor Oversight Act (AOA) and independence (article 728 CO and article 11 AOA) and that there are no circumstances incompatible with our independence.
In accordance with article 728a paragraph 1 item 3 CO and Swiss Auditing Standard 890, we confirm that an internal control system exists which has been designed for the preparation of consolidated financial statements according to the instructions of the Board of Directors.
We recommend that the consolidated financial statements submitted to you be approved.
PricewaterhouseCoopers Ltd
Roy Clark Frank Trauschke Audit expert Auditor in charge
Zurich, 13 March 2019
Key audit matter The Company is carrying a provision for uncertain tax items on its books. The valuations of these items are based on management’s estimates and management’s assessment whether deferred tax assets are more likely than not to be realised. Changes in the estimates of uncertain tax items have an impact (through income tax expense) on the results.
How our audit addressed the key audit matter We assessed and tested the design and operating effectiveness of selected key controls in place to determine the completeness of the uncertain tax items and management’s assessment of the items for recognition and valuation. In relation to the matters set out opposite, our substantive testing procedures included the following: Involving our own tax specialists to critically review
management’s ‘more likely than not’ tax assessments to evaluate the Company’s judgements and estimates of the probabilities and the amounts.
Assessing how the Company had considered new information or changes in tax law or case law, and assessing the Company’s judgement of how these impact the Company’s position or measurement of the required provision.
Examining tax audit documentation to validate the appropriateness of releases of uncertain tax provisions.
Evaluating the appropriateness of management’s assessment of completeness of the uncertain tax provisions.
Examining material movements within the uncertain tax positions in each jurisdiction.
Based on the work performed, we determined management’s assessment of uncertain tax items to be appropriate.
Completeness and valuation of uncertain tax items

304 Swiss Re 2018 Financial Report
USD millions 20091 2010 2011
Income statement Revenues Premiums earned 22 664 19 652 21 300 Fee income 847 918 876 Net investment income 6 399 5 422 5 469 Net realised investment gains/losses 875 2 783 388 Other revenues 178 60 50
Total revenues 30 963 28 835 28 083
Expenses Claims and claim adjustment expenses –8 336 –7 254 –8 810 Life and health benefits –8 639 –8 236 –8 414 Return credited to policyholders –4 597 –3 371 –61 Acquisition costs –4 495 –3 679 –4 021 Other operating costs and expenses –3 976 –3 620 –3 902
Total expenses –30 043 –26 160 –25 208
Income before income tax expense 920 2 675 2 875 Income tax expense –221 –541 –77
Net income before attribution of non-controlling interests 699 2 134 2 798
Income/loss attributable to non-controlling interests –154 –172
Net income after attribution of non-controlling interests 699 1 980 2 626
Interest on contingent capital instruments, net of tax –203 –1 117
Net income attributable to common shareholders 496 863 2 626
Balance sheet Assets Investments 151 341 156 947 162 224 Other assets 81 407 71 456 63 675
Total assets 232 748 228 403 225 899
Liabilities Unpaid claims and claim adjustment expenses 68 412 64 690 64 878 Liabilities for life and health policy benefits 39 944 39 551 39 044 Unearned premiums 6 528 6 305 8 299 Other liabilities 73 336 72 524 65 850 Long-term debt 19 184 18 427 16 541
Total liabilities 207 404 201 497 194 612
Shareholders’ equity 25 344 25 342 29 590
Non-controlling interests 1 564 1 697
Total equity 25 344 26 906 31 287
Earnings/losses per share in USD 1.46 2.52 7.68
Earnings/losses per share in CHF 1.49 2.64 6.79
1 The Group changed its reporting currency from CHF into USD in 2010. Periods prior to 2010 have been translated to USD for informational purposes only based on the Group’s average exchange rates for the income statements and year-end rates for the balance sheets.
2 The Group updated its balance sheet presentation of deferred tax assets and liabilities. Deferred tax assets and liabilities are presented on a gross basis as per the first quarter 2013. The comparative period has been adjusted accordingly and is consistent with the relevant income tax disclosure in the notes to the financial statements in the prior year.

Swiss Re 2018 Financial Report 305
20122 2013 2014 2015 2016 2017 2018
24 661 28 276 30 756 29 751 32 691 33 119 33 875 785 542 506 463 540 586 586 5 302 4 735 4 992 4 236 4 740 4 702 5 077 2 688 3 325 1 059 1 220 5 787 4 048 –2 530 188 24 34 44 28 32 39
33 624 36 902 37 347 35 714 43 786 42 487 37 047
–7 763 –9 655 –10 577 –9 848 –12 564 –16 730 –14 855 –8 878 –9 581 –10 611 –9 080 –10 859 –11 083 –11 769 –2 959 –3 678 –1 541 –1 166 –5 099 –3 298 1 033 –4 548 –4 895 –6 515 –6 419 –6 928 –6 977 –6 919 –3 953 –4 268 –3 876 –3 882 –3 964 –3 874 –3 987
–28 101 –32 077 –33 120 –30 395 –39 414 –41 962 –36 497
5 523 4 825 4 227 5 319 4 372 525 550 –1 125 –312 –658 –651 –749 –132 –69
4 398 4 513 3 569 4 668 3 623 393 481
–141 –2 –3 3 5 –19
4 257 4 511 3 569 4 665 3 626 398 462
–56 –67 –69 –68 –68 –67 –41
4 201 4 444 3 500 4 597 3 558 331 421
152 812 150 075 143 987 137 810 155 016 161 897 147 302 68 691 63 445 60 474 58 325 60 049 60 629 60 268
221 503 213 520 204 461 196 135 215 065 222 526 207 570
63 670 61 484 57 954 55 518 57 355 66 795 67 446 36 117 36 033 33 605 30 131 41 176 42 561 39 593 9 384 10 334 10 576 10 869 11 629 11 769 11 721 62 020 57 970 53 670 55 033 59 402 56 959 51 581 16 286 14 722 12 615 10 978 9 787 10 148 8 502
187 477 180 543 168 420 162 529 179 349 188 232 178 843
34 002 32 952 35 930 33 517 35 634 34 124 27 930
24 25 111 89 82 170 797
34 026 32 977 36 041 33 606 35 716 34 294 28 727
11.85 12.97 10.23 13.44 10.72 1.03 1.37
11.13 12.04 9.33 12.93 10.55 1.02 1.34