financial statements 2016 - imo statements/imo fina… · 3 the financial statements have been...
TRANSCRIPT

FINANCIAL STATEMENTS 2016
TABLE OF CONTENTS• SECRETARY-GENERAL’S STATEMENT ................................................................................................................... 2
• STATEMENT ON INTERNAL CONTROL .................................................................................................................. 18
• STATEMENT I Statement of Financial Position as at 31 December 2016 ....................................................... 20
• STATEMENT II Statement of Financial Performance for the year ended 31 December 2016 ............................. 21
• STATEMENT III Statement of Changes in Net Assets for the year ended 31 December 2016 ............................ 22
• STATEMENT IV Statement of Cash Flow for the year ended 31 December 2016 .............................................. 23
• STATEMENT V Statement of Comparison of Budget and Actual Amounts for the year ended 31 December 2016 ................................................................................... 24
• NOTES TO THE FINANCIAL STATEMENTS ............................................................................................................. 26
• ANNEX 1 (unaudited) ............................................................................................................................ 73
• ANNEX 2 Opinion of the External Auditor on the Organization’s Financial Statements for the financial year ended 31 December 2016 ...................................................................... 74
IMO FINANCIAL STATEMENTS 2016
2
Secretary-General’s StatementINTRODUCTION
1 In accordance with financial regulation 12.10, I have the honour to submit to the Council, for its examination and onward transmission to the Assembly, the financial statements of the International Maritime Organization (IMO) for the year ended 31 December 2016.
2 The Report of the External Auditor on the audit of the 2016 financial statements, together with his opinion thereon, are also submitted to the Council as prescribed under financial regulation 12.10.
3 The financial statements have been prepared in accordance with the International Public Sector Accounting Standards (IPSAS), as prescribed by financial regulation 11.1, adopted by the Assembly through resolution A.1017(26), effective 1 January 2010, and in line with the United Nations policy that IPSAS be used as the accounting standards by United Nations system organizations.
4 In 1948, an international conference in Geneva adopted a convention formally establishing the Intergovernmental Maritime Consultative Organization (IMCO). The Convention entered into force in 1958 and the Organization came into being in 1959. In 1982, the original name was changed to the International Maritime Organization. The Headquarters of the Organization are in London and its complement is approximately 290 staff members, including project staff and Junior Professional Officers. IMO’s principal place of business, as well as the names and addresses of its General Counsel, actuary, principal bankers and external auditor, are indicated in annex 1 to these financial statements.
5 Within the meaning of IPSAS, IMO also controls the World Maritime University (WMU) and the IMO International Maritime Law Institute (IMLI), the financial records of which are presented within these financial statements. However, IMO is not a controlled entity under the definition of IPSAS, its ultimate decision-making body being its Assembly of 172 Member States and three Associate Members, with an elected Council of 40 Member States performing, in accordance with Article 26 of its constitutive Convention, all functions of the Assembly, with the exception of some technical matters, between sessions of the Assembly.
6 The purposes of the Organization, as summarized in Article 1(a) of its Convention, are “to provide machinery for cooperation among Governments in the field of governmental regulation and practices relating to technical matters of all kinds affecting shipping engaged in international trade; to encourage and facilitate the general adoption of the highest practicable standards in matters concerning maritime safety, efficiency of navigation and prevention and control of marine pollution from ships; and to deal with administrative and legal matters related to the purposes set out in this Article.”
7 The mission statement of IMO is as follows:
“The mission of the International Maritime Organization (IMO), as a United Nations specialized agency, is to promote safe, secure, environmentally sound, efficient and sustainable shipping through cooperation. This will be accomplished by adopting the highest practicable standards of maritime safety and security, efficiency of navigation and prevention and control of pollution from ships, as well as through consideration of the related legal matters and effective implementation of IMO instruments, with a view to their universal and uniform application.”
8 IMO, through the development and approval of its Strategic Plan, the most recent of which was approved by the Assembly in November 2015 to cover the period 2016-2021, has defined 14 strategic directions (SDs), which are key to delivering its mission. The SDs for enabling IMO to achieve its mission objectives in the years ahead can be considered under three broad categories:
1 enhancing the status and effectiveness of the Organization (SDs 1, 2, 3 and 4);
2 developing and maintaining a comprehensive framework for safe, secure, efficient and environmentally sound shipping (SDs 5, 6, 7, 8, 9, 10 and 14); and
3 enhancing the profile of shipping and instilling a quality culture and environmental conscience within the shipping community (SDs 11, 12 and 13).
IMO FINANCIAL STATEMENTS 2016
3
9 The SDs are:
SD 1 IMO is the primary international forum for technical matters of all kinds affecting international shipping and legal matters related thereto. An inclusive and comprehensive approach to such matters will be a hallmark of IMO. IMO will actively promote its role as the primary international forum on matters within its competence and ensure and strengthen the linkage between safe, secure, efficient and environmentally friendly maritime transportation, the development of global trade, the world economy and the realization of new United Nations development agenda and the Sustainable Development Goals (SDGs). In order to maintain that primacy, it will:
1 further develop its role in maritime affairs vis-à-vis other intergovernmental and international organizations, so as to be able to deal effectively and comprehensively with complex cross-agency issues;
2 actively engage the various stakeholders to ensure a more inclusive approach to decision making; and
3 actively seek to reap synergies and avoid duplicating efforts made by other United Nations agencies in shipping matters.
SD 2 IMO will foster global compliance with its instruments governing international shipping and will strive for their uniform implementation by Member States.
SD 3 With a view to enhancing its contribution to sustainable development, IMO will strengthen its maritime capacity-building programmes and will focus on:
1 developing capacity-building partnerships with governments, organizations and industry;
2 ensuring the long-term sustainability of the Integrated Technical Cooperation Programme (ITCP);
3 contributing to the realization of the relevant SDGs, including through the development of major projects targeting emerging issues;
4 meeting the needs of its developing Member States; and
5 further improving the delivery, utilization, efficiency and effectiveness of its technical assistance and cooperation programmes.
SD 4 Internally, IMO should be able to respond effectively and efficiently to emerging trends, developments and challenges. It will strive for excellence in governance and management. Besides the Strategic Plan, it will maintain a risk management framework. The Council will provide visionary leadership, committees will be optimally structured and will be supported by an effective and efficient Secretariat. Within approved biennial appropriations and in accordance with a detailed Business Plan, the Secretariat will be endowed with sufficient resources and expertise to realize the Organization’s work plans, and the Organization will make effective use of information and communication technology in management and administration.
SD 5 IMO’s highest priority will be the safety of human life at sea. In particular, greater emphasis will be accorded to:
1 ensuring that all systems related to enhancing the safety of human life at sea are adequate, including those concerned with large concentrations of people;
2 enhancing technical, operational and safety management standards;
3 eliminating shipping that fails to meet and maintain these standards on a continuous basis; and
4 increasing the emphasis on the role of the human element in safe shipping.
SD 6 IMO will seek to enhance the security of the maritime transport network, including vital shipping lanes, and to reduce piracy and armed robbery against ships as well as the frequency of stowaway incidents, by:
1 promoting a comprehensive and cooperative approach, both among Member States within the Organization and between IMO and other intergovernmental and non-governmental organizations;
2 raising awareness of IMO security measures and promoting their effective implementation;
3 raising awareness of IMO measures against piracy and armed robbery against ships and promoting their effective implementation;

IMO FINANCIAL STATEMENTS 2016
4
4 increasing the emphasis on the role of the human element and safeguarding the human rights of seafarers in secure shipping; and
5 increasing the emphasis on safety and security of seafarers.
SD 7 IMO will focus on reducing and eliminating adverse impacts from shipping on the environment by:
1 identifying and addressing possible adverse impacts;
2 developing and facilitating the implementation of effective measures for mitigating and responding to the impact on the environment caused by shipping incidents and operational pollution from ships;
3 contributing to international efforts to reduce atmospheric pollution and address climate change; and
4 increasing the emphasis on the role of the human element in environmentally sound shipping.
SD 8 IMO will seek to ensure that measures to promote safe, secure and environmentally sound shipping do not unduly affect the efficiency of shipping. It will also constantly review such measures to ensure their adequacy, effectiveness and relevance using the best available tools, thereby securing better regulation without unnecessary or disproportionate administrative requirements.
SD 9 IMO will pay special attention to the shipping needs of Small Island Developing States (SIDS) and the least developed countries (LDCs).
SD 10 IMO will apply goal-based standards for maritime safety and environmental protection.
SD 11 IMO, in partnership with other stakeholders, will seek to raise the profile of the safety, security and environmental records of shipping in the eyes of civil society by:
1 actively publicizing the vital importance of shipping as a safe, secure and environmentally sound mode of transport for goods and people as well as being a promoter and enabler of sustainable development, and underlining the role of the Organization in that regard; and
2 consequently further enhancing its public outreach programmes.
SD 12 IMO will take the lead in enhancing the quality culture of shipping by:
1 encouraging the utilization of the best available techniques not entailing excessive costs, in all aspects of shipping;
2 encouraging proper management of ships;
3 promoting and enhancing the availability of, and access to, information – including casualty information – relating to ship safety, security and the environment (i.e. transparency);
4 ensuring that all stakeholders understand and accept their responsibilities regarding safe, secure and environmentally sound shipping by developing a “chain of responsibility” concept among them; and
5 identifying, correlating and evaluating the factors, including human interaction on board ships, that influence safety, security and environmental culture, and developing practical and effective mechanisms to address them.
SD 13 IMO will seek to enhance environmental conscience within the shipping community.
SD 14 IMO will seek to ensure better regulation through a systematic approach and also that its instruments are free from administrative requirements that are disproportionate, obsolete or unnecessary. The Organization will continue its efforts to reduce administrative burdens in IMO instruments without compromising safety, security and the protection of the environment.
SERVICE DELIVERY – HIGHLIGHTS OF 2016
10 The year 2016 saw IMO actively pursuing its targets and objectives in a wide range of subject areas. Some of the highlights of what was a busy, varied and successful year for the Organization are summarized below.
IMO FINANCIAL STATEMENTS 2016
5
MARITIME SAFETY
11 In May 2016, the Maritime Safety Committee (MSC) confirmed that ship construction rules for oil tankers and bulk carriers submitted by 12 classification societies conform to the goals and functional requirements set by the Organization for new oil tankers and bulk carriers set out in the International goal-based ship construction standards for bulk carriers and oil tankers (resolution MSC.287(87)), which were adopted in 2010.
12 The MSC, in November 2016, further developed proposed amendments to revise and update the Guidelines for verification of conformity with goal-based ship construction standards for bulk carriers and oil tankers (resolution MSC.296(87)) (GBS Verification Guidelines), based on the experience gained during the initial verification audits. The revisions, to be further considered in June 2017, include additional and revised paragraphs relating to issues such as the insertion of an application date for any revised version of the Guidelines or submitting corrective action plans to address any findings reported by the GBS Audit Teams. Guidelines on common submissions by groups of submitters and the inclusion of an ongoing review of the rules are also proposed to be included. A revised timetable and schedule of activities for the implementation of the GBS verification scheme was also agreed, to include a 31 December 2017 deadline for the receipt of rule change information and request for new initial verification audits, if any.
13 Interim Recommendations on the safe carriage of more than 12 industrial personnel on board vessels engaged on international voyages, which are aimed at addressing the safe and efficient transfer of technicians at sea, such as those working in the growing offshore alternative energy sector, were adopted by resolution MSC.418(97). In this context, Governments were invited to apply the Interim Recommendations, pending the planned development of the new chapter of SOLAS and the draft new code addressing the carriage of more than 12 industrial personnel on board vessels engaged on international voyages. The new SOLAS chapter and code will be developed under the coordination of the Sub-Committee on Ship Design and Construction (SDC). Offshore industrial activities, covered by the Interim Recommendations, would include the construction, maintenance, operation or servicing of offshore facilities related, but not limited, to exploration, the renewable or hydrocarbon energy sectors, aquaculture, ocean mining or similar activities.
14 The MSC adopted the International Code of Safety for Ships using Gases or other Low-flashpoint Fuels (IGF Code), for ships using gas as fuel, in particular liquefied natural gas (LNG), which was made mandatory under SOLAS and became effective on 1 January 2017. To implement the training provisions of the Code, the MSC also adopted related amendments to the International Convention on Standards of Training, Certification and Watchkeeping for Seafarers (STCW) and the STCW Code, to include new mandatory minimum requirements for the training and qualifications of masters, officers, ratings and other personnel on ships subject to the IGF Code, amendments to which entered into force on 1 January 2017.
15 The MSC, in May 2016, endorsed the decision of the Sub-Committee on Ship Systems and Equipment (SSE) that additional performance and test standards for the equipment and systems on board ships operating in polar waters should be developed. In this connection, the MSC instructed the SSE Sub-Committee to:
1 review the LSA Code and the relevant IMO resolutions to adapt current testing and performance standards to the Polar Code provisions or develop additional requirements, if necessary. In this regard, the application should only address lifesaving appliances in polar waters when requested by the relevant application requirements in the Polar Code (all ships, ships intended to operate in low air temperature, ship ice classes in accordance with chapter 3, etc.); and
2 develop guidance on extinguishing media at polar service temperatures and consider any necessary amendments to current standards for firefighters’ outfits.
16 Additionally, the MSC instructed the Sub-Committee on Navigation, Communications and Search and Rescue (NCSR) to consider current communication requirements in SOLAS and the need for any amendments, taking into account the extended duration requirements in the Polar Code; and to consider the need for a new performance standard for GNSS compasses.

IMO FINANCIAL STATEMENTS 2016
6
ENVIRONMENTAL PROTECTION
17 The International Convention for the Control and Management of Ships’ Ballast Water and Sediments (BWM Convention) met its entry into force conditions on 8 September 2016 and will enter into force on 8 September 2017. Under the Convention, all ships engaged in international voyages are required to manage their ballast water and sediments to a certain standard, according to a ship-specific ballast water management plan. The BWM Convention was adopted at an international conference held at IMO Headquarters in 2004. On meeting the conditions for entry into force, it had 52 Contracting States which represented 35.14% of the world merchant shipping tonnage. As of 31 March 2017 there were 54 Contracting States representing 53.41% of world merchant shipping tonnage.
18 Amendments to MARPOL Annex VI on mandatory requirements for ships to record and report their fuel oil consumption were adopted. Under the new requirements, ships of 5,000 gross tonnage and above will have to collect consumption data for each type of fuel oil they use, as well as other, additional, specified data including proxies for transport work. The new mandatory data collection system is intended to be the first step of a three-step approach in which analysis of the data collected would provide the basis for an objective, transparent and inclusive policy debate in the MEPC. This would allow a decision to be made on whether any further measures are needed to enhance energy efficiency and address greenhouse gas emissions from international shipping. If so, proposed policy options would then be considered. A roadmap (2017 through to 2023) for developing a “Comprehensive IMO strategy on reduction of GHG emissions from ships” was also approved, which foresees an initial GHG strategy to be adopted in 2018.
FACILITATION AND SECURITY
19 Through capacity building, there has been a focus on implementation of special measures to enhance maritime security (SOLAS chapter XI-2, the ISPS Code and the SUA Treaties) and facilitation, in particular: focussing on national organization of security and facilitation, promoting inter-agency cooperation on a national and regional basis, developing and validating new training material, addressing cyber security and other emerging maritime security risks, promoting implementation of the FAL Convention, encouraging the creation of national facilitation committees, integrating security and facilitation activities, and focussing on reducing incidents of stowaways.
LEGAL MATTERS
20 A training programme on the implementation of IMO’s instruments into domestic legislation has been developed and delivered. It provides participants from IMO Member States with the opportunity to familiarize themselves with the Organization, its structure and the treaty-making process at IMO. Treaties covered by the IMO Member State Audit Scheme as well as the civil liability conventions are presented and analysed. The main focus of the programme is on the implementation of those treaties into national legislation. The participants learn drafting techniques and best practices in the implementation process. Special attention is paid to the implementation of those amendments to IMO treaties which are adopted through the tacit acceptance procedure. The ultimate goal of the programme is to furnish participants with the knowledge that is necessary to develop national legislation and to keep it up to date to ensure compliance with IMO standards.
21 An interactive workshop on the civil liability conventions has been developed and delivered. The workshop provides a comprehensive overview of the civil liability conventions, with an in-depth analysis of the history of their development, their principles, implementation and practical implications. It is delivered in collaboration with the IOPC Funds Secretariat and the International Group of P&I Clubs. An understanding of the principles of liability and compensation and of the specific requirements for each of these conventions is necessary for the treaties to be enacted fully and completely into national law.
IMO FINANCIAL STATEMENTS 2016
7
TECHNICAL COOPERATION
22 The Organization continues to provide assistance to Member States to enhance the implementation and enforcement of IMO instruments. In 2016, the number of activities delivered increased slightly compared to the number delivered in 2015, although the total number of persons trained decreased slightly. Overall, however, the figures show consistency with previous years in terms of both total numbers and percentage of delivery.
23 In 2016, 237 activities were delivered out of a total of 299 activities programmed, for a delivery rate of 79%. An additional 15 activities were ongoing at the end of the year, which, when added to those completed by the end of the year, brings the total delivery to 252 out of 299, or 84%. Of the activities delivered in 2016, 18 were advisory and needs assessment missions, which was a decrease from 29 in 2015, while 118 were national and regional training courses, compared with 115 in 2015. Other activities including model legislation, review and updating of training packages, meetings of heads of maritime administrations, conferences and other specific aspects of technical assistance increased in 2016, with a total of 101 such events delivered, as compared to 91 similar activities carried out during 2015. This indicates an increase in the breadth of activities programmed under the Integrated Technical Cooperation Programme (ITCP).
24 A total of 72 fellows completed fellowships in the maritime field in 2016, one more than the 71 fellows recorded in 2015. The 2016 total includes 22 fellows who qualified through the IMO global maritime training institutions, WMU and IMLI, nearly double the 13 who did so in 2015. Additionally, some 2,900 individuals worldwide were trained through attendance at national and regional training workshops and seminars, compared with the 3,367 recorded in 2015. A further 1,124 senior officials attended events in 2016 aimed at developing and harmonizing regional strategies on maritime technical issues, an increase from the 1,079 recorded in 2015. This figure is in addition to the number of persons trained through the regular training courses listed above.
25 The breadth of activities delivered under the ITCP underscores the importance of the active engagement of the Secretariat in providing the assistance requested by Member States in support of the regulatory work of the Organization.
MEMBER STATE AUDITS
26 Audits under the IMO Member State Audit Scheme became mandatory from 1 January 2016, following the entry into force of amendments to the following treaties to commence the process: SOLAS 1974, including SOLAS PROT 1988; MARPOL Annexes I through to VI; STCW 1978; LL PROT 1988; and COLREG 1972.
27 The Scheme provides a mechanism for objective assessment of Member States in meeting their treaties’ obligations and for systematically feeding back any lessons learned from the audits into the regulatory and technical cooperation work of the Organization. Up to 25 audits per year are expected to be carried out under the Scheme, over the first audit cycle covering a period of seven years. During 2016, 19 audits were scheduled and all were successfully completed.
MONITORING OF OUTPUTS AND OUTCOMES
28 Work continued in 2016 on the development of a re-designed Strategic Plan with consideration of the trends, developments and challenges that the Organization is facing. This in turn led to the Council, at its 117th session, agreeing to seven new focused SDs, the first-ever Vision Statement for the Organization, as well as overarching principles that should be taken into account in all of the Organization’s work.
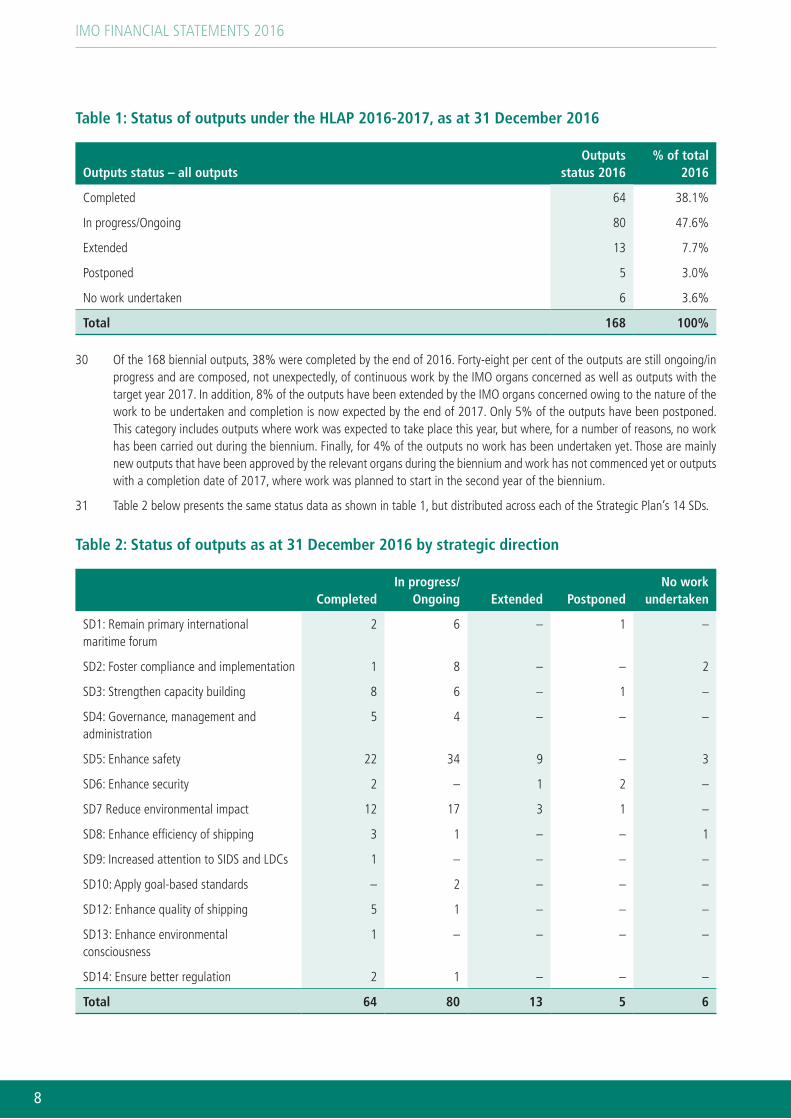
29 Table 1 below shows the status of delivery of the 168 outputs that were active under the HLAP for the 2016-2017 biennium. The HLAP adopted as Assembly resolution A.1098(29) consisted of 162 outputs. One output was deleted and two outputs were transferred to the post-biennial agenda for work to be carried out in future years. Further, nine new outputs were approved by the relevant IMO organs and endorsed by the Council during the biennium.
IMO FINANCIAL STATEMENTS 2016
8
Table 1: Status of outputs under the HLAP 2016-2017, as at 31 December 2016
Outputs status – all outputsOutputs
status 2016% of total
2016
Completed 64 38.1%
In progress/Ongoing 80 47.6%
Extended 13 7.7%
Postponed 5 3.0%
No work undertaken 6 3.6%
Total 168 100%
30 Of the 168 biennial outputs, 38% were completed by the end of 2016. Forty-eight per cent of the outputs are still ongoing/in progress and are composed, not unexpectedly, of continuous work by the IMO organs concerned as well as outputs with the target year 2017. In addition, 8% of the outputs have been extended by the IMO organs concerned owing to the nature of the work to be undertaken and completion is now expected by the end of 2017. Only 5% of the outputs have been postponed. This category includes outputs where work was expected to take place this year, but where, for a number of reasons, no work has been carried out during the biennium. Finally, for 4% of the outputs no work has been undertaken yet. Those are mainly new outputs that have been approved by the relevant organs during the biennium and work has not commenced yet or outputs with a completion date of 2017, where work was planned to start in the second year of the biennium.
31 Table 2 below presents the same status data as shown in table 1, but distributed across each of the Strategic Plan’s 14 SDs.
Table 2: Status of outputs as at 31 December 2016 by strategic direction
CompletedIn progress/
Ongoing Extended PostponedNo work
undertaken
SD1: Remain primary international maritime forum
2 6 – 1 –
SD2: Foster compliance and implementation 1 8 – – 2
SD3: Strengthen capacity building 8 6 – 1 –
SD4: Governance, management and administration
5 4 – – –
SD5: Enhance safety 22 34 9 – 3
SD6: Enhance security 2 – 1 2 –
SD7 Reduce environmental impact 12 17 3 1 –
SD8: Enhance efficiency of shipping 3 1 – – 1
SD9: Increased attention to SIDS and LDCs 1 – – – –
SD10: Apply goal-based standards – 2 – – –
SD12: Enhance quality of shipping 5 1 – – –
SD13: Enhance environmental consciousness
1 – – – –
SD14: Ensure better regulation 2 1 – – –
Total 64 80 13 5 6
IMO FINANCIAL STATEMENTS 2016
9
32 The foregoing analysis of service delivery complies with the guidance provided by IPSAS and resolution A.1099(29)1 for reporting on organizational performance at the level of the Organization’s strategic directions, high-level actions and biennial outputs. However, this reporting model reflects, in the main, the outcome of the work of IMO’s regulatory bodies, which results from technical and political consultation and debates between Member Governments and industry and civil society entities in consultative status.
MONITORING THE SECRETARIAT’S BUSINESS PLAN
33 The Secretariat’s Business Plan specifies the actions to achieve the divisional objectives for a two-year period and is aligned with the biennial budgeting cycle. Information on the status of delivery of the actions is provided by the Secretariat to the Council throughout the biennium in conjunction with the status of the HLAP.
34 The Business Plan includes service delivery by the Secretariat, mainly in connection with the support of the meeting programme of the Organization (i.e. technical meeting support, translation, documentation and conference services), but also in other areas (technical cooperation, legal services, financial, human resources, information and communication technology (ICT) and procurement services, collaboration with the UN System, protocol, liaison and representation services, etc.).
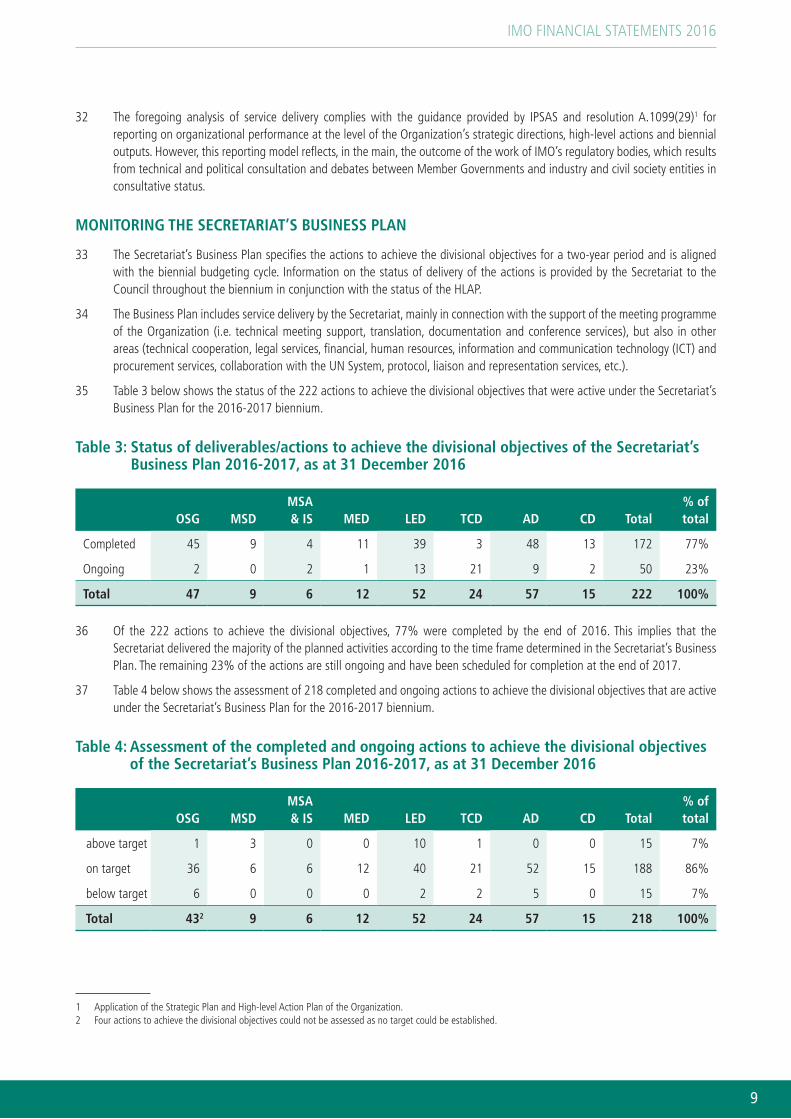
35 Table 3 below shows the status of the 222 actions to achieve the divisional objectives that were active under the Secretariat’s Business Plan for the 2016-2017 biennium.
Table 3: Status of deliverables/actions to achieve the divisional objectives of the Secretariat’s Business Plan 2016-2017, as at 31 December 2016
OSG MSDMSA & IS MED LED TCD AD CD Total
% of total
Completed 45 9 4 11 39 3 48 13 172 77%
Ongoing 2 0 2 1 13 21 9 2 50 23%
Total 47 9 6 12 52 24 57 15 222 100%
36 Of the 222 actions to achieve the divisional objectives, 77% were completed by the end of 2016. This implies that the Secretariat delivered the majority of the planned activities according to the time frame determined in the Secretariat’s Business Plan. The remaining 23% of the actions are still ongoing and have been scheduled for completion at the end of 2017.
37 Table 4 below shows the assessment of 218 completed and ongoing actions to achieve the divisional objectives that are active under the Secretariat’s Business Plan for the 2016-2017 biennium.
Table 4: Assessment of the completed and ongoing actions to achieve the divisional objectives of the Secretariat’s Business Plan 2016-2017, as at 31 December 2016
OSG MSDMSA & IS MED LED TCD AD CD Total
% of total
above target 1 3 0 0 10 1 0 0 15 7%
on target 36 6 6 12 40 21 52 15 188 86%
below target 6 0 0 0 2 2 5 0 15 7%
Total 432 9 6 12 52 24 57 15 218 100%
1 Application of the Strategic Plan and High-level Action Plan of the Organization.2 Four actions to achieve the divisional objectives could not be assessed as no target could be established.

IMO FINANCIAL STATEMENTS 2016
10
38 The delivery of 7% of all actions was assessed as above target, with reference to the target established at the beginning of the biennium. The delivery of 86% of the actions was assessed as on target and only 7% as below target. The main reason for actions being assessed as below target are human resource constraints and the prioritization of other work.
FINANCIAL RESOURCES
39 IMO’s activities are mainly funded by assessed contributions on its Member States and Associate Members. Voluntary contributions from Member States, governmental agencies, intergovernmental bodies and other public, private and non-governmental sources may financially support certain activities of the Organization, the finances of which may receive further support through commercial activities (including the sale of publications and catering and conference services) and through miscellaneous revenue (including interest on financial assets). Indirect support cost income, earned through third party agreements with donors, is also used to fund activities provided for in the regular budget.
GOVERNANCE AND MANAGEMENT
40 The Organization’s governance, through the Assembly and the Council, is defined in the IMO Convention. The key management personnel of IMO consists of the Secretary-General and seven Divisional/Departmental Directors. The key management personnel of WMU and IMLI consists of the President and Director, respectively. Related party disclosures in line with IPSAS requirements are accordingly included in the notes to the financial statements. The Council is responsible for providing intergovernmental support and specific policy direction to, and supervision of, the activities of IMO. In view of its State-membership composition, the Council is not considered a related party as defined by IPSAS.
IPSAS-COMPLIANT FINANCIAL STATEMENTS
41 Since 2010, the Organization has prepared annual financial statements compliant with IPSAS.
42 Several key financial definitions under IPSAS are presented below to enhance the usability and understanding of these financial statements:
1 Assets are resources controlled by IMO as a result of past events in which future economic benefits or service potentials are expected to flow to IMO.
2 Liabilities are present obligations arising from past events, the settlement of which is expected to result in an outflow of resources embodying economic benefits or service potential.
3 Net assets are the residual interest in the assets of IMO after deducting all its liabilities.
4 Revenue is the gross inflow of economic benefits or service potential during the reporting period when those inflows result in an increase in net assets.
5 Expenses are decreases in economic benefits or service potential during the reporting period in the form of outflows or consumption of assets or incurrence of liabilities that result in decreases in net assets.
6 Non-exchange transactions are those transactions for which IMO either receives from or gives value to another entity without directly giving or receiving approximately equal value in exchange.
7 Monetary items are units of currency held and assets and liabilities to be received or paid in fixed or determinable amounts.
8 Surplus for the period is the excess of all items of revenue over expense recognized in a period.
43 Under the accrual basis of accounting, revenues and expenses are recognized in the financial statements in the period to which they relate. IMO recognizes revenues upon written confirmation of contributions and expenses are recognized at the point at which an unavoidable liability is created, typically when goods or services are delivered. The excess of revenues over expenses results in a surplus which is carried forward to the accumulated fund balances. These fund balances represent the unexpended portion of contributions to be utilized in future operational requirements of the Organization.
IMO FINANCIAL STATEMENTS 2016
11
44 Under IPSAS, the matching principle of revenue and expense does not apply for non-exchange transactions. The focus of IPSAS is the financial position which is evidenced by the recognition of assets, when there is sufficient control, and of liabilities, when the criteria to recognize liabilities exist.
45 Outstanding commitments raised against accumulated fund balances do not meet the recognition criteria of expenses under the principle outlined above. These commitments, from a budgetary point of view, are addressed through the provisions of financial regulations 4.3 and 4.4, which allow the transfer of budgets for committed items into the following financial periods.
46 IMO participates in the United Nations Joint Staff Pension Fund (UNJSPF)3, which was established by the United Nations General Assembly to provide post-employment retirement, death, disability and related benefits to employees of the system. The UNJSPF is a funded multi-employer defined benefit plan.
47 The financial obligation of IMO to the UNJSPF comprises its mandated contribution at the rate established by the United Nations General Assembly, together with a share of any actuarial deficiency payments. The actuarial method adopted for the valuation of the UNJSPF is the Open Group Aggregate method carried out every two years. At the time of preparation of these financial statements, the most recent actuarial valuation completed was at 31 December 2015. The United Nations General Assembly has maintained over the years the general criteria that guide the investment of the assets of the UNJSPF.
48 The plan exposes participating organizations to actuarial risks associated with the current and former employees of other organizations, with the result that there is no consistent and reliable basis for allocating the obligation, plan assets and costs to individual organizations participating in the plan. As neither IMO nor the UNJSPF are in a position to identify IMO’s share of the underlying financial position and performance of the plan with sufficient reliability in line with IPSAS 25, IMO accounts for the plan as a defined contribution rather than as a defined benefit plan.
49 The attached financial statements and the accompanying notes are presented in pounds sterling (GBP) throughout, which allows for an overview of the Organization’s financial position in a single currency. Reporting to the Technical Cooperation Committee and individual donors at a more detailed level continues to be made in the most appropriate currency.
FINANCIAL RISK MANAGEMENT
50 At its 100th session in June 2008, the Council approved the Organization’s Risk Management Framework (RMF), consisting of a Risk Management Policy, Risk Management Definitions and a Risk Management Process. It requested the Secretariat to apply the RMF to the strategic directions and high-level actions falling under the Secretary-General’s responsibility as well as to the Secretariat-related key objectives for 2009. A similar exercise has been conducted periodically since that time, the results being reported to the Council and its Risk Review, Management and Reporting Working Group (CWGRM).
51 In addition to the RMF, IMO has an established framework of internal controls, including internal oversight, designed to maximize the effective and efficient use of its resources and safeguard its assets.
52 IMO’s activities expose it to a variety of financial risks, including the effects of fluctuations in currency exchange rates and interest rates and defaults by investment counterparties and debtors in meeting their obligations. In managing financial risks, IMO’s investment policy takes into account the unpredictability of financial markets and seeks to minimize, where feasible, any potential adverse effects on the Organization’s financial performance, the focus being on capital retention rather than maximizing revenue.
53 Financial risk management is carried out by Financial Services in compliance with a defined investment policy, which has been developed on the basis of advice received from an independent treasury consultant. The Organization’s treasury policy is approved by the Secretary-General and is reviewed and adjusted periodically, as necessary. Its implementation is the responsibility of a Treasury Committee, which meets monthly to consider cash-flow forecasts, treasury placements and the list of approved counterparties. Under the treasury policy, investment counterparties are assessed for their financial stability using three criteria – their credit ratings from the major ratings agencies, their tier 1 capital percentages and the price of Credit Default Swaps, with the maximum amount and duration of deposits with any single counterparty being tiered on the basis of this assessment.
3 www.UNJSPF.org
IMO FINANCIAL STATEMENTS 2016
12
54 IMO’s treasury policy requires a monthly assessment of liquidity to ensure that amounts invested still allow the maintenance of sufficient cash to meet the Organization’s commitments as and when they fall due. The majority of cash, cash equivalents and investments are available within one day’s notice to support operational requirements, although penalties would apply on short-term investments should a deviation from agreed arrangements become necessary.
55 As at 31 December 2016, 67% of cash, cash equivalents and short-term investments were denominated in the GBP base currency. Non-GBP holdings primarily relate to contributions made by donors in currencies other than GBP where any return of funds would be in the currency of the donation.
56 Consistent with the objectives of its treasury policy, the Organization does not trade in equities, nor does it use derivatives or hedging for speculative purposes or for any other reason. The primary objective in placing funds on deposit is capital protection.
FINANCIAL AND BUDGET PERFORMANCE HIGHLIGHTS
57 The net assets position presented in Statement I shows a healthy financial situation for the Organization as a whole, with a closing net assets position of £15,938,256 (2015: £20,206,174), although this represents a decrease of £4,267,918 (2015: an increase of £4,429,156) from the opening balance on 1 January 2016.
58 Looking, first, at the closing net assets position, it should be noted that, while the overall situation is strong, the reserves available to the Organization for future use are not without restrictions. Note 2.12 in the financial statements breaks down the overall reserve picture into the Organization’s major funds, and it may be seen that, of the overall £15,938,256 (2015: £20,206,174) closing balance, £13,240,200 (2015: £12,833,423) relates to Multi-donor Trust Funds or the net position under bilateral agreements with individual donors. Such funds can only be applied in accordance with the terms of reference of the Fund concerned or the appropriate contractual agreement with the donor, respectively; as such, there are significant restrictions over their future use. The Working Capital Fund, the Headquarters Capital Fund, the Training and Development Fund and the Technical Cooperation Fund are all in a relatively strong financial position at present – noting that much of the surplus on the Trading Fund will, in due course, be transferred to the Technical Cooperation Fund in accordance with Assembly resolution A.1063(28). The positive position in the General Fund largely reflects the fact that the Organization’s long-term After Service Health Insurance (ASHI) liability of £35,507,753 is shown under the Termination Benefit Fund in accordance with Assembly resolution A.991(25). While the Assembly set aside funds of £6,000,000 to meet these liabilities by means of resolution A.1100(29), effective 1 January 2016, the majority of these liabilities are currently unfunded and are reflected in the Termination Benefit Fund deficit as at 31 December 2016 of £29,920,650 (2015: £29,555,373).
59 The increase in cash and cash equivalents during 2016 reflects in part the operating surplus for 2016, and in particular an increase in the GBP value of the Organization’s holdings of US dollars (USD) of some £2,529,067, due to changes in foreign exchange rates between the two currencies during the year. The majority of the Organization’s USD holdings are in respect of Multi-donor Trust Funds and other donor funds, which are budgeted, managed and reported in USD rather than GBP and, consequently, movements in the GBP value of such funds typically do not directly impact on the ability to deliver planned activities. During 2016, the Organization has, however, increased its holdings of USD in the General Fund in order to mitigate the impact of significant exchange differences on those parts of the Regular Budget expenditure incurred in USD.
60 A further factor in the increase of cash and cash equivalents has been the reduction in contributions due from donors. At the end of 2015 the balance was unusually high, primarily as a result of the major project agreement to establish a network of regional maritime technology cooperation centres, funded by the European Commission for a total of €10,000,000 over four years (the first year’s contribution amounting to €2,404,547) and signed in December 2015. The contribution for 2016 under that project agreement was received in early January 2016. The collection rate for Member States’ assessments remains strong, at 98.9% (2015: 99.2%).
61 There has been a significant increase in the value of property, plant and equipment held by the Organization at 31 December 2016, to £2,007,253 (2015: £1,241,098). This is largely due to the completion of extensive work to replace the simultaneous interpretation systems (SIMS) in the main conference hall and two Committee Rooms in the Headquarters building. The value of the Organization’s intangible assets has also increased during 2016 to £977,428 (2015: £509,292), primarily as a result of ongoing work on enhancing IMO’s SAP reporting systems and the implementation of a new Skype for Business system.

IMO FINANCIAL STATEMENTS 2016
13
62 We continue to seek to carefully balance our obligations to suppliers with the need to effectively manage the Organization’s cash flow, and there has been little change in the overall balance of payables and accruals relating to exchange transactions. The most significant portion of the accruals balance relates to services provided by UNDP under the Service Clearing Account arrangement, but which have not yet been billed by UNDP through their monthly expenditure reporting. UNDP local offices worldwide provide IMO with a range and volume of services in the field which we would otherwise be unable to deliver in such an efficient manner, and are thereby key facilitators of the delivery of the Organization’s Integrated Technical Cooperation Programme (ITCP). There has been an increase in payables relating to non-exchange transactions, in large part as a result of Member States paying their 2017 assessment in advance.
63 The most significant increase in liability balances relates to the Organization’s employee benefit liabilities, which mainly reflect obligations to current staff and retirees for ASHI, repatriation benefits and accrued annual leave. Ordinarily these liabilities are subject to an actuarial valuation conducted every two years. However during 2016 the first phase of UN-wide changes in entitlements became effective through changes to IMO’s Staff Regulations and Staff Rules. This, along with significant changes in underlying market conditions, prompted an interim actuarial valuation to update assumptions and entitlement rules to ensure that the liability was appropriately valued at year end. This resulted in an increase in those liabilities subject to actuarial valuation to £41,094,497 (2015: £34,489,365), and an actuarial loss of £5,004,505. The primary cause of the actuarial loss was an update of assumptions to reflect current market conditions, and of these the greatest impact was from a reduction in the assumed discount rate and an increase in assumptions relating to inflation. A further cause of the increase in the liability was the fact that interest costs, which reflect the increase in the liability arising from being one year closer to settlement, and service costs, which reflect the increase in the liability as a result of services provided by current staff in the year, are in aggregate £1,600,627 higher than the amounts paid by the Organization during 2016 for the provision of ASHI services and other long-term benefit payments to current retirees. This imbalance between the amounts being paid on a “pay as you go” basis for current retirees and the actual costs to the Organization for current staff and retirees is likely to result in an increasing obligation in the future, and will continue to require careful monitoring and appropriate action, a matter considered by the Assembly in setting aside the £6,000,000 mentioned earlier.
64 Turning now to the operating performance for the year, which is shown in Statement II (Statement of Financial Performance) it should be noted that this financial performance of revenue and expenditure is presented on an IPSAS accrual basis and thus is different in its measurement and accounting from the budgetary performance statement of receipts and payments reflected in Statement Va (IMO Only Statement of Comparison of Budget and Actual Amounts), which is prepared on a modified cash/accrual basis. The differences between the two statements are reconciled in detail in Note 5 to the Financial Statements and Statement IV. For instance, the assessed contribution (i.e., invoiced amounts of £30,116,000) for the year is 100% accounted for as revenue in Statement II, whereas only receipted amounts (£29,914,107) are shown as Actual in Statement Va. Likewise, while expenditure in Statement II includes the amount of £789,208 for depreciation and amortization on an accrual basis, that amount, as it is not a cash payment during the year, is not included in Statement Va. The budgetary performance for 2016 under the modified cash basis shown in Statement Va shows a net deficit of £777,300 for the year, largely because of increases in payments, especially in regular budget strategic results, the Trading Fund, capital investment and technical cooperation.
65 The Assembly, by resolution A.1100(29), approved for 2016 both the budget income of £44,329,000 and the appropriation of £45,835,000 under the IMO budgetary Funds, which are presented as the original budget amounts in Statement Va. The final budget amount for income remained the same as original income budget and actual receipts amounted to £44,468,719, £139,719 over the final income budget. Slightly more than two thirds (67%, £29,914,107) of the total actual receipts were from assessment contributions for 2016 and any arrear years. The next largest (29%) income was from commercial trading, showing an increase of 5.5% (£670,720) to £12,968,932 from the outturn in 2015 of £12,298,212 and representing an excess of 2.7% (£343,932) over the income target set for 2016 of £12,625,000. The higher sales performance was ascribed to the planned marketing of various new editions including the IAMSAR Manual (3 volumes), the IMSBC Code and the IBC Code in addition to the release of the IMDG Code towards the end of the year, which provided an uplift to the sales in the final two months of 2016. In addition, catering function sales were also higher, driven by a number of additional functions in the final months of 2016. The support costs income was £1,410,096, representing 98% of the budget, which was realized from two main sources: £632,225 from the Trading Fund and £777,871 from various donor and trust Funds, other UN agencies and the Technical Cooperation Fund. Because Trading Fund expenditure was lower than planned, the related support cost represented 92% of the set budget, although project-related support costs were higher, primarily driven by the stronger USD exchange rate during the second half of 2016. The other miscellaneous income for 2016 amounted to £175,584, resulting in an excess of £25,584 compared with the estimate of £150,000 for 2016. The primary driver of this was the increase in subletting space and related income over prior years from the IOPC Funds.
IMO FINANCIAL STATEMENTS 2016
14
66 As the final accounts of WMU and IMLI were originally presented in Swedish krona (SEK) and euros, respectively, the consolidated income and expenditure statement (Statement Vb) expressed in pounds sterling was produced by using the annual average United Nations operational rates of exchange: £0.086 to a SEK and £0.817 to a Euro. The combined income (planned and received) of WMU and IMLI as at the end of December 2016 is separately presented under the heading of Education and Research as shown in Statement Vb (consolidated statement). Actual receipts under that heading amount to £11,577,147, which indicates that the two educational entities generated 10% above the target set in the final budget of £10,518,395 for 2016. This was driven by an accumulation of an increase over the budgeted revenue of 70% for Donations (partially driven by advance receipts) and Scholarships for IMLI and a 2% increase for WMU on the total receipts over the budgeted revenue.
67 In respect of expenditure amounts, the original budget for 2016 was £45,835,000 as shown in Statement Va, which includes the amounts approved by the Assembly in resolution A.1100(29) but not the current budgets for various donor/trust funds’ programmes. The final expenditure budget for 2016 shown in Statement Va of £48,329,524 included, in addition to the budgets brought forward from 2015 of £2,696,331 to meet mainly the 2015 unliquidated obligations (ULOs), in accordance with the delivery principle under IPSAS 1, and the funds for the completion of the replacement of the SIMS project as approved at the Council’s 113th session under the Headquarters Capital Fund. Actual expenditure in total amounted to £45,246,019. When measured against the final budget amounts budgetary savings were made in all IMO activities, a brief comment of which is provided in subsequent paragraphs.
68 Actual expenditure on regular budget Strategic Results in 2016 amounted to £30,618,803, representing an underspend of 6.5% (£2,146,808) of the corresponding final budget of £32,765,611. The majority of the savings related to staff costs resulting from a number of vacant post and longer than expected period in filling these vacant posts. In 2016, due to staff retirement, separation or transfer/recruitment to other posts, a total of 456.5 work-months (equivalent to 38 posts) were vacant, comprising 145 professional work-months (equivalent to 12 posts) and 311 General Service work-months (equivalent to 26 posts). It should also be noted that the savings in staff costs are due partly to the result of the Secretary-General’s review and reform initiative, which required the Secretariat to: critically assess the need for every vacant post; transfer or redeploy posts in line with changes and imbalances in workload within and across divisions; continue to call for secondees and Junior Professional Officers (JPOs) from Member States; strictly apply the policy on no contract extensions beyond normal retirement age; reclassify every post to its original grade or less when it is vacated by an incumbent with a personal promotion; and, where applicable, apportion to donor-financed projects the regular budget staff costs associated with their delivery. The use of temporary staff and existing staff to carry out the duties of the vacant post, either on a paid (for General Service Staff via overtime) or unpaid basis (for Professional Staff), ensured that the work of the IMO was maintained, with a marginal increase in the Other Personnel costs.
69 Another contribution to the underspend in the regular budget can be found in the reduced official mission travel, predominantly driven by the reduced number of Member State audits in 2016 (which are expected to increase to 25 in the coming year with follow-up audits). Additionally, combining this with maintaining the forward mission planning and video- and tele-conferencing resulted in savings of £175,638. Savings in general operating expenses resulted from the sharing of the building cost with IOPCF for four months of the year and reduced costs in communications through the shift to “paper smart” production of documents, including for online administrative processes using Microsoft SharePoint.
70 The variance between actual expenditure and the final budget for trading activities for 2016 was an underspend of £494,934 (8.3%), which is largely related to Staff Costs and Other Personnel savings of £251,656, with operating expenses forming the balance due to economies made both in the logistics operation and expendable supplies as well as in negotiations with external suppliers in the production of IMO publications. The underspend, together with the increase in trading income, resulted in a net surplus of £7,473,433 for 2016, which was 3% above the amount of the surplus achieved in 2015 of £7,256,604. It should be noted that actual payments in the budgetary accounting for trading activities shown in Statement Va include the printing cost of IMO publications and Model Courses, amounting in total to £1,094,253 for 2016 as recorded under the inventory account (Note 2.3) but, in the financial accounting shown in Statement II (Note 4.4), the expense recognized for the year is not the printing cost of the year but the historic cost of only the IMO publications and Model Courses which are sold, exchanged or distributed in the year in which the related revenue arises.
IMO FINANCIAL STATEMENTS 2016
15
71 Actual expenditure in 2016 under the Headquarters Capital Fund was £2,486,864, representing 97% of the final budget for the year. The comparatively high actual outturn, when compared with the original budget and expenditure outturn in 2015, was partly due to the completion of the SIMS project, which was rescheduled from 2015, totalling £1,133,792. In addition to this, the cost of unplanned building repairs, which included repairs to the air handling units and the building management system (expenditure in 2016 of £202,214), and the changes in SAP necessitated by the ICSC’s compensation package changes (expenditure in 2016 of £152,442).
72 The expenditure status of the Termination Benefit Fund, as at 31 December 2016, shows a budget execution rate of 99.6% (£1,015,235) against the final budget for the year. The actual outturn relates to: separation indemnity and repatriation costs associated with 12 staff members separated or retired from the Organization in 2016; costs of replacement by temporary assistance of staff members on long-term sick leave; and the medical insurance premiums borne by the Organization under the ASHI scheme in respect of retirees.
73 The Organization’s training and development programme expenditure outturn in 2016 totalled £87,029, representing 73.5% of the final budget. The underspend (£31,306) in this programme was due to the fact that, while human resource development and IT/IS proficiency training programmes were conducted through arrangements with commercial training providers, other needs, in particular for SAP financial management and control processes, have mostly been met through the use of in-house expertise.
74 The final budget for technical cooperation (TC) activities financed from the Technical Cooperation Fund comprised the originally approved appropriation for 2016 of £5,150,000 and the budget brought forward from 2015 of £760,199 to finance some postponed activities. The TC expenditure for 2016 amounted to £5,542,589, accounting for 94% of the final budget and an increase of £1,194,104 (27.5%) compared with the outturn in 2015. As the majority of the expenditure of the TC funds is in USD, when compared on a USD basis against 2015 the increase was only 9%, therefore the reason for the increased expenditure is predominantly the fall of GBP against the value of USD, which averaged around 20%.
75 As stated earlier, the final accounts of WMU and IMLI are presented in SEK and Euros, respectively, and thus the consolidation of their budgets and actual outturns into Statement Vb, under the heading of Education and research, is made using the annual average United Nations operational rates of exchange in 2016. The expenditure outturn of the two educational institutions amounted £9,531,911 for 2016, representing an increase of 20% on the previous year’s outturn of £7,938,834. The budget execution rate for 2016 was 98% of the consolidated final budget of £9,732,544.
SUSTAINABILITY
76 In considering the Organization’s financial sustainability, I have evaluated the consequences of any significant delays or defaults in payments from Member States or any reductions in contributions from donors in the context of the global economic and financial crisis, and whether it would lead to a consequential reduction in the scale of operations and/or the delivery of the Strategic Plan, the High-level Action Plan and the Divisional Business Objectives. Having considered IMO’s projected activities and the corresponding risks, I am confident that the Organization has adequate resources to continue to operate in the medium term. Based on this assumption, we will continue to apply the “going concern” basis in preparing IMO’s financial statements.
77 My assertion above is supported by: (i) the budget approved by the Assembly for the 2016-2017 biennium; (ii) the scope and content of the Strategic Plan prepared for the period 2016-2021; (iii) the net assets held at the end of the 2016 financial period, which result largely from the austerity and efficiency measures applied throughout the year; (iv) the high level of collections of the assessed contribution of over 95% for the past 10 years; and (v) the trend in donor support that has been sustaining IMO’s mandate, including delivery of technical cooperation work, as determined by the Council and Assembly.
IMO FINANCIAL STATEMENTS 2016
16
IMO INTO THE FUTURE
78 At IMO our mission is to promote safe, secure, environmentally sound, efficient and sustainable shipping, a mission we address in two ways: first, we develop and adopt a global regulatory regime for shipping that embraces the highest practicable standards of maritime safety and security, efficiency of navigation and prevention and control of pollution from ships; second, we back this up with an extensive programme of technical assistance and capacity building, to ensure that, once adopted, the standards can be implemented evenly and effectively.
79 It is this framework of IMO standards and regulations that enables shipping to operate safely, securely, cleanly and efficiently. The global nature of this framework means that it applies equally to all participants. It does not allow anyone to gain an advantage either by cutting corners or by imposing unilateral requirements. It creates a level playing field. And, perhaps most importantly, it ensures that ships have to comply with the same rules and technical standards wherever in the world they operate and regardless of which flag they fly. These are important principles. Everybody suffers if they are undermined, not just the shipping industry but the billions of people all over the world who depend on it.
80 Perhaps the fundamental challenge that shipping faces today is to remain sustainable while meeting the increasingly stringent demands of global society in terms of safety and environmental performance, and in this challenging global climate IMO too must respond effectively to what lies ahead, something which will require communication, engagement and initiative across a range of stakeholders. There are two important initiatives underway to provide a focus for our work into the future, and which will shape our response to those challenges.
81 First, an important strategic planning exercise is currently taking place within IMO. The Organization is developing a new Strategic Plan for the 2018-2023 period, based on an inclusive process. At the moment, there are seven strategic directions that have been agreed by the Council, identifying areas of priority and focus for that timeframe. Those strategic directions will set the stage for the Organization’s work for the six years commencing in 2018.
82 That process is rightly led by our Member States, facilitated by the Secretariat. As Secretary-General, one of my key roles is then to lead the second initiative – to develop strategies to support the decision-making process of the Member States, and to ensure that the Secretariat is well placed to support the implementation of the new Strategic Plan. In this respect, there are a number of important areas which, as I have indicated, are central to my leadership and which will drive the Secretariat’s work in the delivery of the Strategic Plan. They are:
• Implementation – For an IMO convention to be properly effective, it needs early entry into force, widespread ratification, effective implementation, stringent oversight of compliance and vigorous enforcement. Even those conventions that command almost universal coverage of the global fleet, such as SOLAS and MARPOL, only have teeth if they are backed up by an effective implementation infrastructure at the national level. Through our Member State Audit Scheme we can now monitor the effectiveness of global implementation, and our challenge is to use this information to further the goal of uniform implementation of IMO standards.
We have a strong mandate to help our Member States and the industry to ensure that the regulatory framework and its provisions are effectively and uniformly implemented. And, by so doing, IMO helps ensure that the ability to participate effectively in maritime activities is not just confined to the traditional shipping countries that can tap into rich seams of maritime experience and expertise. In this, I see a much wider benefit that gives IMO a broader significance than ever before – something that is very important for us, as an agency of the United Nations. In this respect, the Organization’s contribution to the attainment of the Sustainable Development Goals of the 2030 Agenda for Sustainable Development will remain a priority.
• Communication – The need for genuinely connected thinking and planning across all aspects of the transportation chain is vital, not just for the efficiency of the supply chain itself, but also to ensure that wider issues such as sustainability, environmental protection and the fair and equitable use of the oceans are fully embraced and properly considered. In this regard I have augmented my engagement with all stakeholders to enhance the general understanding and appreciation, among a far wider constituency, of the vital role played by shipping within the whole global supply chain. This is the very essence of the global economy and something on which we all depend.

IMO FINANCIAL STATEMENTS 2016
17
• Data management – I have commenced a thorough review of our primary data acquisition and distribution platform – the Global Integrated Shipping Information System (GISIS) – with a view to improving connectivity of data elements and to developing an innovative platform that will provide data analysis possibilities, which in turn will feed in to both the regulatory work of the Organization, ensuring that there is a solid evidence-based approach to regulation, and to identifying and targeting gaps in implementation which can then be addressed.
83 My vision for the Organization is one of strengthened partnerships – between developing and developed countries, between governments and industry, between IMO Member States and regions. I have commenced the strengthening of communication between the maritime industry and the general public. I see IMO acting as a bridge between all these stakeholders in what I have referred to as “a voyage together”. Collaboration within and across different sectors to address impacts and ensure a joint approach is vital. An integrated approach, with a long-term focus – an approach that responds to the world’s resource, climate and environmental challenges – is essential. As a maritime community, we need to ensure that growth is coordinated and planned, with input from all relevant stakeholders, and that opportunities for synergy are identified and taken.
84 I am particularly keen, this year, to highlight the importance of “joined-up” maritime development across all sectors and how this can reap great benefits in terms of development, especially in the context of the global Sustainable Development Goals. With this in mind, our theme for this year’s World Maritime Day is “connecting ships, ports and people” and we will be using it as an opportunity to highlight the value of integration in the maritime and logistics sectors – both from a policy and a practical perspective. IMO’s role as the global regulator of the shipping industry can enhance this integration as consistent, uniform regulation facilitates the free flow of commerce.
85 Finding consensus on these and other issues, through a process of discussion among all stakeholders, is one of the great strengths of IMO. The various efforts and initiatives under way at IMO in these areas will benefit people all over the world and help ensure that shipping can play its part in delivering the sustainable development that is essential to our future.
RESPONSIBILITY
86 As required under financial regulation 12.10, I am pleased to submit the annexed financial statements, along with my Statement on Internal Control for the financial period 2016, which does not form a part of the financial statements. I certify that, to the best of my knowledge and information, all transactions during the reporting period have been properly entered in the accounting records of the Organization and that these transactions, together with the financial statements and notes, details of which form part of this document, fairly present the financial position of IMO as at 31 December 2016.
Statement on Internal Control
Statement I – Statement of Financial Position as at 31 December 2016
Statement II – Statement of Financial Performance for the year ended 31 December 2016
Statement III – Statement of Changes in Net Assets for the year ended 31 December 2016
Statement IV – Statement of Cash Flow for the year ended 31 December 2016
Statement V – Statement of Comparison of Budget and Actual Amounts for the year ended 31 December 2016
Notes to the Financial Statements
Kitack Lim Secretary-General London, 27 April 2017
IMO FINANCIAL STATEMENTS 2016
18
Statement on Internal Control for the financial period 2016
SCOPE OF RESPONSIBILITY
1 As Secretary-General of the International Maritime Organization (IMO) I am accountable, in accordance with the responsibilities assigned to me in Article X of the Financial Regulations, for establishing financial rules and procedures to ensure effective financial administration and the exercise of economy, and for maintaining internal financial control.
PURPOSE OF THE SYSTEM OF INTERNAL CONTROL
2 The system of internal control is designed to reduce and manage rather than eliminate the risk of failure to achieve the Organization’s policies, aims and objectives. Therefore it can only provide a reasonable and not absolute assurance of effectiveness. It is based on an ongoing process designed to identify the principal risks, to evaluate the nature and extent of those risks and to manage them efficiently, effectively and economically. Internal control is a process effected by the Council, the Secretary-General, senior management and other members of the Secretariat, and designed to provide reasonable assurance on the achievement of the following internal control objectives:
• The regularity of the receipt, custody, and disposal of all funds and other financial resources of the Organization;
• The conformity of obligations and expenditures with the appropriations or other financial provision voted by the Assembly, or with the purposes and rules relating to trust and other special funds; and
• The economic use of the resources of the Organization.
3 Thus, on an operational level, IMO’s internal control system is not solely a policy or procedure that is performed at certain points in time, but rather continually operated at all levels within the Organization through internal control processes to ensure the above objectives.
4 My current statement on IMO’s internal control processes, as described above, applies for the year ended 31 December 2016, and up to the date of the approval of the Organization’s 2016 financial statements.
RISK MANAGEMENT AND INTERNAL CONTROL
5 The Organization operates a Risk Management Framework, developed and approved by the Council, under which I am required to conduct an annual risk assessment exercise to identify and analyse risks to the delivery of those aspects of the Strategic Plan and High-level Action Plan which are the responsibility of the Secretariat, and to develop and implement mitigation plans where those risks are considered to be unacceptably high. While there is an annual exercise of risk assessment and evaluation, the application of the principles of risk management and the mitigation of risk to the extent practically possible is an ongoing process. The outcome of both the annual risk review exercise and the ongoing monitoring of risk inform my assessment of the effectiveness of the established system of internal control.

IMO FINANCIAL STATEMENTS 2016
19
REVIEW OF EFFECTIVENESS
6 My review of the effectiveness of the system of internal control is also informed by:
• My senior managers, each of whom has a role to play in the system of internal control and has been assigned specific delegations within the framework provided by the Financial Regulations and Financial Rules, Procurement Manual and Budget Manual. Each staff member assigned such delegated responsibility has provided me with an individual attestation on internal control for the year ended 31 December 2016 which acknowledges the scope of their responsibility, reports any significant weaknesses identified in internal controls along with steps being taken to address them, and confirms that internal controls are operating effectively within their area of responsibility;
• The work of the Internal Oversight and Ethics Office (IOEO), which has a dual function, both as internal oversight to provide me with reports on internal audits conducted during the year to provide independent and objective information on the adequacy and effectiveness of the Organization’s system of internal controls, and as the ethics office to provide confidential advice and counsel to the Organization and its staff on ethics and standards of conduct, promote ethical awareness and responsible behaviour and handle referrals of allegations of unethical behaviours or conflicts of interest;
• The External Auditor, the Auditor General of Ghana, who provides me with a management letter identifying any issues of control identified during the course of their annual audit and provides the Council and Assembly with an opinion on the accuracy of the Organization’s financial statements; and
• The Council and, specifically, its Council Working Group on Risk Management, which reviews the outcomes of the annual risk assessment exercise and identifies any action which it believes is necessary to address the findings thereof.
7 For the year 2016 there have been no significant issues in the operation of internal controls.
CONCLUSION
8 Effective internal control, no matter how well designed, has inherent limitations – including the possibility of circumvention – and therefore can only provide reasonable assurance. Furthermore, because of changes in conditions, the effectiveness of internal control may vary over time. In recognizing this, however, I conclude that, to the best of my knowledge and information, the IMO Secretariat had an effective system of internal control for the year ended 31 December 2016, and up to the date of the approval of the financial statements for that year.
Kitack Lim Secretary-General London, 27 April 2017
IMO FINANCIAL STATEMENTS 2016
20
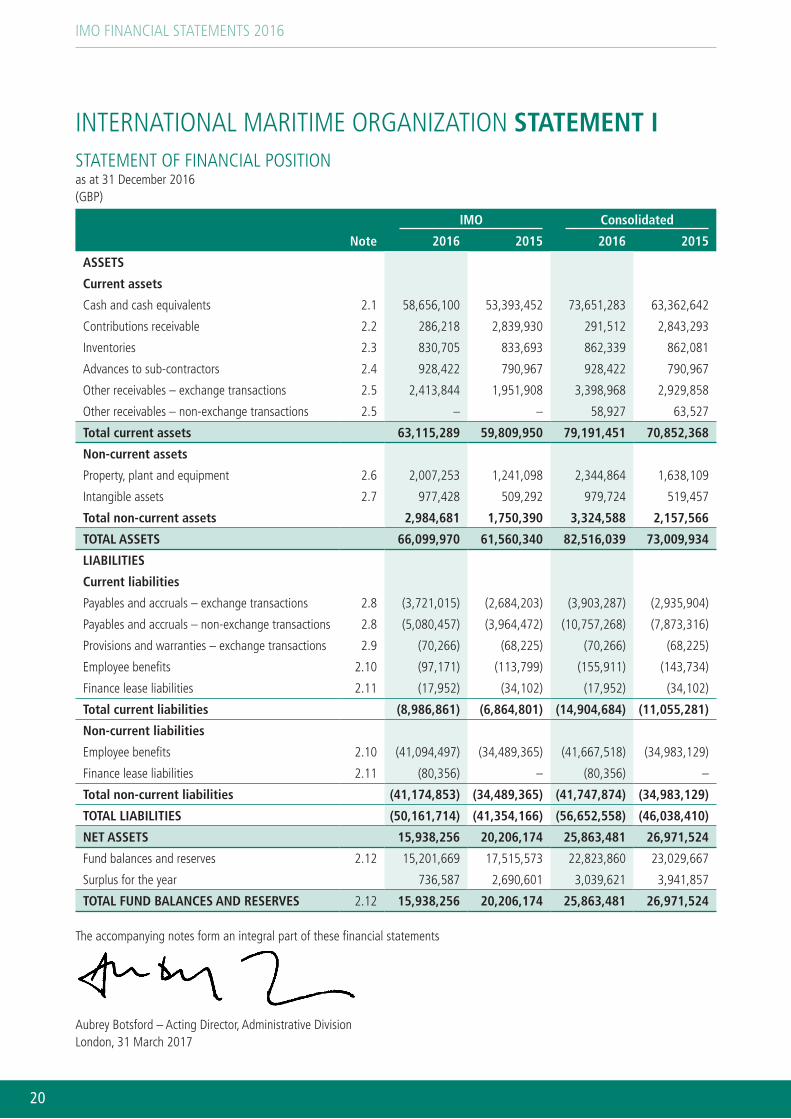
INTERNATIONAL MARITIME ORGANIZATION STATEMENT ISTATEMENT OF FINANCIAL POSITIONas at 31 December 2016 (GBP)
IMO Consolidated
Note 2016 2015 2016 2015
ASSETS
Current assets
Cash and cash equivalents 2.1 58,656,100 53,393,452 73,651,283 63,362,642
Contributions receivable 2.2 286,218 2,839,930 291,512 2,843,293
Inventories 2.3 830,705 833,693 862,339 862,081
Advances to sub-contractors 2.4 928,422 790,967 928,422 790,967
Other receivables – exchange transactions 2.5 2,413,844 1,951,908 3,398,968 2,929,858
Other receivables – non-exchange transactions 2.5 – – 58,927 63,527
Total current assets 63,115,289 59,809,950 79,191,451 70,852,368
Non-current assets
Property, plant and equipment 2.6 2,007,253 1,241,098 2,344,864 1,638,109
Intangible assets 2.7 977,428 509,292 979,724 519,457
Total non-current assets 2,984,681 1,750,390 3,324,588 2,157,566
TOTAL ASSETS 66,099,970 61,560,340 82,516,039 73,009,934
LIABILITIES
Current liabilities
Payables and accruals – exchange transactions 2.8 (3,721,015) (2,684,203) (3,903,287) (2,935,904)
Payables and accruals – non-exchange transactions 2.8 (5,080,457) (3,964,472) (10,757,268) (7,873,316)
Provisions and warranties – exchange transactions 2.9 (70,266) (68,225) (70,266) (68,225)
Employee benefits 2.10 (97,171) (113,799) (155,911) (143,734)
Finance lease liabilities 2.11 (17,952) (34,102) (17,952) (34,102)
Total current liabilities (8,986,861) (6,864,801) (14,904,684) (11,055,281)
Non-current liabilities
Employee benefits 2.10 (41,094,497) (34,489,365) (41,667,518) (34,983,129)
Finance lease liabilities 2.11 (80,356) – (80,356) –
Total non-current liabilities (41,174,853) (34,489,365) (41,747,874) (34,983,129)
TOTAL LIABILITIES (50,161,714) (41,354,166) (56,652,558) (46,038,410)
NET ASSETS 15,938,256 20,206,174 25,863,481 26,971,524
Fund balances and reserves 2.12 15,201,669 17,515,573 22,823,860 23,029,667
Surplus for the year 736,587 2,690,601 3,039,621 3,941,857
TOTAL FUND BALANCES AND RESERVES 2.12 15,938,256 20,206,174 25,863,481 26,971,524
The accompanying notes form an integral part of these financial statements
Aubrey Botsford – Acting Director, Administrative Division London, 31 March 2017
IMO FINANCIAL STATEMENTS 2016
21
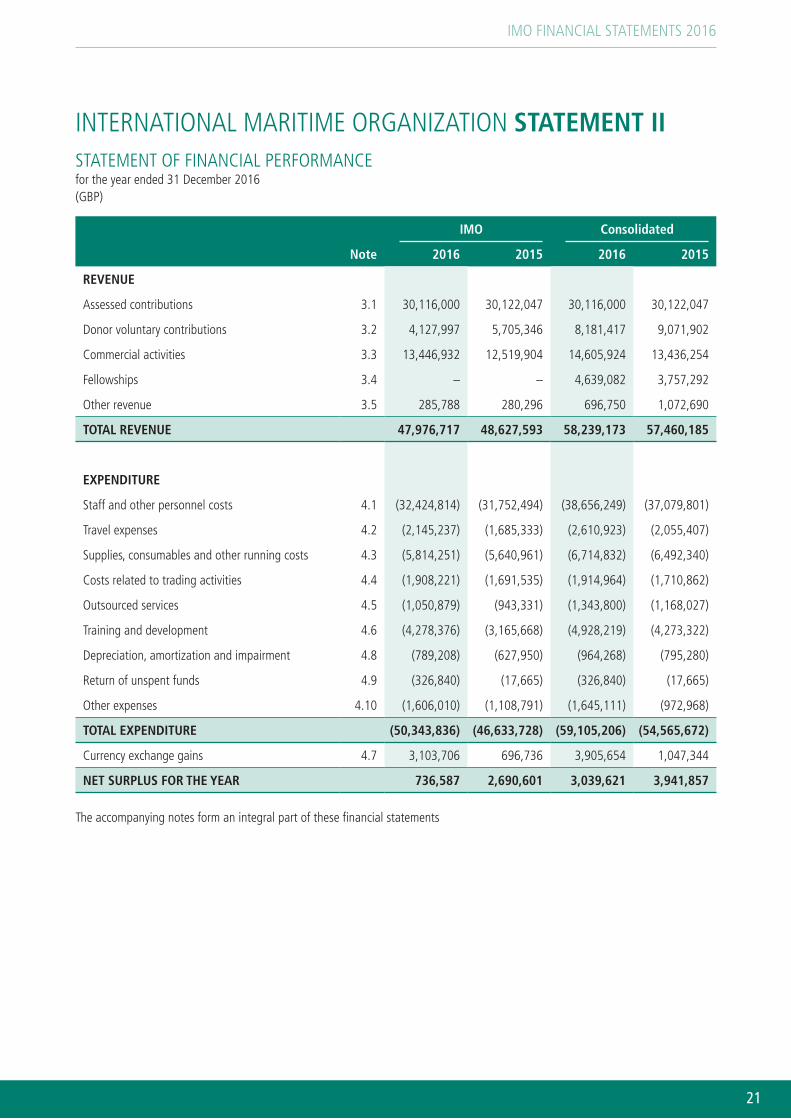
INTERNATIONAL MARITIME ORGANIZATION STATEMENT IISTATEMENT OF FINANCIAL PERFORMANCEfor the year ended 31 December 2016 (GBP)
IMO Consolidated
Note 2016 2015 2016 2015
REVENUE
Assessed contributions 3.1 30,116,000 30,122,047 30,116,000 30,122,047
Donor voluntary contributions 3.2 4,127,997 5,705,346 8,181,417 9,071,902
Commercial activities 3.3 13,446,932 12,519,904 14,605,924 13,436,254
Fellowships 3.4 – – 4,639,082 3,757,292
Other revenue 3.5 285,788 280,296 696,750 1,072,690
TOTAL REVENUE 47,976,717 48,627,593 58,239,173 57,460,185
EXPENDITURE
Staff and other personnel costs 4.1 (32,424,814) (31,752,494) (38,656,249) (37,079,801)
Travel expenses 4.2 (2,145,237) (1,685,333) (2,610,923) (2,055,407)
Supplies, consumables and other running costs 4.3 (5,814,251) (5,640,961) (6,714,832) (6,492,340)
Costs related to trading activities 4.4 (1,908,221) (1,691,535) (1,914,964) (1,710,862)
Outsourced services 4.5 (1,050,879) (943,331) (1,343,800) (1,168,027)
Training and development 4.6 (4,278,376) (3,165,668) (4,928,219) (4,273,322)
Depreciation, amortization and impairment 4.8 (789,208) (627,950) (964,268) (795,280)
Return of unspent funds 4.9 (326,840) (17,665) (326,840) (17,665)
Other expenses 4.10 (1,606,010) (1,108,791) (1,645,111) (972,968)
TOTAL EXPENDITURE (50,343,836) (46,633,728) (59,105,206) (54,565,672)
Currency exchange gains 4.7 3,103,706 696,736 3,905,654 1,047,344
NET SURPLUS FOR THE YEAR 736,587 2,690,601 3,039,621 3,941,857
The accompanying notes form an integral part of these financial statements
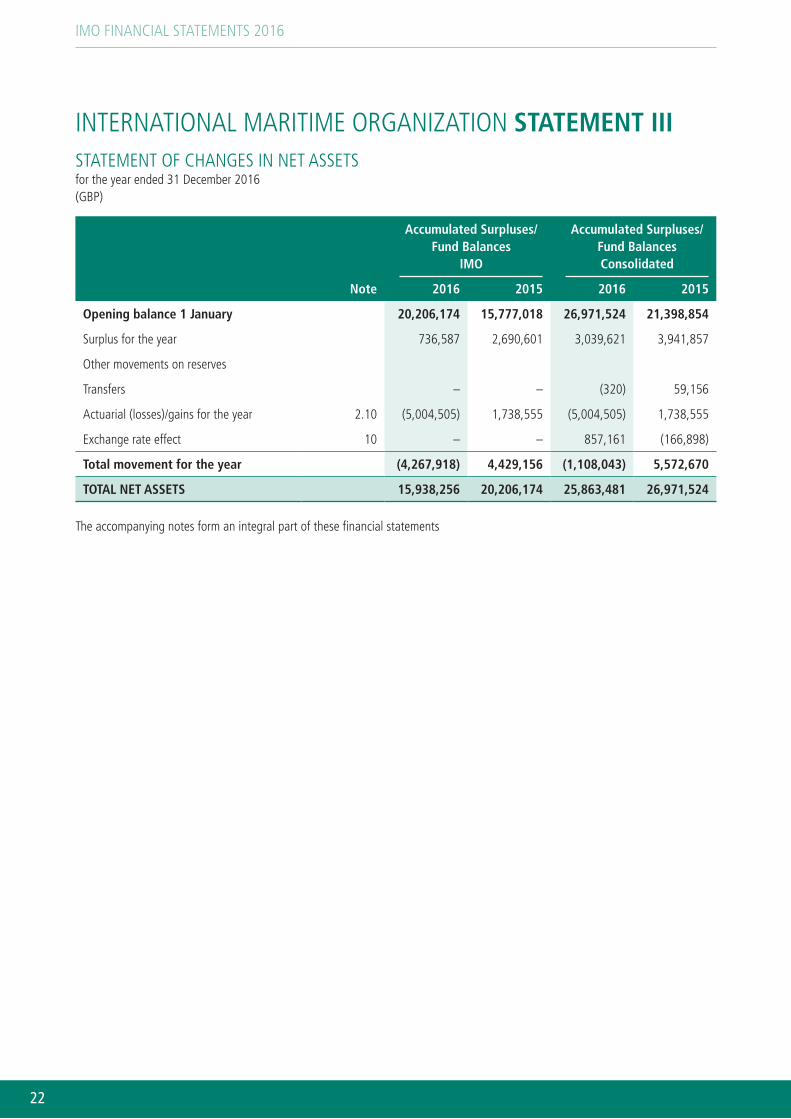
IMO FINANCIAL STATEMENTS 2016
22
INTERNATIONAL MARITIME ORGANIZATION STATEMENT IIISTATEMENT OF CHANGES IN NET ASSETSfor the year ended 31 December 2016 (GBP)
Accumulated Surpluses/ Fund Balances
IMO
Accumulated Surpluses/ Fund Balances Consolidated
Note 2016 2015 2016 2015
Opening balance 1 January 20,206,174 15,777,018 26,971,524 21,398,854
Surplus for the year 736,587 2,690,601 3,039,621 3,941,857
Other movements on reserves
Transfers – – (320) 59,156
Actuarial (losses)/gains for the year 2.10 (5,004,505) 1,738,555 (5,004,505) 1,738,555
Exchange rate effect 10 – – 857,161 (166,898)
Total movement for the year (4,267,918) 4,429,156 (1,108,043) 5,572,670
TOTAL NET ASSETS 15,938,256 20,206,174 25,863,481 26,971,524
The accompanying notes form an integral part of these financial statements
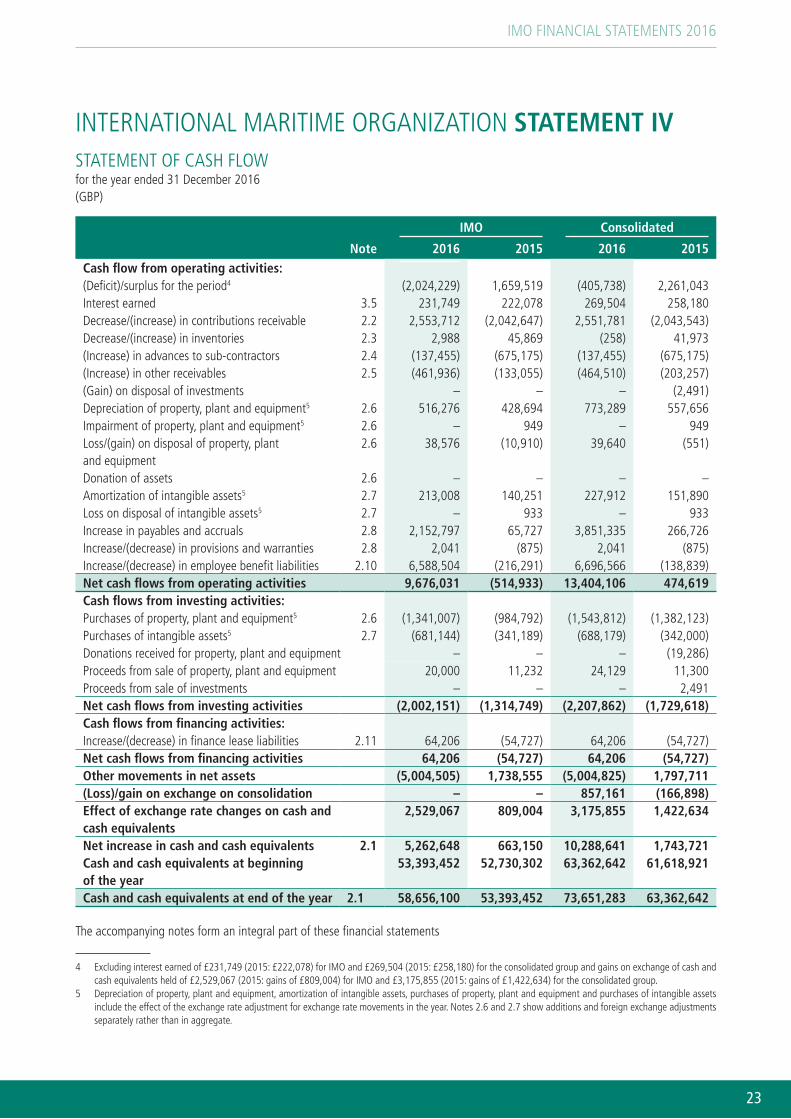
IMO FINANCIAL STATEMENTS 2016
23
INTERNATIONAL MARITIME ORGANIZATION STATEMENT IVSTATEMENT OF CASH FLOWfor the year ended 31 December 2016 (GBP)
IMO Consolidated
Note 2016 2015 2016 2015Cash flow from operating activities: (Deficit)/surplus for the period4 (2,024,229) 1,659,519 (405,738) 2,261,043Interest earned 3.5 231,749 222,078 269,504 258,180Decrease/(increase) in contributions receivable 2.2 2,553,712 (2,042,647) 2,551,781 (2,043,543)Decrease/(increase) in inventories 2.3 2,988 45,869 (258) 41,973(Increase) in advances to sub-contractors 2.4 (137,455) (675,175) (137,455) (675,175)(Increase) in other receivables 2.5 (461,936) (133,055) (464,510) (203,257)(Gain) on disposal of investments – – – (2,491)Depreciation of property, plant and equipment5 2.6 516,276 428,694 773,289 557,656Impairment of property, plant and equipment5 2.6 – 949 – 949Loss/(gain) on disposal of property, plant and equipment
2.6 38,576 (10,910) 39,640 (551)
Donation of assets 2.6 – – – –Amortization of intangible assets5 2.7 213,008 140,251 227,912 151,890Loss on disposal of intangible assets5 2.7 – 933 – 933Increase in payables and accruals 2.8 2,152,797 65,727 3,851,335 266,726Increase/(decrease) in provisions and warranties 2.8 2,041 (875) 2,041 (875)Increase/(decrease) in employee benefit liabilities 2.10 6,588,504 (216,291) 6,696,566 (138,839)Net cash flows from operating activities 9,676,031 (514,933) 13,404,106 474,619Cash flows from investing activities: Purchases of property, plant and equipment5 2.6 (1,341,007) (984,792) (1,543,812) (1,382,123)Purchases of intangible assets5 2.7 (681,144) (341,189) (688,179) (342,000)Donations received for property, plant and equipment – – – (19,286)Proceeds from sale of property, plant and equipment 20,000 11,232 24,129 11,300Proceeds from sale of investments – – – 2,491Net cash flows from investing activities (2,002,151) (1,314,749) (2,207,862) (1,729,618)Cash flows from financing activities: Increase/(decrease) in finance lease liabilities 2.11 64,206 (54,727) 64,206 (54,727)Net cash flows from financing activities 64,206 (54,727) 64,206 (54,727)Other movements in net assets (5,004,505) 1,738,555 (5,004,825) 1,797,711(Loss)/gain on exchange on consolidation – – 857,161 (166,898)Effect of exchange rate changes on cash and cash equivalents
2,529,067 809,004 3,175,855 1,422,634
Net increase in cash and cash equivalents 2.1 5,262,648 663,150 10,288,641 1,743,721Cash and cash equivalents at beginning of the year
53,393,452 52,730,302 63,362,642 61,618,921
Cash and cash equivalents at end of the year 2.1 58,656,100 53,393,452 73,651,283 63,362,642
The accompanying notes form an integral part of these financial statements
4 Excluding interest earned of £231,749 (2015: £222,078) for IMO and £269,504 (2015: £258,180) for the consolidated group and gains on exchange of cash and cash equivalents held of £2,529,067 (2015: gains of £809,004) for IMO and £3,175,855 (2015: gains of £1,422,634) for the consolidated group.
5 Depreciation of property, plant and equipment, amortization of intangible assets, purchases of property, plant and equipment and purchases of intangible assets include the effect of the exchange rate adjustment for exchange rate movements in the year. Notes 2.6 and 2.7 show additions and foreign exchange adjustments separately rather than in aggregate.
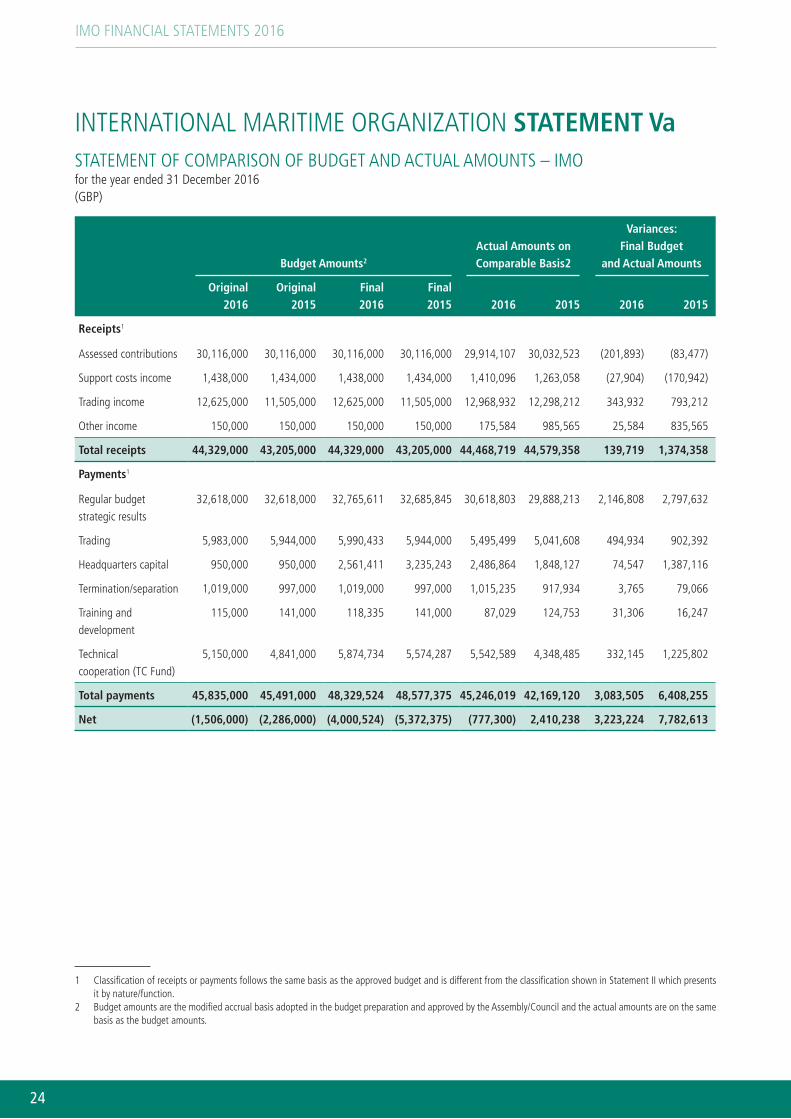
IMO FINANCIAL STATEMENTS 2016
24
INTERNATIONAL MARITIME ORGANIZATION STATEMENT VaSTATEMENT OF COMPARISON OF BUDGET AND ACTUAL AMOUNTS – IMOfor the year ended 31 December 2016 (GBP)
Budget Amounts2
Actual Amounts on Comparable Basis2
Variances: Final Budget
and Actual Amounts
Original 2016
Original 2015
Final 2016
Final 2015 2016 2015 2016 2015
Receipts1
Assessed contributions 30,116,000 30,116,000 30,116,000 30,116,000 29,914,107 30,032,523 (201,893) (83,477)
Support costs income 1,438,000 1,434,000 1,438,000 1,434,000 1,410,096 1,263,058 (27,904) (170,942)
Trading income 12,625,000 11,505,000 12,625,000 11,505,000 12,968,932 12,298,212 343,932 793,212
Other income 150,000 150,000 150,000 150,000 175,584 985,565 25,584 835,565
Total receipts 44,329,000 43,205,000 44,329,000 43,205,000 44,468,719 44,579,358 139,719 1,374,358
Payments1
Regular budget strategic results
32,618,000 32,618,000 32,765,611 32,685,845 30,618,803 29,888,213 2,146,808 2,797,632
Trading 5,983,000 5,944,000 5,990,433 5,944,000 5,495,499 5,041,608 494,934 902,392
Headquarters capital 950,000 950,000 2,561,411 3,235,243 2,486,864 1,848,127 74,547 1,387,116
Termination/separation 1,019,000 997,000 1,019,000 997,000 1,015,235 917,934 3,765 79,066
Training and development
115,000 141,000 118,335 141,000 87,029 124,753 31,306 16,247
Technical cooperation (TC Fund)
5,150,000 4,841,000 5,874,734 5,574,287 5,542,589 4,348,485 332,145 1,225,802
Total payments 45,835,000 45,491,000 48,329,524 48,577,375 45,246,019 42,169,120 3,083,505 6,408,255
Net (1,506,000) (2,286,000) (4,000,524) (5,372,375) (777,300) 2,410,238 3,223,224 7,782,613
1 Classification of receipts or payments follows the same basis as the approved budget and is different from the classification shown in Statement II which presents it by nature/function.
2 Budget amounts are the modified accrual basis adopted in the budget preparation and approved by the Assembly/Council and the actual amounts are on the same basis as the budget amounts.
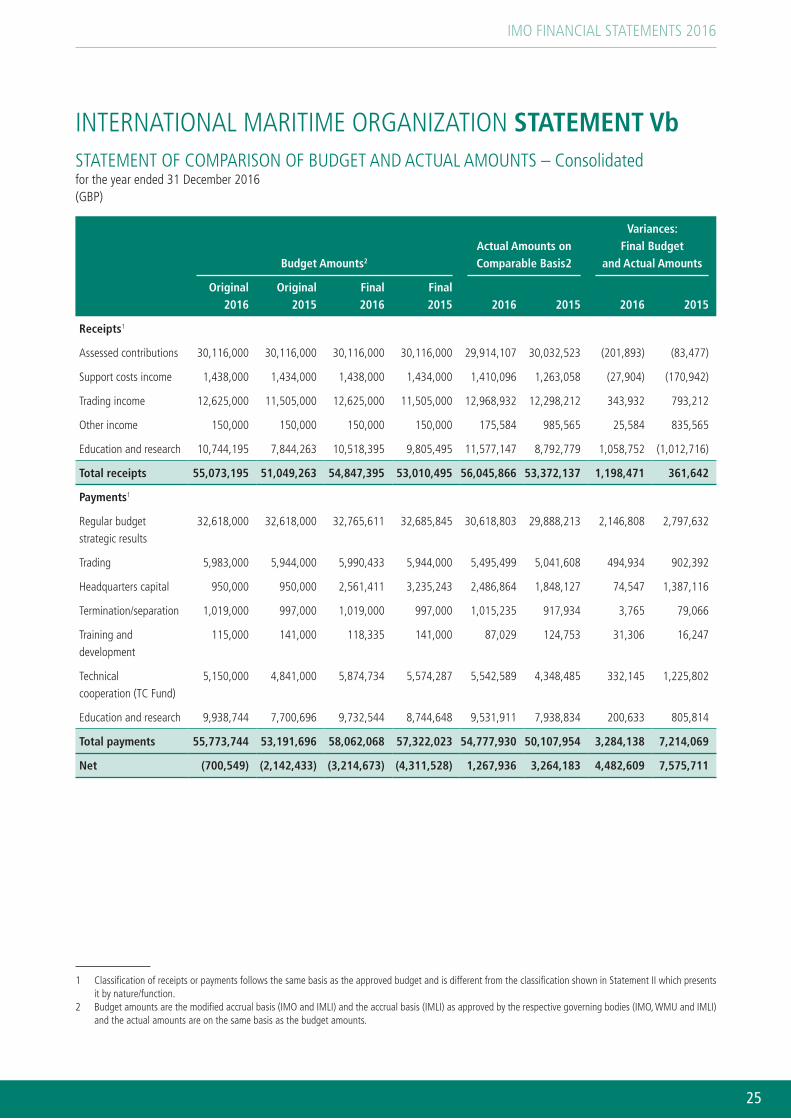
IMO FINANCIAL STATEMENTS 2016
25
INTERNATIONAL MARITIME ORGANIZATION STATEMENT VbSTATEMENT OF COMPARISON OF BUDGET AND ACTUAL AMOUNTS – Consolidatedfor the year ended 31 December 2016(GBP)
Budget Amounts2
Actual Amounts on Comparable Basis2
Variances: Final Budget
and Actual Amounts
Original 2016
Original 2015
Final 2016
Final 2015 2016 2015 2016 2015
Receipts1
Assessed contributions 30,116,000 30,116,000 30,116,000 30,116,000 29,914,107 30,032,523 (201,893) (83,477)
Support costs income 1,438,000 1,434,000 1,438,000 1,434,000 1,410,096 1,263,058 (27,904) (170,942)
Trading income 12,625,000 11,505,000 12,625,000 11,505,000 12,968,932 12,298,212 343,932 793,212
Other income 150,000 150,000 150,000 150,000 175,584 985,565 25,584 835,565
Education and research 10,744,195 7,844,263 10,518,395 9,805,495 11,577,147 8,792,779 1,058,752 (1,012,716)
Total receipts 55,073,195 51,049,263 54,847,395 53,010,495 56,045,866 53,372,137 1,198,471 361,642
Payments1
Regular budget strategic results
32,618,000 32,618,000 32,765,611 32,685,845 30,618,803 29,888,213 2,146,808 2,797,632
Trading 5,983,000 5,944,000 5,990,433 5,944,000 5,495,499 5,041,608 494,934 902,392
Headquarters capital 950,000 950,000 2,561,411 3,235,243 2,486,864 1,848,127 74,547 1,387,116
Termination/separation 1,019,000 997,000 1,019,000 997,000 1,015,235 917,934 3,765 79,066
Training and development
115,000 141,000 118,335 141,000 87,029 124,753 31,306 16,247
Technical cooperation (TC Fund)
5,150,000 4,841,000 5,874,734 5,574,287 5,542,589 4,348,485 332,145 1,225,802
Education and research 9,938,744 7,700,696 9,732,544 8,744,648 9,531,911 7,938,834 200,633 805,814
Total payments 55,773,744 53,191,696 58,062,068 57,322,023 54,777,930 50,107,954 3,284,138 7,214,069
Net (700,549) (2,142,433) (3,214,673) (4,311,528) 1,267,936 3,264,183 4,482,609 7,575,711
1 Classification of receipts or payments follows the same basis as the approved budget and is different from the classification shown in Statement II which presents it by nature/function.
2 Budget amounts are the modified accrual basis (IMO and IMLI) and the accrual basis (IMLI) as approved by the respective governing bodies (IMO, WMU and IMLI) and the actual amounts are on the same basis as the budget amounts.
IMO FINANCIAL STATEMENTS 2016
26
NOTES TO THE FINANCIAL STATEMENTS AS AT 31 DECEMBER 2016NOTE 1: ACCOUNTING POLICIES
BASIS OF PREPARATION
1 The financial statements of the International Maritime Organization (IMO) have been prepared on the accrual basis of accounting in accordance with the International Public Sector Accounting Standards (IPSAS) using the historic cost convention. The appropriate International Financial Reporting Standard (IFRS) has been applied where an IPSAS does not address a particular issue. No Standards have been adopted prior to their required implementation date, and no transitional provisions are in operation.
2 The Cash Flow Statement is prepared using the indirect method.
3 Within the meaning of IPSAS 6 – “Consolidated and Separate Financial Statements” the Organization is a controlling entity with two controlled entities, the World Maritime University (WMU) and the IMO International Maritime Law Institute (IMLI) based in Sweden and Malta, respectively. Neither WMU nor IMLI has equity and the Organization’s control is not by means of shareholding; however, their Charter and Statute, respectively, provide for the “power” and “benefit” criteria necessary for establishing control under IPSAS 6, the key factors being:
• the Secretary-General’s ability to appoint key staff, both management and academic, and also to appoint the respective governing boards;
• the alignment of the objectives of WMU and IMLI with the goals of IMO through the Charter and the Statute, respectively; and
• the requirement for changes to the Charter and Statute to be approved by IMO organs.
4 Consolidated statements have therefore been prepared and are shown alongside those of IMO alone for ease of reference.
5 The functional and reporting currency of IMO is GBP. Transactions in currencies other than GBP are converted into GBP at the prevailing United Nations Operational Rates of Exchange (UNORE) at the time of transaction. Assets and liabilities held at the year-end in currencies other than GBP are converted into GBP at the prevailing UNORE year-end closing rate. Resulting gains or losses are accounted for in the Statement of Financial Performance.
CASH AND CASH EQUIVALENTS
6 Cash and cash equivalents comprise cash on hand, cash at banks and investments held to maturity. Fixed-term deposits placed with counterparties are considered to be receivables within the meaning of IPSAS 29 – “Financial Instruments: Recognition and Measurement”, and consequently are initially measured at their fair value, and subsequently at amortized cost using the effective interest method.
CONTRIBUTIONS AND RECEIVABLES
7 Assessed income on Member States is recognized as revenue when it falls due, normally on 1 January of the financial year for which the assessment is made.
8 Contributions are recognized as an asset when confirmed in writing by donors, with revenue normally being recognized at the same point. However, in some cases a donor agreement may contain sufficiently strict conditions over the application of funds to a specific activity that a liability is recognized along with the asset when the agreement is confirmed in writing and revenue is only recognized as the activity is delivered. The accounting treatment of donor contributions is determined on a case-by-case basis following the provisions of IPSAS 23 – “Revenue from Non-Exchange Transactions”.

IMO FINANCIAL STATEMENTS 2016
27
9 Even in the absence of conditions as defined in IPSAS 23, contributions from donors are typically received with restrictions over their use and are not available for the Organization’s use entirely at its own discretion. Balances of reserves by fund are disclosed in Note 2.12, with all balances held under Bilateral Operations and Multi-Donor Trust Funds (MDTF) being subject to restrictions imposed either through the terms of the bilateral agreement or the Terms of Reference of the MDTF, respectively, and such reserves may only be used in accordance with these restrictions.
10 Receivables are stated at nominal value less allowance for estimated irrecoverable amounts and discounted, where appropriate, if cash flows are not expected within 12 months of the reporting date.
11 In-kind contributions of goods are valued at fair market value and are recognized as revenue and as assets when received. In-kind contributions of services are not recognized in the financial statements.
REVENUE
12 The Organization’s commercial sales operations, conducted through the Trading Fund, and the fees charged to those submitting products and substances for technical assessment in order for the Organization to fully recover costs associated with conducting those assessments, are considered to be exchange transactions within the meaning of IPSAS 9 – “Revenue from Exchange Transactions”. All other revenue is on a non-exchange basis and is accounted for in accordance with IPSAS 23.
13 Revenue from the sale of publications is recognized upon shipment to the customer, with the exception of consignment stock held on the Organization’s behalf by distributors under agreements where the Organization retains the risks and rewards of ownership. Sales of such consignment stock are recognized as sales when made by the distributor to the end customer.
INVENTORIES
14 Publications held for sale on hand at the end of the financial period are recorded as inventories and are valued at the lower of cost or net realizable value.
15 The cost of publications includes purchase cost, transportation and delivery costs, determined on a weighted average basis. Publications held by distributors under a consignment stock arrangement continue to be shown as the Organization’s asset until their sale by the distributor.
16 Publications are shown as a cost of sales at the time at which the sale is recognized, and the inventory is reviewed at the end of each financial year for obsolescence.
17 Obsolete books are held at nil value until their disposal.
18 Slow-moving titles, with an excess of three years’ stock on hand, are considered to be impaired, with a 50% reduction in value.
19 No publications are held solely for distribution on a free of charge basis. Such distributions typically represent less than 5% of all publications distributed. Consequently, no provision is made in this regard.
PROPERTY, PLANT AND EQUIPMENT
20 Property, Plant and Equipment (PP&E) are stated at historical cost less accumulated depreciation and any impairment losses. Depreciation is provided for PP&E over their estimated useful life using the straight line method. The estimated useful life for PP&E classes are as follows:
Class Estimated useful life (years)
Communication and IT equipment 3-5
Vehicles 4-7
Furniture & fixtures 5
Conference equipment 7
Miscellaneous 5
IMO FINANCIAL STATEMENTS 2016
28
21 Leasehold improvements are recognized as assets and valued at cost, and depreciated over the lesser of the remaining useful life of the improvements or the lease term.
22 While the Organization uses an operational threshold for recognizing property, plant and equipment of £500, this threshold is not applied to library collections. Where a library collection is deemed to be in excess of 10% reference in nature, all purchases of reference material are capitalized and depreciated over three years on a straight line basis. Where a library collection holds less than 10% reference books, all items will be expensed as purchased.
23 Impairment reviews are undertaken for all assets at least annually.
INTANGIBLE ASSETS
24 Intangible assets are stated at historical cost less accumulated amortization and any impairment losses.
25 Publication titles are not considered to be intangible assets as they do not meet the provisions of IPSAS 31 – “Intangible Assets”. Consequently, development costs for new titles are expensed as they are incurred.
26 Amortization is provided over the estimated useful life using the straight line method. The estimated useful life for intangible asset classes are as follows:
Class Estimated useful life (years)
Software acquired externally 3
Internally developed software 3-6
Leases
FINANCE LEASES
27 Leases under which substantially all of the risk and reward of ownership have been transferred to the Organization through the lease agreement are treated as finance leases.
28 Assets purchased under a finance lease are shown as assets at the lower of the fair value of the asset and the present value of the minimum lease payments. An associated lease obligation is recognized at the same value.
29 Lease payments made under a finance lease are apportioned between payment of finance charges and reduction of the balance of the liability.
30 Assets acquired through a finance lease are depreciated over the shorter of the lease term or the useful life of the asset, except where such assets become the property of the Organization on completion of the lease term. In such cases, the asset is depreciated over its useful life. The finance charge will be calculated so as to produce a constant periodic rate of interest on the remaining balance of the liability.
OPERATING LEASES
31 Leases which are not categorized as finance leases, with a balance of risk and reward remaining with the lessor, are considered to be operating leases.
32 Expenditure incurred under an operating lease is charged on a straight-line basis over the life of the lease.

IMO FINANCIAL STATEMENTS 2016
29
EMPLOYEE BENEFITS LIABILITIES
33 IMO recognizes the following categories of employee benefits:
• short-term employee benefits due to be settled within 12 months of the end of the accounting period in which employees render the related service;
• post-employment benefits;
• other long-term employee benefits; and
• termination benefits.
34 IMO is a member organization participating in the United Nations Joint Staff Pension Fund (UNJSPF or the Fund), which was established by the United Nations General Assembly to provide retirement, death, disability and related benefits to employees. The Fund is a funded, multi-employer defined benefit plan. As specified by Article 3(b) of the Regulations of the Fund, membership in the Fund shall be open to the specialized agencies and to any other international, intergovernmental organization which participates in the common system of salaries, allowances and other conditions of service of the United Nations and the specialized agencies. Certain categories of employees of IMO are members of the UNJSPF.
35 The Fund exposes participating organizations to actuarial risks associated with the current and former employees of other organizations participating in the Fund, with the result that there is no consistent and reliable basis for allocating the obligation, plan assets, and costs to individual organizations participating in the plan. IMO and the UNJSPF, in line with the other participating organizations in the Fund, are not in a position to identify IMO’s proportionate share of the defined benefit obligation, the plan assets and the costs associated with the plan with sufficient reliability for accounting purposes. Hence, IMO has treated this plan as if it were a defined contribution plan in line with the requirements of IPSAS 25. IMO’s contributions to the Fund during the financial period are recognized as expenses in the statement of financial performance.
36 Actuarial gains and losses which may arise from experience adjustments and changes in actuarial assumptions are recognized in the period in which they occur as a separate item directly in net assets/equity. Past service costs from amendments to the benefits provided by the plans are recognized in surplus or deficit over the average remaining service lives of the related employees if they are not vested, and immediately when they arise if the benefits are already vested. None of the benefits of the Organization’s defined benefits plans have been amended during the reporting period.
37 Termination benefits include indemnities for dismissal before retirement or voluntary redundancy. Where, at the reporting date, there is a formal plan, without realistic possibility of withdrawal, to finish the employment of a staff member and at that date the staff member has not yet separated from the Organization, an accrual is recognized in the financial statements.
PROVISIONS AND CONTINGENT LIABILITIES
38 Provisions are made for future liabilities and charges where IMO has a present legal or constructive obligation as a result of past events and it is probable that IMO will be required to settle the obligation.
39 A high proportion of the Organization’s sales of publications are made through distributors rather than directly to the end user. It is the Organization’s established business practice to refund distributors for unsold copies held by them, which may become obsolete through the issuance of a new edition. A provision is established to reflect an approximation of the funds expected to be reimbursed to distributors for the copies sold to them during the financial year which may be returned during future financial years. This liability is estimated using a percentage of the previous financial year sales based on the historical levels of returns.
40 Other commitments, which do not meet the recognition criteria for liabilities, are disclosed in the notes to the financial statements as contingent liabilities when their existence will be confirmed only by the occurrence or non-occurrence of one or more uncertain future events which are not wholly within the control of IMO.
IMO FINANCIAL STATEMENTS 2016
30
FUND ACCOUNTING AND SEGMENT REPORTING
41 The financial statements are prepared on a fund accounting basis, showing, at the end of the period, the consolidated position of all IMO funds. A fund is a self-balancing accounting entity established to account for the transactions of a specified purpose or objective. Fund balances represent the accumulated residual of revenue and expenses.
42 IMO classifies all projects, operations and fund activities into four segments: i) Core Programme Management; ii) Technical Cooperation and Extra-budgetary Activities; iii) Trading and Business Activities; and iv) Education and Research. IMO reports on the transactions of each segment during the financial period, and the balances held at the end of the period.
43 Under Core Programme Management, the Organization provides services to support Member States’ decision making, including the development of treaties, regulations and policies. These activities are funded by assessed contributions and transfers from surpluses from such contributions. The Organization’s General Fund, Working Capital Fund, Headquarters Capital Fund, Training and Development Fund and Termination Benefit Fund are grouped under this segment.
44 Under Technical Cooperation and Extra-budgetary Activities, the Organization provides Member States with technical cooperation and extra-budgetary planning and implementation services. Such activities are primarily funded through the surplus of the Organization’s commercial activities and through contributions from donors or through a cost recovery model such as the fees charged for assessments of products and substances. In this context, the Organization’s Technical Cooperation Fund and all donor trust Funds are grouped under this segment.
45 Activities conducted by WMU and IMLI are categorized under the Education and Research segment. The Organization provides both internal and external training services, including the activities of WMU and IMLI. Funding is primarily derived from donations to and fees charged by WMU and IMLI, and partly through the surplus of the Organization’s commercial activities.
46 As the Organization undertakes commercial business activities, in particular, of publishing and catering, through the Trading Fund, those activities are segmented under Trading and Business Activities. Funding comes from the sale of publications and catering.
BUDGET COMPARISON
47 The Assembly approves the biennial budgets of the Organization which include regular budget strategic results and budgets of the Trading Fund, the Headquarters Capital Fund, the Training and Development Fund, the Termination Benefit Fund and the Technical Cooperation Fund, which may be subsequently amended by the Council or through the exercise of delegated authority. Statement V: Comparison of Budget and Actual Amounts compares the final budget to actual amounts calculated on the same basis as the corresponding budgetary amounts. As the bases used to prepare the budget and financial statements differ, Note 5 provides a reconciliation between the actual amounts presented in Statement V and the actual amounts presented in Statement IV: Cash Flow.
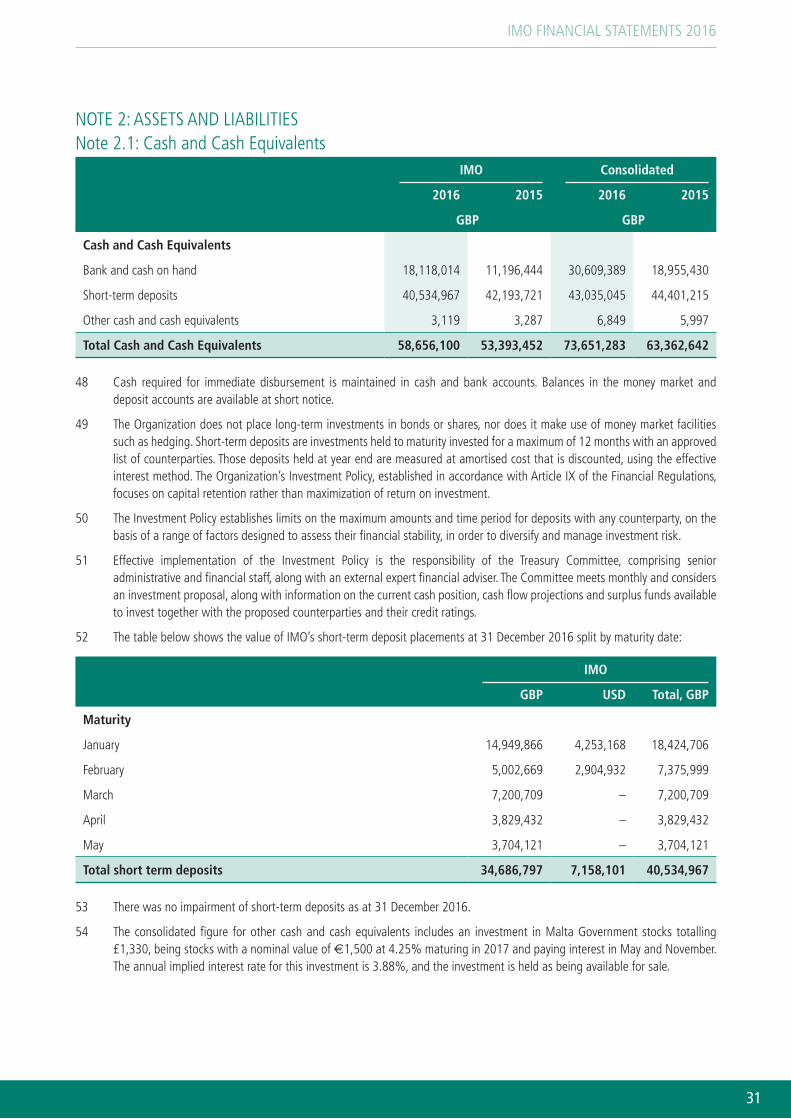
IMO FINANCIAL STATEMENTS 2016
31
NOTE 2: ASSETS AND LIABILITIESNote 2.1: Cash and Cash Equivalents
IMO Consolidated
2016 2015 2016 2015
GBP GBP
Cash and Cash Equivalents
Bank and cash on hand 18,118,014 11,196,444 30,609,389 18,955,430
Short-term deposits 40,534,967 42,193,721 43,035,045 44,401,215
Other cash and cash equivalents 3,119 3,287 6,849 5,997
Total Cash and Cash Equivalents 58,656,100 53,393,452 73,651,283 63,362,642
48 Cash required for immediate disbursement is maintained in cash and bank accounts. Balances in the money market and deposit accounts are available at short notice.
49 The Organization does not place long-term investments in bonds or shares, nor does it make use of money market facilities such as hedging. Short-term deposits are investments held to maturity invested for a maximum of 12 months with an approved list of counterparties. Those deposits held at year end are measured at amortised cost that is discounted, using the effective interest method. The Organization’s Investment Policy, established in accordance with Article IX of the Financial Regulations, focuses on capital retention rather than maximization of return on investment.
50 The Investment Policy establishes limits on the maximum amounts and time period for deposits with any counterparty, on the basis of a range of factors designed to assess their financial stability, in order to diversify and manage investment risk.
51 Effective implementation of the Investment Policy is the responsibility of the Treasury Committee, comprising senior administrative and financial staff, along with an external expert financial adviser. The Committee meets monthly and considers an investment proposal, along with information on the current cash position, cash flow projections and surplus funds available to invest together with the proposed counterparties and their credit ratings.
52 The table below shows the value of IMO’s short-term deposit placements at 31 December 2016 split by maturity date:
IMO
GBP USD Total, GBP
Maturity
January 14,949,866 4,253,168 18,424,706
February 5,002,669 2,904,932 7,375,999
March 7,200,709 – 7,200,709
April 3,829,432 – 3,829,432
May 3,704,121 – 3,704,121
Total short term deposits 34,686,797 7,158,101 40,534,967
53 There was no impairment of short-term deposits as at 31 December 2016.
54 The consolidated figure for other cash and cash equivalents includes an investment in Malta Government stocks totalling £1,330, being stocks with a nominal value of €1,500 at 4.25% maturing in 2017 and paying interest in May and November. The annual implied interest rate for this investment is 3.88%, and the investment is held as being available for sale.
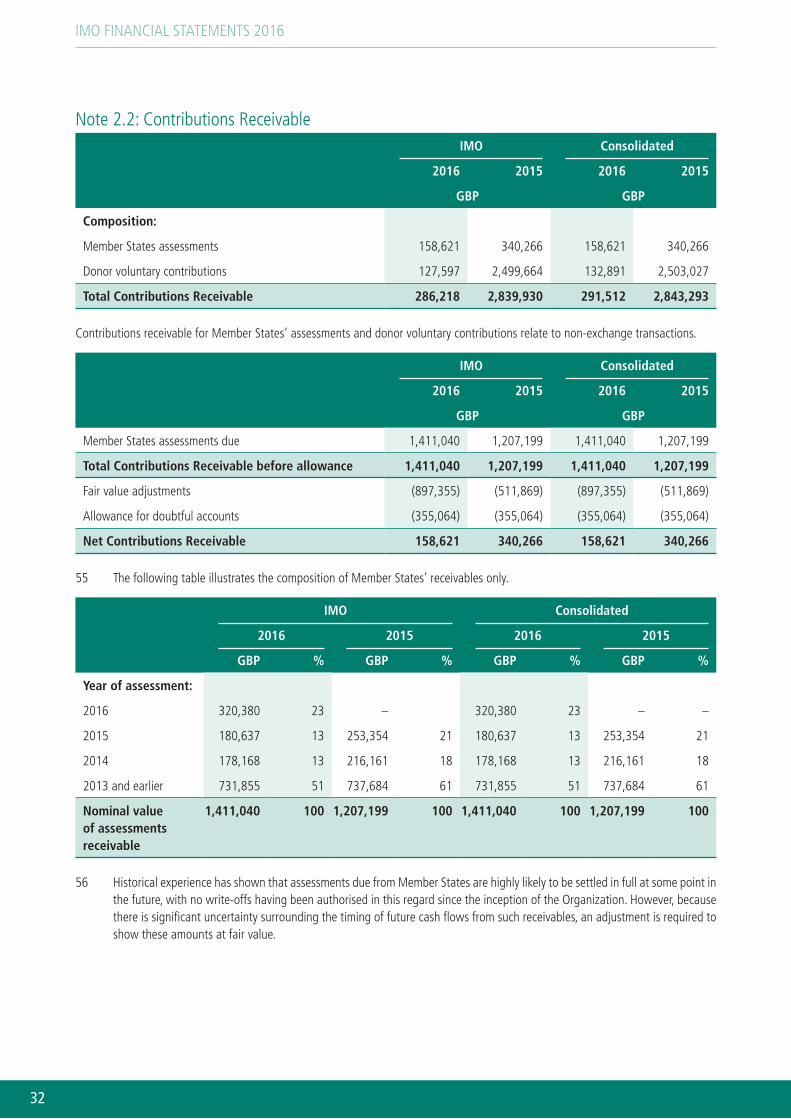
IMO FINANCIAL STATEMENTS 2016
32
Note 2.2: Contributions ReceivableIMO Consolidated
2016 2015 2016 2015
GBP GBP
Composition:
Member States assessments 158,621 340,266 158,621 340,266
Donor voluntary contributions 127,597 2,499,664 132,891 2,503,027
Total Contributions Receivable 286,218 2,839,930 291,512 2,843,293
Contributions receivable for Member States’ assessments and donor voluntary contributions relate to non-exchange transactions.
IMO Consolidated
2016 2015 2016 2015
GBP GBP
Member States assessments due 1,411,040 1,207,199 1,411,040 1,207,199
Total Contributions Receivable before allowance 1,411,040 1,207,199 1,411,040 1,207,199
Fair value adjustments (897,355) (511,869) (897,355) (511,869)
Allowance for doubtful accounts (355,064) (355,064) (355,064) (355,064)
Net Contributions Receivable 158,621 340,266 158,621 340,266
55 The following table illustrates the composition of Member States’ receivables only.
IMO Consolidated
2016 2015 2016 2015
GBP % GBP % GBP % GBP %
Year of assessment:
2016 320,380 23 – 320,380 23 – –
2015 180,637 13 253,354 21 180,637 13 253,354 21
2014 178,168 13 216,161 18 178,168 13 216,161 18
2013 and earlier 731,855 51 737,684 61 731,855 51 737,684 61
Nominal value of assessments receivable
1,411,040 100 1,207,199 100 1,411,040 100 1,207,199 100
56 Historical experience has shown that assessments due from Member States are highly likely to be settled in full at some point in the future, with no write-offs having been authorised in this regard since the inception of the Organization. However, because there is significant uncertainty surrounding the timing of future cash flows from such receivables, an adjustment is required to show these amounts at fair value.

IMO FINANCIAL STATEMENTS 2016
33
57 The movements of the allowance for fair value adjustment and doubtful accounts during 2016 are as follows:
Opening Balance
1.1.2016Increase/
(Decrease)
Closing Balance
31.12.2016
GBP
Fair value adjustment for Member States’ arrears – IMO 511,869 385,486 897,355
Fair value adjustment for Member States’ arrears – Consolidated
511,869 385,486 897,355
Total allowance for doubtful accounts – IMO 355,064 – 355,064
Total allowance for doubtful accounts – Consolidated 355,064 – 355,064
58 As at 31 December 2016 there were a total of 34 Member States with outstanding balances. Of these, 24 had current year and prior year balances only. The remaining 10 had arrears prior to 2015. One Member State had an agreed payment plan in place for outstanding arrears as at 31 December 2016. For the Member States in arrears and without such an agreement, an approximation is made based on historical experience – for those Member States which had arrears extending only to the current year and prior year, no fair value adjustment is made. For the remaining Member States with arrears for 2014 and earlier, it was assumed that the eventual cash flows will be sufficiently far in the future that the present value of those cash flows after discounting is approximately zero.
59 In addition to the balances due from those 34 Member States, the settlement of the former Socialist Federal Republic of Yugoslavia (SFRY) arrears of £355,064 continues to depend on the results of ongoing negotiations at the United Nations regarding succession issues. The Governments of the successor States of the former SFRY have requested the United Nations to write off all debts of the former SFRY relating to their contributions to the United Nations and its specialized agencies and programmes. The United Nations had taken the view that, in accordance with the general rules of international law regarding the succession of States in respect of State debts, the United Nations has the right to seek payment of all or part of the pre-dissolution arrears from the five successor States of the former Yugoslavia. Despite requests for the debt to be written off, the United Nations has refused to do so. The precise amount owing by each of SFRY’s five successor States has not as yet been determined by the United Nations. Until this issue is settled by the United Nations, the Secretariat is not in a position to pursue the recovery of the outstanding amount, and the Secretariat’s policy in this regard is consistent with prior years and the approach taken by the United Nations.
60 Contributions receivable from donors include: amounts due but not yet received under signed donor agreements, other than those amounts for future periods dependent on the successful completion of earlier phases of work.
61 Contributions receivable from donors are shown net of contributions adjustments related to allowance for doubtful accounts based on an individual review of each receivable. Amounts due beyond 2017 are discounted based on likely timings of such future cash flows. A review of amounts due as at 31 December 2016 indicated that no such adjustments were required on outstanding balances.
62 In the case of both Member State assessments and donor voluntary contributions due, adjustments are made to better reflect the fair value of the receivables in the financial statements but constitute neither a formal write-off of the receivable nor a releasing of the third party from their obligation.
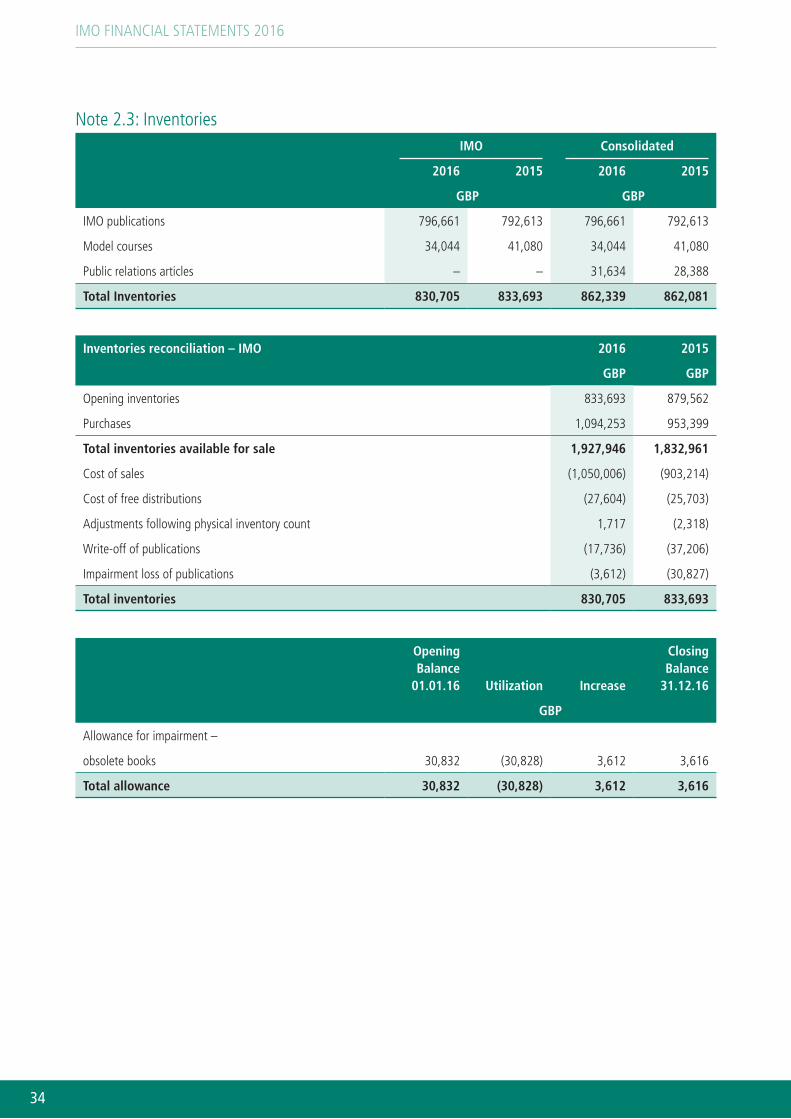
IMO FINANCIAL STATEMENTS 2016
34
Note 2.3: InventoriesIMO Consolidated
2016 2015 2016 2015
GBP GBP
IMO publications 796,661 792,613 796,661 792,613
Model courses 34,044 41,080 34,044 41,080
Public relations articles – – 31,634 28,388
Total Inventories 830,705 833,693 862,339 862,081
Inventories reconciliation – IMO 2016 2015
GBP GBP
Opening inventories 833,693 879,562
Purchases 1,094,253 953,399
Total inventories available for sale 1,927,946 1,832,961
Cost of sales (1,050,006) (903,214)
Cost of free distributions (27,604) (25,703)
Adjustments following physical inventory count 1,717 (2,318)
Write-off of publications (17,736) (37,206)
Impairment loss of publications (3,612) (30,827)
Total inventories 830,705 833,693
Opening Balance
01.01.16 Utilization Increase
Closing Balance
31.12.16
GBP
Allowance for impairment –
obsolete books 30,832 (30,828) 3,612 3,616
Total allowance 30,832 (30,828) 3,612 3,616
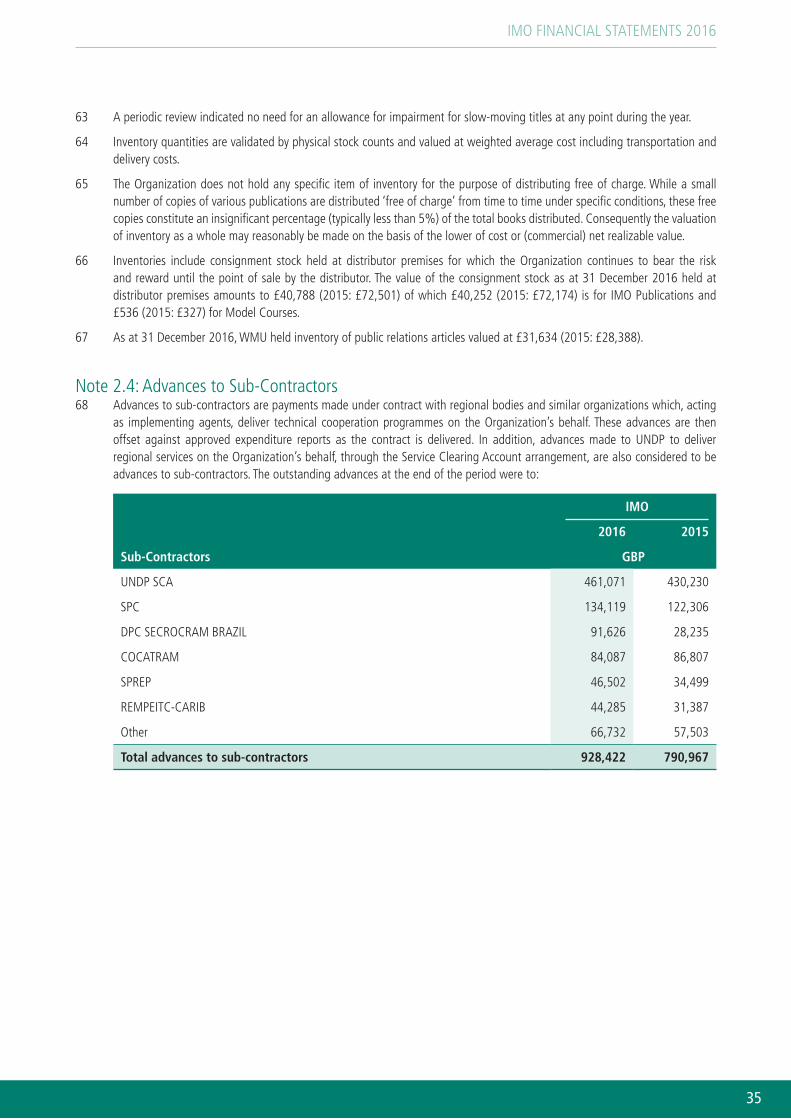
IMO FINANCIAL STATEMENTS 2016
35
63 A periodic review indicated no need for an allowance for impairment for slow-moving titles at any point during the year.
64 Inventory quantities are validated by physical stock counts and valued at weighted average cost including transportation and delivery costs.
65 The Organization does not hold any specific item of inventory for the purpose of distributing free of charge. While a small number of copies of various publications are distributed ‘free of charge’ from time to time under specific conditions, these free copies constitute an insignificant percentage (typically less than 5%) of the total books distributed. Consequently the valuation of inventory as a whole may reasonably be made on the basis of the lower of cost or (commercial) net realizable value.
66 Inventories include consignment stock held at distributor premises for which the Organization continues to bear the risk and reward until the point of sale by the distributor. The value of the consignment stock as at 31 December 2016 held at distributor premises amounts to £40,788 (2015: £72,501) of which £40,252 (2015: £72,174) is for IMO Publications and £536 (2015: £327) for Model Courses.
67 As at 31 December 2016, WMU held inventory of public relations articles valued at £31,634 (2015: £28,388).
Note 2.4: Advances to Sub-Contractors68 Advances to sub-contractors are payments made under contract with regional bodies and similar organizations which, acting
as implementing agents, deliver technical cooperation programmes on the Organization’s behalf. These advances are then offset against approved expenditure reports as the contract is delivered. In addition, advances made to UNDP to deliver regional services on the Organization’s behalf, through the Service Clearing Account arrangement, are also considered to be advances to sub-contractors. The outstanding advances at the end of the period were to:
IMO
2016 2015
Sub-Contractors GBP
UNDP SCA 461,071 430,230
SPC 134,119 122,306
DPC SECROCRAM BRAZIL 91,626 28,235
COCATRAM 84,087 86,807
SPREP 46,502 34,499
REMPEITC-CARIB 44,285 31,387
Other 66,732 57,503
Total advances to sub-contractors 928,422 790,967
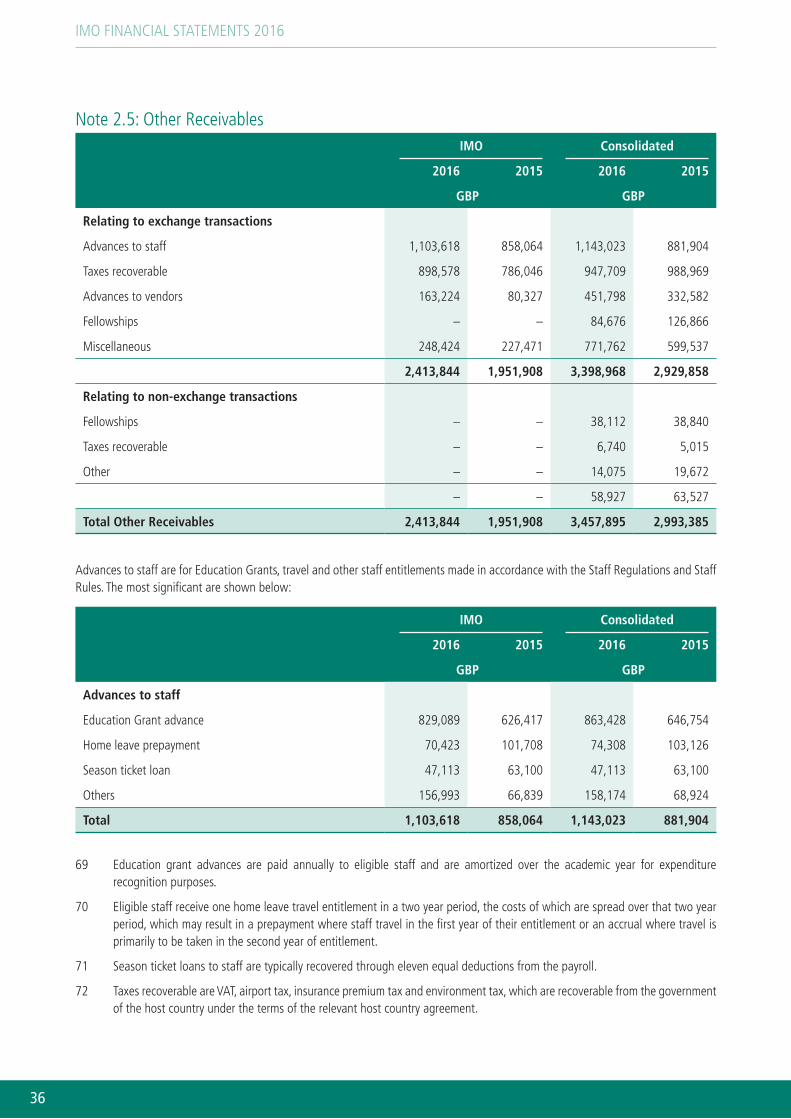
IMO FINANCIAL STATEMENTS 2016
36
Note 2.5: Other ReceivablesIMO Consolidated
2016 2015 2016 2015
GBP GBP
Relating to exchange transactions
Advances to staff 1,103,618 858,064 1,143,023 881,904
Taxes recoverable 898,578 786,046 947,709 988,969
Advances to vendors 163,224 80,327 451,798 332,582
Fellowships – – 84,676 126,866
Miscellaneous 248,424 227,471 771,762 599,537
2,413,844 1,951,908 3,398,968 2,929,858
Relating to non-exchange transactions
Fellowships – – 38,112 38,840
Taxes recoverable – – 6,740 5,015
Other – – 14,075 19,672
– – 58,927 63,527
Total Other Receivables 2,413,844 1,951,908 3,457,895 2,993,385
Advances to staff are for Education Grants, travel and other staff entitlements made in accordance with the Staff Regulations and Staff Rules. The most significant are shown below:
IMO Consolidated
2016 2015 2016 2015
GBP GBP
Advances to staff
Education Grant advance 829,089 626,417 863,428 646,754
Home leave prepayment 70,423 101,708 74,308 103,126
Season ticket loan 47,113 63,100 47,113 63,100
Others 156,993 66,839 158,174 68,924
Total 1,103,618 858,064 1,143,023 881,904
69 Education grant advances are paid annually to eligible staff and are amortized over the academic year for expenditure recognition purposes.
70 Eligible staff receive one home leave travel entitlement in a two year period, the costs of which are spread over that two year period, which may result in a prepayment where staff travel in the first year of their entitlement or an accrual where travel is primarily to be taken in the second year of entitlement.
71 Season ticket loans to staff are typically recovered through eleven equal deductions from the payroll.
72 Taxes recoverable are VAT, airport tax, insurance premium tax and environment tax, which are recoverable from the government of the host country under the terms of the relevant host country agreement.
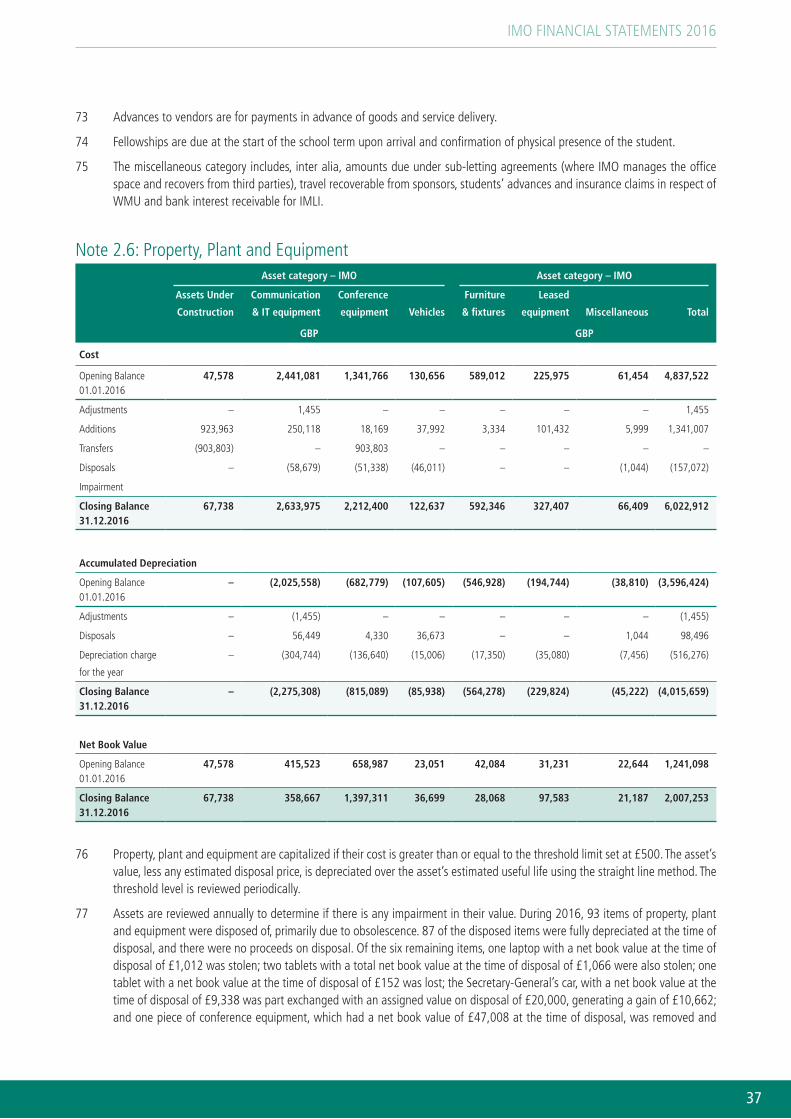
IMO FINANCIAL STATEMENTS 2016
37
73 Advances to vendors are for payments in advance of goods and service delivery.
74 Fellowships are due at the start of the school term upon arrival and confirmation of physical presence of the student.
75 The miscellaneous category includes, inter alia, amounts due under sub-letting agreements (where IMO manages the office space and recovers from third parties), travel recoverable from sponsors, students’ advances and insurance claims in respect of WMU and bank interest receivable for IMLI.
Note 2.6: Property, Plant and EquipmentAsset category – IMO Asset category – IMO
Assets Under
Construction
Communication
& IT equipment
Conference
equipment Vehicles
Furniture
& fixtures
Leased
equipment Miscellaneous Total
GBP GBP
Cost
Opening Balance 01.01.2016
47,578 2,441,081 1,341,766 130,656 589,012 225,975 61,454 4,837,522
Adjustments – 1,455 – – – – – 1,455
Additions 923,963 250,118 18,169 37,992 3,334 101,432 5,999 1,341,007
Transfers (903,803) – 903,803 – – – – –
Disposals – (58,679) (51,338) (46,011) – – (1,044) (157,072)
Impairment
Closing Balance 31.12.2016
67,738 2,633,975 2,212,400 122,637 592,346 327,407 66,409 6,022,912
Accumulated Depreciation
Opening Balance 01.01.2016
– (2,025,558) (682,779) (107,605) (546,928) (194,744) (38,810) (3,596,424)
Adjustments – (1,455) – – – – – (1,455)
Disposals – 56,449 4,330 36,673 – – 1,044 98,496
Depreciation charge
for the year
– (304,744) (136,640) (15,006) (17,350) (35,080) (7,456) (516,276)
Closing Balance 31.12.2016
– (2,275,308) (815,089) (85,938) (564,278) (229,824) (45,222) (4,015,659)
Net Book Value
Opening Balance 01.01.2016
47,578 415,523 658,987 23,051 42,084 31,231 22,644 1,241,098
Closing Balance 31.12.2016
67,738 358,667 1,397,311 36,699 28,068 97,583 21,187 2,007,253
76 Property, plant and equipment are capitalized if their cost is greater than or equal to the threshold limit set at £500. The asset’s value, less any estimated disposal price, is depreciated over the asset’s estimated useful life using the straight line method. The threshold level is reviewed periodically.
77 Assets are reviewed annually to determine if there is any impairment in their value. During 2016, 93 items of property, plant and equipment were disposed of, primarily due to obsolescence. 87 of the disposed items were fully depreciated at the time of disposal, and there were no proceeds on disposal. Of the six remaining items, one laptop with a net book value at the time of disposal of £1,012 was stolen; two tablets with a total net book value at the time of disposal of £1,066 were also stolen; one tablet with a net book value at the time of disposal of £152 was lost; the Secretary-General’s car, with a net book value at the time of disposal of £9,338 was part exchanged with an assigned value on disposal of £20,000, generating a gain of £10,662; and one piece of conference equipment, which had a net book value of £47,008 at the time of disposal, was removed and

IMO FINANCIAL STATEMENTS 2016
38
replaced with enhanced equipment during the year. In the latter case, the equipment had been installed in 2015 in time for the Organization’s Assembly, but with the view of replacing it when an improved version of the equipment became available during 2016. In addition, during 2016 an item of Communication & IT equipment which had been disposed of as lost during a physical audit in 2015 was discovered during a subsequent physical audit. The item, which cost £1,455 and was fully depreciated, was added back to the asset register.
78 The IMO Headquarters building is not part of property, plant and equipment as the IMO is a tenant in the building under a lease which is deemed to be an operating lease under the provisions of IPSAS 13. Further disclosures on the treatment of this lease are provided in Note 2.11.2.
79 During 2016 the Organization carried out works in order to replace the simultaneous interpretation system (SIMS) in Committee Rooms 9 and 10 and to further enhance the system in the Main Hall that had been capitalised in 2015. As at the reporting date the replacement of the SIMS in Committee Rooms 9 and 10, and enhancement of the SIMS in the Main Hall, had been finalised and the corresponding costs were transferred from assets under construction to Conference Equipment, for a total of £666,641 and £237,162 respectively.
80 The assets under construction at year end relate to two assets in the field. £44,985 was incurred in 2016 towards the Development of a Marine Simulator Training Room at the Djibouti Regional Training Centre (DRTC). £22,753 had been incurred in prior years relating to the design and delivery of Search and Rescue (SAR) equipment in the Republic of the Congo, developed as part of an ongoing programme to support the region in this respect. The installation of this equipment is still pending because the designated venue is not yet completed. Provision of these assets is in line with the Organization’s objectives. Control is transferred to the relevant third party on completion of the project, therefore both assets currently in construction remain under the Organization’s control at year-end.
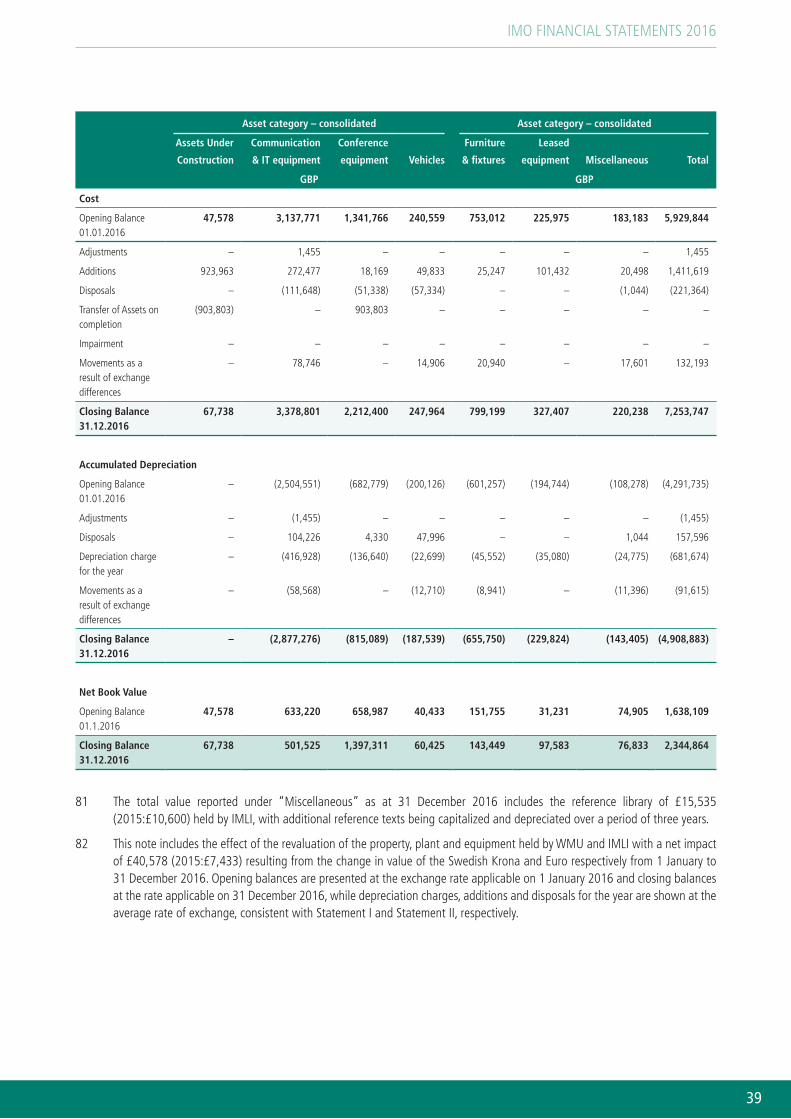
IMO FINANCIAL STATEMENTS 2016
39
Asset category – consolidated Asset category – consolidated
Assets Under
Construction
Communication
& IT equipment
Conference
equipment Vehicles
Furniture
& fixtures
Leased
equipment Miscellaneous Total
GBP GBP
Cost
Opening Balance 01.01.2016
47,578 3,137,771 1,341,766 240,559 753,012 225,975 183,183 5,929,844
Adjustments – 1,455 – – – – – 1,455
Additions 923,963 272,477 18,169 49,833 25,247 101,432 20,498 1,411,619
Disposals – (111,648) (51,338) (57,334) – – (1,044) (221,364)
Transfer of Assets on completion
(903,803) – 903,803 – – – – –
Impairment – – – – – – – –
Movements as a result of exchange differences
– 78,746 – 14,906 20,940 – 17,601 132,193
Closing Balance 31.12.2016
67,738 3,378,801 2,212,400 247,964 799,199 327,407 220,238 7,253,747
Accumulated Depreciation
Opening Balance 01.01.2016
– (2,504,551) (682,779) (200,126) (601,257) (194,744) (108,278) (4,291,735)
Adjustments – (1,455) – – – – – (1,455)
Disposals – 104,226 4,330 47,996 – – 1,044 157,596
Depreciation charge for the year
– (416,928) (136,640) (22,699) (45,552) (35,080) (24,775) (681,674)
Movements as a result of exchange differences
– (58,568) – (12,710) (8,941) – (11,396) (91,615)
Closing Balance 31.12.2016
– (2,877,276) (815,089) (187,539) (655,750) (229,824) (143,405) (4,908,883)
Net Book Value
Opening Balance 01.1.2016
47,578 633,220 658,987 40,433 151,755 31,231 74,905 1,638,109
Closing Balance 31.12.2016
67,738 501,525 1,397,311 60,425 143,449 97,583 76,833 2,344,864
81 The total value reported under “Miscellaneous” as at 31 December 2016 includes the reference library of £15,535 (2015:£10,600) held by IMLI, with additional reference texts being capitalized and depreciated over a period of three years.
82 This note includes the effect of the revaluation of the property, plant and equipment held by WMU and IMLI with a net impact of £40,578 (2015:£7,433) resulting from the change in value of the Swedish Krona and Euro respectively from 1 January to 31 December 2016. Opening balances are presented at the exchange rate applicable on 1 January 2016 and closing balances at the rate applicable on 31 December 2016, while depreciation charges, additions and disposals for the year are shown at the average rate of exchange, consistent with Statement I and Statement II, respectively.
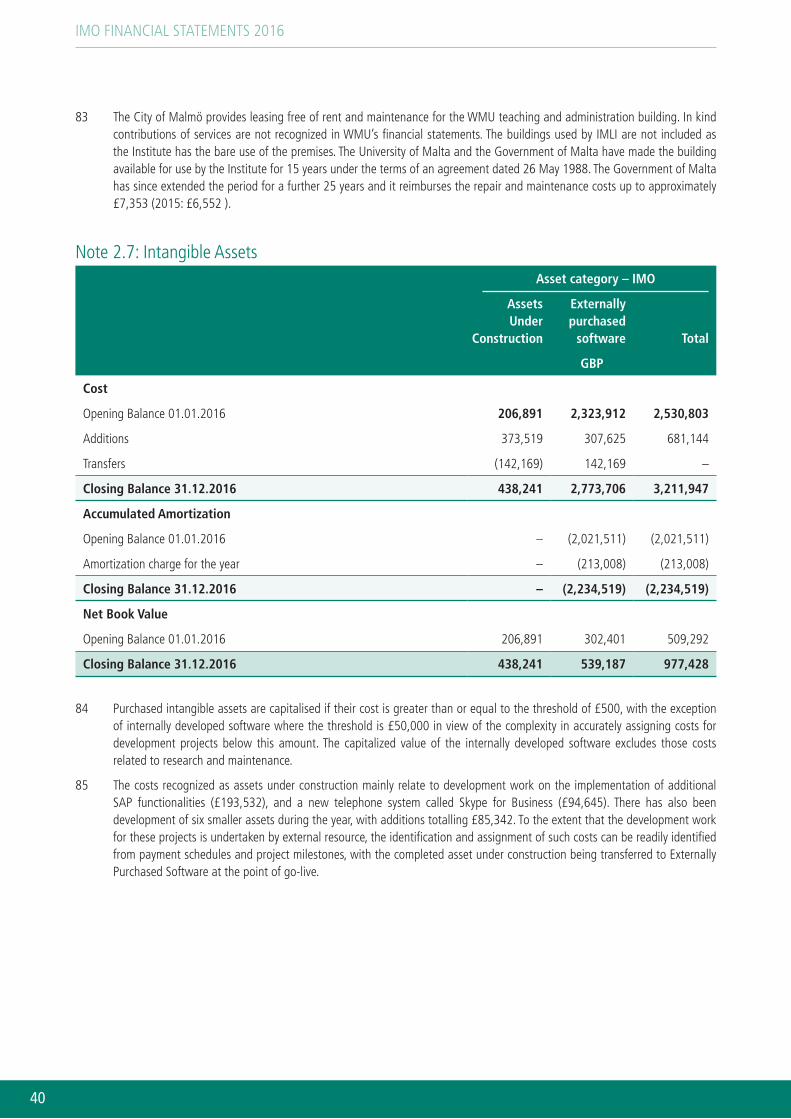
IMO FINANCIAL STATEMENTS 2016
40
83 The City of Malmö provides leasing free of rent and maintenance for the WMU teaching and administration building. In kind contributions of services are not recognized in WMU’s financial statements. The buildings used by IMLI are not included as the Institute has the bare use of the premises. The University of Malta and the Government of Malta have made the building available for use by the Institute for 15 years under the terms of an agreement dated 26 May 1988. The Government of Malta has since extended the period for a further 25 years and it reimburses the repair and maintenance costs up to approximately £7,353 (2015: £6,552 ).
Note 2.7: Intangible AssetsAsset category – IMO
Assets Under
Construction
Externally purchased
software Total
GBP
Cost
Opening Balance 01.01.2016 206,891 2,323,912 2,530,803
Additions 373,519 307,625 681,144
Transfers (142,169) 142,169 –
Closing Balance 31.12.2016 438,241 2,773,706 3,211,947
Accumulated Amortization
Opening Balance 01.01.2016 – (2,021,511) (2,021,511)
Amortization charge for the year – (213,008) (213,008)
Closing Balance 31.12.2016 – (2,234,519) (2,234,519)
Net Book Value
Opening Balance 01.01.2016 206,891 302,401 509,292
Closing Balance 31.12.2016 438,241 539,187 977,428
84 Purchased intangible assets are capitalised if their cost is greater than or equal to the threshold of £500, with the exception of internally developed software where the threshold is £50,000 in view of the complexity in accurately assigning costs for development projects below this amount. The capitalized value of the internally developed software excludes those costs related to research and maintenance.
85 The costs recognized as assets under construction mainly relate to development work on the implementation of additional SAP functionalities (£193,532), and a new telephone system called Skype for Business (£94,645). There has also been development of six smaller assets during the year, with additions totalling £85,342. To the extent that the development work for these projects is undertaken by external resource, the identification and assignment of such costs can be readily identified from payment schedules and project milestones, with the completed asset under construction being transferred to Externally Purchased Software at the point of go-live.
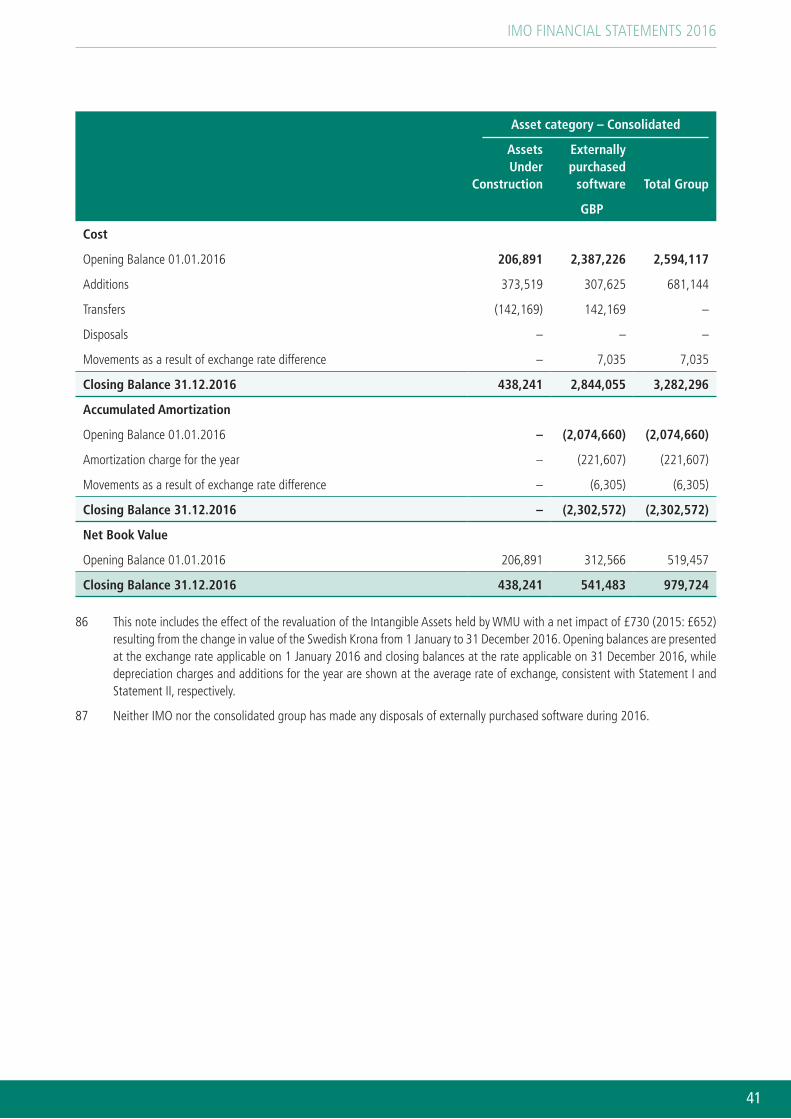
IMO FINANCIAL STATEMENTS 2016
41
Asset category – Consolidated
Assets Under
Construction
Externally purchased
software Total Group
GBP
Cost
Opening Balance 01.01.2016 206,891 2,387,226 2,594,117
Additions 373,519 307,625 681,144
Transfers (142,169) 142,169 –
Disposals – – –
Movements as a result of exchange rate difference – 7,035 7,035
Closing Balance 31.12.2016 438,241 2,844,055 3,282,296
Accumulated Amortization
Opening Balance 01.01.2016 – (2,074,660) (2,074,660)
Amortization charge for the year – (221,607) (221,607)
Movements as a result of exchange rate difference – (6,305) (6,305)
Closing Balance 31.12.2016 – (2,302,572) (2,302,572)
Net Book Value
Opening Balance 01.01.2016 206,891 312,566 519,457
Closing Balance 31.12.2016 438,241 541,483 979,724
86 This note includes the effect of the revaluation of the Intangible Assets held by WMU with a net impact of £730 (2015: £652) resulting from the change in value of the Swedish Krona from 1 January to 31 December 2016. Opening balances are presented at the exchange rate applicable on 1 January 2016 and closing balances at the rate applicable on 31 December 2016, while depreciation charges and additions for the year are shown at the average rate of exchange, consistent with Statement I and Statement II, respectively.
87 Neither IMO nor the consolidated group has made any disposals of externally purchased software during 2016.

IMO FINANCIAL STATEMENTS 2016
42
Note 2.8: Payables and AccrualsIMO Consolidated
2016 2015 2016 2015
GBP GBP
Relating to exchange transactions
Accruals 1,998,824 1,444,320 2,042,297 1,500,432
Payable to vendors 1,441,376 916,427 1,274,324 961,206
Advances from customers 181,036 270,498 181,036 270,468
Payable to staff 67,099 26,558 67,099 26,558
Fellowships – – 305,241 150,313
Deferred revenue 32,680 26,400 32,680 26,400
Other – – 610 527
3,721,015 2,684,203 3,903,287 2,935,904
Relating to non-exchange transactions
Fellowships – – 4,662,983 3,021,560
Condition on donor contributions 2,729,651 2,358,838 2,729,651 2,358,838
Advance contributions 1,816,206 1,197,771 2,109,429 1,661,635
Contributions Incentive Scheme 89,622 181,165 89,622 181,165
Deferred revenue 142,110 145,220 142,110 145,220
Funds held in trust 204,250 – 204,250
Payable to donors 98,618 81,478 615,652 307,212
Other – – 203,571 197,686
5,080,457 3,964,472 10,757,268 7,873,316
Total Payables and Accruals 8,801,472 6,648,675 14,660,555 10,809,220
88 Accruals represent estimates for the value of goods or services received, which have not yet been invoiced and for which the cost is not yet certain, most notably the provision of utilities and services delivered through the UNDP Service Clearing Account (SCA), and liabilities for goods and services received or provided to IMO during the period under agreed contracts but which have not yet been invoiced.
89 Payables to vendors relate to amounts due for goods and services for which invoices have been received.
90 Advances from customers reflect payments received prior to delivery of goods and services.
91 Fellowships and donations received and accrued for the academic year 2016/2017 relating to WMU and IMLI are apportioned over the period of the academic year. The amounts received or accrued in respect of that part of the academic year falling in 2017 are disclosed as advance receipts.
92 Deferred revenue relates to amounts received in the year for which the services have not been provided as at the reporting date.
93 Funds held in trust are contributions made to third party organizations through IMO for administrative purposes only. The Organization has no control over the application of those funds.

IMO FINANCIAL STATEMENTS 2016
43
94 The Organization recognizes as a liability conditions attached to certain voluntary contributions. Conditions may be imposed by donors on the use of contributions, and include both a performance obligation to use the donation in a specified manner, and an enforceable return obligation to return the donation if it is not used in the specified manner. The amount recognized as a liability is the best estimate of the amount that would be required to settle the obligation at the reporting date. As IMO satisfies the conditions on voluntary contributions through performance in the specified manner, the carrying amount of the liability is reduced and an amount of revenue equal to that reduction is recognized. The value of the most significant condition balances is shown below.
IMO Consolidated
2016 2015 2016 2015
GBP GBP
Condition on donor contributions
European Commission – Capacity Building for Climate Mitigation in the Maritime Shipping Industry
2,054,942 1,775,785 2,054,942 1,775,785
European Commission – Support FSI on PSC in Africa 627,958 542,653 627,958 542,653
European Commission – Preparedness for Oil-polluted Shoreline cleanup and Oiled Wildlife interventions Project (POSOW II)
34,558 – 34,558 –
European Commission – Mediterranean Decision Support System for Marine Safety (MEDESS-4MS)
12,193 40,400 12,193 40,400
Total 2,729,651 2,358,838 2,729,651 2,358,838
95 Advance contributions reflect balances received from Member States during 2016 towards the 2017 assessed contributions.
96 Under the Contributions Incentive Scheme (CIS), a part of the interest earned on the General Fund is returned to Member States, the allocation being based on a points system reflecting the timing and amount of the receipt of their current year assessments. The accumulated CIS earnings up to 2016 totalled £89,622 of which £39,194 relates to CIS earnings during 2016, to be distributed during 2018. A residual balance for prior years amounting to £50,428 remains awaiting instruction from one Member State.
97 Payables to donors represent the balance of unspent contributions for projects pending refund.
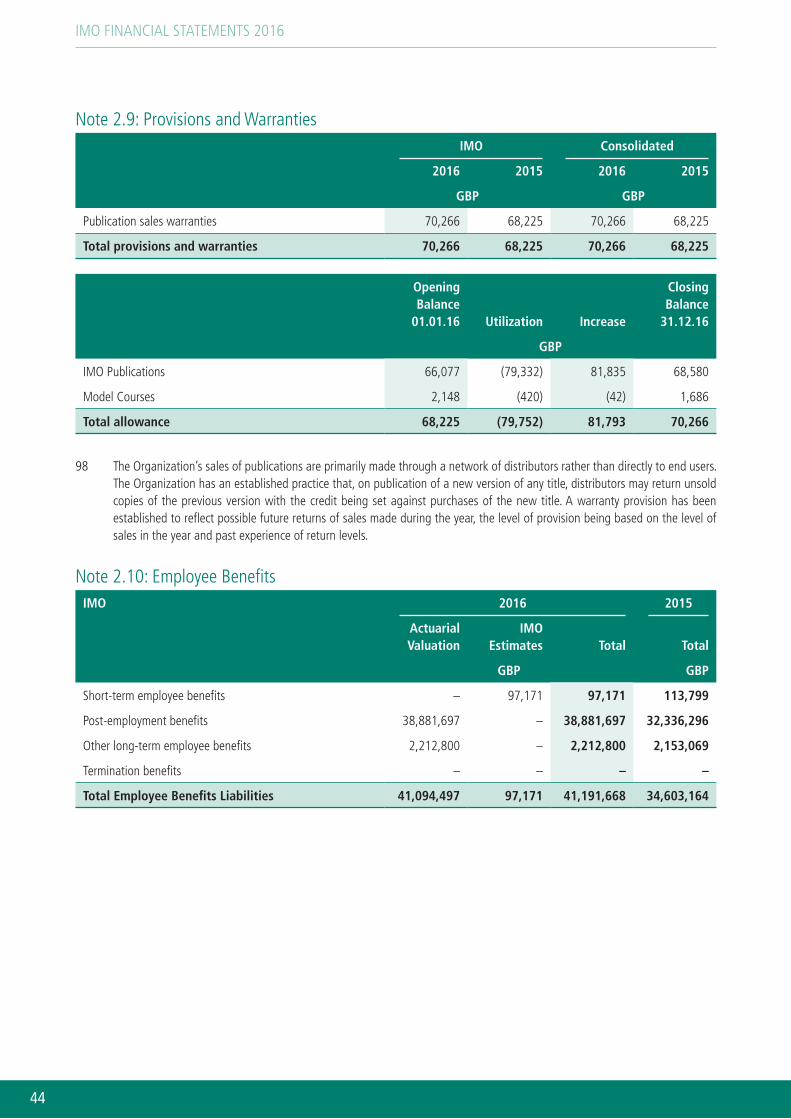
IMO FINANCIAL STATEMENTS 2016
44
Note 2.9: Provisions and WarrantiesIMO Consolidated
2016 2015 2016 2015
GBP GBP
Publication sales warranties 70,266 68,225 70,266 68,225
Total provisions and warranties 70,266 68,225 70,266 68,225
Opening Balance
01.01.16 Utilization Increase
Closing Balance
31.12.16
GBP
IMO Publications 66,077 (79,332) 81,835 68,580
Model Courses 2,148 (420) (42) 1,686
Total allowance 68,225 (79,752) 81,793 70,266
98 The Organization’s sales of publications are primarily made through a network of distributors rather than directly to end users. The Organization has an established practice that, on publication of a new version of any title, distributors may return unsold copies of the previous version with the credit being set against purchases of the new title. A warranty provision has been established to reflect possible future returns of sales made during the year, the level of provision being based on the level of sales in the year and past experience of return levels.
Note 2.10: Employee BenefitsIMO 2016 2015
Actuarial Valuation
IMO Estimates Total Total
GBP GBP
Short-term employee benefits – 97,171 97,171 113,799
Post-employment benefits 38,881,697 – 38,881,697 32,336,296
Other long-term employee benefits 2,212,800 – 2,212,800 2,153,069
Termination benefits – – – –
Total Employee Benefits Liabilities 41,094,497 97,171 41,191,668 34,603,164

IMO FINANCIAL STATEMENTS 2016
45
2016 2015
Short-Term Employee
Benefits
Post-Employment
Benefits
Other Long-Term Employee
Benefits Total Total
GBP GBP
Composition:
Current 97,171 – – 97,171 113,799
Non-current – 38,881,697 2,212,800 41,094,497 34,489,365
Total Employee Benefits Liabilities 97,171 38,881,697 2,212,800 41,191,668 34,603,164
Consolidated 2016 2015
Actuarial Valuation
Group Estimates Total Total
GBP GBP
Short-term employee benefits – 155,911 155,911 143,734
Post-employment benefits 39,180,234 – 39,180,234 32,585,742
Other long-term employee benefits 2,487,284 – 2,487,284 2,397,387
Termination benefits – – – –
Total Employee Benefits Liabilities 41,667,518 155,911 41,823,429 35,126,863
2016 Consolidated 2015
Short-Term Employee
Benefits
Post-Employment
Benefits
Other Long-Term Employee
Benefits Total Total
GBP GBP
Composition:
Current 155,911 – – 155,911 143,734
Non-current – 39,180,234 2,487,284 41,667,518 34,983,129
Total Employee Benefits Liabilities 155.911 39,180,234 2,487,284 41,823,429 35,126,863
99 In determining its post-employment liabilities, WMU used an estimate of the travel and shipment costs based on the prevailing market prices from the duty station to the home country to which the staff member and eligible dependants, if any, are entitled to return. The amount of the liability for the unused annual leave as at the reporting date was calculated based on the balance of unused annual leave days (up to a maximum of 60 days) and the current salary rate of the staff member. The employee benefits for home leave represents the amounts accrued for the year with the cost spread over two years.
IMO FINANCIAL STATEMENTS 2016
46
2.10.1: VALUATION OF EMPLOYEE BENEFITS LIABILITIES
100 Employee benefits liabilities are determined by professional actuaries or calculated by IMO based on personnel data and past payment experience. At 31 December 2016, total employee benefits liabilities amounted to £41,191,668 (2015: £34,603,164), of which £41,094,497 (2015: £34,489,365) was calculated by the actuaries and £97,171 (2015: £113,799) was calculated by IMO. Actuarial valuations are typically undertaken every two years. However, in 2016, an interim actuarial valuation was prepared to reflect the effect of the changes due to the current economic situation on the actuarial assumptions used for the 2015 actuarial valuation. In addition, the actuarial valuation also considered the changes in the Organization’s Staff Regulations & Staff Rules (SR&SR) effective 1 July 2016.
2.10.2: SHORT-TERM EMPLOYEE BENEFITS
101 Short-term employee benefits comprise mainly wages and payroll related allowances, first time employee benefits, education grant related benefits and other benefits such as paid annual leave and sick leave.
102 Short-term employee benefits are expected to be settled within 12 months after the end of the period in which the employees render the related service and are measured at their nominal values based on past payment experience.
2.10.3: POST-EMPLOYMENT BENEFITS
103 Post-employment benefits are defined benefit plans consisting of United Nations Joint Staff Pension Fund (UNJSPF), After-Service Health Insurance Plan (ASHI) and repatriation grant and related benefits.
104 Arrangements relating to the UNJSPF are set out in Note 2.10.7.
105 ASHI is a plan that allows eligible retirees and their eligible family members to participate in the Cigna Medical Scheme (formerly Van Breda) for 50% of the cost of the contribution of active staff members for the defined type of coverage. The Organization subsidizes the remaining amount of the premium to be paid to the third party insurer. Membership of Cigna is compulsory for all new employees, although participation in the ASHI scheme after retirement is voluntary. Cigna is the main third party insurance provider for ASHI benefits; however, there are still a small number of retirees covered by the former insurer, BUPA.
106 Repatriation benefits consist of a repatriation grant lump sum, travel of the staff member and eligible dependants and shipment of their personal effects. The Organization pays the amounts due for repatriation grant, travel and relocation expenses for the entitled staff members.
107 The liabilities include the current service costs and the interest costs for 2016, less benefit payments made and, where applicable, plan participants’ contributions.
2.10.4: OTHER LONG-TERM EMPLOYEE BENEFITS
108 Other long-term employee benefits include accrued unused annual leave and, where applicable, compensation payments in the case of death, injury or illness attributable to performance of duties.
109 Although annual leave is a short-term employee benefit, the right to receive payment for unused annual leave and, consequently, the Organization’s liability for this balance, is shown as a long-term employee benefit as that right only crystallizes on separation, typically more than twelve months from the reporting date.
2.10.5: TERMINATION EMPLOYEE BENEFITS
110 Termination benefits include the expected costs the Organization will bear for the termination of the contract of an employee as per the detailed formal plan in place at the reporting date.
111 As at 31 December 2016, there are no formal plans, without reasonable possibility of withdrawal, to finish the employment of staff members who have not yet separated from the Organization. The employment of one staff member was terminated in November 2016, following the early termination of their probation period. At 31 December 2016, there was no legal obligation to pay compensation to this staff member and the case had not been brought before the UN tribunal.
IMO FINANCIAL STATEMENTS 2016
47
2.10.6: ACTUARIAL VALUATIONS OF POST-EMPLOYMENT AND OTHER SEPARATION RELATED BENEFITS
112 Liabilities arising from post-employment benefits and other long-term employee benefits (i.e. accrued unused annual leave) are determined by consulting actuaries using the Projected Unit Credit Method. These employee benefits are established for those staff members who are entitled to such benefits under the IMO Staff Regulations and Staff Rules. Actuarial valuations are typically undertaken every two years. However, in 2016, an interim actuarial valuation was prepared to reflect the effect of the changes due to the current economic situation on the actuarial assumptions used for the 2015 actuarial valuation. In addition, the actuarial valuation also considered the changes in the Organization’s Staff Regulations & Staff Rules (SR&SR) effective 1 July 2016.
2.10.6.1: ACTUARIAL ASSUMPTIONS AND METHODS
113 During each actuarial study, IMO, in conjunction with the actuary, reviews and selects assumptions that will be used by the actuaries in the year-end valuation to determine the expense and contribution requirements for IMO’s after-service benefit plans (post-employment benefits and unused accrued annual leave). For the 2016 valuation, the assumptions used are as described in the table below.
114 Actuarial assumptions are required to be disclosed in the financial statements in accordance with IPSAS 25. In addition, each actuarial assumption is required to be disclosed in absolute terms.
115 The following assumptions have been used to estimate the value of the post-employment and accrued unused annual leave employee liabilities for IMO as at 31 December 2016 based on the expenditure projections for the reporting period.

IMO FINANCIAL STATEMENTS 2016
48
GENERALBaseline Discount Rate 3.6% p.a. as of 31 December 2016
4.3% p.a. as of 31 December 2015
General Inflation 3.4% p.a. as of 31 December 2016
3.0% p.a. as of 31 December 2015
Accounting Expected Return on Assets Not applicable, no assets held
Mortality Pre-retirement: Age related scale, indicative rates for age 55 – 0.26% for males and 0.11% for females
Post-retirement: Age related scale, indicative rates at 31 December 2007 for age 65 => 0.61% male retirees and spouses and 0.46% female retirees and spouses
Post-retirement mortality improvement: For males the rates of improvement are 2% p.a. for those under 70, reducing to nil for those over 95. For females the rates of improvement are 2% p.a. for those under 60 reducing to nil for those over 90. Those rates of improvement are assumed to apply until 2033 (2014: assumed to apply until 2027)
Withdrawal Rates Vary according to age, gender and length of service, with different rates applying to professional and general service staff, in line with the assumptions used for the valuation of the UN Joint Staff Pension Fund as at 31 December 2013
Retirement Rates Vary according to age, gender and length of service, with different rates applying to professional and general service staff and staff joining before 1 January 1990, between 1 January 1990 and 1 January 2014 and after January 2014, in line with the assumptions used for the valuation of the UN Joint Staff Pension Fund as at 31 December 2013
Assumptions used to value the ASHI Scheme
Participation after retirement 95% of eligible members are assumed to continue coverage after retirement. It is assumed that coverage will not be dropped once elected
Spouses For current employees it is assumed that 60% will elect for coverage for their spouses at retirement. Males are assumed to be three years older than their spouse
Healthcare trend increases 31 December 2016: 5% pa fixed
31 December 2015: 5% pa fixed
Ageing increases 3.5% p.a. for those under 65, 2.5% p.a. for those between 65 and 70 reducing in five year age bands to nil for those over age 90
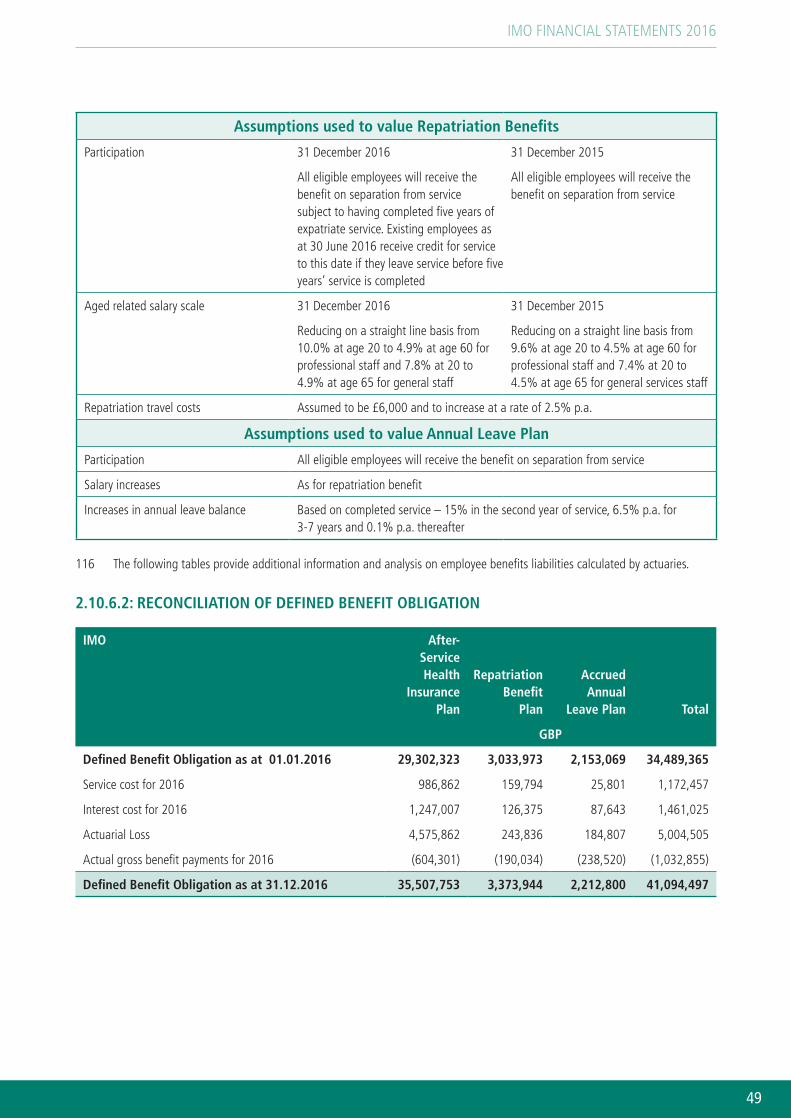
IMO FINANCIAL STATEMENTS 2016
49
Assumptions used to value Repatriation Benefits
Participation 31 December 2016
All eligible employees will receive the benefit on separation from service subject to having completed five years of expatriate service. Existing employees as at 30 June 2016 receive credit for service to this date if they leave service before five years’ service is completed
31 December 2015
All eligible employees will receive the benefit on separation from service
Aged related salary scale 31 December 2016
Reducing on a straight line basis from 10.0% at age 20 to 4.9% at age 60 for professional staff and 7.8% at 20 to 4.9% at age 65 for general staff
31 December 2015
Reducing on a straight line basis from 9.6% at age 20 to 4.5% at age 60 for professional staff and 7.4% at 20 to 4.5% at age 65 for general services staff
Repatriation travel costs Assumed to be £6,000 and to increase at a rate of 2.5% p.a.
Assumptions used to value Annual Leave Plan
Participation All eligible employees will receive the benefit on separation from service
Salary increases As for repatriation benefit
Increases in annual leave balance Based on completed service – 15% in the second year of service, 6.5% p.a. for 3-7 years and 0.1% p.a. thereafter
116 The following tables provide additional information and analysis on employee benefits liabilities calculated by actuaries.
2.10.6.2: RECONCILIATION OF DEFINED BENEFIT OBLIGATION
IMO After-Service Health
Insurance Plan
Repatriation Benefit
Plan
Accrued Annual
Leave Plan Total
GBP
Defined Benefit Obligation as at 01.01.2016 29,302,323 3,033,973 2,153,069 34,489,365
Service cost for 2016 986,862 159,794 25,801 1,172,457
Interest cost for 2016 1,247,007 126,375 87,643 1,461,025
Actuarial Loss 4,575,862 243,836 184,807 5,004,505
Actual gross benefit payments for 2016 (604,301) (190,034) (238,520) (1,032,855)
Defined Benefit Obligation as at 31.12.2016 35,507,753 3,373,944 2,212,800 41,094,497

IMO FINANCIAL STATEMENTS 2016
50
2.10.6.3: ANNUAL EXPENSE AND CHANGES IN NET ASSETS FOR CALENDAR YEAR 2016
IMO After-Service Health
Insurance Plan
Repatriation Benefit
Plan
Accrued Annual
Leave Plan Total
GBP
Service cost 986,862 159,794 25,801 1,172,457
Interest cost 1,247,007 126,375 87,643 1,461,025
Actuarial Loss 4,575,862 243,836 184,807 5,004,505
Total Expense recognized in 2016 6,809,731 530,005 298,251 7,637,987
117 Actuarial gains and losses are recognised through the statement on Changes in Net Assets while service costs and interest costs are included as part of “Staff and Other Personnel Costs”.
118 None of the employee benefits liabilities associated with WMU and IMLI have been subject to actuarial estimate, and consequently the table above reflects both the IMO and consolidated positions.
2.10.6.4: SUMMARY OF PRIOR YEAR AMOUNTS
119 The cumulative amount presented in the statement of changes in net assets/equity is that generated as a result of the actuarial valuation carried out in 2016.
IMO After-Service Health
Insurance Plan
Repatriation Benefit
Plan
Accrued Annual
Leave Plan Total
GBP
Actuarial Losses/(Gains) as at 01.01.2016 4,022,515 (321,096) 1,150,641 4,852,060
Actuarial Losses in 2016 4,575,862 243,836 184,807 5,004,505
Actuarial Losses/(Gains) as at 31.12.2016 8,598,377 (77,260) 1,335,448 9,856,565
120 Actuarial gains and losses comprise experience adjustments for the difference between the previous actuarial assumptions and what actually happened; and the effects of changes in actuarial assumptions.
121 The primary contributory factor in the actuarial loss for 2016 is the change in assumptions made for the discount rate. In 2015 the discount rate used was 4.3% p.a., while in 2016, the rate decreased to 3.6% p.a.. In addition, the increase in the assumption on the general inflation rate from 3.0% p.a. to 3.4% p.a. also contributed to some extent to the actuarial loss generated in the reporting year.

IMO FINANCIAL STATEMENTS 2016
51
IMO 31.12.2016 31.12.2015 31.12.2014 31.12.2013 31.12.2012
ASHI GBP
Present Value of Defined Benefit Obligation 35,507,753 29,302,323 30,633,564 28,868,716 25,687,867
Experience (gain) on Scheme Liabilities – (5,217,624) – (1,079,154) –
Loss on changes in assumptions used to value Scheme liabilities
4,575,862 2,088,192 – 2,805,279 –
IMO 31.12.2016 31.12.2015 31.12.2014 31.12.2013 31.12.2012
Repatriation GBP
Present Value of Defined Benefit Obligation 3,373,944 3,033,973 2,615,211 2,829,918 2,728,950
Experience loss on Scheme Liabilities – 425,584 – 18,337 –
Loss/(gain) on changes in assumptions used to value Scheme liabilities
243,836 (27,974) – (20,929) –
IMO 31.12.2016 31.12.2015 31.12.2014 31.12.2013 31.12.2012
Annual Leave GBP
Present Value of Defined Benefit Obligation 2,212,800 2,153,069 1,364,362 1,394,357 1,405,111
Experience loss on Scheme Liabilities – 991,945 – 134,775 –
Loss/(gain)on changes in assumptions used to value Scheme liabilities
184,807 1,322 – (4,807) –
IMO 31.12.2016 31.12.2015 31.12.2014 31.12.2013 31.12.2012
Total GBP
Present Value of Defined Benefit Obligation 41,094,497 34,489,365 34,613,137 33,092,991 29,821,928
Experience (gains) on Scheme Liabilities – (3,800,095) – (926,042) –
Loss on changes in assumptions used to value Scheme liabilities
5,004,505 2,061,540 – 2,779,543 –
2.10.6.5: SENSITIVITY ANALYSIS
122 Two of the principal assumptions in the valuation of the long-term employee benefit plans are: i) the discount rate used to determine the present value of benefits that will be paid from the plan in the future; and ii) for the ASHI plan, the rate at which medical costs are expected to increase in the future.
123 The obligations were valued based on a discount rate of 3.6% as of 31 December 2016. The table below shows the effect of a one point percentage change in the discount rate as of 31 December 2016.
After Service Health Insurance Plan
Repatriation Benefit Plan
Accrued Annual Leave Plan
%
%+1 (7,100,000) (200,000) (200,000)
%-1 9,900,000 300,000 200,000

IMO FINANCIAL STATEMENTS 2016
52
124 Similarly, a sensitivity analysis was undertaken to determine the impact of changes in assumptions on future healthcare cost. The change in the ASHI obligation due to a one per cent change in the trend rate is presented below.
1% increase
1% decrease
2016 2016
Effect on the aggregate of the service cost and interest cost 700,000 (500,000)
Effect on defined benefit obligation 9,300,000 (6,900,000)
2.10.6.6: EXPECTED COSTS DURING 2017
125 The expected contribution of IMO in 2017 to the defined benefits plans is £1,047,427 (2016 estimate: £1,155,000). This has been derived from the 2016 paid figures with the ASHI payments unchanged for 2017 and the repatriation and annual leave payments increasing in line with general inflation.
2.10.7: UNITED NATIONS JOINT STAFF PENSION FUND
126 The Fund’s Regulations state that the Pension Board shall have an actuarial valuation made of the Fund at least once every three years by the Consulting Actuary. The practice of the Pension Board has been to carry out an actuarial valuation every two years using the Open Group Aggregate Method. The primary purpose of the actuarial valuation is to determine whether the current and estimated future assets of the Pension Fund will be sufficient to meet its liabilities.
127 IMO’s financial obligation to the UNJSPF consists of its mandated contribution, at the rate established by the United Nations General Assembly (currently at 7.9% for participants and 15.8% for member organizations) together with any share of any actuarial deficiency payments under Article 26 of the Regulations of the Fund. Such deficiency payments are only payable if and when the United Nations General Assembly has invoked the provision of Article 26, following determination that there is a requirement for deficiency payments based on an assessment of the actuarial sufficiency of the Fund as of the valuation date. Each member organization shall contribute to this deficiency an amount proportionate to the total contributions which each paid during the three years preceding the valuation date.
128 The actuarial valuation performed as of 31 December 2015 revealed an actuarial surplus of 0.16% (a deficit of 0.72% in the 2013 valuation) of pensionable remuneration, implying that the theoretical contribution rate required to achieve balance as of 31 December 2015 was 23.54% of pensionable remuneration, compared to the actual contribution rate of 23.70%. The next actuarial valuation will be conducted as of 31 December 2017.
129 At 31 December 2015, the funded ratio of actuarial assets to actuarial liabilities, assuming no future pension adjustments, was 141.1% (127.5% in the 2013 valuation). The funded ratio was 100.9% (91.2% in the 2013 valuation) when the current system of pension adjustments was taken into account.
130 After assessing the actuarial sufficiency of the Fund, the Consulting Actuary concluded that there was no requirement, as of 31 December 2015, for deficiency payments under Article 26 of the Regulations of the Fund as the actuarial value of assets exceeded the actuarial value of all accrued liabilities under the Fund. In addition, the market value of assets also exceeded the actuarial value of all accrued liabilities as of the valuation date. At the time of this report, the General Assembly has not invoked the provision of Article 26.
131 During 2016, IMO’s contributions paid to UNJSPF amounted to £5,654,995 (2015: £5,182,986). The Organization’s contributions on behalf of staff members amounted to £3,769,997 (2015: £3,455,324). Expected contributions due in 2017 are £3,898,000.
132 The United Nations Board of Auditors carries out an annual audit of the UNJSPF and reports to the UNJSPF Pension Board on the audit every year. The UNJSPF publishes quarterly reports on its investments and these can be viewed by visiting the UNJSPF at www.unjspf.org.
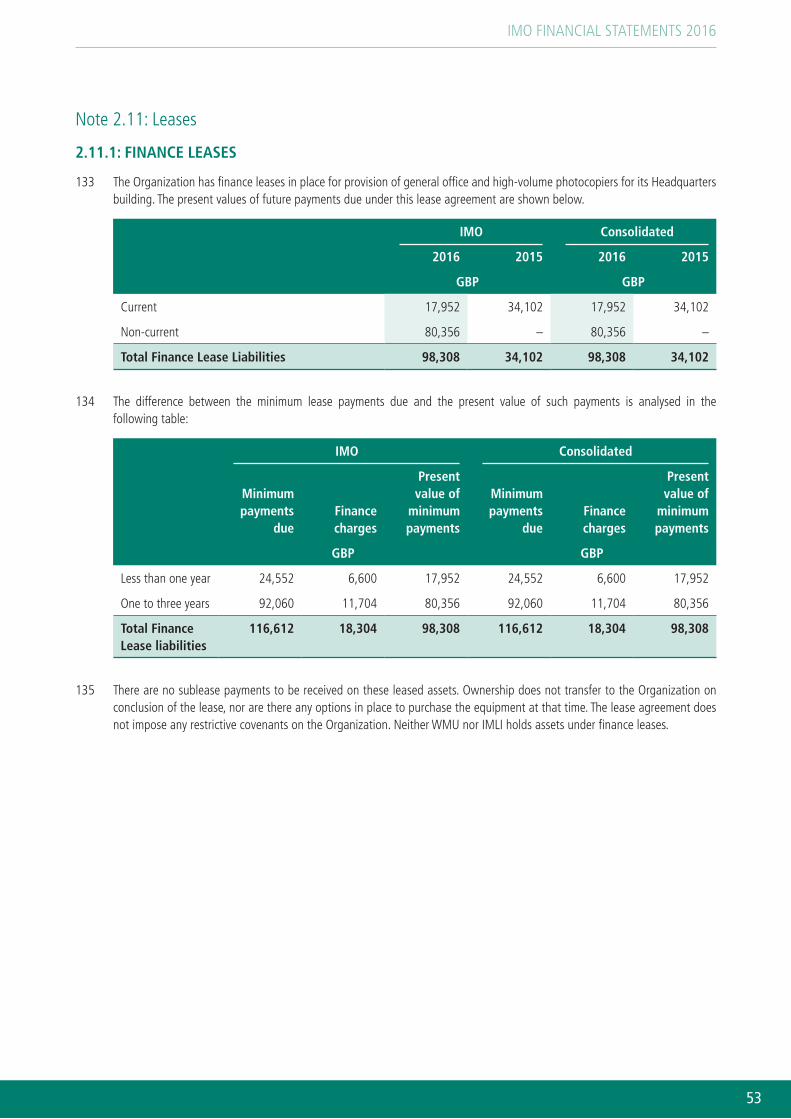
IMO FINANCIAL STATEMENTS 2016
53
Note 2.11: Leases
2.11.1: FINANCE LEASES
133 The Organization has finance leases in place for provision of general office and high-volume photocopiers for its Headquarters building. The present values of future payments due under this lease agreement are shown below.
IMO Consolidated
2016 2015 2016 2015
GBP GBP
Current 17,952 34,102 17,952 34,102
Non-current 80,356 – 80,356 –
Total Finance Lease Liabilities 98,308 34,102 98,308 34,102
134 The difference between the minimum lease payments due and the present value of such payments is analysed in the following table:
IMO Consolidated
Minimum payments
dueFinance charges
Present value of
minimum payments
Minimum payments
dueFinance charges
Present value of
minimum payments
GBP GBP
Less than one year 24,552 6,600 17,952 24,552 6,600 17,952
One to three years 92,060 11,704 80,356 92,060 11,704 80,356
Total Finance Lease liabilities
116,612 18,304 98,308 116,612 18,304 98,308
135 There are no sublease payments to be received on these leased assets. Ownership does not transfer to the Organization on conclusion of the lease, nor are there any options in place to purchase the equipment at that time. The lease agreement does not impose any restrictive covenants on the Organization. Neither WMU nor IMLI holds assets under finance leases.
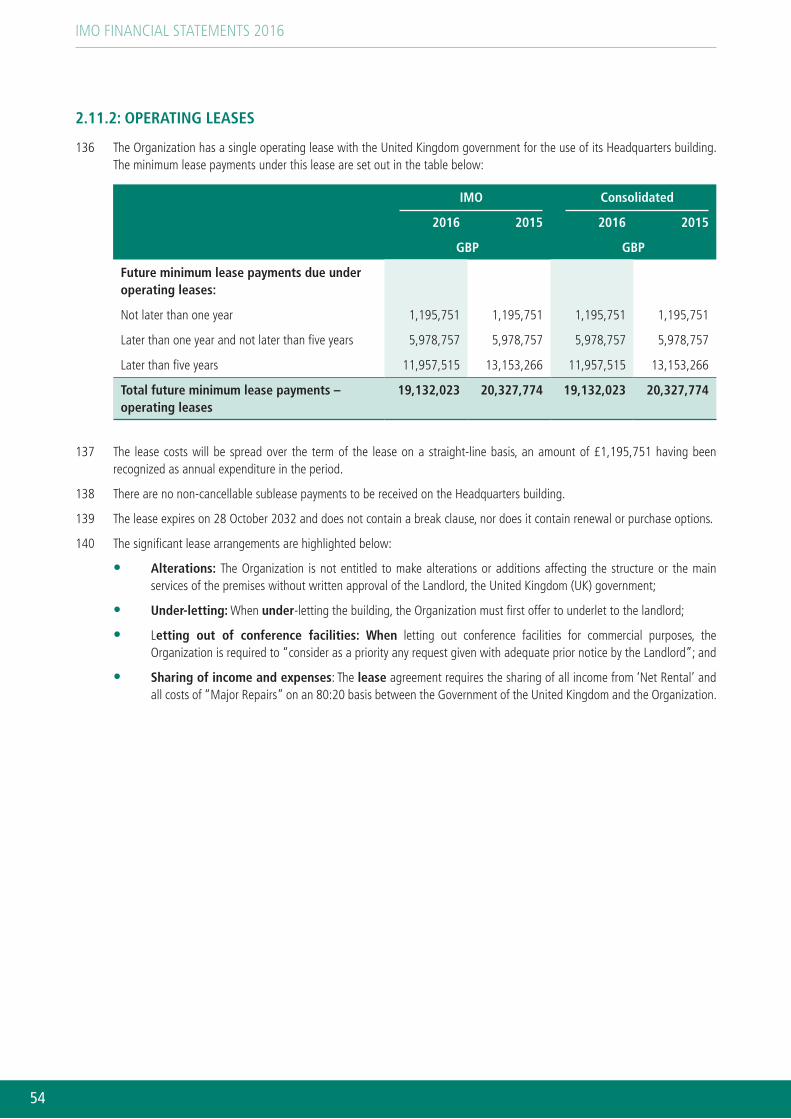
IMO FINANCIAL STATEMENTS 2016
54
2.11.2: OPERATING LEASES
136 The Organization has a single operating lease with the United Kingdom government for the use of its Headquarters building. The minimum lease payments under this lease are set out in the table below:
IMO Consolidated
2016 2015 2016 2015
GBP GBP
Future minimum lease payments due under operating leases:
Not later than one year 1,195,751 1,195,751 1,195,751 1,195,751
Later than one year and not later than five years 5,978,757 5,978,757 5,978,757 5,978,757
Later than five years 11,957,515 13,153,266 11,957,515 13,153,266
Total future minimum lease payments – operating leases
19,132,023 20,327,774 19,132,023 20,327,774
137 The lease costs will be spread over the term of the lease on a straight-line basis, an amount of £1,195,751 having been recognized as annual expenditure in the period.
138 There are no non-cancellable sublease payments to be received on the Headquarters building.
139 The lease expires on 28 October 2032 and does not contain a break clause, nor does it contain renewal or purchase options.
140 The significant lease arrangements are highlighted below:
• Alterations: The Organization is not entitled to make alterations or additions affecting the structure or the main services of the premises without written approval of the Landlord, the United Kingdom (UK) government;
• Under-letting: When under-letting the building, the Organization must first offer to underlet to the landlord;
• Letting out of conference facilities: When letting out conference facilities for commercial purposes, the Organization is required to “consider as a priority any request given with adequate prior notice by the Landlord”; and
• Sharing of income and expenses: The lease agreement requires the sharing of all income from ‘Net Rental’ and all costs of “Major Repairs” on an 80:20 basis between the Government of the United Kingdom and the Organization.
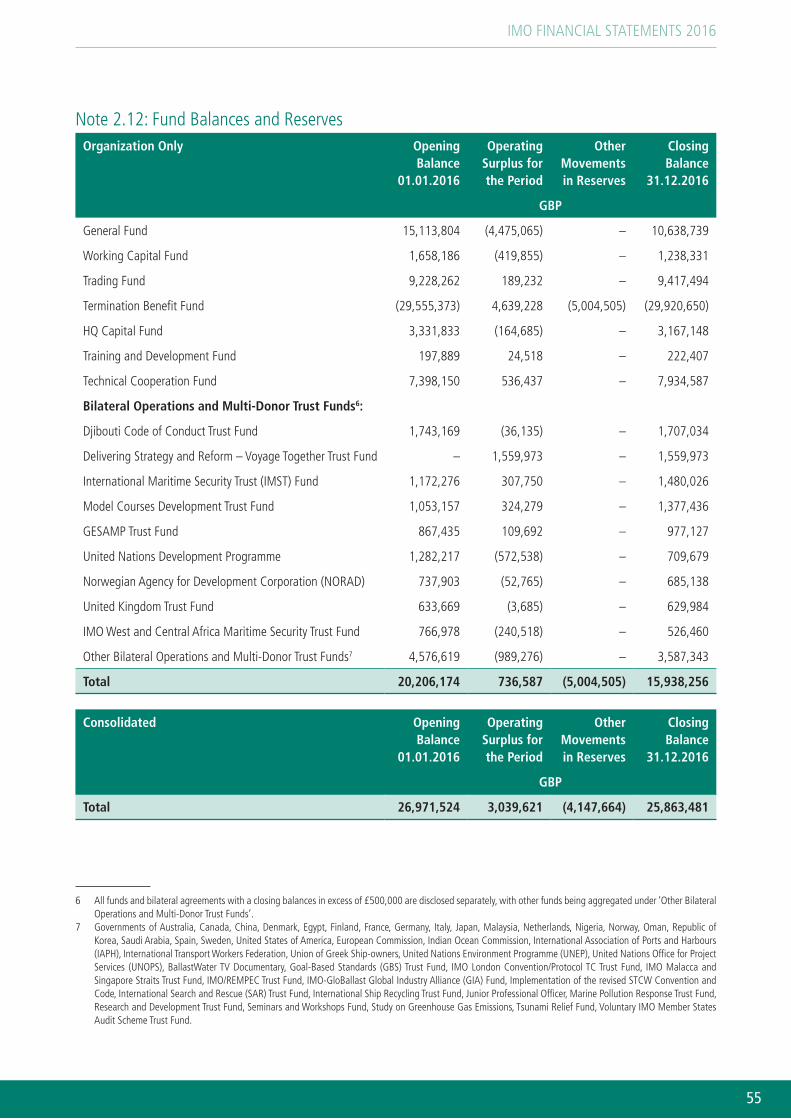
IMO FINANCIAL STATEMENTS 2016
55
Note 2.12: Fund Balances and ReservesOrganization Only Opening
Balance 01.01.2016
Operating Surplus for the Period
Other Movements in Reserves
Closing Balance
31.12.2016
GBP
General Fund 15,113,804 (4,475,065) – 10,638,739
Working Capital Fund 1,658,186 (419,855) – 1,238,331
Trading Fund 9,228,262 189,232 – 9,417,494
Termination Benefit Fund (29,555,373) 4,639,228 (5,004,505) (29,920,650)
HQ Capital Fund 3,331,833 (164,685) – 3,167,148
Training and Development Fund 197,889 24,518 – 222,407
Technical Cooperation Fund 7,398,150 536,437 – 7,934,587
Bilateral Operations and Multi-Donor Trust Funds6:
Djibouti Code of Conduct Trust Fund 1,743,169 (36,135) – 1,707,034
Delivering Strategy and Reform – Voyage Together Trust Fund – 1,559,973 – 1,559,973
International Maritime Security Trust (IMST) Fund 1,172,276 307,750 – 1,480,026
Model Courses Development Trust Fund 1,053,157 324,279 – 1,377,436
GESAMP Trust Fund 867,435 109,692 – 977,127
United Nations Development Programme 1,282,217 (572,538) – 709,679
Norwegian Agency for Development Corporation (NORAD) 737,903 (52,765) – 685,138
United Kingdom Trust Fund 633,669 (3,685) – 629,984
IMO West and Central Africa Maritime Security Trust Fund 766,978 (240,518) – 526,460
Other Bilateral Operations and Multi-Donor Trust Funds7 4,576,619 (989,276) – 3,587,343
Total 20,206,174 736,587 (5,004,505) 15,938,256
Consolidated Opening Balance
01.01.2016
Operating Surplus for the Period
Other Movements in Reserves
Closing Balance
31.12.2016
GBP
Total 26,971,524 3,039,621 (4,147,664) 25,863,481
6 All funds and bilateral agreements with a closing balances in excess of £500,000 are disclosed separately, with other funds being aggregated under ‘Other Bilateral Operations and Multi-Donor Trust Funds’.
7 Governments of Australia, Canada, China, Denmark, Egypt, Finland, France, Germany, Italy, Japan, Malaysia, Netherlands, Nigeria, Norway, Oman, Republic of Korea, Saudi Arabia, Spain, Sweden, United States of America, European Commission, Indian Ocean Commission, International Association of Ports and Harbours (IAPH), International Transport Workers Federation, Union of Greek Ship-owners, United Nations Environment Programme (UNEP), United Nations Office for Project Services (UNOPS), BallastWater TV Documentary, Goal-Based Standards (GBS) Trust Fund, IMO London Convention/Protocol TC Trust Fund, IMO Malacca and Singapore Straits Trust Fund, IMO/REMPEC Trust Fund, IMO-GloBallast Global Industry Alliance (GIA) Fund, Implementation of the revised STCW Convention and Code, International Search and Rescue (SAR) Trust Fund, International Ship Recycling Trust Fund, Junior Professional Officer, Marine Pollution Response Trust Fund, Research and Development Trust Fund, Seminars and Workshops Fund, Study on Greenhouse Gas Emissions, Tsunami Relief Fund, Voluntary IMO Member States Audit Scheme Trust Fund.
IMO FINANCIAL STATEMENTS 2016
56
141 The Organization maintains separate accounts for each Fund, which are combined into eight groups for reporting purposes as set out above.
142 The General Fund was established for the purpose of accounting for the expenditure of the Organization.
143 The Working Capital Fund was originally established as a USD based Fund by Assembly resolution A.19(I) and was converted to sterling with effect from 1 January 1988 by Assembly resolution A.633(15)B. The purpose of the Fund is to make advances, if necessary, to finance the budgetary appropriations of the Regular Budget to cover temporary cash flow deficits. Assembly resolution A.1039 (27) further authorized the Secretary-General to use the fund as a reserve to account for currency gains or losses in the regular budget arising from differences between the United Nations operational rate of exchange and the rate against the pound sterling adopted for calculation of the appropriation. It also authorises the Secretary-General to advance such sums from the Working Capital Fund as may be necessary to meet unforeseen or extraordinary expenses arising during the biennium, with the prior agreement of the Council, provided that such expenses are of a clearly exceptional nature and relate specifically to the Strategic and High-level Action plans of the Organization and that the Council is assured that the relevant expenditure cannot be met by appropriate transfer action within the total budget approved for a calendar year.
144 The Printing Fund was established with effect from 1 January 1966 by Assembly resolution A.100(IV) to provide for the production and sales of IMO publications, being subsequently replaced by the Trading Fund through Assembly resolution A.1014(26), broadening its terms of reference to encompass the Organization’s current commercial activities.
145 The Termination Benefit Fund was established with effect from 1 January 1996 by Assembly resolution A.837(19) at an initial level of £900,000 to meet the costs associated with termination benefits to staff of the Organization. The scope of the Fund was widened to allow the financing of the additional costs of temporary assistance required to replace staff on long-term sick leave. From 2012 it was further widened to accommodate long-term employee benefit liabilities previously allocated among all Funds on the basis of headcount.
146 The Technical Cooperation Fund was originally established with effect from 1 January 1986 by Assembly resolution A.593(14) as a USD based fund, the interest income from which was used to assist the Technical Cooperation Programme of the Organization in accordance with the proposal supported by the Assembly in biennial budgets. The Fund was converted to a sterling based fund with effect from 1 January 1996 by Assembly resolution A.837(19). By that resolution, the scope of the Fund was widened to enable funds to be drawn down and applied to technical cooperation activities.
147 The Headquarters Capital Fund was established with effect from 1 January 1994 by Assembly resolution A.778(18) to meet the capital expenditure necessary for the efficient operation of the Organization and for fulfilling the Organization’s liabilities under the terms of the Lease for the Headquarters building between the Organization and the Government of the United Kingdom. The scope of the Headquarters Capital Fund was widened to include expenditure on the design, installation and implementation of office automation systems, including training on these systems.
148 The Training and Development Fund was established with effect from 1 January 2002 by Assembly resolution A.906(22) at an initial level of £200,000 by a transfer from the surplus of the then Printing Fund as at 1 January 2002 for organizational strengthening initiatives.
149 Trust Funds are established to account for the expenditures related to the activities financed from the respective donors. Fund balances represent the unexpended portion of contributions that are intended to be utilized in future operational requirements consistent with the Terms of Reference of the Fund. These constitute IMO’s residual interest in the assets after deducting all its liabilities.
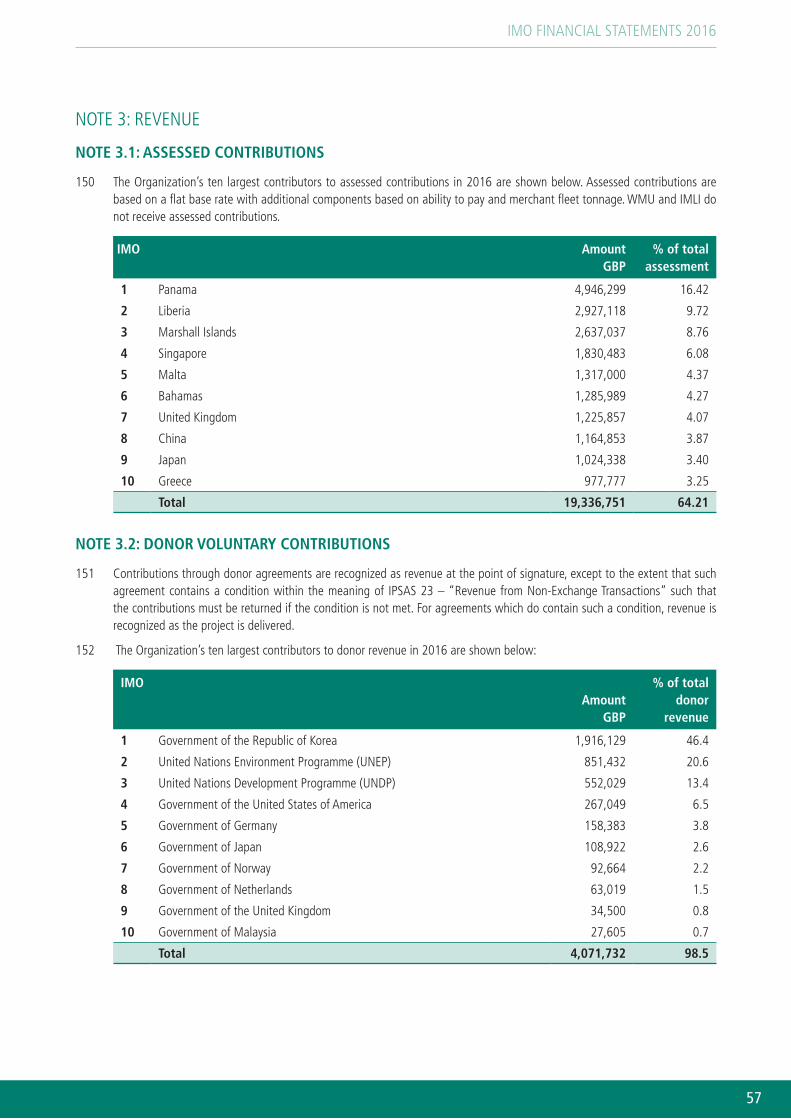
IMO FINANCIAL STATEMENTS 2016
57
NOTE 3: REVENUE
NOTE 3.1: ASSESSED CONTRIBUTIONS
150 The Organization’s ten largest contributors to assessed contributions in 2016 are shown below. Assessed contributions are based on a flat base rate with additional components based on ability to pay and merchant fleet tonnage. WMU and IMLI do not receive assessed contributions.
IMO Amount GBP
% of total assessment
1 Panama 4,946,299 16.42
2 Liberia 2,927,118 9.72
3 Marshall Islands 2,637,037 8.76
4 Singapore 1,830,483 6.08
5 Malta 1,317,000 4.37
6 Bahamas 1,285,989 4.27
7 United Kingdom 1,225,857 4.07
8 China 1,164,853 3.87
9 Japan 1,024,338 3.40
10 Greece 977,777 3.25
Total 19,336,751 64.21
NOTE 3.2: DONOR VOLUNTARY CONTRIBUTIONS
151 Contributions through donor agreements are recognized as revenue at the point of signature, except to the extent that such agreement contains a condition within the meaning of IPSAS 23 – “Revenue from Non-Exchange Transactions” such that the contributions must be returned if the condition is not met. For agreements which do contain such a condition, revenue is recognized as the project is delivered.
152 The Organization’s ten largest contributors to donor revenue in 2016 are shown below:
IMOAmount
GBP
% of total donor
revenue
1 Government of the Republic of Korea 1,916,129 46.4
2 United Nations Environment Programme (UNEP) 851,432 20.6
3 United Nations Development Programme (UNDP) 552,029 13.4
4 Government of the United States of America 267,049 6.5
5 Government of Germany 158,383 3.8
6 Government of Japan 108,922 2.6
7 Government of Norway 92,664 2.2
8 Government of Netherlands 63,019 1.5
9 Government of the United Kingdom 34,500 0.8
10 Government of Malaysia 27,605 0.7
Total 4,071,732 98.5

IMO FINANCIAL STATEMENTS 2016
58
The consolidated group’s ten largest contributors to donor revenue in 2016 are shown below:
ConsolidatedAmount
GBP
% of total donor
revenue
1 Government of Sweden 2,181,049 26.7
2 Government of the Republic of Korea 2,133,935 26.1
3 United Nations Environment Programme (UNEP) 851,432 10.4
4 Nippon Foundation 694,874 8.5
5 European Commission 585,150 7.2
6 United Nations Development Programme (UNDP) 552,029 6.7
7 Government of the United States of America 267,049 3.3
8 Government of Germany 158,383 1.9
9 Government of India 109,251 1.3
10 Government of Japan 108,922 1.3
Total 7,642,074 93.4
NOTE 3.3: COMMERCIAL ACTIVITIES
153 Key commercial revenue streams for the Organization and the consolidated group are shown below:
IMO Consolidated
2016 2015 2016 2015
GBP GBP GBP GBP
Publication Sales 12,319,895 11,602,999 12,319,024 11,601,505
Cafeteria Sales 699,724 759,486 699,724 768,357
Assessment fees 255,402 153,612 255,402 153,612
Letting of conference facilities and other commercial revenue
171,911 3,807 1,331,774 912,780
Total 13,446,932 12,519,904 14,605,924 13,436,254

IMO FINANCIAL STATEMENTS 2016
59
154 The major components of IMO Publication Sales are shown below:
IMO
2016 2015
GBP GBP
Sale of physical publications 10,892,893 10,238,784
Electronic publications 563,449 487,333
Royalties 495,526 534,809
Subscriptions 194,491 168,669
Model Courses 116,167 142,313
Other publications 57,369 31,091
Total 12,319,895 11,602,999
NOTE 3.4: FELLOWSHIPS
155 Both WMU and IMLI receive funds for fellowships to support students. IMO does not receive such revenue, and consequently the consolidated figures only are shown. The five largest aggregate contributors are listed below:
Consolidated
2016
% of total fellowship
revenue
GBP
1 The Nippon Foundation 1,075,313 23.2
2 Transport Education Training Authority (TETA) 269,962 5.8
3 Government of China 246,647 5.3
4 International Transport Workers’ Federation (ITF) 183,977 4.0
5 The TK Foundation 173,905 3.7
Total 1,949,804 42.0
NOTE 3.5: OTHER REVENUE
156 The most significant sources of other revenue are set out below:
IMO Consolidated
2016 2015 2016 2015
GBP GBP GBP GBP
Interest earned on investment of funds 231,749 222,078 269,504 258,180
Sub-letting of office space – 25,881 14,553 33,166
Other revenue 54,039 32,337 412,693 781,344
Total 285,788 280,296 696,750 1,072,690

IMO FINANCIAL STATEMENTS 2016
60
NOTE 4: EXPENDITURE IMO Consolidated
2016 2015 2016 2015
GBP GBP GBP GBP
4.1 Staff and other personnel costs
Professional and general service staff, experts 26,261,440 25,791,510 31,784,886 30,425,477
Appointment and separation 2,379,153 2,473,539 2,494,616 2,511,292
Termination benefit 27,322 36,300 27,322 36,301
Consultants 1,684,999 1,600,892 2,246,940 2,193,075
Temporary assistance 1,205,368 987,431 1,235,953 1,050,834
Meetings personnel (interpreters, translators, temporary employees)
866,532 862,822 866,532 862,822
Total staff and other personnel costs 32,424,814 31,752,494 38,656,249 37,079,801
4.2 Travel expenses
Fares 1,175,193 926,514 1,418,499 1,143,534
Daily Subsistence Allowance (DSA) and other expenses 970,044 758,819 1,192,424 911,873
Total travel expenses 2,145,237 1,685,333 2,610,923 2,055,407
4.3 Supplies, consumables and other running costs
Office supplies and consumables 131,662 113,970 173,403 153,812
Telecommunications and information technology 1,127,103 1,150,008 1,327,297 1,261,349
Rent, rates and insurance 1,435,961 1,409,949 1,480,791 1,469,537
Utilities 556,914 510,729 603,248 552,128
Medical costs 16,820 23,423 16,820 23,423
Library books, magazines, subscriptions 30,192 29,300 202,527 201,238
Hospitality 31,636 50,460 151,783 163,580
Vehicle, local transport and hotel accommodation 46,215 37,560 53,556 55,731
Postage, telephone and freight 369,099 367,247 432,496 426,555
Equipment, furniture and local procurement 870,162 849,637 854,221 800,327
Building maintenance 1,198,487 1,098,678 1,203,163 1,102,262
Other operational costs – – 215,527 282,398
Total supplies, consumables and other running costs
5,814,251 5,640,961 6,714,832 6,492,340
4.4 Costs related to trading activities
Cost of Sales IMO Publications 1,019,209 874,068 1,019,209 874,068
Cost of Sales Model courses 30,797 29,146 30,797 29,146
(Gain)/loss on Physical Inventory (1,717) 2,318 (1,717) 2,318
Publications issued free of charge 27,604 25,703 27,604 25,703
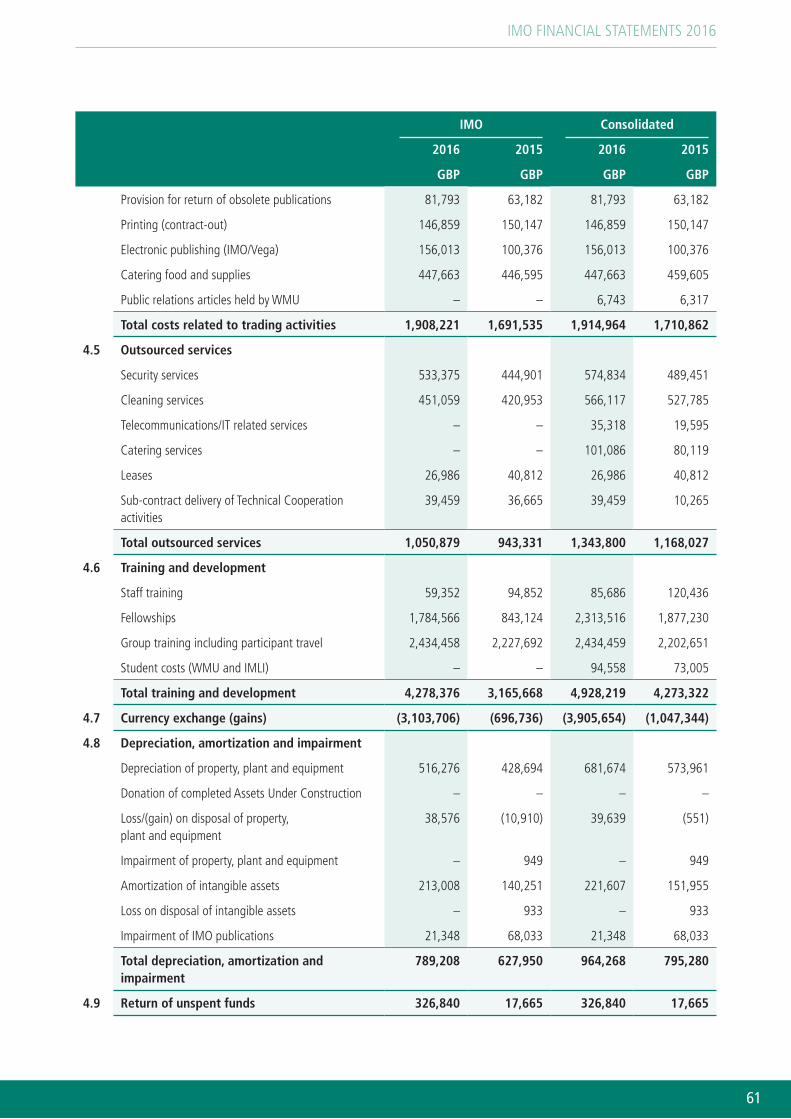
IMO FINANCIAL STATEMENTS 2016
61
IMO Consolidated
2016 2015 2016 2015
GBP GBP GBP GBP
Provision for return of obsolete publications 81,793 63,182 81,793 63,182
Printing (contract-out) 146,859 150,147 146,859 150,147
Electronic publishing (IMO/Vega) 156,013 100,376 156,013 100,376
Catering food and supplies 447,663 446,595 447,663 459,605
Public relations articles held by WMU – – 6,743 6,317
Total costs related to trading activities 1,908,221 1,691,535 1,914,964 1,710,862
4.5 Outsourced services
Security services 533,375 444,901 574,834 489,451
Cleaning services 451,059 420,953 566,117 527,785
Telecommunications/IT related services – – 35,318 19,595
Catering services – – 101,086 80,119
Leases 26,986 40,812 26,986 40,812
Sub-contract delivery of Technical Cooperation activities
39,459 36,665 39,459 10,265
Total outsourced services 1,050,879 943,331 1,343,800 1,168,027
4.6 Training and development
Staff training 59,352 94,852 85,686 120,436
Fellowships 1,784,566 843,124 2,313,516 1,877,230
Group training including participant travel 2,434,458 2,227,692 2,434,459 2,202,651
Student costs (WMU and IMLI) – – 94,558 73,005
Total training and development 4,278,376 3,165,668 4,928,219 4,273,322
4.7 Currency exchange (gains) (3,103,706) (696,736) (3,905,654) (1,047,344)
4.8 Depreciation, amortization and impairment
Depreciation of property, plant and equipment 516,276 428,694 681,674 573,961
Donation of completed Assets Under Construction – – – –
Loss/(gain) on disposal of property, plant and equipment
38,576 (10,910) 39,639 (551)
Impairment of property, plant and equipment – 949 – 949
Amortization of intangible assets 213,008 140,251 221,607 151,955
Loss on disposal of intangible assets – 933 – 933
Impairment of IMO publications 21,348 68,033 21,348 68,033
Total depreciation, amortization and impairment
789,208 627,950 964,268 795,280
4.9 Return of unspent funds 326,840 17,665 326,840 17,665
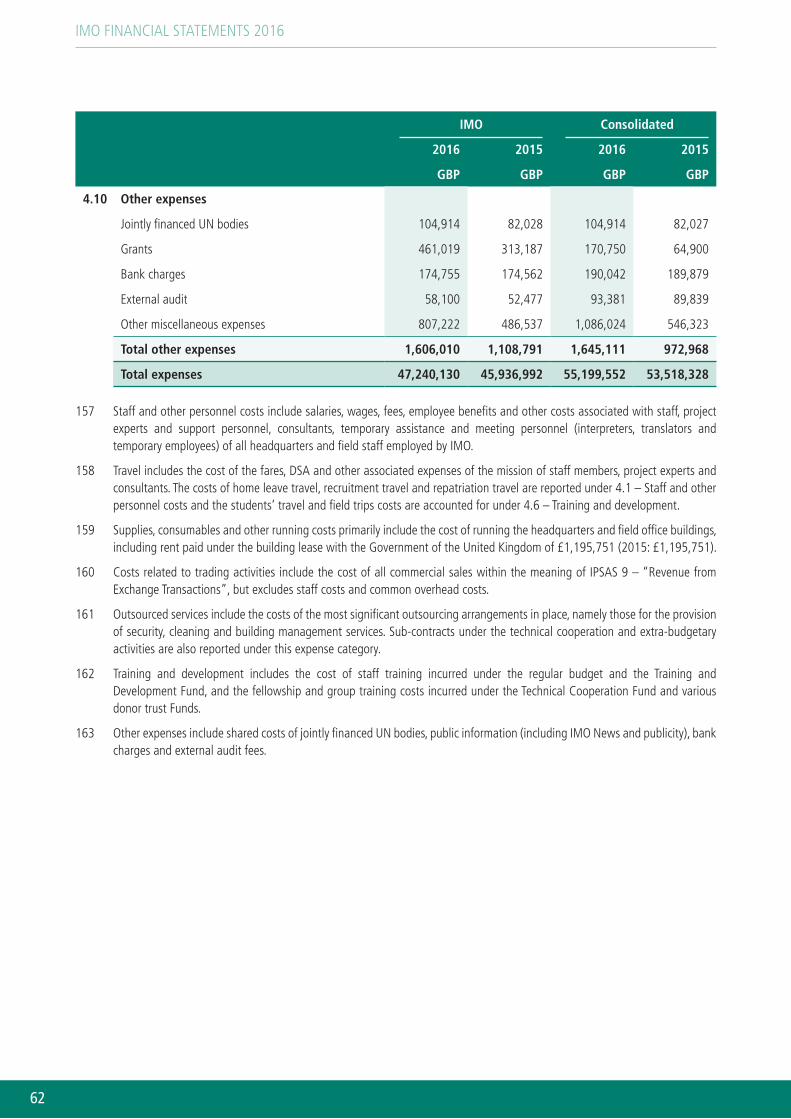
IMO FINANCIAL STATEMENTS 2016
62
IMO Consolidated
2016 2015 2016 2015
GBP GBP GBP GBP
4.10 Other expenses
Jointly financed UN bodies 104,914 82,028 104,914 82,027
Grants 461,019 313,187 170,750 64,900
Bank charges 174,755 174,562 190,042 189,879
External audit 58,100 52,477 93,381 89,839
Other miscellaneous expenses 807,222 486,537 1,086,024 546,323
Total other expenses 1,606,010 1,108,791 1,645,111 972,968
Total expenses 47,240,130 45,936,992 55,199,552 53,518,328
157 Staff and other personnel costs include salaries, wages, fees, employee benefits and other costs associated with staff, project experts and support personnel, consultants, temporary assistance and meeting personnel (interpreters, translators and temporary employees) of all headquarters and field staff employed by IMO.
158 Travel includes the cost of the fares, DSA and other associated expenses of the mission of staff members, project experts and consultants. The costs of home leave travel, recruitment travel and repatriation travel are reported under 4.1 – Staff and other personnel costs and the students’ travel and field trips costs are accounted for under 4.6 – Training and development.
159 Supplies, consumables and other running costs primarily include the cost of running the headquarters and field office buildings, including rent paid under the building lease with the Government of the United Kingdom of £1,195,751 (2015: £1,195,751).
160 Costs related to trading activities include the cost of all commercial sales within the meaning of IPSAS 9 – “Revenue from Exchange Transactions”, but excludes staff costs and common overhead costs.
161 Outsourced services include the costs of the most significant outsourcing arrangements in place, namely those for the provision of security, cleaning and building management services. Sub-contracts under the technical cooperation and extra-budgetary activities are also reported under this expense category.
162 Training and development includes the cost of staff training incurred under the regular budget and the Training and Development Fund, and the fellowship and group training costs incurred under the Technical Cooperation Fund and various donor trust Funds.
163 Other expenses include shared costs of jointly financed UN bodies, public information (including IMO News and publicity), bank charges and external audit fees.
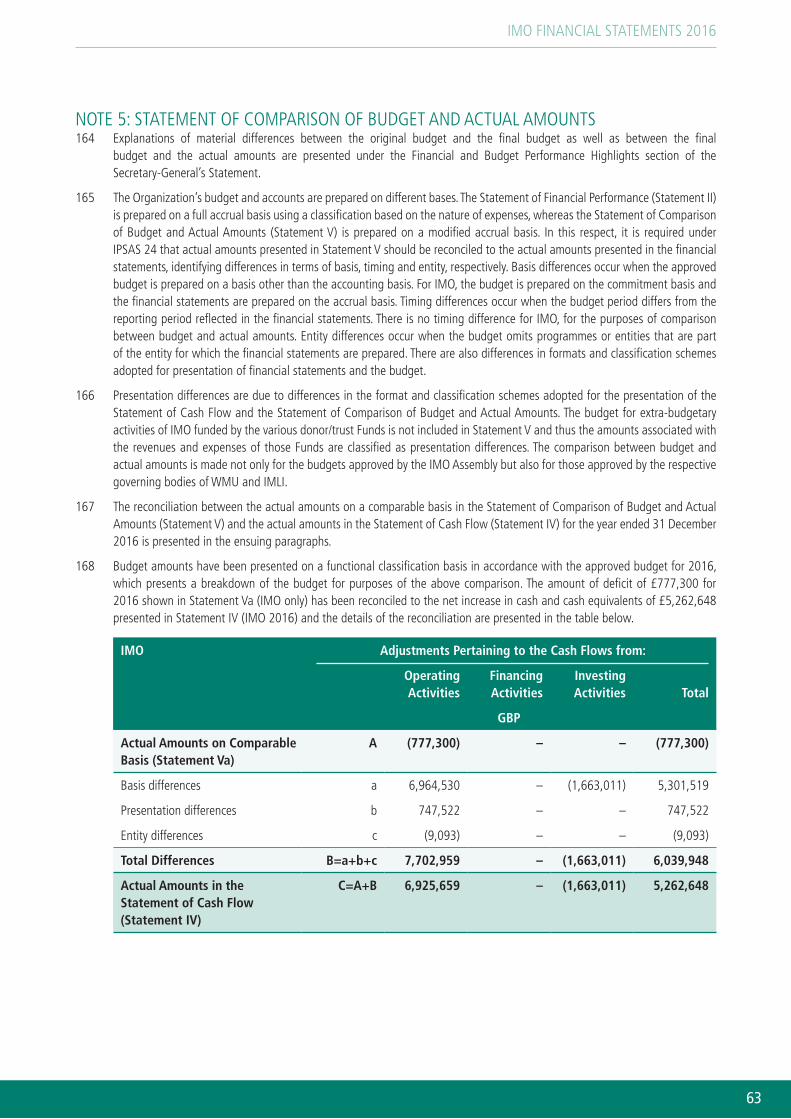
IMO FINANCIAL STATEMENTS 2016
63
NOTE 5: STATEMENT OF COMPARISON OF BUDGET AND ACTUAL AMOUNTS 164 Explanations of material differences between the original budget and the final budget as well as between the final
budget and the actual amounts are presented under the Financial and Budget Performance Highlights section of the Secretary-General’s Statement.
165 The Organization’s budget and accounts are prepared on different bases. The Statement of Financial Performance (Statement II) is prepared on a full accrual basis using a classification based on the nature of expenses, whereas the Statement of Comparison of Budget and Actual Amounts (Statement V) is prepared on a modified accrual basis. In this respect, it is required under IPSAS 24 that actual amounts presented in Statement V should be reconciled to the actual amounts presented in the financial statements, identifying differences in terms of basis, timing and entity, respectively. Basis differences occur when the approved budget is prepared on a basis other than the accounting basis. For IMO, the budget is prepared on the commitment basis and the financial statements are prepared on the accrual basis. Timing differences occur when the budget period differs from the reporting period reflected in the financial statements. There is no timing difference for IMO, for the purposes of comparison between budget and actual amounts. Entity differences occur when the budget omits programmes or entities that are part of the entity for which the financial statements are prepared. There are also differences in formats and classification schemes adopted for presentation of financial statements and the budget.
166 Presentation differences are due to differences in the format and classification schemes adopted for the presentation of the Statement of Cash Flow and the Statement of Comparison of Budget and Actual Amounts. The budget for extra-budgetary activities of IMO funded by the various donor/trust Funds is not included in Statement V and thus the amounts associated with the revenues and expenses of those Funds are classified as presentation differences. The comparison between budget and actual amounts is made not only for the budgets approved by the IMO Assembly but also for those approved by the respective governing bodies of WMU and IMLI.
167 The reconciliation between the actual amounts on a comparable basis in the Statement of Comparison of Budget and Actual Amounts (Statement V) and the actual amounts in the Statement of Cash Flow (Statement IV) for the year ended 31 December 2016 is presented in the ensuing paragraphs.
168 Budget amounts have been presented on a functional classification basis in accordance with the approved budget for 2016, which presents a breakdown of the budget for purposes of the above comparison. The amount of deficit of £777,300 for 2016 shown in Statement Va (IMO only) has been reconciled to the net increase in cash and cash equivalents of £5,262,648 presented in Statement IV (IMO 2016) and the details of the reconciliation are presented in the table below.
IMO Adjustments Pertaining to the Cash Flows from:
Operating Activities
Financing Activities
Investing Activities Total
GBP
Actual Amounts on Comparable Basis (Statement Va)
A (777,300) – – (777,300)
Basis differences a 6,964,530 – (1,663,011) 5,301,519
Presentation differences b 747,522 – – 747,522
Entity differences c (9,093) – – (9,093)
Total Differences B=a+b+c 7,702,959 – (1,663,011) 6,039,948
Actual Amounts in the Statement of Cash Flow (Statement IV)
C=A+B 6,925,659 – (1,663,011) 5,262,648

IMO FINANCIAL STATEMENTS 2016
64
169 The reconciliation of the amount of surplus of £1,267,936 shown in Statement Vb (Consolidated 2016 including WMU and IMLI) has also been made to the net increase in cash and cash equivalents of £10,288,641 indicated in Statement IV (Consolidated 2016), as shown in the table below, using the reconciliation statements submitted by WMU and IMLI.
Consolidated Adjustments Pertaining to the Cash Flows from:
Operating Activities
Financing Activities
Investing Activities Total
GBP
Actual Amounts on Comparable Basis (Statement Vb)
A 1,267,936 – – 1,267,936
Basis differences a 8,054,444 550,000 (1,728,711) 6,875,733
Presentation differences b 2,025,965 128,100 – 2,154,065
Entity difference c (9,093) – – (9,093)
Total Differences B=a+b+c 10,071,316 678,100 (1,728,711) 9,020,705
Actual Amounts in the Statement of Cash Flow (Statement IV)
C=A+B 11,339,252 678,100 (1,728,711) 10,288,641
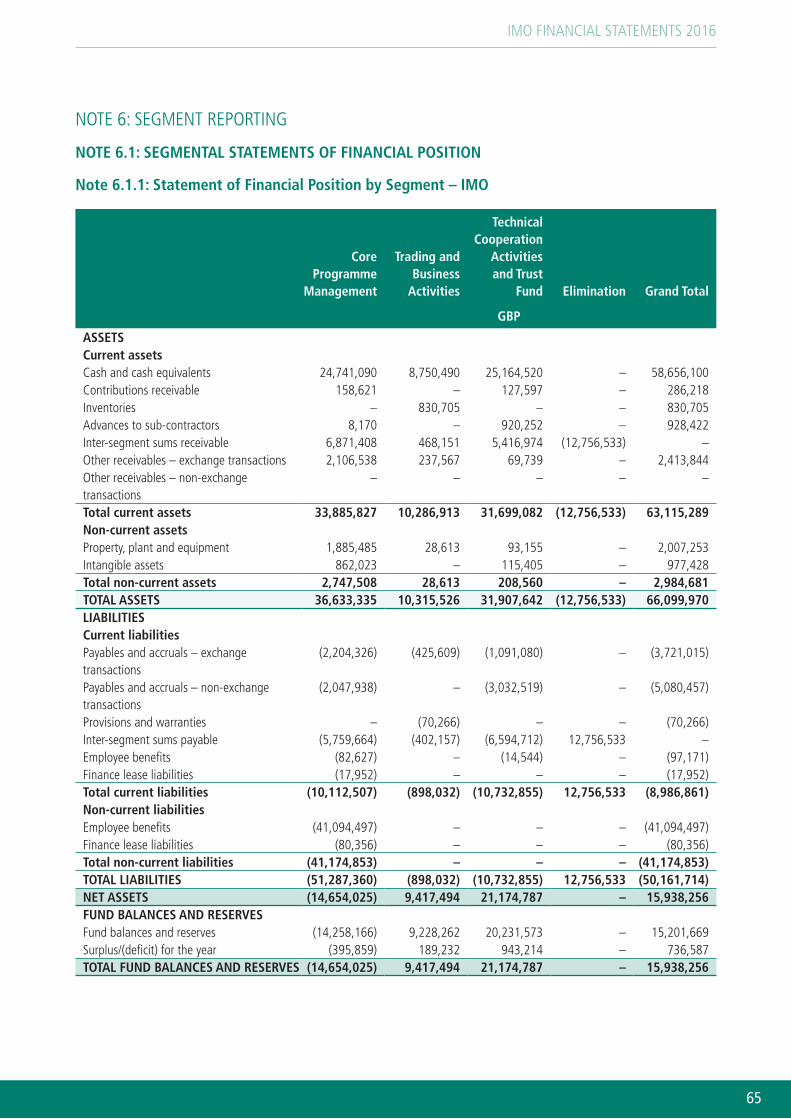
IMO FINANCIAL STATEMENTS 2016
65
NOTE 6: SEGMENT REPORTING
NOTE 6.1: SEGMENTAL STATEMENTS OF FINANCIAL POSITION
Note 6.1.1: Statement of Financial Position by Segment – IMO
Core Programme
Management
Trading and Business
Activities
Technical Cooperation
Activities and Trust
Fund Elimination Grand Total
GBP
ASSETS Current assetsCash and cash equivalents 24,741,090 8,750,490 25,164,520 – 58,656,100Contributions receivable 158,621 – 127,597 – 286,218Inventories – 830,705 – – 830,705Advances to sub-contractors 8,170 – 920,252 – 928,422Inter-segment sums receivable 6,871,408 468,151 5,416,974 (12,756,533) –Other receivables – exchange transactions 2,106,538 237,567 69,739 – 2,413,844Other receivables – non-exchange transactions
– – – – –
Total current assets 33,885,827 10,286,913 31,699,082 (12,756,533) 63,115,289Non-current assetsProperty, plant and equipment 1,885,485 28,613 93,155 – 2,007,253Intangible assets 862,023 – 115,405 – 977,428Total non-current assets 2,747,508 28,613 208,560 – 2,984,681TOTAL ASSETS 36,633,335 10,315,526 31,907,642 (12,756,533) 66,099,970LIABILITIESCurrent liabilitiesPayables and accruals – exchange transactions
(2,204,326) (425,609) (1,091,080) – (3,721,015)
Payables and accruals – non-exchange transactions
(2,047,938) – (3,032,519) – (5,080,457)
Provisions and warranties – (70,266) – – (70,266)Inter-segment sums payable (5,759,664) (402,157) (6,594,712) 12,756,533 –Employee benefits (82,627) – (14,544) – (97,171)Finance lease liabilities (17,952) – – – (17,952)Total current liabilities (10,112,507) (898,032) (10,732,855) 12,756,533 (8,986,861)Non-current liabilitiesEmployee benefits (41,094,497) – – – (41,094,497)Finance lease liabilities (80,356) – – – (80,356)Total non-current liabilities (41,174,853) – – – (41,174,853)TOTAL LIABILITIES (51,287,360) (898,032) (10,732,855) 12,756,533 (50,161,714)NET ASSETS (14,654,025) 9,417,494 21,174,787 – 15,938,256FUND BALANCES AND RESERVESFund balances and reserves (14,258,166) 9,228,262 20,231,573 – 15,201,669Surplus/(deficit) for the year (395,859) 189,232 943,214 – 736,587TOTAL FUND BALANCES AND RESERVES (14,654,025) 9,417,494 21,174,787 – 15,938,256

IMO FINANCIAL STATEMENTS 2016
66
Note 6.1.2: Statement of Financial Position by Segment – Consolidated
Core Programme
Management
Trading and Business
Activities
Technical Cooperation
Activities and Trust
Fund
Education and
Research Elimination Grand Total
GBP
ASSETS Current assetsCash and cash equivalents 24,741,090 8,750,490 25,164,520 14,995,183 – 73,651,283Contributions receivable 158,621 – 127,597 5,294 – 291,512Inventories – 830,705 – 49,125 (17,491) 862,339Advances to sub-contractors 8,170 – 920,252 – – 928,422Inter-segment sums receivable
6,871,408 468,151 5,416,974 – (12,756,533) –
Other receivables – exchange transactions
2,106,538 237,567 69,739 985,582 (458) 3,398,968
Other receivables – non-exchange transactions
– – – 58,927 – 58,927
Total current assets 33,885,827 10,286,913 31,699,082 16,094,111 (12,774,482) 79,191,451Non-current assetsProperty, plant and equipment
1,885,485 28,613 93,155 338,182 (571) 2,344,864
Intangible assets 862,023 – 115,405 2,296 – 979,724Total non-current assets 2,747,508 28,613 208,560 340,478 (571) 3,324,588TOTAL ASSETS 36,633,335 10,315,526 31,907,642 16,434,589 (12,775,053) 82,516,039LIABILITIESCurrent liabilitiesPayables and accruals – exchange transactions
(2,204,326) (425,609) (1,091,080) (477,085) 294,813 (3,903,287)
Payables and accruals – non-exchange transactions
(2,047,938) – (3,032,519) (6,672,298) 995,487 (10,757,268)
Provisions and warranties – (70,266) – – – (70,266)Inter-segment sums payable (5,759,664) (402,157) (6,594,712) – 12,756,533 –Employee benefits (82,627) – (14,544) (58,740) – (155,911)Finance lease liabilities (17,952) – – – – (17,952)Total current liabilities (10,112,507) (898,032) (10,732,855) (7,208,123) 14,046,833 (14,904,684)Non-current liabilitiesEmployee benefits (41,094,497) – – (573,021) – (41,667,518)Finance lease liabilities (80,356) – – – – (80,356)Total non-current liabilities
(41,174,853) – – (573,021) – (41,747,874)
TOTAL LIABILITIES (51,287,360) (898,032) (10,732,855) (7,781,144) 14,046,833 (56,652,558)NET ASSETS (14,654,025) 9,417,494 21,174,787 8,653,445 1,271,780 25,863,481FUND BALANCES AND RESERVESFund balances and reserves (14,258,166) 9,228,262 20,231,573 7,374,823 247,368 22,823,860Surplus for the year (395,859) 189,232 943,214 1,278,622 1,024,412 3,039,621TOTAL FUND BALANCES AND RESERVES
(14,654,025) 9,417,494 21,174,787 8,653,445 1,271,780 25,863,481

IMO FINANCIAL STATEMENTS 2016
67
NOTE 6.2: SEGMENTAL STATEMENTS OF FINANCIAL PERFORMANCE
Note 6.2.1: Statement of Financial Performance by Segment – IMO
Core Programme
Management
Trading and Business
Activities
Technical Cooperation
Activities and Trust
Fund Elimination Grand Total
GBP
Revenue
Assessed contributions 30,116,000 – – – 30,116,000
Donor voluntary contributions – – 4,127,997 – 4,127,997
Commercial activities 171,911 12,915,571 359,450 – 13,446,932
Other revenue 127,096 53,361 105,331 – 285,788
Support costs earned 1,410,096 – – (1,410,096) –
Inter-segment transfers 1,520,019 (7,294) 5,794,930 (7,307,655) –
TOTAL REVENUE 33,345,122 12,961,638 10,387,708 (8,717,751) 47,976,717
Expenditure
Staff and other personnel costs (26,974,030) (1,959,684) (3,491,100) – (32,424,814)
Travel expenses (494,247) (85,371) (1,565,619) – (2,145,237)
Supplies, consumables and other running costs
(4,392,076) (700,465) (721,710) – (5,814,251)
Cost related to trading activities – (1,908,221) – – (1,908,221)
Outsourced services (875,338) (136,082) (39,459) – (1,050,879)
Training and development (59,353) – (4,219,023) – (4,278,376)
Support costs charged – (632,226) (777,870) 1,410,096 –
Depreciation, amortisation and impairment (690,687) (29,450) (69,071) – (789,208)
Return of unspent funds – – (326,840) – (326,840)
Other expenses (620,261) (140,586) (845,163) – (1,606,010)
Inter-segment transfers – (7,258,452) (49,203) 7,307,655 –
TOTAL EXPENDITURE (34,105,992) (12,850,537) (12,105,058) 8,717,751 (50,343,836)
Currency exchange gains 365,011 78,131 2,660,564 – 3,103,706
SURPLUS/(DEFICIT) FOR THE YEAR (395,859) 189,232 943,214 – 736,587
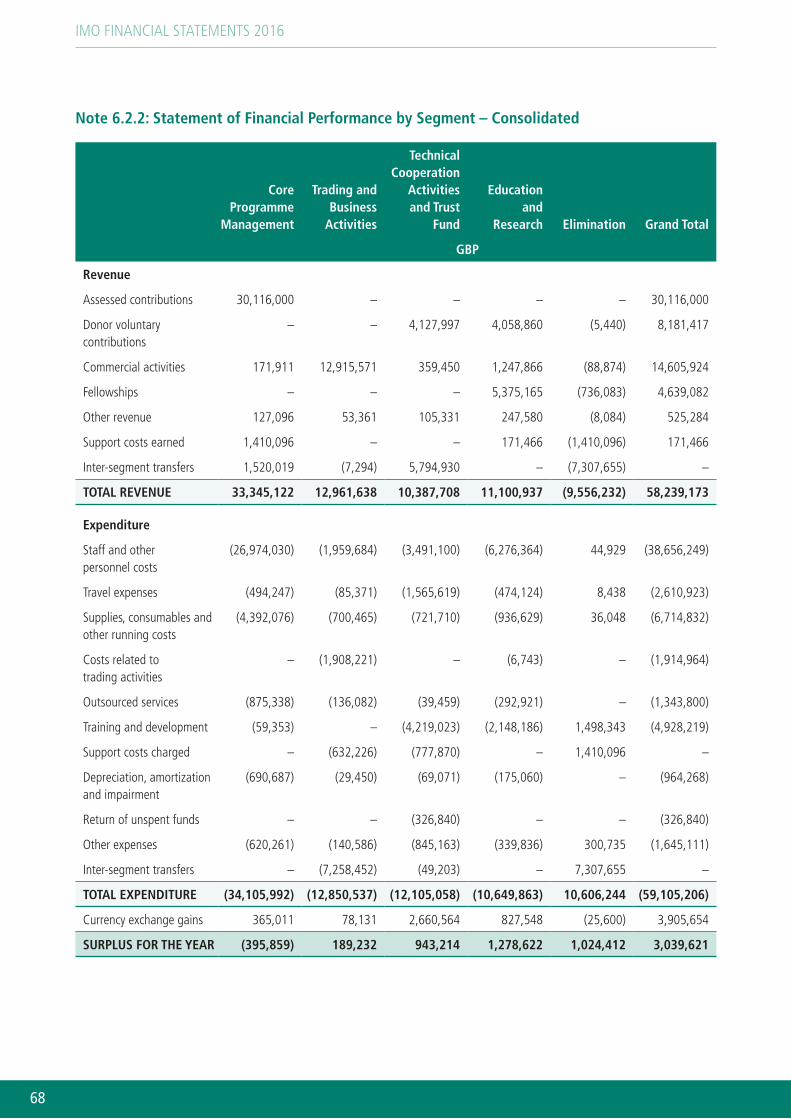
IMO FINANCIAL STATEMENTS 2016
68
Note 6.2.2: Statement of Financial Performance by Segment – Consolidated
Core Programme
Management
Trading and Business
Activities
Technical Cooperation
Activities and Trust
Fund
Education and
Research Elimination Grand Total
GBP
Revenue
Assessed contributions 30,116,000 – – – – 30,116,000
Donor voluntary contributions
– – 4,127,997 4,058,860 (5,440) 8,181,417
Commercial activities 171,911 12,915,571 359,450 1,247,866 (88,874) 14,605,924
Fellowships – – – 5,375,165 (736,083) 4,639,082
Other revenue 127,096 53,361 105,331 247,580 (8,084) 525,284
Support costs earned 1,410,096 – – 171,466 (1,410,096) 171,466
Inter-segment transfers 1,520,019 (7,294) 5,794,930 – (7,307,655) –
TOTAL REVENUE 33,345,122 12,961,638 10,387,708 11,100,937 (9,556,232) 58,239,173
Expenditure
Staff and other personnel costs
(26,974,030) (1,959,684) (3,491,100) (6,276,364) 44,929 (38,656,249)
Travel expenses (494,247) (85,371) (1,565,619) (474,124) 8,438 (2,610,923)
Supplies, consumables and other running costs
(4,392,076) (700,465) (721,710) (936,629) 36,048 (6,714,832)
Costs related to trading activities
– (1,908,221) – (6,743) – (1,914,964)
Outsourced services (875,338) (136,082) (39,459) (292,921) – (1,343,800)
Training and development (59,353) – (4,219,023) (2,148,186) 1,498,343 (4,928,219)
Support costs charged – (632,226) (777,870) – 1,410,096 –
Depreciation, amortization and impairment
(690,687) (29,450) (69,071) (175,060) – (964,268)
Return of unspent funds – – (326,840) – – (326,840)
Other expenses (620,261) (140,586) (845,163) (339,836) 300,735 (1,645,111)
Inter-segment transfers – (7,258,452) (49,203) – 7,307,655 –
TOTAL EXPENDITURE (34,105,992) (12,850,537) (12,105,058) (10,649,863) 10,606,244 (59,105,206)
Currency exchange gains 365,011 78,131 2,660,564 827,548 (25,600) 3,905,654
SURPLUS FOR THE YEAR (395,859) 189,232 943,214 1,278,622 1,024,412 3,039,621
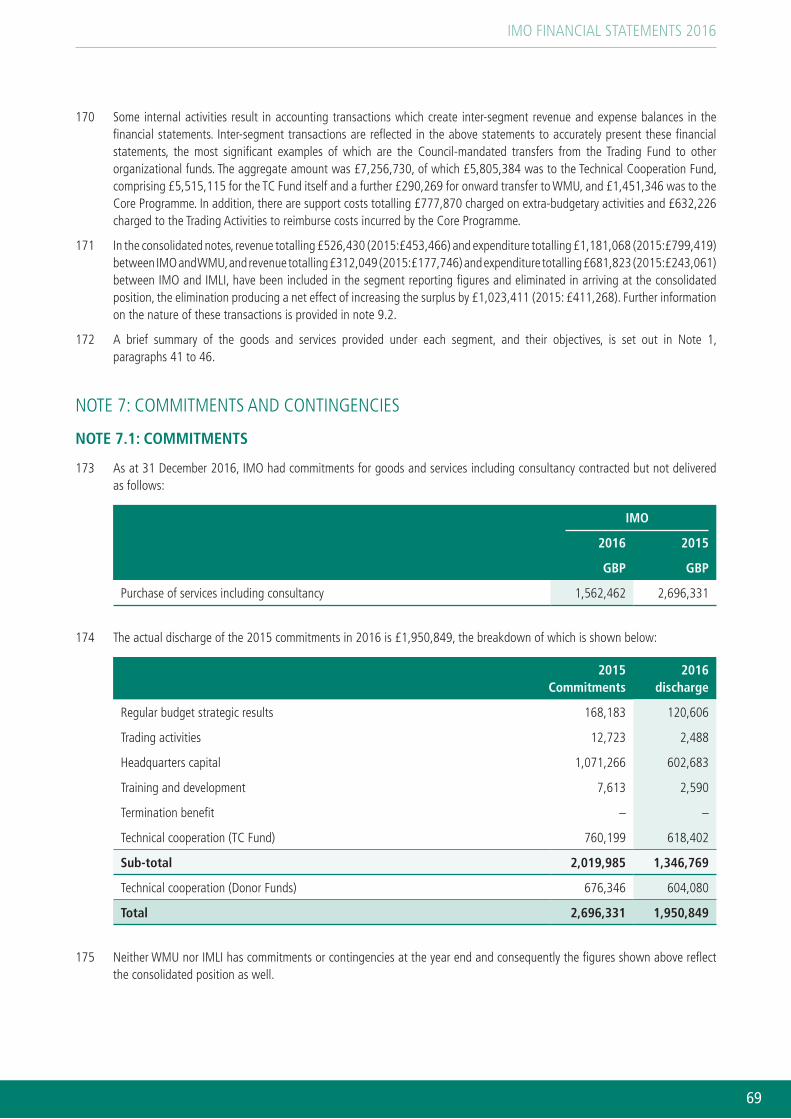
IMO FINANCIAL STATEMENTS 2016
69
170 Some internal activities result in accounting transactions which create inter-segment revenue and expense balances in the financial statements. Inter-segment transactions are reflected in the above statements to accurately present these financial statements, the most significant examples of which are the Council-mandated transfers from the Trading Fund to other organizational funds. The aggregate amount was £7,256,730, of which £5,805,384 was to the Technical Cooperation Fund, comprising £5,515,115 for the TC Fund itself and a further £290,269 for onward transfer to WMU, and £1,451,346 was to the Core Programme. In addition, there are support costs totalling £777,870 charged on extra-budgetary activities and £632,226 charged to the Trading Activities to reimburse costs incurred by the Core Programme.
171 In the consolidated notes, revenue totalling £526,430 (2015:£453,466) and expenditure totalling £1,181,068 (2015:£799,419) between IMO and WMU, and revenue totalling £312,049 (2015:£177,746) and expenditure totalling £681,823 (2015:£243,061) between IMO and IMLI, have been included in the segment reporting figures and eliminated in arriving at the consolidated position, the elimination producing a net effect of increasing the surplus by £1,023,411 (2015: £411,268). Further information on the nature of these transactions is provided in note 9.2.
172 A brief summary of the goods and services provided under each segment, and their objectives, is set out in Note 1, paragraphs 41 to 46.
NOTE 7: COMMITMENTS AND CONTINGENCIES
NOTE 7.1: COMMITMENTS
173 As at 31 December 2016, IMO had commitments for goods and services including consultancy contracted but not delivered as follows:
IMO
2016 2015
GBP GBP
Purchase of services including consultancy 1,562,462 2,696,331
174 The actual discharge of the 2015 commitments in 2016 is £1,950,849, the breakdown of which is shown below:
2015 Commitments
2016 discharge
Regular budget strategic results 168,183 120,606
Trading activities 12,723 2,488
Headquarters capital 1,071,266 602,683
Training and development 7,613 2,590
Termination benefit – –
Technical cooperation (TC Fund) 760,199 618,402
Sub-total 2,019,985 1,346,769
Technical cooperation (Donor Funds) 676,346 604,080
Total 2,696,331 1,950,849
175 Neither WMU nor IMLI has commitments or contingencies at the year end and consequently the figures shown above reflect the consolidated position as well.
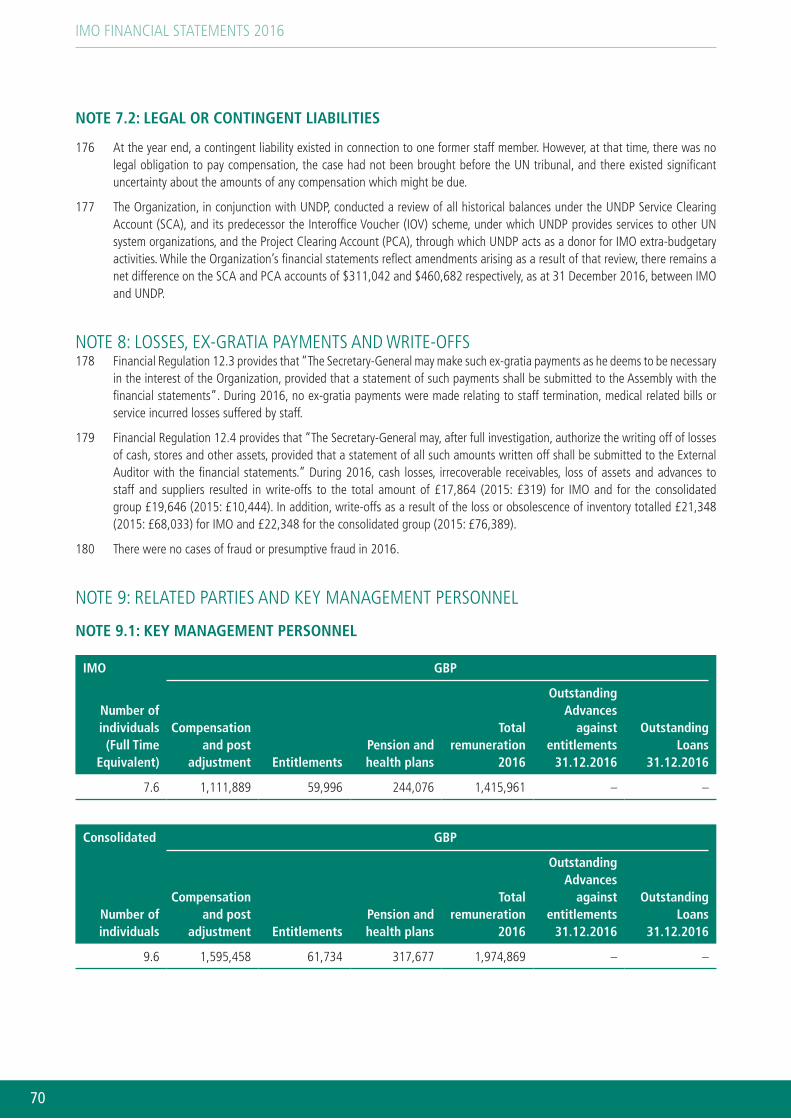
IMO FINANCIAL STATEMENTS 2016
70
NOTE 7.2: LEGAL OR CONTINGENT LIABILITIES
176 At the year end, a contingent liability existed in connection to one former staff member. However, at that time, there was no legal obligation to pay compensation, the case had not been brought before the UN tribunal, and there existed significant uncertainty about the amounts of any compensation which might be due.
177 The Organization, in conjunction with UNDP, conducted a review of all historical balances under the UNDP Service Clearing Account (SCA), and its predecessor the Interoffice Voucher (IOV) scheme, under which UNDP provides services to other UN system organizations, and the Project Clearing Account (PCA), through which UNDP acts as a donor for IMO extra-budgetary activities. While the Organization’s financial statements reflect amendments arising as a result of that review, there remains a net difference on the SCA and PCA accounts of $311,042 and $460,682 respectively, as at 31 December 2016, between IMO and UNDP.
NOTE 8: LOSSES, EX-GRATIA PAYMENTS AND WRITE-OFFS178 Financial Regulation 12.3 provides that “The Secretary-General may make such ex-gratia payments as he deems to be necessary
in the interest of the Organization, provided that a statement of such payments shall be submitted to the Assembly with the financial statements”. During 2016, no ex-gratia payments were made relating to staff termination, medical related bills or service incurred losses suffered by staff.
179 Financial Regulation 12.4 provides that “The Secretary-General may, after full investigation, authorize the writing off of losses of cash, stores and other assets, provided that a statement of all such amounts written off shall be submitted to the External Auditor with the financial statements.” During 2016, cash losses, irrecoverable receivables, loss of assets and advances to staff and suppliers resulted in write-offs to the total amount of £17,864 (2015: £319) for IMO and for the consolidated group £19,646 (2015: £10,444). In addition, write-offs as a result of the loss or obsolescence of inventory totalled £21,348 (2015: £68,033) for IMO and £22,348 for the consolidated group (2015: £76,389).
180 There were no cases of fraud or presumptive fraud in 2016.
NOTE 9: RELATED PARTIES AND KEY MANAGEMENT PERSONNEL
NOTE 9.1: KEY MANAGEMENT PERSONNEL
IMO GBP
Number of individuals (Full Time
Equivalent)
Compensation and post
adjustment EntitlementsPension and health plans
Total remuneration
2016
Outstanding Advances
against entitlements
31.12.2016
Outstanding Loans
31.12.2016
7.6 1,111,889 59,996 244,076 1,415,961 – –
Consolidated GBP
Number of individuals
Compensation and post
adjustment EntitlementsPension and health plans
Total remuneration
2016
Outstanding Advances
against entitlements
31.12.2016
Outstanding Loans
31.12.2016
9.6 1,595,458 61,734 317,677 1,974,869 – –
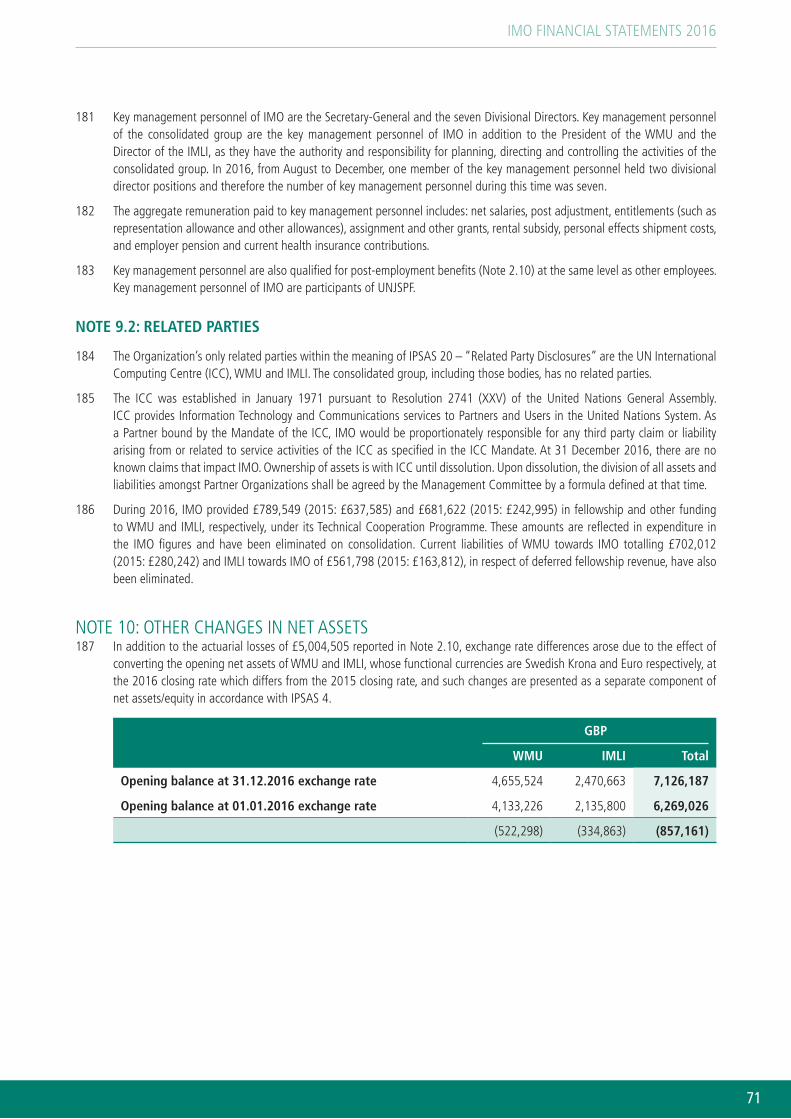
IMO FINANCIAL STATEMENTS 2016
71
181 Key management personnel of IMO are the Secretary-General and the seven Divisional Directors. Key management personnel of the consolidated group are the key management personnel of IMO in addition to the President of the WMU and the Director of the IMLI, as they have the authority and responsibility for planning, directing and controlling the activities of the consolidated group. In 2016, from August to December, one member of the key management personnel held two divisional director positions and therefore the number of key management personnel during this time was seven.
182 The aggregate remuneration paid to key management personnel includes: net salaries, post adjustment, entitlements (such as representation allowance and other allowances), assignment and other grants, rental subsidy, personal effects shipment costs, and employer pension and current health insurance contributions.
183 Key management personnel are also qualified for post-employment benefits (Note 2.10) at the same level as other employees. Key management personnel of IMO are participants of UNJSPF.
NOTE 9.2: RELATED PARTIES
184 The Organization’s only related parties within the meaning of IPSAS 20 – “Related Party Disclosures” are the UN International Computing Centre (ICC), WMU and IMLI. The consolidated group, including those bodies, has no related parties.
185 The ICC was established in January 1971 pursuant to Resolution 2741 (XXV) of the United Nations General Assembly. ICC provides Information Technology and Communications services to Partners and Users in the United Nations System. As a Partner bound by the Mandate of the ICC, IMO would be proportionately responsible for any third party claim or liability arising from or related to service activities of the ICC as specified in the ICC Mandate. At 31 December 2016, there are no known claims that impact IMO. Ownership of assets is with ICC until dissolution. Upon dissolution, the division of all assets and liabilities amongst Partner Organizations shall be agreed by the Management Committee by a formula defined at that time.
186 During 2016, IMO provided £789,549 (2015: £637,585) and £681,622 (2015: £242,995) in fellowship and other funding to WMU and IMLI, respectively, under its Technical Cooperation Programme. These amounts are reflected in expenditure in the IMO figures and have been eliminated on consolidation. Current liabilities of WMU towards IMO totalling £702,012 (2015: £280,242) and IMLI towards IMO of £561,798 (2015: £163,812), in respect of deferred fellowship revenue, have also been eliminated.
NOTE 10: OTHER CHANGES IN NET ASSETS187 In addition to the actuarial losses of £5,004,505 reported in Note 2.10, exchange rate differences arose due to the effect of
converting the opening net assets of WMU and IMLI, whose functional currencies are Swedish Krona and Euro respectively, at the 2016 closing rate which differs from the 2015 closing rate, and such changes are presented as a separate component of net assets/equity in accordance with IPSAS 4.
GBP
WMU IMLI Total
Opening balance at 31.12.2016 exchange rate 4,655,524 2,470,663 7,126,187
Opening balance at 01.01.2016 exchange rate 4,133,226 2,135,800 6,269,026
(522,298) (334,863) (857,161)
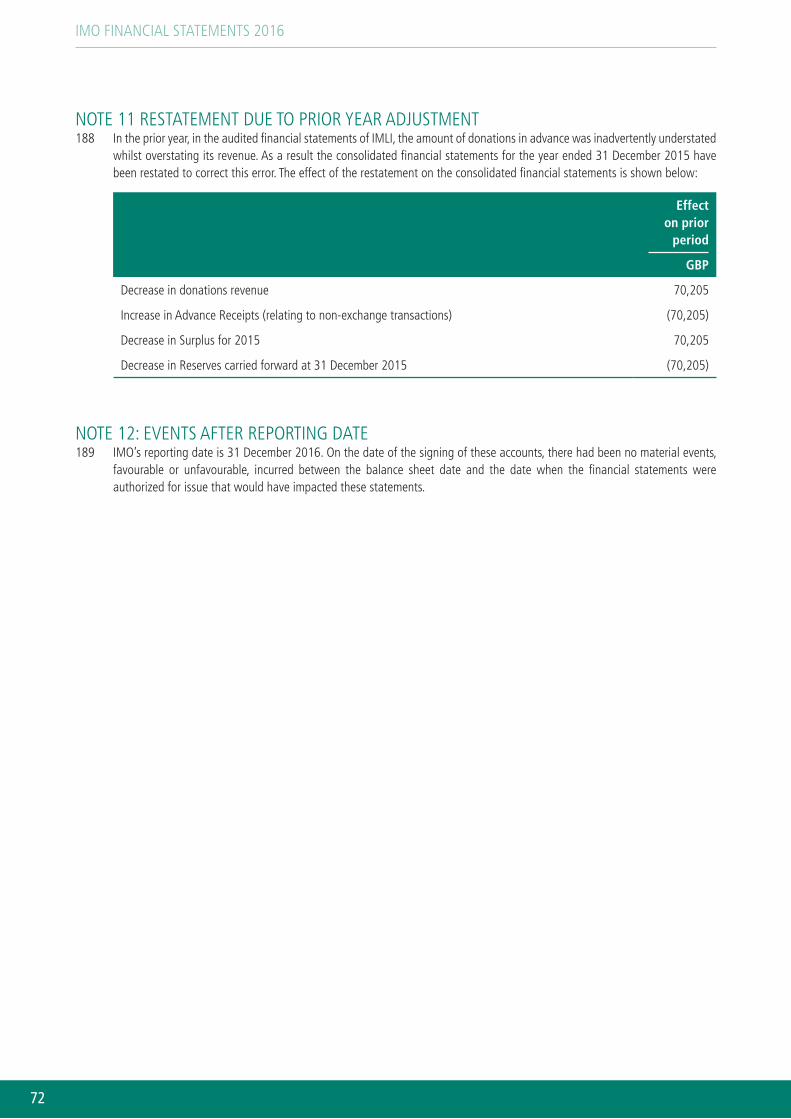
IMO FINANCIAL STATEMENTS 2016
72
NOTE 11 RESTATEMENT DUE TO PRIOR YEAR ADJUSTMENT188 In the prior year, in the audited financial statements of IMLI, the amount of donations in advance was inadvertently understated
whilst overstating its revenue. As a result the consolidated financial statements for the year ended 31 December 2015 have been restated to correct this error. The effect of the restatement on the consolidated financial statements is shown below:
Effect on prior
period
GBP
Decrease in donations revenue 70,205
Increase in Advance Receipts (relating to non-exchange transactions) (70,205)
Decrease in Surplus for 2015 70,205
Decrease in Reserves carried forward at 31 December 2015 (70,205)
NOTE 12: EVENTS AFTER REPORTING DATE189 IMO’s reporting date is 31 December 2016. On the date of the signing of these accounts, there had been no material events,
favourable or unfavourable, incurred between the balance sheet date and the date when the financial statements were authorized for issue that would have impacted these statements.
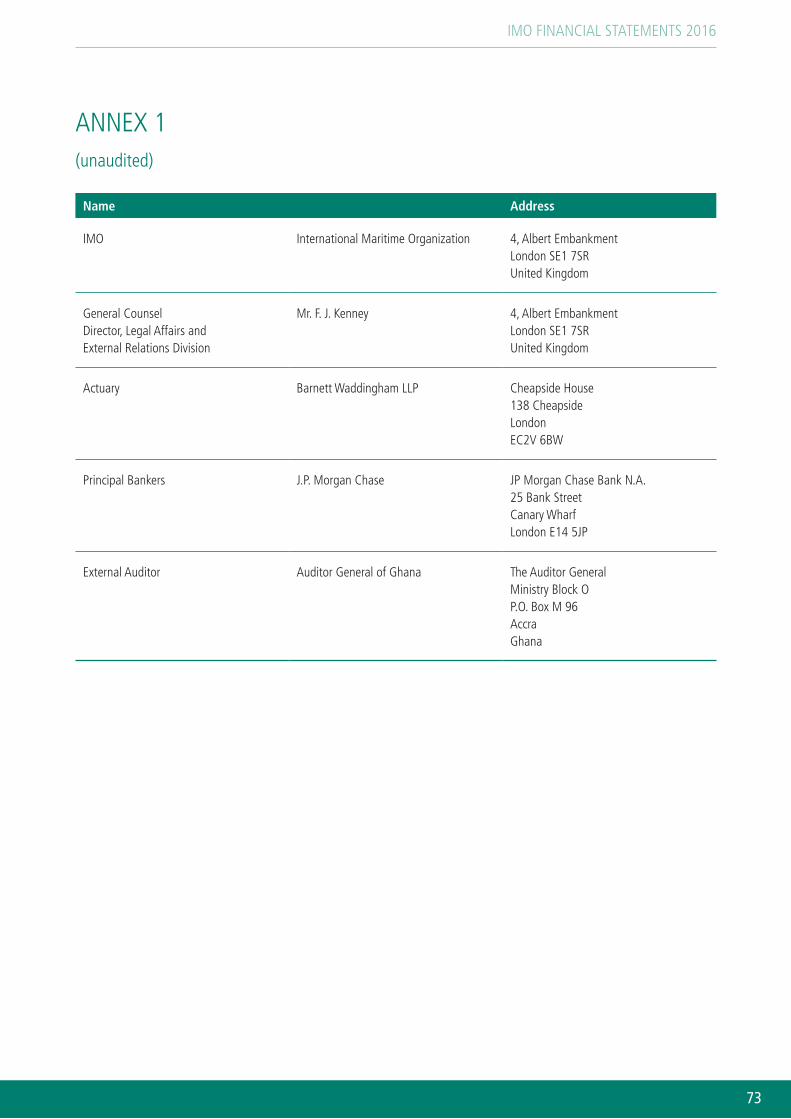
IMO FINANCIAL STATEMENTS 2016
73
ANNEX 1(unaudited)
Name Address
IMO International Maritime Organization 4, Albert Embankment London SE1 7SR United Kingdom
General Counsel Director, Legal Affairs and External Relations Division
Mr. F. J. Kenney 4, Albert Embankment London SE1 7SR United Kingdom
Actuary Barnett Waddingham LLP Cheapside House 138 Cheapside London EC2V 6BW
Principal Bankers J.P. Morgan Chase JP Morgan Chase Bank N.A. 25 Bank Street Canary Wharf London E14 5JP
External Auditor Auditor General of Ghana The Auditor General Ministry Block O P.O. Box M 96 Accra Ghana
IMO FINANCIAL STATEMENTS 2016
74
INDEPENDENT AUDITOR’S REPORTTo: The Chairman, 118th Session of Council, International Maritime Organization
REPORT ON THE FINANCIAL STATEMENTS
We have audited the financial statements of the International Maritime Organization (IMO) for the financial year ended 31 December 2016. The financial statements are made up of: a statement of financial position as at 31 December 2O16; a statement of financial performance; a statement of changes in net assets; a statement of cash flow; a statement of comparison of budget and actual amounts for the year ended 31 December 2016; and notes to the financial statements.
Management’s responsibility for the financial statements
Management of IMO is responsible for the preparation and presentation of the financial statements in accordance with the International Public Sector Accounting Standards (IPSAS). This responsibility includes the design, implementation and maintenance of internal control procedures to enable the preparation of the financial statements which are free of material misstatements, whether due to fraud or errors. This responsibility also includes the selection and application of appropriate accounting policies and the use of accounting estimates that are reasonable in the circumstances.
Auditor’s responsibility
Our responsibility is to express an opinion on these financial statements based on our audit. We conducted our audit in accordance with the International Standards on Auditing. These standards require that we comply with ethical requirements and to plan and perform our audit in order to obtain a reasonable assurance that the financial statements are free from material misstatements.
An audit includes performing procedures to obtain audit evidence about the amounts and disclosures in the financial statements. The procedures selected depend on the auditor’s professional judgment, including assessment of the risks of material misstatements of the financial statements, whether due to fraud or errors. In making those risk assessments, the auditor considers the internal control procedures in place for the preparation and fair presentation of the financial statements, in order to design audit procedures that are appropriate in the circumstances, but not for the purpose of expressing an opinion on the entity’s internal control. An audit also includes evaluating the appropriateness of accounting policies used, the reasonableness of accounting estimates made by management, and the overall presentation of the financial statements.
We believe that the audit evidence we have obtained is sufficient and appropriate to provide a basis for our audit opinion.
Opinion
In our opinion, these financial statements present fairly, in all material respects, the financial position of the International Maritime Organization as at 31 December 2016, and its financial performance and cash flows for the period then ended in accordance with IPSAS.
IMO FINANCIAL STATEMENTS 2016
75
REPORT ON OTHER LEGAL AND REGULATORY REQUIREMENTS
Further, in our opinion, the transactions of the International Maritime Organization that have come to our notice or which we have tested as part of our audit have, in all significant respects, been in accordance with the IMO Financial Regulations and Financial Rules.
In accordance with Article XII of the Financial Regulations and Appendix I attached to the Regulations, we have also issued a long-form Report on our audit of the International Maritime Organization.
Daniel Yaw Domelevo Auditor-General of Ghana External Auditor
Accra, Ghana 9 June 2017