financial statement s june 30, 2020 fremont unified school
TRANSCRIPT

eidebailly.com
Financial Statements June 30, 2020
Fremont Unified School District

Fremont Unified School District Table of Contents
June 30, 2020
Independent Auditor’s Report ................................................................................................................................... 1
Management’s Discussion and Analysis .................................................................................................................... 4
Government Wide Financial Statements
Statement of Net Position ................................................................................................................................... 13 Statement of Activities ......................................................................................................................................... 15
Government Fund Financial Statements
Balance Sheet – Governmental Funds ................................................................................................................. 16 Reconciliation of the Governmental Funds Balance Sheet to the Statement of Net Position ............................ 17 Statement of Revenues, Expenditures, and Changes in Fund Balances – Governmental Funds ........................ 19 Reconciliation of the Statement of Revenues, Expenditures, and Changes in Fund Balances of Governmental Funds to the Statement of Activities ................................................................................................................... 20
Proprietary Fund Financial Statements
Statement of Net Position – Proprietary Funds ................................................................................................... 22 Statement of Revenues, Expenses, and Changes in Fund Net Position – Proprietary Funds .............................. 23 Statement of Cash Flows – Proprietary Funds ..................................................................................................... 24
Fiduciary Fund Financial Statements
Statement of Net Position – Fiduciary Funds ...................................................................................................... 25
Notes to Financial Statements ................................................................................................................................. 26
Required Supplementary Information
Budgetary Comparison Schedule – General Fund ............................................................................................... 73 Schedule of Changes in the District’s Total OPEB Liability and Related Ratios ................................................... 74 Schedule of the District’s Proportionate Share of the Net Pension Liability ....................................................... 75 Schedule of the District Contributions ................................................................................................................. 76 Note to Required Supplementary Information .................................................................................................... 77
Supplementary Information
Schedule of Expenditures of Federal Awards ...................................................................................................... 80 Local Education Agency Organization Structure .................................................................................................. 82 Schedule of Average Daily Attendance ................................................................................................................ 83 Schedule of Instructional Time ............................................................................................................................ 84 Reconciliation of Annual Financial and Budget Report with Audited Financial Statements ............................... 85 Schedule of Financial Trends and Analysis .......................................................................................................... 86 Schedule of Charter Schools ................................................................................................................................ 87 Combining Balance Sheet – Non-Major Governmental Funds ............................................................................ 88 Combining Statement of Revenues, Expenditure, and Changes in Fund Balances – Non-Major Governmental Funds .................................................................................................................................................................... 89 Note to Supplementary Information ................................................................................................................... 90

Independent Auditor’s Reports
Independent Auditor’s Report on Internal Control over Financial Reporting and on Compliance and Other Matters Based on an Audit of Financial Statements Performed in Accordance with Government Auditing Standards ................................................................................................................................................................. 93
Independent Auditor’s Report on Compliance for Each Major Federal Program; Report on Internal Control Over Compliance Required by the Uniform Guidance ..................................................................................................... 95
Independent Auditor’s Report on State Compliance ............................................................................................... 97
Schedule of Findings and Questioned Costs
Summary of Auditor’s Results ............................................................................................................................ 101 Financial Statement Findings ............................................................................................................................. 102 Federal Awards Findings and Questioned Costs ................................................................................................ 103 State Compliance Findings and Questioned Costs............................................................................................. 104 Summary Schedule of Prior Audit Findings ........................................................................................................ 105

1
What inspires you, inspires us. | eidebailly.com
3130 Crow Canyon Pl., Ste. 300 | San Ramon, CA 94583-1386 | T 925.480.4000 | F 925.884.2480 | EOE
Independent Auditor’s Report To the Governing Board Fremont Unified School District Fremont, California Report on the Financial Statements We have audited the accompanying financial statements of the governmental activities, each major fund, and the aggregate remaining fund information of Fremont Unified School District (the District) as of and for the year ended June 30, 2020, and the related notes to the financial statements, which collectively comprise the District’s basic financial statements as listed in the table of contents. Management’s Responsibility for the Financial Statements Management is responsible for the preparation and fair presentation of these financial statements in accordance with accounting principles generally accepted in the United States of America; this includes the design, implementation, and maintenance of internal control relevant to the preparation and fair presentation of financial statements that are free from material misstatement, whether due to fraud or error. Auditor’s Responsibility Our responsibility is to express opinions on these financial statements based on our audit. We conducted our audit in accordance with auditing standards generally accepted in the United States of America and the standards applicable to financial audits contained in Government Auditing Standards, issued by the Comptroller General of the United States. Those standards require that we plan and perform the audit to obtain reasonable assurance about whether the financial statements are free from material misstatement. An audit involves performing procedures to obtain audit evidence about the amounts and disclosures in the financial statements. The procedures selected depend on the auditor’s judgment, including the assessment of the risks of material misstatement of the financial statements, whether due to fraud or error. In making those risk assessments, the auditor considers internal control relevant to the entity’s preparation and fair presentation of the financial statements in order to design audit procedures that are appropriate in the circumstances, but not for the purpose of expressing an opinion on the effectiveness of the entity’s internal control. Accordingly, we express no such opinion. An audit also includes evaluating the appropriateness of accounting policies used and the reasonableness of significant accounting estimates made by management, as well as evaluating the overall presentation of the financial statements. We believe that the audit evidence we have obtained is sufficient and appropriate to provide a basis for our audit opinions.

2
Opinions In our opinion, the financial statements referred to above present fairly, in all material respects, the respective financial position of the governmental activities, each major fund, and the aggregate remaining fund information of Fremont Unified School District, as of June 30, 2020, and the respective changes in financial position and, where applicable, cash flows thereof for the year then ended in accordance with accounting principles generally accepted in the United States of America. Other Matters Required Supplementary Information Accounting principles generally accepted in the United States of America require that the management’s discussion and analysis on pages 4 through 12, budgetary comparison information on page 73, schedule of changes in the District’s net OPEB liability on page 74, schedule of the District’s proportionate share of the net pension liability on page 75, and the schedule of District contributions on page 76, be presented to supplement the basic financial statements. Such information, although not a part of the basic financial statements, is required by the Governmental Accounting Standards Board, who considers it to be an essential part of financial reporting for placing the basic financial statements in an appropriate operational, economic, or historical context. We have applied certain limited procedures to the required supplementary information in accordance with auditing standards generally accepted in the United States of America, which consisted of inquiries of management about the methods of preparing the information and comparing the information for consistency with management’s responses to our inquiries, the basic financial statements, and other knowledge we obtained during our audit of the basic financial statements. We do not express an opinion or provide any assurance on the information because the limited procedures do not provide us with sufficient evidence to express an opinion or provide any assurance. Other Information Our audit was conducted for the purpose of forming opinions on the financial statements that collectively comprise Fremont Unified School District‘s financial statements. The combining and individual nonmajor fund financial statements, Schedule of Expenditures of Federal Awards as required by the audit requirements of Title 2 U.S. Code of Federal Regulations (CFR) Part 200, Uniform Administrative Requirements, Cost Principles, and Audit Requirements for Federal Awards (Uniform Guidance), and other supplementary information listed in the table of contents are presented for purposes of additional analysis and are not a required part of the financial statements. The combining and individual nonmajor fund financial statements, the schedule of expenditures of federal awards, and the other supplementary information listed in the table of contents are the responsibility of management and were derived from and relate directly to the underlying accounting and other records used to prepare the basic financial statements. Such information has been subjected to the auditing procedures applied in the audit of the basic financial statements and certain additional procedures, including comparing and reconciling such information directly to the underlying accounting and other records used to prepare the basic financial statements or to the basic financial statements themselves, and other additional procedures in accordance with auditing standards generally accepted in the United States of America. In our opinion, the combining and individual nonmajor fund financial statements and the schedule of expenditures of federal awards are fairly stated, in all material respects, in relation to the basic financial statements as a whole.
3
Other Reporting Required by Government Auditing Standards In accordance with Government Auditing Standards, we have also issued a report dated January 12, 2021, on our consideration of Fremont Unified School District‘s internal control over financial reporting and on our tests of its compliance with certain provisions of laws, regulations, contracts, grant agreements, and other matters. The purpose of that report is solely to describe the scope of our testing of internal control over financial reporting and compliance and the results of that testing, and not to provide an opinion on the effectiveness of Fremont Unified School District‘s internal control over financial reporting or on compliance. That report is an integral part of an audit performed in accordance with Government Auditing Standards in considering Fremont Unified School District‘s internal control over financial reporting and compliance.
San Ramon, California January 12, 2021

4
Fremont Unified School District Management’s Discussion and Analysis
June 30, 2020 This section of Fremont Unified School District’s annual financial report presents our discussion and analysis of the District’s financial performance during the fiscal year that ended on June 30, 2020, with comparative information for the year ended June 30, 2019. Please read it in conjunction with the District’s financial statements, which immediately follow this section. FINANCIAL HIGHLIGHTS
• The District’s financial status decreased overall as a result of this year’s operations. Net position of governmental activities decreased by $11.7 million, or 7.3% (see Table A-1).
• Governmental expenses were about $490.2 million. Revenues were about $478.5 million (see Table A-2).
• The District spent over $87.5 million in new capital assets during the year. These expenditures were incurred primarily from improvement of sites and buildings.
• The District outstanding long-term debt decreased by $10.5 million. This was primarily due to the increase in other post employment benefits and STRS and PERS pension liabilities, offset by a reduction in bonds and Certificates of Participation.
• Grades K-12 average daily attendance (ADA) decreased by 226, or 0.7%.
OVERVIEW OF THE FINANCIAL STATEMENTS This annual report consists of three parts – management discussion and analysis (this section), the basic financial statements, and required supplementary information. The basic financial statements include two kinds of statements that present different views of the District. The first two statements are district-wide financial statements that provide both short-term and long-term information about the District’s overall financial status. The remaining statements are fund financial statements that focus on individual parts of the District, reporting the District’s operations in more detail than the district-wide statements.
• The governmental funds statements tell how basic services like regular and special education were financed in the short term as well as what remains for future spending.
• Short and long-term financial information about the activities of the District that operate like businesses (self-insurance funds) are provided in the proprietary funds statements.
• Fiduciary funds statement provides information about the financial relationships in which the District acts solely as a trustee or agent for the benefit of others to whom the resources belong.

5
Fremont Unified School District Management’s Discussion and Analysis
June 30, 2020 OVERVIEW OF THE FINANCIAL STATEMENTS (continued) Figure A-1, Organization of Fremont Unified School District’s Annual Financial Report
The financial statements also
include notes that explain
some of the information in
the statements and provide
more detailed data. Figure
A-1 shows how the various
parts of this annual report
are arranged and related to
one another.
Summary Detail Figure A-2 summarizes the major features of the District’s financial statements, including the portion of the District’s activities they cover and the types of information they contain.
Type of Statements
District-Wide Governmental Funds Proprietary Funds Fiduciary Funds
Scope Entire District, except fiduciary activities
The activities of the District that are not proprietary or fiduciary, such as special education and building maintenance
Activities of the District that operate like a business, such as self-insurance funds.
Instances in which the District administers resources on behalf of someone else, such as scholarship programs and student activities monies
Required financial statements
• Statement of Net Position
• Statement of Activities
• Balance Sheet • Statement of
Revenues, Expenditures & Changes in Fund Balances
• Statement of Net Position
• Statement of Revenues, Expenses, & Changes in Net Position
• Statement of Fiduciary Net Position
Management’s Discussion
and Analysis
Required Supplementary
Information
Basic Financial
Statements
District – wide Financial
Statements
Fund Financial
Statements
Notes to the Financial
Statements

6
The remainder of this overview section of management’s discussion and analysis highlights the structure and contents of each of the statements. District-Wide Statements The district-wide statements report information about the District as a whole using accounting methods similar to those used by private-sector companies. The statement of net position includes all of the District’s assets and liabilities. All of the current year’s revenues and expenses are accounted for in the statement of activities regardless of when cash is received or paid. The two district-wide statements report the District’s net position and how it has changed. Net position – the difference between the District’s assets and deferred outflows of resources and liabilities and deferred inflows of resources – is one way to measure the District’s financial health, or position.
• Over time, increases and decreases in the District’s net position are an indicator of whether its financial position is improving or deteriorating, respectively.
• To assess the overall health of the District, you need to consider additional nonfinancial factors, such as
changes in the District’s demographics and the condition of school buildings and other facilities.
• In the district-wide financial statements, the District’s activities are categorized as Governmental Activities. Most of the District’s basic services are included here, such as regular and special education, transportation, and administration. Property taxes and state aid finance most of these activities.
• Statement of Cash Flows
Accounting basis and measurement focus
Accrual accounting and economic resources focus
Modified accrual accounting and current financial resources focus
Accrual accounting and economic resources focus
Accrual accounting and economic resources focus
Type of asset /liability information
All assets and liabilities, both financial and capital, short-term and long-term
Only assets expected to be used up and liabilities that come due during the year or soon thereafter; no capital assets included
All assets and liabilities, both short-term and long-term; The District’s funds do not currently contain nonfinancial assets, though they can
All assets and liabilities, both short-term and long-term; The District’s funds do not currently contain nonfinancial assets, though they can
Type of inflow/outflow information
All revenues and expenses during the year, regardless of when cash is received or paid
Revenues for which cash is received during or soon after end of the year; expenditures when goods or services have been received and payment is due during the year or soon thereafter.
All revenues and expenses during the year, regardless of when cash is received or paid
All revenues and expenses during the year, regardless of when cash is received or paid

7
Fremont Unified School District Management’s Discussion and Analysis
June 30, 2020 Fund Financial Statements The fund financial statements provide more detail information about the District’s most significant funds – not the District as a whole. Funds are accounting devices the District uses to keep track of specific sources of funding and spending on particular programs.
• Some funds are required by State law and by bond covenants.
• The District establishes other funds to control and manage money for particular purposes (like repaying its long-term debt) or to show that it is properly using certain revenues.
The District has three kinds of funds: 1) Governmental funds – Most of the District’s basic services are included in governmental funds, which
generally focus on (1) how cash and other financial assets that can readily be converted to cash flow in and out and (2) the balances left at year-end that are available for spending. Consequently the governmental funds statements provide a detailed short-term view that helps you determine whether there are more or fewer financial resources that can be spent in the near future to finance the District’s programs. Because this information does not encompass the additional long-term focus of the district-wide statements, we provide additional information on a separate reconciliation page that explains the relationship (or differences) between them.
2) Proprietary funds – When the District charges other District funds for the services it provides, these services are reported in proprietary funds. Proprietary funds are reported in the same way that all activities are reported in the Statement of Net Position and Statement of Activities. In fact, the District’s internal service fund is included within the governmental activities reported in the district-wide statements but provide more detail and additional information, such as cash flows. The district uses the internal service fund to report activities that relate to the District’s self-insured program for property and liability claims.
3) Fiduciary funds – The District is the trustee or fiduciary, for assets that belong to others, such as the student
activities funds. The District is responsible for ensuring that the assets reported in these funds are used only for their intended purposes and by those to whom the assets belong. All of the District’s fiduciary activities are reported in a separate statement of fiduciary net position. We exclude these activities form the district-wide financial statements because the District cannot use these assets to finance its operations.
FINANCIAL ANALYSIS OF THE DISTRICT AS A WHOLE Net Position. The District’s combined net position was lower on June 30, 2020, than it was the year before – decreasing to ($171.5) million (See Table A-1), primarily as a result of GASB 75 related to measurement of other post employment benefits plan ($137.4) million.

8
Fremont Unified School District Management’s Discussion and Analysis
June 30, 2020 Table A-1
2020 2019
AssetsCurrent and other assets 276,135,235$ 378,857,908$ Capital assets 618,950,745 544,333,765
Total assets 895,085,980 923,191,673
Deferred outflows of resources 131,684,892 136,772,969
LiabilitiesCurrent liabilities 54,018,125 104,324,349 Long-term liabilities 1,116,289,441 1,094,485,108
Total liabilities 1,170,307,566 1,198,809,457
Deferred inflows of resources 27,984,870 20,976,694
Net PositionNet investment in
capital assets 225,914,119 194,287,863 Restricted 72,115,585 79,064,426 Unrestricted (469,551,268) (433,173,798)
Total net position (171,521,564)$ (159,821,509)$
GovernmentalActivities

9
Fremont Unified School District Management’s Discussion and Analysis
June 30, 2020 Changes in Net Position, governmental activities. The District total revenues decreased by 1.5% to $478.5 million (See Table A-2). The decrease is due primarily to federal, state, and local sources. The total cost of all programs and services decreased 2.6% to $490.2 million. The District’s expenses are predominantly related to educating students, 81.0%. The administrative activities of the District accounted for just 4% of total costs. A significant contributor to the decrease in costs were changes in the state on-behalf contributions to the STRS and PERS plans. Table A-2
2020 2019
RevenuesProgram revenues
Charges for services 4,443,584$ 6,824,345$ Operating grants and contributions 84,457,867 74,180,276 Capital grants and contributions - 3,653,396
General revenues Federal and State aid not restricted 178,378,583 184,874,473 Property taxes 198,100,718 184,951,517 Other general revenues 13,136,646 31,583,681
Total revenues 478,517,398 486,067,688
ExpensesInstruction-related 356,401,320 367,279,606 Pupil services 38,967,041 40,831,608 Administration 20,440,425 23,385,280 Plant services 36,773,757 34,450,988 Other 37,634,910 37,427,852
Total expenses 490,217,453 503,375,334
Change in net position (11,700,055)$ (17,307,646)$
GovernmentalActivities
FINANCIAL ANALYSIS OF THE DISTRICT’S FUNDS The financial performance of the District as a whole is reflected in its governmental funds. As the District completed this year, its governmental funds reported a combined fund balance of $229.0 million, which is below last year’s ending fund balance of $314.8 million. The primary causes of the decreased fund balance are the expenditures of bond proceeds received in the prior year, increased deficit in special education programs and on-going modernization and new construction projects.

10
Fremont Unified School District Management’s Discussion and Analysis
June 30, 2020 General Fund Budgetary Highlights Over the course of the year, the District revised the annual operating budget several times. The major budget amendments fall into these categories: Revenues
• Local Control Funding Formula (LCFF) was fully implemented in FY 2018-19. The only increase in LCFF for FY 2019-20 was cost-of-living adjustment (COLA) of 3.26%.
• Enrollment decreased from prior year to 35,046 or by 130 students. Under the law, the District is allowed to use the greater of current year or previous year’s enrollment and Average Daily Attendance (ADA).
• On-Behalf revenues and expenditures are recorded as required by Governmental Accounting Standard Board (GASB) Statement 68.
• One-time grant as Special Education Early Intervention Preschool Grant. • Carryover of unspent categorical funds from prior year. • Other revenue categories were also adjusted as grants became available from the Federal, State and
local agencies. Expenditures
• Salaries increased for Fremont Unified District Teachers Association (FUDTA), Service Employees International Union (SEIU), and Fremont School Management Association (FSMA) as follows:
o 1.00% ongoing increase, effective July 1, 2019 o 1.50% ongoing increase, effective January 1, 2020 o 1.50% one-time, effective January 2, 2020
Salaries increased for California School Employees Association (CSEA) was a formula comprised of the funded COLA minus the rate of the weighted average increased pension cost for all district employees calculated at 2.72%.
• Increased in employee benefits for State Teacher Retirement System (STRS) from 16.28% to 17.10% and Public employee Retirement System (PERS) from 18.062% to 19.721% of the employees’ gross payroll
• Restricted Maintenance Account (RMA) contribution was at 3% due to receipt of Proposition 51 School Bonds starting FY 2018-19.
• Budgeted expenditures were adjusted in accordance to the increase in categorical program revenues • Additionally, budget for unspent categorical programs (entitlements) with fund balance from the prior
year were increased. • Other expenditure categories were adjusted to cover any unexpected changes during the year.
While the District’s final budget for the General Fund, as listed on page 73 anticipated that expenditures would exceed revenues by about $16.4 million, the actual results for the year show that expenditures exceeded revenues by roughly $4.8 million. Actual revenues were $1 million less than anticipated, and expenditures were $12.5 million less than budgeted. These amounts consists primarily of restricted categorical program dollars that were not spent as of June 30, 2020, that will be carried over into the 2020-21 budget.

11
Fremont Unified School District Management’s Discussion and Analysis
June 30, 2020
CAPITAL ASSET AND DEBT ADMINISTRATION By the end of 2019-2020, the District had invested $619.0 million in capital assets, related to the District’s ongoing construction and modernization program. (More detailed information about capital assets can be found in the notes to the financial statements). Total depreciation for the year was $12.6 million. Table A-3: Capital Assets at Year-End, Net of Depreciation
2020 2019
Land and constructionin progress 305,925,231$ 230,797,606$
Buildings andimprovements 308,418,913 308,216,398
Equipment 4,606,601 5,319,761
Total 618,950,745$ 544,333,765$
This year’s major additions included:Williamson Site - New construction 2,367,892$ Bringhurst Elementary School - New construction 2,318,290 Walters Middle School - Conversion 4,283,254 Horner Middle Schools - Conversion 44,550,916 Centerville, Thorton, Hopkins Middle School - Conversion 10,617,888 American High School - Modernization 14,233,625 Washington High School - Modernization 3,088,036
Total 81,459,901$
GovernmentalActivities
LONG-TERM DEBT At year-end the District had $1.1 billion in general obligation bonds, certificates of participation, pension liabilities, other postemployment benefits and compensated absences – a decrease of 0.9% from last year – as shown in Table A-4. (more detailed information about the District’s long-term liabilities is presented in notes to the financial statements). Table A-4: Outstanding Long-Term Debt at Year-End
2020 2019
Long-Term LiabilitiesGeneral obligation bonds 436,675,000$ 465,755,000$ Certificates of participation 61,790,000 63,095,000 Unamortized premiums/(discounts) 19,760,745 21,460,527 Compensated absences 2,505,735 1,730,600 Total OPEB liability 137,367,513 122,888,933 Aggregate net pension liability 458,190,448 451,858,717
Total 1,116,616,116$ 1,127,123,452$
GovernmentalActivities

12
Fremont Unified School District Management’s Discussion and Analysis
June 30, 2020
FACTORS BEARING ON THE DISTRICT’S FUTURE During the District’s budget development process, the following budget assumptions were applied to the District’s budget based on the most current information available at that time. However, revenue and expenditure assumptions have changed since then. The following assumptions were applied to the Fremont Unified School District’s 2020-21 Budget that was adopted in June 2020. The following assumptions were used in estimating revenues and expenditures:
a) Local Control Funding Formula (LCFF) for 2020-21 is calculated based on actual 2019-20 enrollment of 35,046 which is greater than 2020-21 projected enrollment of 34,989. Under the law, the district is allowed to use the greater of current year or previous year’s enrollment and Average Daily Attendance (ADA).
b) Federal revenues include only current year grants for 2020-21. No carryovers included.
c) State revenues do not include any one-time allocations.
d) Local revenues include estimated gifts/donations from parent organizations and other local donors and interest. Parcel tax revenue (Measure I) in the amount of $4.3 million is included. Measure I was approved by the voters of Fremont on June 7, 2016.
e) Certificated and Classified salaries include step and column adjustments for all eligible employees. Fremont Unified District Teachers Association (FUDTA) salaries include 0.56% negotiated increase. $559,000 has been set aside in Designations to pay for projected “me too” increase in CSEA, SEIU and FSMA salaries.
f) Employee benefits include $0.3 million for potential penalties from the Affordable Care Act (ACA). It also includes the increases/decreases in pension contribution for State Teachers Retirement System (STRS) and Public Employee Retirement System (PERS). To be compliant with Governmental Accounting Standards Board (GASB) 71, the District is also including STRS On-Behalf entries in the amount of $16.8 million. Under the new accounting standards (GASB 68 & 71), if the present value of benefits earned by all employees participating in the CalSTRS pension plan (the plan’s total pension liability) exceeds the resources accumulated by the pension plan to pay benefits (producing a net pension liability), the district must now report in its governmental-wide financial statements the proportionate share of the plan’s net pension liability. At present, CalSTRS has a net pension liability.
g) Books and Supplies budgets do include projected $3.4 million of unspent categorical revenues from the prior year.
h) Capital Outlay and Other Outgo do not includes the expenditures for Proposition 39 (California Clean Energy Jobs Act), or Bay Area Management District, as these funds are projected to be spent in 2019-20.
CONTACTING THE DISTRICT’S FINANCIAL MANAGEMENT This financial report is designed to provide our citizens, taxpayers, and creditors with a general overview of the District’s finances and to demonstrate the District’s accountability for the money it receives. If you have questions about this report or need additional financial information, please contact Marcus Battle, Associate Superintendent, 4210 Technology Drive, Fremont, CA 94538 or (510) 659-2572.

See Notes to Financial Statements 13
Fremont Unified School District Statement of Net Position
June 30, 2020
GovernmentalActivities
AssetsDeposits and investments 231,228,335$ Receivables 37,788,140 Due from other governments 5,397,103 Prepaid items 78,198 Stores inventories 476,473 Other current assets 1,166,986 Capital assets, net of accumulated depreciation 618,950,745
Total assets 895,085,980
Deferred Outflows of ResourcesDeferred charge on refunding 5,926,372 Deferred outflows of resources related to other
postemployment benefits (OPEB) liability 9,907,909 Deferred outflows of resources related to pensions 115,850,611
Total deferred outflows of resources 131,684,892
LiabilitiesAccounts payable 44,417,068 Interest payable 6,952,753 Due to other governments 2,461,122 Unearned revenue 187,182 Long-term liabilities
Long-term liabilities other than OPEB andpensions due within one year 28,609,086
Long-term liabilities other than OPEB andpensions due in more than one year 492,122,394
Total other postemployment benefits liabilities 137,367,513
Aggregate net pension liabilities 458,190,448
Total liabilities 1,170,307,566

See Notes to Financial Statements 14
Fremont Unified School District Statement of Net Position
June 30, 2020
GovernmentalActivities
Deferred Inflows of ResourcesDeferred inflows of resources
related to pensions 27,984,870
Total deferred inflows of resources 27,984,870
Net PositionNet investment in capital assets 225,914,119 Restricted for
Debt service 35,525,889 Capital projects 25,797,689 Educational programs 10,792,007
Unrestricted (469,551,268)
Total net position (171,521,564)$

See Notes to Financial Statements 15
Fremont Unified School District Statement of Activities
Year Ended June 30, 2020
Revenues and Changes
Charges for OperatingServices and Grants and Governmental
Expenses Sales Contributions Activities
Governmental Activities Instruction 305,137,497$ 223,561$ 53,365,317$ (251,548,619)$ Instruction-related activities
Supervision of instruction 17,313,311 23,492 5,563,153 (11,726,666) Instructional library, media,
and technology 4,317,615 4,427 202,745 (4,110,443) School site administration 29,632,897 6,474 2,995,999 (26,630,424)
Pupil services Home-to-school transportation 8,731,954 76,241 2,000,789 (6,654,924) Food services 7,052,555 2,315,376 2,825,656 (1,911,523) All other pupil services 23,182,532 22,296 4,999,865 (18,160,371)
Administration Data processing 5,971,839 - 180,187 (5,791,652) All other administration 14,468,586 110,865 1,539,656 (12,818,065)
Plant services 36,773,757 44,625 647,337 (36,081,795) Ancillary services 1,506,333 6,313 55,330 (1,444,690) Community services 832,537 - - (832,537) Interest on long-term liabilities 17,916,396 - - (17,916,396) Other outgo 17,379,644 1,609,914 10,081,833 (5,687,897)
Total governmental activities 490,217,453$ 4,443,584$ 84,457,867$ (401,316,002)
General Revenues and Subventions Property taxes, levied for general purposes 150,998,865 Property taxes, levied for debt service 42,668,119 Taxes levied for other specific purposes 4,433,734 Federal and State aid not restricted to specific purposes 178,378,583 Interest and investment earnings 1,492,192 Interagency revenues 420,161 Miscellaneous 11,224,293
Subtotal, general revenues 389,615,947
Total general revenues and transfers 389,615,947
Change in Net Position (11,700,055)
Net Position - Beginning (159,821,509)
Net Position - Ending (171,521,564)$
Functions/Programs
Net (Expenses)
in Net PositionProgram Revenues

See Notes to Financial Statements 16
Fremont Unified School District Balance Sheet – Governmental Funds
June 30, 2020
BondCapital Interest and Non-Major Total
General Building Facilities Redemption Governmental GovernmentalFund Fund Fund Fund Funds Funds
AssetsDeposits and investments 28,221,897$ 119,262,748$ 31,056,856$ 35,361,583$ 16,931,234$ 230,834,318$ Receivables 35,566,796 520,835 127,120 164,306 1,406,035 37,785,092 Due from other funds 600,848 120,798 650,000 - - 1,371,646 Due from other
governments - - - - 5,397,103 5,397,103 Prepaid expenditures 78,198 - - - - 78,198 Stores inventories 316,675 - - - 159,798 476,473 Other current assets 1,166,986 - - - - 1,166,986
Total assets 65,951,400$ 119,904,381$ 31,833,976$ 35,525,889$ 23,894,170$ 277,109,816$
Liabilities and Fund Balances
LiabilitiesAccounts payable 31,482,462$ 5,981,747$ 696,173$ -$ 5,908,618$ 44,069,000$ Due to other funds 120,798 - - - 1,250,848 1,371,646 Due to other governments 2,336,299 - - - 124,823 2,461,122 Unearned revenue 187,182 - - - - 187,182
Total liabilities 34,126,741 5,981,747 696,173 - 7,284,289 48,088,950
Fund BalancesNonspendable 494,886 - - - 159,798 654,684 Restricted 9,848,328 113,922,634 31,137,803 35,525,889 943,679 191,378,333 Assigned 7,383,985 - - - 15,506,404 22,890,389 Unassigned 14,097,460 - - - - 14,097,460
Total fund balances 31,824,659 113,922,634 31,137,803 35,525,889 16,609,881 229,020,866
Total liabilities andfund balances 65,951,400$ 119,904,381$ 31,833,976$ 35,525,889$ 23,894,170$ 277,109,816$

See Notes to Financial Statements 17
Fremont Unified School District Reconciliation of the Governmental Funds Balance Sheet to the Statement of Net Position
June 30, 2020 Total Fund Balance - Governmental Funds 229,020,866$
Amounts Reported for Governmental Activities in theStatement of Net Position are Different Because
Capital assets used in governmental activities are not financial resources and, therefore, are not reported as assets in governmental funds.
The cost of capital assets is 898,311,432$ Accumulated depreciation is (279,360,687)
Net capital assets 618,950,745
liabilities is recognized in the period when it is due. On the government-wide financial statements, unmatured interest on long-term liabilities is recognized when it is incurred. (6,952,753)
An internal service fund is used by management to charge the costsof the workers’ compensation insurance program to the individual funds. The assets and liabilities of the internal service fund are included with governmental activities. 48,996
Deferred outflows of resources represent a consumption of netposition in a future period and is not reported in the governmentalfunds. Deferred outflows of resources amounted to and related to
Debt refundings 5,926,372 Other postemployment benefits 9,907,909 Net pension obligation 115,850,612
131,684,893
In governmental funds, unmatured interest on long-term
Total deferred outflows of resources

See Notes to Financial Statements 18
Fremont Unified School District Reconciliation of the Governmental Funds Balance Sheet to the Statement of Net Position
June 30, 2020 Deferred inflows of resources represent an acquisition of net position that applies to a future period and is not reported in the governmental funds. Deferred inflows of resources amount to and related to
Net pension obligation (27,984,870)
(27,984,870)
Net pension liability is not due and payable in the current period, and is not reported as a liability in the funds. (458,190,448)
The District’s OPEB liability is not due and payable in the current period, and is not reported as a liability in the funds. (137,367,513)
Long-term liabilities are not due and payable in the current period and, therefore, are not reported as liabilities in the funds.Long-term liabilities at year-end consist of
General obligation bonds (436,675,000)$ Certificates of participation (61,790,000) Compensated absences (vacations) (2,505,734) Premiums, net of accumulated amortization (19,760,746)
Total long-term liabilities (520,731,480)
Total net position - governmental activities (171,521,564)$
Total deferred inflows of resources

See Notes to Financial Statements 19
Fremont Unified School District Statement of Revenues, Expenditures, and Changes in Fund Balances – Governmental Funds
Year Ended June 30, 2020
BondCapital Interest and Non-Major Total
General Building Facilities Redemption Governmental GovernmentalFund Fund Fund Fund Funds Funds
RevenuesLocal Control Funding Formula 314,986,816$ -$ -$ -$ 3,814,257$ 318,801,073$ Federal sources 11,575,828 - - - 6,056,246 17,632,074 Other State sources 56,666,797 2,546 136 199,015 17,581,990 74,450,484 Other local sources 14,819,686 3,153,253 4,435,766 42,915,802 4,969,302 70,293,809
Total revenues 398,049,127 3,155,799 4,435,902 43,114,817 32,421,795 481,177,440
ExpendituresCurrent
Instruction 265,601,899 - - - 6,875,257 272,477,156 Instruction-related activities
Supervision of instruction 14,528,897 - - - 901,945 15,430,842 Instructional library, media,
and technology 3,652,540 - - - 234,838 3,887,378 School site administration 24,149,896 - - - 2,108,417 26,258,313
Pupil servicesHome-to-school transportation 9,994,859 - - - - 9,994,859 Food services 270,609 - - - 6,250,361 6,520,970 All other pupil services 21,787,578 - - - 202,318 21,989,896
AdministrationData processing 5,666,680 - - - 23,827 5,690,507 All other administration 11,737,657 - 884,490 - 532,503 13,154,650
Plant services 33,428,781 2,546 886,127 - 448,663 34,766,117 Ancillary services 1,371,754 - - - - 1,371,754 Community services 554,716 - - - - 554,716 Other outgo 4,779,922 - - - 12,599,722 17,379,644
Facility acquisition and construction 3,943,017 77,448,036 2,780,300 - 2,723,774 86,895,127 Debt service
Principal - - 1,305,000 29,080,000 - 30,385,000 Interest and other - - 2,518,323 17,674,445 - 20,192,768
Total expenditures 401,468,805 77,450,582 8,374,240 46,754,445 32,901,625 566,949,697
Excess (Deficiency) of Revenues Over Expenditures (3,419,678) (74,294,783) (3,938,338) (3,639,628) (479,830) (85,772,257)
Other Financing Sources (Uses)Transfers in - 2,962,646 1,216,496 - 1,355,749 5,534,891 Transfers out (1,355,749) - - - (4,179,142) (5,534,891)
Net Financing Sources (Uses) (1,355,749) 2,962,646 1,216,496 - (2,823,393) -
Net Change in Fund Balances (4,775,427) (71,332,137) (2,721,842) (3,639,628) (3,303,223) (85,772,257)
Fund Balance - Beginning 36,600,086 185,254,771 33,859,645 39,165,517 19,913,104 314,793,123
Fund Balance - Ending 31,824,659$ 113,922,634$ 31,137,803$ 35,525,889$ 16,609,881$ 229,020,866$

See Notes to Financial Statements 20
Fremont Unified School District Reconciliation of the Statement of Revenues, Expenditures, and Changes in Fund Balances of Governmental
Funds to the Statement of Activities Year Ended June 30, 2020
Total Net Change in Fund Balances - Governmental Funds (85,772,257)$
Amounts Reported for Governmental Activities in the Statement ofActivities are Different Because
Capital outlays to purchase or build capital assets are reported in governmental funds as expenditures; however, for governmental activities, those costs are shown in the Statement of Net Position andallocated over their estimated useful lives as annual depreciationexpenses in the Statement of Activities.
This is the amount by which depreciation exceeds capital outlays in the period.
Depreciation expense (12,892,559)$ Capital outlays 87,664,224
Net expense adjustment 74,771,665
Loss(Gain) on disposal of capital assets is reported in the government-wide Statement of Net Position, but is not recorded in the governmentalfunds. (154,685)
In the Statement of Activities, certain operating expenses, such as compensated absences (vacations) are measured by the amounts earned during the year. In the governmental funds, however, expenditures for these items are measured by the amount of financial resources used (essentially, the amounts actually paid). This amount is the difference between vacation earned and used. (775,135)
In the governmental funds, pension costs are based on employer contributions made to pension plans during the year. However, in the Statement of Activities, pension expense is the net effect ofall changes in the deferred outflows, deferred inflows and netpension liability during the year. (24,166,162)
In the governmental funds, OPEB costs are based on employer contributions made to OPEB plans during the year. However, in the Statement of Activities, OPEB expense is the net effect of all changes in the deferred outflows, deferred inflows, and net OPEB liability during the year. (8,124,714)
Governmental funds report the effect of premiums, discounts, and the deferred amount on a refunding when the debt is first issued, whereas the amounts are deferred and amortized in the Statement of Activities.
Premium amortization 1,699,782 Deferred amount on refunding amortization (615,688)

See Notes to Financial Statements 21
Fremont Unified School District Reconciliation of the Statement of Revenues, Expenditures, and Changes in Fund Balances of Governmental
Funds to the Statement of Activities Year Ended June 30, 2020
Payment of principal on long-term liabilities is an expenditure in the governmental funds, but it reduces long-term liabilities in the Statement of Net Position and does not affect the Statement of Activities.
General obligation bonds 29,080,000 Certificates of participation 1,305,000
Interest on long-term liabilities is recorded as an expenditure in the funds when it is due; however, in the Statement of Activities, interest expense is recognized as the interest accretes or accrues, regardless of when it is due. 1,022,850
An internal service fund is used by management to charge the costsof the self insurance program to the individual funds. The net revenue of the Internal Service Fund is reported with governmentalactivities. 29,289
Change in net position of governmental activities (11,700,055)$

See Notes to Financial Statements 22
Fremont Unified School District Statement of Net Position – Proprietary Funds
June 30, 2020
GovernmentalActivities -
InternalService Fund
AssetsCurrent assets
Deposits and investments 394,017$ Receivables 3,048
Total current assets 397,065
Total assets 397,065
Liabilities Current liabilities
Accounts payable 348,069
Total current liabilities 348,069
Total liabilities 348,069
Net PositionRestricted 29,289 Unrestricted 19,707
Total net position 48,996$

See Notes to Financial Statements 23
Fremont Unified School District Statement of Revenues, Expenses, and Changes in Fund Net Position – Proprietary Funds
Year Ended June 30, 2020
GovernmentalActivities -Internal
Service Fund
Operating RevenuesCharges for services 275,507$
Operating ExpensesSupplies and materials 19,865 Facility rental 750 Other operating cost 229,843
Total operating expenses 250,458
Operating Income (Loss) 25,049
Nonoperating Revenues (Expenses)Interest income 4,240
Change in Net Position 29,289
Total Net Position - Beginning 19,707
Total Net Position - Ending 48,996$

See Notes to Financial Statements 24
Fremont Unified School District Statement of Cash Flows – Proprietary Funds
Year Ended June 30, 2020
GovernmentalActivities -Internal
Service Fund
Operating ActivitiesCash receipts from interfund services provided 260,937$ Other operating cash receipts 25,507 Cash payments to other suppliers of goods or services (50,855) Other operating cash payments (185,637)
Net Cash From Operating Activities 49,952
Noncapital Financing ActivitiesOperating grants received 169,428
Investing ActivitiesInterest on investments 4,240
Net Change in Cash and Cash Equivalents 223,620
Cash and Cash Equivalents, Beginning 170,397
Cash and Cash Equivalents, Ending 394,017$
Reconciliation of Operating Income to NetCash From Operating Activities
Operating income 25,049$ Changes in assets and liabilities
Receivables 10,937 Accrued liabilities 13,966
Net Cash From Operating Activities 49,952$

See Notes to Financial Statements 25
Fremont Unified School District Statement of Net Position – Fiduciary Funds
June 30, 2020
AgencyFunds
AssetsDeposits and investments 2,108,502$
Total assets 2,108,502$
LiabilitiesDue to student groups 2,108,502
Total liabilities 2,108,502$

26
Fremont Unified School District Notes to Financial Statements
June 30, 2020
Note 1 - Summary of Significant Accounting Policies
Financial Reporting Entity
The Fremont Unified School District was formed on July 1, 1964, under the laws of the State of California, and is comprised of an area of approximately 90 square miles located in Alameda County. There were no changes in the boundaries of the District during the current year. The District operates under a locally elected five-member Board form of government and provides educational services to grades k-12 as mandated by the State and Federal Agencies. The District operates 28 elementary schools (K-6), four junior high schools (7-8), one middle school (6-8), and five comprehensive high schools (9-12). The District also maintains a preschool, a continuation school, an adult education program and a charter school.
A reporting entity is comprised of the primary government, component units, and other organizations that are included to ensure the financial statements are not misleading. The primary government of the District consists of all funds, departments, boards, and agencies that are not legally separate from the District. For Fremont Unified School District, this includes general operations, food service, and student related activities of the District.
Component Units
Component units are legally separate organizations for which the District is financially accountable. Component units may also include organizations that are fiscally dependent on the District, in that the District approves their budget, the issuance of their debt or the levying of their taxes. In addition, component units are other legally separate organizations for which the District is not financially accountable but the nature and significance of the organization’s relationship with the District is such that exclusion would cause the District’s financial statements to be misleading or incomplete. For financial reporting purposes, the component unit described below has a financial and operational relationship which meets the reporting entity definition criteria of the Governmental Accounting Standards Board (GASB) Statement No. 14, The Financial Reporting Entity, as amended by GASB Statement No. 39, Determining Whether Certain Organizations are Component Units, and GASB Statement No. 80, Blending Requirements For Certain Component Units and thus are included in the financial statements of the District. The component unit, although a legally separate entity, is reported in the financial statements using the blended presentation method as if it were part of the District’s operations because the governing board of the component unit is essentially the same as the governing board of the District and because its purpose is to finance the construction of facilities to be used for the direct benefit of the District.
The Fremont Unified School District Financing Corporation’s (The Corporation) financial activity is presented in the financial statements blended in the Building Fund and the Debt Service Fund. Certificates of participation issued by the Corporation are included as long-term liabilities in the government-wide financial statements. Individually-prepared financial statements are not prepared for the Corporation.
Other Related Entities
Charter School - The District has approved a Charter for Circle of Independent Learning (COIL) Charter pursuant to Education Code Section 47605. The COIL Charter School is operated by the District, and its financial activities are presented in the Charter School special revenue Fund.

27
Fremont Unified School District Notes to Financial Statements
June 30, 2020 Joint Powers Agencies and Public Entity Risk Pools - The District is associated with three joint powers agencies; Alameda County Schools Insurance Group, Mission Valley Regional Occupational Program (ROP), and Mission Valley Special Education Local Plan Area (SELPA). The organizations do not meet the criteria for inclusion as component units of the District. More detailed information is presented in Note 14 to the financial statements. Basis of Presentation - Fund Accounting The accounting system is organized and operated on a fund basis. A fund is defined as a fiscal and accounting entity with a self-balancing set of accounts, which are segregated for the purpose of carrying on specific activities or attaining certain objectives in accordance with special regulations, restrictions, or limitations. The District’s funds are grouped into three broad fund categories: governmental, proprietary, and fiduciary. Governmental Funds Governmental funds are those through which most governmental functions typically are financed. Governmental fund reporting focuses on the sources, uses, and balances of current financial resources. Expendable assets are assigned to the various governmental funds according to the purposes for which they may or must be used. Current liabilities are assigned to the fund from which they will be paid. The difference between governmental fund assets and liabilities is reported as fund balance. The following are the District’s major and non-major governmental funds: Major Governmental Funds General Fund The General Fund is the chief operating fund for all districts. It is used to account for the ordinary operations of the District. All transactions except those accounted for in another fund are accounted for in this fund.
Building Fund The Building Fund exists primarily to account separately for proceeds from the sale of bonds (Education Code Section 15146) and may not be used for any purposes other than those for which the bonds were issued.
Capital Facilities Fund The Capital Facilities Fund is used primarily to account separately for monies received from fees levied on developers or other agencies as a condition of approval (Education Code Sections 17620-17626 and Government Code Section 65995 et seq.). Expenditures are restricted to the purposes specified in Government Code Sections 65970-65981 or to the items specified in agreements with the developer (Government Code Section 66006).
Bond Interest and Redemption Fund The Bond Interest and Redemption Fund is used for the repayment of bonds issued for a local educational agency (Education Code Sections 15125-15262).

28
Fremont Unified School District
Notes to Financial Statements June 30, 2020
Non-Major Governmental Funds Special Revenue Funds The Special Revenue funds are used to account for the proceeds from specific revenue sources (other than trusts, major capital projects, or debt service) that are restricted or committed to the financing of particular activities, that compose a substantial portion of the inflows of the fund, and that are reasonably expected to continue. Additional resources that are restricted, committed, or assigned to the purpose of the fund may also be reported in the fund.
• Charter Schools Fund The Charter Schools Fund may be used by authorizing districts to account separately for the operating activities of district-operated charter schools that would otherwise be reported in the authorizing District’s General Fund.
• Special Education Pass-Through Fund The Special Education Pass-Through Fund is used by the
Administrative Unit of a multi-district Special Education Local Plan Area (SELPA) to account for Special Education revenue passed through to other member districts.
• Adult Education Fund The Adult Education Fund is used to account separately for Federal, State, and local
revenues that are restricted or committed for adult education programs and is to be expended for adult education purposes only.
• Child Development Fund The Child Development Fund is used to account separately for Federal, State,
and local revenues to operate child development programs and is to be used only for expenditures for the operation of child development programs.
• Cafeteria Fund The Cafeteria Fund is used to account separately for Federal, State, and local resources to
operate the food service program (Education Code Sections 38090-38093) and is used only for those expenditures authorized by the governing board as necessary for the operation of the District’s food service program (Education Code Sections 38091 and 38100).
Capital Project Funds The Capital Project Funds are used to account for financial resources to be used for the acquisition or construction of major capital facilities and other capital assets (other than those financed by proprietary funds and trust funds).
• Special Reserve Fund for Capital Outlay Projects The Special Reserve Fund for Capital Outlay Projects exists primarily to provide for the accumulation of General Fund monies for capital outlay purposes (Education Code Section 42840).

29
Fremont Unified School District Notes to Financial Statements
June 30, 2020 Proprietary Funds Proprietary funds are used to account for activities that are more business-like than government-like in nature. Business-type activities include those for which a fee is charged to external users or to other organizational units of the local education agency, normally on a full cost-recovery basis. Proprietary funds are generally intended to be self-supporting and are classified as enterprise or internal service. The District has the following proprietary funds:
• Internal Service Fund Internal Service funds may be used to account for goods or services provided to other funds of the District on a cost-reimbursement basis. The District operates a Self-insurance fund that is accounted for in an internal service fund.
Fiduciary Funds Fiduciary funds are used to account for assets held in trustee or agent capacity for others that cannot be used to support the District’s own programs. The fiduciary fund category is split into four classifications: pension trust funds, investment trust funds, private-purpose trust funds, and agency funds. The key distinction between trust and agency funds is that trust funds are subject to a trust agreement that affects the degree of management involvement and the length of time that the resources are held. Trust funds are used to account for the assets held by the District under a trust agreement for individuals, private organizations, or other governments and are therefore, not available to support the District’s own programs. Agency funds are custodial in nature (assets equal liabilities) and do not involve measurement of results of operations. Such funds have no equity accounts since all assets are due to individuals or entities at some future time. The District’s agency fund accounts for student body activities (ASB). Basis of Accounting - Measurement Focus Government-Wide Financial Statements The government-wide financial statements are prepared using the economic resources measurement focus and the accrual basis of accounting. This is the same approach used in the preparation of the proprietary fund financial statements, but differs from the manner in which governmental fund financial statements are prepared. The government-wide statement of activities presents a comparison between expenses, both direct and indirect, and for each governmental function, and exclude fiduciary activity. Direct expenses are those that are specifically associated with a service, program, or department and are therefore, clearly identifiable to a particular function. The District does not allocate indirect expenses to functions in the Statement of Activities, except for depreciation. Program revenues include charges paid by the recipients of the goods or services offered by the programs and grants and contributions that are restricted to meeting the operational or capital requirements of a particular program. Revenues that are not classified as program revenues are presented as general revenues. The comparison of program revenues and expenses identifies the extent to which each program or business segment is self-financing or draws from the general revenues of the District. Eliminations have been made to minimize the double counting of internal activities. Net position should be reported as restricted when constraints placed on net position are either externally imposed by creditors (such as through debt covenants), grantors, contributors, or laws or regulations of other governments or imposed by law through constitutional provisions or enabling legislation. The net position restricted for other activities result from special revenue funds and the restrictions on their use.

30
Fremont Unified School District Notes to Financial Statements
June 30, 2020 Fund Financial Statements Fund financial statements report detailed information about the District. The focus of governmental and proprietary fund financial statements is on major funds rather than reporting funds by type. Each major fund is presented in a separate column. Non-major funds are aggregated and presented in a single column. The internal service fund is presented in a single column on the face of the proprietary fund statements. Governmental Funds All governmental funds are accounted for using the flow of current financial resources measurement focus and the modified accrual basis of accounting. With this measurement focus, only current assets and current liabilities generally are included on the balance sheet. The statement of revenues, expenditures, and changes in fund balances reports on the sources (revenues and other financing sources) and uses (expenditures and other financing uses) of current financial resources. This approach differs from the manner in which the governmental activities of the government-wide financial statements are prepared. Governmental fund financial statements, therefore, include reconciliations with brief explanations to better identify the relationship between the government-wide financial statements, prepared using the economic resources measurement focus and the accrual basis of accounting, and the governmental fund financial statements, prepared using the flow of current financial resources measurement focus and the modified accrual basis of accounting.
• Proprietary Funds Proprietary funds are accounted for using the flow of economic resources measurement focus and the accrual basis of accounting. All assets and all liabilities associated with the operation of this fund are included in the statement of net position. The statement of changes in fund net position presents increases (revenues) and decreases (expenses) in net total assets. The statement of cash flows provides information about how the District finances and meets the cash flow needs of its proprietary fund.
• Fiduciary Funds Fiduciary funds are accounted for using the flow of economic resources measurement
focus and the accrual basis of accounting. Fiduciary funds are excluded from the government-wide financial statements because they do not represent resources of the District.
Revenues – Exchange and Non-Exchange Transactions Revenue resulting from exchange transactions, in which each party gives and receives essentially equal value, is recorded on the accrual basis when the exchange takes place. On a modified accrual basis, revenue is recorded in the fiscal year in which the resources are measurable and become available. Available means that the resources will be collected within the current fiscal year or are expected to be collected soon enough thereafter, to be used to pay liabilities of the current fiscal year. The District considers revenues to be available if they are collected within one year after year-end, except for property taxes, which are considered available if collected within 60 days. The following revenue sources are considered to be both measurable and available at fiscal year-end: State apportionments, interest, certain grants, and other local sources. Non-exchange transactions, in which the District receives value without directly giving equal value in return, include property taxes, certain grants, entitlements, and donations. Revenue from property taxes is recognized in the fiscal year in which the taxes are received. Revenue from certain grants, entitlements, and donations is recognized in the fiscal year in which all eligibility requirements have been satisfied. Eligibility requirements include time and purpose restrictions. On a modified accrual basis, revenue from non-exchange transactions must also be available before it can be recognized.

31
Fremont Unified School District Notes to Financial Statements
June 30, 2020 Unearned Revenue Unearned revenues arise when resources are received by the District before it has a legal claim to them, such as when certain grants are received prior to the occurrence of qualifying expenditures. In the subsequent periods, when the District has a legal claim to the resources, the liability for unearned revenue is removed from the balance sheet and the revenue is recognized. Expenses/Expenditures On the accrual basis of accounting, expenses are recognized at the time they are incurred. The measurement focus of governmental fund accounting is on decreases in net financial resources (expenditures) rather than expenses. Expenditures are generally recognized in the accounting period in which the related fund liability is incurred. Principal and interest on long-term liabilities, which has not matured, are recognized when paid in the governmental funds as expenditures. Allocations of costs, such as depreciation and amortization, are not recognized in the governmental funds but are recognized in the entity-wide statements. Cash and Cash Equivalents The District’s cash and cash equivalents are considered to be cash on hand, demand deposits, and short-term investments with original maturities of three months or less from the date of acquisition. Cash equivalents also include cash with county treasury balances for purposes of the statement of cash flows. Investments Investments with original maturities greater than one year are stated at fair value. Fair value is estimated based on quoted market prices at year-end. All investments not required to be reported at fair value are stated at cost or amortized cost. Fair values of investments in county and State investment pools are determined by the program sponsor. Restricted Assets Restricted assets arise when restrictions on their use change the normal understanding of the availability of the asset. Such constraints are either imposed by creditors, contributors, grantors, or laws of other governments or imposed by enabling legislation. Restricted assets in the Bond Interest and Redemption Fund represent investments required by debt covenants to be set aside by the District for the purpose of satisfying certain requirements of the bonded debt issuance. Prepaid Expenditures (Expenses) Certain payments to vendors reflect costs applicable to future accounting periods and are recorded as prepaid items in both the government-wide and fund financial statements. The cost of prepaid items is recorded as expenditures/expenses when consumed rather than when purchased. Stores Inventories Inventories consist of expendable food and supplies held for consumption. Inventories are stated at cost, on the weighted average basis. The costs of inventory items are recorded as expenditures in the governmental funds and expenses in the proprietary funds when consumed rather than when purchased.

32
Fremont Unified School District Notes to Financial Statements
June 30, 2020 Capital Assets and Depreciation The accounting and reporting treatment applied to the capital assets associated with a fund are determined by its measurement focus. Capital assets are long-lived assets of the District. The District maintains a capitalization threshold of $20,000. The District does not possess any infrastructure. Improvements are capitalized; the costs of normal maintenance and repairs that do not add to the value of the asset or materially extend an asset’s life are not capitalized, but are expensed as incurred. When purchased, such assets are recorded as expenditures in the governmental funds and capitalized in the government-wide statement of net position. The valuation basis for capital assets is historical cost, or where historical cost is not available, estimated historical cost based on replacement cost. Donated capital assets are capitalized at acquisition value on the date donated. Capital assets in the proprietary funds are capitalized in the fund in which they are utilized. The valuation basis for proprietary fund capital assets is the same as those used for the capital assets of governmental funds. Depreciation is computed using the straight-line method. Estimated useful lives of the various classes of depreciable capital assets are as follows: buildings and improvements, 25 to 50 years; furniture and equipment, 15 to 20 years; and vehicles, 8 years. Interfund Balances On fund financial statements, receivables and payables resulting from short-term interfund loans are classified as “interfund receivables/payables”. These amounts are eliminated in the governmental and business-type activities columns of the statement of net position, except for the net residual amounts due between governmental and business-type activities, which are presented as internal balances. Compensated Absences Compensated absences are accrued as a liability as the benefits are earned. The entire compensated absence liability is reported on the government-wide statement of net position. For governmental funds, the current portion of unpaid compensated absences is recognized upon the occurrence of relevant events such as employee resignations and retirements that occur prior to year-end that have not yet been paid with expendable available financial resources. These amounts are reported in the fund from which the employees who have accumulated leave are paid. Sick leave is accumulated without limit for each employee at the rate of one day for each month worked. Leave with pay is provided when employees are absent for health reasons; however, the employees do not gain a vested right to accumulated sick leave. Employees are never paid for any sick leave balance at termination of employment or any other time. Therefore, the value of accumulated sick leave is not recognized as a liability in the District’s financial statements. However, credit for unused sick leave is applicable to all classified school members who retire after January 1, 1999. At retirement, each member will receive .004 year of service credit for each day of unused sick leave. Credit for unused sick leave is applicable to all certificated employees and is determined by dividing the number of unused sick days by the number of base service days required to complete the last school year, if employed full-time.

33
Fremont Unified School District Notes to Financial Statements
June 30, 2020 Accrued Liabilities and Long-Term Liabilities All payables, accrued liabilities, and long-term liabilities are reported in the government-wide and proprietary fund financial statements. In general, governmental fund payables and accrued liabilities that, once incurred, are paid in a timely manner and in full from current financial resources are reported as liabilities of the governmental funds. However, claims and judgments, compensated absences, special termination benefits, and contractually required pension contributions that will be paid from governmental funds are reported as a liability in the governmental fund financial statements only to the extent that they are due for payment during the current year. Bonds, capital leases, and other long-term liabilities are recognized as liabilities in the governmental fund financial statements when due. Debt Issuance Costs, Premiums and Discounts In the government-wide financial statements and in the proprietary fund type financial statements, long-term liabilities are reported as liabilities in the applicable governmental activities or proprietary fund statement of net position. Debt premiums and discounts, as well as issuance costs related to prepaid insurance costs are amortized over the life of the bonds using the straight-line method, which approximates the effective interest method. In governmental fund financial statements, bond premiums and discounts, as well as debt issuance costs are recognized in the period the bonds are issued. The face amount of the debt is reported as other financing sources. Premiums received on debt issuance are also reported as other financing sources. Issuance costs, whether or not withheld from the actual debt proceeds, are reported as debt service expenditures in the period the bonds are issued. Deferred Outflows/Inflows of Resources In addition to assets, the Statement of Net Position also reports deferred outflows of resources. This separate financial statement element represents a consumption of net position that applies to a future period and so will not be recognized as an expense or expenditure until then. The District reports deferred outflows of resources for deferred charges on refunding of debt, for pension related items, and for OPEB related items. The deferred charge on refunding resulted from the difference between the carrying value of the refunded debt and its reacquisition price. The amount is deferred and amortized over the shorter of the life of the refunded or refunding debt. The deferred amounts related to pension and OPEB relate to differences between expected and actual earnings on investments, changes of assumptions, and other pension and OPEB related changes. In addition to liabilities, the Statement of Net Position reports a separate section for deferred inflows of resources. This separate financial statement element represents an acquisition of net position that applies to a future period and so will not be recognized as revenue until then. The District reports deferred inflows of resources for deferred charges on refunding of debt, for pension related items, and for OPEB related items.

34
Fremont Unified School District Notes to Financial Statements
June 30, 2020 Pensions For purposes of measuring the net pension liability and deferred outflows/inflows of resources related to pensions, and pension expense, information about the fiduciary net position of the California State Teachers Retirement System (CalSTRS) and the California Public Employees’ Retirement System (CalPERS) plan for schools (Plans) and additions to/deductions from the Plans’ fiduciary net position have been determined on the same basis as they are reported by CalSTRS and CalPERS. For this purpose, benefit payments (including refunds of employee contributions) are recognized when due and payable in accordance with the benefit terms. Member contributions are recognized in the period in which they are earned. Investments are reported at fair value. The net pension liability attributable to the governmental activities will be paid by the fund in which the employee worked. Postemployment Benefits Other Than Pensions (OPEB) For purposes of measuring the net OPEB liability, deferred outflows of resources and deferred inflows of resources related to OPEB, and OPEB expense, information about the fiduciary net position of the District Plan and additions to/deductions from the District Plan have been determined on the same basis as they are reported by the District Plan. For this purpose, the District Plan recognizes benefit payments when due and payable in accordance with the benefit terms. Investments are reported at fair value, except for money market investments and participating interest-earning investment contracts that have a maturity at the time of purchase of one year or less, which are reported at cost. The total OPEB liability attributable to the governmental activities will be paid primarily by the General Fund. Fund Balances - Governmental Funds As of June 30, 2020, fund balances of the governmental funds are classified as follows: Nonspendable - amounts that cannot be spent either because they are in nonspendable form or because they are legally or contractually required to be maintained intact. Restricted - amounts that can be spent only for specific purposes because of constitutional provisions or enabling legislation or because of constraints that are externally imposed by creditors, grantors, contributors, or the laws or regulations of other governments. Committed - amounts that can be used only for specific purposes determined by a formal action of the governing board. The governing board is the highest level of decision-making authority for the District. Commitments may be established, modified, or rescinded only through resolutions or other action as approved by the governing board. The District currently does not have any committed funds. Assigned - amounts that do not meet the criteria to be classified as restricted or committed but that are intended to be used for specific purposes. Under the District’s adopted policy, only the governing board or chief business officer/assistant superintendent of business services may assign amounts for specific purposes. Unassigned - all other spendable amounts.

35
Fremont Unified School District Notes to Financial Statements
June 30, 2020 Spending Order Policy When an expenditure is incurred for purposes for which both restricted and unrestricted fund balance is available, the District considers restricted funds to have been spent first. When an expenditure is incurred for which committed, assigned, or unassigned fund balances are available, the District considers amounts to have been spent first out of committed funds, then assigned funds, and finally unassigned funds, as needed, unless the governing board has provided otherwise in its commitment or assignment actions. Minimum Fund Balance Policy The governing board adopted a minimum fund balance policy for the General Fund in order to protect the district against revenue shortfalls or unpredicted on-time expenditures. For a District this size, the policy requires a Reserve for Economic Uncertainties consisting of unassigned amounts equal to no less than 2 percent of General Fund expenditures and other financing uses. Net Position Net position represents the difference between assets and deferred outflows of resources, and liabilities and deferred inflows of resources. Net position net of investment in capital assets consists of capital assets, net of accumulated depreciation, reduced by the outstanding balances of any borrowings used for the acquisition, construction, or improvement of those assets. Net position is reported as restricted when there are limitations imposed on their use either through the enabling legislation adopted by the District or through external restrictions imposed by creditors, grantors, or laws or regulations of other governments. The District first applies restricted resources when an expense is incurred for purposes for which both restricted and unrestricted net position is available. The government-wide financial statements report $72,115,585 of restricted net position, of which is restricted by enabling legislation. Operating Revenues and Expenses Operating revenues are those revenues that are generated directly from the primary activity of the proprietary funds. For the District, these revenues are interfund insurance premiums. Operating expenses are necessary costs incurred to provide the good or service that is the primary activity of the fund. All revenues and expenses not meeting this definition are reported as nonoperating revenues and expenses. .

36
Fremont Unified School District Notes to Financial Statements
June 30, 2020 Interfund Activity Transfers between governmental and business-type activities in the government-wide financial statements are reported in the same manner as general revenues. Exchange transactions between funds are reported as revenues in the seller funds and as expenditures/expenses in the purchaser funds. Flows of cash or goods from one fund to another without a requirement for repayment are reported as interfund transfers. Interfund transfers are reported as other financing sources/uses in governmental funds and after non-operating revenues/expenses in proprietary funds. Repayments from funds responsible for particular expenditures/expenses to the funds that initially paid for them are not presented in the financial statements. Interfund transfers are eliminated in the governmental and business-type activities columns of the Statement of Activities, except for the net residual amounts transferred between governmental and business-type activities. Estimates The preparation of the financial statements in conformity with accounting principles generally accepted in the United States of America requires management to make estimates and assumptions that affect the amounts reported in the financial statements and accompanying notes. Actual results may differ from those estimates. Property Tax Secured property taxes attach as an enforceable lien on property as of January 1. Taxes are payable in two installments on November 1 and February 1 and become delinquent on December 10 and April 10, respectively. Unsecured property taxes are payable in one installment on or before August 31. The County of Alameda bills and collects the taxes on behalf of the District. Local property tax revenues are recorded when received.

37
Fremont Unified School District Notes to Financial Statements
June 30, 2020 Change in Accounting Principles In May 2020, the GASB issued Statement No. 95, Postponement of the Effective Dates of Certain Authoritative Guidance. The primary objective of this Statement is to provide temporary relief to governments and other stakeholders in light of the COVID-19 pandemic. That objective is accomplished by postponing the effective dates of certain provisions in Statements and Implementation Guides that first became effective or are scheduled to become effective for periods beginning after June 15, 2018, and later. The effective dates of certain provisions contained in the following pronouncements are postponed by one year:
• Statement No. 83, Certain Asset Retirement Obligations • Statement No. 84, Fiduciary Activities • Statement No. 88, Certain Disclosures Related to Debt, including Direct Borrowings and Direct Placements • Statement No. 89, Accounting for Interest Cost Incurred before the End of a Construction Period • Statement No. 90, Majority Equity Interests • Statement No. 91, Conduit Debt Obligations • Statement No. 92, Omnibus 2020 • Statement No. 93, Replacement of Interbank Offered Rates • Implementation Guide No. 2017-3, Accounting and Financial Reporting for Postemployment Benefits
Other Than Pensions (and Certain Issues Related to OPEB Plan Reporting) • Implementation Guide No. 2018-1, Implementation Guidance Update—2018 • Implementation Guide No. 2019-1, Implementation Guidance Update—2019 • Implementation Guide No. 2019-2, Fiduciary Activities. • The effective dates of the following pronouncements are postponed by 18 months: • Statement No. 87, Leases • Implementation Guide No. 2019-3, Leases.
The provisions of this Statement have been implemented as of June 30, 2020. New Accounting Pronouncements In January 2017, the GASB issued Statement No. 84, Fiduciary Activities. The objective of this Statement is to improve guidance regarding the identification of fiduciary activities for accounting and financial reporting purposes and how those activities should be reported. This Statement establishes criteria for identifying fiduciary activities of all State and local governments. The focus of the criteria generally is on (1) whether a government is controlling the assets of the fiduciary activity and (2) the beneficiaries with whom a fiduciary relationship exists. Separate criteria are included to identify fiduciary component units and postemployment benefit arrangements that are fiduciary activities. The requirements of this Statement are effective for the reporting periods beginning after December 15, 2019 due to the implementation of GASB Statements No. 95 previously discussed. Early implementation is encouraged. The effects of this change on the District’s financial statements have not yet been determined.

38
Fremont Unified School District Notes to Financial Statements
June 30, 2020
In June 2017, the GASB issued Statement No. 87, Leases. The objective of this Statement is to better meet the information needs of financial statement users by improving accounting and financial reporting for leases by governments. This Statement increases the usefulness of governments’ financial statements by requiring recognition of certain lease assets and liabilities for leases that previously were classified as operating leases and recognized as inflows of resources or outflows of resources based on the payment provisions of the contract. It establishes a single model for lease accounting based on the foundational principle that leases are financings of the right to use an underlying asset. Under this Statement, a lessee is required to recognize a lease liability and an intangible right-to-use lease asset, and a lessor is required to recognize a lease receivable and a deferred inflow of resources, thereby enhancing the relevance and consistency of information about governments’ leasing activities. The requirements of this Statement are effective for the reporting periods beginning after December 15, 2019. Early implementation is encouraged. The effects of this change on the District’s financial statements have not yet been determined. In June 2018, the GASB issued Statement No. 89, Accounting for Interest Cost Incurred Before the End of a Construction Period. The objectives of this Statement are (1) to enhance the relevance and comparability of information about capital assets and the cost of borrowing for a reporting period and (2) to simplify accounting for interest cost incurred before the end of a construction period. This Statement establishes accounting requirements for interest cost incurred before the end of a construction period. Such interest cost includes all interest that previously was accounted for in accordance with the requirements of paragraphs 5–22 of Statement No. 62, Codification of Accounting and Financial Reporting Guidance Contained in Pre-November 30, 1989 FASB and AICPA Pronouncements, which are superseded by this Statement. This Statement requires that interest cost incurred before the end of a construction period be recognized as an expense in the period in which the cost is incurred for financial statements prepared using the economic resources measurement focus. As a result, interest cost incurred before the end of a construction period will not be included in the historical cost of a capital asset reported in a business-type activity or enterprise fund. This Statement also reiterates that in financial statements prepared using the current financial resources measurement focus, interest cost incurred before the end of a construction period should be recognized as an expenditure on a basis consistent with governmental fund accounting principles. The requirements of this Statement are effective for reporting periods beginning after December 15, 2019. Earlier application is encouraged. The requirements of this Statement should be applied prospectively. The effects of this change on the District’s financial statements have not yet been determined. In August 2018, the GASB issued Statement 90, Majority Equity Interests – An Amendment of GASB Statements No. 14 and No. 60. The primary objectives of this Statement are to improve the consistency and comparability of reporting a government’s majority equity interest in a legally separate organization and to improve the relevance of financial statement information for certain component units. It defines a majority equity interest and specifies that a majority equity interest in a legally separate organization should be reported as an investment if a government’s holding of the equity interest meets the definition of an investment. A majority equity interest that meets the definition of an investment should be measured using the equity method, unless it is held by a special-purpose government engaged only in fiduciary activities, a fiduciary fund, or an endowment (including permanent and term endowments) or permanent fund. Those governments and funds should measure the majority equity interest at fair value.

39
Fremont Unified School District Notes to Financial Statements
June 30, 2020 For all other holdings of a majority equity interest in a legally separate organization, a government should report the legally separate organization as a component unit, and the government or fund that holds the equity interest should report an asset related to the majority equity interest using the equity method. This Statement establishes that ownership of a majority equity interest in a legally separate organization results in the government being financially accountable for the legally separate organization and, therefore, the government should report that organization as a component unit. This Statement also requires that a component unit in which a government has a 100 percent equity interest account for its assets, deferred outflows of resources, liabilities, and deferred inflows of resources at acquisition value at the date the government acquired a 100 percent equity interest in the component unit. Transactions presented in flows statements of the component unit in that circumstance should include only transactions that occurred subsequent to the acquisition. The requirements of this Statement are effective for reporting periods beginning after December 15, 2018. Earlier application is encouraged. The requirements of this Statement should be applied prospectively. The effects of this change on the District’s financial statements have not yet been determined. In May 2019, the GASB issued Statement No. 91, Conduit Debt Obligations. The primary objectives of this Statement are to provide a single method of reporting conduit debt obligations by issuers and eliminate diversity in practice associated with (1) commitments extended by issuers, (2) arrangements associated with conduit debt obligations, and (3) related note disclosures. This Statement achieves those objectives by clarifying the existing definition of a conduit debt obligation; establishing that a conduit debt obligation is not a liability of the issuer; establishing standards for accounting and financial reporting of additional commitments and voluntary commitments extended by issuers and arrangements associated with conduit debt obligations; and improving required note disclosures. A conduit debt obligation is defined as a debt instrument having all of the following characteristics:
• There are at least three parties involved: (1) an issuer, (2) a third-party obligor, and (3) a debt holder or a debt trustee.
• The issuer and the third-party obligor are not within the same financial reporting entity. • The debt obligation is not a parity bond of the issuer, nor is it cross-collateralized with other debt of the
issuer. • The third-party obligor or its agent, not the issuer, ultimately receives the proceeds from the debt
issuance. • The third-party obligor, not the issuer, is primarily obligated for the payment of all amounts associated
with the debt obligation (debt service payments). All conduit debt obligations involve the issuer making a limited commitment. Some issuers extend additional commitments or voluntary commitments to support debt service in the event the third party is, or will be, unable to do so.

40
Fremont Unified School District Notes to Financial Statements
June 30, 2020 An issuer should not recognize a conduit debt obligation as a liability. However, an issuer should recognize a liability associated with an additional commitment or a voluntary commitment to support debt service if certain recognition criteria are met. As long as a conduit debt obligation is outstanding, an issuer that has made an additional commitment should evaluate at least annually whether those criteria are met. An issuer that has made only a limited commitment should evaluate whether those criteria are met when an event occurs that causes the issuer to reevaluate its willingness or ability to support the obligor’s debt service through a voluntary commitment. This Statement also addresses arrangements—often characterized as leases—that are associated with conduit debt obligations. In those arrangements, capital assets are constructed or acquired with the proceeds of a conduit debt obligation and used by third-party obligors in the course of their activities. Payments from third-party obligors are intended to cover and coincide with debt service payments. During those arrangements, issuers retain the titles to the capital assets. Those titles may or may not pass to the obligors at the end of the arrangements. Issuers should not report those arrangements as leases, nor should they recognize a liability for the related conduit debt obligations or a receivable for the payments related to those arrangements. In addition, the following provisions apply:
• If the title passes to the third-party obligor at the end of the arrangement, an issuer should not recognize a capital asset.
• If the title does not pass to the third-party obligor and the third party has exclusive use of the entire capital asset during the arrangement, the issuer should not recognize a capital asset until the arrangement ends.
• If the title does not pass to the third-party obligor and the third party has exclusive use of only portions of the capital asset during the arrangement, the issuer, at the inception of the arrangement, should recognize the entire capital asset and a deferred inflow of resources. The deferred inflow of resources should be reduced, and an inflow recognized, in a systematic and rational manner over the term of the arrangement.
This Statement requires issuers to disclose general information about their conduit debt obligations, organized by type of commitment, including the aggregate outstanding principal amount of the issuers’ conduit debt obligations and a description of each type of commitment. Issuers that recognize liabilities related to supporting the debt service of conduit debt obligations also should disclose information about the amount recognized and how the liabilities changed during the reporting period. The requirements of this Statement are effective for the reporting periods beginning after December 15, 2020. Early implementation is encouraged. The effects of this change on the District’s financial statements have not yet been determined.

41
Fremont Unified School District Notes to Financial Statements
June 30, 2020 In January 2020, the GASB issued Statement No. 92, Omnibus 2020. The objectives of this statement are to enhance comparability in accounting and financial reporting and to improve the consistency of authoritative literature by addressing practice issues that have been identified during implementation and application of certain GASB Statements. This Statement addresses a variety of topics and includes specific provisions about the following:
• The effective date of Statement No. 87, Leases, and Implementation Guide No. 2019-3, Leases, for interim financial reporting
• Reporting of intra-entity transfers of assets between a primary government employer and a component unit defined benefit pension plan or defined benefit other postemployment benefit (OPEB) plan
• The applicability of Statement No. 73, Accounting and Financial Reporting for Pensions and Related Assets That Are Not within the Scope of GASB Statement No. 68, Financial Reporting for Postemployment Benefit Plans Other Than Pension Plans, as amended, to reporting assets accumulated for postemployment benefits
• The applicability of certain requirements of Statement No. 84, Fiduciary Activities, to postemployment benefit arrangements
• Measurement of liabilities (and assets, if any) related to asset retirement obligations (AROs) in a government acquisition
• Reporting by public entity risk pools for amounts that are recoverable from reinsurers or excess insurers • Reference to nonrecurring fair value measurements of assets or liabilities in authoritative literature • Terminology used to refer to derivative instruments
The requirements of this Statement are effective as follows:
• The requirements related to the effective date of Statement 87 and Implementation Guide 2019-3, reinsurance recoveries, and terminology used to refer to derivative instruments are effective upon issuance.
• The requirements related to intra-entity transfers of assets and those related to the applicability of Statements 73 and 74 are effective for fiscal years beginning after June 15, 2020.
• The requirements related to application of Statement 84 to postemployment benefit arrangements and those related to nonrecurring fair value measurements of assets or liabilities are effective for reporting periods beginning after June 15, 2020.
• The requirements related to the measurement of liabilities (and assets, if any) associated with AROs in a government acquisition are effective for government acquisitions occurring in reporting periods beginning after June 15, 2020.
Early implementation is encouraged. The effects of this change on the District’s financial statements have not yet been determined.

42
Fremont Unified School District Notes to Financial Statements
June 30, 2020 In March 2020, the GASB issued Statement No. 93, Replacement of Interbank Offered Rates. The objective of this Statement is to address those and other accounting and financial reporting implications that result from the replacement of an IBOR (Interbank Offered Rate). This Statement achieves that objective by:
• Providing exceptions for certain hedging derivative instruments to the hedge accounting termination provisions when an IBOR is replaced as the reference rate of the hedging derivative instrument’s variable payment
• Clarifying the hedge accounting termination provisions when a hedged item is amended to replace the reference rate
• Clarifying that the uncertainty related to the continued availability of IBORs does not, by itself, affect the assessment of whether the occurrence of a hedged expected transaction is probable
• Removing LIBOR as an appropriate benchmark interest rate for the qualitative evaluation of the effectiveness of an interest rate swap
• Identifying a Secured Overnight Financing Rate and the Effective Federal Funds Rate as appropriate benchmark interest rates for the qualitative evaluation of the effectiveness of an interest rate swap
• Clarifying the definition of reference rate, as it is used in Statement 53, as amended • Providing an exception to the lease modifications guidance in Statement 87, as amended, for certain lease
contracts that are amended solely to replace an IBOR as the rate upon which variable payments depend. The removal of LIBOR as an appropriate benchmark interest rate is effective for reporting periods ending after December 31, 2021. All other requirements of this Statement are effective for reporting periods beginning after June 15, 2020. Early implementation is encouraged. The effects of this change on the District’s financial statements have not yet been determined. In March 2020, the GASB issued Statement No. 94, Public-Private and Public-Public Partnerships and Availability Payment Arrangements. The primary objective of this Statement is to improve financial reporting by addressing issues related to public-private and public-public partnership arrangements (PPPs). As used in this Statement, a PPP is an arrangement in which a government (the transferor) contracts with an operator (a governmental or nongovernmental entity) to provide public services by conveying control of the right to operate or use a nonfinancial asset, such as infrastructure or other capital asset (the underlying PPP asset), for a period of time in an exchange or exchange-like transaction. Some PPPs meet the definition of a service concession arrangement (SCA), which the Board defines in this Statement as a PPP in which (1) the operator collects and is compensated by fees from third parties; (2) the transferor determines or has the ability to modify or approve which services the operator is required to provide, to whom the operator is required to provide the services, and the prices or rates that can be charged for the services; and (3) the transferor is entitled to significant residual interest in the service utility of the underlying PPP asset at the end of the arrangement. This Statement also provides guidance for accounting and financial reporting for availability payment arrangements (APAs). As defined in this Statement, an APA is an arrangement in which a government compensates an operator for services that may include designing, constructing, financing, maintaining, or operating an underlying nonfinancial asset for a period of time in an exchange or exchange-like transaction. The requirements of this Statement are effective for fiscal years beginning after June 15, 2022, and all reporting periods thereafter. Earlier application is encouraged. The effects of this change on the District’s financial statements have not yet been determined.

43
Fremont Unified School District Notes to Financial Statements
June 30, 2020 In May 2020, the GASB issued Statement No. 96, Subscription-Based Information Technology Arrangements. This Statement provides guidance on the accounting and financial reporting for subscription-based information technology arrangements (SBITAs) for government end users (governments). This Statement (1) defines a SBITA; (2) establishes that a SBITA results in a right-to-use subscription asset—an intangible asset—and a corresponding subscription liability; (3) provides the capitalization criteria for outlays other than subscription payments, including implementation costs of a SBITA; and (4) requires note disclosures regarding a SBITA. To the extent relevant, the standards for SBITAs are based on the standards established in Statement No. 87, Leases, as amended. A SBITA is defined as a contract that conveys control of the right to use another party’s (a SBITA vendor’s) information technology (IT) software, alone or in combination with tangible capital assets (the underlying IT assets), as specified in the contract for a period of time in an exchange or exchange-like transaction. The requirements of this Statement are effective for fiscal years beginning after June 15, 2022, and all reporting periods thereafter. Earlier application is encouraged. The effects of this change on the District’s financial statements have not yet been determined. In June 2020, the GASB issued Statement No. 97, Certain Component Unit Criteria, and Accounting and Financial Reporting for Internal Revenue Code Section 457 Deferred Compensation Plans—an amendment of GASB Statements No. 14 and No. 84, and a supersession of GASB Statement No. 32. The primary objectives of this Statement are to (1) increase consistency and comparability related to the reporting of fiduciary component units in circumstances in which a potential component unit does not have a governing board and the primary government performs the duties that a governing board typically would perform; (2) mitigate costs associated with the reporting of certain defined contribution pension plans, defined contribution other postemployment benefit (OPEB) plans, and employee benefit plans other than pension plans or OPEB plans (other employee benefit plans) as fiduciary component units in fiduciary fund financial statements; and (3) enhance the relevance, consistency, and comparability of the accounting and financial reporting for Internal Revenue Code (IRC) Section 457 deferred compensation plans (Section 457 plans) that meet the definition of a pension plan and for benefits provided through those plans. The requirements of this Statement that (1) exempt primary governments that perform the duties that a governing board typically performs from treating the absence of a governing board the same as the appointment of a voting majority of a governing board in determining whether they are financially accountable for defined contribution pension plans, defined contribution OPEB plans, or other employee benefit plans and (2) limit the applicability of the financial burden criterion in paragraph 7 of Statement 84 to defined benefit pension plans and defined benefit OPEB plans that are administered through trusts that meet the criteria in paragraph 3 of Statement 67 or paragraph 3 of Statement 74, respectively, are effective immediately. The requirements of this Statement that are related to the accounting and financial reporting for Section 457 plans are effective for fiscal years beginning after June 15, 2021. For purposes of determining whether a primary government is financially accountable for a potential component unit, the requirements of this Statement that provide that for all other arrangements, the absence of a governing board be treated the same as the appointment of a voting majority of a governing board if the primary government performs the duties that a governing board typically would perform, are effective for reporting periods beginning after June 15, 2021. Earlier application of those requirements is encouraged and permitted by requirement as specified within this Statement.

44
Fremont Unified School District Notes to Financial Statements
June 30, 2020 The Board considered the effective dates for the requirements of this Statement in light of the COVID-19 pandemic and in concert with Statement No. 95, Postponement of the Effective Dates of Certain Authoritative Guidance. The effects of this change on the District’s financial statements have not yet been determined. Note 2 - Deposits and Investments Summary of Deposits and Investments Deposits and investments as of June 30, 2020, are classified in the accompanying financial statements as follows: Governmental funds 230,834,318$ Proprietary funds 394,017 Fiduciary funds 2,108,502
Total deposits and investments 233,336,837$
Deposits and investments as of June 30, 2020, consist of the following: Cash on hand and in banks 3,979,377$ Cash in revolving accounts 100,013 Investments 229,257,447
Total deposits and investments 233,336,837$
Policies and Practices The District is authorized under California Government Code to make direct investments in local agency bonds, notes, or warrants within the State; U.S. Treasury instruments; registered State warrants or treasury notes; securities of the U.S. Government, or its agencies; bankers acceptances; commercial paper; certificates of deposit placed with commercial banks and/or savings and loan companies; repurchase or reverse repurchase agreements; medium term corporate notes; shares of beneficial interest issued by diversified management companies, certificates of participation, obligations with first priority security; and collateralized mortgage obligations. Investment in County Treasury - The District is considered to be an involuntary participant in an external investment pool as the District is required to deposit all receipts and collections of monies with their County Treasurer (Education Code Section 41001). The fair value of the District’s investment in the pool is reported in the accounting financial statements at amounts based upon the District’s pro-rata share of the fair value provided by the County Treasurer for the entire portfolio (in relation to the amortized cost of that portfolio). The balance available for withdrawal is based on the accounting records maintained by the County Treasurer, which is recorded on the amortized cost basis.

45
Fremont Unified School District Notes to Financial Statements
June 30, 2020 Investment in the State Investment Pool - The District is a voluntary participant in the Local Agency Investment Fund (LAIF) that is regulated by California government code Section 16429 under the oversight of the Treasurer of the State of California. The fair value of the District’s investment in the Pool is reported in the accompanying financial statement at amounts based upon the District’s pro-rata share of the fair value provided by LAIF for the entire LAIF portfolio (in relation to the amortized cost of that portfolio). The balance available for withdrawal is based on the accounting records maintained by LAIF, which is recorded on the amortized cost basis. General Authorizations Limitations as they relate to interest rate risk, credit risk, and concentration of credit risk are indicated in the schedules below:
Maximum Maximum MaximumRemaining Percentage InvestmentMaturity of Portfolio in One Issuer
Local Agency Bonds, Notes, Warrants 5 years None NoneRegistered State Bonds, Notes, Warrants 5 years None NoneU.S. Treasury Obligations 5 years None NoneU.S. Agency Securities 5 years None NoneBanker's Acceptance 180 days 40% 30%Commercial Paper 270 days 25% 10%Negotiable Certificates of Deposit 5 years 30% NoneRepurchase Agreements 1 year None NoneReverse Repurchase Agreements 92 days 20% of base NoneMedium-Term Corporate Notes 5 years 30% NoneMutual Funds N/A 20% 10%Money Market Mutual Funds N/A 20% 10%Mortgage Pass-Through Securities 5 years 20% NoneCounty Pooled Investment Funds N/A None NoneLocal Agency Investment Fund (LAIF) N/A None NoneJoint Powers Authority Pools N/A None None
AuthorizedInvestment Type
Interest Rate Risk Interest rate risk is the risk that changes in market interest rates will adversely affect the fair value of an investment. Generally, the longer the maturity of an investment, the greater the sensitivity of its fair value to changes in market interest rates. The District manages its exposure to interest rate risk by investing in the County Pool (and LAIF) which purchase a combination of shorter term and longer term investments and by timing cash flows from maturities so that a portion of the portfolio is maturing or coming close to maturity evenly over time as necessary to provide the cash flow and liquidity needed for operations.

46
Fremont Unified School District Notes to Financial Statements
June 30, 2020
Weighted Average Maturity The District monitors the interest rate risk inherent in its portfolio by measuring the weighted average maturity of its portfolio. Information about the weighted average maturity of the District’s portfolio is presented in the following schedule:
WeightedAverage
Reported MaturityAmount in Years
State Investment Pool 221 193 daysCounty Investment Pool 229,257,226 674 days
Total 229,257,447$
Investment Type
Custodial Credit Risk - Deposits This is the risk that in the event of a bank failure, the District’s deposits may not be returned to it. The District does not have a policy for custodial credit risk for deposits. However, the California Government Code requires that a financial institution secure deposits made by State or local governmental units by pledging securities in an undivided collateral pool held by a depository regulated under state law (unless so waived by the governmental unit). The market value of the pledged securities in the collateral pool must equal at least 110 percent of the total amount deposited by the public agency. California law also allows financial institutions to secure public deposits by pledging first trust deed mortgage notes having a value of 150 percent of the secured public deposits and letters of credit issued by the Federal Home Loan Bank of San Francisco having a value of 105 percent of the secured deposits. As of June 30, 2020, approximately $6,000,000 of the District’s bank balance of was exposed to custodial credit risk because it was uninsured and collateralized with securities held by the pledging financial institution’s trust department or agent, but not in the name of the District.
Note 3 - Receivables
Receivables at June 30, 2020, consisted of intergovernmental grants, entitlements, interest and other local sources. All receivables are considered collectible in full.
Capital Bond Interest Non-MajorGeneral Building Facilities and Redemption Governmental Proprietary
Fund Fund Fund Fund Funds Total Funds
Federal GovernmentCategorical aid 10,462,833$ -$ -$ -$ 322,969$ 10,785,802$ -$
State GovernmentLCFF apportionment 14,980,425 - - - 459,584 15,440,009 - Categorical aid 3,022,242 - - - 146,118 3,168,360 - Lottery 1,755,635 - - - 23,657 1,779,292 - Other State - - - - - - -
Local Government Interest 193,824 520,835 127,120 164,306 271,846 1,277,931 - Other local sources 5,151,837 - - - 181,861 5,333,698 3,048
Total 35,566,796$ 520,835$ 127,120$ 164,306$ 1,406,035$ 37,785,092$ 3,048$

47
Fremont Unified School District Notes to Financial Statements
June 30, 2020 Note 4 - Capital Assets Capital asset activity for the fiscal year ended June 30, 2020, was as follows:
Balance Adjustments/ BalanceJuly 1, 2019 Additions Deductions June 30, 2020
Governmental ActivitiesCapital assets not being depreciated
Land 77,335,636$ -$ -$ 77,335,636$ Construction in progress 153,461,970 87,516,932 (12,389,307) 228,589,595
Total capital assetsnot being depreciated 230,797,606 87,516,932 (12,389,307) 305,925,231
Capital assets being depreciated Land improvements 47,457,033 117,156 - 47,574,189 Buildings and improvements 515,719,472 12,272,151 - 527,991,623 Furniture and equipment 16,827,782 147,292 (154,685) 16,820,389
Total capital assets beingdepreciated 580,004,287 12,536,599 (154,685) 592,386,201
Total capital assets 810,801,893 100,053,531 (12,543,992) 898,311,432
Accumulated depreciation Land improvements (30,839,105) (630,562) - (31,469,667) Buildings and improvements (224,121,002) (11,556,230) - (235,677,232) Furniture and equipment (11,508,021) (705,767) - (12,213,788)
Total accumulateddepreciation (266,468,128) (12,892,559) - (279,360,687)
Governmental activitiescapital assets, net 544,333,765$ 87,160,972$ (12,543,992)$ 618,950,745$

48
Fremont Unified School District Notes to Financial Statements
June 30, 2020 Depreciation expense was charged as a direct expense to governmental functions as follows: Governmental Activities
Instruction 8,520,163$ Supervision of instruction 482,511 Instructional library, media, and technology 121,555 School site administration 821,078 Home-to-school transportation 312,532 Food services 203,906 Ancillary service 42,894 Community serivces 17,346 Enterprise 7,832 All other pupil services 410,085 Data processing 177,938 All other administration 687,608 Plant services 1,087,111
Total depreciation expenses governmental activities 12,892,559$
Note 5 - Interfund Transactions Interfund Receivables/Payables (Due To/Due From) Interfund receivable and payable balances arise from interfund transactions and are recorded by all funds affected in the period in which transactions are executed. Interfund receivable and payable balances at June 30, 2020, between major and non-major governmental funds, non-major enterprise funds, internal service funds, and fiduciary funds are as follows:
General Building Capital
Fund Fund Facilities Fund Total
General Fund -$ 120,798$ -$ 120,798$ Non-Major Governmental Funds 600,848 - 650,000 1,250,848
Total 600,848$ 120,798$ 650,000$ 1,371,646$
Due From
Due To
All remaining balance resulted from the time lag between the date that (1) interfund goods and services are provided or reimbursable expenditures occur, (2) transaction are recorded in the accounting system, and (3) payments between funds are made.

49
Fremont Unified School District Notes to Financial Statements
June 30, 2020 Operating Transfers Interfund transfers for the year ended June 30, 2020, consisted of the following:
Non-MajorGeneral Governmental
Fund Funds Total
Building Fund -$ 2,962,646$ 2,962,646$ Capital Facilities Fund - 1,216,496 1,216,496 Non-Major Governmental Funds 1,355,749 - 1,355,749
Total 1,355,749$ 4,179,142$ 5,534,891$
1,355,749$ to make a contribution to CNS.
1,456,963 Elementary school construction project.
Non-major County Facilities Fund transferred to Building to 1,505,683 reimburse Mattos Elementary school contruction project.
Non-major Special reserve Fund for Capital Outlay transferred 1,216,496 to Capital Facilities to make debt service payment.
Total 5,534,891$
Transfer From
Transfer To
Non-Major County School Facilities Fund transferred to Building Fund to
The General Fund transferred to the Cafeteria Non-Major Governemtal Fund
Interfund transfers are used to (1) move revenues from the fund that statute or budget requires to collect them to the fund that statute or budget requires to expend them, (2) move receipts restricted to debt service from the funds collecting the receipts to the debt service fund as debt service payments become due, and (3) use unrestricted revenues collected in the General Fund to finance various programs accounted for in other funds in accordance with budgetary authorizations.

50
Fremont Unified School District Notes to Financial Statements
June 30, 2020 Note 6 - Accounts Payable Accounts payable at June 30, 2020, consisted of the following:
Capital Non-MajorGeneral Building Facilities Governmental Proprietary
Fund Fund Fund Funds Total Funds
Vendor payables 29,550,038$ 5,981,747$ 696,173$ 3,976,194$ 40,204,152$ 348,069$ State LCFF apportionment - - - - - - Salaries and benefits 1,932,424 - - 1,932,424 3,864,848 -
Total 31,482,462$ 5,981,747$ 696,173$ 5,908,618$ 44,069,000$ 348,069$
Note 7 - Unearned Revenue Unearned revenue at June 30, 2020, consisted of the following:
GeneralFund
Federal financial assistance 113,530$ State categorical aid 38,835 Other local 34,817
Total 187,182$

51
Fremont Unified School District Notes to Financial Statements
June 30, 2020 Note 8 - Long-Term Liabilities other than OPEB and Pensions Summary The changes in the District’s long-term liabilities other than OPEB and pensions during the year consisted of the following:
Balance Balance Due in July 1, 2019 Additions Deductions June 30, 2020 One Year
Long-Term LiabilitiesGeneral obligation bonds 465,755,000$ -$ (29,080,000)$ 436,675,000$ 25,800,000$ Certificates of participation 63,095,000 - (1,305,000) 61,790,000 1,405,000 Unamortized debt premiums 21,460,527 - (1,699,782) 19,760,745 1,404,086 Compensated absences 1,730,600 775,135 - 2,505,735 -
Total 552,375,802$ 780,186$ (32,097,833)$ 521,058,155$ 28,609,086$
Payments on the general obligation bonds are made by the bond interest and redemption fund with local revenues. The Adult Fund makes payments for the Certificates of Participation. The compensated absences will be paid by the fund for which the employee worked. The District’s 2015 outstanding certificates of participation are secured with collateral of the District’s American High School and Brookvale Elementary School, While the 2017 COPE’s are collateralized by the District’s Fremont Adult School. Bonded Debt The outstanding general obligation bonded debt is as follows: Election of 2014 On June 3, 2014, an election was held at which the requisite fifty-five percent or more of the registered voters of the District authorized the issuance and sale of $650,000,000 general obligation bonds. The bonds were issued to repair, upgrade, acquire, construct, and equip certain District property and facilities and to pay the costs of issuing the bonds. On December 9, 2014, the District issued Series A in the amount of $140,000,000. The bonds were issued as follows $73,670,000 in serial bonds with stated interest rates of 4.0% and maturities ranging between August 1,2015 and 2039, and $66,330,000 in term bonds with stated interest rate of 4.0% and maturing August 1, 2046.On March 24, 2016, the District issued Series B in the amount of $130,000,000. The bonds were issued as follows: $90,045,000 in serial bonds with stated interest rates ranging between 3.0% and 4.0% and maturities between August 1, 2017 and 2040, and $39,955,000 in term bonds with a stated interest rate of 4.0% and maturing on August 1, 2045.

52
Fremont Unified School District Notes to Financial Statements
June 30, 2020 On October 10, 2018, the District issued Series C in the amount of $127,000,000. The bonds were issued as follows: $85,810,000 in serial bonds with stated interest rates ranging between 3.25% and 5.0% and maturities between August 1, 2019 and 2038, and $41,190,000 in term bonds with a stated interest rate of 4.0% and maturing on August 1, 2043. A summary of outstanding general obligation bonds issued and outstanding as of June 30, 2020, is presented below:
Final Bonds BondsIssuance Maturity Interest Original Outstanding Outstanding
Date Date Rate Issue July 1, 2019 Redeemed June 30, 2020
12/22/2009 8/1/2020 2.0%-5.0% 40,740,000$ 8,040,000$ (4,365,000)$ 3,675,000$ 2/9/2012 8/1/2026 2.0%-5.0% 61,210,000 57,050,000 (1,775,000) 55,275,000
12/18/2012 8/1/2030 2.0%-5.0% 80,415,000 74,365,000 (2,445,000) 71,920,000 12/9/2014 8/1/2046 4% 140,000,000 103,950,000 - 103,950,000 3/24/2016 8/1/2045 2.0%-4.0% 130,000,000 95,350,000 - 95,350,000
10/10/2018 8/1/2043 3.25%-5.0% 127,000,000 127,000,000 (20,495,000) 106,505,000
465,755,000$ (29,080,000)$ 436,675,000$
Debt Service Requirements to Maturity The bonds mature through 2047 as follows:
Interest toFiscal Year Principal Maturity Total
25,800,000$ 16,329,125$ 42,129,125$ 8,245,000 15,558,450 23,803,450 8,920,000 15,241,550 24,161,550 9,575,000 14,843,450 24,418,450
10,315,000 14,388,700 24,703,700 2026-2030 85,245,000 63,530,937 148,775,937 2031-2035 62,740,000 49,260,512 112,000,512 2036-2040 72,045,000 37,359,788 109,404,788 2041-2045 47,505,000 17,992,300 65,497,300 2046-2047 106,285,000 1,156,500 107,441,500
Total 436,675,000$ 245,661,312$ 682,336,312$
2025
2021202220232024

53
Fremont Unified School District Notes to Financial Statements
June 30, 2020 Certificates of Participation On May 27, 2015, and February 1, 2017, the District issued $54,570,000 and $12,380,000, respectively of certificates of participation through the Fremont Unified School District Financing Corporation for the purpose of providing funds for the purchase of 35068 Fremont Boulevard property and the Rix Center. The certificates consist of serial certificates with interest rates ranging between 3.25%-5.0% with maturity dates through August 1, 2036. Assets consisting of land, building, and equipment in the approximate amount of $91,300,000 have been pledged as collateral for the certificates of participation. The certificates mature through 2045 as follows:
Year EndingJune 30, Principal Interest Total
1,405,000$ 2,446,793$ 3,851,793$ 1,505,000 2,374,044 3,879,044 1,615,000 2,296,044 3,911,044 1,730,000 2,212,419 3,942,419 1,850,000 2,122,919 3,972,919
2026-2030 11,180,000 9,208,704 20,388,704 2031-2035 14,300,000 6,937,782 21,237,782 2036-2040 13,935,000 4,143,138 18,078,138 2041-2045 14,270,000 1,471,600 15,741,600
Total 61,790,000$ 33,213,443$ 95,003,443$
2025
2021202220232024
Compensated Absences Compensated absences (unpaid employee vacation) for the District at June 30, 2020, amounted to $2,505,715. Note 9 - Total Other Postemployment Benefit (OPEB) Liability For the fiscal year ended June 30, 2020, the District reported total OPEB liability, deferred outflows of resources, deferred inflows of resources, and OPEB expense for the following plans:
Total OPEB Deferred Outflows OPEBOPEB Plan Liability of Resources Expense
Retiree Health Plan 137,367,513$ 9,907,909$ 8,124,714$

54
Fremont Unified School District Notes to Financial Statements
June 30, 2020 The details of each plan are as follows: District Plan Plan Administration The District’s governing board administers the Postemployment Benefits Plan (the Plan). The Plan is a single employer defined benefit plan that is used to provide postemployment benefits other than pensions (OPEB) for eligible retirees and their spouses. No assets are accumulated in a trust that meets the criteria in paragraph 4 of GASB Statement No. 75. Plan Membership At June 30, 2018, the valuation date, the Plan membership consisted of the following: Inactive employees or beneficiaries currently receiving benefits payments 1,177 Active employees 2,952
Total 4,129
Benefits Provided The Plan provides medical and dental insurance benefits to eligible retirees and their spouses. Benefits are provided through a third-party insurer, and the full cost of benefits is covered by the Plan. The District’s governing board has the authority to establish and amend the benefit terms as contained within the negotiated labor agreements. Contributions The benefit payment requirements of the Plan members and the District are established and may be amended by the District, the Teacher Education Association (TEA), the local California Service Employees Association (CSEA), and unrepresented groups. The benefit payment is based on projected pay-as-you-go financing requirements as determined annually through the agreements with the District, TEA, CSEA, and the unrepresented groups. For measurement period of June 30, 2019, the District paid $4,379,292 in benefits. Total OPEB Liability of the District The District’s total OPEB liability of $137,367,513 was measured as of June 30, 2019, and the total OPEB liability used to calculate the total OPEB liability was determined by an actuarial valuation as of June 30, 2020.

55
Fremont Unified School District Notes to Financial Statements
June 30, 2020 Actuarial Assumptions The total OPEB liability in the June 30, 2020 actuarial valuation was determined using the following assumptions, applied to all periods included in the measurement, unless otherwise specified: Inflation 3.00 percent Salary increases 3.00 percent, average, including inflationInvestment rate of return 4.00 percent, net of OPEB plan investment expense, including inflationHealthcare cost trend rates 5.90 percent for 2019 The discount rate was based on the Bond Buyer 20-bond General Obligation Index. Mortality RP –Rates the 2014 CalPERS Active Mortality for Miscellaneous Employees Table. Mortality rates vary by age and sex. If employees die prior to retirement, past contributions are available to fund benefits for employees who live to retirement. After retirement, death results in benefit termination or reeducation. Although higher mortality rates reduce service costs, the mortality assumption is not likely to vary from employer to employer. The actuarial assumptions used in the June 30, 2020 valuation were based on the results of an actual experience study for the period July 1, 2018 to June 30, 2019. Changes in the Total OPEB Liability
Total OPEBLiability
Balance, June 30, 2018 Measurement date 122,888,933$
Service cost 7,195,528 Interest 4,370,019 Contributions-employer (4,379,292) Changes of assumptions or other inputs 7,292,325
Net change in total OPEB liability 14,478,580
Balance, June 30, 2019 Measurement date 137,367,513$
Changes of benefit terms reflect an increase in the retirees’ share of health insurance premiums from 6 percent in 2019 to 5 percent in 2020, and changes in inflation rates from 4 percent in 2019 to 3 percent in 2020.

56
Fremont Unified School District Notes to Financial Statements
June 30, 2020 Sensitivity of the Total OPEB Liability to Changes in the Discount Rate The following presents the total OPEB liability of the District, as well as what the District’s total OPEB liability would be if it were calculated using a discount rate that is one percent lower or higher than the current rate:
Total OPEBDiscount Rate Liability
1% decrease (2.13%) 154,293,883$ Current discount rate (3.13%) 137,367,513 1% increase (4.13%) 123,090,068
Sensitivity of the Total OPEB Liability to Changes in the Healthcare Cost Trend Rates The following presents the total OPEB liability of the District, as well as what the District’s total OPEB liability would be if it were calculated using healthcare cost trend rates that are one percent lower or higher than the current healthcare costs trend rates:
Total OPEBHealthcare Cost Trend Rates Liability
1% decrease (4.90% decreasing to 4%) 119,065,924$ Current healthcare cost trend rate (5.90% decreasing to 5%) 137,367,513 1% increase (6.90% decreasing to 6%) 159,915,225

57
Fremont Unified School District Notes to Financial Statements
June 30, 2020 OPEB Expense and Deferred Outflows of Resource related to OPEB At June 30,2020, the District reported deferred outflows of resources and deferred inflow of resources related to OPEB from the following sources:
Deferred Outflowsof Resources
OPEB contributions subsequent to measurement date 3,687,985$ Changes of assumptions 6,219,924
Total 9,907,909$
For the year ended June 30,2020, the District recognized OPEB expense of $12,637,948. At June 30, 2020, the District reported deferred outflows of resources for the amount paid by the District for OPEB as the benefits come due subsequent to measurement date of $3,687,985. Amounts reported as deferred outflows of resources related to OPEB will be recognized in OPEB expense as follows:
Year Ended Deferred OutflowsJune 30, of Resources
1,072,401$ 1,072,401 1,072,401 1,072,401 1,072,401
Thereafter 857,919
Total 6,219,924$
20212022202320242025

58
Fremont Unified School District Notes to Financial Statements
June 30, 2020 Note 10 - Fund Balances Fund balances are composed of the following elements:
Capital Bond Interest Non-MajorGeneral Building Facilities and Redemption Governmental
Fund Funds Fund Fund Funds Total
NonspendableRevolving cash 100,013$ -$ -$ -$ -$ 100,013$ Stores inventories 316,675 - - - 159,798 476,473 Prepaid expenditures 78,198 - - - - 78,198
Total nonspendable 494,886 - - - 159,798 654,684
RestrictedLegally restricted programs 9,848,328 - - - 943,679 10,792,007 Capital projects - 113,922,634 31,137,803 - - 145,060,437 Debt services - - - 35,525,889 - 35,525,889
Total restricted 9,848,328 113,922,634 31,137,803 35,525,889 943,679 191,378,333
AssignedAdvanced placement 4,445 - - - - 4,445 School Use Facility Use Funds 365,925 - - - - 365,925 SEIU professional growth 59,313 - - - - 59,313 CSEA Professional Growth 13,089 - - - - 13,089 Mandated Cost Sites Allocation 221,451 - - - - 221,451 Medi-Cal Administrative Activities Site 285,443 - - - - 285,443 Local Control and Accountability Plan 420,700 - - - - 420,700 Distance Learning/PPE support 3,013,617 - - - - 3,013,617 Learning Loss CNS Mitigation 3,000,002 - - - - 3,000,002 5% Reserve - - - - 231,234 231,234 Facility Reserve - - - - 13,564,690 13,564,690 Other - - - - 1,710,480 1,710,480
Total assigned 7,383,985 - - - 15,506,404 22,890,389
UnassignedReserve for economic
uncertainties 14,097,460 - - - - 14,097,460
Total unassigned 14,097,460 - - - - 14,097,460
Total 31,824,659$ 113,922,634$ 31,137,803$ 35,525,889$ 16,609,881$ 229,020,866$

59
Fremont Unified School District Notes to Financial Statements
June 30, 2020 Note 11 - Risk Management The District’s risk management activities are recorded in the General and Self-Insurance Funds. The District is exposed to various types of loss related to torts; theft of, damage to and destruction of assets, errors and omissions; natural disaster and employee injuries and illnesses for which the District is self-insured. The District has formal self-insurance plans for worker’s compensation, property and liability, employee dental, employee medical and employee income protection. For workers’ compensation coverage, the District is a member of the Alameda County Schools Insurance Group (ACSIG), a joint powers authority (JPA), from which the District purchases first dollar insurance. For property and liability coverage, the District purchases from Northern California Relief (NorCal ReLief) JPA, with a $100,000 retention. Funds are set aside by the District to pay for claims under the self insurance limit. Property and Liability The District is exposed to various risks of loss related to torts; theft of, damage to, and destruction of assets; errors and omissions; injuries to employees and natural disasters. During the fiscal year ending June 30, 2020, the District participated in the Northern California ReLiEF public entity risk pool for property and liability insurance coverage. Settled claims have not exceeded this commercial coverage in any of the past three years. There has not been a significant reduction in coverage form the prior year. Claims Liabilities The District records an estimated liability for indemnity torts and other claims against the District. Claims liabilities are based on estimates of the ultimate cost of reported claims (including future claim adjustment expenses) and an estimate for claims incurred, but not reported based on historical experience. Unpaid Claims Liabilities The fund establishes a liability for both reported and unreported events, which includes estimates of both future payments of losses and related claim adjustment expenses. The following represent the changes in approximate aggregate liabilities in the self insurance fund for the District from July 1, 2018 to June 30, 2020:
Propertyand Liability
Liability Balance, July 1, 2018 296,168$ Claims and changes in estimates 240,298 Claims payments (201,791)
Liability Balance, June 30, 2019 334,675 Claims and changes in estimates 5,051 Claims payments (13,051)
Liability Balance, June 30, 2020 326,675$
Assets available to pay claims at June 30, 2020 397,065$

60
Fremont Unified School District Notes to Financial Statements
June 30, 2020 Note 12 - Employee Retirement Systems Qualified employees are covered under multiple-employer defined benefit pension plans maintained by agencies of the State of California. Academic employees are members of the California State Teachers’ Retirement System (CalSTRS) and classified employees are members of the California Public Employees’ Retirement System (CalPERS). For the fiscal year ended June 30, 2020, the District reported its proportionate share of net pension liabilities, deferred outflows of resources, deferred inflows of resources, and pension expense for each of the above plans as follows:
Net Deferred Outflows Deferred InflowsPension Plan Pension Liability of Resources of Resources Pension Expense
CalSTRS 328,501,117$ 87,701,816$ 23,546,214$ 41,865,973$ CalPERS 129,689,331 28,148,795 4,438,656 21,709,022
Total 458,190,448$ 115,850,611$ 27,984,870$ 63,574,995$
The details of each plan are as follows: California State Teachers’ Retirement System (CalSTRS) Plan Description The District contributes to the State Teachers Retirement Plan (STRP) administered by the California State Teachers’ Retirement System (CalSTRS). STRP is a cost-sharing multiple-employer public employee retirement system defined benefit pension plan. Benefit provisions are established by State statutes, as legislatively amended, within the State Teachers’ Retirement Law. A full description of the pension plan regarding benefit provisions, assumptions (for funding, but not accounting purposes), and membership information is listed in the June 30, 2018, annual actuarial valuation report, Defined Benefit Program Actuarial Valuation. This report and CalSTRS audited financial information are publicly available reports that can be found on the CalSTRS website under Publications at: http://www.calstrs.com/member-publications. Benefits Provided The STRP provides retirement, disability and survivor benefits to beneficiaries. Benefits are based on members’ final compensation, age, and years of service credit. Members hired on or before December 31, 2012, with five years of credited service are eligible for the normal retirement benefit at age 60. Members hired on or after January 1, 2013, with five years of credited service are eligible for the normal retirement benefit at age 62. The normal retirement benefit is equal to 2.0 percent of final compensation for each year of credited service.

61
Fremont Unified School District Notes to Financial Statements
June 30, 2020 The STRP is comprised of four programs: Defined Benefit Program, Defined Benefit Supplement Program, Cash Balance Benefit Program, and Replacement Benefits Program. The STRP holds assets for the exclusive purpose of providing benefits to members and beneficiaries of these programs. CalSTRS also uses plan assets to defray reasonable expenses of administering the STRP. Although CalSTRS is the administrator of the STRP, the state is the sponsor of the STRP and obligor of the trust. In addition, the state is both an employer and nonemployer contributing entity to the STRP. The District contributes exclusively to the STRP Defined Benefit Program, thus disclosures are not included for the other plans. The STRP provisions and benefits in effect at June 30, 2020, are summarized as follows:
On or before On or afterHire date December 31, 2012 January 1, 2013Benefit formula 2% at 60 2% at 62Benefit vesting schedule 5 years of service 5 years of serviceBenefit payments Monthly for life Monthly for lifeRetirement age 60 62Monthly benefits as a percentage of eligible compensation 2.0% - 2.4% 2.0% - 2.4%Required employee contribution rate 10.25% 10.205%Required employer contribution rate 17.10% 17.10%Required state contribution rate 10.328% 10.328%
STRP Defined Benefit Program
Contributions Required member, District and State of California contributions rates are set by the California Legislature and Governor and detailed in Teachers’ Retirement Law. The contributions rates are expressed as a level percentage of payroll using the entry age normal actuarial method. In accordance with AB 1469, employer contributions into the CalSTRS will be increasing to a total of 19.1 percent of applicable member earnings phased over a seven-year period. The contribution rates for each plan for the year ended June 30, 2020, are presented above and the District’s total contributions were $34,678,918. Pension Liabilities, Pension Expense, Deferred Outflows of Resources and Deferred Inflows of Resources Related to Pensions At June 30, 2020, the District reported a liability for its proportionate share of the net pension liability that reflected a reduction for State pension support provided to the District. The amount recognized by the District as its proportionate share of the net pension liability, the related state support and the total portion of the net pension liability that was associated with the District were as follows:
Total net pension liability, including State share
Proportionate share of net pension liability 328,501,117$ State’s proportionate share of the net pension liability 179,219,290
Total 507,720,407$

62
Fremont Unified School District Notes to Financial Statements
June 30, 2020 The net pension liability was measured as of June 30, 2019. The District’s proportion of the net pension liability was based on a projection of the District’s long-term share of contributions to the pension plan relative to the projected contributions of all participating school districts and the State, actuarially determined. The District’s proportionate share for the measurement period June 30, 2019 and June 30, 2018, respectively was 0.3637 percent and 0.0.3591 percent, resulting in an increase of .0046 percent in the proportionate share. For the year ended June 30, 2020, the District recognized pension expense of $41,865,973. In addition, the District recognized pension expense and revenue of $26,689,617 for support provided by the State. At June 30, 2020, the District reported deferred outflows of resources and deferred inflows of resources related to pensions from the following sources:
Deferred Outflows Deferred Inflowsof Resources of Resources
Pension contributions subsequent to measurement date 34,678,918$ -$ Change in proportion and differences between contributions
made and District's proportionate share of contributions 10,645,396 1,635,470 Differences between projected and actual earnings
on pension plan investments - 12,653,964 Differences between expected and actual experience
in the measurement of the total pension liability 829,291 9,256,780 Changes of assumptions 41,548,211 -
Total 87,701,816$ 23,546,214$
The deferred outflows of resources related to pensions resulting from District contributions subsequent to the measurement date will be recognized as a reduction of the net pension liability in the subsequent fiscal year. The deferred outflows/(inflows) of resources related to the difference between projected and actual earnings on pension plan investments will be amortized over a closed five-year period and will be recognized in pension expense as follows:
DeferredYear Ended Outflows/(Inflows)
June 30, of Resources
(1,276,369)$ (10,045,758)
(2,085,656) 753,819
Total (12,653,964)$
2021202220232024
The deferred outflows/(inflows) of resources related to the change in proportion and differences between contributions made and District’s proportionate share of contributions, differences between expected and actual experience in the measurement of the total pension liability, and changes of assumptions will be

63
Fremont Unified School District Notes to Financial Statements
June 30, 2020 amortized over the Expected Average Remaining Service Life (EARSL) of all members that are provided benefits (active, inactive, and retirees) as of the beginning of the measurement period. The EARSL for the measurement period is seven years and will be recognized in pension expense as follows:
DeferredYear Ended Outflows/(Inflows)
June 30, of Resources
10,454,007$ 11,936,494
9,657,140 10,283,954
98,448 Thereafter (299,395)
Total 42,130,648$
202320242025
20212022
Actuarial Methods and Assumptions Total pension liability for STRP was determined by applying update procedures to the financial reporting actuarial valuation as of June 30, 2018, and rolling forward the total pension liability to June 30, 2019. The financial reporting actuarial valuation as of June 30, 2018, used the following methods and assumptions, applied to all prior periods included in the measurement: Valuation date June 30, 2018Measurement date June 30, 2019Experience study July 1, 2010 through June 30, 2015Actuarial cost method Entry age normalDiscount rate 7.10%Investment rate of return 7.10%Consumer price inflation 2.75%Wage growth 3.50%
CalSTRS uses a generational mortality assumption, which involves the use of a base mortality table and projection scales to reflect expected annual reductions in mortality rates at each age, resulting in increases in life expectancies each year into the future. The base mortality tables are CalSTRS custom tables derived to best fit the patterns of mortality among its members. The projection scale was set equal to 110 percent of the ultimate improvement factor from the Mortality Improvement Scale (MP-2016) table, issued by the Society of Actuaries. The long-term expected rate of return on pension plan investments was determined using a building-block method in which best estimate ranges of expected future real rates of return (expected returns, net of pension plan investment expense and inflation) are developed for each major asset class. The best estimate ranges were developed using capital market assumptions from CalSTRS general investment consultant (Pension Consulting Alliance-PCA) as an input to the process. The actuarial investment rate of return assumption was adopted by the

64
Fremont Unified School District Notes to Financial Statements
June 30, 2020 board in February 2017 in conjunction with the most recent experience study. For each future valuation, CalSTRS consulting actuary (Milliman) reviews the return assumption for reasonableness based on the most current capital market assumptions. Best estimates of 20-year geometrically-linked real rates of return and the assumed asset allocation for each major asset class for the year ended June 30, 2019, are summarized in the following table:
Long-Term Assumed Asset Expected Real
Asset Class Allocation Rate of Return
Global equity 47% 4.8%Fixed income 12% 1.3%Real estate 13% 3.6%Private equity 13% 6.3%Risk mitigating strategies 9% 1.8%Inflation sensitive 4% 3.3%Cash/liquidity 2% -0.4%
Discount Rate The discount rate used to measure the total pension liability was 7.10 percent. The projection of cash flows used to determine the discount rate assumed the contributions from plan members and employers will be made at statutory contribution rates. Projected inflows from investment earnings were calculated using the long-term assumed investment rate of return (7.10 percent) and assuming that contributions, benefit payments and administrative expense occurred midyear. Based on these assumptions, the STRP’s fiduciary net position was projected to be available to make all projected future benefit payments to current plan members. Therefore, the long-term assumed investment rate of return was applied to all periods of projected benefit payments to determine total pension liability. The following presents the District’s proportionate share of the net pension liability calculated using the current discount rate as well as what the net pension liability would be if it were calculated using a discount rate that is one percent lower or higher than the current rate:
Net PensionDiscount Rate Liability
1% decrease (6.10%) 489,165,355$ Current discount rate (7.10%) 328,501,117 1% increase (8.10%) 195,279,867

65
Fremont Unified School District Notes to Financial Statements
June 30, 2020 California Public Employees Retirement System (CalPERS) Plan Description Qualified employees are eligible to participate in the School Employer Pool (SEP) under the California Public Employees’ Retirement System (CalPERS), a cost-sharing multiple-employer public employee retirement system defined benefit pension plan administered by CalPERS. Benefit provisions are established by State statutes, as legislatively amended, within the Public Employees’ Retirement Law. A full description of the pension plan regarding benefit provisions, assumptions (for funding, but not accounting purposes), and membership information is listed in the June 30, 2018 annual actuarial valuation report, Schools Pool Actuarial Valuation. This report and CalPERS audited financial information are publicly available reports that can be found on the CalPERS website under Forms and Publications at: https://www.calpers.ca.gov/page/forms-publications. Benefits Provided CalPERS provides service retirement and disability benefits, annual cost of living adjustments and death benefits to plan members, who must be public employees and beneficiaries. Benefits are based on years of service credit, a benefit factor and the member’s final compensation. Members hired on or before December 31, 2012, with five years of total service are eligible to retire at age 50 with statutorily reduced benefits. Members hired on or after January 1, 2013, with five years of total service are eligible to retire at age 52 with statutorily reduced benefits. All members are eligible for non-duty disability benefits after five years of service. The Basic Death Benefit is paid to any member’s beneficiary if the member dies while actively employed. An employee’s eligible survivor may receive the 1957 Survivor Benefit if the member dies while actively employed, is at least age 50 (or 52 for members hired on or after January 1, 2013), and has at least five years of credited service. The cost of living adjustments for each plan are applied as specified by the Public Employees’ Retirement Law. The CalPERS provisions and benefits in effect at June 30, 2020, are summarized as follows:
On or before On or afterHire date December 31, 2012 January 1, 2013Benefit formula 2% at 55 2% at 62Benefit vesting schedule 5 years of service 5 years of serviceBenefit payments Monthly for life Monthly for lifeRetirement age 55 62Monthly benefits as a percentage of eligible compensation 1.1% - 2.5% 1.0% - 2.5%Required employee contribution rate 7.00% 7.00%Required employer contribution rate 19.721% 19.721%
School Employer Pool (CalPERS)

66
Fremont Unified School District Notes to Financial Statements
June 30, 2020 Contributions Section 20814(c) of the California Public Employees’ Retirement Law requires that the employer contribution rates for all public employers be determined on an annual basis by the actuary and shall be effective on the July 1 following notice of a change in the rate. Total plan contributions are calculated through the CalPERS annual actuarial valuation process. The actuarially determined rate is the estimated amount necessary to finance the costs of benefits earned by employees during the year, with an additional amount to finance any unfunded accrued liability. The District is required to contribute the difference between the actuarially determined rate and the contribution rate of employees. The contributions rates are expressed as percentage of annual payroll. The contribution rates for each plan for the year ended June 30, 2020, are presented above and the total District contributions were $12,554,527. Pension Liabilities, Pension Expense, Deferred Outflows of Resources, and Deferred Inflows of Resources Related to Pensions As of June 30, 2020, the District reported net pension liabilities for its proportionate share of the CalPERS net pension liability totaling $129,689,331. The net pension liability was measured as of June 30, 2019. The District’s proportion of the net pension liability was based on a projection of the District’s long-term share of contributions to the pension plan relative to the projected contributions of all participating school districts, actuarially determined. The District’s proportionate share for the measurement period June 30, 2019 and June 30, 2018, respectively was 0.4450 percent and 0.4567 percent, resulting in a net decrease in the proportionate share of 0.0117 percent. For the year ended June 30, 2020, the District recognized pension expense of $21,709,022. At June 30, 2020, the District reported deferred outflows of resources and deferred inflows of resources related to pensions from the following sources:
Deferred Outflows Deferred Inflowsof Resources of Resources
Pension contributions subsequent to measurement date 12,554,528$ -$ Change in proportion and differences between contributions
made and District’s proportionate share of contributions - 3,235,763 Differences between projected and actual earnings on
pension plan investments - 1,202,893 Differences between expected and actual experience
in the measurement of the total pension liability 9,420,652 - Changes of assumptions 6,173,615 -
Total 28,148,795$ 4,438,656$
The deferred outflows of resources related to pensions resulting from District contributions subsequent to the measurement date will be recognized as a reduction of the net pension liability in the subsequent fiscal year.

67
Fremont Unified School District Notes to Financial Statements
June 30, 2020 The deferred outflows/(inflows) of resources related to the difference between projected and actual earnings on pension plan investments will be amortized over a closed five-year period and will be recognized in pension expense as follows:
DeferredYear Ended Outflows/(Inflows)
June 30, of Resources
1,187,389$ (2,371,770)
(359,413) 340,901
(1,202,893)$
2021202220232024
Total
The deferred outflows/(inflows) of resources related to the change in proportion and differences between contributions made and District’s proportionate share of contributions, differences between expected and actual experience in the measurement of the total pension liability, and changes of assumptions will be amortized over the Expected Average Remaining Service Life (EARSL) of all members that are provided benefits (active, inactive, and retirees) as of the beginning of the measurement period. The EARSL for the measurement period is 4.1 years and will be recognized in pension expense as follows:
DeferredYear Ended Outflows/(Inflows)
June 30, of Resources
8,590,542$ 2,919,454
771,370 77,138
12,358,504$ Total
202220232024
2021
Actuarial Methods and Assumptions Total pension liability for the SEP was determined by applying update procedures to the financial reporting actuarial valuation as of June 30, 2018, and rolling forward the total pension liability to June 30, 2019. The financial reporting actuarial valuation as of June 30, 2018, used the following methods and assumptions, applied to all prior periods included in the measurement: Valuation date June 30, 2018Measurement date June 30, 2019Experience study July 1, 1997 through June 30, 2015Actuarial cost method Entry age normalDiscount rate 7.15%Investment rate of return 7.15%Consumer price inflation 2.50%Wage growth Varies by entry age and service

68
Fremont Unified School District Notes to Financial Statements
June 30, 2020 The mortality table used was developed based on CalPERS-specific data. The table includes 15 years of mortality improvements using Society of Actuaries 90 percent of scale MP-2016. In determining the long-term expected rate of return, CalPERS took into account both short-term and long-term market return expectations as well as the expected pension fund cash flows. Using historical returns of all the funds’ asset classes, expected compound returns were calculated over the short-term (first ten years) and the long term (11+ years) using a building-block approach. Using the expected nominal returns for both short term and long-term, the present value of benefits was calculated for each fund. The expected rate of return was set by calculating the rounded single equivalent expected return that arrived at the same present value of benefits for cash flows as the one calculated using both short-term and long-term returns. The expected rate of return was then set equal to the single equivalent rate calculated above and adjusted to account for assumed administrative expenses. The target asset allocation and best estimates of arithmetic real rates of return for each major asset class are summarized in the following table:
Long-Term Assumed Asset Expected Real
Asset Class Allocation Rate of Return
Global equity 50% 5.98%Fixed income 28% 2.62%Inflation assets 0% 1.81%Private equity 8% 7.23%Real assets 13% 4.93%Liquidity 1% -0.92%
Discount Rate The discount rate used to measure the total pension liability was 7.15 percent. The projection of cash flows used to determine the discount rate assumed the contributions from plan members and employers will be made at statutory contribution rates. Based on these assumptions, the School Employer Pool fiduciary net position was projected to be available to make all projected future benefit payments to current plan members. Therefore, the long-term assumed investment rate of return was applied to all periods of projected benefit payments to determine total pension liability. The following presents the District’s proportionate share of the net pension liability calculated using the current discount rate as well as what the net pension liability would be if it were calculated using a discount rate that is one percent lower or higher than the current rate:
Net PensionDiscount Rate Liability
1% decrease (6.15%) 186,938,642$ Current discount rate (7.15%) 129,689,331 1% increase (8.15%) 82,197,072
69
Fremont Unified School District Notes to Financial Statements
June 30, 2020 Tax Deferred Annuity/Social Security As established by Federal law, all public sector employees who are not members of their employer’s existing retirement system (CalSTRS or CalPERS) must be covered by Social Security or an alternative plan. The District has elected to use the TDA as its alternative plan. Contributions made by the District and an employee vest immediately. The District contributes 6.2 percent of an employee’s gross earnings. An employee is required to contribute 6.2 percent of his or her gross earnings to the pension plan. The District also contributes to the Fremont Unified School District 403(b) and 457(b) Tax Deferred Annuity Plans, which are defined contribution pension plans. A defined contribution pension plan provides pension benefits in return for services rendered, provides an individual account for each participant, and specifies how contributions to the individual’s account are to be determined instead of specifying the amount of benefits the individual is to receive. Under a defined contribution pension plan, the benefits a participant will receive depend solely on the amount contributed to the participant’s account, the returns earned on investments of those contributions, and forfeitures of other participants’ benefits that may be allocated to such participant’s account. On Behalf Payments The State of California makes contributions to CalSTRS on behalf of the District. These payments consist of State General Fund contributions to CalSTRS in the amount of $15,496,527 (10.328 percent of annual payroll). Contributions are no longer appropriated in the annual Budget Act for the legislatively mandated benefits to CalPERS. Therefore, there is no on behalf contribution rate for CalPERS. Under accounting principles generally accepted in the United States of America, these amounts are to be reported as revenues and expenditures. Accordingly, these amounts have been recorded in these financial statements. Senate Bill 90 (Chapter 33, Statutes of 2019), which was signed by the Governor on June 27, 2019, appropriated an additional 2019–2020 contribution on-behalf of school employers of $1.1 billion for CalSTRS. A proportionate share of these contribution has been recorded in these financial statements. On behalf payments related to these additional contributions have been excluded from the calculation of available reserves and have been included in the budgeted amounts reported in the General Fund – Budgetary Comparison Schedule and Major Special Revenue Fund – Budgetary Comparison Schedule. Note 13 - Commitments and Contingencies Grants The District received financial assistance from Federal and State agencies in the form of grants. The disbursement of funds received under these programs generally requires compliance with terms and conditions specified in the grant agreements and are subject to audit by the grantor agencies. Any disallowed claims resulting from such audits could become a liability of the General Fund or other applicable funds. However, in the opinion of management, any such disallowed claims will not have a material adverse effect on the overall financial position of the District at June 30, 2020.

70
Fremont Unified School District Notes to Financial Statements
June 30, 2020 Litigation The District is involved in various litigation arising from the normal course of business. There is one pending civil suit against the district which is on appeal, in which the district prevailed in part of the matter and not in another part in the lower courts, that could have a material adverse effect on the overall financial position of the District at June 30, 2020. Construction Commitments As of June 30, 2020, the District had the following commitments with respect to the unfinished capital projects:
Remaining ExpectedConstruction Date of
Location Commitment Completion
American High School 2,004,643$ 6/30/2021Bringhurst Elementary School 405,016 TBDBrookvale Elementary School 9,764 6/30/2021Centerville Junior High School 4,055,482 5/20/2022COIL 20,036 6/30/2021Fremont Boulevard Property 8,192 TBDGreen Elementary School 9,764 6/30/2021Hopkins Junior High School 5,389,577 8/10/2023Horner Junior High School 5,346,411 8/20/2020Kennedy High School 1,568,830 6/30/2021Mattos Elementary School 9,764 6/30/2021Mission San Jose Elementary School 9,764 6/30/2021Middle Schools - various 55,613 TBDPatterson Ranch Elementary School 139,191 6/30/2021Rix Center 201,133 TBDThorton Junior High School 11,280,671 12/9/2021Vallejo Mill Elementary School 9,764 6/30/2021Walters Junior High School 257,057 12/23/2020Washington High School 347,526 6/30/2021Williamson Site 1,922,146 TBDDistrictwide 690,037 6/30/2021Facilities 7,704,512 TBD
41,444,893$

71
Fremont Unified School District Notes to Financial Statements
June 30, 2020 Note 14 - Participation in Public Entity Risk Pools, Joint Powers Authorities and Other Related Party
Transactions The District participates in joint ventures under joint powers agreements with the Alameda County Schools Insurance Group (ACSIG), Northern California ReLiEF Public Entity Risk Pools, and the Mission Valley Regional Occupational Program (MVROP). The District pays the Mission Valley Regional Occupational Program apportionments related to its ROP attendance. The relationships between the District and the JPAs are such that the JPAs are not a component unit of the District for financial reporting purposes. These entities have budgeting and financial reporting requirements independent of member units and their financial statements are not presented in these financial statements; however, fund transactions between the entities and the District are included in these statements. Audited financial statements are generally available from the respective entities. During the year ended June 30, 2020, the District made payments of $6,457,789, and $4,387,964 to ACSIG, and MVROP, respectively. Note 15 - Subsequent Events Subsequent to year-end, the District has been negatively impacted by the effects of the world-wide coronavirus pandemic. The District is closely monitoring its operations, liquidity, and capital resources and is actively working to minimize the current and future impact of this unprecedented situation. As of the issuance date of these financial statements, the full impact to the District’s financial position is not known beyond increased cash flow monitoring due to state apportionment deferrals. On October 28, 2020, the District Board of Education approved resolutions to issue two new series of bonds: the Election of 2014 General Obligation Bonds, Series D for $126.5 million and the 2021 General Obligation Refunding Bonds for approximately $100 million. The 2021 General Obligation Refunding Bonds will be utilized to refinance portions of the outstanding 2012 General Obligation Refunding Bonds and 2012 General Obligation Refunding Bonds, Series B for taxpayer savings. Both new series of bonds are scheduled to be sold in January 2021.

eidebailly.com
Required Supplementary Information June 30, 2020
Fremont Unified School District

See Notes to Required Supplementary Information 73
Fremont Unified School District Budgetary Comparison Schedule – General Fund
Year Ended June 30, 2020
Variances -Positive
(Negative)Budgeted Amounts Final
Original Final Actual to Actual
RevenuesLocal Control Funding Formula 319,697,640$ 315,011,388$ 314,986,816$ (24,572)$ Federal sources 11,756,742 14,099,245 11,575,828 (2,523,417) Other State sources 44,275,245 56,665,298 56,666,797 1,499 Other local sources 10,589,595 13,227,940 14,819,686 1,591,746
Total revenues 1 386,319,222 399,003,871 398,049,127 (954,744)
ExpendituresCurrent
Certificated salaries 200,741,520 198,237,496 197,766,802 470,694 Classified salaries 65,201,621 62,549,178 61,948,908 600,270 Employee benefits 78,589,491 87,063,355 86,735,159 328,196 Books and supplies 13,030,857 15,813,696 9,818,175 5,995,521 Services and operating expenditures 26,937,389 38,063,610 33,976,767 4,086,843 Other outgo 3,995,873 4,361,903 4,399,373 (37,470)
Capital outlay 574,375 7,809,181 6,823,621 985,560
Total expenditures 1 389,071,126 413,898,419 401,468,805 12,429,614
Excess (Deficiency) of RevenuesOver Expenditures (2,751,904) (14,894,548) (3,419,678) 11,474,870
Other Financing Sources (Uses)Transfers out (881,004) (1,536,586) (1,355,749) 180,837
Net Change in Fund Balances (3,632,908) (16,431,134) (4,775,427) 11,655,707
Fund Balance - Beginning 36,600,086 36,600,086 36,600,086 -
Fund Balance - Ending 32,967,178$ 20,168,952$ 31,824,659$ 11,655,707$
On behalf payments of $15,496,527 are included in the actual revenues and expenditures and included in the budgeted amounts. On behalf payments of $8,597,371 relating to Senate Bill 90 are included in the actual revenues and expenditures and have been included in the budgeted amounts.

See Notes to Required Supplementary Information 74
Fremont Unified School District Schedule of Changes in the District’s Total OPEB Liability and Related Ratios
Year Ended June 30, 2020
2020 2019 2018Measurement Date June 30, 2019 June 30, 2018 June 30, 2017
Total OPEB LiabilityService cost 7,195,528$ 6,985,950$ 5,333,834$ Interest 4,370,019 4,121,726 1,060,378 Changes of assumptions 7,292,325 4,787,471 (2,422,902) Benefit payments (4,379,292) (4,120,524) (3,052,283)
Net change in total OPEB liability 14,478,580 11,774,623 919,027
Total OPEB Liability - Beginning 122,888,933 111,114,310 110,195,283
Total OPEB Liability - Ending 137,367,513$ 122,888,933$ 111,114,310$
Covered Payroll N/A1 N/A1 N/A1
Total OPEB Liability as a Percentage of Covered Payroll N/A1 N/A1 N/A1
1 The OPEB Plan is not administered through a trust and contributions are not made based on a measure of pay. Therefore, no measure of payroll is presented.
Note: In the future, as data becomes available, ten years of information will be presented.

See Notes to Required Supplementary Information 75
Fremont Unified School District Schedule of the District’s Proportionate Share of the Net Pension Liability
Year Ended June 30, 2020
2020 2019 2018 2017 2016 2015
Measurement Date June 30, 2019 June 30, 2018 June 30, 2017 June 30, 2016 June 30, 2015 June 30, 2014
CalSTRS
Proportion of the net pension liability (asset) 0.3637% 0.3591% 0.3552% 0.3589% 0.3566% 0.3420%
Proportionate share of the net pension liability (asset) 328,501,117$ 330,083,372$ 328,479,592$ 290,310,481$ 240,346,680$ 199,854,540$ State’s proportionate share of the net pension liability (asset) 179,219,290 188,988,168 194,325,752 165,268,578 126,979,856 121,050,452
Total 507,720,407$ 519,071,540$ 522,805,344$ 455,579,059$ 367,326,536$ 320,904,992$
Covered payroll 200,788,299$ 193,952,474$ 190,604,889$ 132,905,387$ 135,519,640$ 160,599,764
Proportionate share of the net pension liability (asset)as a percentage of its covered payroll 163.61% 170.19% 172.34% 218.43% 177.35% 124%
Plan fiduciary net position as a percentage of the total pension liability 73% 71% 69% 70% 74% 77%
CalPERS
Proportion of the net pension liability (asset) 0.4450% 0.4567% 0.4654% 0.4677% 0.4463% 0.4175%
Proportionate share of the net pension liability (asset) 129,689,331$ 121,775,345$ 111,112,422$ 92,374,628$ 65,785,060$ 47,396,415$
Covered payroll 58,989,315$ 60,513,328$ 59,195,334$ 48,313,539$ 42,617,679$ 48,878,779
Proportionate share of the net pension liability (asset)as a percentage of its covered payroll 219.85% 201.24% 187.70% 191.20% 154.36% 97%
Plan fiduciary net position as a percentage of the total pension liability 70% 71% 72% 74% 79% 83%
Note : In the future, as data becomes available, ten years of information will be presented.

See Notes to Required Supplementary Information 76
Fremont Unified School District Schedule of the District Contributions
Year Ended June 30, 2020
2020 2019 2018 2017 2016 2015
CalSTRS
Contractually required contribution 34,678,918$ 32,688,335$ 27,987,342$ 23,978,095$ 14,260,748$ 12,034,144$ Less contributions in relation to the contractually
required contribution 34,678,918 32,688,335 27,987,342 23,978,095 14,260,748 12,034,144
Contribution deficiency (excess) -$ -$ -$ -$ -$ -$
Covered payroll 202,800,690$ 200,788,299$ 193,952,474$ 190,604,889$ 132,905,387$ 135,519,640$
Contributions as a percentage of covered payroll 17.10% 16.28% 14.43% 12.58% 10.73% 8.88%
CalPERS
Contractually required contribution 12,554,528$ 10,654,650$ 9,398,325$ 8,221,048$ 5,723,705$ 5,016,527$ Less contributions in relation to the contractually
required contribution 12,554,528 10,654,650 9,398,325 8,221,048 5,723,705 5,016,527
Contribution deficiency (excess) -$ -$ -$ -$ -$ -$
Covered payroll 63,660,707$ 58,989,315$ 60,513,328$ 59,195,334$ 48,313,539$ 42,617,679$
Contributions as a percentage of covered payroll 19.721% 18.0620% 15.5310% 13.8880% 11.8470% 11.7710%
Note : In the future, as data becomes available, ten years of information will be presented.

77
Fremont Unified School District Note to Required Supplementary Information
June 30, 2020 Note 1 - Purpose of Schedules Budgetary Comparison Schedule(s) The District employs budget control by object codes and by individual appropriation accounts. Budgets are prepared on the modified accrual basis of accounting in accordance with accounting principles generally accepted in the United State of America as prescribed by the Governmental Accounting Standards Board and provisions of the California Education Code. The governing board is required to hold a public hearing and adopt an operating budget no later than July 1 of each year. The adopted budget is subject to amendment throughout the year to give consideration to unanticipated revenue and expenditures primarily resulting from events unknown at the time of budget adoption with the legal restriction that expenditures cannot exceed appropriations by major object account. The amounts reported as the original budgeted amounts in the budgetary statements reflect the amounts when the original appropriations were adopted. The amounts reported as the final budgeted amounts in the budgetary statements reflect the amounts after all budget amendments have been accounted for. Schedule of Changes in the District’s Total OPEB Liability and Related Ratios This schedule presents information on the District’s changes in the total OPEB liability, including beginning and ending balances, the plan’s fiduciary net position, and the total OPEB liability. In the future, as data becomes available, ten years of information will be presented.
• Changes in Benefit Terms – There were no changes in benefit terms. • Changes of Assumptions – Health insurance premium assumptions changed from 6 percent to 5 percent,
and estimated inflation rates changed from 4 percent to 3 percent. Schedule of District Contributions for OPEB This schedule presents information on the District’s actuarially determined contribution, contributions in relation to the actuarially determined contribution, and any excess or deficiency related to the actuarially determined contribution. In the future, as data becomes available, ten years of information will be presented. Schedule of the District’s Proportionate Share of the Net Pension Liability This schedule presents information on the District’s proportionate share of the net pension liability (NPL), the plans’ fiduciary net position and, when applicable, the State’s proportionate share of the NPL associated with the District. In the future, as data becomes available, ten years of information will be presented.
• Changes in Benefit Terms – There were no changes in benefit terms since the previous valuations for both CalSTRS and CalPERS.
• Changes of Assumptions – There were no changes in economic assumptions for either the CalSTRS or CalPERS plans from the previous valuations.

78
Fremont Unified School District Notes to Required Supplementary Information
June 30, 2020 Schedule of District Contributions This schedule presents information on the District’s required contribution, the amounts actually contributed, and any excess or deficiency related to the required contribution. In the future, as data becomes available, ten years of information will be presented.

eidebailly.com
Supplementary Information June 30, 2020
Fremont Unified School District

See Notes to Supplementary Information 80
Fremont Unified School District Schedule of Expenditures of Federal Awards
Year Ended June 30, 2020
Pass-ThroughFederal EntityCFDA Identifying Federal
Number Number Expenditures
U.S. Department of EducationPassed Through California Department of Education (CDE)
Special Education Cluster Special Education Grants to States - Basic Local Assistance 84.027 13379 8,974,501$ Special Education Grants to States - Part B, Sec 611, Private Schools ISP's 84.027 10115 116,889 Special Education Preschool Grants - Mental Health Services 84.027 [2] 591,108 Special Education Grants to States - Part B, Sec 619 84.173 13430 324,080 Special Education - Preschool Staff Development, Part B, Sec 619 84.173 13431 1,870 Special Education Preschool Grants - Alternative Dispute Resolution 84.173 13007 5,455
Total Special Education Cluster 10,013,903
Special Education - Grants for Infants and Families - Early Intervention Grants, Part C 84.181 [2] 211,330
Adult Education - Basic Grants to States 84.002 14508 464,230 Adult Education - Basic Grants to States - Secondary Education 84.002 13978 8,250 Adult Education - Basic Grants to States - English Literacy & Civics Education 84.002 14109 165,840
Subtotal 638,320
Migrant Education State Grant Program 84.011 14838 57,950 Migrant Education State Grant Program - Summer Program 84.011 10005 1,943
Subtotal 59,893
Title I Grants to Local Educational Agencies 84.010 14329 2,719,459 Supporting Effective Instruction State Grants - Teacher Quality 84.367 14341 559,317 English Language Acquisition State Grants - LEP 84.365 14346 583,817 Student Support and Academic Enrichment Program 84.424 15396 76,205 Career and Technical Education - Basic Grants to States 84.048 14894 97,996 Rehabilitation Services Vocational Rehabilitation
Grants to States - Workability II 84.126 10006 447,188 Indian Education Grants to Local Agencies 84.060 10011 27,164
Total U.S. Department of Education 15,434,592
Federal Grantor/Pass-ThroughGrantor/Program or Cluster Title

See Notes to Supplementary Information 81
Fremont Unified School District Schedule of Expenditures of Federal Awards
Year Ended June 30, 2020
Pass-ThroughFederal EntityCFDA Identifying Federal
Number Number ExpendituresU.S. Department of AgriculturePassed Through California Department of Education
Child Nutrition Cluster National School Lunch Program 10.555 13391 1,406,666 School Breakfast Program - National School Breakfast 10.553 13525 17,023 National School Lunch Program - Meal Supplements 10.555 13396 10,782 School Breakfast Program - Especially Needy Breakfast 10.553 13526 275,161 National School Lunch Program - Summer Food Program 10.559 13004 487,850
National School Lunch Program - Commodity Supplemental Food [2] 10.555 13391 453,393
Total Child Nutrition Cluster 2,650,875
Total U.S. Department of Agriculture 2,650,875
Total Expenditures of Federal Awards 18,085,467$
1 Pass though entity indentifying number not available2 Not recorded in the financial statements
Federal Grantor/Pass-ThroughGrantor/Program or Cluster Title

See Notes to Supplementary Information 82
Fremont Unified School District Local Education Agency Organization Structure
June 30, 2020 ORGANIZATION The Fremont Unified School District was formed on July 1, 1964 and is comprised of an area of approximately 90 square miles located in Alameda County. There were no changes in the boundaries of the District during the current year. The District operates 28 elementary schools (K-6), four junior high schools (7-8), one middle school (6-8), and five comprehensive high schools (9-12). The District also maintains a preschool, a continuation school, an adult education program and a charter school. The Board of Education and the District Administrators for the fiscal year ended June 30, 2020, were as follows: GOVERNING BOARD
MEMBER OFFICE TERM EXPIRES Desrie Campbell
President 2024
Larry Sweeney Vice President 2022
Ann Crosbie Clerk 2020
Michele Berke
Member 2020
Dianne Jones Member 2022
Vivek Prasad Member Elect Effective 12/16/20
2024
Yajing “Rachel” Zhang Member Elect Effective 12/16/20
2024
Zayaan Khan Student Member 2021
ADMINISTRATION
Christopher “CJ” Cammack Superintendent
Marcus Battle Associate Superintendent
Leticia Salinas Assistant Superintendent, Instructional Services
Raul Zamora, Ed.D. Assistant Superintendent, Human Resources

See Notes to Supplementary Information 83
Fremont Unified School District Schedule of Average Daily Attendance
Year Ended June 30, 2020
Final Report As Adjusted per AuditSecond Period Annual Second Period Annual
Report Report Report Report
Regular ADATransitional kindergarten through third 11,030.51 11,030.51 11,029.51 11,029.51 Fourth through sixth 7,750.11 7,750.11 7,750.11 7,750.11 Seventh and eighth 5,007.10 5,007.10 5,007.10 5,007.10 Ninth through twelfth 10,102.43 10,102.43 10,102.43 10,102.43
Total Regular ADA 33,890.15 33,890.15 33,889.15 33,889.15
Extended Year Special EducationTransitional kindergarten through third 29.09 29.09 29.09 29.09 Fourth through sixth 12.17 12.17 12.17 12.17 Seventh and eighth 7.18 7.18 7.18 7.18 Ninth through twelfth 18.76 18.76 18.76 18.76
Total Extended Year Special Education 67.20 67.20 67.20 67.20
Special Education, Nonpublic, Nonsectarian SchoolsTransitional kindergarten through third 7.33 7.33 7.33 7.33 Fourth through sixth 7.83 7.83 7.83 7.83 Seventh and eighth 6.82 6.82 6.82 6.82 Ninth through twelfth 20.72 20.72 20.72 20.72
Total Special Education, Nonpublic, Nonsectarian Schools 42.70 42.70 42.70 42.70
Extended Year Special Education, Nonpublic, Nonsectarian SchoolsTransitional kindergarten through third 1.67 1.67 1.67 1.67 Fourth through sixth 1.74 1.74 1.74 1.74 Seventh and eighth 1.63 1.63 1.63 1.63 Ninth through twelfth 5.43 5.43 5.43 5.43
Total Extended Year Special Education, Nonpublic, Nonsectarian Schools 10.47 10.47 10.47 10.47
Total ADA 34,010.52 34,010.52 34,009.52 34,009.52 Charter SchoolRegular ADA - Non Classroom Based
Transitional kindergarten through third 26.00 26.00 26.00 26.00 Fourth through sixth 51.61 51.61 51.61 51.61 Seventh and eighth 78.46 78.46 78.46 78.46 Ninth through twelfth 233.97 233.97 233.97 233.97
Total Regular ADA 390.04 390.04 390.04 390.04
Total Charter School ADA 390.04 390.04 390.04 390.04

See Notes to Supplementary Information 84
Fremont Unified School District Schedule of Instructional Time
Year Ended June 30, 2020
1986-1987 2019-2020Minutes Actual Traditional Multitrack
Grade Level Requirement Minutes Calendar Calendar Status
Kindergarten 36,000 36,000 180 N/A CompliedGrades 1 - 3 50,400
Grade 1 51,300 180 N/A CompliedGrade 2 51,300 180 N/A CompliedGrade 3 51,300 180 N/A Complied
Grades 4 - 8 54,000 Grade 4 54,000 180 N/A CompliedGrade 5 54,000 180 N/A CompliedGrade 6 54,000 180 N/A CompliedGrade 7 57,385 180 N/A CompliedGrade 8 57,385 180 N/A Complied
Grades 9 - 12 64,800 Grade 9 64,800 180 N/A CompliedGrade 10 64,800 180 N/A CompliedGrade 11 64,800 180 N/A CompliedGrade 12 64,800 180 N/A Complied
Number of Days

See Notes to Supplementary Information 85
Fremont Unified School District Reconciliation of Annual Financial and Budget Report with Audited Financial Statements
Year Ended June 30, 2020 There were no adjustments to the Unaudited Actual Financial Report, which required reconciliation to the audited financial statements at June 30, 2020.

See Notes to Supplementary Information 86
Fremont Unified School District Schedule of Financial Trends and Analysis
Year Ended June 30, 2020
(Budget)2021 1 2020 2019 2018
General Fund 3Revenues 361,655,446$ 398,049,127$ 391,259,848$ 367,360,555$ Other sources 3,500,000 - 12,283,979 1,440,056
Total Revenuesand Other Sources 365,155,446 398,049,127 403,543,827 368,800,611
Expenditures 369,707,448 401,468,805 396,517,110 372,381,140 Other uses and transfers out 1,618,193 1,355,749 746,697 2,533,234
Total Expendituresand Other Uses 371,325,641 402,824,554 397,263,807 374,914,374
Increase/(Decrease)in Fund Balance (6,170,195) (4,775,427) 6,280,020 (6,113,763)
Ending Fund Balance 25,654,464$ 31,824,659$ 36,600,086$ 30,320,066$
Available Reserves 2, 4 14,097,459$ 14,097,460$ 11,917,915$ 11,247,433$
Available Reserves as aPercentage of Total Outgo 4 3.80% 3.50% 3.00% 3.00%
Long-Term Liabilities 1,087,680,355$ 1,116,289,441$ 1,126,788,778$ 1,000,454,866$
K-12 Average DailyAttendance at P-2 33,901 34,010 34,236 34,331
The General Fund balance has increased by $1,504,593 over the past two years. The fiscal year 2020-2021 budget projects a decrease of $6,170,195 (19.4 percent). For a district this size, the State recommends available reserves of at least 2 percent of total General Fund expenditures, transfers out, and other uses (total outgo). The District has incurred operating surpluses in one of the past three years and anticipates incurring an operating deficit during the 2020-2021 fiscal year. Total long-term liabilities have increased by $115,834,575 over the past two years. Average daily attendance has decreased by 326 over the past two years. Additional decline of 104 ADA is anticipated during fiscal year 2019-2020. 1 Budget 2021 is included for analytical purposes only and has not been subjected to audit. 2 Available reserves consist of all unassigned fund balances including all amounts reserved for economic uncertainties contained with the General Fund. 4 On behalf payments of $8,597,371 and $12,687,131 relating to Senate Bill 90 have been excluded from the calculation of available reserves for the fiscal year(s) ending June 30, 2020 and June 30, 2019.

See Notes to Supplementary Information 87
Fremont Unified School District Schedule of Charter Schools
Year Ended June 30, 2020
Included in Name of Charter School and Charter Number Audit Report
Circle of Independent Learning Charter School (0152) Yes

See Notes to Supplementary Information 88
Fremont Unified School District Combining Balance Sheet – Non-Major Governmental Funds
June 30, 2020
Special Education Adult Child Special Reserve Non-MajorCharter Schools Pass-Through Education Development Cafeteria Fund for Capital Governmental
Fund Fund Fund Fund Fund Outlay Projects FundsAssets
Deposits and investments 1,004,277$ 34,581$ 1,602,136$ 505,820$ 710,577$ 13,073,843$ 16,931,234$ Receivables 4,269 - 299,578 77,969 865,559 158,660 1,406,035 Due from other governments 523,318 4,327,644 336,448 59,429 150,264 - 5,397,103 Stores inventories - - - - 159,798 - 159,798
Total assets 1,531,864$ 4,362,225$ 2,238,162$ 643,218$ 1,886,198$ 13,232,503$ 23,894,170$
Liabilities and Fund Balances
LiabilitiesAccounts payable 81,359$ 4,362,225$ 53,207$ 63,503$ 837,571$ 510,753$ 5,908,618$ Due to other funds 210,293 - 135,970 15,756 888,829 - 1,250,848 Due to other governments 124,823 - - - - - 124,823
Total liabilities 416,475 4,362,225 189,177 79,259 1,726,400 510,753 7,284,289
Fund BalancesNonspendable - - - - 159,798 - 159,798 Restricted 41,215 - 412,217 490,247 - - 943,679 Assigned 1,074,174 - 1,636,768 73,712 - 12,721,750 15,506,404
Total fund balances 1,115,389 - 2,048,985 563,959 159,798 12,721,750 16,609,881
Total liabilities and fund balances 1,531,864$ 4,362,225$ 2,238,162$ 643,218$ 1,886,198$ 13,232,503$ 23,894,170$

See Notes to Supplementary Information 89
Fremont Unified School District Combining Statement of Revenues, Expenditure, and Changes in Fund Balances – Non-Major Governmental Funds
For the Year Ended June 30, 2020
Special Education Adult Child County School Special Reserve Non-MajorCharter Schools Pass-Through Education Development Cafeteria Facilities Fund for Capital Governmental
Fund Fund Fund Fund Fund Fund Outlay Projects Funds
RevenuesLocal Control Funding Formula 3,814,257$ -$ -$ -$ -$ -$ -$ 3,814,257$ Federal sources - 3,220,444 638,320 - 2,197,482 - - 6,056,246 Other State sources 349,413 9,379,278 3,593,250 1,147,641 172,618 2,939,790 - 17,581,990 Other local sources 221,257 - 825,689 509,032 2,762,194 22,856 628,274 4,969,302
Total revenues 4,384,927 12,599,722 5,057,259 1,656,673 5,132,294 2,962,646 628,274 32,421,795
ExpendituresCurrent
Instruction 3,153,976 - 2,830,271 891,010 - - - 6,875,257 Instruction-related activities
Supervision of instruction 51,778 - 194,052 656,115 - - - 901,945 Instructional library, media, and technology 107,412 - 127,426 - - - - 234,838 School site administration 664,970 - 1,443,447 - - - - 2,108,417
Pupil servicesFood services 825 - - 28,087 6,221,449 - - 6,250,361 All other pupil services 202,318 - - - - - - 202,318
AdministrationData processing 23,827 - - - - - - 23,827 All other administration 151,954 - 135,970 51,236 193,343 - - 532,503
Plant services 58,746 - 350,732 4,612 34,573 - - 448,663 Other outgo - 12,599,722 - - - - - 12,599,722
Facility acquisition and construction 208,864 - - - - - 2,514,910 2,723,774
Total expenditures 4,624,670 12,599,722 5,081,898 1,631,060 6,449,365 - 2,514,910 32,901,625
Excess (Deficiency) of Revenues Over Expenditures (239,743) - (24,639) 25,613 (1,317,071) 2,962,646 (1,886,636) (479,830)
Other Financing Sources (Uses)Transfers in - - - - 1,355,749 - - 1,355,749 Transfers out - - - - - (2,962,646) (1,216,496) (4,179,142)
Net Financing Sources (Uses) - - - - 1,355,749 (2,962,646) (1,216,496) (2,823,393)
Net Change in Fund Balances (239,743) - (24,639) 25,613 38,678 - (3,103,132) (3,303,223)
Fund Balance - Beginning 1,355,132 - 2,073,624 538,346 121,120 - 15,824,882 19,913,104
Fund Balance - Ending 1,115,389$ -$ 2,048,985$ 563,959$ 159,798$ -$ 12,721,750$ 16,609,881$

90
Fremont Unified School District Note to Supplementary Information
June 30, 2020 Note 1 - Purpose of Schedules Schedule of Expenditures of Federal Awards The accompanying Schedule of Expenditures of Federal Awards includes the Federal grant activity of the District and is presented on the modified accrual basis of accounting. The information in this schedule is presented in accordance with the requirements of Title 2 U.S. Code of Federal Regulations Part 200, Uniform Administrative Requirements, Cost Principles, and Audit Requirements for Federal Awards (Uniform Guidance). Therefore, some amounts presented in this schedule may differ from amounts presented in, or used in the preparation of, the financial statements. The District has not elected to use the ten percent de minimis cost rate as covered in Section 200.414 Indirect (F&A) costs of the Uniform Guidance. No Federal financial assistance has been provided to a subrecipient. The following schedule provides reconciliation between revenues reported on the Statement of Revenues, Expenditures, and Changes in Fund Balances, and the related expenditures reported on the Schedule of Expenditures of Federal Awards.
CFDANumber Amount
DescriptionTotal Federal Revenues reported on the financial statements 17,632,074$
Commodities 10.555 453,393
Total Schedule of Expenditures of Federal Awards 18,085,467$
Local Education Agency Organization Structure This schedule provides information about the District’s boundaries and schools operated, members of the governing board, and members of the administration. Schedule of Average Daily Attendance (ADA) Average daily attendance (ADA) is a measurement of the number of pupils attending classes of the District. The purpose of attendance accounting from a fiscal standpoint is to provide the basis on which apportionments of State funds are made to school districts. This schedule provides information regarding the attendance of students at various grade levels and in different programs. Schedule of Instructional Time The District has received incentive funding for increasing instructional time as provided by the Incentives for Longer Instructional Day. The District has met its target funding. This schedule presents information on the amount of instructional time offered by the District and whether the District complied with the provisions of Education Code Sections 46200 through 46206. Districts must maintain their instructional minutes at the 1986-87 requirements, as required by Education Code Section 46201.

91
Fremont Unified School District Notes to Supplementary Information
June 30, 2020 Due to school closures caused by COVID-19, the District filed the COVID-19 School Closure Certification certifying that schools were closed for 58 days due to the pandemic, In addition, planned minutes covered by the COVID-19 School Certification were included in the Actual Minutes column but were not actually offered due to the COVID-19 school closure. Reconciliation of Annual Financial and Budget Report with Audited Financial Statements This schedule provides the information necessary to reconcile the fund balance of all funds reported on the Unaudited Actual Financial Report to the audited financial statements. Schedule of Financial Trends and Analysis This schedule discloses the District’s financial trends by displaying past years’ data along with current year budget information. These financial trend disclosures are used to evaluate the District’s ability to continue as a going concern for a reasonable period of time. Schedule of Charter Schools This schedule lists all Charter Schools chartered by the District, and displays information for each Charter School on whether or not the Charter School is included in the School District audit. Non-Major Governmental Funds - Balance Sheet and Statement of Revenues, Expenditures and Changes in Fund Balances The Non-Major Governmental Funds Combining Balance Sheet and Combining Statement of Revenues, Expenditures and Changes in Fund Balances is included to provide information regarding the individual funds that have been included in the Non-Major Governmental Funds column on the Governmental Funds Balance Sheet and Statement of Revenues, Expenditures, and Changes in Fund Balances.

eidebailly.com
Independent Auditor’s Reports June 30, 2020
Fremont Unified School District

93
What inspires you, inspires us. | eidebailly.com
3130 Crow Canyon Pl., Ste. 300 | San Ramon, CA 94583-1386 | T 925.480.4000 | F 925.884.2480 | EOE
Independent Auditor’s Report on Internal Control over Financial Reporting and on Compliance and Other Matters Based on an Audit of Financial Statements Performed in Accordance with Government
Auditing Standards To the Board of Directors Fremont Unified School District Fremont, California We have audited, in accordance with auditing standards generally accepted in the United States of America and the standards applicable to financial audits contained in Government Auditing Standards, issued by the Comptroller General of the United States, the financial statements of the governmental activities, each major fund, and the aggregate remaining fund information of Fremont Unified School District, as of and for the year ended June 30, 2020, and the related notes to the financial statements, which collectively comprise Fremont Unified School District‘s basic financial statements and have issued our report thereon dated January 12, 2021. Internal Control over Financial Reporting In planning and performing our audit of the financial statements, we considered Fremont Unified School District‘s internal control over financial reporting (internal control) as a basis for designing the audit procedures that are appropriate in the circumstances for the purpose of expressing our opinions on the financial statements, but not for the purpose of expressing an opinion on the effectiveness of Fremont Unified School District‘s internal control. Accordingly, we do not express an opinion on the effectiveness of Fremont Unified School District‘s internal control. A deficiency in internal control exists when the design or operation of a control does not allow management or employees, in the normal course of performing their assigned functions, to prevent, or detect and correct, misstatements on a timely basis. A material weakness is a deficiency, or a combination of deficiencies, in internal control, such that there is a reasonable possibility that a material misstatement of the entity’s financial statements will not be prevented, or detected and corrected on a timely basis. A significant deficiency is a deficiency, or a combination of deficiencies, in internal control that is less severe than a material weakness, yet important enough to merit attention by those charged with governance. Our consideration of internal control was for the limited purpose described in the first paragraph of this section and was not designed to identify all deficiencies in internal control that might be material weaknesses or significant deficiencies. Given these limitations, during our audit we did not identify any deficiencies in internal control that we consider to be material weaknesses. However, material weaknesses may exist that have not been identified.

94
Compliance and Other Matters As part of obtaining reasonable assurance about whether Fremont Unified School District‘s financial statements are free from material misstatement, we performed tests of its compliance with certain provisions of laws, regulations, contracts, and grant agreements, noncompliance with which could have a direct and material effect on the financial statements. However, providing an opinion on compliance with those provisions was not an objective of our audit, and accordingly, we do not express such an opinion. The results of our tests disclosed no instances of noncompliance or other matters that are required to be reported under Government Auditing Standards. Purpose of this Report The purpose of this report is solely to describe the scope of our testing of internal control and compliance and the results of that testing, and not to provide an opinion on the effectiveness of the entity’s internal control or on compliance. This report is an integral part of an audit performed in accordance with Government Auditing Standards in considering the entity’s internal control and compliance. Accordingly, this communication is not suitable for any other purpose.
San Ramon, California January 12, 2021

95
What inspires you, inspires us. | eidebailly.com
3130 Crow Canyon Pl., Ste. 300 | San Ramon, CA 94583-1386 | T 925.480.4000 | F 925.884.2480 | EOE
Independent Auditor’s Report on Compliance for Each Major Federal Program; Report on Internal Control Over Compliance Required by the Uniform Guidance
To the Board of Directors Fremont Unified School District Fremont, California Report on Compliance for Each Major Federal Program We have audited Fremont Unified School District‘s compliance with the types of compliance requirements described in the OMB Compliance Supplement that could have a direct and material effect on each of Fremont Unified School District‘s major federal programs for the year ended June 30, 2020. Fremont Unified School District‘s major federal programs are identified in the summary of auditor’s results section of the accompanying schedule of findings and questioned costs. Management’s Responsibility Management is responsible for compliance with federal statutes, regulations, and the terms and conditions of its federal awards applicable to its federal programs. Auditor’s Responsibility Our responsibility is to express an opinion on compliance for each of Fremont Unified School District‘s major federal programs based on our audit of the types of compliance requirements referred to above. We conducted our audit of compliance in accordance with auditing standards generally accepted in the United States of America; the standards applicable to financial audits contained in Government Auditing Standards, issued by the Comptroller General of the United States; and the audit requirements of Title 2 U.S. Code of Federal Regulations Part 200, Uniform Administrative Requirements, Cost Principles, and Audit Requirements for Federal Awards (Uniform Guidance). Those standards and the Uniform Guidance require that we plan and perform the audit to obtain reasonable assurance about whether noncompliance with the types of compliance requirements referred to above that could have a direct and material effect on a major federal program occurred. An audit includes examining, on a test basis, evidence about Fremont Unified School District‘s compliance with those requirements and performing such other procedures as we considered necessary in the circumstances. We believe that our audit provides a reasonable basis for our opinion on compliance for each major federal program. However, our audit does not provide a legal determination of Fremont Unified School District‘s compliance.

96
Opinion on Each Major Federal Program In our opinion, Fremont Unified School District‘s complied, in all material respects, with the types of compliance requirements referred to above that could have a direct and material effect on each of its major federal programs for the year ended June 30, 2020. Report on Internal Control over Compliance Management of Fremont Unified School District is responsible for establishing and maintaining effective internal control over compliance with the types of compliance requirements referred to above. In planning and performing our audit of compliance, we considered Fremont Unified School District‘s internal control over compliance with the types of requirements that could have a direct and material effect on each major federal program to determine the auditing procedures that are appropriate in the circumstances for the purpose of expressing an opinion on compliance for each major federal program and to test and report on internal control over compliance in accordance with the Uniform Guidance, but not for the purpose of expressing an opinion on the effectiveness of internal control over compliance. Accordingly, we do not express an opinion on the effectiveness of the Fremont Unified School District‘s internal control over compliance. A deficiency in internal control over compliance exists when the design or operation of a control over compliance does not allow management or employees, in the normal course of performing their assigned functions, to prevent, or detect and correct, noncompliance with a type of compliance requirement of a federal program on a timely basis. A material weakness in internal control over compliance is a deficiency, or a combination of deficiencies, in internal control over compliance, such that there is a reasonable possibility that material noncompliance with a type of compliance requirement of a federal program will not be prevented, or detected and corrected, on a timely basis. A significant deficiency in internal control over compliance is a deficiency, or a combination of deficiencies, in internal control over compliance with a type of compliance requirement of a federal program that is less severe than a material weakness in internal control over compliance, yet important enough to merit attention by those charged with governance. Our consideration of internal control over compliance was for the limited purpose described in the first paragraph of this section and was not designed to identify all deficiencies in internal control over compliance that might be material weaknesses or significant deficiencies. We did not identify any deficiencies in internal control over compliance that we consider to be material weaknesses. However, material weaknesses may exist that have not been identified. The purpose of this report on internal control over compliance is solely to describe the scope of our testing of internal control over compliance and the results of that testing based on the requirements of the Uniform Guidance. Accordingly, this report is not suitable for any other purpose.
January 12, 2021 San Ramon, California

97
What inspires you, inspires us. | eidebailly.com
3130 Crow Canyon Pl., Ste. 300 | San Ramon, CA 94583-1386 | T 925.480.4000 | F 925.884.2480 | EOE
Independent Auditor’s Report on State Compliance
To the Board of Directors Fremont Unified School District Fremont, California Report on State Compliance We have audited Fremont Unified School District’s (the District) compliance with the types of compliance requirements described in the 2019-2020 Guide for Annual Audits of K-12 Local Education Agencies and State Compliance Reporting, applicable to the state laws and regulations listed in the table below for’ the year ended June 30, 2020. Management’s Responsibility Management is responsible for compliance with the state laws and regulations as identified in the table below. Auditor’s Responsibility Our responsibility is to express an opinion on the District’s compliance ’with state laws and regulations based on our audit of the types of compliance requirements referred to below. We conducted our audit in accordance with auditing standards generally accepted in the United States of America; the standards applicable to financial audits contained in Government Auditing Standards, issued by the Comptroller General of the United States; and the audit requirements of the 2019-2020 Guide for Annual Audits of K-12 Local Education Agencies and State Compliance Reporting. Those standards require that we plan and perform the audit to obtain reasonable assurance about whether noncompliance with the compliance requirements listed below has occurred. An audit includes examining, on a test basis, evidence about the District’s ’compliance with those requirements and performing such other procedures as we considered necessary in the circumstances. We believe that our audit provides a reasonable basis for our opinion on state compliance. However, our audit does not provide a legal determination of the District’s ’compliance.

98
Compliance Requirements Tested In connection with the audit referred to above, we selected and tested transactions and records to determine the District’s compliance with laws and regulations applicable to the following items:
Procedures Performed
LOCAL EDUCATION AGENCIES OTHER THAN CHARTER SCHOOLS Attendance Yes Teacher Certification and Misassignments Yes Kindergarten Continuance Yes Independent Study Yes Continuation Education Yes, see below Instructional Time Yes Instructional Materials Yes Ratios of Administrative Employees to Teachers Yes Classroom Teacher Salaries Yes Early Retirement Incentive No, see below Gann Limit Calculation Yes School Accountability Report Card Yes Juvenile Court Schools No, see below Middle or Early College High Schools No, see below K-3 Grade Span Adjustment Yes Transportation Maintenance of Effort Yes Apprenticeship: Related and Supplemental Instruction No, see below Comprehensive School Safety Plan Yes District of Choice No, see below
SCHOOL DISTRICTS, COUNTY OFFICES OF EDUCATION, AND CHARTER SCHOOLS
California Clean Energy Jobs Act Yes After/Before School Education and Safety Program:
General Requirements Yes After School Yes Before School No, see below
Proper Expenditure of Education Protection Account Funds Yes Unduplicated Local Control Funding Formula Pupil Counts Yes Local Control Accountability Plan Yes Independent Study - Course Based No, see below
CHARTER SCHOOLS
Attendance Yes Mode of Instruction No, see below Nonclassroom-Based Instruction/Independent Study for Charter Schools Yes Determination of Funding for Nonclassroom-Based Instruction Yes Annual Instruction Minutes Classroom-Based No, see below Charter School Facility Grant Program No, See below

99
The District does not offer a Work Experience Program; therefore, we did not perform procedures related to the Work Experience Program within the Continuation Education Attendance Program. The District did not offer an Early Retirement Incentive Program during the current year; therefore, we did not perform procedures related to the Early Retirement Incentive Program. The District does not have any Juvenile Court Schools or Middle or Early College High Schools; therefore, we did not perform any procedures related to Juvenile Court Schools, or Middle or Early College High Schools. The District does not offer a Before School Education and Safety Program; therefore, we did not perform any procedures related to the Before School Education and Safety Program. The District does not offer an Apprenticeship Program; therefore, we did not perform any procedures for the Apprenticeship Program. The District does not offer an Independent Study Course Based Program; therefore, we did not perform any procedures for the Independent Study Course Based Program. The District does not offer a District of Choice Program; therefore, we did not perform any procedures for the District of Choice Program. The Charter School did not have any classroom-based ADA, therefore we did not perform any procedures related to Determination of Funding for Annual Instructional Minutes Classroom Based, or Mode of Instruction, and the District did not have a Facility Grant. Basis for Qualified Opinion on Kindergarten Retention As described in the accompanying Schedule of State Compliance Findings and Questioned Costs, Fremont Unified School District did not comply with requirements regarding kindergarten retention finding 2020-001. Compliance with such requirements is necessary, in our opinion, for Fremont Unified School District to comply with the requirements referred to above. Qualified Opinion on Kindergarten Retention In our opinion, except for the noncompliance described in the Basis for Qualified Opinion paragraph, Fremont Unified School District complied, in all material respects, with the compliance requirements referred to above for the year ended June 30, 2020. Fremont Unified School District‘s response to the noncompliance finding identified in our audit is described in the accompanying Schedule of State Compliance Findings and Questioned Costs. Fremont Unified School District‘s response was not subjected to the auditing procedures applied in the audit of compliance and, accordingly, we express no opinion on the response.

100
Unmodified Opinion on Each of the Other Programs In our opinion, Fremont Unified School District complied with the laws and regulations of the state programs referred to above for the year ended June 30, 2020, except as described in the accompanying Schedule of State Compliance Findings and Questioned Costs. The purpose of this report on state compliance is solely to describe the results of our testing based on the requirements of the 2019-2020 Guide for Annual Audits of K-12 Local Education Agencies and State Compliance Reporting. Accordingly, this report is not suitable for any other purpose.
San Ramon, California January 12, 2021
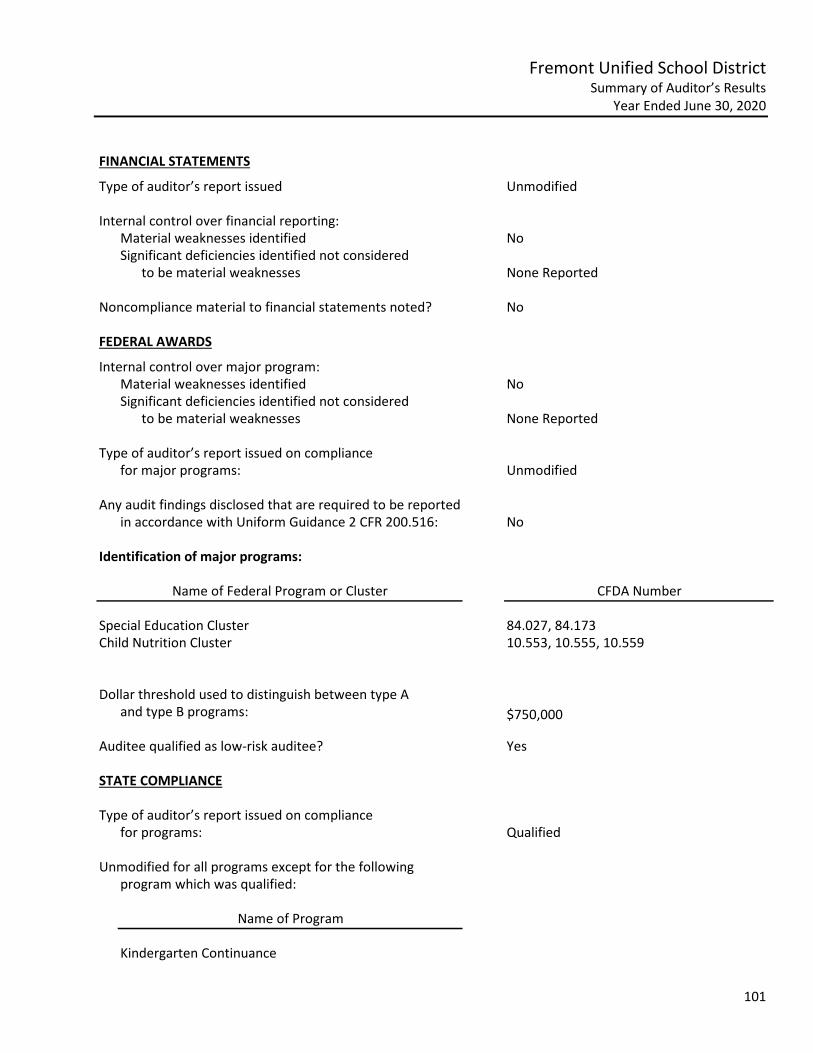
101
Fremont Unified School District Summary of Auditor’s Results
Year Ended June 30, 2020 FINANCIAL STATEMENTS
Type of auditor’s report issued Unmodified
Internal control over financial reporting:Material weaknesses identified NoSignificant deficiencies identified not considered
to be material weaknesses None Reported
Noncompliance material to financial statements noted? No
FEDERAL AWARDS
Internal control over major program:Material weaknesses identified NoSignificant deficiencies identified not considered
to be material weaknesses None Reported
Type of auditor’s report issued on compliance for major programs: Unmodified
Any audit findings disclosed that are required to be reportedin accordance with Uniform Guidance 2 CFR 200.516: No
Identification of major programs:
CFDA Number
Special Education Cluster 84.027, 84.173Child Nutrition Cluster 10.553, 10.555, 10.559
Dollar threshold used to distinguish between type A and type B programs: $750,000
Auditee qualified as low-risk auditee? Yes
STATE COMPLIANCE
Type of auditor’s report issued on compliancefor programs: Qualified
Unmodified for all programs except for the followingprogram which was qualified:
Kindergarten Continuance
Name of Federal Program or Cluster
Name of Program

102
Fremont Unified School District Financial Statement Findings
Year Ended June 30, 2020 None reported.

103
Fremont Unified School District Federal Awards Findings and Questioned Costs
Year Ended June 30, 2020 None reported.

104
Fremont Unified School District State Compliance Findings and Questioned Costs
Year Ended June 30, 2020 The following findings represent instances of noncompliance and/or questioned costs relating to compliance with state laws and regulations. The findings have been coded as follows: Five Digit Code AB 3627 Finding Type 10000 Attendance 40000 State Compliance 42000 Charter School Facilities Program
43000 Apprenticeship: Related and Supplemental Instruction 61000 Classroom Teacher Salaries 62000 Local Control Accountability Plan 70000 Instructional Materials 71000 Teacher Misassignments 72000 School Accountability Report card 2020-001 Code 10000 – Kindergarten retention Criteria or Specific Requirements
Education Code 48000 (c) requires that students retained in kindergarten classes for an additional year have kindergarten retention forms signed by parent to acknowledge that the students will be repeating the grade prior to the start of the new school year.
Condition Kindergarten retention signed parent notification form not on file. Questioned Costs 1 ADA or an estimated $11,068. Context One of 8 students retained for kindergarten did not have a signed approval form on file. Effect The District is not in compliance with requirements for kindergarten retention notifications and forms. Cause The form was not available for review. Repeat Finding No Recommendation Verify required forms are on file and consider need to have a duplicate copy filed in a central location. Corrective Action Plan
The District’s Elementary Director who supervises elementary schools has updated our process to ensure we follow the procedure and appropriately collect the Kindergarten Retention Forms. Principals (and secretaries) are now expected to send a copy of all retention paperwork to Elementary Education as part of the retention process. In addition, the sites must have all retention paperwork in the cumulative files prior to the last day of school. Principals and office staff will add this to their end of the year check out process.

105
Fremont Unified School District Summary Schedule of Prior Audit Findings
Year Ended June 30, 2020 There were no audit findings reported in the prior year’s Schedule of Findings and Questioned Costs.