financial statement comparability and investor responsiveness … · 2018-12-05 · in additional...
TRANSCRIPT
University of St. Thomas, MinnesotaUST Research Online
Accounting Faculty Publications Accounting
2017
Financial Statement Comparability and InvestorResponsiveness to Earnings NewsMatthew StallingsUniversity of St. Thomas - Minnesota, [email protected]
Follow this and additional works at: https://ir.stthomas.edu/ocbacctpub
Part of the Accounting Commons
This Article is brought to you for free and open access by the Accounting at UST Research Online. It has been accepted for inclusion in AccountingFaculty Publications by an authorized administrator of UST Research Online. For more information, please contact [email protected].
Recommended CitationStallings, Matthew, "Financial Statement Comparability and Investor Responsiveness to Earnings News" (2017). Accounting FacultyPublications. 79.https://ir.stthomas.edu/ocbacctpub/79

Financial Statement Comparability and Investor Responsiveness to Earnings
News
Matthew A. Stallings
University of St. Thomas
This study investigates the role of financial statement comparability in the stock price sensitivity to firm-
specific earnings news. Results suggest that information content of earnings is greater for firms with
higher comparability, suggesting that comparability contributes to information usefulness for investors in
equity valuation decisions. Further support indicates that comparability enhances usefulness through
increased response to positive earnings surprises. This influence is pronounced for the earnings news of
small firms, high volatility firms, growth/value firms, and firms with low return on assets, suggesting that
comparability is more informative for more speculative stocks.
INTRODUCTION
This study investigates whether financial statement comparability impacts the usefulness of
information through its effect on the cross-sectional variation in the earnings-return relationship. The
Financial Accounting Standards Board (FASB) defines financial statement comparability as the quality of
information enabling users to identify similarities in and differences between two sets of economic
phenomena in order to enhance usefulness (FASB [1980, 2010]).1 Because decisions of financial
statement users involve choosing between alternatives, relevant and faithfully represented information
about a reporting entity is most useful if it can be compared with similar information reported by other
entities and by the same entity in other periods (FASB [2010], QC20).2 Following De Franco et al. [2011]
and Francis et al. [2014], I conceptually define financial statement comparability as how closely similar
economic events map into the financial statements of firms due to the consistency with which accounting
rules are applied across the firms. From an empirical framework, firm-pairs in the same industry and
fiscal year are expected to have similar earnings and accruals structures, implying comparability, all else
being equal (De Franco et al. [2011]; Francis et al. [2014]).
I extend the financial statement comparability literature to the setting of earnings announcements and
information content of earnings to examine whether comparability contributes to information usefulness,
with investor responsiveness to earnings being a direct proxy for earnings informativeness (Holthausen
and Verrechia [1988]; Liu and Thomas [2000]).3 Because earnings news is correlated with equity market
characteristics that occur when investors revise their equity valuations, information in earnings is
correlated with the information used by investors in the equity valuation decisions (Beaver [1968]; Ball
and Brown [1967, 1968]). Overall, earnings announcements provide information about future firm
earnings and cash flows, where stock price response to the announcement leads to investor valuation of
these incremental cash flows (Kasznik and McNichols [2002]). If financial statement comparability helps
investors better understand firm-specific earnings news/information, then based on the FASB definition
and qualitative objective, comparability should be useful in evaluating alternative investments.
To investigate the role of financial statement comparability in the cross-section of the earnings-return
relationship, I use the standard event study methodology to compute abnormal returns around the annual
earnings announcement date to measure stock price sensitivity to earnings news for the years 1985–2012.
The behavior of security prices is an operational test of usefulness of information in financial statements
(Ball and Brown [1968]), where positive capital markets research uses changes in security prices as an
objective, external outcome to infer whether information in accounting reports is useful to market
participants (Kothari [2001]). Using accounting system variation, earnings covariation, and discretionary
accruals differences as measures of comparability, I examine the impact of comparability on the
sensitivity of stock prices to both good and bad earnings surprises (Earnings Response Coefficients
[ERCs]). Initial results indicate higher information content of earnings for firms with greater accounting
system comparability and earnings covariation comparability. Further results suggest greater magnitude in
ERC for firms with positive unexpected earnings news and higher levels of accounting system
comparability, earnings covariation comparability, and discretionary accruals comparability.
To examine the possibility that the higher ERC for positive earnings news when financial statement
comparability is introduced may reflect the greater information content of the news during periods with
higher average comparability, I control for the informativeness of earnings news and how the estimates of
the information content of earnings may vary with comparability. Using the measure of information
content of earnings developed by Kasznik and McNichols [2002], I find no evidence in support of this
alternative as the incremental effect of all three comparability measures on positive unexpected earnings
is statistically indistinguishable from zero when examining past and current earnings predictability for
future earnings. I also control for risk-based explanations for the results by computing the abnormal return
over a narrow window around the earnings announcement, where the variation of risk over time is less
likely to be evidence for such a short return accumulation period (Mian and Sankaraguruswamy [2012]).
In additional analyses, I form portfolios based on firm characteristics used as controls in De Franco et
al. [2011] to investigate whether the effect of accounting system comparability on the valuation of stocks
is uniform across these attributes. By focusing on firm characteristic extremes and the effect of
comparability, I am controlling for potential skewness in the distribution of comparability to examine
whether comparability remains useful. Because financial statement comparability lowers the cost of
acquiring information and increases the overall quantity and quality of firm information (De Franco et al.
[2011]), it is possible that the effect of comparability on the assessment of stocks is greater for speculative
stocks whose expected cash flows are more uncertain and more difficult to value.4 In addition, both
extreme growth and distressed firms are prone to speculation and are also difficult to arbitrage (Baker and
Wurgler [2006]) and so could be more affected by financial statement comparability, through a reduction
in the propensity to speculate. Considering that the earnings of speculative stocks are often also less
persistent (Baginski et al. [1999]), it can make the identification and valuation of the associated
incremental cash flows more difficult and more subjective, leading to a greater effect of comparability in
the pricing of the earnings of such stocks. Therefore, I investigate and find that the impact of
comparability on the pricing of positive earnings is greater for small firms, high volatility firms,
growth/value firms, and firms with low return on assets. These results indicate that financial statement
comparability exhibits greater usefulness for more speculative stocks, implying that comparability
increases informativeness for firms with cash flows that are more uncertain and difficult to assess, thereby
reducing the propensity to speculate. Overall, results suggest that financial statement comparability
enhances the usefulness of information to capital markets participants.
This paper advances the capital markets literature in the following ways. The results bridge two
research streams by providing evidence on the cross-sectional effect of financial statement comparability
on the stock price sensitivity to firm-specific earnings news. Specifically, this study utilizes newly
developed firm-specific, output-based measures of comparability to investigate additional benefits of
comparable information to financial statement users through enhanced usefulness in influencing the
ability of current share prices to reflect the information in current earnings announcements. This paper

also answers the call from Schipper [2003] for more research investigating comparability usefulness and
presents additional evidence to support claims that comparability is useful in evaluating alternative
investing opportunities (FASB [1980]).5 In addition, the results are important to the International
Accounting Standards Board (IASB) because the primary objective of the International Financial
Reporting Standards (IFRS) is to develop a single set of global standards that are transparent and
comparable (IASB [1989, 2008]). Overall, this study contributes to the accounting literature by
identifying a factor that influences the ability of current stock prices to reflect the information in current
earnings and provides evidence supporting the FASB contention that financial statement comparability
enhances the decision usefulness of accounting information (FASB [1980]).
This study complements another concurrent paper on the impact of financial statement comparability
and the relationship between stock returns and earnings information. Choi et al. [2013] examine whether
financial statement comparability affects the ability of current period stock returns to reflect information
in future earnings. They find that future earnings response coefficients (FERCs) are higher for firms
issuing financial statement that are more comparable with those of their industry peers. This paper is
different from the Choi et al. [2013] study in that I examine how comparability affects the initial pricing
of earnings information. Although Choi et al. [2013] report that the ERC increases with comparability,
they use a multiple-year valuation model with the emphasis on FERCs. This study focuses on cumulative
abnormal returns using a narrower window around the earnings announcement date to control for risk-
based explanations. In addition, I use a larger sample, a longer sample period, three measures of
comparability, and earnings surprises defined relative to analyst forecasts. I also control for future
earnings and examine stock price response to good and bad earnings news, separately.
The remainder of the paper proceeds as follows. Section 2 reviews relevant literature and develops
the hypothesis. Section 3 describes the research design and defines the variables used in the empirical
tests. Section 4 presents the sample selection and provides descriptive statistics. Section 5 reports results
from the empirical analyses. Section 6 conducts additional analyses and Section 7 concludes.
LITERATURE REVIEW AND HYPOTHESIS DEVELOPMENT
Financial Statement Comparability
Rational investing decisions fundamentally involve evaluating alternative opportunities and are not
possible if comparable information is unavailable, where comparability is defined as the quality of
information that enables users to identify similarities and differences between two sets of economic
phenomena (FASB [1980]). The FASB specifically argues that demand for comparable information
drives accounting regulation. Additionally, when market participants ascertain the comparability of
investments, efficient allocation of capital is facilitated (SEC [2000]). Further, financial statement
analysis textbooks frequently illustrate techniques to adjust accounting numbers and increase
comparability across financial statements in order to better assess individual firm performance (e.g.,
Revsine, Collins, and Johnson [2004]; Penman [2006]; Wild, Subramanyam, and Halsey [2006]; Palepu
and Healy [2007]). In addition, enhancing comparability of disclosures across firms is likely to result in
more accurate valuations of individual firm performances (Dye and Sunder [2001]).
Despite the apparent importance of financial statement comparability, empirical research in this area
is somewhat limited. Current studies have responded to this demand by developing new comparability
measures and applying those measures in a financial accounting context. Several recent papers focus on
IFRS adoption and financial statement comparability effects. For example, Barth et al. [2012] examine
comparability between U.S. firms and IFRS firms and find that IFRS adoption enhances financial
statement comparability with U.S. firms. Brochet et al. [2013] examine whether IFRS leads to capital
market benefits through increased comparability and find that mandatory IFRS adoption improves
comparability and leads to capital market benefits by reducing the ability of insiders to exploit private
information. Lang et al. [2010] examine cross-country comparability changes surrounding mandatory
IFRS adoption and find that financial statement comparability is increased with IFRS adoption. DeFond
et al. [2011] provide evidence that foreign mutual fund ownership increases when mandatory IFRS
adoption leads to improved financial statement comparability.
Other studies in the comparability literature focus on financial statement comparability association
with capital market decisions and alternative determinants of comparability. For example, Francis et al.
[2014] find that auditor style increases earnings comparability within Big 4 auditor clientele. De Franco et
al. [2011] provide evidence that financial statement comparability lowers the cost of acquiring
information and increases the overall quantity and quality of information available to analysts about the
firm. Kim et al. [2013] predict and find that increased comparability is associated with lower bid-ask
spreads for traded bonds, lower credit spreads for bonds and credit default swaps, and steeper credit
default swap term structures, essentially reducing debt market participants’ uncertainty about and pricing
of credit risk. Bradshaw et al. [2011] study financial analysts and suggest that similar accounting policy
choices persuade analyst coverage. Wang [2011] shows that comparability brings economic benefits by
allowing investors to extract additional information from one firm’s information signal for another firm’s
valuation. Overall, if comparability helps investors to understand firm-specific information, then it should
be useful to investors in evaluating alternative investments.
Stock Market Response to Earnings News
Financial statement information allows capital providers to evaluate the return potential of investment
opportunities (FASB [1980]). Accounting research studies have long focused on the valuation
implications of corporate earnings, presupposing that accounting information is efficiently compounded
into stock prices by rational agents in well-functioning capital markets.6 In many instances, this research
relies on the assumption of efficient pricing of information and uses stock price variation around an
information event to capture the effect of that event on shareholder value. The behavior of security prices
is an operational test of usefulness of information in financial statements (Ball and Brown [1968]), where
positive capital markets research uses changes in security prices as an objective, external outcome to infer
whether information in accounting reports is useful to market participants (Kothari [2001]). These stock
prices reflect the market’s expectations about firm performance (Collins et al. [1994]; Haw et al. [2012])
and are more informative when they better anticipate earnings realizations.
Research contends that the correlation between accounting numbers and security returns is a function
of the objectives of financial statements, in which there is a demand for objective, verifiable information
that is useful for performance evaluation purposes (Watts and Zimmerman [1986]).7 Typically, capital-
markets research assumes that an accounting performance measure serves the valuation information role
with the measure designed to provide information useful for valuation gives an indication of the firm’s
economic income or the change in shareholders’ wealth (Kothari [2001]). The relation between abnormal
stock returns and unexpected earnings is commonly labeled the earnings response coefficient (ERC) and
is widely used as a proxy for the informativeness of earnings. The measure directly links earnings to
decision usefulness, which is quality in the context of equity valuation decisions, as investors respond to
information that has value implications.8 Therefore, a higher correlation with value implies that earnings
better reflect fundamental performance (i.e., more informative components of earnings will have a higher
response coefficient). Overall, investor responsiveness to earnings has been used to test a variety of
predictions about the determinants of earnings informativeness including the effects of accounting
methods, governance, firm fundamentals, and leverage.9
Hypothesis
Financial statement comparability has the potential to influence ERC magnitudes because
comparability expands the information set available to investors, arguably increasing usefulness. De
Franco et al. [2011] suggest that financial statement comparability lowers the cost of acquiring
information, and increases the overall quantity and quality of information available. In addition,
enhancing comparability of disclosures across firms can result in efficiency gains by reducing investors’
duplication of information production (Dye and Sunder [2001]).10 Further, Haw et al. [2012] provide
evidence that more information about the transactions and judgments underlying a firm’s current
performance can facilitate accurate prediction of future performance. Similarly, investors can rely on
comparable financial statements to obtain more information about the transactions and judgments
underlying the financial statements (Campbell and Yeung [2012]). Using comparable accounting
information, investors can identify similarities and differences among firms to make more meaningful
comparisons (Chen et al. [2013]).11 As a result, investors are likely to set optimistic valuations on the
incremental cash flows embedded in earnings announcements for firms with more comparable financial
information.
Based on the above arguments, if information is enhanced through greater financial statement
comparability, I expect higher earnings response coefficients for firms that have more comparable
financial statements with those of their industry peers. Since the earnings response coefficient is a
measure of earnings quality (Liu and Thomas [2000]), comparability should increase information quality
through an incremental effect on the earnings-return relationship.12 Because financial statement
comparability enhances the usefulness of information (FASB [1980, 2010] and lowers the cost of
acquiring and processing information (De Franco et al. [2011]), the hypothesis examines whether
financial statement comparability enhances the informativeness of earnings through increased earnings
response coefficient magnitude. Hypothesis H1, in alternative form, is stated as follows:
H1: Ceteris paribus, earnings response coefficients are higher for firms with greater financial
statement comparability.
RESEARCH DESIGN
Previous literature establishes financial statement comparability from inputs such as similar
accounting methods and related policy choices (e.g., DeFond and Hung [2003]; Bradshaw and Miller
[2008]). Additional comparability proxies are based on correlations in cross-sectional levels of
contemporaneous measures, designed to estimate variation across countries (e.g., Joos and Lang [1994];
Land and Lang [2002]; Brochet et al. [2013]). Further studies focus on financial statement output
covariation across time (e.g., De Franco et al. [2011]; Barth et al. [2012]; Francis et al. [2014]), argued to
hold advantages over input based methods.13 To test the hypothesis, I build upon this research and utilize
three measures of financial statement comparability based on variation in firm accounting systems,
earnings covariation over time, and differences in discretionary accruals.
Accounting System Variation
The first financial statement comparability measure follows De Franco et al. [2011], where the
accounting system is defined as a mapping from economic events to financial statements. The following
equation represents this mapping:
Financial Statementsi = fi(Economic Eventsi) (1)
where fi() represents firm i's accounting system and similar mappings indicate that two firms have
comparable accounting systems. Equation (1) declares that a firm’s financial statements are a function of
economic events and the accounting for these events. De Franco et al. [2011] conceptually define
financial statement comparability as two firms having comparable accounting systems if the systems
deliver similar financial statements for an analogous set of economic events.
To apply this conceptual definition of financial statement comparability, I follow De Franco et al.
[2011] to develop an understandable empirical model of the firm’s accounting system, using earnings as a
proxy for financial statements and stock return as a proxy for the net effect of economic events on the
financial statements.14 I estimate the following equation for each firm-year, using the 16 previous quarters
of data:
IBQit = β0i + β1iRETit + uit (2)
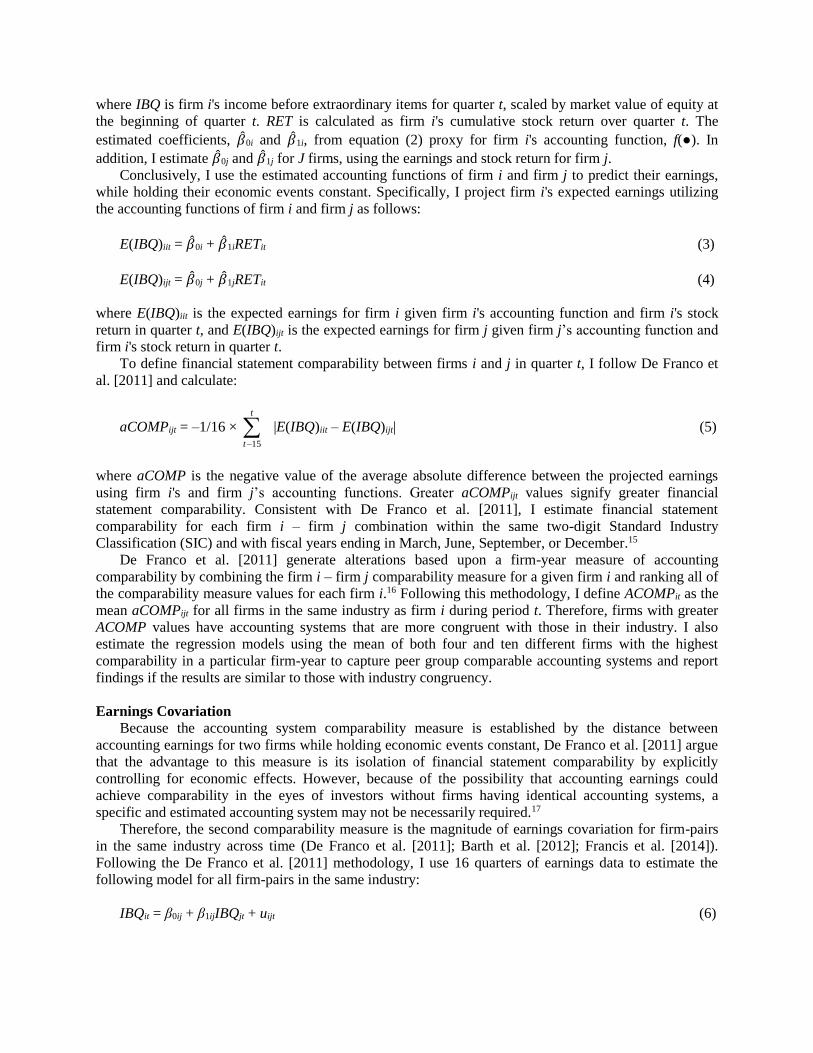
where IBQ is firm i's income before extraordinary items for quarter t, scaled by market value of equity at
the beginning of quarter t. RET is calculated as firm i's cumulative stock return over quarter t. The
estimated coefficients, �̂�0i and �̂�1i, from equation (2) proxy for firm i's accounting function, f(●). In
addition, I estimate �̂�0j and �̂�1j for J firms, using the earnings and stock return for firm j.
Conclusively, I use the estimated accounting functions of firm i and firm j to predict their earnings,
while holding their economic events constant. Specifically, I project firm i's expected earnings utilizing
the accounting functions of firm i and firm j as follows:
E(IBQ)iit = �̂�0i + �̂�1iRETit (3)
E(IBQ)ijt = �̂�0j + �̂�1jRETit (4)
where E(IBQ)iit is the expected earnings for firm i given firm i's accounting function and firm i's stock
return in quarter t, and E(IBQ)ijt is the expected earnings for firm j given firm j’s accounting function and
firm i's stock return in quarter t.
To define financial statement comparability between firms i and j in quarter t, I follow De Franco et
al. [2011] and calculate:
aCOMPijt = –1/16 ×
t
t 15
|E(IBQ)iit – E(IBQ)ijt| (5)
where aCOMP is the negative value of the average absolute difference between the projected earnings
using firm i's and firm j’s accounting functions. Greater aCOMPijt values signify greater financial
statement comparability. Consistent with De Franco et al. [2011], I estimate financial statement
comparability for each firm i – firm j combination within the same two-digit Standard Industry
Classification (SIC) and with fiscal years ending in March, June, September, or December.15
De Franco et al. [2011] generate alterations based upon a firm-year measure of accounting
comparability by combining the firm i – firm j comparability measure for a given firm i and ranking all of
the comparability measure values for each firm i.16 Following this methodology, I define ACOMPit as the
mean aCOMPijt for all firms in the same industry as firm i during period t. Therefore, firms with greater
ACOMP values have accounting systems that are more congruent with those in their industry. I also
estimate the regression models using the mean of both four and ten different firms with the highest
comparability in a particular firm-year to capture peer group comparable accounting systems and report
findings if the results are similar to those with industry congruency.
Earnings Covariation
Because the accounting system comparability measure is established by the distance between
accounting earnings for two firms while holding economic events constant, De Franco et al. [2011] argue
that the advantage to this measure is its isolation of financial statement comparability by explicitly
controlling for economic effects. However, because of the possibility that accounting earnings could
achieve comparability in the eyes of investors without firms having identical accounting systems, a
specific and estimated accounting system may not be necessarily required.17
Therefore, the second comparability measure is the magnitude of earnings covariation for firm-pairs
in the same industry across time (De Franco et al. [2011]; Barth et al. [2012]; Francis et al. [2014]).
Following the De Franco et al. [2011] methodology, I use 16 quarters of earnings data to estimate the
following model for all firm-pairs in the same industry:
IBQit = β0ij + β1ijIBQjt + uijt (6)
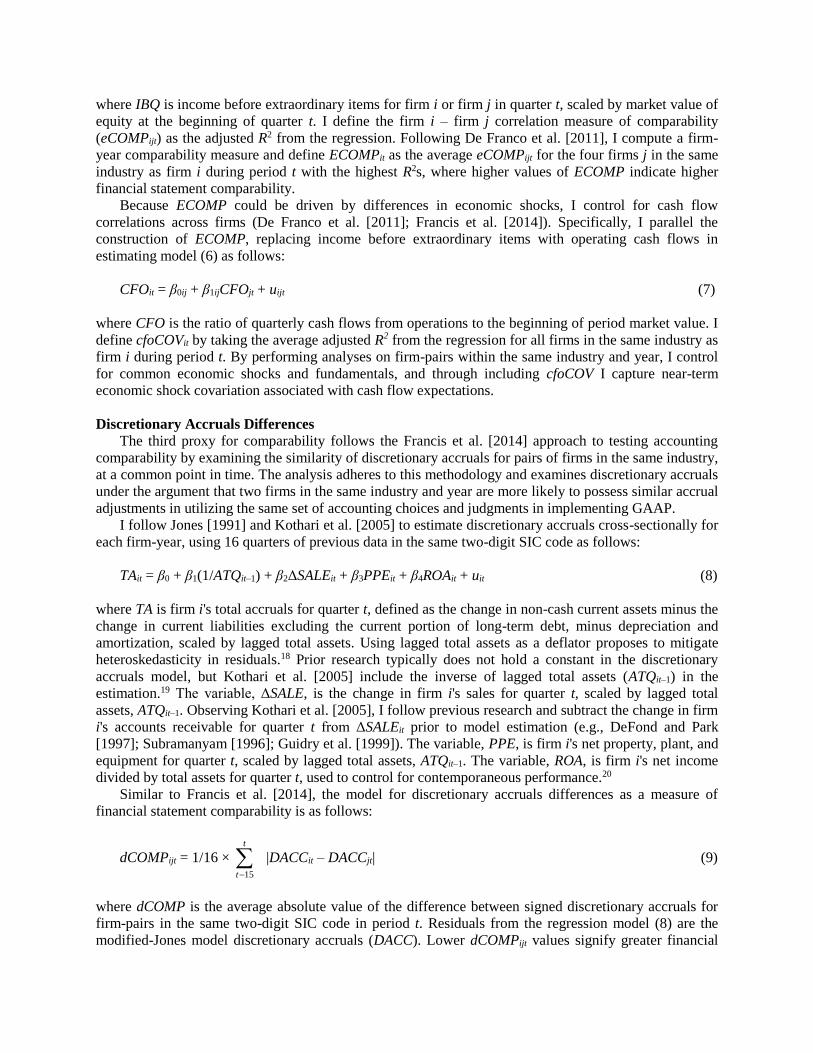
where IBQ is income before extraordinary items for firm i or firm j in quarter t, scaled by market value of
equity at the beginning of quarter t. I define the firm i – firm j correlation measure of comparability
(eCOMPijt) as the adjusted R2 from the regression. Following De Franco et al. [2011], I compute a firm-
year comparability measure and define ECOMPit as the average eCOMPijt for the four firms j in the same
industry as firm i during period t with the highest R2s, where higher values of ECOMP indicate higher
financial statement comparability.
Because ECOMP could be driven by differences in economic shocks, I control for cash flow
correlations across firms (De Franco et al. [2011]; Francis et al. [2014]). Specifically, I parallel the
construction of ECOMP, replacing income before extraordinary items with operating cash flows in
estimating model (6) as follows:
CFOit = β0ij + β1ijCFOjt + uijt (7)
where CFO is the ratio of quarterly cash flows from operations to the beginning of period market value. I
define cfoCOVit by taking the average adjusted R2 from the regression for all firms in the same industry as
firm i during period t. By performing analyses on firm-pairs within the same industry and year, I control
for common economic shocks and fundamentals, and through including cfoCOV I capture near-term
economic shock covariation associated with cash flow expectations.
Discretionary Accruals Differences
The third proxy for comparability follows the Francis et al. [2014] approach to testing accounting
comparability by examining the similarity of discretionary accruals for pairs of firms in the same industry,
at a common point in time. The analysis adheres to this methodology and examines discretionary accruals
under the argument that two firms in the same industry and year are more likely to possess similar accrual
adjustments in utilizing the same set of accounting choices and judgments in implementing GAAP.
I follow Jones [1991] and Kothari et al. [2005] to estimate discretionary accruals cross-sectionally for
each firm-year, using 16 quarters of previous data in the same two-digit SIC code as follows:
TAit = β0 + β1(1/ATQit–1) + β2ΔSALEit + β3PPEit + β4ROAit + uit (8)
where TA is firm i's total accruals for quarter t, defined as the change in non-cash current assets minus the
change in current liabilities excluding the current portion of long-term debt, minus depreciation and
amortization, scaled by lagged total assets. Using lagged total assets as a deflator proposes to mitigate
heteroskedasticity in residuals.18 Prior research typically does not hold a constant in the discretionary
accruals model, but Kothari et al. [2005] include the inverse of lagged total assets (ATQit–1) in the
estimation.19 The variable, ΔSALE, is the change in firm i's sales for quarter t, scaled by lagged total
assets, ATQit–1. Observing Kothari et al. [2005], I follow previous research and subtract the change in firm
i's accounts receivable for quarter t from ΔSALEit prior to model estimation (e.g., DeFond and Park
[1997]; Subramanyam [1996]; Guidry et al. [1999]). The variable, PPE, is firm i's net property, plant, and
equipment for quarter t, scaled by lagged total assets, ATQit–1. The variable, ROA, is firm i's net income
divided by total assets for quarter t, used to control for contemporaneous performance.20
Similar to Francis et al. [2014], the model for discretionary accruals differences as a measure of
financial statement comparability is as follows:
dCOMPijt = 1/16 ×
t
t 15
|DACCit – DACCjt| (9)
where dCOMP is the average absolute value of the difference between signed discretionary accruals for
firm-pairs in the same two-digit SIC code in period t. Residuals from the regression model (8) are the
modified-Jones model discretionary accruals (DACC). Lower dCOMPijt values signify greater financial
statement comparability. I estimate the Francis et al. [2014] financial statement comparability metric for
each firm i – firm j pairwise combination within the same industry and fiscal year. Similar to Francis et al.
[2014], I define DCOMPit as the average dCOMPijt for all firms in the same industry as firm i and period
t, where lower values of DCOMP indicate firms with accounting systems that are more consistent with
those in their industry.
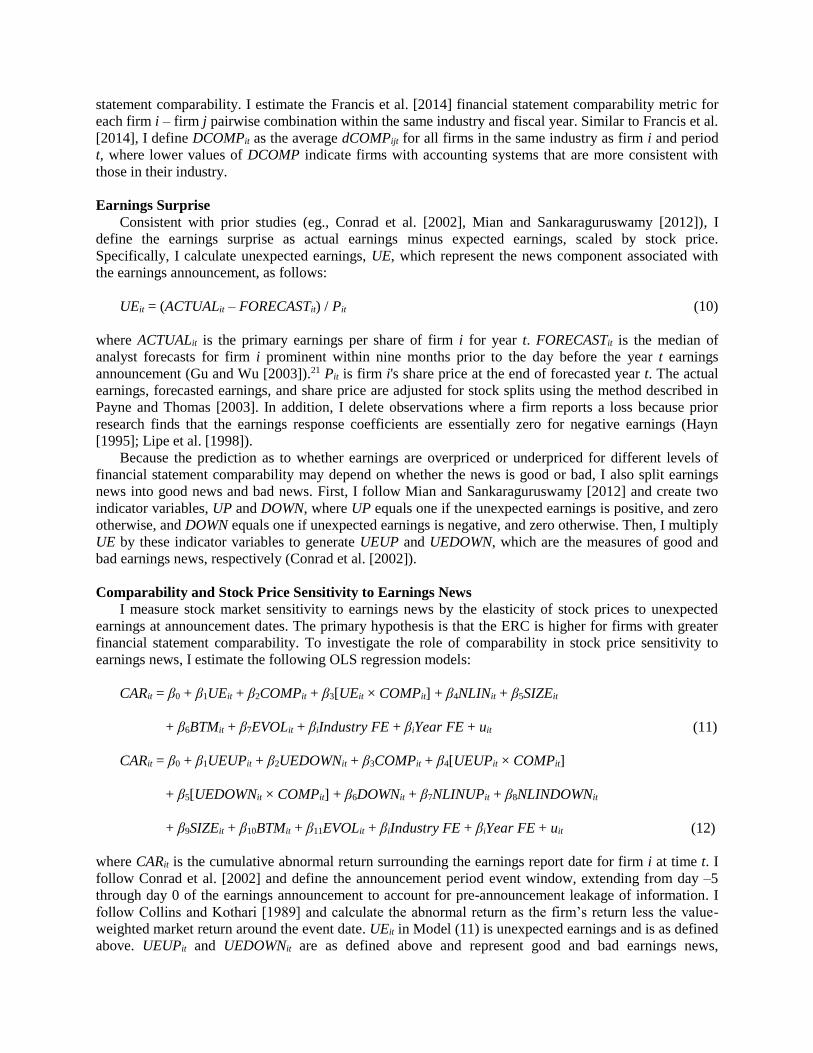
Earnings Surprise
Consistent with prior studies (eg., Conrad et al. [2002], Mian and Sankaraguruswamy [2012]), I
define the earnings surprise as actual earnings minus expected earnings, scaled by stock price.
Specifically, I calculate unexpected earnings, UE, which represent the news component associated with
the earnings announcement, as follows:
UEit = (ACTUALit – FORECASTit) / Pit (10)
where ACTUALit is the primary earnings per share of firm i for year t. FORECASTit is the median of
analyst forecasts for firm i prominent within nine months prior to the day before the year t earnings
announcement (Gu and Wu [2003]).21 Pit is firm i's share price at the end of forecasted year t. The actual
earnings, forecasted earnings, and share price are adjusted for stock splits using the method described in
Payne and Thomas [2003]. In addition, I delete observations where a firm reports a loss because prior
research finds that the earnings response coefficients are essentially zero for negative earnings (Hayn
[1995]; Lipe et al. [1998]).
Because the prediction as to whether earnings are overpriced or underpriced for different levels of
financial statement comparability may depend on whether the news is good or bad, I also split earnings
news into good news and bad news. First, I follow Mian and Sankaraguruswamy [2012] and create two
indicator variables, UP and DOWN, where UP equals one if the unexpected earnings is positive, and zero
otherwise, and DOWN equals one if unexpected earnings is negative, and zero otherwise. Then, I multiply
UE by these indicator variables to generate UEUP and UEDOWN, which are the measures of good and
bad earnings news, respectively (Conrad et al. [2002]).
Comparability and Stock Price Sensitivity to Earnings News
I measure stock market sensitivity to earnings news by the elasticity of stock prices to unexpected
earnings at announcement dates. The primary hypothesis is that the ERC is higher for firms with greater
financial statement comparability. To investigate the role of comparability in stock price sensitivity to
earnings news, I estimate the following OLS regression models:
CARit = β0 + β1UEit + β2COMPit + β3[UEit × COMPit] + β4NLINit + β5SIZEit
+ β6BTMit + β7EVOLit + βiIndustry FE + βiYear FE + uit (11)
CARit = β0 + β1UEUPit + β2UEDOWNit + β3COMPit + β4[UEUPit × COMPit]
+ β5[UEDOWNit × COMPit] + β6DOWNit + β7NLINUPit + β8NLINDOWNit
+ β9SIZEit + β10BTMit + β11EVOLit + βiIndustry FE + βiYear FE + uit (12)
where CARit is the cumulative abnormal return surrounding the earnings report date for firm i at time t. I
follow Conrad et al. [2002] and define the announcement period event window, extending from day –5
through day 0 of the earnings announcement to account for pre-announcement leakage of information. I
follow Collins and Kothari [1989] and calculate the abnormal return as the firm’s return less the value-
weighted market return around the event date. UEit in Model (11) is unexpected earnings and is as defined
above. UEUPit and UEDOWNit are as defined above and represent good and bad earnings news,
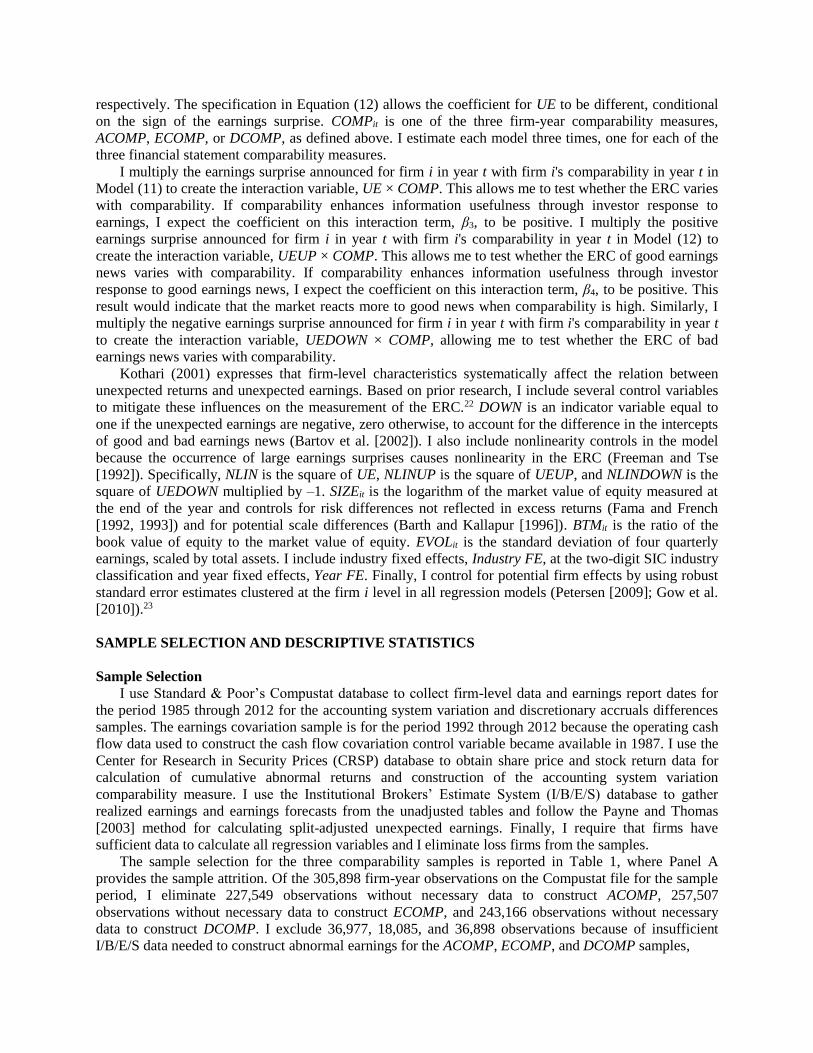
respectively. The specification in Equation (12) allows the coefficient for UE to be different, conditional
on the sign of the earnings surprise. COMPit is one of the three firm-year comparability measures,
ACOMP, ECOMP, or DCOMP, as defined above. I estimate each model three times, one for each of the
three financial statement comparability measures.
I multiply the earnings surprise announced for firm i in year t with firm i's comparability in year t in
Model (11) to create the interaction variable, UE × COMP. This allows me to test whether the ERC varies
with comparability. If comparability enhances information usefulness through investor response to
earnings, I expect the coefficient on this interaction term, β3, to be positive. I multiply the positive
earnings surprise announced for firm i in year t with firm i's comparability in year t in Model (12) to
create the interaction variable, UEUP × COMP. This allows me to test whether the ERC of good earnings
news varies with comparability. If comparability enhances information usefulness through investor
response to good earnings news, I expect the coefficient on this interaction term, β4, to be positive. This
result would indicate that the market reacts more to good news when comparability is high. Similarly, I
multiply the negative earnings surprise announced for firm i in year t with firm i's comparability in year t
to create the interaction variable, UEDOWN × COMP, allowing me to test whether the ERC of bad
earnings news varies with comparability.
Kothari (2001) expresses that firm-level characteristics systematically affect the relation between
unexpected returns and unexpected earnings. Based on prior research, I include several control variables
to mitigate these influences on the measurement of the ERC.22 DOWN is an indicator variable equal to
one if the unexpected earnings are negative, zero otherwise, to account for the difference in the intercepts
of good and bad earnings news (Bartov et al. [2002]). I also include nonlinearity controls in the model
because the occurrence of large earnings surprises causes nonlinearity in the ERC (Freeman and Tse
[1992]). Specifically, NLIN is the square of UE, NLINUP is the square of UEUP, and NLINDOWN is the
square of UEDOWN multiplied by –1. SIZEit is the logarithm of the market value of equity measured at
the end of the year and controls for risk differences not reflected in excess returns (Fama and French
[1992, 1993]) and for potential scale differences (Barth and Kallapur [1996]). BTMit is the ratio of the
book value of equity to the market value of equity. EVOLit is the standard deviation of four quarterly
earnings, scaled by total assets. I include industry fixed effects, Industry FE, at the two-digit SIC industry
classification and year fixed effects, Year FE. Finally, I control for potential firm effects by using robust
standard error estimates clustered at the firm i level in all regression models (Petersen [2009]; Gow et al.
[2010]).23
SAMPLE SELECTION AND DESCRIPTIVE STATISTICS
Sample Selection
I use Standard & Poor’s Compustat database to collect firm-level data and earnings report dates for
the period 1985 through 2012 for the accounting system variation and discretionary accruals differences
samples. The earnings covariation sample is for the period 1992 through 2012 because the operating cash
flow data used to construct the cash flow covariation control variable became available in 1987. I use the
Center for Research in Security Prices (CRSP) database to obtain share price and stock return data for
calculation of cumulative abnormal returns and construction of the accounting system variation
comparability measure. I use the Institutional Brokers’ Estimate System (I/B/E/S) database to gather
realized earnings and earnings forecasts from the unadjusted tables and follow the Payne and Thomas
[2003] method for calculating split-adjusted unexpected earnings. Finally, I require that firms have
sufficient data to calculate all regression variables and I eliminate loss firms from the samples.
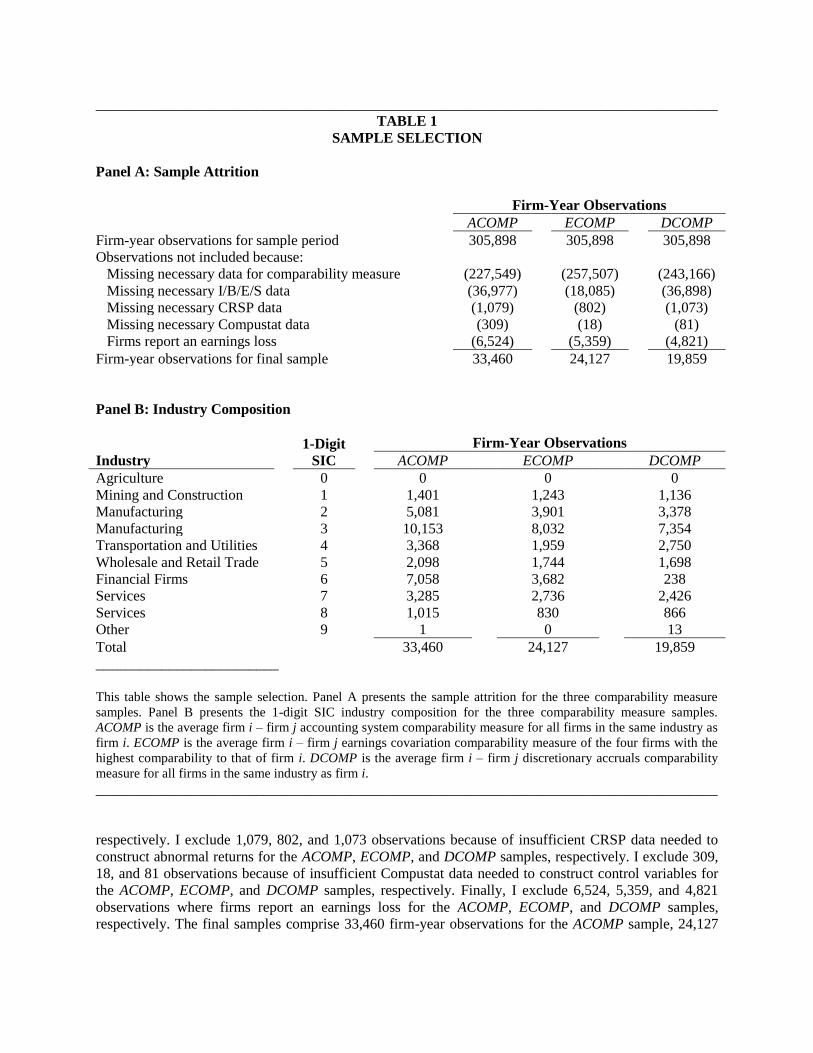
The sample selection for the three comparability samples is reported in Table 1, where Panel A
provides the sample attrition. Of the 305,898 firm-year observations on the Compustat file for the sample
period, I eliminate 227,549 observations without necessary data to construct ACOMP, 257,507
observations without necessary data to construct ECOMP, and 243,166 observations without necessary
data to construct DCOMP. I exclude 36,977, 18,085, and 36,898 observations because of insufficient
I/B/E/S data needed to construct abnormal earnings for the ACOMP, ECOMP, and DCOMP samples,
_____________________________________________________________________________________
TABLE 1
SAMPLE SELECTION
Panel A: Sample Attrition
Firm-Year Observations
ACOMP ECOMP DCOMP
Firm-year observations for sample period 305,898 305,898 305,898
Observations not included because:
Missing necessary data for comparability measure (227,549) (257,507) (243,166)
Missing necessary I/B/E/S data (36,977) (18,085) (36,898)
Missing necessary CRSP data (1,079) (802) (1,073)
Missing necessary Compustat data (309) (18) (81)
Firms report an earnings loss (6,524) (5,359) (4,821)
Firm-year observations for final sample 33,460 24,127 19,859
Panel B: Industry Composition
Industry
1-Digit
SIC
Firm-Year Observations
ACOMP ECOMP DCOMP
Agriculture 0 0 0 0
Mining and Construction 1 1,401 1,243 1,136
Manufacturing 2 5,081 3,901 3,378
Manufacturing 3 10,153 8,032 7,354
Transportation and Utilities 4 3,368 1,959 2,750
Wholesale and Retail Trade 5 2,098 1,744 1,698
Financial Firms 6 7,058 3,682 238
Services 7 3,285 2,736 2,426
Services 8 1,015 830 866
Other 9 1 0 13
Total 33,460 24,127 19,859
_________________________
This table shows the sample selection. Panel A presents the sample attrition for the three comparability measure
samples. Panel B presents the 1-digit SIC industry composition for the three comparability measure samples.
ACOMP is the average firm i – firm j accounting system comparability measure for all firms in the same industry as
firm i. ECOMP is the average firm i – firm j earnings covariation comparability measure of the four firms with the
highest comparability to that of firm i. DCOMP is the average firm i – firm j discretionary accruals comparability
measure for all firms in the same industry as firm i.
_____________________________________________________________________________________
respectively. I exclude 1,079, 802, and 1,073 observations because of insufficient CRSP data needed to
construct abnormal returns for the ACOMP, ECOMP, and DCOMP samples, respectively. I exclude 309,
18, and 81 observations because of insufficient Compustat data needed to construct control variables for
the ACOMP, ECOMP, and DCOMP samples, respectively. Finally, I exclude 6,524, 5,359, and 4,821
observations where firms report an earnings loss for the ACOMP, ECOMP, and DCOMP samples,
respectively. The final samples comprise 33,460 firm-year observations for the ACOMP sample, 24,127
firm-year observations for the ECOMP sample, and 19,859 firm-year observations for the DCOMP
sample.
Panel B in Table 1 reports industry composition by 1-digit SIC code for the three comparability
samples. For the ACOMP sample, the largest concentrations are in manufacturing (45.53 percent),
financial (21.09 percent), and services (12.85 percent) industries. For the ECOMP sample, the largest
concentrations are in manufacturing (49.46 percent), financial (15.26 percent), and services (14.78
percent) industries. For the DCOMP sample, the largest concentrations are in manufacturing (54.04
percent), services (16.58 percent), and transportation and utilities (13.85 percent) industries. Overall, a
wide variety of industries is represented in all three comparability samples.
Descriptive Statistics
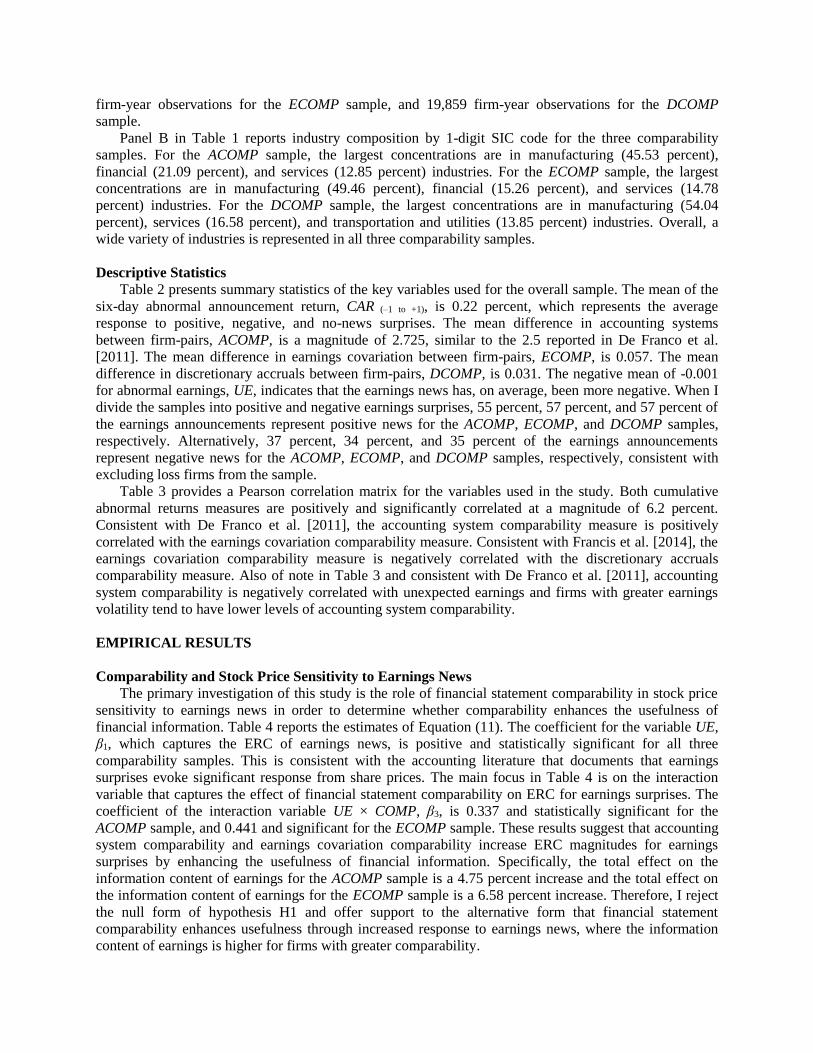
Table 2 presents summary statistics of the key variables used for the overall sample. The mean of the
six-day abnormal announcement return, CAR (–1 to +1), is 0.22 percent, which represents the average
response to positive, negative, and no-news surprises. The mean difference in accounting systems
between firm-pairs, ACOMP, is a magnitude of 2.725, similar to the 2.5 reported in De Franco et al.
[2011]. The mean difference in earnings covariation between firm-pairs, ECOMP, is 0.057. The mean
difference in discretionary accruals between firm-pairs, DCOMP, is 0.031. The negative mean of -0.001
for abnormal earnings, UE, indicates that the earnings news has, on average, been more negative. When I
divide the samples into positive and negative earnings surprises, 55 percent, 57 percent, and 57 percent of
the earnings announcements represent positive news for the ACOMP, ECOMP, and DCOMP samples,
respectively. Alternatively, 37 percent, 34 percent, and 35 percent of the earnings announcements
represent negative news for the ACOMP, ECOMP, and DCOMP samples, respectively, consistent with
excluding loss firms from the sample.
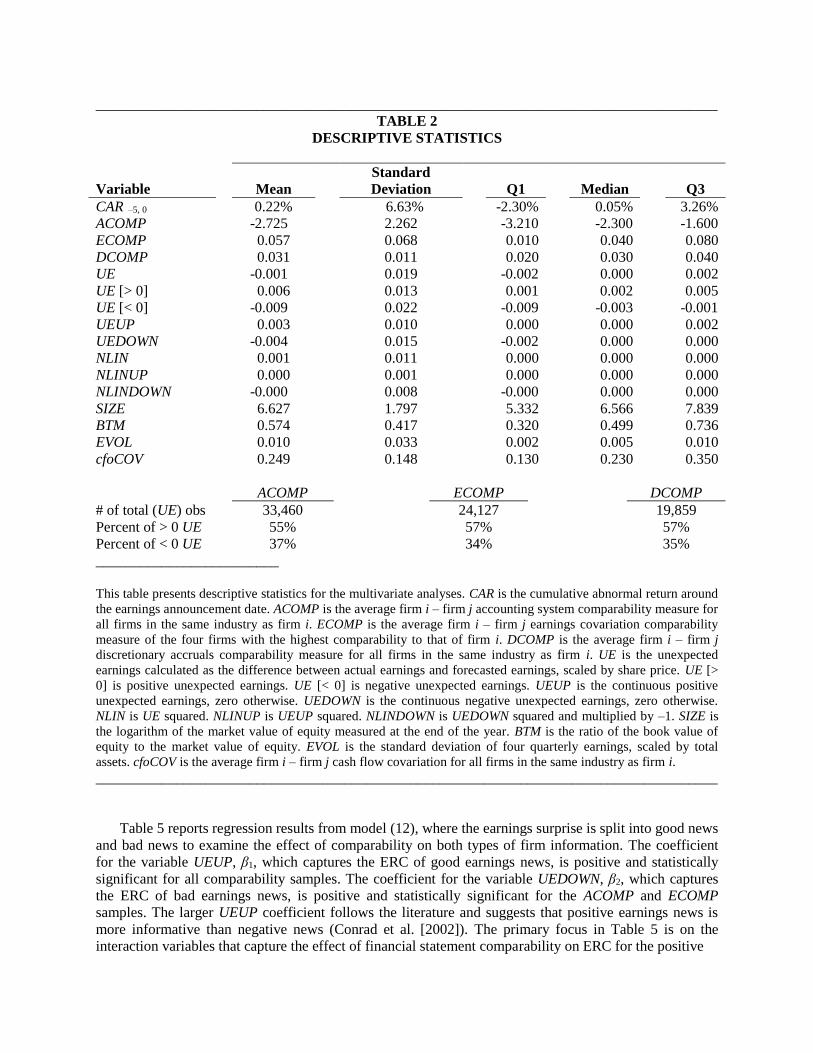
Table 3 provides a Pearson correlation matrix for the variables used in the study. Both cumulative
abnormal returns measures are positively and significantly correlated at a magnitude of 6.2 percent.
Consistent with De Franco et al. [2011], the accounting system comparability measure is positively
correlated with the earnings covariation comparability measure. Consistent with Francis et al. [2014], the
earnings covariation comparability measure is negatively correlated with the discretionary accruals
comparability measure. Also of note in Table 3 and consistent with De Franco et al. [2011], accounting
system comparability is negatively correlated with unexpected earnings and firms with greater earnings
volatility tend to have lower levels of accounting system comparability.
EMPIRICAL RESULTS
Comparability and Stock Price Sensitivity to Earnings News
The primary investigation of this study is the role of financial statement comparability in stock price
sensitivity to earnings news in order to determine whether comparability enhances the usefulness of
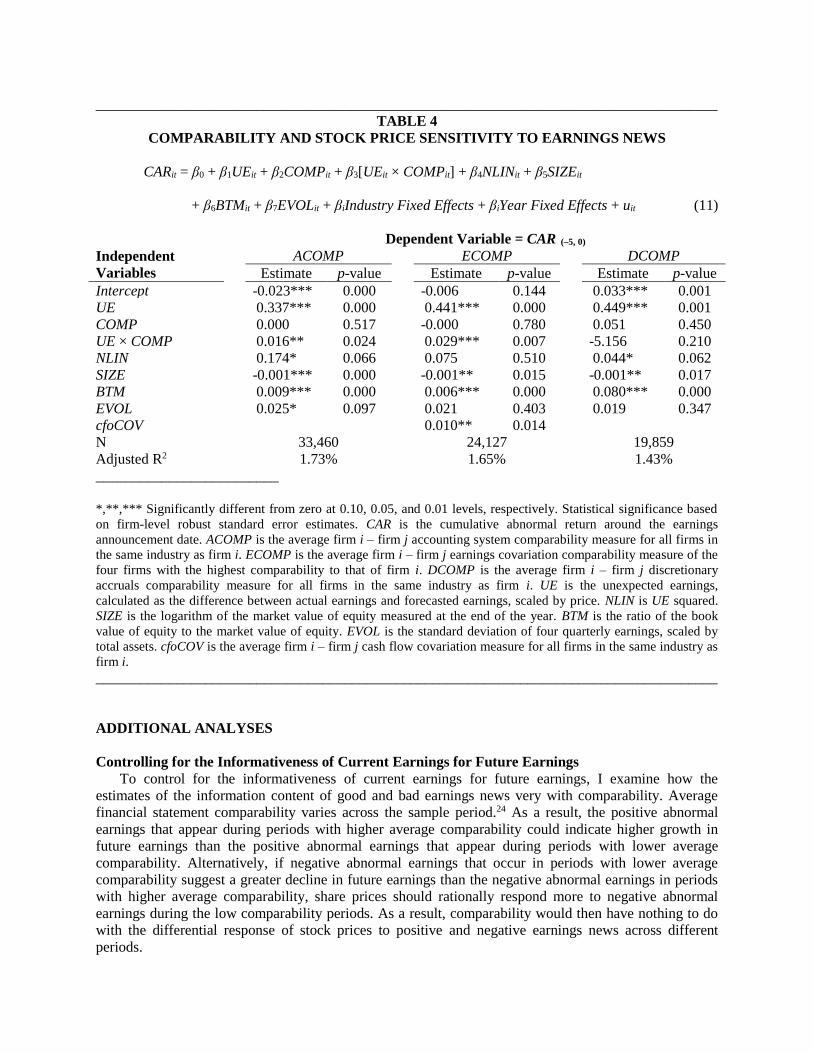
financial information. Table 4 reports the estimates of Equation (11). The coefficient for the variable UE,
β1, which captures the ERC of earnings news, is positive and statistically significant for all three
comparability samples. This is consistent with the accounting literature that documents that earnings
surprises evoke significant response from share prices. The main focus in Table 4 is on the interaction
variable that captures the effect of financial statement comparability on ERC for earnings surprises. The
coefficient of the interaction variable UE × COMP, β3, is 0.337 and statistically significant for the
ACOMP sample, and 0.441 and significant for the ECOMP sample. These results suggest that accounting
system comparability and earnings covariation comparability increase ERC magnitudes for earnings
surprises by enhancing the usefulness of financial information. Specifically, the total effect on the
information content of earnings for the ACOMP sample is a 4.75 percent increase and the total effect on
the information content of earnings for the ECOMP sample is a 6.58 percent increase. Therefore, I reject
the null form of hypothesis H1 and offer support to the alternative form that financial statement
comparability enhances usefulness through increased response to earnings news, where the information
content of earnings is higher for firms with greater comparability.
_____________________________________________________________________________________
TABLE 2
DESCRIPTIVE STATISTICS
Variable
Mean
Standard
Deviation
Q1
Median
Q3
CAR –5, 0 0.22% 6.63% -2.30% 0.05% 3.26%
ACOMP -2.725 2.262 -3.210 -2.300 -1.600
ECOMP 0.057 0.068 0.010 0.040 0.080
DCOMP 0.031 0.011 0.020 0.030 0.040
UE -0.001 0.019 -0.002 0.000 0.002
UE [> 0] 0.006 0.013 0.001 0.002 0.005
UE [< 0] -0.009 0.022 -0.009 -0.003 -0.001
UEUP 0.003 0.010 0.000 0.000 0.002
UEDOWN -0.004 0.015 -0.002 0.000 0.000
NLIN 0.001 0.011 0.000 0.000 0.000
NLINUP 0.000 0.001 0.000 0.000 0.000
NLINDOWN -0.000 0.008 -0.000 0.000 0.000
SIZE 6.627 1.797 5.332 6.566 7.839
BTM 0.574 0.417 0.320 0.499 0.736
EVOL 0.010 0.033 0.002 0.005 0.010
cfoCOV 0.249 0.148 0.130 0.230 0.350
ACOMP ECOMP DCOMP
# of total (UE) obs 33,460 24,127 19,859
Percent of > 0 UE 55% 57% 57%
Percent of < 0 UE 37% 34% 35%
_________________________
This table presents descriptive statistics for the multivariate analyses. CAR is the cumulative abnormal return around
the earnings announcement date. ACOMP is the average firm i – firm j accounting system comparability measure for
all firms in the same industry as firm i. ECOMP is the average firm i – firm j earnings covariation comparability
measure of the four firms with the highest comparability to that of firm i. DCOMP is the average firm i – firm j
discretionary accruals comparability measure for all firms in the same industry as firm i. UE is the unexpected
earnings calculated as the difference between actual earnings and forecasted earnings, scaled by share price. UE [>
0] is positive unexpected earnings. UE [< 0] is negative unexpected earnings. UEUP is the continuous positive
unexpected earnings, zero otherwise. UEDOWN is the continuous negative unexpected earnings, zero otherwise.
NLIN is UE squared. NLINUP is UEUP squared. NLINDOWN is UEDOWN squared and multiplied by –1. SIZE is
the logarithm of the market value of equity measured at the end of the year. BTM is the ratio of the book value of
equity to the market value of equity. EVOL is the standard deviation of four quarterly earnings, scaled by total
assets. cfoCOV is the average firm i – firm j cash flow covariation for all firms in the same industry as firm i.
_____________________________________________________________________________________
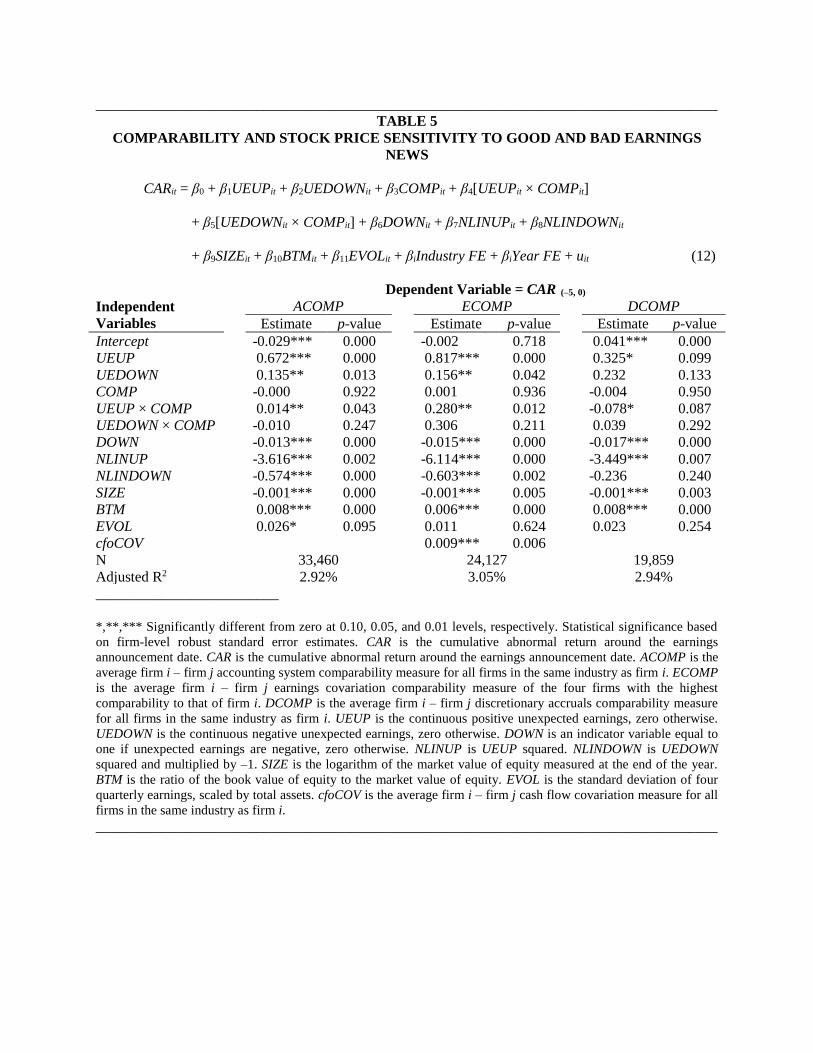
Table 5 reports regression results from model (12), where the earnings surprise is split into good news
and bad news to examine the effect of comparability on both types of firm information. The coefficient
for the variable UEUP, β1, which captures the ERC of good earnings news, is positive and statistically
significant for all comparability samples. The coefficient for the variable UEDOWN, β2, which captures
the ERC of bad earnings news, is positive and statistically significant for the ACOMP and ECOMP
samples. The larger UEUP coefficient follows the literature and suggests that positive earnings news is
more informative than negative news (Conrad et al. [2002]). The primary focus in Table 5 is on the
interaction variables that capture the effect of financial statement comparability on ERC for the positive
_____________________________________________________________________________________
TABLE 3
PEARSON CORRELATION MATRIX
(II) (III) (IV) (V) (VI) (VII) (VIII) (IX) (X) (XI) (XII) (XIII)
CAR –5, 0 (I) 0.001 -0.010 0.020 0.069 0.083 0.029 0.020 0.033 -0.009 -0.048 0.046 0.016
ACOMP (II) 0.024 -0.126 -0.019 -0.104 0.049 -0.045 -0.070 0.039 -0.054 -0.025 -0.116
ECOMP (III) -0.186 -0.003 0.024 -0.021 0.031 0.041 -0.005 0.046 0.082 0.017
DCOMP (IV) -0.017 0.060 -0.067 0.017 0.034 -0.032 -0.259 -0.060 0.134
UE (V) 0.613 0.835 -0.129 0.477 0.589 0.036 -0.030 0.015
UEUP (VI) 0.076 0.330 0.829 0.014 -0.155 0.191 0.086
UEDOWN (VII) -0.392 0.024 0.734 0.154 -0.171 -0.041
NLIN (VIII) 0.496 -0.532 -0.053 0.063 0.061
NLINUP (IX) 0.004 -0.076 0.120 0.067
NLINDOWN (X) 0.043 -0.049 -0.015
SIZE (XI) -0.353 -0.049
BTM (XII) -0.030
EVOL (XIII)
_________________________
This table reports Pearson correlations for the variables used in the multivariate analyses. Bold font indicates
significance at a p-value < 0.05. CAR is the cumulative abnormal return around the earnings announcement date.
ACOMP is the average firm i – firm j accounting system comparability measure for all firms in the same industry as
firm i. ECOMP is the average firm i – firm j earnings covariation comparability measure of the four firms with the
highest comparability to that of firm i. DCOMP is the average firm i – firm j discretionary accruals comparability
measure for all firms in the same industry as firm i. UE is the unexpected earnings calculated as the difference
between actual earnings and forecasted earnings, scaled by share price. UEUP is the continuous positive unexpected
earnings, zero otherwise. UEDOWN is the continuous negative unexpected earnings, zero otherwise. NLIN is UE
squared. NLINUP is UEUP squared. NLINDOWN is UEDOWN squared and multiplied by –1. SIZE is the logarithm
of the market value of equity measured at the end of the year. BTM is the ratio of the book value of equity to the
market value of equity. EVOL is the standard deviation of four quarterly earnings, scaled by total assets.
_____________________________________________________________________________________
and negative earnings surprises. The coefficient of the interaction variable UEUP × COMP, β4, is 0.014
and statistically significant for the ACOMP sample, 0.280 and statistically significant for the ECOMP
sample, and -0.078 and statistically significant for the DCOMP sample. The coefficient of the interaction
variable UEDOWN × COMP, β5, is not statistically different from zero for all three comparability
measures. The results suggest that accounting system comparability, earnings covariation comparability,
and discretionary accruals comparability increase ERC magnitudes for positive earnings surprises by
enhancing information usefulness. Specifically, the total effect on the information content of positive
earnings is a 2.08 percent increase for the ACOMP sample, a 34.27 percent increase for the ECOMP
sample, and a 24 percent increase for the DCOMP sample. Therefore, I offer further support that financial
statement comparability enhances usefulness through increased response to positive news.
_____________________________________________________________________________________
TABLE 4
COMPARABILITY AND STOCK PRICE SENSITIVITY TO EARNINGS NEWS
CARit = β0 + β1UEit + β2COMPit + β3[UEit × COMPit] + β4NLINit + β5SIZEit
+ β6BTMit + β7EVOLit + βiIndustry Fixed Effects + βiYear Fixed Effects + uit (11)
Dependent Variable = CAR (–5, 0)
Independent
Variables
ACOMP ECOMP DCOMP
Estimate p-value Estimate p-value Estimate p-value
Intercept -0.023*** 0.000 -0.006 0.144 0.033*** 0.001
UE 0.337*** 0.000 0.441*** 0.000 0.449*** 0.001
COMP 0.000 0.517 -0.000 0.780 0.051 0.450
UE × COMP 0.016** 0.024 0.029*** 0.007 -5.156 0.210
NLIN 0.174* 0.066 0.075 0.510 0.044* 0.062
SIZE -0.001*** 0.000 -0.001** 0.015 -0.001** 0.017
BTM 0.009*** 0.000 0.006*** 0.000 0.080*** 0.000
EVOL 0.025* 0.097 0.021 0.403 0.019 0.347
cfoCOV 0.010** 0.014
N 33,460 24,127 19,859
Adjusted R2 1.73% 1.65% 1.43%
_________________________
*,**,*** Significantly different from zero at 0.10, 0.05, and 0.01 levels, respectively. Statistical significance based
on firm-level robust standard error estimates. CAR is the cumulative abnormal return around the earnings
announcement date. ACOMP is the average firm i – firm j accounting system comparability measure for all firms in
the same industry as firm i. ECOMP is the average firm i – firm j earnings covariation comparability measure of the
four firms with the highest comparability to that of firm i. DCOMP is the average firm i – firm j discretionary
accruals comparability measure for all firms in the same industry as firm i. UE is the unexpected earnings,
calculated as the difference between actual earnings and forecasted earnings, scaled by price. NLIN is UE squared.
SIZE is the logarithm of the market value of equity measured at the end of the year. BTM is the ratio of the book
value of equity to the market value of equity. EVOL is the standard deviation of four quarterly earnings, scaled by
total assets. cfoCOV is the average firm i – firm j cash flow covariation measure for all firms in the same industry as
firm i.
_____________________________________________________________________________________
ADDITIONAL ANALYSES
Controlling for the Informativeness of Current Earnings for Future Earnings
To control for the informativeness of current earnings for future earnings, I examine how the
estimates of the information content of good and bad earnings news very with comparability. Average
financial statement comparability varies across the sample period.24 As a result, the positive abnormal
earnings that appear during periods with higher average comparability could indicate higher growth in
future earnings than the positive abnormal earnings that appear during periods with lower average
comparability. Alternatively, if negative abnormal earnings that occur in periods with lower average
comparability suggest a greater decline in future earnings than the negative abnormal earnings in periods
with higher average comparability, share prices should rationally respond more to negative abnormal
earnings during the low comparability periods. As a result, comparability would then have nothing to do
with the differential response of stock prices to positive and negative earnings news across different
periods.
_____________________________________________________________________________________
TABLE 5
COMPARABILITY AND STOCK PRICE SENSITIVITY TO GOOD AND BAD EARNINGS
NEWS
CARit = β0 + β1UEUPit + β2UEDOWNit + β3COMPit + β4[UEUPit × COMPit]
+ β5[UEDOWNit × COMPit] + β6DOWNit + β7NLINUPit + β8NLINDOWNit
+ β9SIZEit + β10BTMit + β11EVOLit + βiIndustry FE + βiYear FE + uit (12)
Dependent Variable = CAR (–5, 0)
Independent
Variables
ACOMP ECOMP DCOMP
Estimate p-value Estimate p-value Estimate p-value
Intercept -0.029*** 0.000 -0.002 0.718 0.041*** 0.000
UEUP 0.672*** 0.000 0.817*** 0.000 0.325* 0.099
UEDOWN 0.135** 0.013 0.156** 0.042 0.232 0.133
COMP -0.000 0.922 0.001 0.936 -0.004 0.950
UEUP × COMP 0.014** 0.043 0.280** 0.012 -0.078* 0.087
UEDOWN × COMP -0.010 0.247 0.306 0.211 0.039 0.292
DOWN -0.013*** 0.000 -0.015*** 0.000 -0.017*** 0.000
NLINUP -3.616*** 0.002 -6.114*** 0.000 -3.449*** 0.007
NLINDOWN -0.574*** 0.000 -0.603*** 0.002 -0.236 0.240
SIZE -0.001*** 0.000 -0.001*** 0.005 -0.001*** 0.003
BTM 0.008*** 0.000 0.006*** 0.000 0.008*** 0.000
EVOL 0.026* 0.095 0.011 0.624 0.023 0.254
cfoCOV 0.009*** 0.006
N 33,460 24,127 19,859
Adjusted R2 2.92% 3.05% 2.94%
_________________________
*,**,*** Significantly different from zero at 0.10, 0.05, and 0.01 levels, respectively. Statistical significance based
on firm-level robust standard error estimates. CAR is the cumulative abnormal return around the earnings
announcement date. CAR is the cumulative abnormal return around the earnings announcement date. ACOMP is the
average firm i – firm j accounting system comparability measure for all firms in the same industry as firm i. ECOMP
is the average firm i – firm j earnings covariation comparability measure of the four firms with the highest
comparability to that of firm i. DCOMP is the average firm i – firm j discretionary accruals comparability measure
for all firms in the same industry as firm i. UEUP is the continuous positive unexpected earnings, zero otherwise.
UEDOWN is the continuous negative unexpected earnings, zero otherwise. DOWN is an indicator variable equal to
one if unexpected earnings are negative, zero otherwise. NLINUP is UEUP squared. NLINDOWN is UEDOWN
squared and multiplied by –1. SIZE is the logarithm of the market value of equity measured at the end of the year.
BTM is the ratio of the book value of equity to the market value of equity. EVOL is the standard deviation of four
quarterly earnings, scaled by total assets. cfoCOV is the average firm i – firm j cash flow covariation measure for all
firms in the same industry as firm i.
_____________________________________________________________________________________
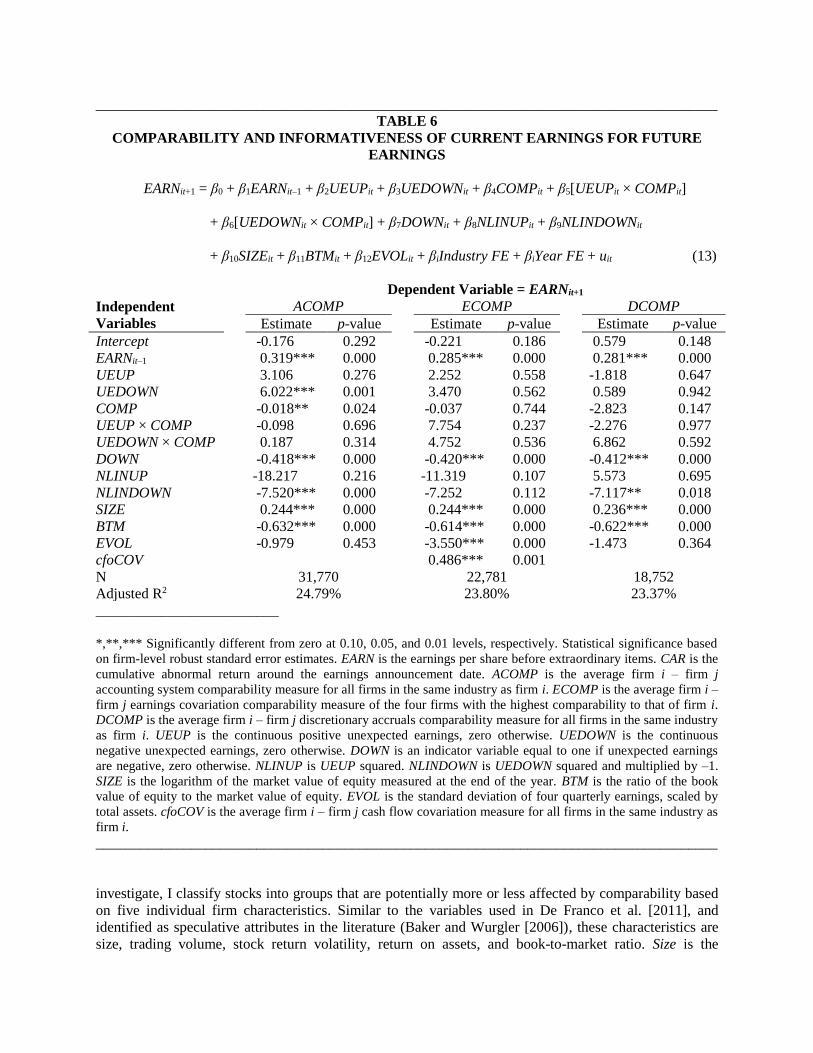
To control for potential information content of earnings surprises, I follow the Kasznik and
McNichols [2002] methodology. Specifically, to test for the informativeness of earnings news and how
the estimates of the information content of good and bad earnings surprises vary with financial statement
comparability, I estimate the following equation:
EARNit+1 = β0 + β1EARNit–1 + β2UEUPit + β3UEDOWNit + β4COMPit + β5[UEUPit × COMPit]
+ β6[UEDOWNit × COMPit] + β7DOWNit + β8NLINUPit + β9NLINDOWNit
+ β10SIZEit + β11BTMit + β12EVOLit + βiIndustry FE + βiYear FE + uit (13)
where EARNit+1 is firm i's actual earnings per share before extraordinary items for year t+1. EARNit–1 is
firm i's actual earnings per share before extraordinary items for year t–1. Following Kasznik and
McNichols [2002] and Mian and Sankaraguruswamy [2012], I use EARNit–1 in Model (13) as the proxy
for expected earnings in year t+1. UEUP, UEDOWN, COMP, DOWN, NLINUP, NLINDOWN, SIZE,
BTM, and EVOL are as previously defined.
Because the previous results suggest higher ERC for good news firms with higher comparability, the
coefficient of interest in Model (13) is the coefficient for UEUP × COMP, β5. Specifically, if good news
has higher information content for future earnings where average comparability is higher contrasted with
lower comparability, β5 should be positive. However, if β5 is insignificant then the differential information
content of news across comparability is unlikely to be an alternative explanation for the results. Table 6
reports results from the estimation of Model (13). The reported estimates of β5 are statistically
indistinguishable from zero for all three comparability samples. For earnings informativeness to account
for the main results, this coefficient should be significant rather than insignificant. The results in Table 6
suggest that the time variation in the information content of earnings cannot explain the results in Tables
4 and 5 because the information content of earnings appears unrelated to comparability.
Cross-Sectional Variation in the Role of Comparability
Financial statement comparability may have greater effects on stocks with varying firm-specific
economic characteristics. De Franco et al. [2011] use variables such as size, book-market, volume, return
on assets (ROA), and the volatility of returns to control for variation in economic characteristics in their
tests.25 As an example, De Franco et al. [2011] find evidence that skewness in ACOMP is greater for firms
that are smaller and have lower book-to-market ratios. Specifically, when two firms are in the same
extreme size quintile, De Franco et al. [2011] report that the mean ACOMP value is greater than it is for
two firms in the opposite extreme size quintiles. Similarly, De Franco et al. [2011] report that the mean
ACOMP value for two firms in the same extreme book-market quintile is greater than it is for two firms in
opposite extreme book-market quintiles. By focusing on extremes of the firm characteristics and the
effect of comparability, I am controlling for potential skewness in the distribution of comparability to
examine whether comparability remains useful.
Because financial statement comparability lowers the cost of acquiring information and increases the
overall quantity and quality of firm information (De Franco et al. [2011]), it is also possible that the effect
of comparability on the assessment of stocks is greater for speculative stocks whose expected cash flows
are more uncertain and more difficult to value. In addition, both extreme growth and distressed firms are
prone to speculation and are also difficult to arbitrage (Baker and Wurgler [2006]) and so could be more
affected by financial statement comparability, through a reduction in the propensity to speculate.
Considering that the earnings of speculative stocks are often also less persistent (Baginski et al. [1999]), it
can make the identification and valuation of the associated incremental cash flows more difficult and
more subjective, leading to a greater effect of comparability in the pricing of the earnings of such stocks.
Because firm-specific economic characteristics can potentially affect the financial statement
comparability measures, I examine whether the comparability effect on the relationship between
unexpected earnings and abnormal returns is more pronounced for these varying firm characteristics. To
_____________________________________________________________________________________
TABLE 6
COMPARABILITY AND INFORMATIVENESS OF CURRENT EARNINGS FOR FUTURE
EARNINGS
EARNit+1 = β0 + β1EARNit–1 + β2UEUPit + β3UEDOWNit + β4COMPit + β5[UEUPit × COMPit]
+ β6[UEDOWNit × COMPit] + β7DOWNit + β8NLINUPit + β9NLINDOWNit
+ β10SIZEit + β11BTMit + β12EVOLit + βiIndustry FE + βiYear FE + uit (13)
Dependent Variable = EARNit+1
Independent
Variables
ACOMP ECOMP DCOMP
Estimate p-value Estimate p-value Estimate p-value
Intercept -0.176 0.292 -0.221 0.186 0.579 0.148
EARNit–1 0.319*** 0.000 0.285*** 0.000 0.281*** 0.000
UEUP 3.106 0.276 2.252 0.558 -1.818 0.647
UEDOWN 6.022*** 0.001 3.470 0.562 0.589 0.942
COMP -0.018** 0.024 -0.037 0.744 -2.823 0.147
UEUP × COMP -0.098 0.696 7.754 0.237 -2.276 0.977
UEDOWN × COMP 0.187 0.314 4.752 0.536 6.862 0.592
DOWN -0.418*** 0.000 -0.420*** 0.000 -0.412*** 0.000
NLINUP -18.217 0.216 -11.319 0.107 5.573 0.695
NLINDOWN -7.520*** 0.000 -7.252 0.112 -7.117** 0.018
SIZE 0.244*** 0.000 0.244*** 0.000 0.236*** 0.000
BTM -0.632*** 0.000 -0.614*** 0.000 -0.622*** 0.000
EVOL -0.979 0.453 -3.550*** 0.000 -1.473 0.364
cfoCOV 0.486*** 0.001
N 31,770 22,781 18,752
Adjusted R2 24.79% 23.80% 23.37%
_________________________
*,**,*** Significantly different from zero at 0.10, 0.05, and 0.01 levels, respectively. Statistical significance based
on firm-level robust standard error estimates. EARN is the earnings per share before extraordinary items. CAR is the
cumulative abnormal return around the earnings announcement date. ACOMP is the average firm i – firm j
accounting system comparability measure for all firms in the same industry as firm i. ECOMP is the average firm i –
firm j earnings covariation comparability measure of the four firms with the highest comparability to that of firm i.
DCOMP is the average firm i – firm j discretionary accruals comparability measure for all firms in the same industry
as firm i. UEUP is the continuous positive unexpected earnings, zero otherwise. UEDOWN is the continuous
negative unexpected earnings, zero otherwise. DOWN is an indicator variable equal to one if unexpected earnings
are negative, zero otherwise. NLINUP is UEUP squared. NLINDOWN is UEDOWN squared and multiplied by –1.
SIZE is the logarithm of the market value of equity measured at the end of the year. BTM is the ratio of the book
value of equity to the market value of equity. EVOL is the standard deviation of four quarterly earnings, scaled by
total assets. cfoCOV is the average firm i – firm j cash flow covariation measure for all firms in the same industry as
firm i.
_____________________________________________________________________________________
investigate, I classify stocks into groups that are potentially more or less affected by comparability based
on five individual firm characteristics. Similar to the variables used in De Franco et al. [2011], and
identified as speculative attributes in the literature (Baker and Wurgler [2006]), these characteristics are
size, trading volume, stock return volatility, return on assets, and book-to-market ratio. Size is the
logarithm of the market value of equity. Volume is the logarithm of trading volume in millions of shares
during the year. Stock return volatility is the standard deviation of monthly returns over the preceding
twelve months. Return on assets is earnings before extraordinary items divided by total assets for the
year. Book-to-market ratio is the ratio of the book value of equity to the market value of equity.
I use each individual firm characteristic to identify one portfolio that is likely to be affected more by
comparability and a second portfolio that is likely to be affected less. I classify firms that fall in the
bottom quintile based on size as small firms and classify their counterparts in the top quintile as large
firms. I classify firms that fall in the bottom quintile based on trading volume as low volume firms and
classify their counterparts in the top quintile as high volume firms. I classify firms that fall in the bottom
quintile based on stock return volatility as stable and classify their counterparts in the top quintile as
volatile. For ROA, I classify firms that fall in the bottom quintile as low ROA and classify their
counterparts in the top quintile as high ROA. Finally, I classify firms that fall in the bottom quartile based
on book-to-market ratio as growth/value and classify their counterparts in the top quartile as staid firms.
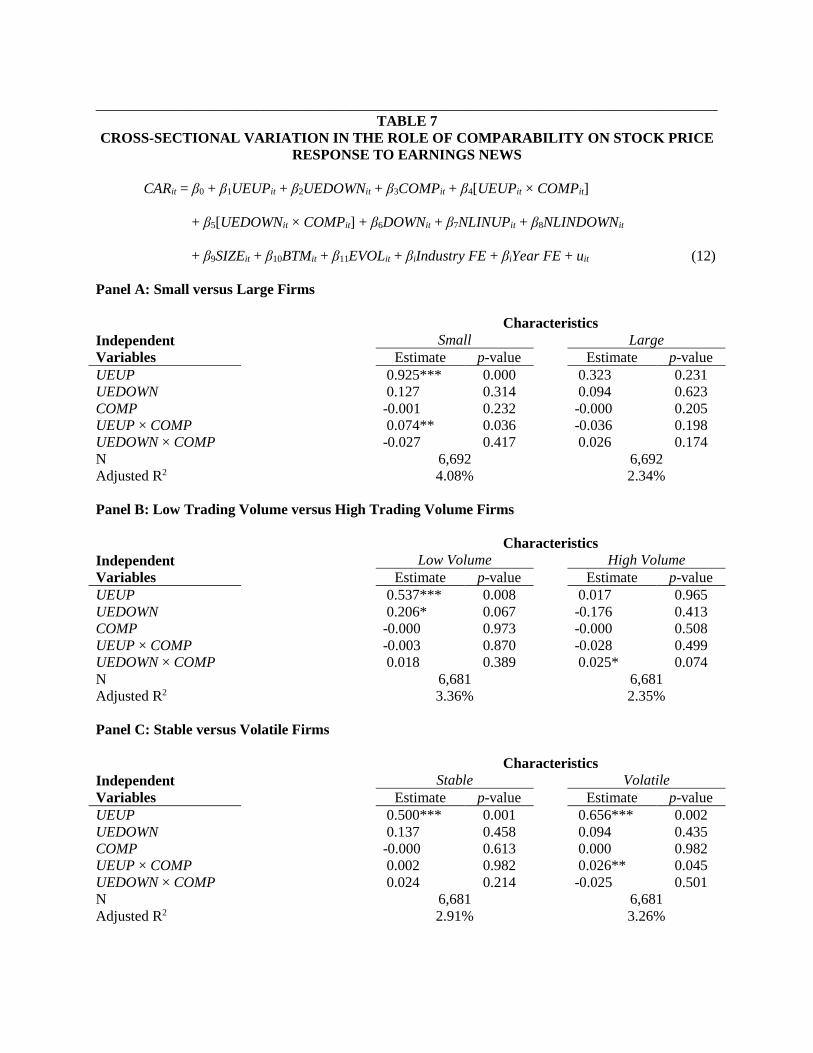
To investigate the cross-sectional differences in the role of comparability, I estimate Equation (12)
separately for the subsamples of stocks classified on the five individual firm characteristics. Results of the
cross-sectional analyses are reported in Table 7. Each panel of Table 7 reports the estimates of Equation
(12) for two sub-groups of stocks sorted on one of the firm characteristics. Specifically, Panels A through
E classify stocks based on size, trading volume, stock return volatility, return on assets, and book-to-
market, respectively. Results indicate that the ERC for good news is statistically no different from zero
with comparability for all characteristics except dividend payout. The ERC for good news firms increases
with comparability for small, volatile, low return on assets, and growth/value firms. These results indicate
that financial statement comparability exhibits greater usefulness for more speculative stocks, implying
that comparability increases informativeness for firms with cash flows that are more uncertain and
difficult to assess. Overall, the results in Table 7 provide general support for the notion that the effect of
comparability on the stock price sensitivity to news varies cross-sectionally with different firm-specific
economic characteristics.
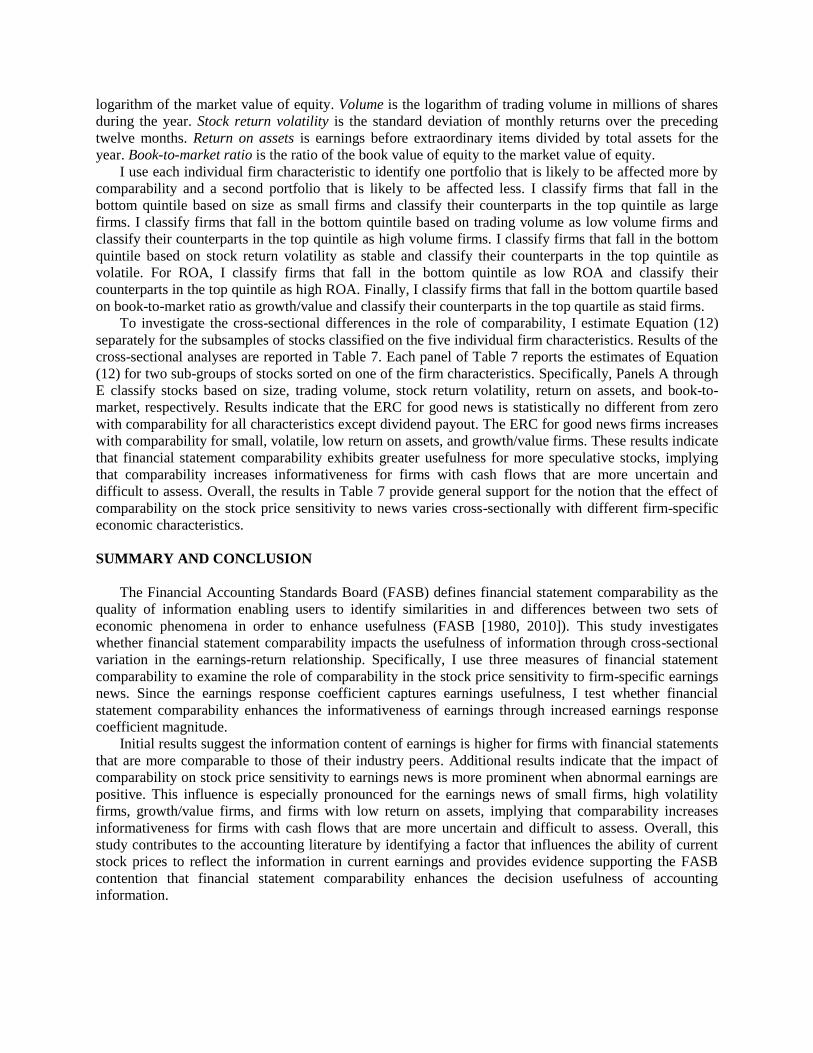
SUMMARY AND CONCLUSION
The Financial Accounting Standards Board (FASB) defines financial statement comparability as the
quality of information enabling users to identify similarities in and differences between two sets of
economic phenomena in order to enhance usefulness (FASB [1980, 2010]). This study investigates
whether financial statement comparability impacts the usefulness of information through cross-sectional
variation in the earnings-return relationship. Specifically, I use three measures of financial statement
comparability to examine the role of comparability in the stock price sensitivity to firm-specific earnings
news. Since the earnings response coefficient captures earnings usefulness, I test whether financial
statement comparability enhances the informativeness of earnings through increased earnings response
coefficient magnitude.
Initial results suggest the information content of earnings is higher for firms with financial statements
that are more comparable to those of their industry peers. Additional results indicate that the impact of
comparability on stock price sensitivity to earnings news is more prominent when abnormal earnings are
positive. This influence is especially pronounced for the earnings news of small firms, high volatility
firms, growth/value firms, and firms with low return on assets, implying that comparability increases
informativeness for firms with cash flows that are more uncertain and difficult to assess. Overall, this
study contributes to the accounting literature by identifying a factor that influences the ability of current
stock prices to reflect the information in current earnings and provides evidence supporting the FASB
contention that financial statement comparability enhances the decision usefulness of accounting
information.
_____________________________________________________________________________________
TABLE 7
CROSS-SECTIONAL VARIATION IN THE ROLE OF COMPARABILITY ON STOCK PRICE
RESPONSE TO EARNINGS NEWS
CARit = β0 + β1UEUPit + β2UEDOWNit + β3COMPit + β4[UEUPit × COMPit]
+ β5[UEDOWNit × COMPit] + β6DOWNit + β7NLINUPit + β8NLINDOWNit
+ β9SIZEit + β10BTMit + β11EVOLit + βiIndustry FE + βiYear FE + uit (12)
Panel A: Small versus Large Firms
Characteristics
Independent
Variables
Small Large
Estimate p-value Estimate p-value
UEUP 0.925*** 0.000 0.323 0.231
UEDOWN 0.127 0.314 0.094 0.623
COMP -0.001 0.232 -0.000 0.205
UEUP × COMP 0.074** 0.036 -0.036 0.198
UEDOWN × COMP -0.027 0.417 0.026 0.174
N 6,692 6,692
Adjusted R2 4.08% 2.34%
Panel B: Low Trading Volume versus High Trading Volume Firms
Characteristics
Independent
Variables
Low Volume High Volume
Estimate p-value Estimate p-value
UEUP 0.537*** 0.008 0.017 0.965
UEDOWN 0.206* 0.067 -0.176 0.413
COMP -0.000 0.973 -0.000 0.508
UEUP × COMP -0.003 0.870 -0.028 0.499
UEDOWN × COMP 0.018 0.389 0.025* 0.074
N 6,681 6,681
Adjusted R2 3.36% 2.35%
Panel C: Stable versus Volatile Firms
Characteristics
Independent
Variables
Stable Volatile
Estimate p-value Estimate p-value
UEUP 0.500*** 0.001 0.656*** 0.002
UEDOWN 0.137 0.458 0.094 0.435
COMP -0.000 0.613 0.000 0.982
UEUP × COMP 0.002 0.982 0.026** 0.045
UEDOWN × COMP 0.024 0.214 -0.025 0.501
N 6,681 6,681
Adjusted R2 2.91% 3.26%
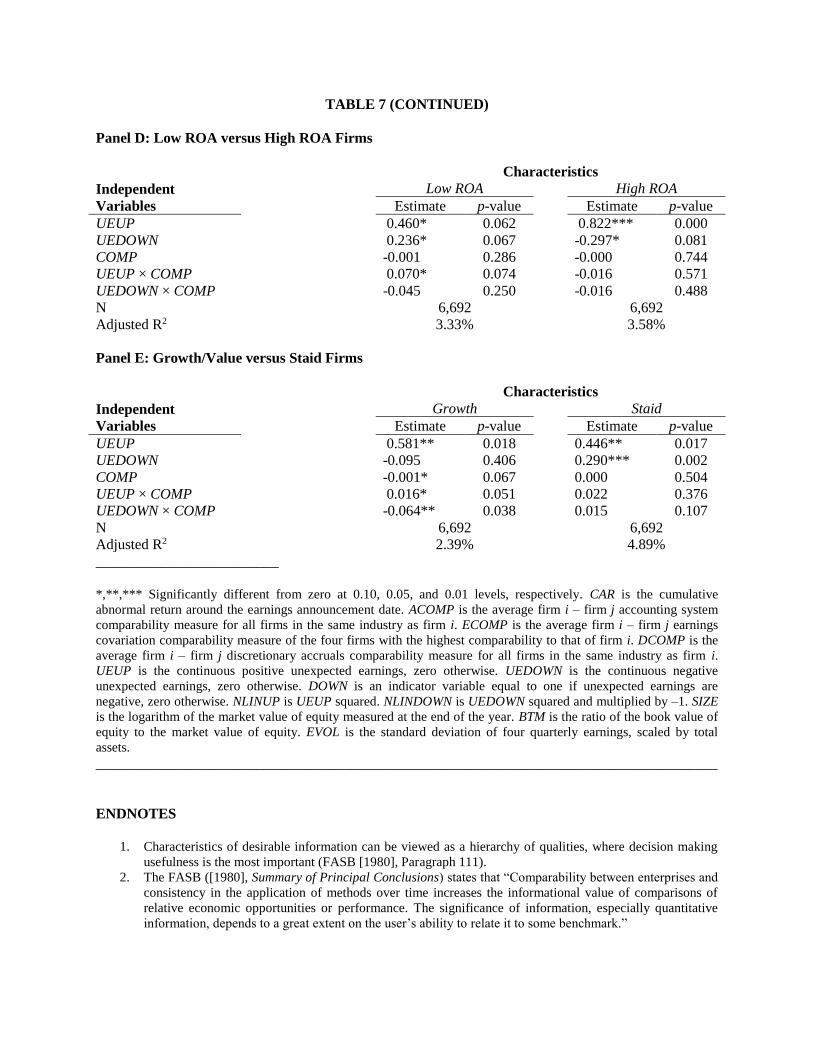
TABLE 7 (CONTINUED)
Panel D: Low ROA versus High ROA Firms
Characteristics
Independent
Variables
Low ROA High ROA
Estimate p-value Estimate p-value
UEUP 0.460* 0.062 0.822*** 0.000
UEDOWN 0.236* 0.067 -0.297* 0.081
COMP -0.001 0.286 -0.000 0.744
UEUP × COMP 0.070* 0.074 -0.016 0.571
UEDOWN × COMP -0.045 0.250 -0.016 0.488
N 6,692 6,692
Adjusted R2 3.33% 3.58%
Panel E: Growth/Value versus Staid Firms
Characteristics
Independent
Variables
Growth Staid
Estimate p-value Estimate p-value
UEUP 0.581** 0.018 0.446** 0.017
UEDOWN -0.095 0.406 0.290*** 0.002
COMP -0.001* 0.067 0.000 0.504
UEUP × COMP 0.016* 0.051 0.022 0.376
UEDOWN × COMP -0.064** 0.038 0.015 0.107
N 6,692 6,692
Adjusted R2 2.39% 4.89%
_________________________
*,**,*** Significantly different from zero at 0.10, 0.05, and 0.01 levels, respectively. CAR is the cumulative
abnormal return around the earnings announcement date. ACOMP is the average firm i – firm j accounting system
comparability measure for all firms in the same industry as firm i. ECOMP is the average firm i – firm j earnings
covariation comparability measure of the four firms with the highest comparability to that of firm i. DCOMP is the
average firm i – firm j discretionary accruals comparability measure for all firms in the same industry as firm i.
UEUP is the continuous positive unexpected earnings, zero otherwise. UEDOWN is the continuous negative
unexpected earnings, zero otherwise. DOWN is an indicator variable equal to one if unexpected earnings are
negative, zero otherwise. NLINUP is UEUP squared. NLINDOWN is UEDOWN squared and multiplied by –1. SIZE
is the logarithm of the market value of equity measured at the end of the year. BTM is the ratio of the book value of
equity to the market value of equity. EVOL is the standard deviation of four quarterly earnings, scaled by total
assets.
_____________________________________________________________________________________
ENDNOTES
1. Characteristics of desirable information can be viewed as a hierarchy of qualities, where decision making
usefulness is the most important (FASB [1980], Paragraph 111).
2. The FASB ([1980], Summary of Principal Conclusions) states that “Comparability between enterprises and
consistency in the application of methods over time increases the informational value of comparisons of
relative economic opportunities or performance. The significance of information, especially quantitative
information, depends to a great extent on the user’s ability to relate it to some benchmark.”

3. The FASB ([1978], paragraph 43) states that “The primary focus of financial reporting is information about
an enterprise’s performance provided by measures of earnings and its components. Investors, creditors, and
others who are concerned with assessing the prospects for enterprise net cash flows are especially interested
in the information. Their interest in an enterprise’s future cash flows and its ability to generate favorable
cash flows leads primarily to an interest in information about its earnings.”
4. Speculative stocks can be defined as stocks with a high degree of risk, low predictability of fundamentals,
and a high degree of volatility (Lui, Markov, and Tamayo [2007]).
5. The FASB [2010, BC3.33] states that “one of the most important reasons that financial reporting standards
are needed is to increase the comparability of reported financial information.”
6. See Holthausen and Watts [2001] and Kothari [2001] for a review of the literature.
7. Previous studies suggest that high quality disclosure helps investors to better predict firm performance
(e.g., Gelb and Zarowin [2002]; Lundholm and Myers [2002]; Orpurt and Zang [2009]; Choi et al. [2011];
Haw et al. [2012]).
8. Researchers’ use of the term “earnings quality” is usually in the context of examining whether earnings
information is useful to investors for valuation (Kothari [2001]). The general definition of earnings quality
suggests that quality could be evaluated with respect to any decision that depends on an informative
representation of financial performance and is not limited solely to the context of equity valuation decisions
(Dechow et al. [2010]).
9. See Kothari [2001] and Dechow et al. [2010] for a review of the earnings quality literature.
10. This may generate economies of scale in terms of understanding and evaluating disclosures for investors.
Mahoney [1995] and Dye and Sridhar [2008] argue that disclosure regulation can provide market-wide cost
savings and efficiency gains when the optimal disclosure level is comparable across firms.
11. Information transfer among comparable firms should be greater, where studies document the effect of one
firm’s financial statement information on the financial statements and operating decisions of other related
firms, with the net result being a set of higher-quality information for more comparable firms (e.g.,
Ramnath [2002]; Gleason et al. [2008]; Durnev and Mangen [2009]).
12. Liu and Thomas [2000] provide evidence on the ERC as a proxy for earnings quality and define quality as
overall decision usefulness for equity valuation.
13. Potential advantages include employing actual weights firms use when calculating reported earnings,
holding economic events constant while focusing on accounting system differences, and using widely
available financial statement and market return data.
14. This measure is consistent with the empirical financial accounting literature reviewed by Kothari [2001]
and Beyer et al [2010].
15. To avoid matching parent and subsidiary companies, I exclude holding firms from the Compustat sample.
In addition, American Depository Receipts (ADRs) and limited partnerships are excluded in order to focus
on corporations domiciled in the United States.
16. These permutations consist of taking the average of a decided number of firms with the highest
comparability in a particular firm-year to capture accounting systems that are more congruent to their peer
group, or taking the average or median comparability for all firms in the same industry in a particular firm-
year to capture accounting systems that are more congruent to those in their industry.
17. De Franco et al. [2011] offer an example of two firms with accounting earnings varying over time where
information about the earnings of one firm is useful in forecasting earnings of another firm.
18. White [1980] statistics for the Kothari et al. [2005] annual cross-sectional, industry models show reduced
but not eliminated heteroskedasticity.
19. Including a constant in the estimation provides an additional control for heteroskedasticity unalleviated by
using assets as a deflator (Kothari et al. [2005]) and mitigates problems potentially arising from an omitted
size (scale) variable (Brown et al. [1999]).
20. Kothari et al. [2005] calculate ROA using net income instead of net income including net-of-tax interest
expense in order to avoid possible problems associated with tax rate estimation.
21. Gu and Wu [2003] argue that if analysts’ objective is to provide the most accurate forecast by minimizing
the mean absolute forecast error, then the optimal forecast is the median instead of the mean earnings.
22. See Subramanyam (1996), Blouin et al. (2003), Wilson (2008), and others.
23. Cluster-robust standard errors are also known as Huber-White or Rogers standard errors and are a
generalization of the heteroscedasticity-robust standard errors of White [1980].
24. For example, average annual ACOMP comparability fluctuates from a high of -4.410 to a low of -1.802
throughout the sample period, a range of 2.608, where the function is non-monotonic.
25. For some tests in De Franco et al. [2011], these variables have an established relation with the dependent
comparability variables. In other tests, these variables represent natural controls, as their comparability
measures are influenced by the characteristics.
REFERENCES
Baginski, S., Lorek, K., Willinger, G. & Branson, B. (1999). The relationship between economic
characteristics and alternative annual earnings persistence measures. The Accounting Review,
74: 105–120.
Baker, M. & Wurgler, J. (2006). Investor sentiment and the cross-section of stock returns. Journal of
Finance, 61: 1645–1680.
Ball, R. & Brown, P. (1967). Some preliminary findings on the association between the earnings of a
firm, its industry, and the economy. Journal of Accounting Research, 55–80.
Ball, R. & Brown, P. (1968). An empirical evaluation of accounting income numbers. Journal of
Accounting Research, 6: 159–178.
Barth, M. & Kallapur, S. (1996). Effects of cross-sectional scale differences on regression results in
empirical accounting research. Contemporary Accounting Research, 13: 527–567.
Barth, M., Landsman, W., Lang, M. & Williams, C. (2012). Are IFRS-based and US GAAP-based
accounting amounts comparable? Journal of Accounting and Economics, 54: 68–93.
Bartov, E., Givoly, D. & Hayn, C. (2002). The rewards to meeting or beating analyst expectations.
Journal of Accounting and Economics, 33: 173–204.
Beaver, W. (1968). The information content of annual earnings announcements. Journal of Accounting
Research, 6: 67–92.
Beyer, A., Cohen, D., Lys, T. & Walther, B. (2010). The financial reporting environment: Review of the
recent literature. Journal of Accounting and Economics, 50: 296–343.
Bradshaw, M., Miller, G. & Serafeim, G. (2009). Accounting method heterogeneity and analysts’
forecasts. Working paper. University of Chicago.
Brochet, F., Jagolinzer, A. & Riedl, E. (2013). Mandatory IFRS adoption and financial statement
comparability. Contemporary Accounting Research, 30: 1373–1400.
Brown, S., Lo, K. & Lys, T. (1999). Use of R2 in accounting research: Measuring changes in value
relevance over the last four decades. Journal of Accounting and Economics, 28: 83–115.
Campbell, J. & Yeung, P. (2012). Comparability, investor sophistication, and contagion effects. Working
Paper. University of Georgia.
Chen, C., Collins, D., Kravet, T. & Mergenthaler, R. (2016). Financial statement comparability and the
efficiency of acquisition decisions. Working Paper. University of Iowa.
Choi, J., Myers, L., Zang, Y. & Ziebart, D. (2011). Do management EPS forecasts allow returns to reflect
future earnings? Implications for the continuation of management’s quarterly earnings guidance.
Review of Accounting Studies, 16: 143–182.
Choi, J., Choi, S., Myers, L. & Ziebart, D. (2017). Financial statement comparability and the
informativeness of stock prices about future earnings. Working Paper. Seoul National University.
Collins, D. & Kothari, S. P. (1989). An analysis of intertemporal and cross-sectional determinants of
earnings response coefficients. Journal of Accounting and Economics, 11: 143–181.
Collins, D., Kothari, S. P., Shanken, J. & Sloan, R. (1994). Lack of timeliness and noise as explanations
for the low contemporaneous return-earnings association. Journal of Accounting and Economics,
18: 289–324.
Conrad, J., Comell, B. & Landsman, W. (2002). When is bad news really bad news? Journal of Finance,
57: 2507–2532.
Daniel, K. & Titman, S. (1997). Evidence on the characteristics of cross-sectional variation in common
stock returns. Journal of Finance, 52: 1–33.
Daniel, K., Grinblatt, M., Titman, S. & Wermers, R. (1997). Measuring mutual fund performance with
characteristic-based benchmarks. Journal of Finance, 52: 1035–1058.
De Franco, G., Kothari, S. P. & Verdi, R. (2011). The benefits of financial statement comparability.
Journal of Accounting Research, 49: 895–931.
DeFond, M. & Park, C. (1997). Smoothing income in anticipation of future earnings. Journal of
Accounting and Economics, 23: 115–139.
DeFond, M. & Hung, M. (2003). An empirical analysis of analysts’ cash flow forecasts. Journal of
Accounting and Economics, 35: 73–100.
DeFond, M., Hu, X., Hung, M. & Li, S. (2011). The impact of mandatory IFRS adoption on foreign
mutual fund ownership: The role of comparability. The Journal of Accounting and Economics,
51: 240–258.
Durnev, A. & Mangen, C. (2009). Corporate investments: Learning from restatements. Journal of
Accounting Research, 47: 679–720.
Dye, R. & Sunder, S. (2001). Why not allow FASB and IASB standards to compete in the U.S.?
Accounting Horizons, 15: 257–271.
Dye, R. & Sridhar, S. (2008). A positive theory of flexibility in accounting standards. Journal of
Accounting and Economics, 46: 312–333.
Fama, E. & French, K. (1992). The cross-section of expected stock returns. Journal of Finance, 47:
427–465.
Fama, E. & French, K. (1993). Common risk factors in the returns on stocks and bonds. Journal of
Financial Economics, 33: 3–56.
Fama, E. & French, K. (1996). Multifactor explanations of asset pricing anomalies. Journal of Finance,
51: 55–84.
Financial Accounting Standards Board. (1980). Qualitative Characteristics of Accounting Information.
Statement of Financial Accounting Concepts No. 2.
Financial Accounting Standards Board. (2010). Conceptual Framework for Financial Reporting.
Statement of Financial Accounting Concepts No. 8.
Francis, J., Pinnuck, M. & Watanabe, O. (2014). Auditor style and financial statement comparability. The
Accounting Review, 89: 605–633.
Freeman, R. & Tse, S. (1992). A nonlinear model of security price responses to unexpected earnings.
Journal of Accounting Research, 30: 185–209.
Gelb, D. & Zarowin, P. (2002). Corporate disclosure policy and the informativeness of stock prices.
Review of Accounting Studies, 7: 33–52.
Gleason, C., Jenkins, N. & Johnson, W. (2008). The contagion effects of accounting restatements. The
The Accounting Review, 83–110.
Gow, I., Ormazabal, G. & Taylor, D. (2010). Correcting for cross-sectional and time-series dependence in
accounting research. The Accounting Review, 85: 483–512.
Gu, Z. & Wu, J. (2003). Earnings skewness and analyst forecast bias. Journal of Accounting and
Economics, 35: 5–29.
Guidry, F., Leone, A. & Rock, S. (1999). Earnings-based bonus plans and earnings management by
business unit managers. Journal of Accounting and Economics, 26: 113–142.
Haw, I., Hu, B., Lee, J. & Wu, H. (2012). Investor protection and price informativeness about future
earnings: International evidence. Review of Accounting Studies, 17: 389–419.
Hayn, C. (1995). The information content of losses. Journal of Accounting and Economics, 20: 125–153.
Holthausen, R. & Verrecchia, R. (1988). The effect of sequential information release on the variance of
price changes in an intertemporal multi-asset market. Journal of Accounting Research, 26:
82–106.
Holthausen, R. & Watts, R. (2001). The relevance of value relevance. Journal of Accounting and
Economics, 31: 3–75.
International Accounting Standards Board. (1989). Framework for the preparation and presentation of
financial statements. International Accounting Standards Board.
International Accounting Standards Board. (2008). Exposure draft of an improved conceptual framework
for financial reporting. International Accounting Standards Board.
Jegadeesh, N. & Titman, S. (1993). Returns to buying winners and selling losers: Implications for stock
market efficiency. Journal of Finance 48: 65–91.
Jones, J. (1991). Earnings management during import relief investigations. Journal of Accounting
Research, 29: 193–228.
Joos, P. & Lang, M. (1994). The effects of accounting diversity: Evidence from the European Union.
Journal of Accounting Research, 32: 141–68.
Kasznik, R. & McNichols, M. (2002). Does meeting earnings expectations matter? Evidence from
analyst forecast revisions and share prices. Journal of Accounting Research, 40: 727–759.
Kim, S., Kraft, P. & Ryan, S. (2013). Financial statement comparability and credit risk. Review of
Accounting Studies, 18: 783–823.
Kothari, S. P. (2001). Capital markets research in accounting. Journal of Accounting and Economics, 31:
105–231.
Kothari, S., Leone, A. & Wasley, C. (2005). Performance matched discretionary accrual measures.
Journal of Accounting and Economics, 39: 163–197.
Land, J. & Lang, M. (2002). Empirical evidence on the evolution of international earnings. The
Accounting Review, 77: 115–33.
Lang, M., Maffett, M. & Owens, E. (2010). Earnings comovement and accounting comparability: the
effects of mandatory IFRS adoption. Working Paper. University of North Carolina – Chapel Hill.
Lipe, R., Bryant, L. & Widener, S. (1998). Do nonlinearity, firm-specific coefficients, and losses
represent distinct factors in the relation between stock returns and accounting earnings? Journal
of Accounting and Economics, 25: 195–214.
Liu, J. & Thomas, J. (2000). Stock returns and accounting earnings. Journal of Accounting Research, 38:
71–101.
Lui, D., Markov, S. & Tamayo, A. (2007). What makes a stock risky? Evidence from sell-side analysts’
risk ratings. Journal of Accounting Research, 45: 629–665.
Lundholm, R. & Meyers, L. (2002). Bringing the future forward: The effect of disclosure on the
returns-earnings relation. Journal of Accounting Research, 40: 809–839.
Mahoney, P. (1995). Mandatory disclosure as a solution to agency problems. University of Chicago Law
Review, 62: 1047–1112.
Mian, G. & Sankaraguruswamy, S. (2012). Investor sentiment and stock market response to earnings
news. The Accounting Review, 87: 1357–1384.
Orpurt, S. & Zang, Y. (2009). Do direct cash flow disclosures help predict future operating cash flows
and earnings? The Accounting Review, 84: 893–935.
Palepu, K. & Healy, P. (2007). Business Analysis & Valuation Using Financial Statements. Fourth
edition. Mason, OH: Thomson/South-Western.
Payne, J. & Thomas, W. (2003). The implications of using stock-split adjusted I/B/E/S data in empirical
research. The Accounting Review, 78: 1049–1067.
Penman, S. (2006). Financial Statement Analysis and Security Valuation. Third edition. Boston, MA:
McGraw-Hill Irwin.
Petersen, M. (2009). Estimating standard errors in finance panel data sets: Comparing approaches. The
Review of Financial Studies, 22: 435–480.
Ramnath, S. (2002). Investor and analyst reactions to earnings announcements of related firms: An
empirical analysis. Journal of Accounting Research, 40: 1351–1376.
Revsine, L., Collins, D. & Johnson, W. (2004). Financial Reporting and Analysis. Third edition. Upper
Saddle River, NJ: Prentice Hall.
Schipper, K. (2003). Principle-based accounting standards. Accounting Horizons, 17: 61–72.
Securities and Exchange Commission. (2000). International Accounting Standards. SEC Concept Release,
34–42430.
Subramanyam, K. (1996). The pricing of discretionary accruals. Journal of Accounting and Economics,
22: 249–282.
Wang, C. (2011). Financial statements comparability: Definition and implication for equity valuation.
Working Paper. Northwestern University.
Watts, R. & Zimmerman, J. (1986). Positive Accounting Theory. Prentice-Hall, Englewood Cliffs, NJ.
White, H. (1980). A heteroscedasticity-consistent covariance matrix estimator and a direct test for
heteroscedasticity. Econometrica, 48: 817–838.
Wild, J., Subramanyam, K. & Halsey, R. (2006). Financial Statement Analysis. Ninth edition. Boston,
MA: McGraw-Hill Irwin.
MAILING INFORMATION
Matthew Stallings
University of St. Thomas
2115 Summit Ave
McNeely Hall 316
St. Paul, MN 55105
(651) 962–5112