financial statement analysis an introduction to ratio analysis
TRANSCRIPT
Financial Statement Analysis
An introduction to Ratio Analysis

Steps in Financial Analysis
• Select the information • relevant information• arrange the information• to highlight significant
relationships• interpretation
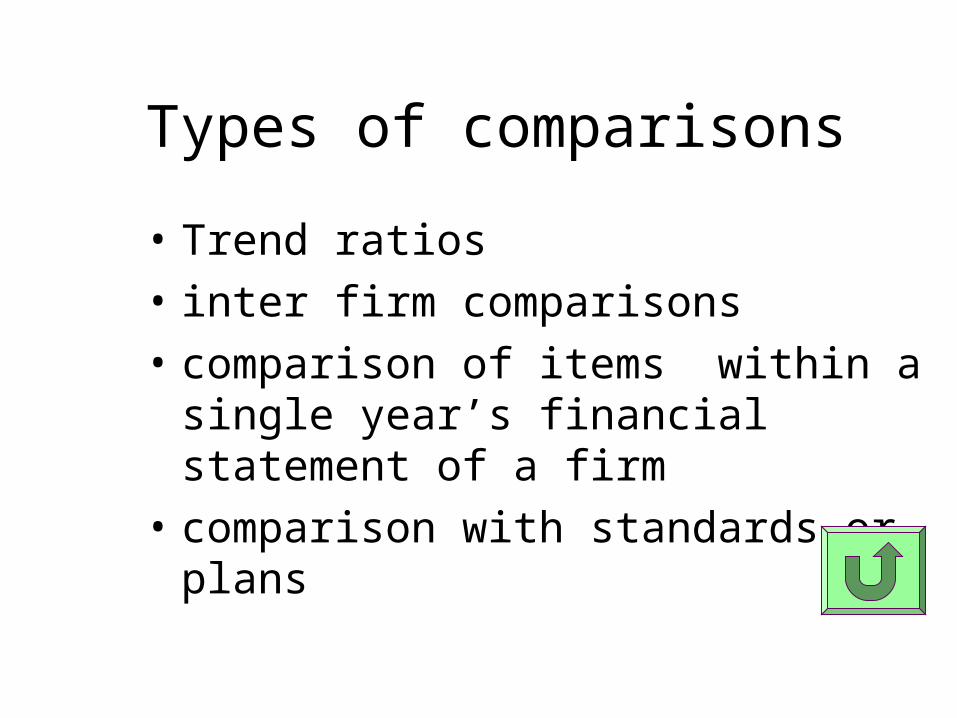
Types of comparisons
• Trend ratios• inter firm comparisons• comparison of items within a
single year’s financial statement of a firm
• comparison with standards or plans

Liquidity Ratios
• Measure of firms ability to meet short term /current liabilities
• inverse relationship between liquidity and profitability
• Types of liquidity ratios
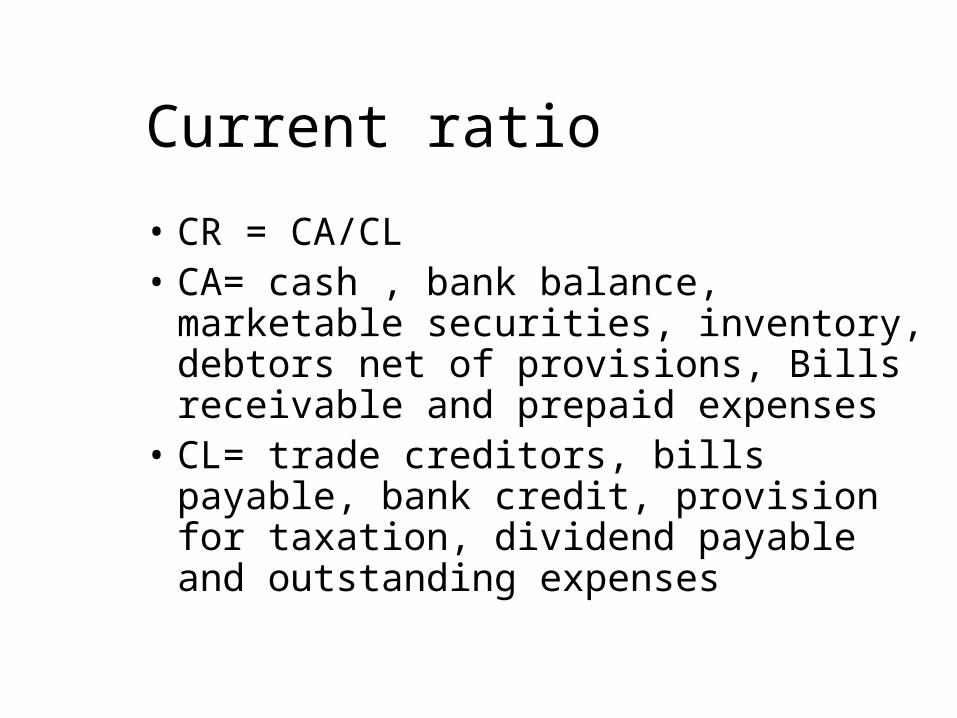
Current ratio
• CR = CA/CL• CA= cash , bank balance,
marketable securities, inventory, debtors net of provisions, Bills receivable and prepaid expenses
• CL= trade creditors, bills payable, bank credit, provision for taxation, dividend payable and outstanding expenses
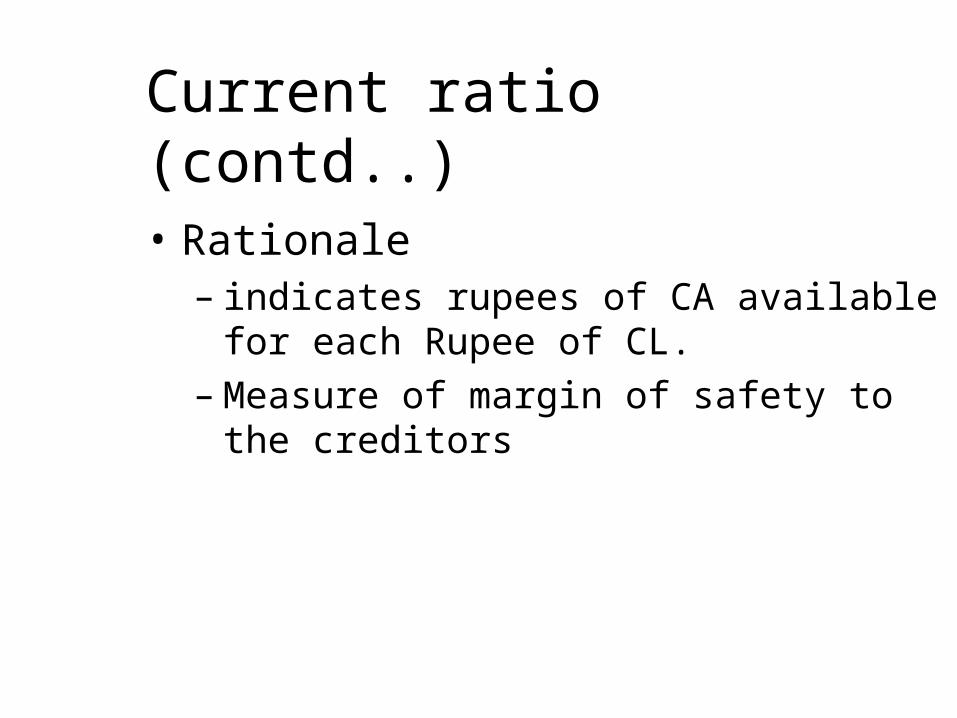
Current ratio (contd..)
• Rationale – indicates rupees of CA available for
each Rupee of CL.– Measure of margin of safety to the
creditors
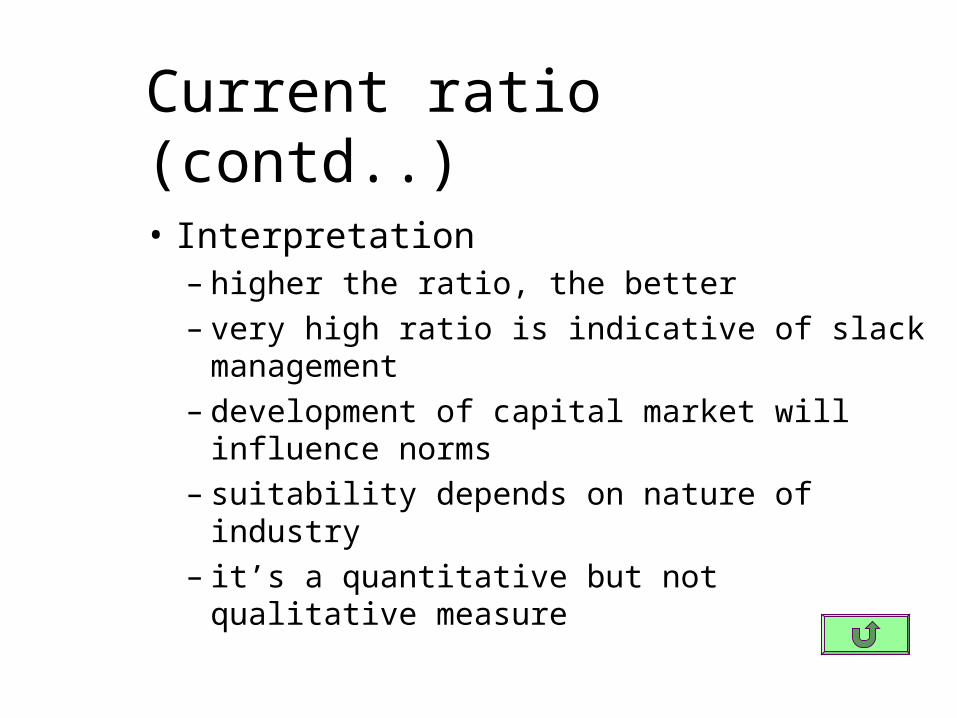
Current ratio (contd..)
• Interpretation– higher the ratio, the better– very high ratio is indicative of slack
management– development of capital market will
influence norms– suitability depends on nature of industry– it’s a quantitative but not qualitative
measure

Acid test or quick ratio
• ATR/QR= QA/CL• QA= CA- inventories-prepaid
expenses• Interpretation
– qualitative measure of liquidity– relationship between CR and ATR/QR
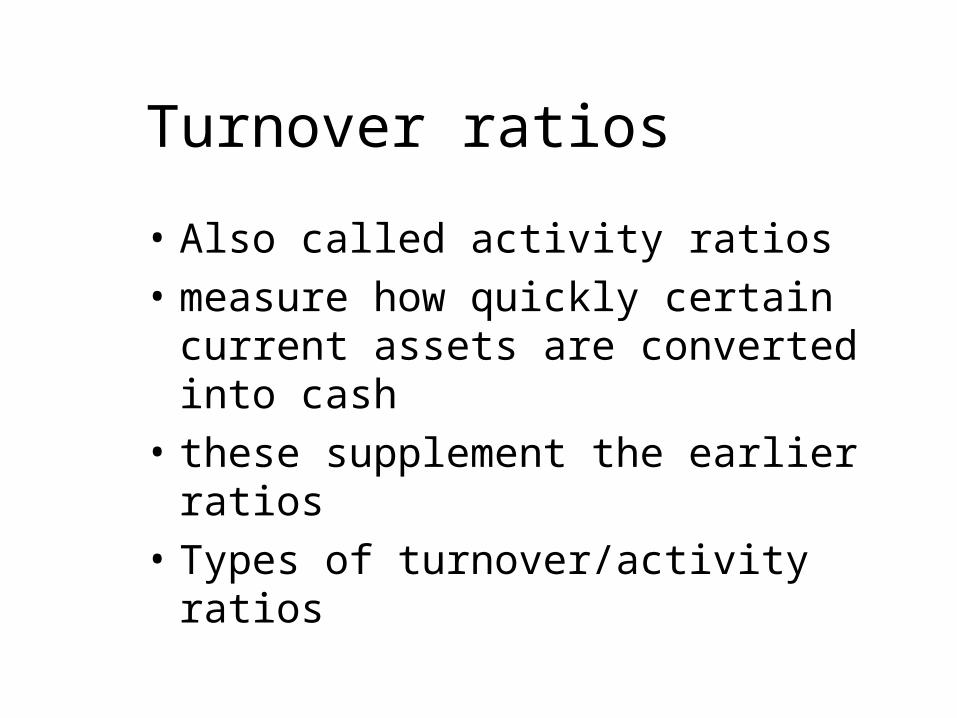
Turnover ratios
• Also called activity ratios• measure how quickly certain
current assets are converted into cash
• these supplement the earlier ratios• Types of turnover/activity ratios

Types of turnover/activity ratios• Inventory turnover ratio• debtors turnover ratio• creditors turnover ratio
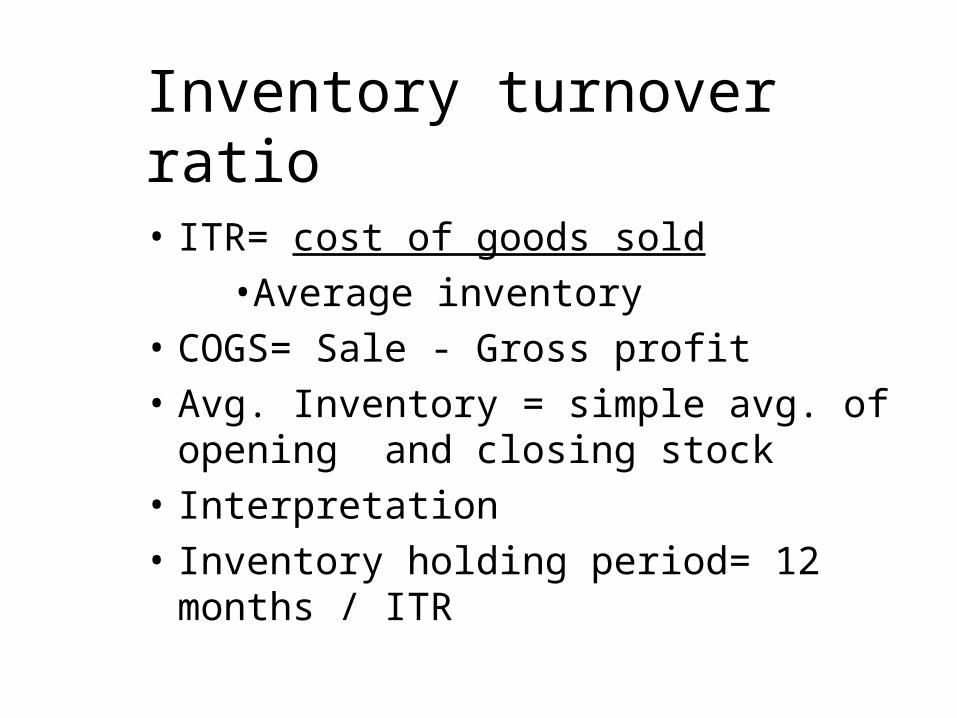
Inventory turnover ratio
• ITR= cost of goods sold•Average inventory
• COGS= Sale - Gross profit• Avg. Inventory = simple avg. of
opening and closing stock• Interpretation• Inventory holding period= 12
months / ITR

Debtors turnover ratio
• DTR = Net credit sales/ Avg. debtors
• interpretation• Debt collection period = 12 mths/
DTR

Creditors turnover ratio
• CTR = Net credit purchases/ Avg. creditors
• Interpretation• Creditor’s payment period = 12
mths/ CTR

Defensive interval ratio
• Ability to meet daily projected cash expenditure from operations
• DIR=quick assets/ projected daily cash requirement(PDCR)
• PDCR= projected cash operating exp./ 365
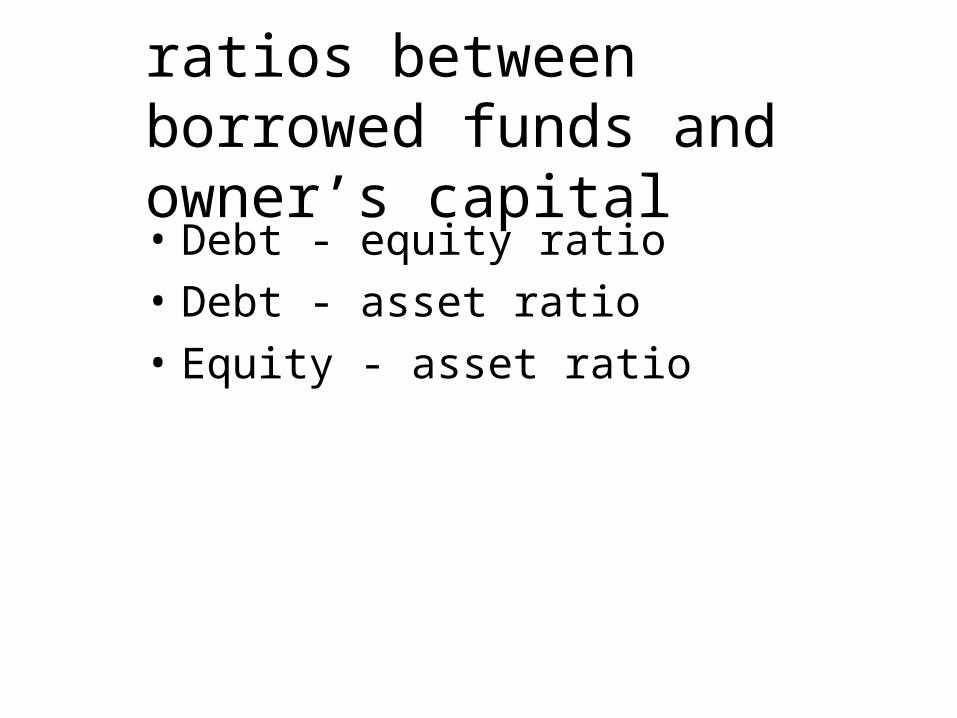
ratios between borrowed funds and owner’s capital• Debt - equity ratio• Debt - asset ratio• Equity - asset ratio
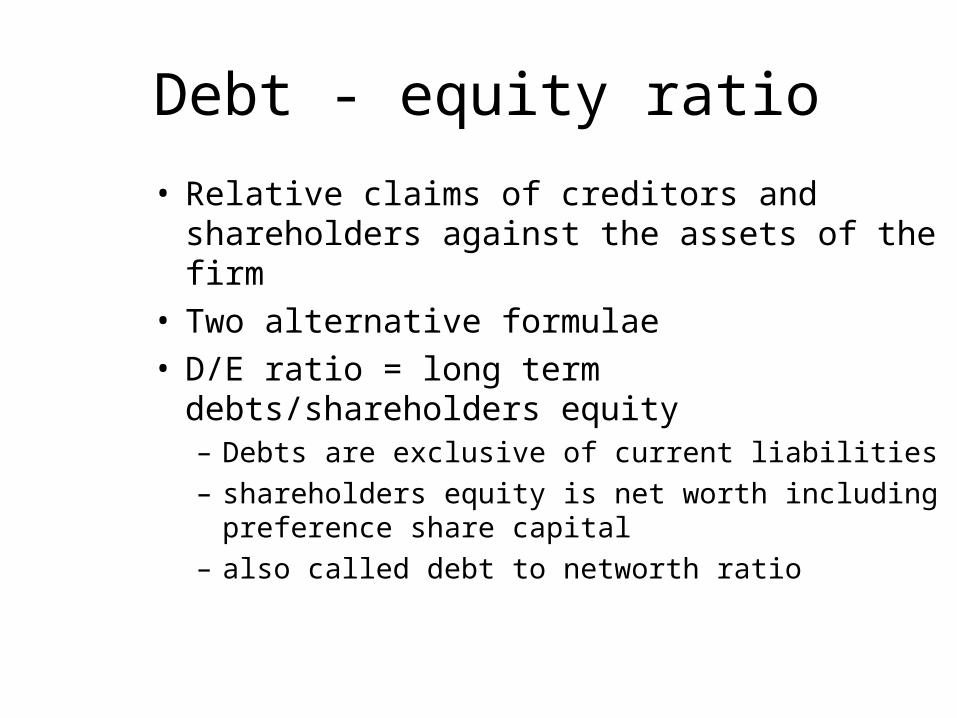
Debt - equity ratio
• Relative claims of creditors and shareholders against the assets of the firm
• Two alternative formulae• D/E ratio = long term debts/shareholders
equity– Debts are exclusive of current liabilities– shareholders equity is net worth including
preference share capital– also called debt to networth ratio
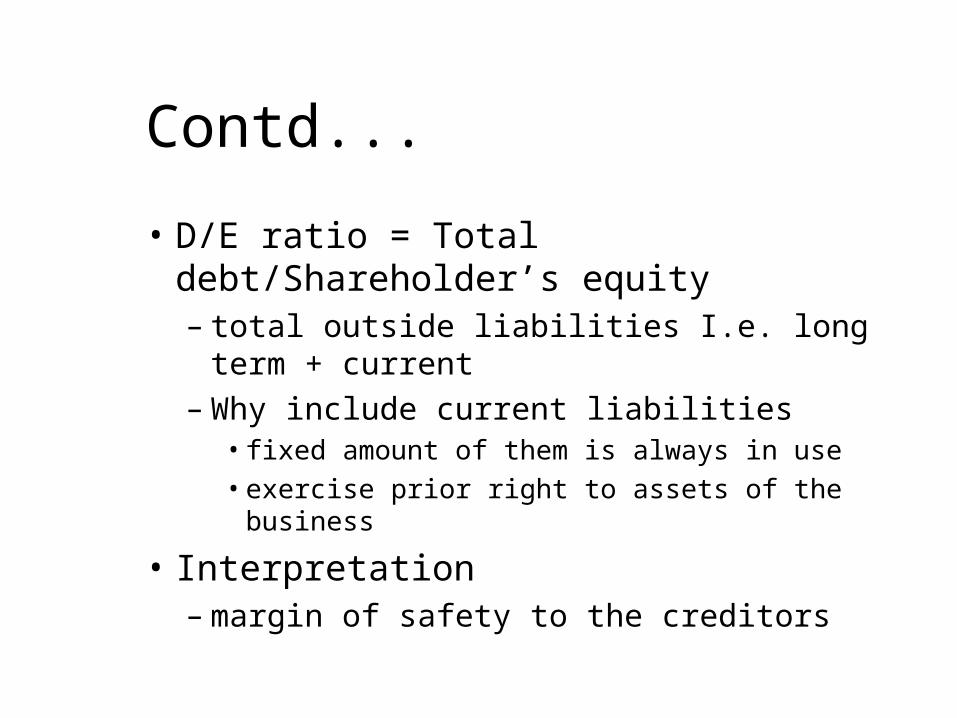
Contd...
• D/E ratio = Total debt/Shareholder’s equity– total outside liabilities I.e. long term +
current– Why include current liabilities
• fixed amount of them is always in use• exercise prior right to assets of the business
• Interpretation– margin of safety to the creditors

Contd...• implications from
– creditors angle,• stake of shareholders and • degree of their commitment
– firms angle• influence of creditors• borrowing under restrictive conditions
– shareholders angle • trading on equity• maintain control inspite of limited stake
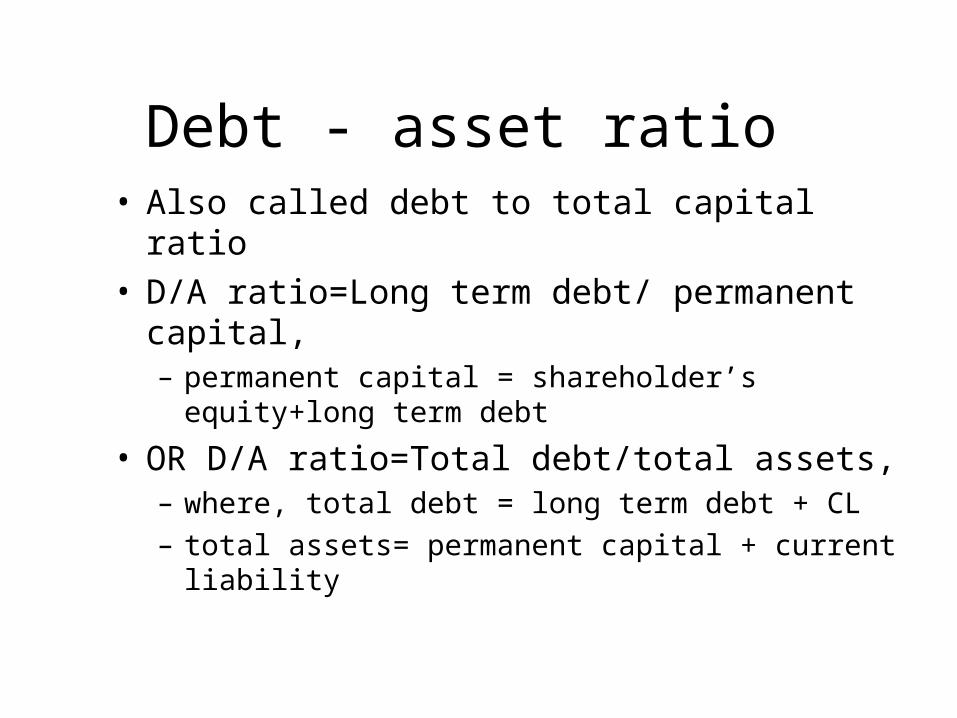
Debt - asset ratio• Also called debt to total capital ratio• D/A ratio=Long term debt/ permanent
capital,– permanent capital = shareholder’s
equity+long term debt
• OR D/A ratio=Total debt/total assets,– where, total debt = long term debt + CL– total assets= permanent capital + current
liability

Equity - asset ratio
• Also called Proprietor’s ratio• E/A ratio= Proprietor’s funds x 100
»total assets

Dividend coverage ratio
• = EAT/Preference dividend• reveals safety margin available to
preference shareholders

Total coverage ratio
• Takes into account all fixed obligations of the firm
• = EBIT+Lease payments/{Interest payment + Lease payment + (preference dividend + instalment of principal)/(1-t)}

Profitability ratios
• Reflect operating efficiency and return on investment
• profitability ratios are measured w.r.t.– sales– investment
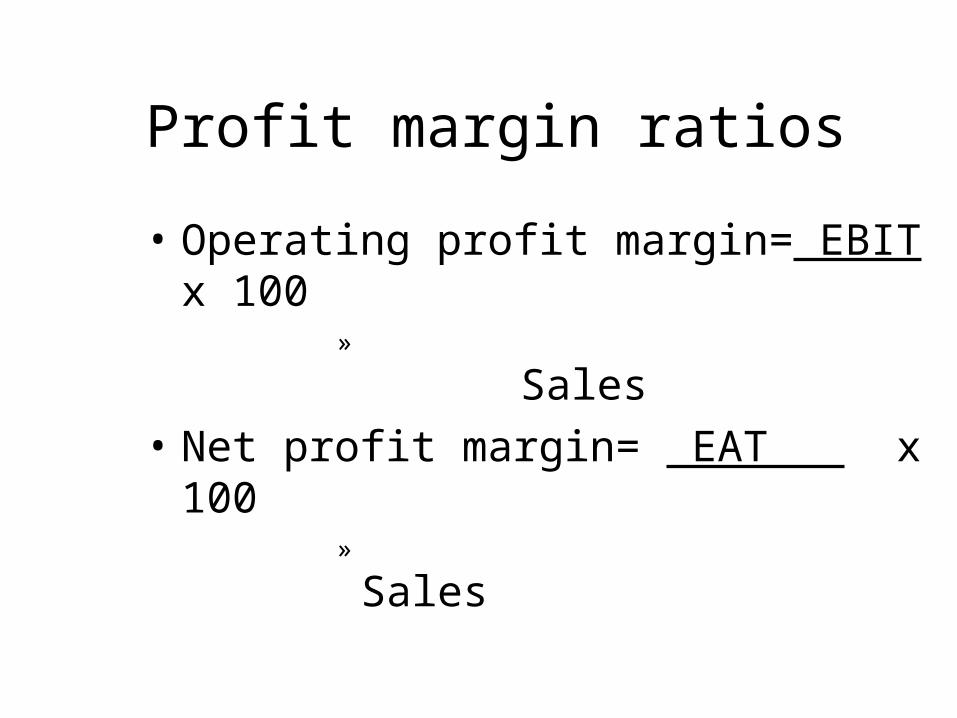
Profit margin ratios
• Operating profit margin= EBIT x 100
» Sales• Net profit margin= EAT x 100
» Sales

Profitability ratios related to investment• Also called Return on Investment
(ROI) ratios• Three broad types
– Return on Assets– Return on Capital Employed– Return on Shareholder’s equity

Return on Assets
• ROA = EAT+Interest-tax advantage on int.
–Avg. total assets/Tangible assets/Fixed assets
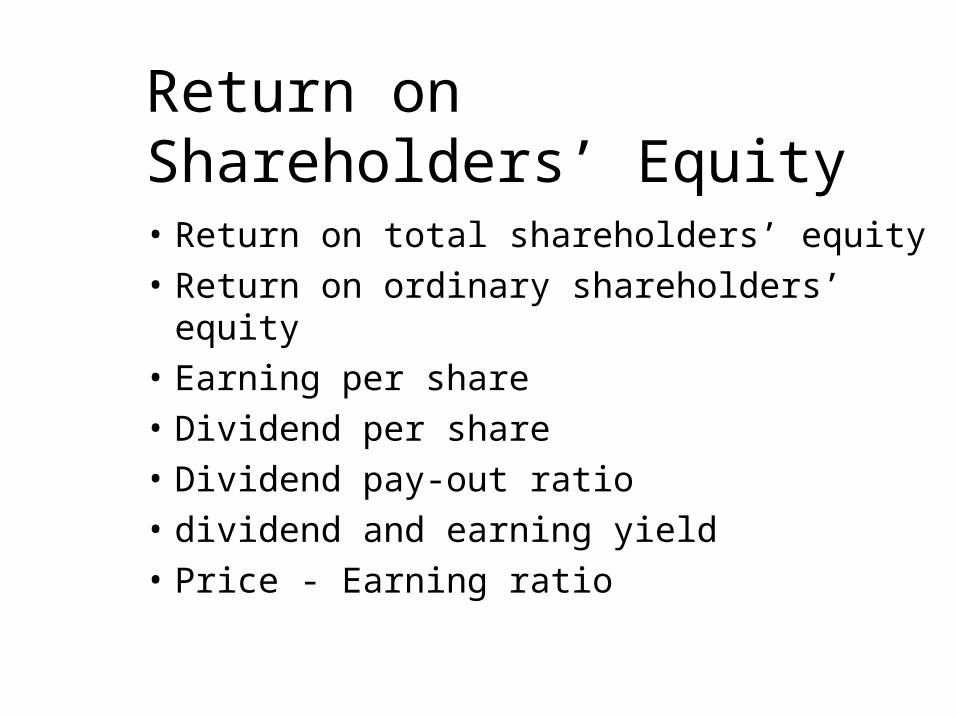
Return on Shareholders’ Equity• Return on total shareholders’ equity• Return on ordinary shareholders’
equity• Earning per share• Dividend per share• Dividend pay-out ratio• dividend and earning yield• Price - Earning ratio

Various formulae
• Return on total shareholders’ equity = Net profit after taxes Avg. total shareholders’ equity
– Where, Avg. total shareholders’ includes preference share capital, ordinary share capital, share premium, reserves and surplus, accumulated losses I.e. net worth
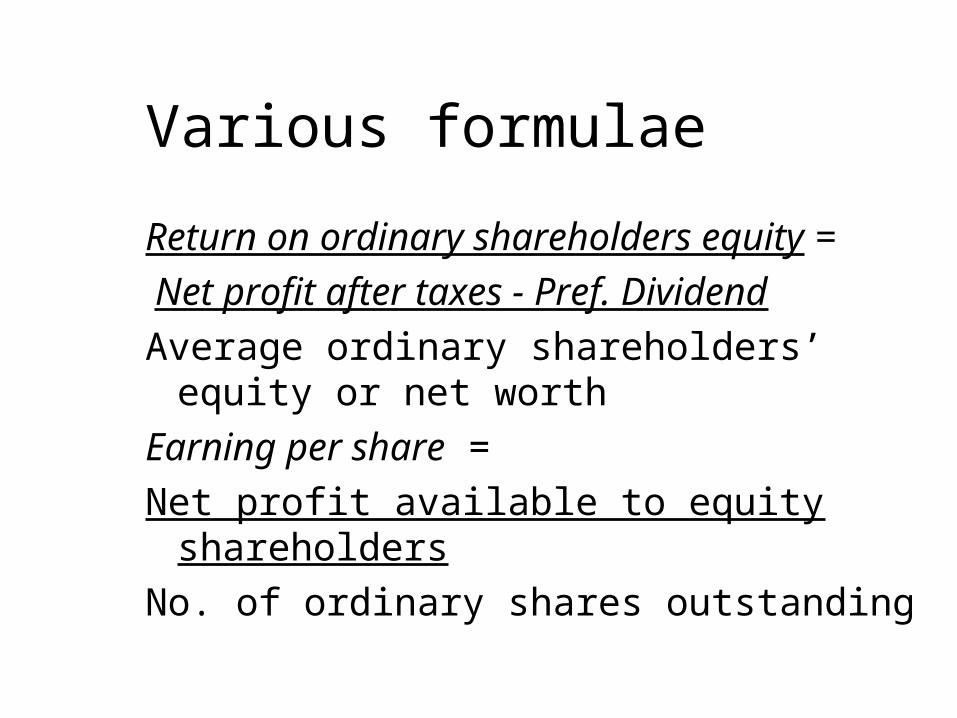
Various formulae
Return on ordinary shareholders equity = Net profit after taxes - Pref. DividendAverage ordinary shareholders’ equity or
net worthEarning per share =Net profit available to equity
shareholdersNo. of ordinary shares outstanding

Various formulae
• Dividend per share = NP distributed to ordinary shareholdersNo. of ordinary shares outstanding
• Dividend pay out ratio =Total dividend to equity holders(cash
div)Total NP belonging to equity holders