financial stability review - european central bank - europa
TRANSCRIPT

F INANC IAL STAB I L I TY REV IEW DECEMBER 2012
EURO
PEAN
CEN
TRAL
BAN
K
FIN
ANCI
AL S
TABI
LITY
REV
IEW
D
ECEM
BER
2012

financial stability reviewDecember 2012
In 2012 all ECB publications
feature a motif taken from
the €50 banknote.

© European Central Bank, 2012
Address Kaiserstrasse 29 60311 Frankfurt am Main Germany
Postal address Postfach 16 03 19 60066 Frankfurt am Main Germany
Telephone +49 69 1344 0
Website http://www.ecb.europa.eu
Fax +49 69 1344 6000
All rights reserved. Reproduction for educational and non-commercial purposes is permitted provided that the source is acknowledged.
Unless otherwise stated, this document uses data available as at 22 November 2012.
ISSN 1830-2017 (print) ISSN 1830-2025 (online)

3ECB
Financial Stability ReviewDecember 2012
Preface 5
Overview 7
1 macrO risks 13Box 1 Recent trends in global portfolio flows amid sovereign tensions
in the euro area 20
2 creDit risks 252.1 Weak economic growth prospects and financial sector vulnerabilities weigh
on the government sector 252.2 Household sector conditions remain heterogeneous across countries 302.3 Weak conditions in the non-financial corporate sector amid increased
uncertainty regarding the outlook 32Box 2 The financial crisis and external financing of euro area
non-financial corporations 352.4 A two-speed euro area property market 38
3 financial markets anD glObal financial institutiOns 433.1 Some subsiding of money and capital market tensions 43
Box 3 Main findings of the Euro Money Market Survey 2012 463.2 Challenging environment for global financial institutions 52
4 eurO area financial institutiOns 574.1 The euro area banking sector: along the path to a new post-crisis world 57
Box 4 Developments in the price-to-book ratios of large and complex banking groups 63Box 5 Gauging the potential for sovereign and banking sector spillovers
in the euro area 734.2 Euro area insurance sector: overall resilience conceals a high level of heterogeneity 764.3 Assessment of financial institutions 834.4 Reshaping the regulatory and supervisory framework for financial institutions,
markets and infrastructures 93Box 6 Central clearing for derivatives 98
sPec ial features 101
A Predicting bank distress and identifying interdependencies among European banks 101B The impact of bank funding market fragmentation on credit intermediation during
the sovereign debt crisis 109C Towards a banking union 119
statistical anneX s1
cOntents


5ECB
Financial Stability ReviewDecember 2012
Financial stability can be defined as a condition in which the financial system – which comprises financial intermediaries, markets and market infrastructures – is capable of withstanding shocks and the unravelling of financial imbalances. This mitigates the likelihood of disruptions in the financial intermediation process that are severe enough to significantly impair the allocation of savings to profitable investment opportunities. Understood this way, the safeguarding of financial stability requires identifying the main sources of risk and vulnerability. Such sources include inefficiencies in the allocation of financial resources from savers to investors and the mispricing or mismanagement of financial risks. The identification of risks and vulnerabilities is necessary because the monitoring of financial stability must be forward looking: inefficiencies in the allocation of capital or shortcomings in the pricing and management of risk can, if they lay the foundations for vulnerabilities, compromise future financial system stability and therefore economic stability. This Review assesses the stability of the euro area financial system both with regard to the role it plays in facilitating economic processes and with respect to its ability to prevent adverse shocks from having inordinately disruptive impacts.
The purpose of publishing this Review is to promote awareness in the financial industry and among the public at large of issues that are relevant for safeguarding the stability of the euro area financial system. By providing an overview of sources of risk and vulnerability for financial stability, the Review also seeks to play a role in preventing financial crises.
The analysis contained in this Review was prepared with the close involvement of the Financial Stability Committee (FSC). The FSC assists the decision-making bodies of the European Central Bank (ECB) in the fulfilment of the ECB’s tasks in the field of financial stability.
Preface


7ECB
Financial Stability ReviewDecember 2012
OverviewStresses on the euro area financial system have eased tangibly since the summer, as the intensity of self-fulfilling and destructive confidence spirals has dissipated. An unequivocal commitment by the ECB to combat unfounded concerns about euro revocability has played a key role in this development, by mitigating the tail risks that had been priced in to financial asset prices. Broader policy action to address the root causes of the crisis has remained uneven across countries and over time. But, importantly, the focus has shifted from simply countering the worst manifestations of vulnerabilities to a more cohesive focus on durably strengthening the foundations of the euro area. Adjustment of national imbalances remains essential in this respect – namely, to set public finances on a sustainable footing, foster competitiveness and lay the foundations for robust financial intermediation. Building upon national adjustment, the progressive emergence of a roadmap to strengthen Economic and Monetary Union (EMU) contains several practical steps to redress pre-crisis institutional weaknesses in the fiscal, economic and financial spheres.
Notwithstanding a lessening of signs of financial stress, the euro area financial stability environment continues to be fragile, and several vulnerabilities remain. In particular, adjustment towards more sustainable public finances and adaptation of a banking sector damaged by the crisis remain incomplete in the euro area as elsewhere around the globe – though euro area heterogeneity remains stark across countries, sectors and individual financial institutions. Where imbalances remain, consistent actions are needed to reinforce plans and restore credibility; any hesitation in the pursuit of necessary reforms would inevitably fuel new market tensions.
Ultimately, progress along a path to a sustainable post-crisis equilibrium has been slow, painful, and not devoid of setbacks. Protracted financial strain and heightened uncertainty have not only manifested themselves in bouts of financial market turbulence; the uncertain planning environment has also been denting macroeconomic growth prospects, not least by distorting economic allocation. Persistent uncertainty has fostered the home-country bias of investors, resulting in strong financial market fragmentation. This has exacerbated funding strains in some countries, whilst yielding the prospect of a new build-up of imbalances in others.
main risks tO eurO area financial stability
An easing of the most acute financial stability strains has been evident in various market indicators, with gauges of systemic risk capturing financial market and banking stress in the euro area exhibiting noticeable declines. Key financial stability risks nonetheless continue to stem from imbalances and vulnerabilities in the fiscal, macroeconomic and financial sector domains (see the table below).
An easing of financial stress…
… but remaining vulnerabilities…
… and legacies of a protracted crisis
Three key risks to euro area financial stability
key risks to euro area financial stability
Current level and recent change
1. Aggravation of the euro area sovereign debt crisis, partly because of implementation risk for agreed policy measures at the national and EU level
2. A further deterioration in bank profitability and credit quality owing to a weak macro-financial environment
3. Fragmented financial markets amplifying funding strains for banks in countries under stress
The colour indicates the current level (with red representing considerable systemic risk, orange systemic risk and yellow potential systemic risk). The current level of risk is a combination of the probability of materialisation and an estimate of the likely systemic impact of the identified risk, based on the judgement of the ECB’s staff. The arrows indicate the change since the previous FSR.

8ECBFinancial Stability ReviewDecember 201288
The systemic dimension of these risks originates not only from individual domains, but also from amplifications resulting from the interplay between them – notably mutual adverse feedback loops between euro area sovereign debt strains and the effects of a weakened macro-financial environment on financial institutions, combined with particular funding strains for banks in countries exhibiting sovereign stress.
Key risk 1: Aggravation of the euro area sovereign debt crisis, partly because of implementation risk for agreed policy measures at the national and EU level
Sovereign risk premia have receded from their very high peaks. Much of this has stemmed from monetary policy announcements ruling out tail risk associated with the euro. Strengthened policy commitments to address fundamental policy weaknesses at the heart of the crisis have also played a role in stemming its worst manifestations. At the same time, vulnerabilities remain and a renewed flare-up in the sovereign debt crisis continues to be the most pressing risk to euro area financial stability. While there is an increasingly clear roadmap to move away from pre-crisis weaknesses in the institutional framework for Monetary Union, it is surrounded by considerable implementation risks to strong policy commitments, including risks to pledged national adjustment. In this sense, sources of uncertainty have largely migrated from where the future of EMU will lie to how this transition will occur, and the potential for policy slippage or insufficient determination in moving to this new equilibrium.
Delays or failures in the timely implementation of needed reforms have the potential to unleash vulnerabilities. On the one hand, doubts linger in the market regarding the commitment in some member countries to undertake fundamental adjustment in the sphere of fiscal and structural policies central to sovereign stress, particularly in the absence of stark market pressures. On the other hand, any delay in the policy agenda that could be perceived as signalling a waning commitment to completing a genuine currency union, including steps towards a banking union, could severely undermine investors’ confidence and spur a rebound in market tensions. Avoiding such outcomes requires a steady commitment to necessary adjustment by member countries, along with determined implementation of European-level decisions to complete the strengthening of the institutional framework for EMU.
Key risk 2: A further deterioration in bank profitability and credit quality owing to a weak macro-financial environment
The persistence of sovereign strains in the euro area, as part of the broader global financial crisis, has implied pronounced uncertainty surrounding euro area macro-financial developments. More worryingly, a progressive weakening in the macro-financial environment has led to increasing risks to banks’ credit exposures, profitability and capital levels.
Specific channels through which such impacts may be most strongly felt could include increases in non-performing loans – of particular concern for those banks with low starting levels of profitability. Such interaction would be most relevant for banks with exposures to households and firms with stretched debt-servicing capacity – stemming, for instance, from high household or firm indebtedness along with susceptibility to adverse macroeconomic developments in the form of rising unemployment or weak economic demand.
Provisioning for non-performing assets needs to be adequate, including property loan portfolios. While loan loss provisioning of euro area banks has exhibited a rise in recent quarters, possible
Some easing of sovereign tensions
belies remaining vulnerabilities
Adverse impact on bank credit quality
from a weakened economy

9ECB
Financial Stability ReviewDecember 2012 9
Overview
9
forbearance is an issue to be monitored. Fostering market confidence in the solidity of banks’ balance sheets is paramount – and efforts at the national level to enhance the transparency of balance sheets, notably through strengthened asset quality reviews coordinated by supervisory authorities, are a key step towards easing existing banking vulnerabilities in the euro area. In the case of Spain, for instance, where particularly acute challenges to parts of the banking sector have come to the fore, important progress is being made to restructure and strengthen the balance sheets of financial intermediaries. More broadly, steady improvements in solvency positions of euro area large and complex banking groups should provide a more solid buffer against losses than in past economic downturns. Such steps should ensure that bank profitability, while unlikely to return to pre-crisis highs, will be on a sounder basis, free of the excessive concentration of risks and leverage in the balance sheets of financial institutions.
Key risk 3: Fragmented financial markets amplifying funding strains for banks in countries under stress
Fragmentation in financial markets has remained heightened amid flows of internationally mobile capital from countries under stress to perceived safe and liquid havens. Policy actions to provide funding certainty and remove tail risk from the euro area have implied some normalisation of funding conditions for banks – including medium to long-term debt issuance by (mainly) large banks, as well as returning stability to retail deposit flows. At the same time, the cost of attracting new funding for banks has remained elevated at the aggregate level and, in particular, in countries exhibiting sovereign stress.
By definition, fragmentation has multiple faces. On the one hand, persistently high funding costs in stressed jurisdictions could easily serve to amplify pressures for banks to deleverage in a disorderly way, with an implied risk of asset fire sales, the loss of strategically important profitable assets and restricted lending to the real economy. Lending to households and firms has indeed been weak in countries under sovereign stress, compounded by a limited scope for alternative non-bank sources of financing. On the other hand, protracted safe-haven flows could foster a build-up of new imbalances, with a potential for disruptive unwinding. Indeed, distortions in prices and flows stemming from crisis-related risk aversion have been pervasive even beyond the euro area. A perceived erosion of the use of sovereign bonds of several countries as risk-free assets by investors could be giving way to a generalised financial market search for alternative assets that offer a comparable risk-adjusted return – for instance, sovereign holdings of different geographical origin or a complete replacement of sovereign holdings altogether by other assets, such as those in the non-financial corporate sphere. Such developments could be amplified in some cases by a trend towards financial market interactions on a secured basis – with a corollary of increasingly encumbered assets considered as safe and liquid. Regarding banks, a generalised trend towards “home bias” in interbank flows and collateral acceptance would undermine an integrated market which remains a natural corollary of monetary union. More generally, any restrictions on the flow of liquidity may reduce market depth, with the prospect of large collective losses.
The functioning of money and debt markets has remained impaired, notwithstanding ECB action, as diffusion of aggregate liquidity has been hindered by intertwined sovereign and counterparty credit risk concerns. Strides towards improving fundamentals at the national level, whilst simultaneously working to sever sovereign-bank feedback loops, are critical to fundamentally resolving the pernicious fragmentation of funding and capital markets.
Fragmentation in funding and capital markets

10ECBFinancial Stability ReviewDecember 20121010
OtHer risks
Within a period of protracted crisis, attention has been rightly diverted towards manifest risks. A comprehensive monitoring nonetheless requires vigilance against other systemic risks – notably any insidious build-up of new imbalances. The broad and exhaustive analysis presented within this Review highlights developments with destabilising potential across the financial sector, financial intermediaries and the non-financial sectors of the economy – not only inside but also beyond the euro area.
Close monitoring has, however, limits in the form of timely and encompassing information on risk build-up. In this respect, ongoing financial innovation or rapid growth of under-monitored sectors requires close scrutiny of its potential to engender risks to systemic stability. One example in this respect relates to the “shadow banking” sector. Initiatives aimed at improving data availability for all relevant areas within the financial system, including these entities, must be fostered. Beyond this, efforts to obtain more information on financial innovation would also be warranted – including those developments with the potential to fundamentally alter market microstructures, such as exchange-traded funds, as well as algorithmic and high-frequency trading.
POlicy initiatives tO aDDress tHe crisis anD strengtHen tHe eurO area
Timely ECB action to address risks to euro area price stability has been critical in not only ensuring price stability but also in easing financial stress which had at times reached extreme levels. Most recently, the announcement of Outright Monetary Transactions (OMTs) was key in underpinning a widespread narrowing of euro area sovereign spreads, accompanied by a more generalised calming of financial markets. While ECB action has in this way attenuated the symptoms of financial market fragmentation, it has not – and, indeed, cannot – address its root causes. Exceptional and temporary non-standard central bank monetary policy measures have, however, created important breathing space – and an effective window for governments and financial institutions to fundamentally tackle the root causes of the crisis.
A common narrative has emerged over the last years portraying a lack of timely policy action to tackle these root causes amid a rapidly evolving situation. In the early stages of the crisis, policy interventions in euro area countries had been often – and rightly in many respects – characterised as predominantly reactive as opposed to proactive. Policy efforts have nonetheless been cumulatively adding up, with the result that this virulent phase of the global financial crisis for the euro area has seen not only considerable turbulence, but also quite some policy progress – progress which better addresses marked externalities on other countries from the pursuit of inappropriate national economic policies within a monetary union. In particular, commitment to strong national policy adjustment has been complemented by policies to strengthen the long-term viability of EMU in three areas.
First, the European fiscal governance framework has been reinforced to reduce proclivity for deficit bias, which is especially forceful in a monetary union. This deficit bias has been insufficiently addressed in the past because of weak institutional governance matched by insufficient market discipline to penalise unsound national policies. The establishment of the European Stability Mechanism has been matched by considerable progress towards durably strengthening fiscal governance. This includes most notably the so-called “six-pack”, which has reinforced both the preventive and corrective arms of the Stability and Growth Pact, set new minimum requirements for national budgetary frameworks and strengthened enforcement through new financial sanctions.
Other vulnerabilities and information
gaps
Timely ECB action…
… amid European measures to
strengthen the long-term viability
of EMU…
… tackling a deficit bias in monetary
union

11ECB
Financial Stability ReviewDecember 2012 11
Overview
11
The fiscal compact constitutes a further welcome step towards a stronger rule-based fiscal governance framework, notably the mandatory introduction of a balanced budget rule at the national level as well as a strengthening of the automaticity of the excessive deficit procedure in case of breaches. In addition, negotiations on the “two-pack” – including further elements for strengthening fiscal surveillance by the European Commission and Council – are currently ongoing. Ultimately, while much progress has been made in strengthening governance on paper, it is the actual implementation of these rules which will condition their success – underlining the need for a strictly implemented and rigorously enforced fiscal governance framework, in contrast to the past.
A second area of significant progress has been competitiveness and productivity gaps within EMU. Imbalances in this sphere, which had largely escaped pre-crisis surveillance, have been key aggravating factors underlying the incidence and severity of the crisis across many euro area regions and countries. Important policy steps aimed at addressing this shortcoming have included measures at the national level, for instance through more ambitious structural reform agendas. At the European level, noteworthy advances include strengthened economic governance through a new wide-ranging macro-imbalances procedure as part of the “six-pack”, as well as a Compact for Growth and Jobs to improve macroeconomic competitiveness in Europe.
Last but not least, the excessive risk-taking in the financial sector that led to the global financial crisis had laid bare the shortcomings of both supervisory and regulatory processes around the world. The initial response to these shortcomings has been resolute, though the process remains incomplete. A sweeping and exhaustive global regulatory agenda should contribute to a stronger and more robust financial system. On the micro-prudential side, regulatory strides range from capital and liquidity requirements in banks through to heightened shock-absorption capacity outside banks and across financial market infrastructures. At the same time, micro- and macro-level oversight has been strengthened around the globe – notably in Europe through the European System of Financial Supervision and the European Systemic Risk Board. Lastly, concrete and important steps are being taken towards a banking union in Europe – including a new area-wide single supervisory mechanism.
The crisis has called for and, in large part, is finally yielding more substantial and comprehensive policy measures to match its severity. While much progress has been made, open issues nonetheless remain in several areas and a need for effective implementation is key. As part of this, there is an ongoing debate within the euro area regarding the appropriate balance between national sovereignty and a collective insurance of liabilities. As the prospect of renewed virulence of the crisis still looms, such necessary discussions also face the need to accurately gauge a feasible pace of change fast enough to regain financial market confidence. Ultimately, continued momentum building upon progress to date is needed to improve the robustness of the financial system, while completing the foundations of EMU, to durably strengthen euro area financial stability.
… closing competitiveness and productivity gaps
… durably strengthening financial regulation and supervision
Continued policy momentum needed


13ECB
Financial Stability ReviewDecember 2012
1 macrO risks
early 2011 (see Chart S.1.1) has been rooted in subdued domestic demand. In particular, the protracted euro area sovereign debt crisis and the resolution of legacy balance sheet issues have taken their toll on confi dence – both at the household and at the fi rm level. Household sentiment has suffered from rising unemployment – which climbed to a record high of 11.7% in October, albeit amid a signifi cant degree of cross-country dispersion that ranged from 4.3% in Austria to 26.2% in Spain (see Chart S.1.2). Firm sentiment has suffered from a combination of high commodity prices and adverse credit supply conditions in some euro area countries. Perhaps most importantly, the persistence of crisis-like conditions has led to an erosion of confi dence stemming from a high degree of uncertainty regarding its eventual resolution – thus hampering long-term planning and associated investment.
An analysis of the evolution of private sector forecasts suggests heightened uncertainty regarding the pace of economic recovery not only in the euro area, but also for other important global growth engines such as the United States (see Chart 1.1). That said, the development of these forecast distributions indicates that uncertainty remains close to the peaks witnessed in the post-Lehman period or prior to the ECB’s three-year longer-term refi nancing operations (LTROs). The latest Eurosystem staff macroeconomic projections for the euro area suggest a recovery in real economic activity,
Macroeconomic and macro-fi nancial risks remain elevated and surrounded by a high degree of uncertainty – both at the euro area and at the global level. Economic growth concerns are underpinned by ongoing sovereign tensions in several euro area countries, persistent global imbalances and continued economic policy uncertainty. In many advanced economies, a need for structural deleveraging across both the fi nancial and the non-fi nancial sectors in conjunction with a high level of fragmentation in fi nancial markets weighs further on economic growth prospects. Among the still virulent strains of the fi nancial crisis that has now lasted for fi ve years, policy support – including the non-standard measures aimed at buttressing the functioning of the price stability-oriented monetary policies of major central banks around the globe, as well as fi scal and structural adjustment measures – continues to be pivotal in contributing to economic stabilisation and recovery.
Economic activity in the euro area has weakened further since the fi nalisation of the June 2012 Financial Stability Review (FSR). The ongoing and persistent weakness of economic activity since
Economic activity in the euro area has lost further momentum
chart 1.1 Distribution of real gDP growth forecasts for the euro area and the united states(probability density)
0.0
0.5
1.0
1.5
2.0
0.0
0.5
1.0
1.5
2.0
-3 -2 -1 0 1 2 3 4 5
200720082009
201020112012
x-axis: real GDP growth forecasts (percentage change per annum)
a) Euro area
0.0
0.5
1.0
1.5
2.0
0.0
0.5
1.0
1.5
2.0
-3 -2 -1 0 1 2 3 4 5
200720082009
201020112012
x-axis: real GDP growth forecasts (percentage change per annum)
b) United States
0.0
0.5
1.0
1.5
2.0
0.0
0.5
1.0
1.5
2.0
-3 -2 -1 0 1 2 3 4 5
Sources: Consensus Economics and ECB calculations.Notes: Data refer to forecasts as of October for real GDP growth in the following year. For example, the line for 2007 shows forecast data as of October 2007 for the growth of real GDP in 2008.

14ECBFinancial Stability ReviewDecember 20121414
albeit at a less brisk pace than envisaged at the time of the June 2012 FSR. At the same time, probability distributions derived from the ECB Survey of Professional Forecasters for one-year-ahead forecasts imply a largely unchanged probability with respect to adverse growth scenarios, as well as a slight decrease in the uncertainty surrounding individual forecasts and a reduced heterogeneity of the views of individual forecasters (see Chart 1.2).
While the euro area outlook remains subdued in comparison with other economic regions, notably emerging market economies, cross-country heterogeneity continues to characterise both economic developments and the outlook for economic growth within the euro area. Private sector forecasts for 2013 range from 1.0% in Finland and Ireland to -3.8% in Greece, with a signifi cant downside skew accompanying the weak aggregate outlook for the euro area as a whole (see Chart 1.3). The underlying reasons for the divergence within the euro area continue to be found in ongoing fi scal adjustment, structural reforms and – in particular – an in-depth revamping of the fi nancial sector in several countries with the main aim of repairing balance sheets, strengthening competitiveness and putting economic growth on a broader and sounder footing.
Ultimately, ongoing adjustment – supported in the near term by the standard and non-standard monetary policy measures taken by the Eurosystem – should pave the way for re-invigorated and sustainable economic expansion, but the path to economic recovery in the euro area remains fragile, with risks skewed to the downside amid persistently high uncertainty. Over the medium term, several factors are expected to weigh on the underlying euro area growth momentum, including risks related to a possible re-intensifi cation of the euro area sovereign debt crisis and its impact on
Substantial cross-country heterogeneity
within the euro area prevails
Considerable downside risks
to the economic outlook remain…
chart 1.2 uncertainty and heterogeneity surrounding one-year-ahead real gDP forecasts for the euro area(Q1 2005 – Q4 2012)
0.0
0.2
0.4
0.6
0.8
1.0
1.2
1.4
0.0
0.2
0.4
0.6
0.8
1.0
1.2
1.4
2005 2006 2007 2008 2009 2010 2011 2012
uncertainty (standard deviation of aggregateprobability distribution)disagreement (standard deviation of point forecasts)probability of growth below 0%
Sources: ECB Survey of Professional Forecasters and ECB calculations.Note: The scale of the downward revision of uncertainty in the fi rst quarter of 2009 resulted in outcomes of probability distributions for one-year-ahead forecasts located mainly in the lowest, open-ended intervals; thus, the value for the fi rst quarter of 2009 is an underestimation of uncertainty for that quarter.
chart 1.3 evolution of real gDP growth forecasts for 2013
(Jan. 2012 – Nov. 2012; percentage change per annum)
-4
-2-10123456789
-4-3-3
-2-10123456789
Jan. Feb. Mar. Apr. May June July Aug. Sep. Oct. Nov.2012
euro area
United StatesUnited Kingdom
ChinaIndia
BrazilRussia
Source: Consensus Economics.Note: The chart shows the minimum, maximum and interquartile distribution across the euro area countries surveyed by Consensus Economics (Belgium, Germany, Ireland, Greece, Spain, France, Italy, the Netherlands, Austria, Portugal and Finland).

15ECB
Financial Stability ReviewDecember 2012 15
i macrO r isks
15
sovereign and bank funding conditions, implementation risks for agreed policy measures at the national and EU levels, the ongoing process of balance sheet adjustment in the fi nancial and non-fi nancial sectors (including the public sector), the high level of unemployment and lower foreign demand as a result of the global economic slowdown. Along this path towards a recovery, the continued pursuit of stability-oriented macroeconomic policies has a clear role to play in restoring fi nancial market, business and consumer confi dence. On this note, alongside the three-year LTROs conducted at the turn of 2011-12, the ECB’s programme for Outright Monetary Transactions (OMTs), which was introduced in September, is an important step with a view to removing tail risk in the euro area.
Weak economic prospects and uncertainty regarding the duration and severity of the downturn pose several risks to the euro area fi nancial sector. In particular, a weakened macro-fi nancial environment may result in further adverse effects on banks’ credit risk, which could have a negative impact on bank profi tability and capitalisation. Particularly vulnerable are fi nancial sectors that have low levels of profi tability and low non-performing loan coverage ratios, that operate in countries where the debt-servicing capacity of the non-fi nancial sector is impaired as a result of a high degree of leverage or an elevated level of unemployment, or that face the need for adequate provisioning for commercial and/or residential property loan portfolios. At the same time, a lasting divergence of growth prospects across individual euro area countries may also add to a further fragmentation of euro area funding markets. Should these developments become more structural in character, ineffi cient or insuffi cient fi nancial intermediation could seriously harm growth prospects.
Mirroring the above developments in the euro area, the growth of the global economy has lost some momentum since the fi nalisation of the June 2012 FSR. The declining pace of global growth, while widespread across regions, was relatively more pronounced in the euro area – a development not dissimilar to the decoupling seen in the middle of the past decade (see Chart 1.4). In advanced economies, the fall in growth momentum has been due to a combination of ongoing deleveraging in both the private and the public sector, subdued private sector sentiment and continued adjustment in the labour and housing markets. In emerging economies, by contrast, economic activity has moderated on account of both domestic factors, including past policy tightening, and weaker external demand, not least from the euro area.
While global economic activity is expected to pick up over the medium term, bolstered by improving fi nancial conditions and by supportive monetary policy action undertaken by central banks in major advanced and emerging economies, the recovery may be weaker than previously anticipated. In fact, the global economy is marked by considerable fragilities and the growth outlook remains surrounded by a high degree of uncertainty, with risks tilted to the downside. The key risks emanating from the external environment relate to fi scal imbalances
... with related risks to fi nancial stability
Global economy loses momentum…
chart 1.4 business sentiment: global Pmi composite output
(Jan. 2005 – Oct. 2012; diffusion index; seasonally-adjusted)
35
40
45
50
55
60
65
35
40
45
50
55
60
65
2005 2006 2007 2008 2009 2010 2011 2012
euro areaglobal excluding euro area
Source: Markit.

16ECBFinancial Stability ReviewDecember 20121616
in several advanced economies and to a possibly stronger than expected slowdown in global trade, with lower demand from advanced economies possibly having stronger adverse spillover effects on emerging market economies than currently envisaged. At the same time, a high degree of economic policy uncertainty – visible both in the United States and in the euro area (see Chart 1.5) – may continue to weigh on business and consumer sentiment, and could – via lower spending on investment and consumption, as well as the lack of and a higher cost of funding – translate into slower global growth.
Global real and fi nancial imbalances have continued to persist since the fi nalisation of the previous FSR in June 2012. While structural factors continue to play a role, more recently, oil price developments have had a notable effect on the confi guration of global current account imbalances. Uncertainty remains high across global fi nancial markets more broadly, with continued investor appetite for safe havens, as well as a rebalancing of portfolios towards safer assets. Some promising recent signs of improved market confi dence suggest a potential for some nascent unwinding of safe-haven fl ows, with a notable increase in bond fl ows to countries rated lower than AAA (see Box 1). Current account imbalances, defi ned as the sum total of absolute defi cits and surpluses among the largest global economies, are nonetheless expected to remain at around 2% of world GDP in the period 2012-16 (see Chart S.1.8). The United States and China are likely to remain the economies with the largest imbalances. The IMF expects the US current account defi cit to remain at about 3% of GDP until 2016 (see Chart 1.6 and Chart S.1.7), but concerns about the sustainability of external adjustments over the medium-to-long term remain in some other countries as well. In fact, the rebalancing of China’s economic growth toward domestic consumption is still under way, but may be hampered by the recent halt in the nominal appreciation of the renminbi against the US dollar. As a result of the euro area sovereign debt crisis and the related fi scal and structural adjustments, particularly (but not only), in
… while global imbalances persist
chart 1.5 us and european economic policy uncertainty index
(Jan. 2005 – Oct. 2012; index: 2006 = 100)
0
50
100
150
200
250
300
350
400
0
50
100
150
200
250
300
350
400
2005 2006 2007 2008 2009 2010 2011 2012
United StatesEurope
Sources: Scott Baker, Nicholas Bloom and Steven J. Davis at www.PolicyUncertainty.com.
chart 1.6 current account balances of selected economies
(2005 – 2016; percentage of US GDP)
-10
-8
-6
-4
-2
0
2
4
6
8
10
-10
-8
-6
-4
-2
0
2
4
6
8
10
other Asia
China
oil-exporting countriesJapan
United States
euro area
2005 2007 2009 2011 2013 2015
Sources: IMF World Economic Outlook (October 2012) and ECB calculations.Note: 2012-2016 projected data.

17ECB
Financial Stability ReviewDecember 2012 17
i macrO r isks
17
countries under stress, the current account balance for the euro area as a whole is expected to turn into a surplus in 2012, and to remain in positive territory throughout the forecasting horizon, even though fairly marked differences prevail at the national level.
In line with oil price developments over the past few years, oil-exporting countries have re-emerged as the largest contributors to global imbalances since 2011. While the current account surplus of China declined from 2.9% of US GDP in 2008 to 1.3% in 2011, the overall surplus of the oil-exporting countries increased after a temporary drop in 2009, to 4.3% of US GDP – a level close to the pre-crisis peak (see Chart 1.6). The recycling of oil-exporting countries’ export revenues via the trade channel has also returned to the pre-crisis level, with around 55% of export revenues now being recycled as imports, and around 45% being cumulated as fi nancial assets, primarily in the United States and Europe. The fact that such a large proportion of the oil revenues is accumulated as excess savings abroad implies that oil price developments have a signifi cant impact on global imbalances – not least given ongoing moves toward economic diversifi cation, as well as increased exchange rate fl exibility.
Commodity prices, in particular oil prices, have risen over the past few months, partially offsetting the declines that were observed in the second quarter of 2012, a development that may give rise to downside risks to global economic activity, and may also contribute to preserving global imbalances. These increases can be attributed mainly to a lower oil supply and to market concerns regarding supply-side disruptions in some oil-producing countries. Although, demand-side pressures are currently low, future market tightness is expected as the level of oil demand is projected by the International Energy Agency to reach record levels by the end of 2012, with the strong growth of oil demand in emerging economies over the past few decades continuously adding to the level of oil demanded. At the same time, OPEC’s spare capacity is well below the levels reached in the period 2009-11 (see Chart 1.7), so that small disruptions to the supply may already have a relatively signifi cant impact on oil prices. Accordingly, abrupt and disorderly disruptions to the oil supply, such as those related to geopolitical tensions, could reinforce fi nancial stress in affected unhedged entities, and thus remain a source of concern also from a fi nancial stability point of view.
In the United States, economic growth is expected to recover on the back of a gradual strengthening of domestic demand, with notable signs of a tentative recovery in the construction sector and in housing markets, despite still elevated mortgage delinquency rates and relatively tight lending conditions. Support for an economic recovery should also stem from the Federal Reserve’s purchases of mortgage-backed securities in an amount of USD 40 billion per month. Despite these positive signs, headwinds persist on several fronts, including a combination of persistent unemployment and lower participation rates, weak income growth and the deleveraging pressures associated with
High and increasing oil prices may pose downside risks to an economic recovery
Fiscal risks may pose a challenge to economic recovery in the United States
chart 1.7 Oil prices and spare OPec oil production capacity
(Jan. 2005 – Nov. 2012)
0
20
40
60
80
100
120
140
160
0
1
2
3
4
5
6
7
8
2005 2006 2007 2008 2009 2010 2011 2012
spare OPEC oil production capacity (million barrels per day; left-hand scale)Brent oil price (USD per barrel; right-hand scale)
Source: Bloomberg. Notes: Monthly data: the last observation for spare OPEC production capacity is July 2012.

18ECBFinancial Stability ReviewDecember 20121818
elevated household debt – albeit contained by very low interest rates. A key risk relates to policy uncertainty – specifi cally the so-called “fi scal cliff” stemming from the simultaneous expiration of a number of previously enacted tax cuts in combination with automatic reductions in public spending at the start of 2013. All in all, the measures subsumed under the fi scal cliff amount to over 4% of GDP and, therefore, have the potential to imply either a signifi cant fi scal drag next year or a concomitant increase in the budget defi cit. There remains ambiguity with respect to near-term plans to tackle these issues. Uncertainty regarding a possible reaching of the debt ceiling, coupled with a lack of clarity on medium-term fi scal consolidation plans, contributes to a relatively uncertain policy environment with a potentially adverse impact on consumer and business confi dence. While the recently held Presidential elections may now help to clarify policies further, economic policy uncertainty generally remains at elevated levels (see Chart 1.5).
Following a strong recovery in Japan in the fi rst half of 2012, the economy contracted in the third quarter of 2012, amid a slowdown in global activity and weak domestic demand. A modest economic recovery is expected in the fi rst half of 2013, partly driven by external demand. High fi scal imbalances and public debt continue to pose a serious risk to both fi scal and fi nancial sustainability. In this respect, the recent approval of a gradual consumption tax increase from 5% to 10% by 2015 was an important step towards fi scal consolidation. However, further efforts are probably needed to ensure fi scal sustainability in the medium term.
Despite improving fi nancial conditions, the economic outlook has deteriorated further in most EU countries outside the euro area over the last six months. The weakness of economic activity in the euro area, in particular, had a clear impact on those economies in which growth was driven by external demand. Available forecasts suggest that economic activity in these countries is likely to remain modest in 2013 (see Chart 1.8), mirroring developments in the euro area, given strong fi nancial and trade linkages. Risks surrounding this scenario are broadly balanced. The key vulnerabilities in non-euro area EU Member States continue to be associated with a high level of private sector indebtedness (Bulgaria, Denmark, Latvia, Hungary, Sweden and the United Kingdom), a potential correction of historically elevated house prices (mainly in Sweden, but – despite some past correction – also in Denmark and the United Kingdom), a potentially disruptive process of deleveraging by foreign banks (central and eastern European Member States) and currency mismatches as a result of foreign currency lending (central and eastern European Member States).
More specifi cally, in the United Kingdom, output growth is likely to remain subdued in the near term. Apart from external factors, economic activity is expected to be restrained also by domestic factors such as ongoing fi scal consolidation and tight credit conditions, as well as by the high level of household indebtedness and related low consumer confi dence. At the same time, the stimulus from the Bank of
Weak economic growth in Japan
coupled with risks to fi scal sustainability
Weakening macroeconomic
outlook also for EU countries outside
the euro area
Economic momentum is also
fading in the United Kingdom
chart 1.8 evolution of real gDP growth projections for 2013 in non-euro area eu countries(Jan. 2012 – Nov. 2012; percentage change per annum)
0.0
0.5
1.0
1.5
2.0
2.5
3.0
3.5
0.0
0.5
1.0
1.5
2.0
2.5
3.0
3.5
Jan. Feb. Mar. Apr. May June July Aug. Sep. Oct.
SwedenUnited Kingdom
PolandRomania
Hungary
Czech RepublicDenmark
euro area
2012
Source: Consensus Economics.

19ECB
Financial Stability ReviewDecember 2012 19
i macrO r isks
19
England’s asset purchase programme and the Funding for Lending Scheme could spur a modest recovery. The latter, a scheme involving a total amount of GBP 80 billion over a period of 18 months that was announced in July 2012, is aimed at increasing bank lending by providing access to funding for banks and building societies at rates below the money market rates. Moreover, in Sweden and Denmark, the growth outlook has weakened, following a relatively strong performance in Sweden in previous quarters, where households and banks also remain vulnerable to potential corrections in house prices.
With regard to EU countries in central and eastern Europe, declining interest rates and credit default swap spreads, as well as strengthening currencies vis-à-vis the euro, suggest that fi nancial conditions improved in most countries, supported by positive growth differentials against the euro area and improved investor sentiment. The risk of disruptive withdrawals of funding by foreign banks active in the region remains a concern, although the pace of deleveraging seems to have been gradual so far. After declining again in late 2011, the external positions vis-à-vis the region of banks reporting to the Bank for International Settlements (BIS) seem to have stabilised in the fi rst quarter of 2012, before declining again in the second quarter (see Chart 1.9). The process of deleveraging in the region has differed from country to country, ranging from a signifi cant reduction of the roll-over rate of parent banks in Hungary to a very limited impact in the Czech Republic or Poland. The deleveraging process has also affected the Baltic countries relatively strongly, although that seems mainly to have been associated with declining demand for credit in the wake of the relatively sharp downturns in economic activity in these countries. These differences across countries confi rm earlier evidence that the impact of deleveraging on output may be more pronounced in countries that had to unwind major macroeconomic imbalances, or in countries where economic policies undermined investor confi dence, or in economies where banks remain heavily reliant on external funding.1
Apart from the risk of disorderly deleveraging by parent banks, currency mismatches on private sector balance sheets continue to represent a major risk to fi nancial stability in many countries in the region. While growth rates in new foreign currency-denominated loans remain subdued, a key vulnerability stems from the stock of outstanding loans in foreign currency, which continue to expose unhedged borrowers to foreign currency risk and may lead to a substantial weakening of the fi nancial condition of both the private sector in the countries concerned and euro area banking groups with substantial exposures to such borrowers. In countries where such risks have already materialised to some extent, non-performing loans have increased and may compromise the loan quality further in the case of further downward exchange rate pressures.
1 For more details, see ECB, “EU bank deleveraging – driving forces and strategies”, Financial Stability Review, June 2012.
Deleveraging by foreign banks in central and eastern Europe has been orderly so far…
… but foreign exchange risk linked to the stock of foreign currency loans remains
chart 1.9 bis reporting banks’ foreign claims on selected central and eastern european countries(Q1 2005 – Q2 2012; Q2 2008 = 100)
0
10
20
30
40
50
60
70
80
90
100
110
0
10
20
30
40
50
60
70
80
90
100
110
2005 2006 2007 2008 2009 2010 2011 2012
HungaryPolandRomania
Czech RepublicBulgaria
LithuaniaLatvia
Source: BIS.

20ECBFinancial Stability ReviewDecember 20122020
As regards major emerging economies, there were signs of moderating activity, following years of strong expansion, notably in the BRIC countries (Brazil, Russia, India and China). In particular, economic growth in China has moderated as part of the global slowdown and a less-accommodative policy stance aimed at reducing the overhang from the stimulus package of 2008-09. In addition, numerous downside risks persist, including a further weakening of the external environment, declining confidence in manufacturing industries and an increase in non-performing loans. However, data releases over the last few months confirm that growth momentum has again become positive and growth is likely to pick up, in year-on-year terms, going forward. Similarly, in India, GDP growth decelerated sharply over the last few quarters, as a result of the deterioration of the external environment and the lagged effects of monetary tightening. Looking ahead, the lagged positive impact of the depreciation of the domestic currency on exports, the easing of monetary policy, along with fiscal reform, and a rebound in investment are expected to support growth. At the same time, downside risks remain, given the persistently uncertain global macro-financial environment and fiscal challenges. Russia’s economy has thus far proved to be fairly resilient to the weaker global environment, on account of favourable oil price developments and fiscal stimuli. Nevertheless, lower private consumption as a result of accelerating inflation and the related tightening of monetary policy is expected to weigh on the country’s growth momentum in 2013. As regards Brazil, a significant tightening of monetary and fiscal policy in 2011 and weak external demand led to a deceleration of growth in 2012. Looking ahead, the economy is expected to recover on the back of a gradual improvement in the global outlook and the recent monetary easing. However, the economy will continue to face some structural headwinds, including weak investment growth, infrastructure bottlenecks and low labour productivity growth.
Monetary easing in emerging economies
supports economic recovery
box 1
recent trenDs in glObal POrtfOliO flOws amiD sOvereign tensiOns in tHe eurO area
The rise of global tensions on account of the intensification of the sovereign debt crisis in the euro area since mid-2011 has led to distortions in capital flows and to a rebalancing of portfolio investment – both across asset classes and across borders. One aspect of these disrupted flows has been a hunt for safe and liquid assets in the context of heightened (and protracted) uncertainty. Indeed, an analysis of balance of payments data, complemented by high-frequency data on mutual fund portfolio decisions, suggests significant safe-haven flows.
Geographic flows have been severely affected. Within the euro area, there is clear evidence of flows toward highly rated euro area countries. At the global level, safe-haven flows suggest outflows from the euro area to the benefit of other advanced economies, along with rather volatile emerging market flows (see Charts A and B). US investors have exhibited particularly pronounced risk aversion, persistently repatriating foreign investments from all around the world, including other advanced economies, between November 2011 and early 2012. Some of the home bias inherent in these flows suggests that they have perceived their own market as the ultimate safe haven for piling up precautionary liquidity buffers in times of heightened financial market stress (see Chart A).

21ECB
Financial Stability ReviewDecember 2012 21
i macrO r isks
21
The manifestation of risk aversion that is revealed in geographic fl ows has been mirrored by asset class allocations. International investors have been reallocating investments in riskier assets, such as equities or lower-rated debt securities, to assets they perceive to be safer. Cumulating international fl ows into equity and bonds (see Chart C), as well as those into bonds, broken down by rating class (see Chart D), suggests persistent safe-haven fl ows that have been interrupted by policy interventions. The combination of infl ows to AAA-rated countries and outfl ows from lower-rated countries was particularly strong between September and December 2011 (see Chart D). Since January 2012, fl ows into AAA-countries have continued, but fl ows into lower-rated countries resumed in the aftermath of the Eurosystem’s three-year LTROs, subject to volatility, however, and with short-lived periods of outfl ows in spring this year. Since August 2012, expectations concerning market interventions by the ECB and the unveiling of the OMT programme in early September 2012 have boosted fl ows into lower-rated countries.
chart a us investors’ portfolio investment assets, by region
(July 2011 – Sep. 2012; USD billion; three-month moving average)
-15
-12
-9
-6
-3
0
3
6
9
12
15
-15
-12
-9
-6
-3
0
3
6
9
12
15
July Sep. Nov. Jan. Mar. May July Sep.2011 2012
emerging market economies
other advanced economieseuro area countries under stress
other euro area countries
Source: US International Capital System.
chart b Japanese investors’ portfolio investment assets, by region
(July 2011 – Sep. 2012; JPY trillion; three-month moving average)
-1.0
-0.5
0.0
0.5
1.0
1.5
2.0
2.5
-1.0
-0.5
0.0
0.5
1.0
1.5
2.0
2.5
July Sep. Nov. Jan. Mar. May July Sep.2011 2012
emerging market economies
other advanced economieseuro area countries under stress
other euro area countries
Source: Haver.
chart c cumulative gross flows into equity and bond funds
(June 2011 – Nov. 2012; index: June 2011 = 100)
90
95
100
105
110
115
120
90
95
100
105
110
115
120
June Aug. Oct. Dec. Feb. Apr. June Aug. Oct.2011 2012
bond fundsequity funds
Source: EPFR.Notes: EPFR data on fl ows refl ect mainly investment decisions by funds domiciled in advanced economies, especially in the United States. As a consequence, EPFR fl ows can be considered gross fl ows from a balance of payments point of view. Cumulated infl ows net of valuation effects are presented in the form of an index. For example, an increase in the index from 100 to 102 indicates net cumulated infl ows equivalent to 2% of the assets invested in the region.

22ECBFinancial Stability ReviewDecember 20122222
These aggregate developments in fl ows between geographical regions and across asset classes conceal certain differences. Clearly, portfolio fl ows in the euro area suggest an increased intra-regional fragmentation amid prevailing sovereign tensions. However, withdrawals of capital from the euro area by foreign investors have, on aggregate, remained limited. Instead, foreign investors have responded to elevated levels of fi nancial stress by rebalancing their euro area securities portfolios both across instruments and across euro area countries. More specifi cally, foreign global investors have shifted portfolio investment away from euro area countries under stress to other euro area countries. Viewed in terms of instruments, foreign investors have sold debt instruments (bonds and money market instruments) and reinvested part of the proceeds in euro area equity markets (see Chart E). Residents in higher-rated euro area countries have also been rebalancing their portfolios, moving away from securities issued by sovereigns and companies in countries under stress towards other euro area securities. As a result, in contrast to the euro area aggregate, portfolio investment outfl ows from the euro area countries under stress increased sharply in the fi rst half of 2012. However, these outfl ows moderated substantially in the third quarter of 2012.
Finally, looking at funding fl ows to euro area countries under stress, both foreign and other euro area investors have reduced their short-term exposures to these countries’ banking sectors steadily over the last two and a half years (see Chart F). Since December 2011, however, these capital outfl ows from banking sectors in countries under stress have refl ected withdrawals of deposits by other euro area residents. Given the intensifi cation of the euro area sovereign debt crisis, foreign investors have also withdrawn short-term funding (mainly deposits) from the higher-rated euro area banking sector during the summer months of 2012, following a period of marked capital infl ows in the fi rst months of the year.
chart e euro area portfolio investment liability flows vis-à-vis non-residents, by instrument(Jan. 2010 – Sep. 2012; EUR billions; three-month moving average)
-75
-50
-25
0
25
50
75
-75
-50
-25
0
25
50
75
2010 2011 2012
money market instrumentsequitybondstotal liabilities
Source: ECB.
chart D cumulative gross flows into bond funds, by rating class
(June 2011 – Nov. 2012; index: June 2011 = 100)
95
100
105
110
115
120
125
95
100
105
110
115
120
125
June Aug. Oct. Dec. Feb. Apr. June Aug. Oct.2011 2012
AAAAA- to AA+below AA-
Source: EPFR.

23ECB
Financial Stability ReviewDecember 2012 23
i macrO r isks
23
Ultimately, these data clearly reveal that profound dislocations have occurred in international capital fl ows as a result of the sovereign debt strains in the euro area over the last few years. These dislocations were often based on, and provided evidence of, unfounded fears regarding the reversibility of the euro. The announcement of the OMTs helped to reduce risk premia related to the euro area sovereign debt crisis, thereby inducing investors to rebalance their portfolios in favour of securities issued by euro area countries under stress. From one perspective, the unwinding of dislocated capital fl ows should be the natural outcome of an eventual resolution of the fi nancial crisis. A benign unwinding of these fl ows, however, is only one of several possible paths: the possibility of sudden stops or reversals of capital fl ows remains a risk. Indeed, a rapid and disorderly correction could occur upon a change in either risk perceptions or the perceived liquidity of current safe-haven fl ows.
chart f euro area mfis’ short-term external funding
(Jan. 2010 – Sep. 2012; EUR billions; three-month moving average)
-100
-50
0
50
100
-100
-50
0
50
100
2010 2011 2012
other euro area countries: intra-euro area fundingother euro area countries: funding from abroadeuro area countries under stress: intra-euro area fundingeuro area countries under stress: funding from abroad
Source: ECB.Notes: Short-term funding includes deposits and debt securities with a maturity of up to two years. Short-term intra-euro area funding includes only deposits.


25ECB
Financial Stability ReviewDecember 2012
2 creDit risksAmid a deteriorated economic environment and continued – albeit diminishing – financial market tensions, credit risks have increased throughout different economic sectors alongside increasing heterogeneity in country developments within the euro area. Despite some improvement in market sentiment, newly announced fiscal consolidation measures in several euro area countries and major policy decisions taken at the EU level to further strengthen Economic and Monetary Union, sovereign stress remains elevated. This stems from concerns regarding fiscal slippage arising from a combination of implementation risks and weaker economic growth, financial sector vulnerabilities and contagion fears. Strained public finances have not only stemmed from the evolution of fundamentals, but also from the impact of ongoing tensions in government bond markets on sovereign financing conditions, notwithstanding resolute ECB action addressing tail risks for the euro area. The fiscal outlook remains fragile and requires sustained effort and political commitment with regard to both fiscal consolidation and structural reforms.
Risks in the non-financial private sector, while clearly less pronounced than in the public sector in this environment of sovereign strains, have also picked up slightly on the back of the general worsening in macroeconomic conditions. While currently not a predominant source of risk for financial stability for the euro area, risks to households’ balance sheets have nonetheless increased given weak labour market conditions. The financial condition of households remains highly heterogeneous across different euro area countries. Alongside the deteriorated economic outlook, risks predominantly relate to possible downward corrections in housing markets in some euro area countries. Indeed, financial stability risks arising from euro area property markets have remained elevated. Significant segmentation in both residential and commercial property markets remains, manifest in ongoing downward adjustments in some countries contrasting with persisting overvaluation in others. A potential sharp correction in property values remains a risk.
Fragilities in the euro area non-financial corporate sector continue to persist given elevated levels of indebtedness and tightened access to bank credit. The improvements seen in the financial condition of euro area corporates at the turn of 2011-2012 proved short-lived and, since then, credit risks have increased on the back of tighter financing conditions and weak economic activity. Heightened credit risk is accompanied by continued divergence between small and medium-sized enterprises (SMEs), which remain more vulnerable to bank deleveraging pressures, and large corporations with access to affordable market financing – although there is limited disintermediation potential in countries with small domestic markets or those under stress.
2.1 weak ecOnOmic grOwtH PrOsPects anD financial sectOr vulnerabilities weigH On tHe gOvernment sectOr
Public finances have remained under stress in vulnerable euro area countries. Notwithstanding declining deficits and the announcement of additional reform measures, factors such as high and further increasing public debt levels in most countries (see Chart 2.1), a weaker economic growth outlook, as well as, in some cases, delays in the implementation of fiscal consolidation and structural reforms have continued to feed market concerns with respect to fiscal fundamentals. Moreover, continued financial sector vulnerabilities and contagion fears, as well as further sovereign rating downgrades by major rating agencies, have added to heightened sovereign risk perceptions.
The 2012 aggregate fiscal outlook for the euro area has deteriorated slightly compared with the forecast available at the time of the June FSR. Nonetheless, compared with 2011, the general government deficit is projected by the European Commission to decline by 0.8 percentage point of GDP to 3.3%. Moreover, on account of additional measures announced in the context of next year’s
Sovereign stress in the euro area has remained high, with a slight deterioration of the fiscal outlook in 2012…

26ECBFinancial Stability ReviewDecember 20122626
budgets, the outlook for 2013 has improved since the last FSR. The aggregate defi cit is forecast to continue to decline, to 2.6% in 2013 and 2.5% in 2014.
At the country level, in ten out of the 17 euro area countries, the 2012 fi scal position is projected to deteriorate – though in some countries only marginally – compared with the forecast available at the time of the June FSR. The 2013 defi cit outlook worsened in only seven countries. The projected fi scal worsening is pronounced in countries exhibiting stronger than initially expected macroeconomic deterioration and/or where consolidation measures are still awaiting implementation or lacking concrete substance.
An examination of the factors affecting public debt dynamics suggests that driving forces continue to differ strongly across countries (see Chart 2.2) – with fi ve main areas of vulnerability. First, the worst interest rate-growth differentials in 2012 correspond closely with those countries under
… and large cross-country differences…
… with different driving forces
across countries
chart 2.1 Public finances in selected euro area countries
(2007 – 2014; percentage of GDP)
FR
DEPT
IE
ITGR
ES
EEFI
SI
-33
-30
-27
-24
-21
-18
-15
-12
-9
-6
-3
0
3
6
-33
-30
-27
-24
-21
-18
-15
-12
-9
-6
-3
0
3
6
0 30 60 90 120 150 180 210
x-axis: public debty-axis: budget balance
Source: European Commission’s autumn 2012 economic forecast. Note: Projections for 2012-2014.
chart 2.2 snapshot of debt-related vulnerabilities
(2012 unless otherwise indicated)
BEDE
EE
IE
GR
ES
FR
IT
CYLU
MT
NL
AT
PT
SI
SK
FI
EA
share of short-term securities (rs)
interest rate-growth differential (rs)
primary deficit (rs)
debt impact of support to financial sector (2008-12) (rs)
debt-to-GDP ratio in excess of 60%
increase in cost of ageing (2010-2060) (rs)
Sources: European Commission’s autumn 2012 economic forecast, ESCB and 2012 EC/EFC Ageing Report.Notes: Some variables have been rescaled (indicated with rs). The centre of the cobweb is at -100 and the external edge at +200. Explanation of variables: share of short-term securities: share of short-term securities maturing within one year in total outstanding government securities (percentage, as at end-September 2012); primary defi cit and debt-to-GDP ratio in excess of 60%: for general consolidated government, as a percentage of GDP; interest rate-growth differential: implicit interest rate on the stock of government debt minus GDP growth (in percentage points); debt impact of support to fi nancial sector: the impact of government support to the domestic fi nancial sector granted between 2008 and the end of September 2012 on government debt (percentage of GDP); increase in cost of ageing: projected increase in ageing-related public expenditure (percentage points of GDP, 2010-2060) according to the 2012 Ageing Report.

27ECB
Financial Stability ReviewDecember 2012 27
2 creDit r isks
27
strong market pressure – notably Greece, followed by Portugal, Italy, Cyprus, Spain and Slovenia. Second, the highest primary deficits are projected for 2012 in Spain, Ireland and Slovakia, while Italy has the most favourable primary balance in the euro area (with only three other countries forecast to record a budget surplus after accounting for interest spending). Third, a particularly vulnerable maturity structure of government debt securities appears to be present in Cyprus. Fourth, fiscal positions in Ireland, Greece, Germany, Cyprus, Portugal and the Benelux countries have been so far the most affected by the support granted to their financial sector. For Greece, the sizeable impact as of 2012 is related to the bank recapitalisation and resolution package under the second EU/IMF adjustment programme. Fifth, longer-run fiscal challenges – which if left unaddressed would negatively affect future debt dynamics, in particular the increase in the cost of population ageing – are major for some sovereigns currently spared from market tensions, such as Belgium, Luxembourg, Malta, the Netherlands, Slovakia or Finland. Finally, high debt-to-GDP ratios – well in excess of the 60% threshold, in particular in Greece, Italy, Portugal and Ireland, but also in Belgium, France, Cyprus and Spain – compound existing vulnerabilities and have the potential to weaken the resilience of the sovereign to negative shocks.
Overall, compared with past years, notable progress is being made on reducing budgetary imbalances, as indicated by the fact that an increasing number of countries are projected to record deficits below 3% of GDP by 2013. At the same time, consolidation gaps relative to government targets under the stability programmes have arisen in several countries, also associated with a weakening economic environment. For several of these countries, these gaps pose increased risks in terms of their ability to correct excessive deficits in line with excessive deficit procedure (EDP) deadlines. In the current crisis, the initial deadlines for correcting excessive deficits already allowed for three or four years of adjustment in many countries, notably in those with more difficult macroeconomic, financial and fiscal situations. These deadlines were later modified on several occasions, giving rise to paths of excessive deficit correction of up to five to six years from the start of the consolidation period. In particular, since the last FSR, Spain and Portugal have been granted an extension of their EDP deadlines by one additional year to 2014. In most cases, the European Council justified the new deadlines with negative unexpected shocks in terms of growth developments.
The euro area public debt outlook – not only for 2012, but also for 2013 – has deteriorated slightly since the June 2012 FSR, while contingent liabilities from the financial sector continue to weigh heavily on several countries. A worsening in the interest rate-growth differential and a larger deficit-debt adjustment for 2012 – inter alia related to sovereign support for the financial sector – contribute to the higher euro area debt ratio. Moreover, “explicit” contingent liabilities from the financial sector (e.g. outstanding guarantees extended by governments to their domestic banks since 2008) – which could add to future increases in the debt path if called – vary strongly across euro area countries. The highest levels outstanding (above the euro area average) are observed in Ireland, Greece, Belgium, Portugal and Spain (see Chart 2.3).
Turning to sovereign financing needs, financial stability risks may also emanate from near-term financing needs of euro area sovereigns, in particular those under stress. In this context, average gross financing needs of euro area governments are expected to decline somewhat in 2013 given lower deficits and slightly lower redemptions. Based on available information on securities redemption as at end-September 2012 (thus excluding a part of short-term debt refinancing needs
Public debt levels remained elevated, with contingent liabilities adding to fiscal risks
Financing needs are expected to decline somewhat in 2013, but remain sizeable in some countries…

28ECBFinancial Stability ReviewDecember 20122828
in 2013), the 2013 gross fi nancing needs remain signifi cant in many euro area countries (see Chart 2.4).1
At the end of September 2012 the share of securities with a residual maturity of up to one year remained at around 21% of total outstanding debt securities in the euro area, while about one-third of outstanding debt securities will mature within two years. While the maturity structure of government debt securities differs across countries, the most vulnerable case remains Cyprus where close to 40% of outstanding debt securities mature within one year. The average residual maturity of the outstanding government securities as at end-September 2012 was 6.3 years for the euro area and ranged from 1.9 years in Cyprus to 7.8 years in Austria.2
To some extent, sovereign fi nancing needs could be mitigated through recourse to existing fi nancial assets, including currency and deposits, loans granted by the government, securities other than
1 The gross fi nancing needs for 2013 are very broad estimates consisting of redemption of government debt securities maturing in 2013 and the government defi cit (assuming no additional fi nancial operations “below the line”). The estimates are subject to the following caveats. First, they only take into account redemptions of securities, while maturing loans (e.g. from domestic banks) are not included on account of a lack of data (this may lead to underestimation). Second, some government securities do not fall under the defi nition used in the European System of Accounts 1995 (ESA 95) for general government debt (which might lead to overestimation). Third, estimates do not take account of the fact that some maturing government securities are held within the government sector. Finally, refi nancing needs corresponding to short-term debt issued after September 2012 are not refl ected in the 2013 data. The redemption values for Greece refl ect the impact of the debt exchange in the context of private sector involvement (PSI). For Cyprus, a special-purpose bond with a one-year maturity amounting to €1.88 billion, issued in June 2012 with the aim of improving the capital position of the banking sector, was excluded, since it is automatically renewed for a period of up to fi ve years unless exchanged for cash.
2 In Greece, following the PSI, the average residual maturity of government securities increased from 6.7 years at end-February 2012 to 10.6 years at end-September 2012.
… but could in some cases be
attenuated through sales of fi nancial
assets
chart 2.3 general government debt and explicit contingent liabilities from the financial sector(2012; percentage of GDP)
0102030405060708090
100110120130140150160170180
0102030405060708090100110120130140150160170180
1 Greece2 Italy3 Portugal4 Ireland5 Belgium
6 euro area7 France8 Cyprus9 Spain
10 Germany
11 Austria12 Malta13 Netherlands14 Slovenia15 Finland
16 Slovakia17 Luxembourg18 Estonia
1 2 3 4 5 6 7 8 9 10 11 12 13 14 15 16 17 18
gross debtcontingent liabilities from the financial sector
Sources: European Commission’s autumn 2012 economic forecast and ESCB.Note: Contingent liabilities refl ect guarantees and other forms of contingent support outstanding as at end-September 2012 and granted by governments to their fi nancial sector since 2008.
chart 2.4 maturing sovereign debt and projected deficit financing needs of euro area countries in 2013(data on maturing government securities as available at end-September 2012; percentage of GDP)
0
2
4
6
8
10
12
14
16
18
20
0
2
4
6
8
10
12
14
16
18
20
1 2 3 4 5 6 7 8 9 10 11 12 13 14 15 16 17 18
maturing sovereign debtgeneral government deficit
ItalySpainGreece
123
CyprusPortugal
45
Belgium6Franceeuro areaGermany
789
Ireland10
MaltaSlovakia
1112
NetherlandsSloveniaAustria
131415
LuxembourgFinland
1617
Estonia18
Sources: European Commission’s autumn 2012 economic forecast, ECB and ECB calculations.

29ECB
Financial Stability ReviewDecember 2012 29
2 creDit r isks
29
shares, shares and other equity, and other accounts receivable. At end-June 2012 the average amount of consolidated financial assets held by euro area governments stood at 38% of GDP, with some variation across countries. At the same time, the market value of consolidated government liabilities reached 99% of GDP. Accordingly, the net debt of euro area governments totalled 61% of GDP at the end of June 2012. Overall, the use of financial assets as a means of smoothing governments’ financing needs depends on their liquidity and marketability, which may arguably be lower in times of crisis. Nevertheless, government holdings of financial assets are relevant for assessing sovereign debt sustainability over the medium term, when a larger part of financial assets could potentially be mobilised.
The severity of the sovereign debt crisis and its persistence have underscored the need for improved fiscal sustainability and governance to restore market confidence in the credibility of euro area public finances. Looking forward, the medium-term fiscal outlook for the euro area should benefit from two factors. First, further fiscal adjustment and more clarity regarding the implementation of announced measures is expected following the approval of 2013 budgets and medium-term fiscal strategies in all euro area countries. The already announced additional consolidation measures, combined with structural reforms and efforts to further strengthen fiscal rules and institutions, should contribute to improving fiscal fundamentals.
Second, further steps in the announced policy reforms at the EU level have led to progress in strengthening the foundations for stable Economic and Monetary Union. In this respect, reinforcing the fiscal governance remains a key priority at the EU level, with several initiatives now requiring timely enforcement. Most importantly, the Treaty on Stability, Coordination and Governance needs to be ratified in the remaining signatory countries and, above all, strictly followed in the budgetary planning. Discussions are also currently ongoing to reach a final agreement on the “two-pack”, which provides for an improvement in budgetary plan monitoring and for an enhanced surveillance of vulnerable euro area countries. In particular, the proposal to require budgetary plans to be grounded on macroeconomic and fiscal projections undertaken by independent councils will enhance budgetary plans’ reliability and support their monitoring.
Major decisions were taken at the EU summit of 28-29 June 2012. These included the establishment of a single euro area banking supervisory mechanism; a more flexible and efficient use of the European Financial Stability Facility (EFSF)/European Stability Mechanism (ESM), and the possibility of direct banking sector assistance. In addition, the Presidents of the European Council, the European Commission, the Eurogroup and the ECB submitted a first report to the EU Heads of State or Government, outlining the four building blocks of a deeper union: banking union, fiscal union, economic union and political union. Further steps towards a fiscal union, to the extent that it implies significant risk-sharing, would require commensurate steps to transfer sovereignty from Member States to the euro area level.
As regards the euro area institutional firewalls, after some initial uncertainty, the adoption of the Treaty establishing the European Stability Mechanism adds another crucial element, alongside the EFSF, to the toolkit for addressing systemic crises that threaten financial stability in the euro area. While creating important firewalls for euro area sovereigns, the EFSF and ESM are subject to a trade-off between the capacity to address financial contagion, on the one hand, and the creation of distorting fiscal incentives and the need for the contributing member countries to manage the resulting contingent liabilities, on the other. To reduce fiscal distortions stemming from moral hazard, only euro area countries that have ratified the “fiscal compact” will be eligible for financial assistance under the ESM as of March 2013. Strong conditionality is also a feature of the ECB’s
The fiscal outlook should improve, with advances in budget planning for 2013 and beyond…
… and major policy initiatives at the European level…

30ECBFinancial Stability ReviewDecember 20123030
non-standard monetary policy measures such as Outright Monetary Transactions (OMTs) which, in safeguarding the monetary policy transmission mechanism, complete a fully effective backstop mechanism intended to remove tail risk in the euro area.
Despite policy action taken at both the national and the euro area levels to improve fundamentals and strengthen market confi dence, threats to fi scal fundamentals that could cause a renewed fl aring-up of the sovereign debt crisis remain. This most notably relates to implementation risks, which need to be addressed through an effective execution of the already announced consolidation plans and detailed specifi cation of outstanding fi scal measures and structural reforms. Furthermore, the deterioration of the macroeconomic environment raises additional challenges for the successful implementation of the necessary fi scal adjustments. Nonetheless, backtracking on policy action promises made could weaken market confi dence, reignite contagion fears and thus jeopardise the progress made so far.
2.2 HOuseHOlD sectOr cOnDitiOns remain HeterOgeneOus acrOss cOuntries
Income risks faced by households have increased as a result of weakening labour market conditions in a deteriorating macroeconomic growth environment. Unemployment rates continued to increase in many euro area countries, in some cases from already high levels (see Chart 2.5). Consequently, average euro area unemployment reached the highest level on record in the autumn of 2012. Given continued weak economic prospects, unemployment rates are expected to remain high and even to increase further in some countries until a more broad-based and inclusive economic recovery sets in.
Adverse labour market conditions appear not to have negatively affected, on aggregate, the debt servicing capability of the euro area household sector so far, as suggested by broadly stable loan write-off rates since mid-2012 (see Chart 2.5). Thus, the negative correlation seen between unemployment and write-off rates in the previous quarters prevails – a development which most
likely also refl ects forbearance by banks with respect to their problematic loans. Alongside weak economic prospects, households’ relatively weak real income position for the euro area as a whole (see Chart 2.6) will most likely contribute to a moderate increase in write-off rates going forward.
The level of indebtedness of euro area households remained broadly stable at around 66% of GDP throughout the second quarter of 2012. At the same time, the dispersion of country-specifi c developments underlying this aggregate euro area development widened on the back of sharp GDP declines in countries under stress, with household indebtedness at the country level ranging from 28% of GDP in Slovakia to about 137% of GDP in Cyprus. Relatively subdued lending to the euro area household sector contributed to the broadly stable household indebtedness at the euro area level, with household lending by monetary fi nancial institutions (MFIs) declining year on
… but challenges remain
Weak labour market conditions…
… may translate into increasing write-off rates
Households’ indebtedness
remained broadly stable
given continued weak household
borrowing…
chart 2.5 write-off rates on mfi loans to households and unemployment rates in the euro area(Jan. 2007 – Sep. 2012; percentages)
0.16
0.20
0.24
0.28
0.32
0.36
0.40
0.44
0.48
0.52
0.56
0.60
0.64
2
4
6
8
10
12
14
16
18
20
22
24
26
2007 2008 2009 2010 2011 2012
maximum-minimum distribution of unemploymentrates across the euro area (left-hand scale)average euro area unemployment rate (left-hand scale)write-off rates (right-hand scale)
Source: ECB.

31ECB
Financial Stability ReviewDecember 2012 31
2 creDit r isks
31
year in many euro area countries during the summer of 2012 (see Chart 2.7). As regards the types of loans to households, mortgage lending contributed positively to the weak positive annual growth rate of MFIs’ lending to households at the euro area level. By contrast, consumer credit contributed negatively, in particular in countries under stress, with both demand-side factors, such as subdued consumer confi dence and elevated levels of unemployment, as well as supply-side factors, including banks’ restrictions regarding their capital and liquidity positions, underpinning these developments.
This said, the latest euro area bank lending survey of October 2012 suggested that the muted MFI lending growth since the end of 2011 was a function of contracting net loan demand rather than constrained loan supply. In fact, euro area banks reported a further contraction in the demand for housing loans during the third quarter of 2012. Both weaker consumer confi dence and gloomier housing market prospects, the latter due partly to the waning effects of past government support schemes for housing markets, were the main factors behind the reduced demand for loans for house purchase. Euro area banks reported a broadly unchanged net tightening of credit standards on loans to households for house purchase in the third quarter of 2012. Concerning the factors contributing to the tightening of credit standards, pressures from cost of funds and balance sheet constraints on credit standards have eased, while the impact of the general economic outlook and of housing market prospects on the net tightening of credit standards on housing loans remained broadly unchanged in the third quarter of 2012. Competitive pressures were reported to have remained neutral (see Chart 2.8).
Looking ahead, the level of household sector indebtedness is likely to decrease only moderately, with deleveraging of the household sector expected to be a long structural adjustment process in several euro area countries. This, in turn, may weigh on private consumption and thus economic
Indebtedness is likely to decrease only slowly in the period ahead
chart 2.6 euro area households’ disposable income
(Q1 2007 – Q2 2012; percentage change per annum and percentage point contributions)
-6
-4
-2
0
2
4
6
8
-6
-4
-2
0
2
4
6
8
2007 2008 2009 2010 2011
direct taxes
net property income gross operating surplusand mixed incomecompensation of employees
net social benefits gross disposable incomereal income growth
Sources: Eurostat, ECB and ECB calculations.
chart 2.7 mfi lending to euro area households
(Jan. 2007 – Sep. 2012; percentage change per annum; maximum, minimum, interquartile distribution and average)
-30
-25
-20
-15
-10
-5
0
5
10
15
20
25
30
35
-30
-25
-20
-15
-10
-5
0
5
10
15
20
25
30
35
2007 2008 2009 2010 2011 2012
Source: ECB.

32ECBFinancial Stability ReviewDecember 20123232
recovery. Supply-side restrictions such as a further tightening of credit standards for household lending, by contrast, are expected to be contained by gradually decreasing bank funding pressures and waning risk aversion. Nevertheless, new regulatory requirements in the banking sector, as well as more structural deleveraging pressures on some banks given the ongoing process of balance sheet adjustment, could lead to more limited credit supply for households.
The fi nancing costs borne by the euro area household sector have continued to decline slightly since the June 2012 FSR. This development has been underpinned by the Eurosystem’s liquidity-providing measures at the turn of 2011-2012, which reduced funding-induced pressures to ration lending by allowing banks to secure medium-term funding at low cost. It has been further supported by the decision in July 2012 to cut by 25 basis points the ECB interest rate on main refi nancing operations. At the same time, heterogeneity across individual euro area countries, as measured by the range between the highest and lowest interest rate charged on loans to households, increased and remained at clearly elevated levels (see Chart 2.9).
2.3 weak cOnDitiOns in tHe nOn-financial cOrPOrate sectOr amiD increaseD uncertainty regarDing tHe OutlOOk
Weak economic activity continues to weigh on the euro area non-fi nancial corporate sector’s earnings capacity, with corporate profi tability remaining at relatively low levels since the end of 2011. According to sectoral accounts data on the euro area, the gross operating surplus of euro area non-fi nancial corporations (NFCs) remained almost fl at on an annual basis during the fi rst half of 2012. Modest growth in sales, together with a slight decrease in the ratio of operating expenses to sales, resulted in a moderate increase in the return on assets in the fi rst half of 2012, which nevertheless remains close to the historical lows reached at the beginning of 2009 (see Chart 2.10).
Financing costs have continued to
decline
Corporate profi tability
remained generally subdued…
chart 2.8 changes in euro area banks’ credit standards for loans to households for house purchase(Q1 2007 – Q3 2012; net percentage of banks contributing to tightening standards)
-20
-10
0
10
20
30
40
50
-20
-10
0
10
20
30
40
50
2007 2008 2009 2010 2011 2012
housing market prospectsexpectations regarding general economic activitycost of funds and balance sheet constraintsbank competition
Source: ECB.
chart 2.9 euro area mfi lending rate on new household loans and the euribOr
(Jan. 2007 – Sep. 2012; percentages; average, maximum and minimum)
0
1
2
3
4
5
6
7
8
9
0
1
2
3
4
5
6
7
8
9
2007 2008 2009 2010 2011 2012
euro area average MFI lending ratesix-month EURIBORmaximum-minimum distribution of MFI lendingrates across euro area countries
Source: ECB.

33ECB
Financial Stability ReviewDecember 2012 33
2 creDit r isks
33
Consequently, relatively weak profi tability limits the capacity of fi rms to accumulate capital through retained earnings, making them more dependent on external fi nancing and more exposed to refi nancing risks, and thus possibly also weighing on their investment activities.
In terms of fi rm size, however, developments in fi rms’ fi nancial conditions varied markedly. On the one hand, a moderate improvement in fi rms’ profi tability and the expansion of retained earnings have been evident more recently for listed (and therefore generally larger) companies. By contrast, profi ts of SMEs have continued to deteriorate since the end of 2011, according to the ECB’s survey on the access to fi nance of SMEs in the euro area. Indeed, in the latest survey, a higher net percentage of euro area SMEs reported a decrease in turnover and lower profi ts. Moreover, small corporations participating in this survey found access to bank credit more diffi cult in the period from April 2012 to September 2012 in all the euro area economies, except Germany and Ireland.
Looking forward, non-fi nancial corporate earnings in the euro area are likely to be affected by the weak economic prospects. In this context, a slowdown in global demand would affect mainly large (and export-oriented) multinational companies, while subdued domestic demand – a result of higher precautionary saving, increased unemployment, modest income growth and the short-term costs of fi scal consolidation – is likely to compromise the profi tability of fi rms with a predominantly domestic base (e.g. SMEs).
The euro area non-fi nancial corporate sector’s leverage has remained broadly unchanged since the fi nalisation of the June 2012 FSR. Although leverage has declined slightly since the peak in 2008, it remains high in some countries, especially at this point of the economic cycle and particularly in some sectors, such as construction. In addition, equity price developments have caused indebtedness as a share of total equity to be volatile in recent quarters (see Chart 2.11). Although the ability of fi rms to service their debt continued to be supported by the low interest rate environment and low
… but depends on the fi rm size
Weaker economic activity is expected to weigh on the earnings outlook…
… while leverage remains at elevated levels
chart 2.10 sales growth, return on assets and operating expenses-to-net sales ratio of listed non-financial corporations in the euro area(Q1 2005 – Q2 2012; percentages; median)
93
94
95
96
97
98
99
100
-15
-10
-5
0
5
10
15
20
2005 2006 2007 2008 2009 2010 2011
annual sales growth (left-hand scale)return on assets (left-hand scale)operating expenses-to-net sales ratio (right-hand scale)
Sources: Thomson Reuters and ECB calculations.
chart 2.11 total debt and interest burden of non-financial corporations in the euro area
(Q1 2005 – Q2 2012; percentages)
0
2
4
6
8
10
12
40
45
50
55
60
65
70
2005 2006 2007 2008 2009 2010 2011
debt-to-equity ratio (market prices, left-hand scale)debt-to-equity ratio (notional stock, left-hand scale)net interest payments-to-gross operating surplus ratio (right-hand scale)
Sources: ECB and ECB calculations.

34ECBFinancial Stability ReviewDecember 20123434
corporate bond yields, NFCs’ income remained relatively weak so that, in relation to it, net interest payments remained at an elevated level.
In terms of euro area NFCs’ funding, the issuance of debt securities has remained strong since the start of 2012, whereas bank lending decelerated and remained almost fl at in the summer of 2012 (see Chart 2.12). At the turn of 2011-2012, some fi rms were also able to diversify their sources of fi nancing in response to tighter lending standards, although the option of disintermediation has thus far been limited mainly to larger companies that are predominantly domiciled in larger countries with more developed corporate bond markets.
As regards the funding costs, the overall cost has slightly declined in the euro area as a whole since the beginning of the year (see Chart 2.13). The decline refl ected not only the transmission of the cuts in monetary policy rates to bank lending rates, but – more notably – also the lower cost of market debt. The latter was also impacted by the regaining of investor confi dence triggered by the Eurosystem’s two longer-term refi nancing operations (LTROs). In mid-2012 the cost of quoted equity also declined markedly, on the back of a rally in the stock market associated with the announcement of the ECB’s Outright Monetary Transactions programme.
Access to market-based funding, however, has been characterised by broadly diverging developments in debt and equity fi nancing, as well as by substantial cross-country disparities. Large fi rms have continued to diversify their sources of funding in response to the perceived risk regarding the availability of bank credit. At the same time, those corporations that are most dependent on bank funding, inter alia SMEs, as well as fi rms located in stressed countries, still remain vulnerable to restrictions in credit supply (see Box 2).
Tighter lending standards underpin
disintermediation
Overall funding costs have declined
slightly…
chart 2.12 external financing of euro area non-financial corporations
(Q1 2005 – Q3 2012; net annual fl ows; EUR billions)
-200
-100
0
100
200
300
400
500
600
700
-200
-100
0
100
200
300
400
500
600
700
2005 2006 2007 2008 2009 2010 2011
debt securitiesMFI loans
Sources: ECB and ECB calculations.
chart 2.13 cost of the external financing of euro area non-financial corporations
(Jan. 2006 – Nov. 2012; percentages)
0
2
4
6
8
10
12
0
2
4
6
8
10
12
2006 2007 2008 2009 2010 2011 2012
overall cost of financing
cost of quoted equitycost of market-based debt
short-term MFI lending rates
Source: ECB calculations.

35ECB
Financial Stability ReviewDecember 2012 35
2 creDit r isks
35
box 2
tHe financial crisis anD eXternal financing Of eurO area nOn-financial cOrPOratiOns
As bank-related strains have been a key feature of the fi nancial crisis, access to other fi nancing sources has provided important support for non-fi nancial corporations (NFCs) in the euro area. This has included a broad range of external fi nancing instruments, such as equity, debt securities and, in particular, also inter-company loans and trade credit. This box explores this issue fi rst on the basis of changes in the balance sheet structure, then by examining patterns across euro area countries.
In examining fi rms’ capital structure, equities generally remain the most important source of external fi nancing for NFCs in the euro area despite a fall in their share during the crisis (see Chart A). A fall in this share from 52% over the pre-crisis period (Q1 2000-Q2 2008) to 48% over the crisis period (Q3 2008-Q2 2012) has occurred exclusively due to transactions, i.e. more limited equity issuance compared with other fi nancing sources, while there was a small valuation gain. By contrast, when investigating the change in the equity share during the fi nancial crisis, there was also a decline (from 50% to 47%), but this was largely related to losses in the valuation of equity. Across large euro area countries, French fi rms exhibit a structurally
high share of equity fi nance, contrasting with a low share for their German peers. For Italian and Spanish NFCs, the equity share was lower in the crisis compared with the pre-crisis average, resulting from high use of other (i.e. debt) fi nancing sources, which led to a moderate change in the NFC capital structure over time. Loans (MFI loans, inter-company loans, and other loans such as from other fi nancial intermediaries) and trade credit also play a very relevant role in the capital structure of euro area NFCs, with varying importance across euro area countries. Inter-company loans are relatively important in Germany and, from the smaller countries, in particular in Belgium (partly due to an advantageous tax treatment of corporate treasury centres). Trade credit payable, which represents the third largest component of NFCs’ external liabilities, is especially important for Spanish and Italian NFCs.
The fi nancial crisis has signifi cantly affected the balance between debt and equity fi nance, particularly at the country level (see Chart B). In the pre-crisis period, debt fi nancing contributed considerably to the external fi nancing growth of NFCs. On average during this period, the contribution of debt fi nancing
chart a composition of external financing of non-financial corporations across selected euro area countries(Q1 2000 – Q2 2012; share in the outstanding amounts of external fi nancing; percentages; based on market valuation)
0
10
20
30
40
50
60
70
80
90
100
0
10
20
30
40
50
60
70
80
90
100
Q1 2000 – Q2 2008 Q3 2008 – Q2 20121 2 3 4 5 6 7 1 2 3 4 5 6 7
1 euro area2 Germany
5 Italy6 Netherlands
3 Spain4 France
7 Other
debt securitiesMFI loansother loansother items
shares and other equitypension fund reservesinter-company loanstrade credit payable
Source: ECB. Notes: “Other loans” are defi ned as loans excluding MFI loans and inter-company loans where available (i.e. BE, DE, EE, ES, FR, IT, LU, AT, PT, SI, SK and FI). “Other items” include other accounts excluding trade credit where available (but including trade credit in countries where this item is not available separately) and fi nancial derivatives. Quarterly trade credit data are available for DE, EE, ES, FR, IT, AT, PT, SI, SK and FI.

36ECBFinancial Stability ReviewDecember 20123636
to NFCs’ external fi nancing was larger than that of equity fi nancing especially for Italian and Spanish fi rms and, to a smaller extent, also in the “other” euro area countries. By contrast, during the fi nancial crisis, euro area NFCs’ external fi nancing, in particular debt fi nancing, decelerated substantially, in particular in Spain and Greece, but also Ireland and Italy.
At the same time, other sources of external fi nancing have become more important as bank lending has exhibited signs of constraints in some countries – with inter-company loans and debt securities playing an important role as an offset (see Chart C). Across euro area countries, the decline in MFI lending to NFCs was strong over an extended period of time during the crisis in particular in Spain, Ireland and Greece, but also in Estonia. By contrast, the decline in annual MFI lending to NFCs was limited to the period of 2009-2010, when economic activity was very subdued, in Germany, France, Austria and Finland, and growth in MFI lending to NFCs became positive again in 2011-2012. Differences in the decline in MFI lending refl ect both reduced demand for bank loans due to weak economic activity and supply-side factors affecting the provision of bank loans.
The extent to which decreasing availability and increasing cost of MFI lending during the fi nancial crisis could be offset has clearly differed across countries – depending importantly on the level of fi nancial market development and differences in traditional NFC fi nancing patterns (see Chart D). First, internal fi nancing of NFCs (i.e. retained earnings) became more important for NFCs in most euro area countries during the crisis relative to their external fi nancing. Second, the relative importance of external fi nancing instruments of NFCs changed during the crisis. While NFCs in some countries like Germany and France substituted MFI loans with other external fi nancing sources like inter-company loans (from the countries for which data are
chart b equity and debt financing of non-financial corporations in selected euro area countries(Q1 2000 – Q2 2012; contributions to annual growth of the sum of equity and debt fi nancing in percentages)
-1
0
1
2
3
4
5
6
7
8
9
-1
0
1
2
3
4
5
6
7
8
9
shares and other equity financingdebt financing
Q1 2000 – Q2 2008 Q3 2008 – Q2 20121 2 3 4 5 6 7 1 2 3 4 5 6 7
1 euro area2 Germany
5 Italy6 Netherlands
3 Spain4 France
7 Other
Source: ECB. Notes: “Debt fi nancing” is defi ned as loans, debt securities and pension fund reserves. “Other” includes the euro area countries for which data are available, except for the largest fi ve countries. Data for EE are available only from Q4 2004, for IE since 2002, for CY, SI and SK since 2005 and for LU and MT since 2006. The calculation of annual growth rates is based on the data ranges shown in the chart.
chart c substitution between financing instruments of euro area non-financial corporations(Q1 2007 – Q2 2012; annual transactions; EUR billions)
-200
-100
0
100
200
300
400
500
600
-200
-100
0
100
200
300
400
500
600
2007 2008 2009 2010 2011
MFI loans to NFCs
debt securities issued by NFCsinter-company loans
trade credit payable of NFCs
Source: ECB.

37ECB
Financial Stability ReviewDecember 2012 37
2 creDit r isks
37
Weak domestic and foreign demand affected listed fi rms across all major industrial sectors and contributed to an increase in expected default frequencies in most non-fi nancial corporate sectors after the turn of the year, but these frequencies have since fallen considerably in some segments (see Chart 2.14). The relatively higher risk attached to small corporations in stressed economies is refl ected in the pricing of loans by banks. The spread between bank lending rates for large loans and those for small loans to NFCs has widened continuously in the euro area since the beginning of 2011 (see Chart 2.15). The difference between the loan pricing conditions for small and large fi rms, which primarily results from the divergence in fi rm-specifi c risks, highlights the more adverse conditions faced by small fi rms, particularly in countries under stress. In part, these spreads may
… but differ strongly depending on the fi rm and loan size
available 1 this was mainly Germany) or debt securities (France in particular), there was less substitution in other countries, notably Spain, and external fi nancing transactions were very modest. For trade credit, which is linked to the exchange of goods, developments are closely related to the economic cycle. While annual trade credit transactions were mostly negative in 2009, i.e. due to the weakness in economic activity, trade credit became more important in NFC fi nancing in many euro area countries in 2010-2012. From the larger euro area countries for which data are available, trade credit payable gained strength in the period 2010-Q2 2012, in particular in Germany and France, but remained weak in Spain and turned negative again in Italy in 2012, after a recovery in 2010-2011. Overall, external fi nancing developments can partly be explained by weak economic activity, but also indicate constraints in the supply of external fi nancing to NFCs during the crisis. The latter relate to deteriorated (bank) funding costs, but also to worsened creditworthiness of borrowers in an adverse macroeconomic environment.
Overall, marked changes in NFC external fi nancing trends have been apparent during the fi nancial crisis. First, equity remained the most important form of fi nancing for euro area NFCs, based on NFCs’ outstanding liabilities. Second, the ability of NFCs to substitute MFI loans with other external fi nancing instruments has provided a buffer in an environment of bank deleveraging – though with considerable heterogeneity across countries. From a fi nancial stability angle, a diversifi cation of external fi nancing sources has the potential to increase robustness of funding conditions to adverse shocks. At the same time, a higher use of trade credit increases the potential for contagion among NFCs. In addition, a move away from bank fi nancing exposes fi rms to the whims of the market and, in particular, to potentially fi ckle sources of external fi nance.
1 Data on inter-company loans are available for Belgium, Germany, Estonia, Spain, France, Italy, Luxembourg, Austria, Portugal, Slovenia, Slovakia and Finland.
chart D substitution between financing instruments of non-financial corporations across selected euro area countries(Q1 2000 – Q2 2012; annual transactions, as a percentage of amounts outstanding of debt and trade credit payable)
averageQ1 2000 – Q2 2008
averageQ3 2008 – Q2 2012
MFI loans
debt securitiesinter-company loanstrade creditother debt financing
1 2 3 4 5 6 7 1 2 3 4 5 6 7-4
-2
0
2
4
6
8
10
12
14
-4
-2
0
2
4
6
8
10
12
14
1 euro area2 Germany
3 Spain4 France
5 Italy6 Netherlands
7 Other
Source: ECB.Notes: “Other” includes all euro area countries except for DE, ES, FR, IT and NL. “Other debt fi nancing” includes other loans, in particular loans from other fi nancial intermediaries, and pension fund reserves. Trade credit and inter-company loan data are not available for some euro area countries. The calculation of annual transactions is based on the data ranges shown in the chart.

38ECBFinancial Stability ReviewDecember 20123838
also refl ect the fact that SMEs are more dependent on their respective domestic banking sectors and are subject to tighter credit conditions, compared with larger fi rms that have greater access to global fi nancial markets.
Against this background, refi nancing risks persist, in particular for fi rms that are more vulnerable to a reduction in the supply of bank loans, amid bank deleveraging pressures, including tightened bank lending standards. The ECB’s euro area bank lending survey for the third quarter of 2012 showed that the net tightening of credit standards by euro area banks for loans to enterprises increased in the third quarter of 2012 compared with the second quarter of 2012. The net tightening of credit standards on loans to SMEs increased in the third quarter of 2012, while that of credit standards on loans to large fi rms remained broadly stable. This mainly refl ected the impact of risk perceptions on the net tightening of credit standards, in particular expectations regarding general economic activity and industry-specifi c risks. By contrast, the impact of banks’ cost of funds and balance sheet constraints eased in the case of loans to both large enterprises and SMEs. The tightening of credit standards was applied more evenly both for short-term loans and for long-term loans.
2.4 a twO-sPeeD eurO area PrOPerty market
Developments observed in residential property markets since the fi nalisation of the June 2012 FSR imply a further decrease of aggregate euro area house prices. Residential property prices declined by 1.5% year on year in the second quarter of 2012, following a drop of 0.9% in the fi rst quarter of 2012. However, developments diverged strongly at the country level (see Chart 2.16), with house prices still declining in some southern European countries such as Greece, Spain and Portugal, but also in Ireland and the Netherlands. At the same time, prices continued to increase in Austria and Estonia at a rather brisk pace, although in the latter case this may refl ect a rebound
Refi nancing risks remain given
continued tight lending standards
Residential property prices declined
in the euro area, but developments
differed across countries
chart 2.14 expected default frequencies for selected non-financial sectors in the euro area(Jan. 2006 – Oct. 2012; percentage probability; median)
0.0
0.3
0.6
0.9
1.2
1.5
1.8
2.1
2.4
2.7
3.0
0.0
0.3
0.6
0.9
1.2
1.5
1.8
2.1
2.4
2.7
3.0
2006 2007 2008 2009 2010 2011 2012
construction consumer cyclicalcapital goods utilitiesmedia and technology
Sources: Moody’s KMV and ECB calculations. Notes: The expected default frequency (EDF) provides an estimate of the probability of default over the following year. Owing to measurement considerations, the EDF values are restricted by Moody’s KMV to an interval between 0.1% and 35%.
chart 2.15 spread between interest rates on small and large loans
(Jan. 2006 – Sep. 2012; three-month moving average; basis points)
0
25
50
75
100
125
150
175
200
225
250
275
300
0
25
50
75
100
125
150
175
200
225
250
275
300
2006 2007 2008 2009 2010 2011 2012
euro areaGermanySpain
FranceItalyNetherlands
Sources: ECB and ECB calculations.

39ECB
Financial Stability ReviewDecember 2012 39
2 creDit r isks
39
following the strong corrections seen at the height of the economic and fi nancial crisis. House prices in Germany kept on rising at an average rate of some 3% in the fi rst three quarters of 2012, not least as a consequence of safe-haven considerations and favourable credit conditions, though to date this relatively sustained house price growth has not brought about a marked departure from standard housing market fundamentals (see Chart 2.17).
The degree of property market overvaluation at the euro area level, as captured by a range of commonly used metrics such as housing affordability and asset valuation (house price-to-rent ratios), is declining, but nevertheless still persistent. With regard to cross-country developments, such metrics suggest residential property overvaluation in those countries where there is a continued working-off of pre-crisis excesses, e.g. Spain, as well as some countries where house prices – even if growth rates are decelerating – are still on the rise, such as Belgium and Finland (see Chart 2.17). Clearly, these crude indicators do not capture all country-specifi c factors, such as important specifi cities in housing fi nance, but nonetheless suggest that, in general, provisioning for property loan portfolios must be adequate – particularly where there is a combination of high exposure of major banks to residential property markets, elevated loan-to-value ratios and a highly indebted household sector.
The outlook for house price developments remains weak, refl ecting subdued demand for housing, as well as the need to correct the still relatively high degree of property market overvaluation in several countries. Potential systemic risks include most notably ongoing weaknesses in economic fundamentals, in particular real disposable income growth and labour market conditions. More general downside risks to real GDP growth in an environment of exceptionally high economic and fi nancial market uncertainty could potentially trigger further house price corrections and create challenges for the debt servicing capability of borrowers.
Overvaluation is still a concern in some countries…
… amid a weak outlook for residential property markets
chart 2.16 residential property prices in the euro area and selected euro area countries
(Q1 2003 – Q3 2012; index: Q1 2003 = 100)
406080100120140160180200220240260280300320
708090
100110120130140150160170180190200210
2003 2004 2005 2006 2007 2008 2009 2010 2011
euro area
Belgium
FranceFinland
Spain
NetherlandsItaly
Germany
IrelandAustria
Portugal
Estonia (right-hand scale)
Sources: National sources and ECB.
chart 2.17 residential property price valuation indicators for selected euro area countries(percentage deviation from long-term averages or model-based equilibria of indicators)
range
average, Q2 2012 average, 2007
-50
-30
-10
10
30
50
70
90
-50
-30
-10
10
30
50
70
90
1 2 3 4 5 6 7 8 9 10 119 Austria
10 Germany11 euro area
6 Italy
8 Portugal
5 Netherlands
7 Finland3 Belgium4 France
2 Estonia1 Ireland
Sources: ECB, Eurostat, OECD, national sources and ECB calculations.Notes: Estimates are based on data up to the second quarter of 2012. They start in the 1980s for all the selected countries. The ranges and averages refer to estimates calculated using four methods (i.e. affordability index, log-linear regression, house price-to-rent ratio and simplifi ed static asset pricing framework) to measure over/undervaluation of house prices. The wide ranges across the four estimates illustrate the uncertainties surrounding the assessment of property price over/undervaluation. For instance, the estimates do not take into account national specifi cities including the fi scal treatment and structural aspects of the housing market. See Box 3 in ECB, Financial Stability Review, June 2011, for more details on these methods.

40ECBFinancial Stability ReviewDecember 20124040
Euro area commercial property markets became increasingly bifurcated after the June FSR. Although growth in property values, as well as rents, decelerated somewhat in the second and third quarters of 2012, on average, the aggregate euro area developments masked increasingly heterogeneous movements across countries (see Chart 2.18). On the one hand, countries such as France, Finland and Belgium recorded notable increases which resulted in higher values for different valuation measures, although developments in the prime commercial property segment (see Chart 2.19) may differ from overall commercial property price movements. On the other hand, values and valuation measures declined or remained supressed in Greece, Ireland and Spain. Looking ahead, on average, commercial property value growth is likely to remain sluggish or to turn negative in the euro area in the coming quarters. In addition, the deteriorating economic outlook has increased the uncertainty surrounding future commercial property developments.
The risks for euro area fi nancial stability stemming from commercial property markets are twofold and largely depend on the state of different property markets. In countries which have witnessed continued value increases in recent quarters and show signs of overvaluation, the main concern stems from the potential for sharp corrections. In countries which experienced strong increases in the run-up to and sharp corrections after the onset of the fi nancial crisis, the main fi nancial stability concern relates to refi nancing risks for loan-fi nanced investors, since commercial property prices in many euro area countries currently stand well below their peak levels.
Both of these vulnerabilities could be triggered if economic activity were to deteriorate signifi cantly or if property investors’ cost of capital were to increase. Some loan-fi nanced property investors could indeed experience signifi cant constraints when refi nancing their investments, as many banks’ deleveraging plans have focused on commercial property lending. This risk has, however, been
Increasing bifurcation in
commercial property markets, with weak
economic activity weighing on the
outlook
Risks remain signifi cant but
different in nature across countries…
… and could be triggered by weaker economic activity or higher funding costs
chart 2.18 changes in the capital value of prime commercial property in the euro area countries(Q1 2007 – Q3 2012; percentage change per annum; maximum, minimum, interquartile distribution and weighted average)
-50
-40
-30
-20
-10
0
10
20
30
40
50
-50
-40
-30
-20
-10
0
10
20
30
40
50
-60 -602007 2008 2009 2010 2011 2012
Source: Jones Lang LaSalle.Note: Data for Estonia, Cyprus, Malta, Slovenia and Slovakia are not available.
chart 2.19 average value misalignment of prime commercial property in selected euro area countries(Q1 2003 – Q3 2012; percentage deviation from average values from Q1 1997 to Q3 2012; two-quarter moving average)
-60
-50
-40
-30
-20
-10
0
10
20
30
40
50
60
70
-60
-50
-40
-30
-20
-10
0
10
20
30
40
50
60
70
2003 2004 2005 2006 2007 2008 2009 2010 2011
AustriaFranceIreland
PortugalBelgiumGermanyItaly
SpainFinlandGreeceNetherlands
euro area
Sources: Jones Lang LaSalle, ECB and ECB calculations.Note: For details, see Box 6 in ECB, Financial Stability Review, December 2011.

41ECB
Financial Stability ReviewDecember 2012 41
2 creDit r isks
41
mitigated to a substantial extent by the Eurosystem’s two three-year LTROs in December 2011 and February 2012, which prevented more adverse disruption in the provision of credit, as well as by the ECB’s decision in July 2012 to lower interest rates, which should pass through to lower financing costs for property investors.


43ECB
Financial Stability ReviewDecember 2012
3 financial markets anD glObal financial institutiOns
Notwithstanding the wide-ranging effects of ECB action designed to address impaired monetary policy transmission, the functioning of money and debt markets remained impaired, largely on account of the high fragmentation driven by intertwined sovereign and counterparty credit risk concerns. One corollary of this fragmentation has been a persistent hunt for perceived safe and liquid assets, pushing yields towards (or beyond) previous historical lows in some regions, impacting not only sovereign bond yields but also markets for non-fi nancial corporate debt.
In this environment, the profi tability of global large and complex banking groups (LCBGs) declined in the second and third quarters of 2012, whereas capital buffers remained broadly stable. Nonetheless, the operating environment is likely to remain challenging for LCBGs, with muted profi tability for at least the next 6-12 months. Although hedge funds found it diffi cult to navigate through volatile fi nancial markets and used moderate fi nancial leverage, they recouped May-June 2012 investment losses. Investor infl ows slowed down and investor redemption pressures appeared to be increasing somewhat.
3.1 sOme subsiDing Of mOney anD caPital market tensiOns
mOney marketsDespite some signs of improvement, the functioning of the euro money market has remained impaired. Although aggregate excess liquidity has remained high, its diffusion has been hindered by an increased fragmentation1 caused by elevated counterparty credit risk concerns with respect to banks from euro area countries under stress. According to market-based indicators, tensions somewhat abated following the decisions taken by the European Council on 28-29 June 2012 and the reduction of ECB policy rates by 25 basis points on 5 July 2012 (see Chart 3.1), but a more tangible improvement started only after end-July 2012, when the expectations of market intervention by the ECB intensifi ed (see Chart 3.2, Chart S.4.1 and Chart S.5.8) and eventually were confi rmed by the ECB’s announcement of the modalities of Outright Monetary Transactions (OMTs) on 6 September 2012.
Amid abundant aggregate liquidity conditions and following the reduction of ECB policy rates on 5 July 2012 – including the cut of the ECB’s deposit facility rate to zero – euro money market interest rates declined, but the zero deposit 1 See also ECB, Financial integration in Europe, April 2012.
The functioning of the euro money market remained impaired
The zero rate of the ECB’s deposit facility has not led to higher unsecured interbank lending…
chart 3.1 spreads between unsecured interbank lending and overnight index swap (Ois) rates(Jan. 2007 – Nov. 2012; basis points; three-month LIBOR/OIS spread)
0
50
100
150
200
250
300
350
400
0
50
100
150
200
250
300
350
400
euroarea
UK
US
2007 2008 2009 2010 2011 2012
GBPUSDEUR
Finalisation of the June 2012 FSR
Sources: Bloomberg and ECB calculations.Notes: In the lower panel, red indicator points to rising, yellow to moderating and green to falling pressure in the respective money markets. For more details, see Box 4, entitled “Assessing stress in interbank money markets and the role of unconventional monetary policy measures”, in ECB, Financial Stability Review, June 2012.

44ECBFinancial Stability ReviewDecember 20124444
facility rate has not led to higher unsecured interbank lending, as, for example, evidenced by low EONIA volume.2 The low level of unsecured interest rates reportedly did not provide enough incentives to bear additional credit risk. Nonetheless, it encouraged overall higher risk-taking, thereby flattening the yield curve, as investors lengthened their investment duration in their search for a higher yield. Although the zero rate of the ECB’s deposit facility should make banks indifferent about whether they hold their funds as unremunerated excess reserves or place them into the deposit facility, some banks seemed to still have incentives to use the deposit facility. Anecdotal evidence suggests that internal liquidity management practices as well as regulatory requirements (i.e. reserves held in the deposit facility would count towards liquidity buffers, whereas excess reserves held in the current account would not) may have played a role. In the period ahead, aggregate excess liquidity might already begin to subside as of 30 January 2013, the first date when banks might choose to exercise an early repayment option for the first of the three-year longer-term refinancing operations (LTROs).
By contrast, secured interbank activity was more resilient – especially for short-term maturities – not least because of the general trend towards the collateralisation of credit exposures (see Box 3). Still, in addition to the reportedly increasing scarcity of the highest-grade collateral, repo volumes have also been adversely affected by the exhaustion of interbank credit limits, higher haircuts and high asset encumbrance at some banks from countries under stress. In order to alleviate collateral pressures, on 20 June 2012 the Eurosystem decided to broaden the scope of the measures which were introduced on 8 December 2011 by reducing the rating threshold and amending other eligibility requirements for certain asset-backed securities. Furthermore, on 6 September 2012 the Eurosystem decided (i) to suspend the application of the minimum credit rating threshold requirement for assets issued or guaranteed by the government of countries that are eligible for OMTs or are under an EU/IMF programme and comply with the attached conditionality as assessed by the ECB’s Governing Council, and (ii) to make eligible for its refinancing operations marketable debt instruments denominated in US dollars, pounds sterling and Japanese yen.
The fragmentation of the euro money market has somewhat abated following the ECB’s announcement on 6 September 2012, but remained high, as, for example, evidenced by: (i) a large, albeit decreasing, dispersion of EONIA, EURIBOR and EUREPO contributions (see Chart 3.3); 3, 4 (ii) the “home bias”
2 From 5 July 2012 to late November 2012 average daily EONIA volume hovered around €23 billion and was about €2.5 billion lower than after the second three-year LTRO in February 2012.
3 For more information, including on the contributing panel of banks, see http://www.euribor-ebf.eu.4 See also ECB, Financial integration in Europe, April 2012.
… while secured interbank activity
was much more resilient
The fragmentation of the euro money market remained
high
chart 3.2 composite indicator of systemic stress (ciss) for the euro area and contributions of its components(Jan. 1999 – Nov. 2012)
-0.4
-0.2
0.0
0.2
0.4
0.6
0.8
1.0
-0.4
-0.2
0.0
0.2
0.4
0.6
0.8
1.0
1999 2001 2003 2005 2007 2009 2011
correlation contributionequity market contributionforeign exchange market contributionbond market contributionfinancial sector contributionmoney market contributionCISS
Finalisation of the June 2012 FSR
Sources: ECB and ECB calculations.Note: For further details, see Special Feature C, entitled “Systemic risk methodologies”, in ECB, Financial Stability Review, June 2011.

45ECB
Financial Stability ReviewDecember 2012 45
3 f inancial markets anD glObal
f inancial inst itutiOns
45
with respect to interbank counterparties (see Chart 3.4); or (iii) a continuing dependency of some banks on the Eurosystem’s liquidity support through the weekly liquidity-providing operations, despite the high level of overall excess liquidity. Following the reduction of the ECB’s deposit facility rate to zero, secured lending rates for perceived safe-haven country general collateral became negative, whereas interest rates for lending against collateral from countries under stress, while also lower, remained positive.
Very low unsecured and sometimes even negative secured interest rates had forced some prime euro-denominated money market funds (MMFs) to suspend new subscriptions. This, however, created opportunities for MMFs with less stringent investment constraints in terms of permissible credit ratings and maturities. In this context, it is noteworthy that the outstanding amount of short-term European paper (STEP) slightly increased from €382 billion in mid-May 2012 to around €400 billion in late November 2012, although the bulk of outstanding paper and new issuance remained confi ned to highly rated entities.
Similar to the euro money market, liquidity remained ample in the US dollar money market. On 13 September 2012 the US central bank announced a USD 40 billion a month purchase programme for agency mortgage-backed
Low interest rates pose challenges for money market funds
The availability of US dollar funding has improved for euro area banks
chart 3.3 cross-country standard deviation of average unsecured lending and repo rates
(Jan. 2006 – Oct. 2012; basis points; two-month moving average)
0
5
10
15
20
0
5
10
15
20
0
5
10
15
20
0
5
10
15
20
2006 2008 2010 2012 2006 2008 2010 2012
EONIAone-month EURIBORtwelve-month EURIBOR
one-month EUREPOtwelve-month EUREPO
Sources: European Banking Federation and ECB calculations.
chart 3.4 share of cross-border non-repo interbank lending and borrowing
(Jan. 2005 – Sep. 2012; percentage of total non-repo interbank lending and borrowing)
10
15
20
25
30
35
40
45
50
10
15
20
25
30
35
40
45
50
2005 2006 2007 2008 2009 2010 2011 2012
SpainItaly
euro area GermanyFrance
Sources: ECB and ECB calculations.Note: Sum of non-repo lending to and borrowing from monetary fi nancial institutions.
chart 3.5 euribOr/Ois spread and the eur/usD basis swap
(Jan. 2008 – Nov. 2012; basis points)
50
0
100
150
200
250
300
0
50
100
150
200
250
300
2008 2009 2010 2011 2012
Finalisation of the June 2012 FSR
EUR/USD three-month basis swapEURIBOR/OIS three-month spread
Source: Bloomberg.

46ECBFinancial Stability ReviewDecember 20124646
securities and extended the guidance for near-zero short-term interest rates until mid-2015. The availability of US dollar funding for euro area banks has improved, as suggested by: (i) a continued tightening of the EUR/USD basis swap (see Chart 3.5); (ii) a declining recourse to the ECB’s US dollar-providing operations; and (iii) a recovery in lending to euro area banks by US MMFs.
box 3
main finDings Of tHe eurO mOney market survey 2012
On 28 September 2012 the ECB published the results of the Euro Money Market Survey 2012, which were based on data collected from banks in 28 European countries (the EU Member States plus Switzerland) and covered developments in various segments of the euro money market in the second quarter of 2012. This box reports the survey’s main fi ndings.1 Overall, the survey results suggest a strong impact of the euro area sovereign debt crisis as well as of the Eurosystem’s extraordinary policy measures that aim at restoring market functioning and the proper transmission of monetary policy in an environment where the euro money market remains fragmented.
The overall turnover in the euro money market decreased by 14% in the second quarter of 2012 compared with the second quarter of the previous year (see Chart A). After a signifi cant increase in turnover in 2011, aggregate turnover fell back to below 2010 levels in the second quarter of 2012. This decline could be attributed to both the ongoing euro area sovereign debt crisis and the related impairment of the interbank market, as well as to the surplus liquidity environment that prevailed in the euro interbank market as a result of the high allotment at the two three-year longer-term refi nancing operations (LTROs) in December 2011 and February 2012.
The most notable decline in turnover took place in the segment of overnight index swaps (OISs), where turnover declined by 50%, and in the unsecured market, where turnover contracted by 36%. Market activity in the unsecured segment remained highly concentrated in the overnight market (with a share of more than 70%), while turnover in the segment beyond one month remained very limited (only around 2% of total unsecured activity). The contraction in the unsecured market can be explained by the general trend towards secured lending and a shortening of maturities against the backdrop of greater risk aversion to counterparty credit
1 For more details, see ECB, Euro Money Market Study, December 2012.
chart a aggregate average turnover of the euro money market
(Q2 fi gures in the period from 2002 to 2012; index: aggregated average daily turnover volume in 2002 = 100)
0
50
100
150
200
250
0
50
100
150
200
250
2002 2004 2006 2008 2010 2012
unsecuredsecuredovernight index swapsforeign exchange swaps
other interest rate swapscross-currency swapsforward rate agreementsshort-term securities
Source: ECB Euro Money Market Survey 2012.Note: The panel comprised 105 credit institutions.

47ECB
Financial Stability ReviewDecember 2012 47
3 f inancial markets anD glObal
f inancial inst itutiOns
47
risk. At the same time, the high level of surplus liquidity provided by the Eurosystem reduced the demand for interbank funding, while stricter regulatory requirements tend to reduce the supply of unsecured interbank lending.
The decline in money market activity was particularly pronounced compared with the previous year, as the second quarter of 2011 was a time before the intensifi cation of the euro area debt crisis when surplus liquidity had temporarily subsided and activity in the money market had picked up substantially. This effect is also very noticeable in the substantial decline in the OIS segment – the environment of high surplus liquidity, combined with the low level of interest rates (close to the zero percent rate of the deposit facility) and low volatility of the overnight EONIA rate, have signifi cantly reduced the need for hedging interest rate risk.
The secured market remained the largest segment of the euro money market, although turnover declined by 15% in the second quarter of 2012, which was broadly in line with the fi ndings of the latest International Capital Market Association’s European repo market survey.2 The decline in turnover was driven by a 26% decrease in overnight activity. The share of secured market activity cleared through central clearing counterparties (CCPs) increased further and accounted for 55% of secured market transactions (compared with 51% in 2011). While in previous years activity through CCPs picked up considerably after more European banks had joined the international repo platforms, in 2012 even the CCP-cleared repo business declined (albeit at a slower pace than all repo transactions), on account of, among other things, increased margin requirements following rating downgrades and higher yields on debt securities of some euro area countries under stress in the second quarter of 2012. Demand for repo was also lower because many banks had had their funding needs for 2012 fulfi lled with liquidity received from the Eurosystem’s LTROs.
The continued decline in the relative share of unsecured lending, as well as the increase in the share of transactions settled through CCPs, indicate heightened concerns about counterparty credit risk, especially with respect to banks from euro area countries under stress. Except for unsecured transactions, the data on the geographical structure of counterparties and used collateral show, however, only some limited signs of a stronger preference for domestic banks and collateral (so-called “home bias”). In the unsecured market, the share of domestic counterparties increased signifi cantly from around 28% in 2011 to around 39% in 2012, while for the secured market the share of domestic collateral increased slightly from 26% to around 31% (see Chart B).3
2 See International Capital Market Association, “European repo market survey”, No 23, August 2012.3 For a bigger panel of 172 credit institutions, for which only 2011 and 2012 data were available, the results were quite similar: in the
unsecured market the share of domestic counterparties increased from around 31% in 2011 to around 43% in 2012, while for the secured market the share of domestic collateral remained broadly unchanged at around 30%.
chart b share of domestic counterparties and collateral
(percentage of total)
25
30
35
40
45
50
25
30
35
40
45
50
2002 2004 2006 2008 2010 2012
unsecured transactionssecured transactionscollateral
Source: ECB Euro Money Market Survey 2012.Note: The panel comprised 105 credit institutions.

48ECBFinancial Stability ReviewDecember 20124848
gOvernment bOnD marketsFollowing the ECB’s announcement on 6 September 2012 of the modalities of OMTs in secondary sovereign bond markets that aim at safeguarding an appropriate monetary policy transmission and the singleness of the monetary policy, tensions in the government bond markets of euro area countries under stress somewhat subsided (see also Chart 3.2), most notably in Spain and Italy, although the improvements had already started after end-July 2012, when expectations of market intervention by the ECB intensifi ed. Beyond their stated purpose, the prospect and eventually an announcement of the modalities of OMTs provided an accompanying forceful boost to market confi dence across virtually all asset classes – not unlike the impact of LTROs in late 2011.5 Most notably, this paved the way for a reversal of the fragmentation of euro area government bond markets, the progress of which, however, will ultimately depend on the successful and swift implementation of various agreed policy measures at the national and euro area levels.
The general decline in yields on bonds issued by vulnerable sovereigns was particularly pronounced for shorter-term maturities (see Chart 3.6) as shorter-term debt securities are more sensitive to potential near-term funding liquidity pressures. The positive impact on shorter-term bonds was further reinforced by the fact that OMTs will focus on the shorter part of the yield curve and in 5 See Box 5, entitled “The impact of the longer-term refi nancing operations on money market options”, in ECB, Financial Stability Review,
June 2012.
Tensions in the euro area government
bond markets of countries
under stress have somewhat subsided
The decline in yields was most pronounced for
shorter-term maturities
There has been a slight trend away from domestic collateral – also related to the euro area sovereign debt crisis – as repo investors are often less willing to trade repos with collateral issued in the same country as the counterparty for countries with perceived elevated sovereign and counterparty credit risk (so-called “wrong way” correlation risk).
The only market segment where activity picked up signifi cantly was in the derivatives market, namely foreign exchange (FX) swaps (up by 12%), as such swaps remained an important secured cash funding instrument for European banks and had benefi ted from the move away from unsecured transactions. Another sign of the resilience of the FX swap market is the fact that the increase in activity took place also for the longer maturities (see Chart C). Furthermore, a wider use of e-commerce platforms continued to support activity in this market segment, as the survey showed that the share of electronic trading increased in most market segments.
The overall turnover in the outright secondary market for short-term securities declined by 9%, whereas the turnover for the short-term paper issued by credit institutions increased by 12%, a trend that could also be indirectly supported by an increase in the outstanding amount of short-term European paper (STEP). Some of this increase could potentially be explained also by the eligibility of these short-term securities as collateral for the Eurosystem’s operations.
chart c maturity-weighted breakdown of average daily turnover in the foreign exchange swap segment(percentage of total)
0
5
10
15
20
25
0
5
10
15
20
25
over-night
less than1 week
1 weekto
1 month
1-3months
3-6months
6 monthsto 1 year
morethan 1 year
20112012
Source: ECB Euro Money Market Survey 2012. Note: The panel comprised 172 credit institutions.

49ECB
Financial Stability ReviewDecember 2012 49
3 f inancial markets anD glObal
f inancial inst itutiOns
49
particular on sovereign bonds with a maturity of between one and three years. By contrast, yields on shorter-term government bonds that tended to benefi t from fl ight-to-safety fl ows have slightly increased, which in some cases means that they returned to positive territory.
Despite these positive developments, the heterogeneity of market conditions across euro area government bond markets remained, as yield levels, volatility and liquidity conditions varied signifi cantly. By October 2012 the cumulative year-to-date volumes of Italian and Spanish government bonds traded on the MTS platform were €423 billion and €60 billion respectively, much lower than during the same period in 2010 and 2011. The share of non-domestic investors in sovereign bonds of vulnerable euro area countries has reportedly halted its downward trend and some market participants publicly expressed their more positive views (see also Chart S.2.9). According to several market reports, market-makers have been reviewing their trading activities and downsized trading inventories, not least because often high volatility (see Chart 3.7) reduced volatility-based position limits and thus prevented them and other market participants from entering into larger trades. Hence investors who wanted to increase their allocations to government bonds issued by vulnerable euro area sovereigns needed to consider also what alternative (non-dealer) sources of liquidity could be used in future to exit such positions.
Low yields on the highest-grade government bonds were not confi ned to the euro area sovereigns. High demand for safe and liquid assets has been a global phenomenon pushing down yields also of other AAA-rated government debt securities – in some cases to historical lows (see Chart 3.8). This has a clear counterpart in a shrinking supply of assets perceived to be safe and liquid – as shown
Yield levels, volatility and liquidity conditions varied signifi cantly
Low yields on the highest-grade euro area government bonds are part of the global phenomenon
chart 3.7 implied bond market volatility in the euro area and the united states
(Jan. 2008 – Nov. 2012; percentages; three-day moving average)
6
9
12
15
6
9
12
15Finalisation of the June 2012 FSR
3 3
euro areaUnited States
2008 2009 2010 2011 2012
Source: Bloomberg.Notes: Implied government bond volatility is a measure of uncertainty over the short term (up to three months) for German and US ten-year government bond prices. It is based on the market values of related traded options contracts. Bloomberg uses implied volatility of the closest to at-the-money strikes for both puts and calls using near-month expiry futures.
chart 3.6 two- and ten-year government bond yields in germany, italy and spain
(Jan. 2011 – Nov. 2012; percentages)
SpainItalyGermany
Two-year bond yield
-2
0
2
4
6
8
-2
0
2
4
6
8
2011 2012
Finalisation of the June 2012 FSR
Ten-year bond yield
-2
0
2
4
6
8
-2
0
2
4
6
8
2011 2012
Finalisation of the June 2012 FSR
Source: Bloomberg.

50ECBFinancial Stability ReviewDecember 20125050
in Chart 3.9, the pool of sovereign issuers with the highest or at least an investment-grade credit rating has been declining, amplifi ed by the size of the markets affected, thereby limiting choices available for credit rating-constrained or index-tracking investors. A sudden reversal of safe-haven fl ows might lead to an abrupt rise in bond yields of AAA-rated countries. It is also noteworthy that credit default swap (CDS) spreads for AAA-rated sovereigns had been more persistently elevated, declining in earnest only after May 2012 (see Chart 3.8). That said, signals from euro area sovereign CDS markets should be interpreted with caution given reportedly falling liquidity on account of regulatory initiatives to curb “naked” purchases of sovereign CDS protection.
creDit marketsAgainst the backdrop of low nominal interest rates and the increasing dearth of high-grade sovereign bonds, investors have turned their search-for-yield efforts towards corporate debt markets, fi rst and foremost to debt securities issued by non-fi nancial corporations. Strong demand for non-fi nancial corporate debt, also through infl ows into bond investment funds, resulted in record- or close to record-high issuance of such debt in the United States and the euro area respectively during the fi rst ten months of 2012 (see Chart 3.10). Issuing companies were keen to lock in current low interest rates for longer maturities, not least because of lower availability of bank fi nancing.
Buoyant demand outstripped supply and pushed down yields and spreads across various credit markets. Non-fi nancial corporate bond spreads tightened signifi cantly both in the euro area and the United States and both for investment-grade and high-yield debt (see Chart 3.11). In the same vein, credit spreads narrowed for various types of AAA-rated euro area asset-backed securities (see Chart S.3.7). It should be noted, however, that in some cases the cost of issuing longer-term high-yield bonds had been so low by historical standards that some market observers started questioning the rationality of the pricing of the associated default risk.
Search-for-yield activity resulted in high demand
for non-fi nancial corporate debt…
…pushing down yields and spreads
across credit markets
chart 3.8 average bond yield and cDs spread of aaa-rated sovereigns
(Jan. 2008 – Nov. 2012; fi ve-year maturity)
0
20
40
60
80
100
120
140
160
0
1
2
3
4
5
6
2008 2009 2010 2011 2012
bond yield (percentages; left-hand scale)CDS spread (basis points; right-hand scale)
Finalisation of the June 2012 FSR
Sources: Thomson Reuters Datastream and ECB calculations.Note: AAA-rated sovereigns include Australia, Austria, Denmark, Finland, France, Germany, the Netherlands, Norway, Sweden, Switzerland, the United Kingdom and the United States.
chart 3.9 credit ratings of OecD and euro area sovereign issuers
(Jan. 2000 – Oct. 2012; number of countries)
2000 2002 2004 2006 2008 2010 2012
OECD countries: at least one investment-grade ratingOECD countries: at least one triple-A ratingeuro area countries: at least one investment-grade ratingeuro area countries: at least one triple-A rating
0
5
10
15
20
25
30
0
5
10
15
20
25
30
Sources: ECB and ECB calculations.Notes: Data refer to the current OECD (29) and euro area (17) member countries. Calculations are based on long-term foreign-currency credit ratings issued by Fitch, Moody’s and Standard & Poor’s.

51ECB
Financial Stability ReviewDecember 2012 51
3 f inancial markets anD glObal
f inancial inst itutiOns
51
eQuity marketsAmid higher risk tolerance (see Chart S.3.1), reinforced by major central bank policy actions, euro area and US equity markets rallied, creating the impression that equity investors had shrugged off the uncertain macroeconomic outlook. From mid-May 2012 to late November 2012, broad equity indices increased in all countries shown in Chart 3.12. In the case of the United States, equity prices
Equity prices rallied, supported by lower risk aversion
chart 3.10 bond issuance by non-financial corporations (all rating classes)
(Jan. 2006 – Oct. 2012; issuance in EUR billions and number of deals)
0
100
200
300
400
500
600
700
800
0
50
100
150
200
250
300
350
400
450
2006 2008 2010 2012 2006 2008 2010 2012
rest of the year (left-hand scale)first ten months (left-hand scale)number of deals (right-hand scale)
euro area United States
Sources: Dealogic and ECB calculations.
chart 3.11 corporate bond spreads in the euro area and the united states
(Jan. 2007 – Nov. 2012; basis points)
0
500
1,000
1,500
2,000
2,500
0
500
1,000
1,500
2,000
2,500Finalisation of theJune 2012 FSR
2007 2008 2009 2010 2011 2012
euro area speculative-grade-ratedUS speculative-grade-ratedeuro area A-ratedUS A-rated
Source: Bank of America Merrill Lynch.Note: Option-adjusted spreads of corporate bond indices (average maturity of six to ten years).
chart 3.12 equity price developments in the euro area and the united states
(Jan. 2007 – Nov. 2012; index: Jan. 2007 = 100)
0
20
40
60
80
100
120
140
0
20
40
60
80
100
120
140
2007 2008 2009 2010 2011 2012
US (S&P 500)GermanyBelgiumFranceSpain
PortugalItalyIrelandGreece
Finalisation of the June 2012 FSR
Source: Thomson Reuters.
chart 3.13 Option-implied volatility for the euro area stock market at different horizons
(Jan. 2008 – Nov. 2012; percentages)
-40
-20
0
20
40
60
80
0
-40
-20
20
40
60
80
2008 2009 2010 2011 2012
three monthstwo yearsthree-month to two-year slope
Finalisation of the June 2012 FSR
Source: Thomson Reuters.Note: EUROSTOXX option-implied volatility.

52ECBFinancial Stability ReviewDecember 20125252
at one point even exceeded end-2006 levels. Price increases were relatively broad-based, but more pronounced for shares issued by fi nancial fi rms. As a further refl ection of improved market sentiment, implied stock market volatility derived from stock option prices declined, while the increasingly positive slope of the implied volatility curve was not suggestive of any near-term stress (see Chart 3.13 and Chart S.3.4). Cyclically adjusted price/earnings ratios slightly increased, but remained below historical averages and thus did not point to an overvaluation of euro area equity prices (see Chart S.3.2).
3.2 cHallenging envirOnment fOr glObal financial institutiOns
glObal large anD cOmPleX banking grOuPs6
The profi tability of large and complex banking groups (LCBGs) headquartered outside the euro area – which include banks in the United States, the United Kingdom and Switzerland – declined in the second and third quarters of 2012 (see Chart 3.14). The performance across institutions was, however, varied – not surprisingly given the diverse conditions faced by these banks – with some banks suffering substantial outright losses.
The weaker fi nancial performance was due to a deterioration in all major income sources, whether compared with a quarter or a year earlier, hurt by the pronounced fi nancial market volatility during the spring and summer (see Chart 3.15). Fee and commission income, although declining slightly compared with the fi rst quarter of the year, remained the main contributor to income. Net interest income continued on its steady but moderate declining path and was put under pressure by lower loan demand. Profi tability was in some cases also negatively affected by some prominent
6 For a discussion on how global LCBGs are identifi ed, see Box 10 in ECB, Financial Stability Review, December 2007. The institutions included in the analysis presented here are Bank of America, Bank of New York Mellon, Barclays, Citigroup, Credit Suisse, Goldman Sachs, HSBC, JP Morgan Chase & Co., Lloyds Banking Group, Morgan Stanley, Royal Bank of Scotland, State Street and UBS.
Profi tability declined in the
second and third quarters of 2012…
chart 3.14 return on shareholders’ equity of global large and complex banking groups
(2006 – Q3 2012; percentages; maximum, minimum, interquartile range and median)
-30
-20
-10
0
10
20
30
-30
-20
-10
0
10
20
30
-53%
2006 2008 2010 2011 2012Q1 Q2 Q3 Q4 Q1 Q2 Q3 Q4 Q1 Q2 Q3
Sources: Individual banks’ reports and ECB calculations.
chart 3.15 breakdown of income sources of global large and complex banking groups
(Q1 2010 – Q3 2012; percentage of total assets)
0.0
-0.5
0.5
1.0
1.5
2.0
0.0
-0.5
0.5
1.0
1.5
2.0
2010 2011 2012
net interest incomenet fee and commission incomenet trading incomeloan loss provisions
Sources: Individual banks’ reports and ECB calculations.

53ECB
Financial Stability ReviewDecember 2012 53
3 f inancial markets anD glObal
f inancial inst itutiOns
53
manifestations of operational risk, with some instances of higher compliance/penalty costs and higher provisions taken to compensate customers for mis-sold products.
Solvency positions of global LCBGs – including both core Tier 1 and Tier 1 capital ratios – improved at the beginning of 2012 and remained broadly stable from then onwards (see Chart 3.16). This strengthening of solvency positions was due to both increases in Tier 1 capital levels, which increased by 3% on average, and reductions in risk-weighted assets, which declined by 2% on average during the fi rst half of 2012. The Tier 1 capital growth was mainly spurred by higher retained earnings. Signifi cant capital-raising in some cases also stemmed from more stringent capital requirements imposed by the authorities, for instance in Switzerland.
The fi nancial performance of global LCBGs during the second and third quarters of 2012 was, in general, somewhat better than that of their euro area peers (see Section 4.1). This had a clear link to the weaker performance of market indicators of euro area LCBGs, such as stock prices and CDS spreads (see Chart 3.17).
Looking ahead, the operating environment for global LCBGs is likely to remain challenging, with muted bank profi tability for at least the next 6-12 months stemming mainly from weak macroeconomic growth prospects. Banks’ operating environment is characterised in particular by a combination of relatively high levels of unemployment, low interest rates, and still high levels of non-performing assets, compounded by depressed residential property values in the United States and remaining commercial property fragilities in the United Kingdom. In addition, short-term costs may accrue to banks in the form of higher regulatory and compliance costs. With respect to the latter, further fi nes and litigation costs associated with the LIBOR manipulation process uncovered in the summer of 2012 cannot be excluded.
…with capital buffers stable
Global LCBGs outperformed their euro area peers
The operating environment remains challenging
chart 3.16 tier 1 capital ratios of global large and complex banking groups
(2006 – Q3 2012; percentages; maximum, minimum, interquartile range and median)
6
8
10
12
14
16
18
20
22
6
8
10
12
14
16
18
20
22
2006 2008 2010 2011 2012Q1 Q2 Q3 Q4 Q1 Q2 Q3 Q4 Q1 Q2 Q3
Sources: Individual banks’ reports and ECB calculations.
chart 3.17 stock prices and cDs spreads of global and euro area large and complex banking groups(Jan. 2012 – Nov. 2012; median; fi ve-year maturity CDS spreads for senior debt)
70
80
90
100
110
120
130
140
70
80
90
100
110
120
130
140
140
160
180
200
220
240
260
280
300
320
140
160
180
200
220
240
260
280
300
320
Jan. May Sep. Jan. May Sep.2012 2012
global LCBGseuro area LCBGs
CDS spreads (basis points)
Stock prices(index: Jan. 2012 = 100)
Sources: Bloomberg and ECB calculations.

54ECBFinancial Stability ReviewDecember 20125454
These possible negative effects for global LCBGs are to some extent counterbalanced by the strengthening of capital positions, cost-cutting measures which should improve net earnings, and the improvements in liquidity positions, including reduced reliance on short-term funding.
HeDge funDsinvestment performance and exposuresHedge fund investment performance was quite volatile over much of 2012, closely tied to rapidly evolving market conditions over the course of the year. By the end of October 2012 hedge funds had recouped investment losses suffered in May and June 2012. In this way, they provided a call option-like downside protection, since at an aggregate level investment losses in May and June 2012 were lower than in world equity markets and the positive result was posted over the period from July to October 2012, which, however, was lower than the increase in global equity prices.7 The average cumulative investment performance of all broadly defi ned investment strategies except for short-selling and managed futures was positive in 2012 (see Chart 3.18). For the sector as a whole, the year-to-date investment performance was somewhat below the median of historical returns, generated using all possible investment dates and holding periods of a theoretical investment in the broad non-investable hedge fund index (see Chart 3.19).
7 While it is common to compare average aggregate hedge fund investment performance with rather volatile changes in world equity prices, a more appropriate benchmark could be a diversifi ed portfolio of global equities and bonds.
…but banks’ shock-absorption capacity
has improved
Hedge funds have recouped losses
suffered in May and June 2012 …
chart 3.18 global hedge fund returns
(Jan. 2011 – Oct. 2012; percentage returns, net of all fees, in USD)
-10 0 10 -10 0 10
May 2012June 2012July 2012August 2012
September 2012October 2012January-December 2011January-August 2012
event-driven
relative value
directional
Funds of Funds
Emerging MarketsLong/Short Equity
Global MacroCTA Global
Short Selling
Distressed SecuritiesEvent Driven
Merger Arbitrage
EDHEC
Convertible ArbitrageFixed Income Arbitrage
Relative ValueEquity Market Neutral
Broad IndexMulti-Strategy
Dow JonesCredit Suisse
Sources: Bloomberg, EDHEC Risk and Asset Management Research Centre and ECB calculations.Notes: EDHEC indices represent the fi rst component of a principal component analysis of similar indices from major hedge fund return index families. “CTA Global” stands for “Commodity Trading Advisors”; this investment strategy is also often referred to as managed futures.
chart 3.19 Distribution of historical global hedge fund returns by investment holding period(Jan. 1994 – Oct. 2012; percentage returns, net of all fees, in USD)
-20
-10
0
10
20
30
40
-20
-10
0
10
20
30
40
2 3 4 5 7 10 151 3 6 9 12
cumulative return after indicated number
of months
annualised compound rate of return after indicated number
of years
minimum-maximum range10th-90th percentile rangeinterquartile rangeJanuary-October 2012median
Sources: Bloomberg and ECB calculations.Notes: Dow Jones Credit Suisse Broad Hedge Fund Index. Distributions are generated using all possible investment dates and investment holding periods up to October 2012.

55ECB
Financial Stability ReviewDecember 2012 55
3 f inancial markets anD glObal
f inancial inst itutiOns
55
The estimated similarity of hedge funds’ investment positioning within broadly defi ned investment strategies and thus the associated risk of simultaneous and disorderly collective exits from crowded trades varied across investment strategies. At the end of October 2012 moving median pair-wise correlation coeffi cients of the investment returns of hedge funds within investment strategies – a measure of the possible crowding of hedge fund trades – reached or were close to their respective all-time highs in the case of multi-strategy (0.7), macro (0.4) and fi xed income arbitrage (0.4) strategies.8
funDing liQuiDity risk anD leverageAccording to various estimates, investor infl ows into the hedge fund sector have slowed down. This was most noticeable in the second quarter of 2012, while the pace of new allocations in the third quarter of 2012 remained subdued. Some investors reportedly seemed disappointed by hedge funds’ inability to deal successfully with volatile market conditions. Nonetheless, institutional investors continued to express interest in hedge fund investments, not least because of low nominal yields on traditional debt investments. The share of total capital under management provided by institutional investors, in particular pension funds, has been increasing, largely at the expense of the share of capital entrusted by high net worth individuals and family offi ces.9
Against this backdrop, near-term funding liquidity pressures associated with large investor redemptions appeared to be somewhat increasing, as suggested also by the forward redemption indicator shown in Chart 3.20. According to this indicator, in November 2012 forward redemption notifi cations received from investors, measured as a percentage of the total capital under management of covered hedge funds, were higher than in 2009, 2010 or 2011.
None of the major prime-broker banks were under acute fi nancial stress and thus for hedge funds the risk of funding liquidity pressures associated with large and sudden withdrawals of short-term fi nancing provided by banks and the resulting disorderly fi re sales of assets did not seem to be high. However, should banks’ or market conditions deteriorate, bank fi nancing could be withdrawn quickly, especially if term fi nancing commitments by banks prove to be cancellable in stressful conditions. According to the Federal Reserve System’s September 2012 survey on dealers’ fi nancing terms10, price and non-price credit terms for US dollar-denominated securities fi nancing
8 Estimated using the moving 12-month Kendall’s τb pair-wise correlation of monthly net-of-all-fees returns in US dollars. The most recent data are subject to incomplete reporting.
9 See Financial Services Authority, “Assessing the possible sources of systemic risk from hedge funds”, August 2012.10 See Federal Reserve Board, “Senior Credit Offi cer Opinion Survey on Dealer Financing Terms”, September 2012.
...while the estimated possible crowding of trades increased
Investor infl ows slowed down…
...and investor redemption pressures appeared to be somewhat increasing
The risk of cuts in bank fi nancing did not seem to be high...
chart 3.20 near-term redemption pressures
(Jan. 2008 – Nov. 2012; percentage of hedge fund assets under administration that investors plan to withdraw)
0
4
8
12
16
20
0
4
8
12
16
20
Jan. Mar. May July Sep. Nov.
GlobeOp forward redemption indicator
20082009
201020112012
Source: GlobeOp.Notes: Assets under administration refer to the sum of the net asset value (capital under management) of all hedge funds administered by GlobeOp. Data are based on actual redemption notices received by the 12th business day of the month. Investors may, and sometimes do, cancel redemption notices. Unlike subscriptions, redemption notifi cations are typically received up to 90 days in advance of the redemption date, depending on individual fund redemption notice requirements. In addition, the establishment and enforcement of redemption notifi cation deadlines may vary from fund to fund.

56ECBFinancial Stability ReviewDecember 20125656
and over-the-counter derivatives transactions with hedge funds remained basically unchanged over the three-month period ending in August 2012 (see also Section 4.1.2).
In tandem with unchanged credit terms, respondents to the same Federal Reserve survey indicated that the use of financial leverage by hedge funds also remained basically unchanged, whereas in the surveys earlier in the year modest net percentages of respondents had pointed to a reduction in financial leverage. Furthermore, the availability of additional (and currently unutilised) financial leverage under existing agreements between dealers and hedge fund clients also changed little, on balance. Other data sources and market intelligence also suggested moderate aggregate leverage, not least because many hedge fund managers found it difficult to navigate successfully through volatile financial markets driven by macro-financial developments and policy-makers’ actions (see Chart 3.21).
...while the use of financial leverage
was moderate
chart 3.21 Hedge fund leverage
(June 2006 – Nov. 2012; percentage of responses and weighted average leverage)
0.6
1.0
1.4
1.8
2.2
2.6
0
20
40
60
80
100
2006 2007 2008 2009 2010 2011 2012
don’t know/not availableless than oncebetween 1 and 2 timesbetween 2 and 3 timesbetween 3 and 4 timesmore than 4 timesweighted average (right-hand scale)
Source: Bank of America Merrill Lynch, “Global Fund Manager Survey”. Notes: Leverage is defined as a ratio of gross assets to capital. In 2011 and 2012 the number of responses varied between 32 and 48.

57ECB
Financial Stability ReviewDecember 2012
4 eurO area financial institutiOnsThe average financial performance of large and complex banking groups (LCBGs) in the euro area remained muted in the second and third quarters of 2012, negatively affected by higher loan loss provisions, by losses associated with disposals of assets and by increases in the fair value of banks’ own debt in the third quarter of 2012. The earnings outlook for euro area banks remains subdued, given headwind from a combination of economic and regulatory developments as banks optimise their business models. At the same time, euro area LCBGs’ solvency positions continued to improve steadily in the second and third quarters of 2012, helped by both increases in capital levels – primarily through retained earnings – and reductions in risk-weighted assets due to deleveraging and risk-weighted asset optimisation. The average financial performance of large euro area insurers remained stable, given stable underwriting and investment income. While the capital buffers of the sector still include a reasonable amount of shock-absorption capacity, profitability will be tied closely to a weak pace of economic expansion.
The risk outlook for banks is characterised by two potentially negative factors. First, a weakening macroeconomic backdrop has implied higher credit risk for the euro area banking sector. Second, funding risk remains an issue for a number of banks, despite the recent improvement in funding conditions after the announcement of further exceptional measures by the ECB. In particular, developments in euro area funding markets have continued to be characterised by significant fragmentation, with bank funding conditions in countries under stress characterised by low rollover rates of maturing debt, elevated costs of issuing new debt and, in some cases, weak deposit trends. If these developments persist, inefficient financial intermediation could ensue and seriously harm growth prospects. The risk outlook for insurers is likewise highly heterogeneous, following diverging macroeconomic activity and a geographic fragmentation of financial markets, with a low-yield environment in certain jurisdictions potentially pushing insurers towards more lucrative non-core activities that need to be closely monitored.
Scenario-based analysis suggests that a materialisation of key risks (including an economic slowdown, an aggravation of the sovereign debt crisis and an increased fragmentation and heightened distress of bank funding markets) could have significant implications for the banking and insurance sectors, as well as for the wider euro area economy. The estimated impact, however, is likely to be mitigated by the currently ongoing bank recapitalisation processes, by the potential for further progress on policy reform and by the effects of exceptional ECB policy measures on wholesale funding constraints.
Last but not least, ongoing regulatory initiatives both in Europe and around the globe should help to structurally strengthen euro area financial stability.
4.1 tHe eurO area banking sectOr: alOng tHe PatH tO a new POst-crisis wOrlD1
financial sOunDness Of large anD cOmPleX banking grOuPsProfitability remained subdued for the vast majority of the large and complex banking groups (LCBGs) in the euro area in the second and third quarters of 2012, irrespective of whether it is compared with the previous year or with the previous quarters (see Chart 4.1). Profitability developments were, on average, negatively affected by losses associated with both disposals of
1 The sample used for most of the analysis carried out in this section includes 18 euro area banks. The criteria for identifying them are described in ECB, “Identifying large and complex banking groups for financial system stability assessment”, Financial Stability Review, December 2006. However, at the time of writing, not all quarterly figures were available for all banks.
Profitability has been declining for almost all LCBGs…

58ECBFinancial Stability ReviewDecember 20125858
assets and increases in the fair value of banks’ own debt, as well as by higher loan loss provisions for some banks. Steeper declines in profi tability, however, were avoided thanks to broadly stable interest income and fee and commission income.
Net interest income continued to be the main source of LCBGs’ income. In an environment of weak profi tability, it remained broadly stable across banks (see Chart 4.2 and Chart S.6.3), on account of muted or negative loan growth, as well as broadly fl at interest margins. Net fee and commission income remained broadly stable too, as the negative effects of sluggish economic activity and weak lending growth were mitigated by income generated from corporate bond issuance, which increased in the second and third quarters of 2012 as corporates took advantage of low yields to disintermediate their fi nancing. Trading income decreased slightly in the second quarter of 2012, but almost all euro area LCBGs avoided trading losses, and trading income in the third quarter of 2012 was higher than that recorded in the corresponding period of the previous year. Finally, the weakening economic environment and the associated deterioration in credit quality resulted in a broad-based – but only slight – increase in LCBGs’ loan loss provisions.
The earnings outlook for euro area banks remains subdued, given headwinds from a combination of economic and regulatory developments, as banks make their business models more robust for the post-crisis period. Bank analysts generally expect LCBGs’ earnings to decline further in the fi nal quarter of 2012, before this negative trend is reversed in the fi rst two quarters of 2013 (see Chart 4.3).
Turning to banks’ asset quality, the second and third quarters of 2012 were characterised by, on average, broadly stable non-performing loan ratios, although the dispersion across banks widened
… due to losses associated with asset disposals and higher loan loss provisions
Non-performing loans are increasing
in some cases…
chart 4.1 return on equity of euro area large and complex banking groups
(2007 – Q3 2012; percentages; maximum, minimum, interquartile distribution and median)
-30
-20
-10
0
10
20
30
-30
-20
-10
0
10
20
30
-58 -81 -86
2007 2009 2011Q1
2011Q2 Q3 Q4 Q1
2012Q2 Q3
Sources: Individual institutions’ fi nancial reports and ECB calculations.
chart 4.2 breakdown of the sources of income of euro area large and complex banking groups(2007 – Q3 2012; percentage of total assets; mean values)
-0.50
-0.25
0.00
0.25
0.50
0.75
1.00
1.25
1.50
-0.50
-0.25
0.00
0.25
0.50
0.75
1.00
1.25
1.50
net interest incomenet fee and commission incomenet trading incomeloan loss provisions
2007 2009 2011Q1
2011Q2 Q3 Q4 Q1
2012Q2 Q3
Sources: Individual institutions’ fi nancial reports and ECB calculations.

59ECB
Financial Stability ReviewDecember 2012 59
4 eurO area f inancial
inst itutiOns
59
and several banks reported signifi cant increases. Thanks to higher loan loss provisioning, banks’ coverage for non-performing loans has improved somewhat.
This higher provisioning was a welcome development since several banks have reduced their coverage ratios over the past few years. On average, coverage ratios declined from 60% in 2008 to 55% in the fi rst half of 2012 (see Chart 4.4). Developments across banks varied widely, however, with some banks increasing their coverage ratios at the same time as other banks reduced theirs by up to 25 percentage points. Some banks that have been reducing their coverage ratios would have reported lower profi ts if coverage of non-performing loans had been kept unchanged. This has also left such banks more vulnerable to increases in non-performing loans.
Euro area LCBGs’ solvency positions continued to improve steadily in the second and third quarters of 2012 for most banks. The steady increase in core Tier 1 capital ratios witnessed over past years gained momentum in the case of most banks in the fi rst two quarters of 2012 (see Chart 4.5), also in response to the recapitalisation exercise of the European Banking Authority (EBA) and continued to do so in anticipation of more stringent Basel III requirements in the third quarter. The increase
… and coverage ratios have declined during the crisis
Solvency positions have improved…
chart 4.3 Quarterly earnings per share of euro area large and complex banking groups
(Q1 2009 – Q3 2013; EUR; maximum, minimum, interquartile distribution and median)
-1.5
-1.0
-0.5
0.0
0.5
1.0
1.5
2.0
2.5
3.0
-1.5
-1.0
-0.5
0.0
0.5
1.0
1.5
2.0
2.5
3.0Analystestimates
2009 2010 2011 2012 2013
Source: Bloomberg.
chart 4.4 coverage ratios of euro area large and complex banking groups
(loan loss reserves as a percentage of non-performing loans)
0
10
20
30
40
50
60
70
80
90
100
0
10
20
30
40
50
60
70
80
90
100
1 2 3 4 5 6 7 8 9 10 11 12 13 14 15 16 17Bank
2008H1 2012median value in 2008median value in H1 2012
Source: SNL Financial.
chart 4.5 core tier 1 capital ratios of euro area large and complex banking groups
(Q1 2009 – Q3 2012; percentages; maximum, minimum, interquartile distribution and median)
4
5
6
7
8
9
10
11
12
13
14
4
5
6
7
8
9
10
11
12
13
14
2009 2010 2011 2012
Sources: SNL Financial and ECB calculations.

60ECBFinancial Stability ReviewDecember 20126060
in capital ratios was achieved both through reductions in risk-weighted assets that resulted from deleveraging and through risk-weighted asset optimisation (i.e. internal model modifi cations), as well as through increases in capital levels, mainly via retained earnings (see Charts 4.6 and S.6.9).
These developments with respect to euro area LCBGs were consistent with the actions taken by the 27 EU banks identifi ed as having a capital shortfall in the EBA’s capital exercise. Those banks strengthened their capitalisation by €115.7 billion, which was in excess of the initial shortfall of €72 billion identifi ed by the EBA. The capital increases were made up of direct capital measures in an amount of €83.2 billion and risk-weighted asset measures amounting to €32.5 billion.
After having successfully met the EBA’s capital targets, banks have turned their attention to the tougher Basel III capital requirements. Although Basel III has a long implementation period, some regulators have announced more ambitious timelines, as well as additional requirements on top of the rules agreed by the Basel Committee in some cases (some expect common equity Tier 1 capital ratios in excess of 8% to already be met at the end of 2012). In addition, analysts and investors are pressuring banks to meet the full Basel III requirements well before December 2018. Given these more stringent requests, some euro area LCBGs face pressure to increase their levels of common equity capital in the coming quarters. As much as this objective may well be within reach, it will nonetheless prove challenging to do so in the current environment where retained earnings are diffi cult to accumulate and share issuance is expensive.
Indeed, regulatory initiatives will have a still broader impact on bank capitalisation. Notable examples include the elimination of the prudential fi lter regarding changes in the market value of debt securities recorded in available-for-sale portfolios and deferred tax assets, making it necessary for some banks also to increase capital levels in response to their treatment under Basel III.
Prolonging a trend observed since 2008, euro area LCBGs continued to reduce their leverage after the fi nalisation of the June FSR, with the aggregate leverage ratio declining further to assets 23 times higher than equity in 2012 (see Chart 4.7 and Chart S.6.11). This ratio has fallen considerably since 2008 when assets were 31 times higher than banks’ equity. The substantial decline over the crisis period was driven by a signifi cant increase in banks’ equity (31%) as, on aggregate, total assets remained largely unchanged, after having decreased slightly up to the end of 2011 and then increasing this year. However, the stable aggregate asset picture masks signifi cant and diverging developments across LCBGs, with balance sheet reductions of between 5% and 27% for certain banks since 2008 contrasting with increases by up to 26% for others. The banks that recorded the largest declines in
… also in response to the EBA’s capital
exercise…
… but some banks still have some
way to go before meeting Basel III
requirements
chart 4.6 core tier 1 capital and risk-weighted assets of euro area large and complex banking groups(Q1 2009 – Q3 2012; percentage change per quarter; maximum, minimum, interquartile distribution and median)
Core Tier 1 capital
-20
-10
0
10
20
30
-20
-10
0
10
20
30
2009 2010 2011 2012
Risk-weighted assets
-15
-10
-5
0
5
10
15
-15
-10
-5
0
5
10
15
2009 2010 2011 2012
Sources: SNL Financial and ECB calculations.

61ECB
Financial Stability ReviewDecember 2012 61
4 eurO area f inancial
inst itutiOns
61
assets were those that had to reduce their balance sheets in order to comply with EU rules on state aid. Interestingly, in 2012 developments became more synchronised, as all but three euro area LCBGs increased their assets, and resulted in an aggregate increase of 2%. This can be linked to the three-year LTROs of late 2011/early 2012 which eased the signifi cant pressure on banks towards the end of last year to reduce assets – potentially in a disorderly fashion – in response to funding constraints.
In addition to the reduction in leverage ratios, there is further evidence of euro area banks’ efforts to deleverage or restructure their balance sheets. First, banks in EU/IMF programme countries have made considerable progress in reducing their loan-to-deposit ratios to levels in line with programme recommendations. More generally, the aggregate loan-to-deposit ratios of euro area LCBGs fell further in 2012, to 120% in June, although the pace of decline was rather muted in comparison with that of other banking sectors in the wake of banking crisis, with the exception of Japan (see Chart 4.8). Second, refl ecting their plans to target non-core non-domestic assets, euro area banks reduced their international claims by a quarter from the end of 2008 to mid-2012. In terms of magnitude, the largest reduction was towards other euro area countries, which account for the bulk of such international claims. However, the focus of banks’ reductions this year was largely on external regions, in particular the United States, where euro area banks reduced their claims by more than USD 180 billion, or 11%, in the fi rst half of 2012. The considerable decline over a short space of time may refl ect US dollar funding diffi culties on account of both US money market funds reducing their exposures to European banks and European subsidiaries in
chart 4.7 leverage ratio of euro area large and complex banking groups
(Q4 2011 – Q3 2012; asset-to-equity ratio)
0
5
10
15
20
25
30
35
0
5
10
15
20
25
30
35
Leverage2011
Equity increase
Asset increase
Leverage H1 2012
Leverage Q3 2012*
24.423.6 23.5
Sources: Individual institutions’ fi nancial reports and ECB calculations. Note: Data for the third quarter of 2012 exclude three LCBGs for which quarterly data are unavailable.
chart 4.8 evolution of banks’ loan-to-deposit ratios following crises
(percentages; non-bank loans over customer deposits)
60
80
100
120
140
160
60
80
100
120
140
160
t 1 2 3 4 5 6 7 8 9 10 11
Finland ( t = 1991)
Japan (t = 1997)
Sweden (t = 1991)
United States (t = 2007)
Norway (t = 1991)
euro area LCBGs (t = 2008)
x-axis: years following the banking crisis
Sources: OCED, Federal Reserve System, individual institutions’ fi nancial reports and ECB calculations. Notes: Banking crises dates are based on L. Laeven and F. Valencia, “Resolution of Banking Crises: The Good, the Bad, and the Ugly”, IMF Working Paper, No 10/146, 2010.

62ECBFinancial Stability ReviewDecember 20126262
the United States experiencing deposit outflows. Finally, banks have de-risked their balance sheets significantly – given that the risk-weighted assets of euro area LCBGs, expressed as a proportion of their total assets, have fallen from 34% in 2008 to 31% in mid-2012.
banking sectOr OutlOOk anD risks
Outlook for the banking sector on the basis of market indicators Market-based indicators have shown considerable volatility over the past six months, with sharp movements underlining the strong influence of major policy initiatives. After the finalisation of the June FSR, market-based indicators initially pointed to a deterioration in the risk outlook for euro area LCBGs, largely on account of the intensification of the sovereign debt crisis, but also in reflection of the deterioration in the economic outlook, weak earnings results and, in some cases, rising levels of non-performing loans. However, developments changed noticeably after the announcement by the ECB of further actions to counter the euro area sovereign debt crisis, including the unveiling of Outright Monetary Transactions (OMTs). The positive market response to the announced measures led almost immediately to an improvement in equity market valuations and, in particular, in credit risk indicators for euro area LCBGs. Nonetheless, market indicators still show an elevated risk aversion when compared with the first half of last year, as euro area banks still face considerable challenges over the short to medium term, including a weaker outlook for both earnings and growth, the need to adjust business models further and to rebalance funding profiles, and, for banks in countries under stress, a more pronounced deterioration of asset quality in a recessionary environment.
The median share price of euro area LCBGs has shown a modest improvement since the finalisation of the previous FSR, although the divergence of prices has increased across institutions (see Chart S.6.21), with some of them experiencing a decline in prices. This heterogeneity of share price developments reflects more discerning behaviour by investors whose concerns are increasingly differing across entities, depending on specific underlying fundamentals. Price-to-book ratios of LCBGs, despite showing some improvement, remain at quite low levels owing to heightened risk perceptions and a deterioration of expectations regarding returns (see Box 4). Stock borrowing fees, which serve as a good summary measure of the dynamics of the stock lending market and investor sentiment, indicate that the high demand by short-sellers for some LCBGs’ shares that was evident at the beginning of the year has contracted (see Chart 4.9). At the system-wide level, there is no evidence of any extensive short-selling of institutions’ stocks; investor concerns are institution-specific. The implied volatility of bank equity indices remains higher than that of general market indices, indicating that uncertainty regarding the outlook for the banking sector is higher than that for other sectors.
A key indicator of financial stress that captures the interdependence of risk across euro area banks has decreased, as shown by the significant decline of estimates of the conditional joint probability of the failure of two or more banks, as measured by the systemic risk measure, although the latter still remains relatively high (see Chart 4.10). The timing of the improvement in this measure coincides with announcements of OMTs and the expansion of the collateral framework after the ECB Governing Council’s decisions of August. The decline in LCBGs’ median credit default swap (CDS) spread since end-July indicates an improvement in market participants’ perceptions of banks’ default risk (see Chart S.6.19). Nonetheless, CDS spreads remain elevated in comparison with the first half of last year, and the range of spreads across banks has widened significantly, highlighting increased financial fragmentation.
Despite improvements
since late July, market-based indicators still
show an elevated risk aversion…

63ECB
Financial Stability ReviewDecember 2012 63
4 eurO area f inancial
inst itutiOns
63
box 4
DevelOPments in tHe Price-tO-bOOk ratiOs Of large anD cOmPleX banking grOuPs
The fi nancial crisis and its consequences, including the deterioration of economic activity, have had a strong impact on the market valuation of fi nancial institutions across the globe – particularly on that of large and internationally active banks. One manifestation thereof has been a considerable drop in the current market price-to-book value ratios of large and complex banking groups (LCBGs) (see Chart A, panel a), to levels below one for all but two institutions. This occurred despite signifi cant efforts by banks to ease investor concerns by strengthening their balance sheets and improving their capital ratios (see Chart B).
A price-to-book ratio of less than one gives rise to concern for a number of reasons. First, it means that it is expensive for the LCBGs to issue equity, which might impinge on their ability to raise capital through fi nancial market channels in a cost-effective way – thereby increasing the potential for asset disposal or lending restrictions. Second, it can indicate that investors believe that the book value of such banks overstates their actual value. This may stem from concerns that banks have not fully recognised losses on certain assets, a fear which may be heightened with respect to banks with operations in euro area countries where asset quality has deteriorated
chart 4.9 cost of borrowing stocks of selected euro area large and complex banking groups(Jan. 2007 – Nov. 2012; cost-of-borrowing score based on seven-day stock borrowing fees)
0
1
2
3
4
5
6
7
8
9
10
0
1
2
3
4
5
6
7
8
9
10
2007 2008 2009 2010 2011 2012
highestsecond highestthird highestmedian
Sources: Data Explorers and ECB calculations.Notes: Data include 11 euro area LCBGs. The cost-of-borrowing score is a number from 1 to 10 that indicates the cost of borrowing particular securities, based on seven-day fees, with 1 the cheapest and 10 the most expensive.
chart 4.10 Probability of a simultaneous default by two or more large and complex banking groups, as measured by the systemic risk measure(Jan. 2007 – Nov. 2012; probability; percentages)
0
5
10
15
20
25
30
0
5
10
15
20
25
30
2007 2008 2009 2010 2011 2012
Sources: Thomson Reuters Datastream and ECB calculations.Notes: The systemic risk measure covers a sample of 15 banks and uses a one-year horizon. See Box 8 in ECB, Financial Stability Review, June 2012, for further details.

64ECBFinancial Stability ReviewDecember 20126464
signifi cantly or where non-performing loans are rising. Third, a price-to-book ratio of below one can indicate that investors do not believe that LCBGs can generate earnings to meet their required rates of return. Investors may be pessimistic with regard to banks’ future earnings, given the weak macro-fi nancial outlook, the outlook for LCBGs’ future income from global capital market operations and the fact that necessary regulatory surcharges imposed on most LCBGs under Basel III may temporarily dampen their earnings. Pessimism with respect to future earnings seems to be more pronounced for euro area LCBGs than for their global counterparts (see Chart C). Investors may be concerned regarding the possibility of injections of public capital into banks of certain euro area countries, which could dilute dividend cashfl ows if they lead to the creation of preference shares. In addition, the rates of return desired by investors may have increased as LCBGs are currently considered to be more risky than they were in the past (see Chart A, panel b).
Regardless of institution or region-specifi c idiosyncrasies, the observed decline in the price-to-book ratios of LCBGs has largely been a phenomenon shared by all regions (see Chart A, panel a). The average correlation between daily changes in price-to-book ratios of euro area LCBGs and those of global LCBGs – which include banks in the United States, the United Kingdom and Switzerland – increased from 0.45 in the period from January 2007 to April 2010 to 0.50 in the period from May 2010 to November 2012. In addition, cluster analysis on changes in the price-to-book ratios of LCBGs indicates that
chart a average price-to-book ratios and credit default swap spreads of selected lcbgs
0.0
0.5
1.0
1.5
2.0
2.5
3.0
0.0
0.5
1.0
1.5
2.0
2.5
3.0
euro area LCBGsUK and Swiss LCBGsUS LCBGs
2006 2007 2008 2009 2010 2011 2012
a) Average price-to-book ratio (Jan. 2006 - Nov. 2012)
b) Average five-year CDS spread (inverse; Jan. 2007 – Nov. 2012; basis points)
0.0
0.5
1.0
1.5
2.0
2.5
3.0
0.0
0.5
1.0
1.5
2.0
2.5
3.0
euro area LCBGsUK and Swiss LCBGsUS LCBGs
2006 2007 2008 2009 2010 2011 2012
0
100
200
300
400
500
600
0
100
200
300
400
500
6002007 2008 2009 2010 2011 2012
euro area LCBGsUK and Swiss LCBGsUS LCBGs
Sources: Bloomberg, Thomson Reuters Datastream and ECB calculations.
chart b Price-to-book ratios and tier 1 capital ratios of selected lcbgs
(Q4 2007 and Q3 2012; x-axis: price-to-book ratio; y-axis: Tier 1 capital ratio)
4
6
8
10
12
14
16
18
20
4
6
8
10
12
14
16
18
20
0.0 0.5 1.0 1.5 2.0
Q4 2007
Q3 2012
euro area LCBGs – Q3 2012
euro area LCBGs – Q4 2007UK and Swiss LCBGs – Q4 2007 US LCBGs – Q4 2007
US LCBGs – Q3 2012UK and Swiss LCBGs – Q3 2012
Sources: Individual institutions’ fi nancial reports and Bloomberg.

65ECB
Financial Stability ReviewDecember 2012 65
4 eurO area f inancial
inst itutiOns
65
risks emanating from banks’ lending to corporates and householdsThe level of credit risk confronting the euro area banking sector has increased somewhat, on average, since the fi nalisation of the June FSR. However, developments continue to differ strongly across countries, and across individual banks, on account of banks’ different geographical and sectoral credit risk exposures.
Looking at general credit growth and asset price developments, the latest reading of the global credit gap indicator suggests that credit-related early warning signals of crises in OECD economies remain near record lows by historical standards (see Chart 4.11). Indeed, the global credit gap also remained well below its early warning threshold for costly asset price booms in the second quarter of 2012. The slight increase observed over the last four quarters refl ects a decline in the recursively estimated trend, rather than an increase in credit.
Continued deterioration in the credit risk outlook
movements have become less dissimilar since the outbreak of the euro area sovereign debt crisis, although it is still possible to distinguish sub-clusters of institutions according to the geographic region (see Chart D). These developments could highlight the aforementioned challenges and/or concerns that are specifi c to LCBGs.
The most concerning aspect of the currently low level of price-to-book ratios from a fi nancial stability point of view may be the implied challenging environment for LCBGs with respect to raising capital. Against a backdrop of a weakened economic outlook, improving price-to-book ratios will require banks to address investor concerns by recognising losses on troubled assets, improving the transparency of their balance sheets and adjusting their business models to reduce risk and improve their earnings prospects. As banks address these issues, the rate of return required by investors should decline and their views regarding banks’ earnings potential should improve, leading to an increased willingness to invest in LCBGs.
chart c earnings per share of euro area and global lcbgs
(H1 2011 – H1 2013; EUR; maximum, minimum, interquartile distribution and median)
-1
0
1
2
3
4
5
6
-1
0
1
2
3
4
5
6
-1
0
1
2
3
4
5
6
-1
0
1
2
3
4
5
6
H12011 2011
H2 H12012
H2 H12013
H1 H2 H12012
H2 H12013
Euro area LCBGs Global LCBGsAnalystestimates
Analystestimates
Sources: Bloomberg and ECB calculations.
chart D clustering of changes in lcbgs’ price-to-book ratios before and after the euro area sovereign debt crisis
(Jan. 2007– Nov. 2012; distance)
0.0
0.5
1.0
2.0
1.5
0.0
0.5
1.0
2.0
1.5
Jan. 2007 to April 2010
euro area LCBGs
May 2010 to Nov. 2012
US LCBGsUK and Swiss LCBGs
Sources: Bloomberg and ECB calculations.

66ECBFinancial Stability ReviewDecember 20126666
Lending by monetary fi nancial institutions (MFIs) to households and fi rms showed divergent patterns after the June FSR. Total lending to households picked up somewhat, on average, in recent months, whereas lending to the corporate sector declined (see Chart 4.12). However, developments differed greatly across countries, with signifi cant declines in lending volumes being recorded in some countries (see Section 2).
The divergent patterns in lending to the non-fi nancial private sector were accompanied by higher levels of credit risk for euro area banks, due to the deterioration in the credit quality of borrowers (see Section 2). The slowdown in economic activity, which brought lower profi ts for fi rms and higher unemployment rates among households, was the main contributor to the deterioration in credit quality. Deteriorating credit quality was evident in rising non-performing loan ratios for some banks (see Chart 4.13).
In some cases, banks responded to higher credit risk by reducing their credit exposures with higher risk weights (see Chart 4.14). This reduction is likely to have been a consequence of deleveraging and/or the de-risking of credit exposures, but also – to some extent – a result
Divergent patterns in lending to the private sector…
… with deteriorating
creditworthiness of borrowers
Banks have responded to higher
credit risk by deleveraging…
chart 4.11 global credit gap and optimal early warning threshold
(Q1 1980 – Q2 2012; percentages)
-6
-4
-2
0
2
4
6
-6
-4
-2
0
2
4
6
1980 1984 1988 1992 1996 2000 2004 2008 2012
Sources: ECB and ECB calculations.Note: For details, see L. Alessi and C. Detken, “Quasi real time early warning indicators for costly asset price boom/bust cycles: A role for global liquidity”, European Journal of Political Economy, Vol. 27(3), September 2011, pp. 520-533.
chart 4.12 euro area monetary financial institutions’ lending to households and non-financial corporations(July 2009 – Oct. 2012; EUR billions; three-month moving average of transactions)
-20
-15
-10
-5
0
5
10
15
20
-20
-15
-10
-5
0
5
10
15
20
2009 2010 2011 2012
non-financial corporationshouseholds
Source: ECB. Note: Loans adjusted for sales and securitisation, expressed in seasonally adjusted terms.
chart 4.13 non-performing loan ratios of euro area large and complex banking groups
(Q1 2008 – Q3 2012; percentage of total loans; maximum, minimum, interquartile distribution and median)
0
2
4
6
8
10
12
14
0
2
4
6
8
10
12
14
2008 2009 2010 2011 2012
Source: Bloomberg.

67ECB
Financial Stability ReviewDecember 2012 67
4 eurO area f inancial
inst itutiOns
67
of risk-weighted asset optimisation (i.e. internal model modifi cations). In addition, some banks appear to have been responding to more stringent capital requirements for market risk by reducing their credit risk exposures. The implementation of the Capital Requirements Directive III (CRD III), the so-called “Basel 2.5” regulatory framework, on 31 December 2011 did indeed result in signifi cant shifts in the composition of some banks’ capital ratios in the fi nal quarter of 2011 (see Chart 4.14), in particular by applying considerably higher risk weights both to securitisations in the trading book and to market risks measured via internal models.
The bank lending survey of October 2012 showed that euro area banks also responded to the deterioration in the credit quality of borrowers by continuing to tighten lending standards (see Chart 4.15). The net tightening of credit standards for loans to fi rms increased in the third quarter of 2012, and remained broadly stable for housing loans. Looking ahead, euro area banks expected a further net tightening of credit standards in the fi nal quarter of 2012.
More prudent lending behaviour can help mitigate increased credit risks for banks. However, such action runs the risk of spurring negative second-round effects in the economy through a reduced availability of credit. Nevertheless, non-conventional measures adopted by the Eurosystem, in particular the three-year LTROs, are expected to continue both to mitigate funding concerns and to reduce the pressures faced by some banks that could lead to excessive credit rationing. Indeed, the October 2012 bank lending survey revealed that the impact of banks’ costs of funds and balance sheet constraints on the net tightening of lending standards has eased. Nevertheless, since other factors affecting banks’ credit standards have intensifi ed, the overall net tightening increased, which caused the previously observed co-movement between credit standards and money market conditions to disappear (see Chart 4.15).
… and by tightening lending standards
chart 4.14 changes in euro area large and complex banking groups’ risk-weighted assets for credit and market risk(Q1 2009 – Q3 2012; quarter-on-quarter percentage change)
Credit risk
-20
-15
-10
-5
0
5
10
15
20
-20
-15
-10
-5
0
5
10
15
20
2009 2010 2011 2012
Market risk
-100
-50
0
50
100
150
200
250
-100
-50
0
50
100
150
200
250
2009 2010 2011 2012
Source: SNL Financial.
chart 4.15 changes in euro area banks’ credit standards for loans or credit lines and the three-month euribOr/Ois spread(Q1 2007 – Nov. 2012)
0
20
40
60
80
100
120
140
160
-10
0
10
20
30
40
50
60
70
2007 2008 2009 2010 2011 2012
change in credit standards for corporate loans(net percentage; left-hand scale)changes in credit standards for house purchase loans(net percentage; left-hand scale)EURIBOR/OIS spread (basis points; right-hand scale)
Sources: ECB and Bloomberg.

68ECBFinancial Stability ReviewDecember 20126868
counterparty credit riskFollowing a request by Spain for up to €100 billion in support of its banking system from euro area governments in early June 2012, the median cost of protection against the default of a euro area LCBG, as refl ected by CDS spreads, has been on a downward trend and had decreased signifi cantly by early November 2012 (see Chart 4.16). An improvement was also observed in the euro area spread between unsecured interbank and repo rates (see Chart S.5.7). Market participants continued to view euro area LCBGs as somewhat less creditworthy than their non-euro area counterparts. At the same time, the close co-movement of perceived riskiness also suggested a high degree of interdependence between the largest banks globally.
While the resources and attention devoted to the management of counterparty credit exposures has been high and increasing, this holds even more true for collateral management issues. In addition to the generally greater preference for the collateralisation of credit exposures – partly also on account of the stricter regulatory requirements associated with unsecured exposures – the forthcoming mandatory central clearing of standardised over-the-counter (OTC) derivatives and the related margin requirements for derivatives that are not centrally cleared will further increase demand for eligible collateral assets. As a result thereof and also in the context of, in some cases, already high asset encumbrance levels,2 banks have been actively improving their collateral management systems with a view to optimising the use of available collateral. These changes include, among other things, a better tracking and aggregation of collateral to maximise funding capacity, utilisation of netting benefi ts and collateral swap (transformation) possibilities.
The euro area sovereign debt crisis continued to be the main driver of changes in price and non-price counterparty credit terms for securities fi nancing and OTC derivatives transactions. While changes to non-price terms tend to be less frequent and may, in some cases, require changes to legal documentation, some of them, such as haircuts, are dependent on market developments, and were thus also infl uenced by strains and volatility in the euro area sovereign debt markets. In this context and given that credit terms set by European banks are infl uenced more often than not by competition from globally active banks, it is noteworthy that the Federal Reserve System’s latest quarterly opinion survey on dealer fi nancing terms did not point to any signifi cant changes in price and non-price counterparty credit terms for the fi nancing of US dollar-denominated securities and OTC derivatives transactions with non-dealer counterparties. Nevertheless, dealers did report a slight easing for some counterparties, traditionally non-leveraged institutional investors such as pension funds, mutual funds, endowments and insurance companies (see Chart 4.17).3 Surveyed dealers, some of which were large European banking groups, continued to report persistent pressure from most-favoured clients, including hedge funds, to negotiate more favourable credit terms.
2 See Box 7, entitled “Asset encumbrance at euro area large and complex banking groups”, in ECB, Financial Stability Review, June 2012.3 Federal Reserve Board, “Senior Credit Offi cer Opinion Survey on Dealer Financing Terms”, September 2012.
Perceived counterparty credit
risk of euro area LCBGs has declined
Collateral management
issues have gained prominence
Non-price credit terms for wholesale
non-bank clients appear to have changed little
chart 4.16 credit default swap spreads of euro area and global large and complex banking groups(Jan. 2007 – Nov. 2012; basis points; senior debt; fi ve-year maturity)
0
100
200
300
400
500
600
700
800
900
1,000
0
100
200
300
400
500
600
700
800
900
1,000
2007 2008 2009 2010 2011 2012
minimum-maximum range of euro area LCBGsmedian of US, UK and Swiss LCBGsmedian of euro area LCBGs
Finalisation of the June 2012 FSR
Sources: Bloomberg and ECB calculations.

69ECB
Financial Stability ReviewDecember 2012 69
4 eurO area f inancial
inst itutiOns
69
The use of leverage by hedge funds nonetheless appeared to be moderate, and at the end of October 2012, the estimated proportion of hedge funds breaching triggers of cumulative total decline in net asset value (NAV)4 was below its longer-term median, suggesting moderate counterparty credit risk associated with banks’ exposures to these important and usually very active leveraged non-bank counterparties (see Chart 4.18).
funding liquidity risk Since August 2012, the improved sentiment in credit markets – thanks to expectations of a more decisive tackling of the sovereign debt crisis following ECB communications in late July and early August, as well as the announcement of the modalities of OMTs in early September – has contributed to an improvement in bank funding conditions. This manifested itself both in increased debt issuance volumes (see Chart 4.19) and in the tightening of spreads on senior unsecured debt and covered bonds (see Chart 4.20). As a further sign of improvement, several banks from distressed countries also returned to the debt markets, benefi ting from the signifi cant decrease in sovereign bond yields and the increase in investors’ risk appetite.
Notwithstanding the recent pick-up in primary market activity, by late November, year-to-date issuance of senior unsecured debt and covered bonds had declined by 22% and 48% respectively
4 NAV triggers can be based on a cumulative decline in either total NAV or NAV per share, and allow creditor banks to terminate transactions with a particular hedge fund client and seize the collateral held. As opposed to NAV per share, a cumulative decline in total NAV incorporates the joint impact of both negative returns and investor redemptions.
Conditions in bank funding have improved since August…
… but signs of funding market fragmentation remain …
chart 4.17 changes in the credit terms of us primary dealers for us dollar-denominated securities financing and Otc derivatives transactions with non-dealers(Q2 2010 – Q3 2012; net balance of reported changes as a percentage share of reporting dealers)
-60
-40
-20
0
20
40
60
-60
-40
-20
0
20
40
60
2010 2011 2012 2010 2011 2012 2010 2011 2012
Net tightening
Net easing
Hedge funds Insurancecompanies
Non-financialcorporations
price termsnon-price termsoverall change
Sources: Federal Reserve Board and ECB calculations. Notes: The net balance is calculated as the difference between the number of respondents reporting “tightened considerably” or “tightened somewhat” and those reporting “eased somewhat” or “eased considerably”. Up to the second quarter of 2011, the “hedge funds” group also included private equity fi rms and other similar private pools of capital, while the “insurance companies” group included pension funds and other institutional investors.
chart 4.18 estimated proportion of hedge funds breaching triggers of cumulative total nav decline(Jan. 1994 – Oct. 2012; percentage of total reported NAV)
0
5
10
15
20
25
30
35
40
0
5
10
15
20
25
30
35
40
1994 1996 1998 2000 2002 2004 2006 2008 2010 2012
-15% on a monthly basis-25% on a rolling three-month basis-40% on a rolling 12-month basis
Sources: Lipper TASS database and ECB calculations. Notes: Excluding funds of hedge funds. Net asset value (NAV) is the total value of a fund’s investments less liabilities; also referred to as capital under management. For each point in time, estimated proportions are based only on hedge funds which reported respective NAV data and for which NAV change could thus be computed. If several typical total NAV decline triggers were breached, then the fund in question was only included in the group with the longest rolling period. If, instead of one fund or sub-fund, several sub-fund structures were listed in the database, each of them was analysed independently. The most recent data are subject to incomplete reporting.

70ECBFinancial Stability ReviewDecember 20127070
compared with a year earlier. As a consequence, euro area banks refi nanced just over one-half of their term debt that matured in the fi rst eleven months of 2012. This resulted in negative net issuance of around €230 billion for the euro area banking sector as a whole, although fi gures varied greatly across countries (see Chart 4.21). In addition to the impact of the Eurosystem’s three-year LTROs, which are likely to have eased the need of several banks to refi nance themselves in the market in the near term, negative net issuance can also refl ect the ongoing deleveraging and restructuring processes in some banking sectors, as well as hampered market access and prohibitive funding costs – notably for many of the medium-sized and smaller banks – over a signifi cant part of the year. Moreover, the cost of issuing new debt remained highly dispersed across banks, mainly depending on the country of issuer, with swap spreads on Spanish and Italian banks’ newly issued senior unsecured debt ranging between 315 and 450 basis points in the period between August and November (see Chart 4.22).
Deposit fl ows have continued to show rather diverging patterns in different parts of the euro area since the fi nalisation of the June 2012 FSR, with signifi cant infl ows to the banking sectors of perceived safe-haven countries contrasting with moderate outfl ows of household and corporate deposits from some (but not all) countries under sovereign stress, although deposits in the latter group of countries showed signs of stabilisation in September and October.5 Funding strains in distressed countries were also refl ected in further increases in recourse to Eurosystem operations, even after the implementation of the three-year LTROs, although borrowing from the Eurosystem fell in September (see Chart 4.23). As another sign of funding market fragmentation, some cross-border banking groups have announced, or are already implementing, asset-liability management
5 It should be added that, in some cases, more signifi cant outfl ows were recorded in broader deposit aggregates, such as deposits from non-MFIs excluding general government. However, these declines were to a large extent related to outfl ows of deposits of securitisation vehicles categorised under non-monetary fi nancial intermediaries other than insurance corporations and pension funds (OFIs). The recent steeper decline of these deposits was mainly the result of an early termination of some (retained) securitisation transactions, related to the optimisation of banks’ collateral. Therefore, to a signifi cant extent, the decline in OFI deposits was infl uenced by the statistical recording of deposits from securitisation vehicles.
… leaving some banks to rely on
Eurosystem funding
chart 4.19 monthly issuance of medium and long-term debt securities by euro area banks
(Jan. 2010 – Nov. 2012; EUR billions)
0
10
20
30
40
50
60
70
80
90
100
0
10
20
30
40
50
60
70
80
90
100
2010 2011 2012
senior unsecured debtcovered bondssubordinated debt
Source: Dealogic. Note: Excludes retained deals.
chart 4.20 spreads between covered bond yields and euro swap rates
(Jan. 2010 – Nov. 2012; basis points)
0
50
100
150
200
250
300
350
400
450
500
550
0
50
100
150
200
250
300
350
400
450
500
550
2010 2011 2012
iBoxx EUR banks seniorFranceSpain
iBoxx EUR coveredGermanyItaly
Source: Markit.

71ECB
Financial Stability ReviewDecember 2012 71
4 eurO area f inancial
inst itutiOns
71
strategies that aim at matching assets and liabilities in countries in which they operate and, in particular, in some countries under stress.
Overall, despite the recent improvements in funding markets, fragmentation is evident in the shift of funding away from banks in countries under stress to those in other countries (see also Special Feature B). Furthermore, progress in reducing dependence on wholesale funding remains slow, at least in some countries, leaving banks vulnerable to adverse changes in market sentiment. Fragmentation in funding markets has amplifi ed deleveraging pressures on banks, in particular in countries under stress. Therefore, if these developments persist, there is a risk that ineffi cient fi nancial intermediation would seriously harm growth prospects.
market-related risksBanks’ interest rate risk has decreased somewhat over recent months – in terms of both yield curve dynamics and interest rate volatility. The recent improvement in market sentiment has been driven
Interest rate risk has decreased somewhat
chart 4.21 net issuance of medium and long-term debt securities by banks in selected euro area countries(Jan. – Nov. 2012; percentage of outstanding debt at end-2011)
-16
-14
-12
-10
-8
-6
-4
-2
0
2
4
-16
-14
-12
-10
-8
-6
-4
-2
0
2
4
1 France2 Netherlands 3 Belgium
4 Italy 5 Germany6 Spain
senior unsecured debtcovered bondstotal
1 2 3 4 5 6
Sources: Dealogic and ECB calculations.Notes: Excludes retained deals. Net issuance is shown as a percentage of total medium and long-term debt at the end of 2011.
chart 4.22 swap spreads on senior unsecured debt issued by euro area banks
(Jan. 2011 – Nov. 2012; basis points)
0
50
100
150
200
250
300
350
400
450
500
0
50
100
150
200
250
300
350
400
450
500
Jan. Apr. July Oct. Jan. Apr. July Oct.
“stressed” countriesother countries
2011 2012
Sources: Dealogic and ECB calculations.Notes: Based on fi xed rate euro-denominated deals with a face value of at least €500 million. Bond maturities range from 1.5 to 10 years. Excludes retained deals. In this chart, “stressed” countries refer to Italy and Spain.
chart 4.23 monthly changes in euro area monetary financial institutions’ liabilities
(Mar. 2011 – Oct. 2012; EUR billions)
-400
-300
-200
-100
0
100
200
300
400
500
600
-400
-300
-200
-100
0
100
200
300
400
500
600
capital and reservesinterbank depositsEurosystem fundingdebt securities <1 yearforeign deposits
private sector depositsgovernment depositsdebt securities >1 yearother liabilities
Apr. July Oct. Apr. July Oct.Jan.
Source: ECB.Note: Derivative instruments and other remaining liabilities are not shown.

72ECBFinancial Stability ReviewDecember 20127272
by market expectations regarding the non-standard monetary policy measures of major central banks. Compared with the June 2012 FSR, the euro area yield curve has steepened somewhat and the levels across the entire yield curve are the lowest recorded since at least the beginning of 2007 (see Chart 4.24). Notwithstanding the improvement in market conditions over the past few months, sentiment has remained fragile.
Data on MFIs’ holdings of government securities in countries where LCBGs are located indicate that median bank holdings of government securities increased between the fi nalisation of the June 2012 FSR and October 2012 (see Chart 4.25). The increase was driven by banks’ purchases of domestic sovereign bonds, with banks’ holdings of domestic sovereign bonds rising by 30% in October 2012, as compared with a year ago. On the other hand, holdings of non-domestic sovereign bonds have declined since the fi rst quarter of 2010, and banks’ holdings of non-domestic sovereign bonds decreased by 14% in October 2012, in comparison with a year ago. MFI data on holdings of domestic sovereign securities in countries where LCBGs are located show that the increase in these holdings has been relatively homogeneous across banking sectors. This, in part, could be attributed to fl ight-to-quality fl ows that were also observed during previous episodes of downturn in economic activity and credit cycles. In some cases, however, the increase in these holdings may also have been driven by banks’ carry trade activities after the two three-year LTROs.
At the same time, the median interest rate value at risk (VaR) for euro area LCBGs decreased somewhat as a percentage of shareholders’ equity in the second quarter of 2012. Nevertheless, the dispersion across institutions increased refl ecting increasing differences between the behaviour of euro area LCBGs.
Some banks increased their
government bond holdings…
chart 4.24 Developments in the euro area yield curve
(percentages)
0.0
0.5
1.0
1.5
2.0
2.5
3.0
3.5
4.0
0.0
0.5
1.0
1.5
2.0
2.5
3.0
3.5
4.0
1 1.5 3 4.5 6 7.5 10
December 2010 FSRJune 2011 FSRDecember 2011 FSRJune 2012 FSR21 November 2012
month yearsyearsyearsyears years years
Sources: ECB and Bloomberg.
chart 4.25 annual growth rates of monetary financial institutions’ government bond holdings in countries where large and complex banking groups are located(Jan. 2006 – Oct. 2012, percentage change per annum)
-60
-40
-20
0
20
40
60
80
100
-60
-40
-20
0
20
40
60
80
100
2006 2007 2008 2009 2010 2011 2012
maximumminimum
median
Sources: ECB and ECB calculations.

73ECB
Financial Stability ReviewDecember 2012 73
4 eurO area f inancial
inst itutiOns
73
According to the Dow Jones EUROSTOXX volatility index, volatility in equity markets decreased somewhat during the summer of 2012. As a result, the median equity VaR of euro area LCBGs decreased slightly as a percentage of shareholders’ equity, while at the same time the variation across euro area LCBGs increased. MFI statistics on banks’ shareholdings indicate that, on average, LCBGs decreased their equity market exposures slightly in the fi rst ten months of 2012 (see Chart 4.26), while the differences between countries have also decreased at the same time. These developments are affected by the continuing deleveraging process through which banks are decreasing their non-core activities.
Despite a decrease in equity market volatility in the course of the summer of 2012, the situation remains fragile as markets expect higher volatility in the months ahead, as indicated by the slope of the volatility term structure (see Chart 4.27). Euro area market developments depend mainly on the implementation of agreed measures and on the commitment of governments to keep their promises.
… while banks reduced equity market exposures further
chart 4.26 annual growth rates of monetary financial institutions’ shareholdings in countries where large and complex banking groups are located(Jan. 2006 – Oct. 2012; percentage change per annum)
-60
-40
-20
0
20
40
60
80
-60
-40
-20
0
20
40
60
80
2006 2007 2008 2009 2010 2011 2012
maximumminimum
median
Sources: ECB and ECB calculations.
chart 4.27 the slope of the Dow Jones eurOstOXX 50 volatility index futures curve
(Jan. 2010 – Nov. 2012; percentage)
-20
-15
-10
-5
0
5
10
-20
-15
-10
-5
0
5
10
2010 2011 2012
spread – 1 month to 12 monthsspread – 3 months to 12 months
Source: Bloomberg.
box 5
gauging tHe POtential fOr sOvereign anD banking sectOr sPillOvers in tHe eurO area
One salient feature of the euro area sovereign debt crisis has been the increase in fi nancial links and interdependencies between banks and sovereigns. In this environment, the incidence of shocks affecting the assessment of creditworthiness both on the sovereign and on the bank side has implied time-varying spillovers – across sovereigns, across banking sectors and between

74ECBFinancial Stability ReviewDecember 20127474
the two. One methodology that captures how such interdependencies can vary over time is the construction of an index that captures the potential impact of shocks to sovereign and bank credit default swap (CDS) spreads.1 This box links these two sets of data in a vector autoregression framework, augmented by several common regional and global factors as controls, for 11 sovereigns and nine country-specifi c groups of banks in the euro area.2 The index is based on an 80-day rolling window of derived generalised impulse responses from the dynamic relationships between the credit risk of banks and sovereigns.
The spillovers are captured in a weighted index of responses to shocks from given entities, referred to as the potential-for-spillover (PFS) index – with four sub-components: (i) across banking sectors; (ii) across sovereigns; (iii) from banks to sovereigns; and (iv) from sovereigns to banks.
In examining the overall index of potential spillovers, a peak was reached in June 2012, just prior to G20 and EU summits (see Chart A). Thereafter, it declined steadily. Similar declines were witnessed across the various sub-components of this spillover index – albeit with differences in the impact of the various major policy events identifi ed. Spillovers from banks to sovereigns
1 For a selection of other ECB research on the analysis of contagion, see e.g. V. Constâncio, “Contagion and the European debt crisis”, Banque de France Financial Stability Review, No 16, 2012, and ECB, Research Bulletin, No 14, 2011.
2 For a detailed description of the methodology, see A. Alter and A. Beyer, “The dynamics of spillover effects during the European sovereign crisis”, CFS Working Paper, No 2012/13, Center for Financial Studies, 2012.
chart a Pfs index and its components in the euro area
(May 2011 – Nov. 2012)
(i) PFS index, PFS across banks and PFS across sovereigns
(ii) PFS from banks to sovereigns and PFS from sovereigns to banks
10
15
20
25
30
35
40
45
10
15
20
25
30
35
40
45
May Aug. Nov. Feb. May Aug. Nov.
PFS indexPFS across banksPFS across sovereigns
I II III IV V
2011 2012
0
10
20
30
40
0
10
20
30
40
May Aug. Nov. Feb. May Aug. Nov.
PFS from banks to sovereignsPFS from sovereigns to banks
I II III IV V
2011 2012
Sources: CMA, Bloomberg and ECB calculations.Notes: The black vertical lines denote the following events: I. ECB reactivates purchases under the Securities Markets Programme (SMP); II. ECB announces second covered bond purchase programme (CBPP2); III. ECB announces three-year LTROs; IV. Spain seizes control of Bankia; and V. EU Summit. The PFS takes values between 0 (lowest contagion effect) and 100 (highest contagion effect). The PFS across banks and the PFS across sovereigns (panel i), as well as the PFS from banks to sovereigns and the PFS from sovereigns to banks (panel ii) are the sub-components of the PFS index.

75ECB
Financial Stability ReviewDecember 2012 75
4 eurO area f inancial
inst itutiOns
75
and across banking sectors decreased markedly after the ECB reactivated the Securities Markets Programme (SMP) in August 2011, as well as in the period after the EU Summit of mid-2012. Similarly, several other key policy interventions over the period from July 2011 to March 2012 helped to contain spillovers as captured by this index. In the last quarter, spillovers from banks to sovereigns increased considerably, while the potential for spillovers from sovereigns to banks remained subdued.
chart b the impact of several events on the Pfs index and its components
(20-day window around each event)
PFS across banks (left-hand scale)PFS across sovereigns (left-hand scale)PFS from banks to sovereigns (right-hand scale)PFS from sovereigns to banks (right-hand scale)
(I) ECB reactivates the Securities Markets Programme (II) ECB announces second covered bond purchase programme
10
20
30
40
20
25
30
35
40
PFS across banks (left-hand scale)PFS across sovereigns (left-hand scale)PFS from banks to sovereigns (right-hand scale)PFS from sovereigns to banks (right-hand scale)
4 August 2011
20
30
40
22
24
26
28
30
32
34
6 October 20111020
(III) ECB announces three-year LTROs (IV) Spain seizes control of Bankia
5
10
15
20
25
25
30
35
40
8 December 201110
15
20
25
20
30
40
10 May 2012
(V) EU Summit
15
20
25
30
25
30
35
40
45
28 June 2012
Sources: CMA, Bloomberg and ECB calculations.

76ECBFinancial Stability ReviewDecember 20127676
4.2 eurO area insurance sectOr: Overall resilience cOnceals a HigH level Of HeterOgeneity
financial cOnDitiOn Of large insurers 6
Large euro area insurers continued to show a broadly stable performance in terms of their profitability and capital positions in the second and third quarters of 2012.
6 The analysis is based on a sample of 19 listed primary insurers with total combined assets of about €4.3 trillion, representing 60% of the gross premiums written in the euro area insurance sector, and on a sample of three reinsurers with total combined assets of about €310 billion, representing about 30% of total global reinsurance premiums. Quarterly data were only available for a sub-sample of these insurers.
Insurers’ performance
remained modest but stable…
A closer scrutiny of key events is contained in Chart B and the table above – with the latter containing a 20-day window around each event. The components of the PFS index ten days after the event are compared with their levels ten days before the event. Four events are worth highlighting, building on developments in Chart A. First, the announcement of the second covered bond purchase programme (CBPP2) had a positive effect on all four components of the PFS index, resulting in a decrease of potential spillovers across banking sectors and sovereigns. Second, following the announcement of the three-year LTROs, the potential for spillover both across banking sectors and between banks and sovereigns decreased remarkably further. While those policy measures seem to have helped to tame funding pressures for banks, they nevertheless induced slightly higher potential spillover effects across sovereigns. Third, the circumstances surrounding the nationalisation of Bankia (event IV) had an adverse impact on all four sub-components of the PFS index. Finally, the decisions taken at the EU Summit (event V) contributed to a delinking of interdependencies in the euro area, especially among sovereigns.
All in all, these indices for spillovers suggest a key role for policy intervention in addressing adverse developments in the feedback loop between sovereigns and banks that has characterised much of the recent phase of euro area sovereign debt strains. In examining its time-varying nature, it is clear that policies resolutely addressing long-term issues have been most effective in stemming spillovers and contagion.
relative and absolute changes in Pfs indices around selected policy events
(percentages)
Change in PFS indices 10 days after the event compared to 10 days before
No Date Event
PFS across banks
PFS across sovereigns
PFS from sovereigns to banks
PFS from banks to sovereigns
Relative Absolute Relative Absolute Relative Absolute Relative Absolute
I 4.08.2011 ECB reactivates SMP purchases -11 -4 -26 -8 -1 -0.4 -32 -7
II 6.10.2011 ECB announces CBPP2 -11 -4 -14 -3 -22 -7 -56 -8III 8.12.2011 ECB announces
three-year LTROs -13 -5 4 1 -44 -8 -41 -6IV 10.05.2012 Spain seizes control
of Bankia 17 4 43 10 42 5 54 7V 28.06.2012 EU Summit -4 -1 -31 -11 -13 -3 -18 -5
Sources: CMA, Bloomberg and ECB calculations.Note: “Relative” refers to the change in the components of the PFS index ten days after relative to that ten days before the event. “Absolute” refers to the absolute change in the components of the PFS index, i.e. the difference between the level ten days after and that ten days before the event.

77ECB
Financial Stability ReviewDecember 2012 77
4 eurO area f inancial
inst itutiOns
77
Underwriting remained moderate on account of modest economic activity, as evidenced by the gross premiums written (see Chart S.6.15). Competitive pressures continued to persist in some non-life insurance markets, and with respect to life insurance products, although there were some exceptions. Reinsurers were able to increase their prices in products and markets affected by the natural catastrophes of last year. Life insurance continued to suffer from competition from other savings vehicles, although the impact of alleviated bank funding pressures could be seen in a decreasing pace of lapses and surrenders in some countries.
The profi tability indicators of large euro area insurers remained at comfortable levels, owing both to the lesser occurrence of natural catastrophes in the fi rst three quarters of 2012 and to positive investment income (see Charts 4.27 and 4.28). Combined ratios, encapsulating incurred losses and expenses as a proportion of premiums earned, decreased to below 100% for all insurers in the sample in the third quarter of 2012, thereby signalling profi table underwriting activity (see Chart S.6.16). Investment income remained positive on account of somewhat improved market returns and the absence of the signifi cant write-offs that had characterised developments in the past.
The capital buffers of large euro area insurers still seem to include some shock-absorption capacity (see Chart 4.29). Reinsurers, in particular, have been able to strengthen their capital through retained earnings. However, the capital positions may partially refl ect accounting effects, as low yields on highly rated government bonds infl ate insurance assets, and as liabilities in most jurisdictions in the euro area are not marked to market.7
insurance sectOr OutlOOk anD risksThe aggregate fi nancial situation of large euro area insurers is expected to remain stable over the next six to 12 months. The outlook, however, bears a high degree of heterogeneity across individual institutions and euro area countries, in line with the geographical fragmentation of markets.
7 Large, listed euro area insurers generally follow International Financial Reporting Standards (IFRSs), which provide for a uniform treatment of fi nancial assets (depending on their respective accounting classifi cation), but (currently) not for like treatment of insurance liabilities.
… on account of positive underwriting and investment income
Capital buffers still in place, although possibly infl ated
Stable overall outlook masks a high level of heterogeneity
chart 4.27 investment income and return on equity of selected large euro area primary insurers(2009 – Q3 2012; maximum, minimum, interquartile distribution and median)
0
1
2
3
4
5
6
7
8
0
1
2
3
4
5
6
7
8
2009 2011 2012Q1 Q2 Q3
2009 2011 2012Q1 Q2 Q3
Investment income(percentage of total assets)
-20-15-10-505
1015202530
-20-15-10-5051015202530
Return on equity (percentages)
-42% -58%
Sources: Bloomberg, individual institutions’ fi nancial reports and ECB calculations. Note: The quarterly data are annualised.
chart 4.28 investment income and return on equity of selected large euro area reinsurers(2009 – Q3 2012; minimum-maximum distribution and weighted average)
0
1
2
3
4
0
1
2
3
4
0
5
10
15
20
25
0
5
10
15
20
25
Investment income(percentage of total assets)
Return on equity(percentages)
Q1 Q2 Q3 Q1 Q2 Q32009 2011 2012 2009 2011 2012
Sources: Bloomberg, individual institutions’ fi nancial reports and ECB calculations. Note: The quarterly data are annualised.

78ECBFinancial Stability ReviewDecember 20127878
Low yields on highly rated government bonds and subdued economic activity continue to put pressure on profi tability, with life insurers with rigid guarantees suffering most. As regards solvency, volatility in government bond prices could impact balance sheet valuations and thus capital, the direction of the impact depending on the liability valuation rules of the jurisdiction. The low-yield environment may also push insurers towards more lucrative non-core activities, which would be a development that needs to be closely monitored. The negative rating outlooks generated by the low-yield environment, on the one hand, and sovereign risk in Europe, on the other, are making capital raising an increasingly expensive option for the insurance sector. Many insurers are therefore paying increasing attention to earnings retention, also with a view to the potentially higher future capital needs that will result from the forthcoming introduction of the risk-based requirements of the Solvency II framework.
earnings outlookAnalysts expect insurers’ earnings to remain stable in 2013 (see Chart 4.30). Market-based indicators for insurers showed some improvement despite continued volatility in the sector. Euro area insurers’ credit default swap (CDS) spreads and their dispersion across institutions remained wide, although they have declined since the publication of the June FSR (see Chart S.6.20). The average equity prices of insurance companies in mid-November 2012 were around 18% above those in mid-May (see Chart S.6.22).
Recent developments in competition between, and the pricing of, insurance products disclose some upside potential for revenue generation. Increases in prices of selected products, and in selected markets, in 2011 and 2012 are likely to reinforce the underwriting results for non-life insurance products and reinsurance over the next six to 12 months. The demand for reinsurance for risk-management purposes is expected, in addition, to increase on account of the forthcoming Solvency II regime. In life insurance, competition from banking products has decreased somewhat and lapse rates have levelled off as the funding situation of banks has improved.
Analysts’ expectations and
market indicators have improved
somewhat
Upside potential in the pricing of
selected products…
chart 4.30 earnings per share of selected large euro area insurers and real gDP growth
(Q1 2002 – Q4 2013)
-6-5-4-3-2-1012345
-6-5-4-3-2-1012345
2002 2004 2006 2008 2010 2012
actual earnings per share (EUR)real GDP growth (percentage change per annum)earnings per share forecast for 2012 and 2013 (EUR)real GDP growth forecast for 2012 and 2013 (percentage change per annum)
Sources: European Commission, Thomson Reuters and ECB calculations.
chart 4.29 capital positions of selected large euro area insurers
(2009 – Q3 2012; percentage of total assets)
0
10
20
30
40
50
0
10
20
30
40
50
median
Primary insurers(maximum – mininum,
inter-quartile distribution)
0
10
20
30
40
50
0
10
20
30
40
50
weighted average
Reinsurers(maximum – mininum,
distribution)
2009 2011 2012Q1 Q2 Q3
2009 2011 2012Q1 Q2 Q3
Sources: Bloomberg, individual institutions’ fi nancial reports and ECB calculations. Note: Capital is the sum of borrowings, preferred equity, minority interests, policyholders’ equity and total common equity.

79ECB
Financial Stability ReviewDecember 2012 79
4 eurO area f inancial
inst itutiOns
79
Downside risks to profi tability include an uncertain economic outlook and the persistence of the low-yield environment. Weak economic growth translates into sluggish demand for primary insurance. Analysts do not, therefore, expect the recent price increases to pave the way for a general hardening of insurance markets. Weakened growth prospects are also bound to increase credit risk in the corporate bond markets. The low yields on highly rated government bonds constitute an important risk for profi tability, especially in the case of some life insurers that, besides being subject to signifi cant re-investment risk owing to long-term liabilities, also offer minimum guarantees to their policyholders.8 But the high yields on lower-rated euro area government bonds also incorporate profi tability risks for life insurers. First, they may induce insurers to offer higher guarantees in the presence of high volatility, and have an inherent potential for rapid decreases in yields in the near future. Second, cautious pricing may result in less demand for insurance products as customers turn to other high-yielding savings products. So far, insurers seem to have generally adopted a cautious policy towards guarantees, implying that demand for life insurance products is likely to remain subdued in these markets until there is a return to stability.
main risks to solvencyThe most important risks to the overall solvency of the sector currently emanate from investment activity. Large euro area insurers continue to be highly exposed to government and corporate bond markets, which contrasts with a low aggregate exposure to equity, structured credit and commercial property. Uncertainty in the government bond markets, in particular, has generally remained at an elevated level over the past six months, although very recent data show a decline (see Charts 4.31 and 4.32).
The divergent developments in government bond yields and prevailing differences in accounting treatment across jurisdictions imply that the types of solvency risk the insurers are facing differ along the national borders. The recent tendency of insurers to increasingly match their investments and liabilities at a country level is contributing further to the fragmentation of the market.9
Many insurers are vulnerable to a solvency risk in the event of a sudden rise in yields. Most euro area jurisdictions do not currently treat insurance liabilities in a market-consistent way. Consequently, low yields on highly rated government bonds infl ate assets, but do not
8 Although new policies are being granted at substantially lower rates than in the past, the impossibility of renegotiating old policies in many countries implies a slow process towards lower average rates. For a discussion of the impact on insurers of low risk-free interest rates, see Box 16 in ECB, Financial Stability Review, June 2010. An analysis conducted by the European Insurance and Occupational Pensions Authority (EIOPA) concluded that the European insurance sector still seems to be capable of coping with a low-yield environment for some time to come, but that careful monitoring was warranted (see EIOPA, Financial Stability Report 2012: First half-year report, 7 June 2012 – available at https://eiopa.europa.eu/publications/fi nancial-stability/index.html).
9 It should be noted, however, that the impact of government bond yields on an individual institution ultimately depends on the investment profi le of the institution concerned, as well as on the maturity mismatch, hedging strategies and the exact product design. The risks outlined here may thus not apply in a straightforward way.
… versus risks to the economic outlook and the low-yield environment
Government and corporate bond markets key for investment risk
Regional differences in market developments and accounting treatment play a key role
chart 4.31 investment mix for selected large euro area insurers
(H1 2011 – H2 2012; percentage of total investments; maximum, minimum and interquartile distribution)
0
10
20
30
40
50
60
70
80
0
10
20
30
40
50
60
70
80
2011 2011 2011 2011 2011H2 H1H1 H2 H1H1 H2 H1H1 H2 H1H1 H2 H1H1
2012 2012 2012 2012 2012
Governmentbonds
Corporate bonds
Equity Commercial property
Structuredcredit
median
Sources: JPMorgan Cazenove, individual institutions’ fi nancial reports and ECB calculations.Notes: Based on consolidated fi nancial accounts data. The equity exposure data exclude investment in mutual funds.

80ECBFinancial Stability ReviewDecember 20128080
impact the valuation of liabilities in these countries. A rise in yields on highly rated government bonds would therefore imply a signifi cant decrease in the valuation of the assets, without any impact on the liabilities, thus decreasing solvency.
The persistent low-yield environment is the most pressing problem for solvency in those jurisdictions where it coincides with a market-consistent approach to the treatment of insurance liabilities. Besides the impact through a reduced profi tability that is independent of the accounting regime, the value of liabilities is higher in a low-yield environment, thus squeezing solvency through an additional channel. Although this is currently limited to a few euro area countries, and thus not considered to be a major solvency risk for large euro area insurers on aggregate over the next six to 12 months, the liability effect will gain in importance on the eve of the introduction of the Solvency II regime. Therefore, a persistent low-yield environment could become a major solvency risk in the medium term.10
Finally, although insurers’ investment exposures to lower-rated government bonds appear, on aggregate, to be manageable, additional marking-to-market valuation declines could challenge the solvency of insurers that have signifi cant exposures to the countries and sectors most affected by the current crisis. On the other hand, a sudden decrease of yields in these countries could also become a strain on solvency, should some companies not be cautious in their pricing of minimum guarantees. However, the modest development of gross premiums written and anecdotal evidence thus far point towards careful risk management in this regard.
In line with the manifold ways in which solvency is affected by market fragmentation and accounting treatments, the measures that some national supervisors have introduced to alleviate the impact of high market volatility on insurance balance sheets have differed as well.11 An adequate design, within Solvency II, of common measures to mitigate the impact of market volatility on balance sheets is still under discussion (see also Section 4.4).
10 In order to contain this medium-term risk, the EIOPA stress test 2011 was already conducted on the basis of Solvency II requirements. In this exercise, 10% of the participating institutions would have failed to fulfi l Solvency II minimum capital requirements under the adverse scenario. See https://eiopa.europa.eu/fi leadmin/tx_dam/fi les/Press-Room/Stress-Test-Results-Release.pdf.
11 See EIOPA, Financial Stability Report 2012: First half-year report, 7 June 2012, for an overview.
chart 4.32 investment uncertainty map for euro area insurers
(Jan. 1999 – Oct. 2012)
greater than 0.9
between 0.7 and 0.8between 0.8 and 0.9
below 0.7data not available
Government bond markets
Corporate bond markets
Stock markets
Structured credit
Commercial property markets
1999 2001 2003 2005 2007 2009 2011
Sources: ECB, Bloomberg, JPMorgan Chase & Co., Moody’s, Jones Lang LaSalle and ECB calculations.Notes: The chart shows the level of each indicator in comparison with its “worst” level (i.e. its highest or lowest level, depending on what is worse from an insurer’s perspective regarding investment) since January 1999. An indicator value of one signifi es the worst conditions in that market since January 1999. “Government bond markets” represent the euro area ten-year government bond yield and the option-implied volatility of ten-year government bond yields in Germany; “Corporate bond markets” the average of euro area A-rated corporations’ bond spreads and European speculative-grade corporations’ actual and forecast default rates; “Stock markets” the average of the index level and the price/earnings ratio of the Dow Jones EURO STOXX 50 index; “Structured credit” the average of euro area residential mortgage-backed securities and European commercial mortgage-backed securities spreads; and “Commercial property markets” the average of average euro area commercial property capital values and value-to-rent ratios. For further detail on how the uncertainty map is created, see Box 13 in ECB, Financial Stability Review, December 2009.

81ECB
Financial Stability ReviewDecember 2012 81
4 eurO area f inancial
inst itutiOns
81
Corporate bonds continue to contribute signifi cantly to the investment portfolios of large euro area insurers. Although the investment uncertainty map still signals relatively good investment conditions in this market, increasing exposure to this asset class, together with the weak macroeconomic outlook, may imply an increased credit risk in the future. Rating downgrades of corporate bonds could also risk forced selling on account of regulatory restrictions on insurance investments below the upper rating scales, possibly with a loss. Within the class of corporates, insurers remain particularly exposed to developments in the banking sector (see the next section on interlinkages).
Diverse factors may increase incentives for insurers to invest in the corporate sector in the future. Sovereign stress in the euro area, the decrease in demand in connection with the need for banks to deleverage and the low-yield environment are likely to make it attractive for insurers to invest in corporate bonds, but also in other high-yielding products that currently feature less prominently in their investment mix, despite the potentially higher, risk-based, capital requirements under the Solvency II framework (see Chart 4.31). Indeed, anecdotal evidence points towards an increased interest on the part of insurers in investment in non-fi nancial corporate bonds, as well as in project and infrastructure fi nancing. With portfolio adjustments in favour of the real economy, insurers may also alleviate the refi nancing risk that corporates are facing, thereby acting as a stabilising force in the market.
Solvency risks related to insurance underwriting have abated somewhat since the publication of the previous FSR. For non-life insurers, the limited losses due to catastrophes in the fi rst half of 2012 (see Chart 4.33) and the increases in the pricing both of catastrophe insurance in selected sectors and of motor insurance have improved the potential for generating capital through retained earnings. The forecasts regarding the Atlantic hurricane season have been broadly in line with actual events, supporting the assumption that insurers have set aside adequate reserves (see Chart 4.34). The estimates of the insured losses due to hurricane Sandy in the fourth quarter of 2012, albeit signifi cant, have thus far been contained for euro area insurers.12 For life insurers, the recent alleviation of competition for funds from the banking sector, in line with the improved liquidity conditions of banks, is reducing the risk of forced asset sales by insurers on account of a liquidity squeeze that could impact solvency.
interlinkages with the banking sectorInsurance companies have signifi cant links to the banking sector, which results in the possibility of potential stability impacts in both directions. Insurers are important institutional investors in the market. In addition, they act as counterparties in operations that are often labelled as non-core insurance activities, owing to their proximity to the banking business.
12 The bulk of the estimated loss of between USD 10 and USD 25 billion is likely to be borne by US primary insurers in the case of damage caused by wind, and by the US Government in the case of fl ood damage.
Signifi cant corporate bond exposures…
… may even increase further in the future
Risks related to underwriting have abated
chart 4.33 insured catastrophe losses
(1985 – H1 2012; USD billions)
0
20
40
60
80
100
120
0
20
40
60
80
100
120
1985 1990 1995 2000 2005 2010
earthquake/tsunamiweather-relatedman-made disasterstotal
Sources: EQECAT, Munich Re, Swiss Re and ECB calculations.
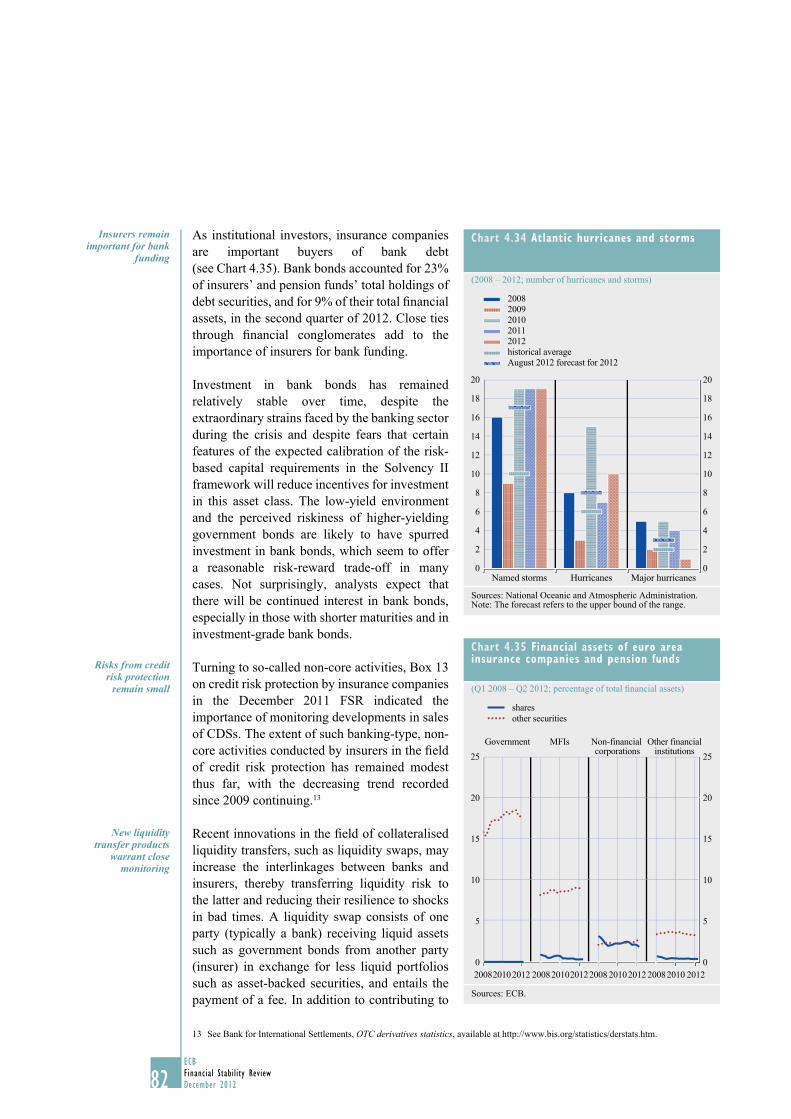
82ECBFinancial Stability ReviewDecember 20128282
As institutional investors, insurance companies are important buyers of bank debt (see Chart 4.35). Bank bonds accounted for 23% of insurers’ and pension funds’ total holdings of debt securities, and for 9% of their total fi nancial assets, in the second quarter of 2012. Close ties through fi nancial conglomerates add to the importance of insurers for bank funding.
Investment in bank bonds has remained relatively stable over time, despite the extraordinary strains faced by the banking sector during the crisis and despite fears that certain features of the expected calibration of the risk-based capital requirements in the Solvency II framework will reduce incentives for investment in this asset class. The low-yield environment and the perceived riskiness of higher-yielding government bonds are likely to have spurred investment in bank bonds, which seem to offer a reasonable risk-reward trade-off in many cases. Not surprisingly, analysts expect that there will be continued interest in bank bonds, especially in those with shorter maturities and in investment-grade bank bonds.
Turning to so-called non-core activities, Box 13 on credit risk protection by insurance companies in the December 2011 FSR indicated the importance of monitoring developments in sales of CDSs. The extent of such banking-type, non-core activities conducted by insurers in the fi eld of credit risk protection has remained modest thus far, with the decreasing trend recorded since 2009 continuing.13
Recent innovations in the fi eld of collateralised liquidity transfers, such as liquidity swaps, may increase the interlinkages between banks and insurers, thereby transferring liquidity risk to the latter and reducing their resilience to shocks in bad times. A liquidity swap consists of one party (typically a bank) receiving liquid assets such as government bonds from another party (insurer) in exchange for less liquid portfolios such as asset-backed securities, and entails the payment of a fee. In addition to contributing to
13 See Bank for International Settlements, OTC derivatives statistics, available at http://www.bis.org/statistics/derstats.htm.
Insurers remain important for bank
funding
Risks from credit risk protection
remain small
New liquidity transfer products
warrant close monitoring
chart 4.34 atlantic hurricanes and storms
(2008 – 2012; number of hurricanes and storms)
0
2
4
6
8
10
12
14
16
18
20
0
2
4
6
8
10
12
14
16
18
20
Named storms Hurricanes Major hurricanes
20082009201020112012historical averageAugust 2012 forecast for 2012
Sources: National Oceanic and Atmospheric Administration.Note: The forecast refers to the upper bound of the range.
chart 4.35 financial assets of euro area insurance companies and pension funds
(Q1 2008 – Q2 2012; percentage of total fi nancial assets)
0
5
10
15
20
25
0
5
10
15
20
25
200820102012 2008201020122008 20102012 20082010 2012
Government MFIs Non-financial corporations
Other financialinstitutions
sharesother securities
Sources: ECB.

83ECB
Financial Stability ReviewDecember 2012 83
4 eurO area f inancial
inst itutiOns
83
the asset encumbrance of banks, collateralised liquidity transfers may require a substantial upgrading of risk management procedures for insurers that are endeavouring to obtain returns outside their core competences. While warranting close monitoring, such products may contain a high degree of opaqueness, especially if conducted within a financial conglomerate.
4.3 assessment Of financial institutiOns
This section provides a quantitative assessment of various macro-financial scenarios that map the three main systemic risks identified in the previous sections of the FSR. The aim of this assessment is to illustrate the importance of these systemic risks using (i) a forward-looking solvency analysis, similar to a top-down stress test, for euro area LCBGs and (ii) a forward-looking analysis of the asset side of the euro area insurance sector. The analysis was carried out using publicly available data for individual banks and insurance companies, as well as bank exposure data disclosed in the 2011 EU-wide stress test and the 2011 EU capital exercise, both coordinated by the European Banking Authority (EBA).14
The assessment focuses on the following risks: (i) a potential aggravation of the debt crisis for euro area sovereigns – reflecting the implementation risk of recent policy measures aimed at containing the euro area debt crisis and materialising through an increase in long-term interest rates and declining stock prices; (ii) reduced bank profitability stemming from weaker economic growth and the higher credit and asset valuation losses associated therewith – materialising through a lack of growth-enhancing structural reforms, measured by adverse productivity shocks in a number of euro area countries; and (iii) fragmentation of, and heightened distress in, bank funding markets – reflected in reduced access to wholesale debt financing and deposit outflows in distressed countries, with a proportion thereof flowing to banks in the non-distressed euro area countries (see Table 4.1).
The first part of this section outlines the three macro-financial shock scenarios. The second part presents the impact of these scenarios on the loss-absorption capacity of the euro area banking sector.15 This is assessed using models of bank profitability and model-based estimates of credit and market risk-related losses. Furthermore, the analysis includes a ranking of the scenarios with respect to the size of the shocks needed under each scenario for the median bank capital ratio to reach a pre-specified level, in other words, a reverse stress test. In addition, the potential for interbank contagion effects under the different scenarios is illustrated. The third part of this section presents an assessment of the possible implications of the above-mentioned risks for the insurance sector. In the insurance stress
14 This assessment is based on a macro-prudential simulation exercise involving top-down stress testing tools. The results are not comparable with those of micro-prudential stress tests used for supervisory purposes, which analyse the solvency of individual financial institutions.
15 The results are derived using publicly available data based on EU banks’ financial reports up to the fourth quarter of 2011, also including data disclosed in the context of the EBA’s EU-wide stress test and EU capital exercises, and are therefore not based on confidential supervisory information.
… namely intensified contagion, reduced profitability and a fragmentation of funding
A quantitative assessment of three distinct macro-financial scenarios…
table 4.1 mapping main systemic risks into adverse macro-financial scenarios
Scenario/shock A. Sovereign contagion scenario
B. Funding stress scenario
C. Productivity shock to euro area countries
Type of systemic risk
An aggravation of the euro area sovereign debt crisis √ √
A deteriorating credit quality on account of a weaker economic environment
√ √
A fragmentation of, and distress in, bank funding markets √ √

84ECBFinancial Stability ReviewDecember 20128484
test, the risks are transmitted through two channels, namely (i) valuation effects on financial securities owing to changes in prices and (ii) changes in the credit quality of loan portfolios.
macrO-financial scenariOs
contagion of sovereign risk The contagion scenario is based on an increase in euro area sovereign bond yields to abnormally high levels. The shocks are assumed to emanate from euro area countries that are not covered by EU/IMF programmes and that are currently perceived by market participants, for various reasons and to differing degrees, as being particularly vulnerable to possible further contagion from euro area programme countries.16
Leaving aside the substantial response of Greek long-term government bond yields to such shocks, the resulting increase in ten-year government bond yields across euro area countries ranges from 0 to 545 basis points. The slope of national yield curves at the cut-off date is used to transpose the simulated shock to maturities other than ten years. It is moreover assumed that interest rates at all maturities remain at the higher level throughout the simulated horizon. Furthermore, the shock to bond yields has spillover effects on stock prices, ranging from -2% to -43% across the euro area countries, with the strongest negative impact being observed in Spanish and Italian stock markets.
The rise in sovereign bond yields has a number of effects on banks’ profit and loss accounts:
First, it implies marking-to-market valuation losses on euro area banks’ sovereign exposures in the trading book.17 By contrast, securities held in the available-for-sale portfolio and in the banking book are assumed to remain unaffected by the asset price shock, in line with treatment in the EBA’s 2011 EU-wide stress test.
Second, the increase in sovereign credit spreads raises the cost of euro area banks’ funding via a number of channels. First, an immediate and persistent increase of 40 basis points above the baseline is observed in short-term market interest rates.18 Second, wholesale bank funding costs are affected by country-specific shocks to banks’ credit default swap (CDS) spreads. Finally, the rise in short-term interest rates is passed on to short-term retail loan and deposit rates, thereby affecting banks’ net interest income.
Third, under the assumption that banks will seek to counter this shock by increasing their lending margins, an adverse impact on real economic activity is expected. The overall macroeconomic impact resulting from the initial shocks to banks’ solvency positions is derived using a dynamic
16 The selection of countries that are potentially vulnerable to further contagion is based on the level of sovereign bond yields in mid-October 2012. Smaller countries, e.g. Cyprus and Slovenia, have not been considered as countries from which shocks may emanate since their sovereign bonds outstanding are insufficient or their data quality is inadequate for carrying out a robust analysis. The calibration of the sovereign bond yield shock is based on daily compounded changes in ten-year government bond yields and stock prices observed since January 2011. These observations are used to simulate a joint, multivariate forward distribution of yields and stock prices 60 days ahead. In the simulation, long-term interest rates and stock prices in countries that are currently perceived by market participants as being particularly vulnerable to possible further contagion are shock-originating markets, with the shocks assumed to occur with 1% probability. The response for all other markets/countries is computed using a non-parametric model consistent with the shock probability assumption. The resulting shock sizes are dependent on the selected sample period. However, sensitivity analyses show that the shocks do not change materially if, for instance, the sample period is shortened to mid-2011.
17 The valuation haircuts are calibrated to the new levels of government bond yields, using the sovereign debt haircut methodology applied in the EBA’s 2011 stress test exercise. The impact of the Greek private sector involvement (PSI) has been incorporated by applying a 75% haircut to all Greek sovereign bond holdings (in the trading and the banking books).
18 The same simulation procedure as that used for calibrating long-term bond yield shocks across countries has been applied to the three-month EURIBOR at the euro area level and to national three-month money market rates in the case of non-euro area countries.
Under the first scenario, euro area sovereign
bond yields rise to abnormally high
levels…
… accompanied by a sharp decline in
stock prices
This implies losses in the trading book
and an increase in banks’ cost of funding…
… as well as an increase in banks’
lending margins

85ECB
Financial Stability ReviewDecember 2012 85
4 eurO area f inancial
inst itutiOns
85
stochastic general equilibrium (DSGE) model, which includes a household sector subject to borrowing constraints (linked to the value of their collateral), as well as a capital-constrained profit-optimising banking sector.19
The impact on real GDP – assuming an unchanged monetary policy and expressed in percentage point deviations from baseline growth rates – ranges from 0.0 to -0.4 percentage point in 2012 and from 0.0 to -1.0 percentage point in 2013 (excluding Cyprus and Greece).20 On average, the impact on the euro area will amount to -0.1 percentage point at the end of 2012 and to -0.2 percentage point at the end of 2013.
The sovereign debt contagion scenario in itself has relatively weak effects on real GDP; this, however, is due to the relatively narrow set of shocks considered in the scenario. It should be expected that renewed pressure on sovereigns will have direct spillover effects on the banking sector via funding constraints and resulting balance sheet adjustments. In order to obtain a more realistic picture, the contagion scenario should thus be considered in conjunction with shocks to bank balance sheets (as described in the next sub-section).
fragmented funding scenarioThe risk of an increasing fragmentation of bank funding markets is related to the risk of an aggravation of the sovereign debt crisis (described in the previous sub-section). The fragmentation risk leads to strongly deteriorating funding conditions for banks in some countries, and to capital inflows into other countries, resulting in an uneven development of banks’ access to reliable funding sources across the euro area. This, in turn, can seriously hamper credit intermediation in countries where adverse developments are being observed.
To account for the increasing fragmentation of bank funding markets, a number of shocks are considered. First, some deposit outflows from banks in the more distressed euro area countries are assumed.21 A certain proportion of these outflows (25%) is assumed to flow to non-distressed euro area countries. Second, banks are assumed to roll over only part of their wholesale debt that is maturing over the next two years. The imposed rollover rates reflect differences across banks in their access to wholesale funding markets and a more system-wide drive to gradually reduce reliance on (especially short-term) wholesale funding.22 Third, the fragmentation of the funding market forces many banks to alleviate structural and medium-term funding-related pressures on their balance sheets. Hence, country-specific loan-to-deposit ratio targets are imposed to reflect a more general need to reduce reliance on wholesale funding (also in the light of upcoming Basel III liquidity requirements).23
19 See M. Darracq Pariès, C. Kok and D. Rodriquez Palenzuela, “Macroeconomic propagation under different regulatory regimes: an estimated DSGE model for the euro area”, International Journal of Central Banking, December 2011.
20 Given the impact of the Greek PSI on banks’ solvency, the macroeconomic effects are particularly severe for Cyprus and Greece.21 Deposit outflows have been calibrated on the basis of observed outflows since mid-2011, with countries being grouped according
to sovereign risk, using prevailing credit ratings. The assumed deposit outflows range from 20% for banks in countries rated below investment grade to -1% for banks in AA-rated countries. Deposit inflows are assumed to occur in banks resident in AAA-rated countries as a function of the banks’ market share in the EU’s retail deposit market and the conservative assumption that only 25% of the deposit outflows from distressed countries are translated into deposit inflows in AAA-rated EU countries.
22 In practice, banks are assumed to roll over only between 50% and 90% of their maturing wholesale debt in 2012 and 2013, depending on the level of sovereign distress in the country where the bank has its headquarters. The funding gap thereby created is corrected for the individual bank’s take-up of the three-year LTROs and for country-specific information on the usage of the LTRO funds (i.e. the proportion used to redeem maturing debt).
23 More stringent loan-deposit targets are assumed for countries facing greater distress, also reflecting explicit requirements under ongoing EU/IMF programmes. Hence, loan-deposit targets are assumed to be 110% for banks in countries with credit ratings of below BBB, 125% for those in BBB-rated countries, 150% for banks in A-rated countries, 165% for those in AA-rated countries and 175% for banks in AAA-rated countries.
Increased fragmentation in bank funding markets...
… with deposit outflows and limited access to wholesale markets in some countries…

86ECBFinancial Stability ReviewDecember 20128686
Overall, the funding constraints induce the affected banks to deleverage their balance sheets, triggering a shock to the loan supply that, in turn, has negative repercussions on economic activity. To capture this effect, banks’ own announcements concerning ongoing restructuring plans are taken into account.24 If the three imposed constraints give rise to deleveraging amounts that are lower than those announced by individual banks, the difference is added, implying that the minimum deleveraging estimated corresponds to the bank’s own announcements. Overall, for many banks, these deleveraging forces exceed the short-term liquidity shortages that were addressed by the two three-year longer-term refinancing operations (LTROs).25
Assuming, in addition, a pecking-order of deleveraging whereby banks first shed more liquid assets (such as non-domestic sovereign bonds and interbank exposures) and foreign credit exposures, and reduce their domestic loan book only as a last resort, quantitative constraints on lending (loan supply shocks) are derived. These loan supply shocks are, in turn, applied to the same DSGE model that is used in the sub-section on bank solvency results below to account for the direct feedback effect on real economic activity. The size of the loan supply shocks ranges from a slightly positive figure (mainly on account of deposit inflows) in a few countries to close to -10% of the outstanding loan book in the countries affected most.
Overall, the macroeconomic implications of the fragmented funding scenario for GDP, expressed in percentage point deviations from baseline growth rates, range from 0.1 to -1.8 percentage points by the end of 2012 and from 0.1 to -3.8 percentage points by the end of 2013. For the euro area as a whole, the impact averages between -0.3 percentage point at the end of 2012 and -0.7 percentage point at the end of 2013.
The sovereign debt crisis has clearly illustrated the strong interconnections between the sovereign and the banking sector. For this reason, a joint scenario combining sovereign contagion and fragmented funding shocks is also considered. This joint scenario seeks to illustrate the adverse feedback loops between sovereign distress and banking sector vulnerabilities. Under such a combined scenario, the country-specific impact on real GDP growth, expressed in percentage point deviations from the baseline, ranges from 0.1 to -1.9 percentage points at the end of 2012 and from 0.1 to -3.9 percentage points at the end of 2013. For the euro area as a whole, the impact amounts to, on average, -0.4 percentage point by the end of 2012 and to -0.7 percentage point by the end of 2013.
adverse shock to productivity in the euro areaIn order to capture the risk of weaker than anticipated economic growth, the scenario aims to capture the problems of competitiveness and the lack of growth-enhancing structural reforms in many euro area countries. This is calibrated by applying country-specific shocks to the user cost of capital and nominal wages in order to capture negative productivity shocks that, in turn, reduce investment and employment.26
To reflect cross-country differences in competitiveness and economic performance that are partly linked to the fiscal situation and the potential spillover effects from the euro area debt crisis, the size of the productivity shocks are defined as being largest (as measured by sovereign CDS spreads) in euro area countries under distress and medium-sized in other euro area countries.
24 According to publicly available information on plans announced by banks since mid-2011, EU banks expect to reduce their assets by around €1.5 trillion, with just below €1 trillion being accounted for solely by euro area banks. See also Special Feature A in the June 2012 FSR.
25 Deleveraging incentives stemming from the EBA’s EU capital exercise and Basel III-related capital requirements are not explicitly treated in the scenario.
26 Arguably, the full effects of supply-side economic shocks such as those considered in this scenario can be expected to be more long-lasting in nature than those captured by the two-year forecasting horizon employed in this impact assessment exercise.
… combined with deleveraging and
resulting loan supply shocks…
… forcing banks to shed assets, leading to a feedback effect
on the real economy
The third scenario is based on a
shock to the user cost of capital and
nominal wages

87ECB
Financial Stability ReviewDecember 2012 87
4 eurO area f inancial
inst itutiOns
87
The impact of the productivity shock was derived using “stress test elasticities”.27 This translates into an overall impact on euro area real GDP growth, expressed in percentage point deviations from baseline levels, of -0.2 percentage point in 2012 and -0.9 percentage point in 2013. The real economic impact varies considerably across euro area countries, with peripheral euro area countries being affected most negatively, but the cross-country heterogeneity is less pronounced than under the contagion and funding fragmentation scenarios.
Overview of scenario designSummarising the three adverse scenarios, Tables 4.2 and 4.3 display the key driving factors at play, as well as the overall impact on euro area GDP, expressed in percentage point deviations from baseline growth rates, based on the IMF World Economic Outlook of October 2012. Projected annual euro area GDP growth amounts to -0.4% in 2012 and 0.2% in 2013.
bank sOlvency results
impact on banks’ profit and loss results under the baseline scenarioThe impact of the specified scenarios on euro area banks’ profit and loss accounts and, ultimately, on their solvency positions is estimated by projecting the main variables that determine banks’ solvency, such as credit risk, profits and risk-weighted assets.
Both the balance sheet and the profit and loss data are based on banks’ published financial reports, with due consideration also being given to supervisory information disclosed in the context of the EBA’s 2011 EU-wide stress test and 2011 EU capital exercise. Wherever possible, the data were updated to cover the period up to the end of December 2011. In the case of the Greek banking sector, data refer to the first quarter of 2012 and incorporate the bridge recapitalisation completed in May 2012. Where the Spanish banking sector is concerned, end-2011 balance sheets were adjusted to take into account the additional provisioning amounts required under Royal Decree Laws 2/2012 and 18/2012.28 Furthermore, the capital buffers accumulated in the context of the EBA’s 2011 capital exercise were added to the end-2011 balance sheets. The sample includes
27 Stress test elasticities are a multi-country, EU-wide simulation tool based on impulse response functions (taken from ESCB central banks’ models) of endogenous variables to pre-defined exogenous shocks. They incorporate intra-EU trade spillovers.
28 Also taking into account Royal Decree Law 24/2012, approved on 31 August 2012. The bank-specific recapitalisation amounts related to the European support measures specified in the Memorandum of Understanding agreed with the Spanish authorities on 20 July 2012 have not been considered in the analysis.
Scenario-implied changes in credit risk and profits impact banks’ solvency positions
table 4.2 key drivers impacting euro area gDP under the adverse scenarios
Key assumptions driving impact on GDP
Sovereign contagion scenario
An aggravation of the sovereign debt crisis that fuels increases in interest rates and a decline in stock prices
Funding stress scenario
A restricted access to funding that fuels bank deleveraging and restricts the supply of loans
Productivity shock scenario
Shocks to the unit costs of capital and to nominal wages
table 4.3 Overall impact on euro area gDP growth under the baseline and the adverse scenarios(2011-2013; percentages; percentage point deviation from baseline growth rates)
2011 2012 2013
Baseline growth 1) 1.5 -0.4 0.1Contagion shock -0.1 -0.2Funding stress shock -0.3 -0.7Contagion and funding stress shock -0.4 -0.7Productivity shock -0.2 -0.9
Sources: ECB and ECB calculations.1) Annual growth rate, based on the EU Commission Autumn Forecast of November 2012.

88ECBFinancial Stability ReviewDecember 20128888
17 euro area LCBGs. Data consolidated at the banking group level are used. Bank balance sheets are assumed to remain unchanged over the simulated horizon.29
The projection of banks’ credit risk – in terms of changes to probabilities of default and loss given default – is estimated by exposure types (i.e. loans to non-financial corporations, as well as retail and commercial real estate loans).30 The projected changes at the country level are then applied to bank-specific loss rates, as reported in the EBA’s 2011 stress test exercise, to calculate the expected losses.31 The calculations take into account the geographical breakdown of credit exposures (i.e. the projected losses on a bank’s non-domestic credit exposures are derived using the macroeconomic scenario assumed for the specific foreign countries to which the bank is exposed). For exposures to sovereigns and financial institutions in the banking book, provisioning is generally based on rating-implied probabilities of default, similar to what was done in the EBA’s exercise.32 The only exception were Greek sovereign exposures, for which a loss rate of 75% is used.
The computation of banks’ net interest income is based on a loan-deposit margin multiplier approach to assess the impact of interest rate changes.33 The respective changes in short-term loan and deposit rates are then multiplied by the outstanding amounts of loans and deposits for each bank at the end of 2011. Moreover, some banks operate with a substantial funding gap, which implies that part of their loan portfolio needs to be refinanced in an environment of higher money market rates.34 Furthermore, to account for a marginal pricing of deposit rates, which have risen sharply in many euro area countries in recent years, changes in the short-term rates have been adjusted by adding the spread at the end of June 2012 between the three-month money market rate and new business time deposit rates at the country level.
Trading income developments are assumed to correspond, for each bank, to its average trading income over the last five years (the period 2006-10) under the baseline scenario, and to the average recorded over the three years of severe financial crisis (the period 2008-10) under the adverse scenarios. Simplifying judgmental assumptions have been applied with respect to income from fees and commissions, whereby fee and commission income is assumed to remain constant in nominal terms. Overall profit developments account for banks’ domestic and non-domestic activities.
Tax and dividend assumptions are bank-specific, using the average ratio of positive tax payments to pre-tax profits over the period 2008-10 and the median dividend-to-net income ratio over the same period.
Finally, risk-weighted assets are also calculated at the bank level, using the Basel formulae for IRB banks and assuming fixed losses given default. Risk-weighted assets are defined according to the so-called Basel 2.5 (or CRD III) framework, including higher risk weights on re-securitisations in the banking book and certain market risk elements in the trading book.
29 Except when explicitly assumed otherwise, e.g. in the funding stress scenario.30 The forecasting methodology applied is based on the benchmark parameter approach used in the context of the EBA’s 2011 EU-wide
stress test exercise; see ECB, “2011 EU-wide EBA stress test: ECB staff forecasts for probability of default and loss rate benchmark”, 4 April 2011.
31 More technically, the range from the starting levels of both the probabilities of default and the loss given default to the maximum of actual 2010 provisioning rates for the non-financial corporate, retail and commercial real estate sector was calibrated conservatively.
32 See EBA, “2011 EU-wide Stress Test: Methodological Note – Additional Guidance”, 9 June 2011.33 The methodology applied to estimate the coefficient multipliers was presented in Box 7 of the December 2010 FSR. See also Box 13 of
the June 2009 FSR for further details.34 As a conservative assumption, it is assumed that the increase in the national sovereign CDS spreads between December 2010 and the cut-
off date remains constant over the simulation horizon and is passed through one-to-one to the costs of refinanced market-based debt, and thus adds to the net interest payments banks will have to honour. In order to avoid any unreasonably strong impact, the increase in CDS spreads was capped at 200 basis points.

89ECB
Financial Stability ReviewDecember 2012 89
4 eurO area f inancial
inst itutiOns
89
Having computed the effects of the various shocks on the above-mentioned balance sheet components, the overall impact is ultimately assessed on the basis of core Tier 1 capital ratios.
Under the baseline scenario, euro area banks’ core Tier 1 capitalisation is projected, on average, to increase somewhat from 9.5% at the end of 2011 to 10.8% by the end of 2013 (see Chart 4.36). Whereas profi t accumulation and credit losses (and a slight increase in risk-weighted assets) broadly cancel each other out over the forecasting horizon, the increase to a large extent refl ects capital accumulation that has taken place during 2012, mainly driven by the 2011 EU capital exercise. Under the baseline scenario, by the end of 2013, euro area banks would, on average, still comply with the core Tier 1 capital requirements set out in the EBA’s capital exercise. At the same time, the average development of euro area banks’ solvency positions masks substantial variations both across individual banks and across euro area countries.
impact on banks’ profit and loss results under the adverse scenariosThe end-2013 impact on banks’ solvency positions under the adverse scenarios is illustrated in Chart 4.37.
The main results are as follows:
First, all three scenarios would have a signifi cant adverse impact on euro area banks’ solvency, with core Tier 1 capital ratios declining by 1 percentage point or more in comparison with the baseline scenario at the end of 2013. The most severe impact is found under the contagion scenario and under the productivity shock scenario where euro area banks’ core Tier 1 capital ratios would decline, on average, to 9.2% by the end of 2013, i.e. 1.6 percentage points below the baseline. This average impact, however, masks differences across banks and across countries, in part due to the positive capital fl ows affecting banks in some countries, which partly mitigate somewhat the negative effects on banks in the more distressed countries.35 The average euro area core Tier 1 ratio would decline to 9.3% by the end of 2013 under the fragmented funding scenario, 1.5 percentage points below the baseline.
Second, the main driving factors under all scenarios are the increase in loan losses and lower retained earnings with respect to the baseline (see Chart 4.37). Under the contagion and deleveraging scenarios in particular, the decline in profi ts is relatively strong on account of marking-to-market and fi re-sale losses, whereas the adverse impact under the productivity shock scenario is mainly due to higher loan losses. 35 Such crisis-related infl ows could, if sustained for a prolonged period of time, potentially lead to an excessive supply of credit at too low
prices from banks in affected countries, which might, over time, pose the risk of fuelling a credit bubble.
Under the baseline scenario, the average core Tier 1 capital ratio is projected to increase from 9.5% to 10.8% at the end of 2013
Under the contagion, funding stress and productivity shock scenarios, the average core Tier 1 capital ratios decline to 9.2%, 9.3% and 9.2% respectively by the end of 2013
chart 4.36 average contribution of profits, loan losses and risk-weighted assets to core tier 1 capital ratios under the baseline scenario(percentage of the core Tier 1 capital ratio and percentage point contribution)
9.5
10.8
3.2-2.70.9
0
2
4
6
8
10
12
14
16
0
2
4
6
8
10
12
14
16
Core Tier1 ratio,
end-2011
Profit Capitalraised
Loanloss
RWA Core Tier1 ratio,
end-2013
-0.1
Sources: Individual institutions’ fi nancial reports, EBA, ECBand ECB calculations.Note: Apart from the changes in profi ts, loan losses and risk-weighted assets, the difference in core Tier 1 ratios between the end of 2011 and the end of 2013 is a result of capital accumulated in the EBA’s 2011 EU capital exercise, the bridge recapitalisation of Greek banks and the two Spanish Royal Decree Laws affecting the Spanish banks.

90ECBFinancial Stability ReviewDecember 20129090
Third, the combined contagion and funding stress scenario produces more negative results, according to which the euro area average core Tier 1 capital ratio would fall to 9.0% by the end of 2013, i.e. 1.8 percentage points below the baseline.
In general, a shift in the distribution of banks from the centre towards lower core Tier 1 ratios is observed under the adverse scenarios in comparison with the baseline scenario (and especially with end-2011 levels), with the ratios of a larger number of banks falling below the threshold of 6%. Furthermore, it is notable that the shift in the distribution towards lower core Tier 1 capital ratios is most pronounced under the joint sovereign contagion and fragmented funding scenario, under which entire banking sectors in the distressed countries are severely affected, while the impacts under the productivity shock scenario are spread more evenly across countries and banks.
To rank the systemic risks considered in the various scenarios, it is not suffi cient to focus solely on the solvency-implied results of each scenario. The probability of occurrence attached to each of the scenarios should also be considered in order to make the results fully comparable. In general, the scenarios are calibrated to ensure a probability of occurrence of around 5%, or lower. However, as the model approaches underlying the scenarios differ, a direct comparison of severity levels is not possible.
Potential interbank contagion due to bank failuresWhile the contagion and funding stress scenarios incorporate macro-feedback effects, the potential impact of the derived bank capital losses in terms of contagion via interbank liabilities was not taken into account. However, the impact of the adverse shocks on one bank’s solvency position would be expected to spill over to other banks in the system if, for example, the failure of the bank to comply with a threshold capital level (e.g. a targeted core Tier 1 capital ratio of 6%) forces it to renege on its interbank liabilities. Such action would, in turn, impose losses on its creditors in the interbank market and result in system-wide losses on top of the original solvency impact derived under the adverse scenarios, as reported in this sub-section.
In order to model how shocks to one (or more) fi nancial entities can have contagious effects throughout the fi nancial system, a dynamic network modelling approach is used.36 The interbank
36 This exercise is based on a sample of 89 banks that were also covered in the 2011 EU-wide stress testing exercise conducted by the EBA. An interbank network is randomly generated, based on banks’ interbank placements and deposits, and taking into account the geographical breakdown of banks’ activities. Once the distribution of interbank networks has been calibrated, the system can be shocked to assess how specifi c shocks are transmitted throughout the system and to gauge the implications for the overall resilience of the banking sector. The shock is typically a given bank’s default on all of its interbank payments. It then spreads across the banking system, transmitted by the interbank network of the simulated bilateral exposures. The model consists of three main building blocks: the interbank probability map, the random interbank network generator and the equilibrium interbank payments. For a more detailed description of the methodology, see Special Feature C of the June 2012 Financial Stability Review.
Combining the contagion and funding stress
scenarios leads to an average core
Tier 1 capital ratio of 9.0% at the end
of 2013
Adverse shocks to individual
banks’ solvency positions can lead to contagion effects via interbank liabilities
chart 4.37 average core tier 1 capital ratios of euro area banks under the baseline and adverse scenarios(2011–2013; percentage; average of euro area banks)
6
7
8
9
10
11
12
6
7
8
9
10
11
12
1 End-20112 Baseline end-20133 Contagion shock4 Funding stress
5 Joint contagion and funding stress6 Productivity shock
1 2 3 5 64
Adverse shocks
9.5
10.8
9.2 9.39.0
9.2
Sources: Individual institutions’ fi nancial reports, EBA, ECB and ECB calculations.

91ECB
Financial Stability ReviewDecember 2012 91
4 eurO area f inancial
inst itutiOns
91
contagion results derived by applying such a methodology to the four adverse scenarios considered in the sub-section above are illustrated in Chart 4.38.
For the large majority of the simulated interbank networks, the contagion effects would be negligible. In 90% of the randomly generated interbank networks, interbank contagion losses do not materialise. This highlights the highly non-linear nature of interbank network structures.
Substantial contagion effects are observed only in the upper percentiles of the distribution of randomly simulated interbank networks. Hence, for the worst affected simulated networks, system-wide core Tier 1 capital reductions could potentially reach 2.0-2.5 percentage points, and in some countries, the contagion could result in core Tier 1 capital reductions of as much as 4.0-4.5 percentage points (see Chart 4.38).
assessing tHe resilience Of eurO area insurers
The major investment risks identifi ed in the previous sub-section are quantifi ed in this sub-section in order to assess the potential impact on large euro area insurers.37 More specifi cally, the following market and credit risks are assessed: (i) an increase in interest rates; (ii) a fall in equity and property prices; (iii) a deterioration of the creditworthiness of borrowers through a growth of credit spreads for marketable instruments; and (iv) an increase in loss rates on loan portfolios.
The analysis for the insurance sector 38 allows an assessment of the possible implications of the above-mentioned risks on the basis of two of the adverse macroeconomic scenarios described in the sub-section above, namely the joint contagion and funding shock scenario and the productivity shock scenario.39 The risks are transmitted through two channels, namely (i) through valuation effects on fi nancial securities owing to changes in prices and (ii) through changes in the credit quality of loan portfolios.
The exposures of the insurance companies analysed in this sub-section are to a great extent similar to those at the end of 2011. The analysis assumes that the market values of shares, bonds and property decrease sharply and abruptly, with effects occurring instantaneously before institutions have an opportunity to adjust their portfolios.40 The assessment of the credit risk in the insurers’ loan books follows the scenario-based estimation procedure of the assessment of the resilience of euro area banks.
37 The exercise is based on a sample of 13 major insurance groups in the euro area.38 The exercise is not related to the EU-wide stress tests in the banking and insurance sectors coordinated by the EBA and the European
Insurance and Occupational Pensions Authority (EIOPA) respectively.39 The results for the contagion and funding shock scenarios are not analysed individually in this sub-section since it is in combination with
one another that they have an impact on the asset side of the insurance sector balance sheets.40 Only fi nancial instruments and investment accounted for as assets are considered in the exercise.
Major risks are quantifi ed…
… under the scenarios set out under “Macro-fi nancial scenarios”
Assessments carried out on insurers’ exposures as at the end of 2011
chart 4.38 “worst case” basis point reduction in the core tier 1 capital ratio due to interbank contagion: cross-country dispersion(basis point reduction of the core Tier 1 capital ratio; maximum, minimum, interquartile range and median)
0
100
200
300
400
500
0
100
200
300
400
500
Contagionshock
Fundingstress
Productivityshock
Jointcontagion andfunding stress
Sources: Individual institutions’ fi nancial reports, EBA, ECB and ECB calculations.Note: Interquartile range represents the 25th to 75th percentiles of the cross-country contagion effects under the most severe of the simulated interbank networks.

92ECBFinancial Stability ReviewDecember 20129292
A number of simplifying assumptions had to be made for this exercise. First, available granular data (e.g. on financial instruments, on investment in sovereigns, broken down by jurisdiction, and on investment, broken down by credit rating 41) were used wherever possible, but broad aggregates of financial investments were used in some instances. The relative weights of various investments, broken down by instrument, are shown in Chart 4.31. Second, no hedging or other risk-mitigation measures were taken into account, which means that some losses might be overestimated.42 Unit-linked financial investments 43 were excluded from the scope of the exercise. Third, all other income and expenses except those analysed within this framework were assumed to be fixed.44 Fourth, the credit risk assessment is carried out using aggregate loan portfolios only, and the EBA’s reported average loss rate of the retail and corporate portfolios of banks domiciled in the home country of the insurance group under consideration.
Table 4.4 summarises the main parameters applied in assessing the resilience of euro area insurers under both the joint sovereign contagion and funding stress scenario and the productivity shock scenario. Haircuts for debt securities were generally derived from implied changes in the value of representative hypothetical securities after the assumed increases in interest rates were applied. The haircuts were applied uniformly across the sample of large euro area insurers.
The valuation haircuts to government bond portfolios were estimated on the basis of representative euro area sovereign bonds with a maturity of five years. Under the joint sovereign contagion and funding cost shock scenario, the haircuts for government bonds reflected an actual change in corresponding yields from the end of 2011 to mid-August 2012, with a limitation of no positive gains. An additional widening of average long-term euro area government bonds yields by 261 basis points was introduced under the joint sovereign contagion and funding shock scenario.
Haircuts for corporate bonds were derived from implied changes in the value of an average hypothetical security that has the characteristics of the representative market index of bond portfolios.45 The pricing of corporate bonds was influenced additionally 46 by a widening of credit spreads.47 On average, the simulated response of credit spreads on corporate debt securities equals 301 basis points. Finally, picking only the most severe parameter from the macro-scenarios, stock prices were assumed to fall by 25%. Property prices were assumed to decline by 22%, on average, in the euro area.48
41 Slightly more than 90% of the investment in corporate bonds is accounted for by investment-grade bonds.42 On the other hand, counterparty risk on derivatives exposures used primarily for hedging was not considered.43 This means financial assets owned by, and managed on the behalf of, policyholders, with any appreciation or depreciation of these assets
accruing to policyholders.44 For example, underwriting risk or reduced demand for insurance products was not taken into account.45 Typically, various iBoxx euro corporate bond indices with an average maturity of 5.5 years, an average coupon of 4.5-5.1% and an
average yield of 1.9-3.5% in mid-August 2012.46 Meaning in addition to an increase in long-term interest rates.47 The size of the latter was set by simulating a joint, multivariate forward distribution of daily compounded changes of various iTraxx
indices with a 60-day horizon.48 Property prices react endogenously to other elements of the macro-financial scenario.
table 4.4 the parameters for the assessment of euro area insurers
Joint contagion and funding
stress scenario
Productivity shock
scenario
Average euro area increase in long-term government bond yields (basis points) 261 0
Average add-on in credit yields of corporate bonds (basis points) 301 0
Shock to equity prices -25% 0%
Shock to property prices -22% 0%
Cumulative loss rates over two years 1.3% 1.6%
Source: ECB calculations.

93ECB
Financial Stability ReviewDecember 2012 93
4 eurO area f inancial
inst itutiOns
93
The results show that insurers remain considerably exposed to market risks. Moreover, the heterogeneity of the results for individual insurance groups suggests that some institutions are particularly vulnerable to the materialisation of risks.
Under the joint sovereign contagion and funding shock scenario, insurers’ losses would originate mainly from their investment in corporate debt, and could amount to 1.9% of the assets, on average. A signifi cant proportion of these losses stems from holdings of debt securities issued by other fi nancial companies. In addition, losses stemming from sovereign debt securities could total as much as 1.7% of the assets, on average. Regarding equity prices, losses of individual insurance companies under the joint sovereign contagion and funding shock scenario are largely related to the volume of such investments, which is rather high in some cases. Finally, while conditions in several euro area property markets remain fragile, the potential losses for insurers would not exceed 0.4% of the assets, on average.
Under the productivity shock scenario, which assumes a marked weakening of economic activity in the euro area, the insurers’ losses from corporate debt could be as much as 1% of the assets, on average. In addition, the assets are negatively impacted through loan losses. These, however, would be only slightly higher than those recorded under the contagion and funding shock scenario.
4.4 resHaPing tHe regulatOry anD suPervisOry framewOrk fOr financial institutiOns, markets anD infrastructures
The severity and duration of the fi nancial crisis, as well as its breadth, have clearly revealed the need for tighter regulatory oversight encompassing both fi nancial institutions and fi nancial markets. The regulatory and supervisory framework for fi nancial institutions, markets and infrastructures continues to be overhauled both globally and at the EU level. The global regulatory reform agenda, and the priorities therein, have been set by G20 leaders, while the concrete work on the development of policy is being carried out by international standard setters, coordinated primarily by the Financial Stability Board (FSB) and the Basel Committee on Banking Supervision (BCBS).49
Within the European Union, the global regulatory reform agenda is being implemented in a consistent and comprehensive way. Tables 4.5 to 4.7 provide an overview of some key regulatory initiatives in the EU, followed by a short discussion of their relevance from the perspective of fi nancial stability and macro-prudential policy.
49 See Financial Stability Board, “Overview of Progress in the Implementation of the G20 Recommendations for Strengthening Financial Stability”, available at http://www.fi nancialstabilityboard.org/publications/r_120619a.pdf, and Basel Committee on Banking Supervision, “Report to G20 Leaders on Basel III implementation”, available at http://www.bis.org/publ/bcbs220.pdf.
The regulatory framework continues to be overhauled both globally and at the EU level
chart 4.39 asset losses for large euro area insurers under different scenarios
(Q4 2011 – Q4 2013; percentage of total assets)
0.0
0.5
1.0
1.5
2.0
0.0
0.5
1.0
1.5
2.0
Joint contagion andfunding stress
Productivity shock
sovereign debt securitiescorporate debt securitiesloan lossesequityproperty
Sources: Bloomberg, individual institutions’ fi nancial reports, JPMorgan, Thomson Reuters Datastream and ECB calculations.

94ECBFinancial Stability ReviewDecember 201294
With respect to banking regulation, the Commission’s proposal for a banking union aims to set up a single supervisory mechanism in the euro area, with specific tasks being conferred upon the ECB. The establishment of a banking union is discussed in detail in Special Feature C in this FSR.
As concerns the proposal for an EU framework for the recovery and resolution of credit institutions and investment firms, an efficient and harmonised framework is needed to manage bank failures in an orderly way and to avoid contagion to other institutions. The aim of the framework is to equip the relevant authorities with common and efficient tools and powers for addressing a banking crisis pre-emptively, safeguarding financial stability and minimising taxpayers’ exposure to losses. For this purpose, the range of powers available to the relevant authorities consists of three elements: (i) preparatory steps and plans to minimise the risks of potential problems; (ii) in the event of emerging problems, powers to halt a bank’s deteriorating situation at an early stage in order to avoid insolvency (early intervention); and (iii) in the event of insolvency of an institution, clear means to reorganise or wind down the bank in an orderly fashion while preserving its critical functions and limiting the impact on the taxpayers, given that normal insolvency proceedings present a concern in terms of the general public interest.
With regard to the revision of the Deposit Guarantee Scheme (DGS) Directive, the overarching objectives are to maintain financial stability by strengthening depositor confidence and protecting
The proposal for a banking union aims to set up a
single supervisory mechanism in the
euro area
table 4.5 selected legislative proposals in the eu for the banking sector
Initiative Description Current status
Banking union A single supervisory mechanism with strong ECB powers for the supervision of all banks in the euro area (in cooperation with national supervisory authorities). Further components of the proposal: single rulebook, common deposit protection and single bank resolution mechanisms. Main aims: avoid future banking crises, restore confidence in the financial system and protect savers.
The European Commission’s proposal was published in September 2012.
Capital Requirements Directive and Regulation (CRD IV)
The proposal implements Basel III in the EU. Overarching goal is to strengthen the resilience of the EU banking sector, while ensuring that banks continue to finance economic activity and growth. The proposal consists of a Directive, which relates primarily to the national supervisory process, and a Regulation, which sets prudential standards for financial institutions.
The European Commission’s proposal was published in July 2011. “Trialogue” negotiations between the Commission, the European Parliament and the Council are ongoing.
Deposit guarantee schemes The legislative proposal deals mainly with the harmonisation and simplification of protected deposits, a faster pay-out, and an improved financing of schemes.
The European Commission’s proposal was published in July 2010.
Bank resolution The proposed framework sets out the necessary steps and powers to ensure that bank failures across the EU are managed in a way which avoids financial instability and minimises costs for taxpayers. The proposed tools are divided into powers relating to “prevention”, “early intervention” and “resolution”.
The European Commission’s proposal was published in June 2012.Revision of the proposal after comments from Member States and other relevant parties.
Mortgage credit directive The aim of the proposal is to create a responsible, efficient, healthy and competitive pan-European mortgage credit market that works to the benefit of consumers, also promoting customer mobility, cross-border activity of creditors and intermediaries, and creating a level playing field for all actors involved.
The European Commission’s proposal was published in March 2011.

95ECB
Financial Stability ReviewDecember 2012 95
4 eurO area f inancial
inst itutiOns
95
their wealth in order to avoid bank runs in times of financial stress. The pursuit of these objectives is driven, in addition, by the need to enhance the internal market.
The Capital Requirements Directive and Regulation (CRD IV) initiative aims to implement the Basel Committee’s global regulatory framework (Basel III) in a timely and consistent manner in the EU. The framework is considered key for increasing the resilience of the banking system, maintaining market confidence and providing a level playing field for internationally active banks. The CRD IV proposal extends the scope of the framework to all banks and investment firms in the EU. The proposed framework: (i) requires financial institutions to hold more and better capital, sets liquidity requirements and constrains leverage; (ii) improves the governance framework by giving supervisors new powers; and (iii) contributes to the creation of a single rule book for banking regulation.
The CRD IV proposal incorporates several provisions that are relevant for macro-prudential policy-making in that they allow authorities to address identified systemic risks efficiently in the EU. These elements include, in particular, capital buffers (capital conservation buffer, counter-cyclical capital buffer and possibly also buffers for systemically important financial institutions) and extended scope for policy interventions by authorities under the Supervisory Review and Evaluation Process (SREP), as well as the adoption of temporarily stricter measures at the national and/or EU level to address macro-prudential/systemic risk (e.g. stricter prudential requirements on own funds, large exposures, public disclosures, capital conservation buffer and risk weights for targeting asset bubbles in residential and commercial property, as well as re-calibrating liquidity and leverage ratios, once implemented).
Concerning insurance regulation, Solvency II will harmonise the fragmented regulatory landscape of insurers and will introduce, inter alia, a new regime of common capital requirements for insurers, an economic valuation of assets and liabilities, and enhanced disclosure and reporting requirements. The new solvency standards are based on a risk-sensitive approach, calibrated also to address market, credit and operational risk. The adequacy of this new capital regime may have implications for the financial stability of the insurance sector, but also indirectly for other financial market sectors, as insurance corporates provide long-term funding for banks and governments. Moreover, the Omnibus II Directive will amend the Solvency II Directive according to the Lisbon Treaty and the new European supervisory structure. The “trialogue” negotiations on the Omnibus II Directive are still ongoing.
The CRD IV proposal aims to implement Basel III in a timely and consistent manner in the EU
Solvency II will harmonise the fragmented regulatory landscape for insurers and introduce a new regime of common capital requirements
table 4.6 selected legislative proposals in the eu for the insurance sector
Initiative Description Current status
Solvency II The Solvency II Directive aims to harmonise the different regulatory regimes for insurance corporations in the European Economic Area (EEA). Similar to the Basel III framework, it will introduce a three-pillar approach, which includes, inter alia, new solvency standards in pillar I, but also new qualitative requirements as well as disclosure and reporting requirements in pillars II and III.
The Directive was adopted in November 2009.In July 2012, a short amending Directive was adopted by the European Commission that will move the date for implementation by Member States to 30 June 2013, and the date for application by companies to 1 January 2014.
Omnibus II The initial proposal will amend the Solvency II Directive by: (i) extending the implementation deadline to 1 January 2013; (ii) adapting it to the new architecture for its implementation, in line with measures introduced in the Lisbon Treaty; (iii) introducing new powers for the European Insurance and Occupational Pensions Authority (EIOPA); and (iv) introducing transitional measures.
The European Commission’s proposal was published in January 2011. “Trialogue” negotiations between the Commission, the European Parliament and the Council are still ongoing.

96ECBFinancial Stability ReviewDecember 20129696
As regards securities and derivatives markets regulation, in line with the G20 commitments, the European Market Infrastructure Regulation (EMIR) aims at reducing systemic risk by increasing the safety, efficiency and transparency of the over-the-counter (OTC) derivatives market. The Regulation also provides for standardised OTC derivative contracts to be cleared through central counterparties (CCPs). This will reduce counterparty credit risk, i.e. the risk that one party to the contract defaults. The review of the Markets in Financial Instruments Directive (MiFID II) will contribute to enhancing the stability of the financial system through a series of key measures: (i) the resilience and efficiency of market structures will be increased, with an upgrade to the market structure framework; (ii) the transparency of trading activities in financial markets will be improved; (iii) with a view to taking into account technological innovations, new safeguards will be put in place for algorithmic and high-frequency trading activities; and (iv) the role and powers of supervisory authorities will be reinforced so as to enable them to ban specific products, services or practices in the case of threats to investor protection, financial stability or the orderly functioning of markets. Furthermore, the supervision of commodity derivatives markets will be strengthened. Eventually, the MiFID review will enhance investor protection, which is a key element in preserving the stability of the financial system.
The harmonisation of the rules for short selling is necessary to prevent Member States from adopting uncoordinated measures that could create obstacles to the proper functioning of the internal market. Consistently, the Regulation on short selling and certain aspects of credit default swaps establishes a common regulatory framework that restricts uncovered short selling and improves the coordination of activities of national authorities and those of the European Securities and Markets Authority (ESMA) whenever emergency measures have to be taken under exceptional circumstances. Moreover, the Regulation introduces obligations on private parties to notify and disclose net short positions, thus ultimately enhancing consumer and investor protection.
In July 2012, the European Commission published a package of legislative proposals intended to improve consumer protection in financial services that comprised a Proposal for a Regulation on packaged retail investment products (PRIPs), a Proposal for a Directive amending the UCITS Directive (UCITS V) and a Proposal for a revision of the Insurance Mediation Directive (IMD 2).
Finally, as regards policy initiatives where extensive discussions are ongoing in the EU but no concrete legislative proposals have been tabled yet, two major areas, namely the regulation of the financial structure and shadow banking, can be highlighted.
In the field of financial structures, the High-level Expert Group on reforming the structure of the EU banking sector, chaired by Erkki Liikanen, presented its report to the European Commission on 2 October 2012. The Group recommended action in the following five areas: (i) the mandatory separation of proprietary trading and other high-risk trading activities; (ii) a possible additional separation of activities conditional on recovery and resolution plans; (iii) possible amendments to the use of bail-in instruments as a resolution tool; (iv) a review of capital requirements on trading assets and property-related loans; and (v) the strengthening of the governance and control of banks. The report will feed into the Commission’s reflections on the need for further action. Considering the next steps, the Commission will look into the impact of these recommendations both on growth and on the safety and integrity of financial services.
With respect to shadow banking – which can broadly be defined as “credit intermediation involving entities and activities outside the regular banking system” – the FSB has been tasked with
EMIR and MiFID II aim at
strengthening the EU’s regulatory
framework in the field of securities and
financial market infrastructures
The Regulation on short selling will
improve conditions for the functioning
of the internal market

97ECB
Financial Stability ReviewDecember 2012 97
4 eurO area f inancial
inst itutiOns
97
table 4.7 selected legislative proposals in the eu for financial markets
Initiative Description Current status
The European Market Infrastructure Regulation (EMIR)
In line with G20 commitments, the Regulation aims at bringing more safety and transparency to the over-the-counter (OTC) derivatives market. To this end, the Regulation introduces: (i) a reporting obligation for OTC derivatives; (ii) a clearing requirement for eligible OTC derivatives; (iii) measures to reduce counterparty credit risk and operational risk for bilaterally cleared OTC derivatives; (iv) common rules for central counterparties (CCPs) and for trade repositories; and (v) rules on the establishment of interoperability between CCPs.
The European Commission’s proposal was published in September 2010 and entered into force in August 2012. Level 2 implementation measures are being finalised.
Review of the Markets in Financial Instruments Directive (MiFID II)
The proposals, consisting of a Directive and a Regulation, aim to make financial markets more efficient, resilient and transparent, and to strengthen the protection of investors. The new framework will also increase the supervisory powers of regulators and provide clear operating rules for all trading activities. In addition, it addresses the G20’s commitment at the Pittsburgh Summit to tackle less regulated and more opaque parts of the financial system and to improve the organisation, transparency and oversight of various market segments, especially for instruments traded mainly over the counter.
The European Commission’s proposal was published in October 2011.The proposals are likely to be adopted in December 2012, in line with the G20 commitments, with implementation by Member States in 2013 and 2014.
Regulation on short selling and certain aspects of credit default swaps
The Regulation aims at establishing a specific regulatory framework that can avoid the creation of obstacles to the proper functioning of the internal market. To this end, the Regulation sets out a common framework by: (i) restricting uncovered short sales; (ii) establishing an enhanced transparency regime; and (iii) clarifying powers of intervention of the European Securities and Markets Authority (ESMA) and of Member States’ competent authorities.
The Regulation was adopted in March 2012. Both the Regulation and the implementation measures entered into force on 1 November 2012.
Revision of the Directive relating to undertakings for collective investment in transferable securities (UCITS V)
The proposal aims at ensuring the safety of investors and the integrity of the financial markets. With its objective of also ensuring that the UCITS brand remains trustworthy, the proposal focuses on three areas, namely: (i) the clarification of UCITS depositaries’ functions and improvements to provisions governing their liability; (ii) the introduction of rules on remuneration policies for UCITS managerial staff; and (iii) the harmonisation of the minimum administrative sanctions that are available to supervisors.
The European Commission’s proposal was published in July 2012.
Proposals on credit rating agencies (CRA III)
The general objective of the proposal is to contribute to reducing risks to financial stability and restoring the confidence of investors and other market participants in financial markets and the quality of ratings. To this end, the proposal includes amendments relating to: (i) diminishing the impact of “cliff” effects on financial institutions and markets by reducing reliance on external credit ratings; (ii) mitigating risks of contagion effects linked to sovereign debt ratings; (iii) improving transparency as a means to improve the quality of ratings; (iv) ensuring the right of redress for investors; and (v) improving the quality of ratings by reinforcing the independence of credit rating agencies and promoting sound credit rating processes and methodologies.
The European Commission’s proposal was published in November 2011. “Trialogue” negotiations are ongoing and the plenary vote in European Parliament is expected for 11 December 2012.

98ECBFinancial Stability ReviewDecember 20129898
developing recommendations aimed at strengthening the oversight and regulation of this market segment, in order to address the systemic risks that stem from maturity and liquidity transformation, excessive leverage and regulatory arbitrage. The FSB, in cooperation with the BCBS and the International Organization of Securities Commissions (IOSCO), has set up five workstreams that focus on banks’ interactions with shadow banking entities, on money market funds, on other shadow banking entities, on securitisation, and on securities lending and repos. In November 2012, the FSB published a Consultative Document initiating a public consultation with regard to the policy recommendations elaborated within those workstreams. Parallel to the FSB initiatives, the European Commission has published a Green Paper on shadow banking that focuses on the need to increase the monitoring and regulation thereof.
box 6
central clearing fOr Derivatives
Financial derivatives play an important role in the financial system. They allow financial and industrial corporations to hedge their risk exposures in a customised way – thereby facilitating risk-taking that is integral to economic growth. They also, however, present specific risk management challenges insofar as this market is inherently complex, given the heterogeneous nature of derivatives, their inherent degree of leverage, more limited liquidity and the significant role of non-linear risks.
The global financial crisis highlighted additional risks in over-the-counter (OTC) derivatives markets that arise from the limited development of financial market infrastructures. In view of also the bilateral and bespoke nature of OTC derivatives, counterparty risk management and transparency have proved to be insufficient.1 Against this background, the G20 agreed in 2009 to strengthen the infrastructure for OTC derivatives through mandatory reporting, electronic trading and central clearing obligations.
Policy-makers recognise centralised clearing platforms (i.e. central counterparties (CCPs)) as a key tool to enhance counterparty risk management with a view to ensuring the application of robust and consistent margin requirements, multilateral netting and risk-sharing. Given the fragmented nature of OTC derivatives markets, the use of CCPs for these products is considered particularly beneficial. Recent research supports the arguments for an increased role for CCPs in three ways.
First, in determining the positions of their members, CCPs take into account all transactions cleared. In addition to the improvement of transparency, this also redresses a basic externality in financial markets, namely the fact that whenever a party enters into a new transaction, this affects existing transactions, but is inadequately reflected in the new transaction as the newcomer is unaware of prior transactions. A CCP can counter this externality.2
1 See D. Russo, “OTC derivatives: financial stability challenges and responses from authorities”, Financial Stability Review, No 14, Banque de France, July 2010.
2 For more on this externality, see C.A. Parlour and U. Rajan, “Competition in loan contracts”, American Economic Review, Vol. 91, No 5, December 2001, and V.V. Acharya and A. Bisin, “Counterparty Risk Externality: Centralized Versus Over-the-counter Markets”, NBER Working Papers, No 17000, National Bureau of Economic Research, April 2011.

99ECB
Financial Stability ReviewDecember 2012 99
4 eurO area f inancial
inst itutiOns
99
Second, given that CCPs have a more complete picture of exposures than individual counterparties, it can provide a more accurate assessment of exposures, which supports both better risk management and a better allocation of capital. Combined with the CCP’s role in multilateral netting, this can also free up substantial amounts of collateral.3 Furthermore, the CCP’s role in applying robust and consistent margin requirements does not only offer protection against default, but – just as importantly – the threat of losing collateral improves incentives to avoid default in the first place.4 By enforcing margin calls, a CCP also avoids bilateral disputes about such calls, as witnessed in the financial crisis.5 Clearly, the design of margin requirements is complex. Poorly designed margins may lead to underinvestment in socially optimal but privately costly protection against default insofar as they are viewed as perfect insurance for transacting parties. Furthermore, margins may be potentially destabilising since the selling of assets to comply with a margin call can depress prices, leading to a downward revision of asset values that requires a further margin call, and so on.6 However, CCPs can mitigate such risks by applying forward-looking margin models to reduce potential pro-cyclical effects.
Third, the nature of CCPs as independent clearing agents enables them to provide effective insurance against counterparty risk. By pooling risks, a CCP can exploit the law of large numbers to make insurance payments to some, using the insurance fees of others. However, care needs to be taken that the “mutualisation” of risk does not lead to moral hazard. Insurance against the aggregate component of one’s own risk requires finding counterparties with little exposure to this aggregate component (say from another industry or economic region). But incentives to perform such “due diligence” suffer when parties are fully insured. Hence, a CCP must provide incentives (e.g. through margin requirements and default fund contributions proportionate to the specific risks of each clearing member) for private parties to still search for sound counterparties that enhance the risk-bearing capacity of the entire system.7
While a stronger role for CCPs offers many benefits in terms of financial stability, it is not without risk. First and foremost among these risks is the fact that a CCP is, by definition, a systemically important institution that can easily become “too big to fail”. This presents a clear case for the tight regulation, supervision and oversight of these entities. In the same vein, recovery and resolution arrangements for CCPs are important in order to mitigate the potential risk of moral hazard.
Furthermore, there are a number of issues specific to the effective implementation of centralised clearing – relating to e.g. the breadth, governance and the market structure – that need to be given due consideration.
With respect to breadth, since one of the main benefits of centralised clearing is the mutualisation of risk, clearing may have to be mandatory in order to be effectively implemented. The incentives 3 On such “netting efficiencies”, see D. Duffie and H. Zhu, “Does a central clearing counterparty reduce counterparty risk?”, Review of
Asset Pricing Studies, Vol. 1, Issue 1, December 2011.4 For more on the economics of optimal collateral in the context of derivative contracts (i.e. margins), see B. Biais, F. Heider and
M. Hoerova, “Risk sharing or risk-taking? Counterparty risk, incentives and margins”, Working Paper Series, No 1413, ECB, January 2012.
5 See, in particular, the disagreement between AIG and Goldman Sachs about the margin calls on their credit default swap positions in “Testy conflict with Goldman helped push AIG to the edge”, New York Times, 7 February 2010.
6 On such downward spirals, see M.K. Brunnermeier and L.H. Pedersen, “Market Liquidity and Funding Liquidity”, Review of Financial Studies, Vol. 22, Issue 6, June 2009.
7 See B. Biais, F. Heider and M. Hoerova, “Clearing, Counterparty Risk, and Aggregate Risk”, IMF Economic Review, Vol. 60, Issue 2, July 2012.

100ECBFinancial Stability ReviewDecember 2012100100
for individual parties to join a CCP are greatest when many others join as well. As long as only few other members have joined, the benefits of central clearing may be outweighed by its costs from the perspective of individual participants, which may lead to a coordination failure and hamper the establishment and use of CCPs. This fundamental problem was an important consideration underlying the G20’s mandatory clearing mandate for OTC derivatives.
With regard to governance, organising a CCP as a cooperative or mutual undertaking, the users of which are its owners, could be beneficial in terms of risk mutualisation. However, cooperatives are often limited in scope and scale. A for-profit CCP owned by external shareholders can be more efficient, but should be supervised and overseen as the objective of making a profit and that of providing for appropriate risk mitigation may not always be fully aligned with one another.
Finally, as regards the market structure, it is important to appropriately balance efficiency and safety considerations. On the one hand, competition between CCPs reduces the economies of scale inherent in the pooling of risks, and may also entail the risk that the optimal amount of the public good in question (clearing) is ultimately not provided.8 On the other hand, concentration on central clearing, although it may maximise netting efficiencies, raises other financial stability concerns in terms of excessive risk concentration and obstacles both to the effective risk management and to the appropriate oversight and supervision of such entities, especially in cases where they operate on a cross-border basis. In view of the risks arising from global clearing, action should be taken in parallel to promote interoperability between CCPs (subject to appropriate safeguards) and to ensure that competition between CCPs does not lead to a reduction of risk management standards.
8 Such standard economic reasoning may not hold when there is asymmetric information in the market — see T. Santos and J.A. Scheinkman, “Competition among Exchanges”, Quarterly Journal of Economics, Vol. 116, Issue 3, August 2001.

101ECB
Financial Stability ReviewDecember 2012
intrODuctiOn
The global financial crisis has brought a large number of banks to the brink of collapse – including several European banks. Data from the European Commission show that the amount of aid granted by EU states to stabilise the EU banking sector that had been used by the end of 2010 had exceeded €1.6 trillion, more than 13% of EU GDP.1 Though large, the immediate bailout costs account only for a moderate share of the total cost of a banking crisis. Output losses of previous banking crises have averaged around 20-25% of GDP.2 In addition, the interplay of fiscally strained sovereigns and weak banking systems that characterise the ongoing sovereign debt crisis in Europe underscore the need for a means of providing robust predictions of banking sector distress to facilitate timely policy action.
The outbreak of financial and banking crises or corporate failures is however difficult to predict, not least in situations where market prices do not reflect systemic risk. That said, detecting underlying vulnerabilities and finding common patterns preceding financial crises is possible. Hence, the aim is to predict vulnerable states of banks, where one or multiple triggers could lead to bank distress, rather than trying to predict the exact timings of bank failures per se. As outright bank failures are rare events, particularly in Europe, the definition of bank distress used here also takes into account state intervention and mergers in distress.
This special feature presents an early warning model that uses publicly available indicators of vulnerabilities calculated from bank and country-level variables.3 The approach contains four basic building blocks. First, it defines “bank distress events”. In addition to bankruptcies, liquidations and defaults, state interventions and forced mergers are also taken into account to represent bank distress. Second, it draws from bank-specific and banking-sector vulnerability indicators, as well as incorporating measures of macroeconomic and financial imbalances from the EU Alert Mechanism Report of the EU Macroeconomic Imbalance Procedure (MIP). Third, it includes an estimated tail dependence network in order to model vulnerabilities arising from interdependencies. Lastly, it takes into account policy-maker preferences between missing distress events versus issuing false
1 At the time of writing, the data for state aid in the context of the financial and economic crisis was available only for 2007-10. An update of the data is expected to become available towards the end of the year.
2 See, for example, G. Dell’Ariccia, E. Detragiache and R. Rajan, “The Real Effects of Banking Crises”, Journal of Financial Intermediation, 17, 2008, pp. 89-112, and L. Laeven and F. Valencia, “Systemic Banking Crises: A New Database”, IMF Working Papers, No 08/224, 2008.
3 For more details of the methodology, see F. Betz, S. Oprica, T. Peltonen and P. Sarlin, “Predicting distress in European banks”, ECB Working Paper Series, forthcoming, and F. Betz, T. Peltonen and P. Sarlin, “Measures of tail dependence to predict distress in European banks”, ECB Working Paper Series, forthcoming.
An early warning model to predict bank distress
Four building blocks of an early warning system for banks
sPecial featuresa PreDicting bank Distress anD iDentifying interDePenDencies amOng eurOPean banks
Financial institutions have played a central role in the ongoing financial crisis. The bank bailout costs associated with the current global financial crisis and the large output losses experienced in several countries clearly motivate the attempts to develop early warning models for predicting banking crises and individual bank failures.
This special feature presents an early warning model based on publicly available bank-specific and country-level indicators for predicting vulnerable European banks that could potentially experience distress given suitable triggers. A novel model extension incorporates an estimated tail dependence network of European banks to the early warning model in order to take into account vulnerabilities arising from estimated interdependencies.

102ECBFinancial Stability ReviewDecember 2012102102
alarms. The methodology is applied to a sample of 439 large and medium-sized banks from 23 EU countries with more than €1 billion in total assets.
iDentifying bank Distress events
Identifying bank distress events is challenging, given that outright bank failures have been rather rare in Europe. To account for this, the definition of bank failure is widened beyond bankruptcies, liquidations and defaults to capture a broader notion of distress that also incorporates cases where financial institutions have been subject to public or private intervention. To that end, three different criteria are applied in order to capture different aspects of bank distress. First, data on bankruptcies, liquidations and defaults capture actual bank failures. Second, data on state support are also used to detect distressed banks. A bank is defined as being in distress if it receives a capital injection by the state or participates in asset relief programmes (asset protection or asset guarantees). It should be noted that this definition does not include liquidity support or guarantees on banks’ liabilities. Third, mergers in distress capture private sector solutions to bank distress – either in the form of state aid or represented by a low coverage ratio prior to the merger.4
This methodology identifies 194 quarters at which banks are in distress during the period from 2000 to 2011 (see Table A.1). This figure is smaller than the sum of events across the three above categories as they are not mutually exclusive. Chart A.1 shows the number of banks and distress events (distress quarters) by country. Within the available sample, Italy is the country with the largest number of banks, followed by Spain, Germany and France. In the case of Greece, Ireland and Belgium, the number of distress events exceeds the number of banks, which is feasible as a bank can experience multiple distress periods.
vulnerability inDicatOrs
Three different categories of indicators represent various aspects of a bank’s vulnerability to distress. First, bank-specific vulnerabilities are captured by indicators from banks’ income statements and balance sheets. As common in the literature, indicators from the CAMELS rating system are proxied as follows.5 The equity-to-assets and Tier 1 capital ratio represent capital adequacy (C).
4 The coverage ratio is defined as the ratio of capital equity and loan reserves minus non-performing loans to total assets.5 The Uniform Financial Rating System, informally known as the CAMEL ratings system, was introduced by US regulators in 1979,
where the letters refer to Capital adequacy, Asset quality, Management quality, Earnings and Liquidity. Since 1996 the rating system also includes Sensitivity to market risk (i.e. CAMELS).
Identifying bank distress events
Bank-specific indicators…
table a.1 bank distress events (number of quarters), 2000-11
Event Definition Incidence Source
1. Bankruptcies, liquidations and defaults
Actual bank failures 13 Bureau van Dijk Bankscope (bankruptcies and liquidations), Moody’s and Fitch (annual compendiums of corporate defaults)
2. State support Entity receives a capital injection by the state or participates in asset relief programmes
153 European Commission and data collected from market sources (Reuters and Bloomberg)
3. Mergers in distress If (i) a parent receives state aid within 12 months after the merger or (ii) a merged entity has a coverage ratio smaller than 0 during the 12 months prior to the merger
35 Bureau van Dijk Bankscope (mergers) and Bloomberg (coverage ratio computed using banks’ balance sheet items)

103ECB
Financial Stability ReviewDecember 2012 103
sPecial features
103
Asset quality (A) is measured by return on assets (ROA), size of total assets, the debt-to-equity ratio, impaired assets and loan loss provisions. The cost-to-income ratio represents management quality (M), while return on equity (ROE) and the net interest margin measure earnings (E). Liquidity (L) is represented by the share of interest expenses to total liabilities, the deposits-to-funding ratio and the ratio of loans to deposits. Finally, the share of trading income proxies sensitivity to market risk (S).
Second, country-specifi c banking sector indicators represent imbalances at the level of banking systems. These indicators are often cited as important early warning indicators for banking crises.6 The indicators proxy the following types of imbalances: booms and rapid increases in banks’ balance sheets, e.g. growth in fi nancial liabilities and non-core liabilities; securitisation, e.g. debt securities to liabilities; property booms, e.g. mortgage-to-loans ratios; banking system leverage, e.g. debt-to-equity and loans-to-deposits ratios; and banking system exposures to derivatives contracts, e.g. gross derivatives to capital and reserves.
Third, country-specifi c macro-fi nancial indicators identify macroeconomic imbalances and control for conjunctural variation in asset prices and business cycles. Regarding macroeconomic imbalances, this special feature uses most of the internal and external variables from the EU MIP, such as current account imbalances, unit labour costs, the unemployment rate and general government debt. Moreover, asset prices (stock and house price gaps) and business cycle variables (real GDP growth and consumer price infl ation) capture conjunctural variation.
6 See, for example, A. Demirgüc-Kunt and E. Detragiache, “The determinants of banking crises in developed and developing countries”, IMF Staff Papers, No 45(1), 1998, and A. Demirgüc-Kunt and E. Detragiache, “Monitoring Banking Sector Fragility. A Multivariate Logit”, World Bank Economic Review, No 14(2), 2000, or G. Kaminsky and C.M. Reinhart, “The Twin Crises: The Causes of Banking and Balance-of-Payments Problems”, American Economic Review, No 89(3), 1999.
… country-specifi c macro-fi nancial indicators…
… and banking sector indicators
chart a.1 the number of banks and distress events by country
(number of banks and distressed quarters)
0
20
40
60
80
100
120
140
0
20
40
60
80
100
120
140
1 2 3 4 5 6 7 8 9 10 11 12 13 14 15 16 17 18 19 20 21 22 23
1 Belgium2 Bulgaria3 Czech Republic4 Denmark5 Germany6 Ireland
7 Greece8 Spain9 France
10 Italy11 Latvia12 Luxembourg
13 Hungary14 Malta15 Netherlands16 Austria17 Poland18 Portugal
19 Slovenia20 Slovakia21 Finland22 Sweden23 United Kingdom
banksdistress events (quarters)
Source: F. Betz, S. Oprica, T. Peltonen and P. Sarlin, “Predicting distress in European banks”, ECB Working Paper Series, forthcoming.

104ECBFinancial Stability ReviewDecember 2012104104
interPreting tHe early warning signals: misseD Distress events versus false alarms
Early warning models require evaluation criteria that account for the nature of the underlying problem. Distress events are often outliers in three respects: the dynamics of the economy differ significantly from tranquil times, they are often costly, and they occur rarely. Given these properties, an evaluation framework that resembles the decision problem faced by a policy-maker is of central importance.
Designing a comprehensive evaluation framework for early warning signals is challenging as there are several political economy aspects to be taken into account. For instance, the frequency and optimal timing of when the policy-maker should signal a distress event might be different depending on whether the policy-maker maximises his/her own utility or social welfare. While important, these considerations are beyond the scope of this special feature. Thus, the signal evaluation framework focuses only on a policy-maker with relative preferences between Type I errors (missing distress events) and Type II errors (false alarms), and the usefulness of using the early warning model versus not using it. However, the model evaluation can also be extended to account for the potential systemic relevance of each individual financial institution, e.g. proxied by its size.7
a mODel fOr PreDicting Distress in eurOPean banks
As common in the literature,8 a pooled logit model is used for estimating distress probabilities. The indicator capturing a bank’s vulnerability to distress (pre-distress period) is defined as a specified number of quarters prior to the actual distress event (e.g. eight quarters in the benchmark case). The model is recursive – predicting the probability of pre-distress one quarter ahead at each quarter. In practice, the model is estimated at each quarter t with all available information up to that point. The model is then used to calculate the probability of a bank being distressed. Then, the signals of the model are evaluated with respect to the optimal threshold for given preferences between missing distress events and issuing false alarms.
The estimates of a logit model for factors with an impact on bank distress are reported in Table A.2 and are based on data from the first quarter of 2000 until the last quarter of 2009 (full estimation sample).9 The benchmark model (column 1) contains vulnerability indicators that are drawn from the three groups introduced earlier: bank-level balance sheet indicators, country-specific banking sector indicators and country-level macro-financial indicators. The benchmark model is chosen based on two considerations. On the one hand, it should be encompassing and contain a wide-range of potential vulnerabilities. On the other hand, a relatively short publicly available time series of bank balance sheet items from market sources limits the number of observations.
Most of the estimated coefficients in the benchmark model have the expected signs and are statistically significant. Among the bank-specific variables, a high capital ratio and a high return on assets are associated with lower distress probabilities. High interest expenses and a high deposits-to-funding ratio, on the other hand, increase the probability of bank distress.
Of the country-level banking-sector indicators, almost all are statistically significant. As expected, rapid growth in both financial liabilities and non-core liabilities is associated with higher
7 For the technical details on the evaluation framework, see P. Sarlin, “On policymakers’ loss functions and the evaluation of early warning systems”, TUCS Technical Report, No 1054, Turku Centre for Computer Science, 2012.
8 See, for example, E.P. Davis and D. Karim, “Comparing Early Warning Systems for Banking Crisis”, Journal of Financial Stability, No 4(2), 2008.
9 The sample Q1 2000-Q4 2009 is the full estimation sample in the benchmark case, where a bank distress event is predicted eight quarters ahead and where full information on bank distress events is available until the fourth quarter of 2011.
Interpreting early warning signals
A recursive logit model is used for estimating bank
distress probabilities
Combining a broad set of indicators is important in
predicting bank distress

105ECB
Financial Stability ReviewDecember 2012 105
sPecial features
105
probabilities of distress. The same applies to the ratio of debt securities to liabilities, a measure of securitisation, and the share of mortgages among loans, a proxy for property booms. Likewise, high banking system leverage and a high loans-to-deposits ratio increase bank vulnerability.
table a.2 logit model estimates on factors with an impact on bank distress
(estimated coefficients)
(1) (2) (3) (4)Estimates Benchmark
modelBank-specific
modelBanking
sector modelMacro-
financial model
Bank-specific balance sheet variables
Intercept -10.76*** -4.65*** -5.35*** -3.36***C Equity to assets -13.32*** -15.47***
ASize (total assets) 0.47*** 0.38***Debt to equity 0.00 -0.01ROA -36.07** -16.34
M Cost to income 0.00 -0.01E ROE -1.03 -2.53***
L Interest expenses to liabilities 1.86*** 2.61***Deposits to funding 24.43*** 21.14***
S Share of trading income -0.05 -0.07
Country-specific banking sector variables
Financial liabilities (annual growth rate) 8.50*** 0.62Non-core liabilities (annual growth rate) 10.07* 14.40***Debt securities to liabilities 2.49* -3.62***Mortgages to loans 2.51* 7.56***Debt to equity 0.07*** 0.08***Loans to deposits 0.34*** 0.26***Gross derivatives to capital and reserves (annual growth rate) -0.56 -0.51
Country-specific macro-financial variables
GDP (annual growth rate) -5.94 -7.82**Inflation (annual growth rate) 19.58*** 24.51***House price gap 0.13*** 0.10***Stock price gap 0.00** 0.00*10-year Bund spread 12.77 3.92Government debt to GDP 1.13*** -0.61*Private sector credit flow to GDP -3.79*** -1.63*Private sector credit to GDP gap 6.98*** 10.92***Unemployment rate (3-year average) 9.45*** 2.74Current account balance to GDP (3-year average) 5.79** 5.33**International investment position to GDP -2.59*** -1.41***Real effective exchange rate (3-year percentage change) 4.80*** 4.99***Export market share (3-year percentage change) -1.90*** -3.23***Unit labour cost (3-year percentage change) 0.13 -4.57**
R2 0.32 0.17 0.06 0.14No of observations 10,898 10,898 10,898 10,898
Evaluation of the predictive performance of the models Ur(μ) Ur(μ) Ur(μ) Ur(μ)
μ=0.6 0.02 0.00 0.00 0.00Usefulnessmeasures
μ=0.7 0.12 0.02 -0.01 -0.01μ=0.8 0.23 0.05 0.01 0.10μ=0.9 0.37 0.16 0.02 0.24
Source: F. Betz, S. Oprica, T. Peltonen and P. Sarlin, “Predicting distress in European banks”, ECB Working Paper Series, forthcoming. Note: Statistical significance : “***” = 0.001; “**” = 0.01; “*” = 0.05; “.” = 0.10. The estimation sample is from the first quarter of 2000 to the fourth quarter of 2009. The usefulness for a policy-maker is computed with relative usefulness Ur(μ). The relative Ur (μ) summarises the gain the policy-maker gets by using the model versus ignoring it in terms of making Type I and Type II errors.

106ECBFinancial Stability ReviewDecember 2012106106
Among the country-specifi c macro-fi nancial indicators, all estimates have the expected signs. High infl ation and low real GDP growth increase bank vulnerability. Likewise, positive stock and house price gaps that proxy for an overvaluation of assets increase distress probabilities. Regarding indicators of internal imbalances, the estimated coeffi cient for government debt is positive, whereas the estimated coeffi cient for private sector credit fl ow is negative and the coeffi cient for the private sector credit-to-GDP gap is positive. Higher levels of unemployment increase bank vulnerability. Finally, regarding external competitiveness, high net external borrowing by a country increases bank vulnerability, whereas a higher current account balance lowers bank vulnerability. An increase in the real effective exchange rate and a decrease in export market share positively affect bank vulnerability through a loss of competitiveness.
Regarding the predictive power of the three variable groups, when focusing on the relative usefulness measure Ur(μ), the model based on macro-fi nancial variables (model presented in column 4 of Table A.2) clearly outperforms the other models presented in columns 2-4 of Table A.2. The specifi cation that includes only bank balance sheet items (column 2 of Table A.2) performs nearly as well. By contrast, the model including only banking sector variables (column 3 of Table A.2) performs the worst. Interestingly, macro-fi nancial variables turn out to be more useful for predicting distress at the bank level than bank-specifi c variables. However, combining bank-level balance sheet indicators with both
The importance of macro-fi nancial
variables in bank distress
table a.3 the predictive performance of the early warning model for different policy-maker preferences (μ) between missing bank distress events and issuing false alarms
Preferences Predicted pre-distress observations
Missed pre-distress observations
Predicted tranquil observations
False alarm observations
Ur (μ) Ur (μ,wj)
μ = 0.0 0 605 5,025 0 NA NAμ = 0.1 0 605 5,025 0 0.00 0.00μ = 0.2 0 605 5,025 0 0.00 0.00μ = 0.3 0 605 5,025 0 0.00 0.01μ = 0.4 20 585 4,999 26 -0.03 0.06μ = 0.5 78 527 4,934 91 -0.02 0.11μ = 0.6 119 486 4,864 161 0.02 0.19μ = 0.7 187 418 4,763 262 0.12 0.32μ = 0.8 243 362 4,611 414 0.23 0.26μ = 0.9 336 269 4,279 746 0.37 0.16μ = 1.0 605 0 0 5,025 NA NA
Source: F. Betz, S. Oprica, T. Peltonen and P. Sarlin, “Predicting distress in European banks”, ECB Working Paper Series, forthcoming. Notes: The table reports results for out-of-sample predictions of a logit model for different policy-maker preferences (μ) between missing distress events (Type I error) and issuing false alarms (Type II error). The sample period is Q1 2007-Q4 2011 and the forecast horizon is eight quarters. Relative usefulness Ur (μ) summarises the gain the policy-maker gets by using the model versus ignoring it in terms of making Type I and Type II errors, while Ur (μ,wj) denotes the relative usefulness taking into account bank size measured using total assets. See Betz et al., op. cit., or Sarlin, op. cit. for more details.
chart a.2 a case study of the model: out-of-sample prediction of bank distress
(Q1 2007 – Q4 2011; predicted probabilities eight quarters ahead)
100
90
80
70
60
50
40
30
20
10
0
100
90
80
70
60
50
40
30
20
10
0
2007 2008 2009 2010 2011
distress quarters pre-distress quarters predicted distress quarters
Q1 Q3 Q1 Q3 Q1 Q3 Q1 Q3 Q1 Q3
Source: F. Betz, S. Oprica, T. Peltonen and P. Sarlin, “Predicting distress in European banks”, ECB Working Paper Series, forthcoming. Notes: The green dots are “correct” signals (i.e. signals above the threshold when there is either a pre-distress period or a distress period), while red dots are signals below the time-varying threshold for parameter μ=0.90.

107ECB
Financial Stability ReviewDecember 2012 107
sPecial features
107
macro-financial indicators and banking sector variables produces a model that outperforms the other models for out-of-sample forecasts.
The predictive performance of the benchmark model for different policy-maker preferences (parameter μ) between Type I (missing distress events) and Type II (false alarms) errors is presented in Table A.3. The table shows that, given the uneven distribution of tranquil and (pre-)distress periods, it is optimal to disregard the model for µ≤0.5, i.e. when the policy-maker prefers to miss a distress event than to issue a false alarm. As discussed above, it is assumed that the policy-maker is substantially more interested in correctly calling bank distress events than tranquil periods. This is intuitive if it is assumed that an early warning signal triggers an internal review of a bank’s fundamentals, business model and peers. Should the analysis reveal that the signal is false, there is no loss of credibility on behalf of the policy authority. Hence, in the benchmark case, preferences are set to µ=0.9.
Chart A.2 shows a case study illustrating the predictive performance of the model. As shown in the chart, the model signals early on and consistently vulnerabilities in the bank prior to the distress events in 2008 and 2011.
iDentificatiOn Of vulnerabilities tHrOugH estimateD bank interDePenDencies
A novel feature of the model is the introduction of estimated interdependencies among banks into an early warning model. In practice, this is done in two steps. First, in order to detect potential vulnerabilities arising from bank interdependencies, a tail dependence network for the European banking system is estimated. The aim is to identify co-movements in equity returns in the left – or distressed – tail of the distribution that could arise from either direct bilateral exposures or from exposures to common risk factors.
The applied method follows Hautsch et al. in using the quantile-Lasso 10 developed by Belloni and Chernozhukov 11. In a nutshell, the method identifies a set of banks whose stock returns move in parallel with those of any individual bank in the case of tail events. To obtain the set of tail risk drivers for an individual bank, the stock return of a bank is regressed using a quantile regression method on its own lagged return and the unconditional Value-at-Risk (VaR) exceedances of all other banks in the sample. The VaR exceedances are represented by binary indicators equal to one if a bank’s stock return is in the tenth percentile of the unconditional distribution of stock returns. The Lasso procedure is then used to select the subset of relevant risk drivers for a pool of banks’ VaR exceedances and macro-financial state variables. The size of this subset depends on a bank-specific penalty parameter that is obtained in a data-driven way, which governs how many banks survive the Lasso shrinkage.
As a second step, a simple binary indicator is created that equals one for all banks in the estimated neighbourhood of a bank that the model signals to be in distress and zero otherwise. Then, the indicator of signals in the bank’s neighbourhood is used as an additional variable in the early warning model to predict the probability of distress for the individual banks.
10 Lasso stands for least absolute shrinkage and selection operator. See R. Tibshirani, “Regression Shrinkage and Selection via the Lasso”, Journal of the Royal Statistical Society, Series B, Vol. 58, Issue 1, 1996.
11 See N. J. Hautsch, J. Schaumburg and M. Schienle, “Financial Network Systemic Risk Contributions”, SFB 649 Discussion Paper, No 2011-072, Humboldt-Universität zu Berlin, 2011, and A. Belloni and V. Chernozhukov, “L1-penalized quantile regression in high-dimensional sparse models”, The Annals of Statistics, No 39, 2011.
A 30% gain if a policy-maker uses the model
Bank-specific distress events are rarely independent
Estimating a tail dependence network for the European banking system

108ECBFinancial Stability ReviewDecember 2012108108
estimateD bank interDePenDencies in tHe early warning mODel
To evaluate the performance of the early warning model augmented with the estimated bank interdependencies, it is compared with the benchmark model and with two simpler ways of introducing proxies for potential contagion effects. As the estimation of bank interdependencies requires stock returns, the sample is restricted to a subset of listed banks. The results show that any specification including a proxy for estimated interdependencies and potential contagion effects in the model perform better than the benchmark model. In particular, in out-of-sample forecasting the model including the estimated interdependencies appears to outperform the two simpler approaches to control for potential contagion effects.
A further advantage of this method is the visualisation of the banks’ interconnectedness and the identities of neighbouring banks provided by the tail dependence network. This type of information may be of importance to a policy-maker for assessing possible future financial stability risks. In order to focus on the interlinkages among major European banks, the illustration of the tail dependence network is based on a sub-sample of 52 banks, consisting of the European “global systemically important financial institutions” (G-SIFIs) as defined by the Financial Stability Board, complemented by the largest financial institutions in the 27 EU Member States.
Chart A.3 displays the estimated tail dependence network for bank i for a sample from the first quarter of 2000 to the fourth quarter of 2006. The colour coding represents bank i’s estimated neighbourhood: nodes marked red are bank i’s direct neighbours, while those in green represent the neighbours’ neighbours. The links between the banks are the estimated tail dependencies, while the location of nodes in the graph is based on the Fruchterman-Reingold algorithm.12
cOncluDing remarks
This special feature describes an early warning model for predicting bank distress in the EU banking sector. It builds upon both bank-level and country-level indicators of vulnerabilities, along with explicitly accounting for vulnerabilities arising from estimated bank interdependencies and evaluating model signals based on policy-makers’ preferences. Examining EU banks over the last decade, it suggests that early warnings based on publicly available data would have yielded useful out-of-sample predictions of bank distress during the current global financial crisis.
12 See T. M. J. Fruchterman and E.M. Reingold, “Graph Drawing by Force-Directed Placement”, Software: Practice and Experience, 21(11), 1991.
Benefits of a model including estimated
interdependency
Visualising the estimated
interconnectedness of the banks
chart a.3 a case study of an estimated tail dependence network for a bank i
(estimated tail dependence network for bank i, for Q1 2000 – Q4 2006)
Size of neighbourhood
01
2>=3
Sources: F. Betz, T. Peltonen and P. Sarlin, “Measures of tail dependence to predict distress in European banks”, ECB Working Paper Series, forthcoming. Notes: The chart illustrates an estimated tail dependence network using a quantile regression of stock returns of bank i on the unconditional VaR exceedances of all other banks in the sample, using a Lasso procedure to select the relevant tail risk drivers. There are 52 large EU banks in the sample. The links between the banks are the estimated tail dependencies. The location of nodes in the graph is based on the Fruchterman-Reingold algorithm.

109ECB
Financial Stability ReviewDecember 2012 109
sPecial features
109
b tHe imPact Of bank funDing market fragmentatiOn On creDit intermeDiatiOn During tHe sOvereign Debt crisis
The persistent feedback loop between tensions in the sovereign debt market and the banking sector has increased the fragmentation within the euro area bank funding market, with banks in distressed countries facing much greater funding diffi culties than banks operating in other countries.
This special feature analyses how, against the background of the sovereign debt crisis, funding market fragmentation has affected the capacity of banks to provide credit to the economy. A quantitative assessment based on macroeconomic models provides estimates on the effect that the market fragmentation could exert on economic activity. Overall, while the impact on the euro area as a whole is assessed to be limited, some regions have been affected disproportionately.
intrODuctiOn
A central feature of the global fi nancial crisis, which has now lasted fi ve years, has been the severe disruption to bank funding markets. The latest phase of this ongoing crisis – characterised by stress in sovereign bonds in several euro area countries, as well as underlying macroeconomic adjustments to balance of payment rebalancing fl ows – has been no exception, with the intermittent emergence of liquidity and capital constraints in the euro area banking sector resulting in banks’ access to and cost of funding becoming divided largely along national lines. A closer look at the geographic and regional component of these strains has suggested that funding conditions faced by sovereign issuers, the fi nancial sector and – importantly – the economy as a whole have played a pivotal role in this fragmentation. One clear illustration of this phenomenon can be seen in the pricing of sovereign and resident fi nancial institution credit default swaps (CDSs), where there has been an increasing divergence in fi nancing conditions between jurisdictions under sovereign stress and those perceived to be “safe havens” within the euro area (see Chart B.1).
For countries under stress, impediments to banks’ access to funding have clearly hampered the ability of the banking sector to continue channelling funds from lenders to borrowers. In the longer term, such fi nancial market fragmentation affects fi nancial stability via the distortions that it can generate in both asset prices and economic allocation. At a shorter horizon, supply restrictions represent a major risk for the non-fi nancial private sector, which may in turn fuel negative feedback effects to the fi nancial system and hence be detrimental to fi nancial stability.
The fi nancial crisis led to severe disruptions in bank funding markets…
… in the euro area this dysfunctioning was further exacerbated by the sovereign debt crisis…
… in particular affecting banks in countries with distressed sovereigns, effectively implying a fragmentation of euro area fi nancial markets
chart b.1 bank and sovereign credit default swap spreads in the euro area
(basis points)
x-axis: sovereign CDSsy-axis: bank CDSs
0
50
100
150
200
250
300
350
400
450
0
50
100
150
200
250
300
350
400
450
0 100 200 300 400
Q1 2010Q2 2010Q3 2010
Q4 2010Q1 2011Q2 2011
Q3 2011Q4 2011Q1 2012
Q2 2012Q3 2012
Sources: Thomson Reuters and ECB calculations. Notes: The sovereign CDS spreads for the euro area are calculated as a weighted average of the fi ve-year CDS spreads of 11 euro area countries using the ECB’s capital key as weights. The countries included are Belgium, Germany, Ireland, Spain, France, Italy, the Netherlands, Austria, Portugal, Slovakia and Finland. The bank CDS spreads are calculated as the simple average across ten large banks in the euro area. Each dot represents both the sovereign and the bank CDS spreads on a certain day in each quarter.

110ECBFinancial Stability ReviewDecember 2012110110
Three key aspects of the increasing fragmentation of the euro area financial markets during the sovereign debt crisis are particularly worth highlighting.
First, some euro area countries have been exposed to significant funding strains in recent months – both in retail and wholesale markets. Perhaps most worryingly, banks resident in countries characterised by sovereign stress have suffered from some reallocation of bank deposits; investors and corporates in particular have shown a high sensitivity to stress, while retail deposits have been comparatively more stable. As a result, from the end of 2011 up until September 2012 there was an outflow of (non-interbank) deposits from the distressed countries amounting to €80 billion.1 Some of the money flowing out of distressed euro area countries has instead moved into the banking systems of other euro area countries where, since the end of 2011, an inflow of (non-interbank) deposits from other euro area countries of €6 billion has been recorded. Arguably, sovereign stress and the resulting feedback on banking sector soundness is not the only factor driving deposit outflows in those countries; the weak macroeconomic conditions are also likely to exert downward pressure on non-financial corporations’ liquidity in particular and hence on the funds they deposit with the banks. Furthermore, it must be acknowledged that even within the group of distressed countries, bank deposit developments mask significant differences across jurisdictions.
Second, there have been increased signs of home bias in investment decisions, with sovereign debt and credit markets becoming more domestically oriented. Notably, interbank lending from banks resident in countries less affected by the sovereign debt crisis to banks in the distressed countries has fallen substantially and anecdotal evidence suggests that many banking groups are increasingly trying to fund their cross-border branches and subsidiaries locally to limit any cross-border exposures. Overall, in the distressed countries, deposits from monetary financial institutions (MFIs) (excluding the Eurosystem) have fallen by €133 billion since the end of 2011 and, by the end of the third quarter of 2012, cross-border interbank deposits in those countries from banks in other euro area countries represented only around 20% of total interbank deposits, compared with around 45% in early 2008. Indeed, since the end of 2011, cross-border interbank loans have fallen by 17% for banks located in distressed countries, compared with a 2% decline recorded in the rest of the euro area.
Third, and partly as a consequence of the other two features, a widening divergence in the cost and availability of external financing to the non-financial private sector has been observed. For instance, loan growth in the distressed countries has fallen into negative territory in recent months (with an annual growth rate of around -5% by the end of the third quarter of 2012), but remains positive in the other countries. At the same time, the cost of bank lending has displayed diverging dynamics across jurisdictions, increasing relatively more in those countries particularly affected by the financial tensions. While acknowledging that demand for loans may differ substantially across the euro area, the lower loan growth in the distressed countries has generally not been accompanied by lower bank lending rates, suggesting that bank loan supply effects are playing an important role as well.2 In addition, according to the latest survey on small business financing conditions, between a quarter and a third of small and medium-sized enterprises in the distressed countries report that getting access to finance is their biggest challenge, compared with around 10% to 15% in the remaining euro area countries.3 These bank loan supply effects are intensified by the fact that companies in the distressed countries are comparatively more reliant on bank lending.
1 In this special feature, euro area countries are grouped along the major fault lines of financial market fragmentation. Thus, the group of “distressed” countries consists of Cyprus, Spain, Greece, Ireland, Italy, Portugal and Slovenia.
2 Apart from pure bank balance sheet effects affecting loan supply, supply constraints may also be related to the deterioration of macroeconomic prospects and increased risk aversion.
3 See ECB, “Survey on the access to finance of small and medium-sized enterprises in the euro area”, November 2012.
The increasing fragmentation ìs
reflected through a number of
channels...
... first, by significant strains in wholesale and
retail bank funding markets...
... second, by an increasing “home
bias” in investment decisions...
... third, by a widening divergence
in the cost and availability of
external financing to the non-financial
private sector

111ECB
Financial Stability ReviewDecember 2012 111
sPecial features
111
This special feature examines how bank funding markets have become increasingly fragmented since the beginning of the sovereign debt crisis. First, the increasing fragmentation of these markets is analysed on the basis of market prices and bank balance sheet data. In the second part of the special feature, the implications of funding strains and bank valuation losses are then estimated for credit supply and the real economy.
bank funDing market fragmentatiOn
Sovereign tensions have impaired credit intermediation across the euro area through various channels and feedback loops, as illustrated in Chart B.2, thereby increasing risks to fi nancial stability.4 In particular, tensions in the sovereign bond markets may adversely affect the ability of banks to provide credit to households and fi rms. Increased perceived credit risk associated with euro area banks as well as the ongoing gradual loss of access to funding by euro area banks located in the distressed countries may, in turn, be a further consequence of distress in sovereign markets.
Money markets – including notably interbank markets – represent one area where such fragmentation has been apparent. Following a temporary increase in 2011, daily turnover in the unsecured segment has declined again in 2012. The declining trend in unsecured interbank lending activity observed as
4 For a more detailed description of fi nancing conditions and the sovereign debt crisis, see the article entitled “Assessing the fi nancing conditions of the euro area private sector during the sovereign debt crisis”, Monthly Bulletin, ECB, August 2012.
A pernicious triangle between sovereign debt markets, credit intermediation and the real economy
Cross-country fragmentation has been clearly visible in the money markets...
chart b.2 stylised representation of the transmission of the sovereign debt crisis to the real economy via bank funding markets and feedback loops
Bank funding (access and conditions)
Sove
reig
n bo
nd m
arke
ts
Real
-fina
ncia
l fee
dbac
k
Real
-fina
ncia
l fee
dbac
k
Sovereign-financialfeedback Banks’
funding andliquiditypositions
Banks’balance sheetand capitalpositions
Borrowers’credit risk
Retail deposit funding Market-based debt funding
Bank lending to firms and households
Real private sector investment / GDP
Lending volumesLending conditions (price andnon-price terms & conditions)
Bank lending to firms and households
non-price terms & conditions)
Source: ECB.
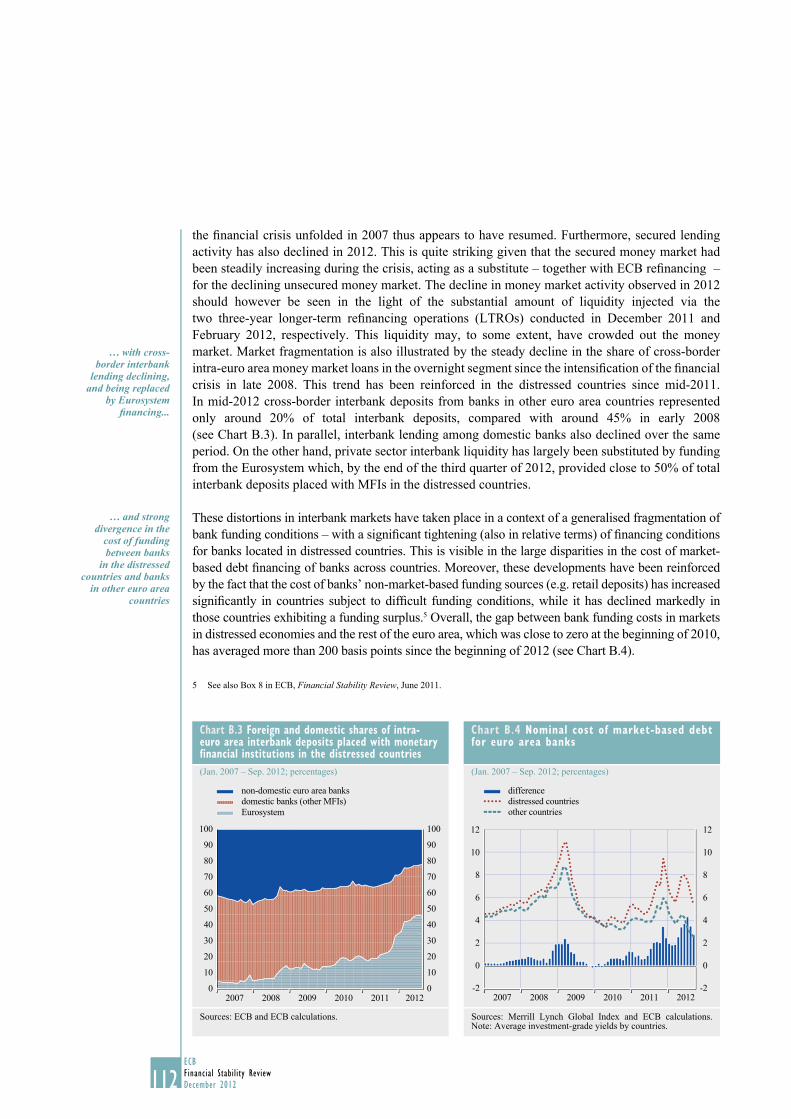
112ECBFinancial Stability ReviewDecember 2012112112
the fi nancial crisis unfolded in 2007 thus appears to have resumed. Furthermore, secured lending activity has also declined in 2012. This is quite striking given that the secured money market had been steadily increasing during the crisis, acting as a substitute – together with ECB refi nancing – for the declining unsecured money market. The decline in money market activity observed in 2012 should however be seen in the light of the substantial amount of liquidity injected via the two three-year longer-term refi nancing operations (LTROs) conducted in December 2011 and February 2012, respectively. This liquidity may, to some extent, have crowded out the money market. Market fragmentation is also illustrated by the steady decline in the share of cross-border intra-euro area money market loans in the overnight segment since the intensifi cation of the fi nancial crisis in late 2008. This trend has been reinforced in the distressed countries since mid-2011. In mid-2012 cross-border interbank deposits from banks in other euro area countries represented only around 20% of total interbank deposits, compared with around 45% in early 2008 (see Chart B.3). In parallel, interbank lending among domestic banks also declined over the same period. On the other hand, private sector interbank liquidity has largely been substituted by funding from the Eurosystem which, by the end of the third quarter of 2012, provided close to 50% of total interbank deposits placed with MFIs in the distressed countries.
These distortions in interbank markets have taken place in a context of a generalised fragmentation of bank funding conditions – with a signifi cant tightening (also in relative terms) of fi nancing conditions for banks located in distressed countries. This is visible in the large disparities in the cost of market-based debt fi nancing of banks across countries. Moreover, these developments have been reinforced by the fact that the cost of banks’ non-market-based funding sources (e.g. retail deposits) has increased signifi cantly in countries subject to diffi cult funding conditions, while it has declined markedly in those countries exhibiting a funding surplus.5 Overall, the gap between bank funding costs in markets in distressed economies and the rest of the euro area, which was close to zero at the beginning of 2010, has averaged more than 200 basis points since the beginning of 2012 (see Chart B.4).
5 See also Box 8 in ECB, Financial Stability Review, June 2011.
… with cross-border interbank
lending declining, and being replaced
by Eurosystem fi nancing...
… and strong divergence in the
cost of funding between banks
in the distressed countries and banks
in other euro area countries
chart b.4 nominal cost of market-based debt for euro area banks
(Jan. 2007 – Sep. 2012; percentages)
-2
0
2
4
6
8
10
12
-2
0
2
4
6
8
10
12
2007 2008 2009 2010 2011 2012
differencedistressed countriesother countries
Sources: Merrill Lynch Global Index and ECB calculations. Note: Average investment-grade yields by countries.
chart b.3 foreign and domestic shares of intra-euro area interbank deposits placed with monetary financial institutions in the distressed countries(Jan. 2007 – Sep. 2012; percentages)
0
10
20
30
40
50
60
70
80
90
100
0
10
20
30
40
50
60
70
80
90
100
non-domestic euro area banksdomestic banks (other MFIs)Eurosystem
2007 2008 2009 2010 2011 2012
Sources: ECB and ECB calculations.

113ECB
Financial Stability ReviewDecember 2012 113
sPecial features
113
The disparities between distressed countries and the other euro area countries have not only been visible with respect to funding costs but also funding availability. A gradual loss of access to funding by euro area banks located in distressed countries has also become more pronounced in the course of 2012 (see Chart B.5). While MFIs resident in distressed countries are facing increasing funding pressures (practically only offset by higher recourse to Eurosystem refi nancing), MFIs resident in the countries less affected by the sovereign debt crisis face funding surpluses refl ected in considerable deposit infl ows. One notable implication of this development is that many banks in fi scally vulnerable economies are excluded from the market, and the Eurosystem is increasingly playing an intermediation role in those countries. Symmetrically, on the asset side, banks in the other euro area countries are scaling down their exposures to the distressed economies in the euro area. Although part of this movement is explained by banks’ deleveraging policy, the stronger reduction recorded in cross-border claims on distressed economies illustrates the increasing fragmentation between those euro area economies that are distressed and those that are not (see Chart B.6).6
The impact of developments in national sovereign debt markets on banks’ funding conditions is not only apparent in market-based indicators but also survey-based information – notably banks’ replies to the Eurosystem’s bank lending survey (BLS). According to the surveyed banks, the intensifi cation of the sovereign debt crisis deepened the divergences in banks’ funding conditions for retail as well as wholesale funding across different market segments in the euro area. 6 For more details on EU banks’ deleveraging process, see ECB, “EU bank deleveraging – driving forces and strategies”, Financial Stability
Review, June 2012.
Deposit outfl ows from distressed countries are partly fl owing into banks in the other euro area countries...
… and there have been strong declines in banks’ exposures to the distressed countries
The negative impact of the sovereign debt crisis has also been refl ected in banks’ replies to the bank lending survey…
chart b.6 change in banks’ intra-euro area cross-border exposures
(Q4 2010 – Q2 2012; deviation from end-2010; index: Q4 2010 =100)
50
60
70
80
90
100
110
120
50
60
70
80
90
100
110
120
Q4 2010
Q1 Q2 Q3 Q4 Q1 Q2
euro area sovereignsbanks in the euro areadistressed sovereignsbanks in distressed countries
2011 2012
Sources: BIS and ECB calculations.
chart b.5 flows of main assets and liabilities of euro area monetary financial institutions
(Jan. 2012 – Sep. 2012; EUR billions)
-300
-200
-100
0
100
200
-300
-200
-100
0
100
200Main assets Main liabilities
1 2 3 4 5 6 7 81 Loans to households and non-financial corporations2 Other credit to the euro area private sector3 Credit to euro area governments4 External (non-euro area) assets5 Non-bank deposits6 Bank deposits 7 Net debt issuance8 External (non-euro area) funding
non-distressed countriesdistressed countries
Sources: ECB, IMF and ECB calculations.

114ECBFinancial Stability ReviewDecember 2012114114
Concerning the negative impact of the sovereign debt crisis on banks’ funding conditions, in mid-2012 banks indicated in their replies to the BLS a temporary rise in the detrimental impact for the euro area as a whole after some relief reported for the fi rst quarter of 2012 following on from the two three-year LTROs (see Chart B.7; left-hand panel). At the same time, there was a notable divide between distressed countries more affected by the sovereign debt crisis and the other countries. While for the distressed countries, the rise in the reported negative impact on their funding conditions was, on average, quite substantial (42% in the second quarter of 2012, in net terms, after 10% in the fi rst quarter of 2012), the rise remained rather contained for the other countries (9% in the second quarter of 2012, in net terms, after 0% in the fi rst quarter of 2012). These developments confi rm the temporarily deepening divergence in banks’ funding conditions in mid-2012 on account of sovereign risk developments. By contrast, the announcement of Outright Monetary Transactions (OMTs) by the ECB in the third quarter of 2012 seems to have mitigated the adverse impact of sovereign risk on banks’ funding substantially, particularly for the distressed countries. Concerning the ultimate impact of funding constraints related to the sovereign debt crisis on changes in banks’ credit standards, these effects remained notable both in the second and third quarters of 2012 (see Chart B.7; right-hand panel). In the third quarter of 2012, 7% of the euro area banks, in net terms, reported a tightening of credit standards on account of these constraints, mainly driven by a tightening of, on balance, 13% of the banks in distressed countries.
Across the different funding segments, further divergence was particularly noticeable for wholesale funding and somewhat less pronounced for retail funding (see Chart B.8). More specifi cally, after the temporary relief in the fi rst quarter of 2012, deteriorations were reported, particularly for debt securities markets and securitisation and, to a somewhat more limited extent, for money markets. Likewise, the deepening divergence between distressed countries and the other countries in the euro area
… with a reported worsening of banks’
funding conditions and a net tightening
of their credit standards …
… in the most recent quarter,
however, the OMT announcement seemed to have
mitigated somewhat these negative
effects
chart b.8 Deterioration in euro area banks’ access to wholesale funding over the past three months(net percentages of banks reporting deteriorated market access)
-40
-20
0
20
40
60
80
-40
-20
0
20
40
60
80
1 Retail funding2 Money markets3 Debt securities markets4 Securitisation
euro areadistressed countriesother countries
2012 2011 2012 2011 2012 2011 2012Q1 Q3Q1 Q3 Q1 Q3 Q1 Q3 Q1 Q3 Q1 Q3 Q1 Q3
1 2 3 4
Source: ECB.
chart b.7 negative impact of the sovereign debt crisis on euro area banks’ funding conditions and credit standards applied to enterprises and housing loans(net percentages of banks reporting a negative impact on funding conditions or on credit standards)
-10
0
10
20
30
40
50
60
-10
0
10
20
30
40
50
60
1 Impact on banks’ funding conditions2 Impact on banks’ credit standards for loans to enterprises
Q4 Q1 Q2 Q3 Q4 Q1 Q2 Q3
euro areadistressed countriesother countries
2012 20112011 20121 2
Source: ECB.

115ECB
Financial Stability ReviewDecember 2012 115
sPecial features
115
was particularly pronounced in mid-2012 for these market segments, with for instance, on balance, 37% of the banks in distressed countries reporting deteriorations in their access to debt securities markets in the second quarter of 2012 (up from a net percentage of 35%, recording an actual improvement for the first quarter of 2012) compared with only 2% in the other countries (up from actual improvements recorded by, on balance, 29% in the first quarter of 2012).
The contagion from the sovereign debt crisis to the banking sector and the detrimental effects it may have on banks’ ability to fund themselves could have serious repercussions on banks’ capacity to provide credit to the real economy.7 The funding constraints on banks, especially in the group of distressed euro area countries, are likely to reduce the amount of loans they are able to supply to households and firms. The ad hoc BLS questions on the impact of the sovereign crisis, presented in Chart B.7, confirm that the impact on the tightening of banks’ credit standards was stronger (in terms of net tightening) in the distressed countries than elsewhere in the euro area.
risk analysis: sOvereign tensiOns, bank funDing cOnstraints anD real-financial interactiOns
Macro-financial models offer one means of providing a quantification of the potential impact that the funding market fragmentation stemming from the sovereign debt crisis may have on credit intermediation and the real economy. To this end, this sub-section analyses bank funding and solvency based on the adverse scenarios applied to the ECB’s top-down bank solvency analysis framework presented in Section 4.3 combined with structural macroeconomic models that take into account financial frictions.
As illustrated in Chart B.2, there are a variety of channels through which fragmentation of funding markets has an impact on the economy. Perhaps most importantly, fragmentation in the form of the significant divergence observed in sovereign bond yields and bank funding constraints across euro area countries is likely to produce a number of effects on banks’ balance sheets and their profit and loss accounts.8
First, it implies mark-to-market (MTM) valuation losses on euro area banks’ sovereign exposures in their trading books. By contrast, securities held in the available-for-sale portfolio and in the banking book would largely be unaffected by an asset price shock. Second, the increase in sovereign credit spreads would be expected to raise the cost of euro area banks’ funding (as shown above). This increase would be partly passed on to short-term retail loan and deposit rates, thus affecting banks’ net interest income.9 Since banks seek to counter the adverse impact of the funding shock on their earnings, lending margins tend to increase, exerting an adverse impact on real economic activity.
7 See Chart B.2 for a stylised illustration of the various channels of transmission and feedback linkages between sovereign markets, banks and the real economy.
8 The quantification of the impact on banks’ profits and balance sheets is based on the “joint” sovereign contagion and funding fragmentation scenario described in Section 4.3, which also includes details about the key assumptions and the methodology underlying the calculations. In summary, the simulated country-specific shocks to long-term government bond yields range from 0 to 545 basis points compared with present levels, while shocks to stock prices range from -2% to -43% across euro area countries. Bank funding costs are affected by a 40 basis point shock to the three-month EURIBOR (that affects its retail lending and deposit rates) and its wholesale funding costs are affected by country-specific shocks to bank CDS spreads calibrated via the shocks to long-term government bond yields.
9 Overall, the direct impact on bank solvency ratios from the MTM losses and the increase in funding costs results in a change in the core Tier 1 capital ratio ranging from -5 percentage points to 1 percentage point across the euro area countries. In a few countries, banks experience positive core Tier 1 ratio changes, on account of the fact that MTM losses and wholesale funding cost increases in those countries were minor, while the increase in the short-term interest rate is found to have a stronger impact on their lending rates than on their deposit rates (i.e. increasing net interest income).
The sovereign tensions and bank funding fragmentation could have real economic implications…
… through the impairment it may exert on banks’ credit intermediation function
Several channels through which intermediation may be affected…
… via MTM losses on banks’ sovereign exposures…

116ECBFinancial Stability ReviewDecember 2012116116
Pressure on sovereign bonds would most likely be accompanied by funding constraints and resulting balance sheet adjustments. In line with developments observed in recent quarters, funding constraints could be expected to emerge from at least three channels. First, they could emerge from deposit outflows from banks in the more distressed euro area countries, a share of which could flow into banks located in less distressed countries.10 Second, banks may only be able to roll over part of their wholesale debt that is maturing over the next two years, with rollover rates likely to reflect differences across banks in terms of the degree of stress affecting their sovereign.11 Third, the fragmentation of the funding market also forces many banks to advance with efforts to alleviate the more structural and medium-term funding-related pressures on their balance sheets, such as targeting specific loan-to-deposit ratio targets that reflect a more general need to reduce wholesale funding reliance (also in the light of upcoming Basel III-based liquidity requirements).12
In those countries where adverse developments are expected, such quantitative funding constraints on credit intermediation induce banks to engage in deleveraging policies. Overall, the funding constraints induce the affected banks to deleverage their balance sheets, producing a shock to loan supply that in turn has negative repercussions on economic activity. For many banks, these deleveraging forces exceed the acute pressures on their balance sheets from the short-term liquidity shortages observed towards the end of 2011 that were addressed by the two three-year LTROs. If it is assumed, in addition, that there is a pecking order of deleveraging whereby banks first shed their more liquid assets (such as non-domestic sovereign bonds and interbank exposures), followed by foreign credit exposures and, only as a last resort, reduce their domestic loan book, quantitative constraints on lending (loan supply shocks) result.13 The size of the loan supply shocks ranges from slightly positive (mainly owing to deposit inflows) in a few countries to close to -10% of the outstanding loan book in the worst affected countries (see Chart B.9). It is, however, important to note that the derived magnitude of such disorderly deleveraging does not take into account the impact of potential mitigating policy actions by, for instance, regulators or central banks.
The macroeconomic impact resulting from the shocks to bank solvency positions is derived using a dynamic stochastic general equilibrium (DSGE) model, which includes a well-specified household and corporate sector subject to borrowing constraints (linked to the value of their collateral) as well as a capital-constrained, profit-optimising banking sector.14 Overall, the effects of the joint sovereign contagion and funding stress configuration entail a country-specific impact on real GDP growth, in percentage point deviations from the baseline, ranging from -0.3 for the less affected countries (on a GDP-weighted average basis) to -1.9 for the distressed countries by the end of 2012 and from -0.4 for the less affected countries to -2.5 for the distressed countries by the end of 2013. On average, across the euro area countries, the impact in turn amounts to -0.8 by the end of 2012 and to -1.0 by the end of 2013, in percentage point deviations from the baseline. Obviously, in applying these estimates to actual economic conditions in countries under stress, some of these impacts may have already become apparent – as suggested by the wide range of economic projections for euro area countries reported in, for example, the European Commission’s European Economic Forecast Autumn 2012.
10 The simulated deposit outflows range from 20% for banks in sub-investment grade countries to -1% in AA-rated countries. It is assumed that some of these flows end up in banks in AAA-rated countries.
11 The assumed rollover rates range from 90% for AAA-rated countries to 50% for sub-investment grade countries.12 More stringent loan-to-deposit ratios are imposed on countries under distress (also reflecting concrete requirements in the context of the
EU/IMF programmes). The target loan-to-deposit ratios range from 175% for AAA-countries to 110% in sub-investment grade countries. 13 See e.g. L. Maurin and M. Toivanen, “Risk, capital buffers and bank lending: a granular approach to the adjustment of euro area banks”,
ECB Working Paper Series, No 1499, 2012, and C. Kok and G. Schepens, “Banks’ reactions after capital shortfalls”, ECB Working Paper Series, forthcoming.
14 See M. Darracq Pariès, C. Kok and D. Rodriquez Palenzuela, “Macroeconomic propagation under different regulatory regimes: an estimated DSGE model for the euro area”, International Journal of Central Banking, December 2011.
… via higher funding costs being
passed on to retail lending and deposit
rates
The combination of constrained
access to wholesale markets, deposit
outflows and more structural funding model adjustments
can give rise to asset-side
deleveraging and a reduction of loan
supply
… that in turn may have negative
real economic implications

117ECB
Financial Stability ReviewDecember 2012 117
sPecial features
117
These country-specifi c macroeconomic scenarios would subsequently affect banks’ solvency position via the effects on their profi t and loss accounts. The extent of this impact is estimated by projecting the main variables determining banks’ solvency, such as the credit risk parameters, profi ts and risk-weighted assets (see Section 4.3 for details on the solvency analysis framework applied). Owing to the cross-country heterogeneity in the imposed shocks, the resulting impact on core Tier 1 ratios likewise varies substantially across banks in different countries (see Chart B.10). Notably, banks in the distressed countries are, on average, expected to be more severely affected in terms of their solvency (-2.5 percentage point change, on average, between the end of 2011 and the end of 2013), whereas banks resident in the less affected countries are (with few exceptions) more resilient to the funding market fragmentation considered here.
cOncluDing remarks
The analysis presented in this special feature suggests that the sovereign debt crisis combined with heightened distress in bank funding markets has contributed to the fragmentation of the euro area banking sector. Banks’ funding conditions have been affected by sovereign risk via different channels. First, banks’ direct exposures to sovereign debt, while in principle providing banks with a stable stream of revenues, have at the same time contributed to weakening their balance sheets in the eyes of investors and thereby decreased their creditworthiness as counterparties. Second, higher sovereign risk reduces the value of the sovereign collateral banks post to raise their wholesale funding. In addition, other effects emanating from implied effects on the value of implicit or explicit government guarantees or further fi nancial contagion, from sovereign to sovereign or from sovereign to banks, contribute to the overall effect on banks’ funding conditions.
Illustrative quantitative estimates exploring the combined effects of the fragmentation and the sovereign debt crisis vary widely across euro area countries, with the distressed economies most severely affected. The effect of the sovereign debt crisis on economic activity remains nonetheless contained at the euro area level – not least as redistributive effects associated with fragmentation may lead to a muted aggregate effect. While these estimates provide a useful means of quantifying
... which could further impair banks’ loss-absorption capacity and exert pressure on their solvency position
Financial market fragmentation is a cause for concern…
… in particular, as it may seriously impair the credit intermediation process...… entailing signifi cant fi nancial stability risks
The increasing fragmentation of euro area fi nancial markets is also hampering the smooth transmission of monetary policy
chart b.10 change in country aggregate core tier 1 ratio owing to sovereign contagion and funding fragmentation(percentage point change; end-2011 to end-2013; maximum, minimum, interquartile distribution and median)
-9
-8
-7
-6
-5
-4
-3
-2
-1
0
1
2
-9
-8
-7
-6
-5
-4
-3
-2
-1
0
1
2
Distressed countries Other euro area countries
Sources: ECB and ECB calculations.
chart b.9 size of country-specific loan supply shocks owing to sovereign contagion and funding fragmentation(percentage change in total outstanding loans; end-2011 to end-2013; maximum, minimum, interquartile distribution and median)
-10
-8
-6
-4
-2
0
2
-10
-8
-6
-4
-2
0
2
Distressed countries Other euro area countries
Sources: ECB and ECB calculations.

118ECBFinancial Stability ReviewDecember 2012118118
prospective effects under clear assumptions, reality is, of course, far more complex. In particular, the weakening of economic activity predicted by model-based estimates could extend beyond the channels analysed, thereby potentially amplifying initial adverse effects.
Ultimately, fragmentation has remained a key financial stability issue throughout the sovereign debt crisis. For the ECB, fragmentation has not only been a source of concern from a financial stability perspective, but also in its role in hampering the effective transmission of monetary policy – and the key need for regional lending conditions to adequately reflect Eurosystem key policy rates. This has motivated several non-standard policy measures to improve the effectiveness of monetary policy. Eurosystem support in itself presents only part of the solution – indeed, sustained political efforts at the national and pan-European level are needed to ultimately sever the “Gordian knot” which has emerged between sovereigns and their resident banks. In this regard, the June 2012 European Council agreement to allow for the direct recapitalisation of banks by the European Stability Mechanism once the Single Supervisory Mechanism has been established constitutes an important step towards breaking the adverse feedback loop between sovereigns and banks.
Recent policy measures, including
plans for the Single Supervisory
Mechanism, should help break the
adverse feedback loop between banks
and sovereigns

119ECB
Financial Stability ReviewDecember 2012 119
sPecialfeatures
119
c tOwarDs a banking uniOn
The establishment of a banking union is a major component of the framework required for a genuine Economic and Monetary Union (EMU). The legislative proposals published by the European Commission on 12 September 2012 regarding the establishment of a Single Supervisory Mechanism (SSM) as part of a “Roadmap towards a Banking Union” represent a major step in this direction. The proposals follow up on the euro area summit statement of 29 June, and are in line with the European Council’s call for an integrated financial framework. This special feature argues that while the building of a banking union is an arduous and complex process, it is nevertheless essential to support an effective EMU. The financial crisis has illustrated the fundamental inconsistency of banking supervision being carried out at the national level in a currency area with a single monetary policy. Under the current setting, fragility in national banking systems can be quickly transmitted to the national fiscal side and vice versa, triggering an adverse feedback loop between fiscal and banking problems. This is damaging from a financial stability perspective and hampers the smooth transmission of monetary policy. In the short term, the SSM should contribute to weakening significantly the link between banks and sovereigns persisting in a number of euro area countries. In the long term, the stronger institutional framework of the SSM should exert a beneficial influence on the euro area and the global economy. From this perspective, this special feature highlights the importance of moving towards a common supervisory system and implementing a common resolution regime. In particular, an independent European resolution authority is urgently required to meet the challenges posed by the resolution of banking institutions, also at a cross-border level. Such an authority is also necessary in order to align the incentives of the SSM and the resolution function.
intrODuctiOn
The architecture of EMU needs to be substantially strengthened to break the adverse link between bank and sovereign risk in some euro area Member States and to reverse the current process of financial market fragmentation in the euro area. The crisis has highlighted the fundamental incongruity of banking supervision being controlled at the national level in a currency area with a single monetary policy. In a monetary union, fragility in national banking systems can transmit quickly to domestic fiscal tensions, and vice versa, giving rise to an adverse fiscal/financial loop that jeopardises both financial and monetary stability, hampering the transmission of monetary policy. To overcome these problems in a consistent manner and to safeguard stability and confidence in the financial system, an appropriate regulatory and supervisory framework is essential.
The ECB supports the conclusions of the Final Report by the President of the European Council on EMU and an integrated financial framework centred around an SSM.1
The establishment of the SSM should contribute to restoring confidence in the banking sector and to reviving interbank lending and cross-border credit flows through independent integrated supervision for all participating Member States, on the basis of a system that involves the ECB and national supervisors. The SSM will also contribute to the effective application of the single rulebook for financial services and the harmonisation of supervisory procedures and practices, by removing national distortions and better reflecting the needs of an integrated currency area.
1 See the Interim Report by the President of the European Council, Towards a genuine economic and monetary union, 12 October 2012, and the Final Report by the President of the European Council in close collaboration with the Presidents of the European Commission, Eurogroup and European Central Bank, Towards a genuine economic and monetary union, 5 December 2012 (available at http://www.consilium.europa.eu/uedocs/cms_Data/docs/pressdata/en/ec/134069.pdf).
The banking union will strengthen the institutional framework in the euro area, creating a true monetary union
With a broader perspective, it will harmonise supervisory procedures and remove national distortions

120ECBFinancial Stability ReviewDecember 2012120120
This special feature will, first, review the reasons for establishing the SSM. Second, it will mention the main elements of, and guiding principles behind, the planned SSM. Third, an issue of paramount importance, namely the urgent need to establish a single European bank resolution authority as an essential complement to the SSM, will be discussed. Finally, the special feature will conclude by explaining the importance of macro-prudential policies for ensuring effective supervision, a key lesson from the crisis.
tHe macrOecOnOmic anD structural ratiOnale fOr a banking uniOn
Over the past few years, pressures in funding markets have increasingly triggered a fragmentation of the euro area banking system along national lines. A key feature of the present crisis is the increase in the correlation between the cost of funding of euro area banks and that of their respective sovereigns, particularly in some countries under stress. Countries suffering from a loss of market confidence have become progressively more dependent on domestic sources of funding (where and insofar as they are available) and less responsive to common monetary policy impulses. The divergence in bank funding conditions at the national level, in turn, gives rise to cross-country differences in lending conditions. The retrenchment of credit supply within national borders, coupled with funding pressures, impairs the transmission of monetary policy, which in the euro area, functions primarily via the banking sector. In some jurisdictions, lending conditions for households and firms become tighter (or looser) than they should be given the prevailing monetary policy stance, and less predictable. To a large extent, the need to remedy this situation explains the extraordinary monetary policy decisions made by the ECB in recent months.
It is important to stress that this loop between banking problems and tensions in sovereign funding can undermine national efforts towards re-establishing fiscal sustainability. Indeed, some countries undergoing a fiscal adjustment process may be penalised by financial markets on account of their potential additional burden of supporting the domestic banking system. As a result, their banks face increasing pressures in terms of their refinancing and the fragmentation of the euro area banking system along national lines increases further. Against this background, the need to weaken the spillover chain between banks and sovereigns by taking responsibility for the stability of the banking system at the European level becomes evident. Within the framework of improving the institutional arrangements to ensure a more efficient and consistent solution to banking problems across the euro area, a banking union is a necessary step to improve investors’ confidence and to weaken this link between fiscal and banking problems. It would also contribute to achieving a more integrated banking system that supports a full-fledged EMU.
The first step towards a banking union took place when the Heads of State or Government at the euro area summit of 29 June 2012 invited the Commission to present a proposal on the basis of Article 127(6) of the Treaty on the Functioning of the European Union to establish an SSM involving the ECB. The Commission published its proposals on 12 September 2012.2 In October the European Council reiterated the aim of completing the legislative work by the end of the year and called for further progress to be achieved on other related legislation, including the single rulebook and the new Capital Requirements Directive (CRD IV). Finally, the European Council mentioned, as further objectives, bank resolution arrangements and the harmonisation of national deposit-guarantee schemes.
2 See the proposal from the European Commission for a Council regulation conferring specific tasks on the European Central Bank concerning policies relating to the prudential supervision of credit institutions (COM(2012) 511 final), and the proposal for a regulation of the European Parliament and of the Council amending Regulation (EU) No 1093/2010 establishing a European Supervisory Authority (European Banking Authority) as regards its interaction with Council Regulation (EU) No.../... conferring specific tasks on the European Central Bank concerning policies relating to the prudential supervision of credit institutions (COM(2012)512 final).
Fragmentation and tensions in bank
funding conditions at the national
level have impaired the transmission
mechanism of monetary policy…
… and fragmentation could
also contribute to negative loops between banking
problems and tensions in
sovereign funding
On 12 September the European
Commission published a
proposal to establish an SSM involving
the ECB

121ECB
Financial Stability ReviewDecember 2012 121
sPecialfeatures
121
tHe main elements Of tHe ssm
The SSM will support and complement the institutional setting of EMU. It should ensure homogeneous standards of supervisory intensity across the euro area. The SSM should assess, in a fully independent and autonomous manner, the banking system and individual banks, so that domestic factors have no impact on the effectiveness and the timeliness of the relevant supervisory decisions. This will be decisive in restoring and maintaining confidence in the banking sector. In turn, it should help to reverse the trend towards financial fragmentation and also help to restart and preserve a well-functioning interbank market.
In this context, the SSM should be better able to address systemic risk, as it will take into account externalities and spillovers in a fully integrated economic area, and be more effective in preventing imbalances over the economic cycle.
The SSM will reinforce and further develop the Single Market for financial services. A single framework for monitoring the banking sector will facilitate common crisis management in the event of future crises. The SSM will also reduce the risk of coordination failures among supervisors in the Single Market, thereby facilitating the role of the European Banking Authority (EBA) with regard to the convergence of supervisory practices across all Member States, as well as the development of a single rulebook.
For participating Member States therefore, building a single supervisory authority around the ECB provides an institutional solution that has the independence, the legal means and, in conjunction with the national supervisory authorities, the resources and technical capability to carry out these supervisory tasks at the European level.
funDamental PrinciPles
The Governing Council of the ECB has presented the following set of guiding principles for establishing the SSM.3
First, the ECB, within the SSM, should be able to carry out the tasks assigned to it effectively and rigorously without any risk to its reputation. Second, the ECB should remain independent in carrying out all its tasks. Third, there should be a strict separation between the ECB’s new tasks concerning supervision and its monetary policy tasks, as assigned by the Treaty. Fourth, the ECB should be able to have full recourse to the knowledge, expertise and operational resources of national supervisory authorities. Fifth, the SSM should operate in a manner fully consistent with the principles underpinning the Single Market in financial services and in full adherence to the single rulebook for financial services. In this regard, the ECB also welcomes the possibility of involving non-euro area Member States in the SSM to ensure greater harmonisation of supervisory practices within the EU, thus strengthening the internal market. Sixth, the ECB is ready to comply with the highest standards of accountability with regard to the supervisory tasks.
3 See the ECB’s Opinion of 27 November 2012 on a proposal for a Council regulation conferring specific tasks on the European Central Bank concerning policies relating to the prudential supervision of credit institutions and a proposal for a regulation of the European Parliament and of the Council amending Regulation (EU) No 1093/2010 establishing a European Supervisory Authority (European Banking Authority) (CON/2012/96) (available at http://www.ecb.europa.eu/ecb/legal/pdf/en_con_2012_96_f.pdf).
A strict separation between the monetary policy and supervisory mandates will ensure independence in carrying out both tasks

122ECBFinancial Stability ReviewDecember 2012122122
The principles can be detailed as follows.
First, to enable the SSM to conduct effective supervision, the proposed SSM regulation entrusts the ECB with specific supervisory tasks associated with the necessary corresponding supervisory and investigatory powers and direct access to information. This is essential to ensure that the SSM performs its tasks effectively. The inclusion of all credit institutions under the scope of the SSM is important to preserve a level playing field among banks and prevent segmentation in the banking system.
The proposed conferral of macro-prudential supervisory powers on the ECB is welcome since the ECB will be able to coordinate the use of macro- and micro-prudential policies. The proposed SSM regulation should enable the activation of macro-prudential instruments provided by EU law, including the counter-cyclical buffers and any other measures aimed at addressing systemic or macro-prudential risks, by either the national macro-prudential authorities or the ECB. It should be open to them to apply more stringent requirements, if deemed necessary and subject to prior notification. The national authorities and the ECB will cooperate closely in this field. In particular, given their responsibility for financial stability, and their close proximity to, and knowledge of, national economies and financial systems,4 the national authorities should have sufficient tools at their disposal to address macro-prudential risks related to the particular situation of participating Member States, without prejudice to the possibility for the SSM to also act to contain such risks in an effective manner by imposing more stringent measures. In view of the importance of a functional separation between macro- and micro-prudential supervision, on the one hand, and the Governing Council’s responsibility for financial stability, on the other, specific procedures should be envisaged within the SSM framework for the involvement of the Governing Council with regard to the ECB’s decisions on macro-prudential policy measures.
Second, the ECB has to perform the tasks conferred on it by the proposed SSM regulation without prejudice to the objectives of the European System of Central Banks (ESCB) as provided in Article 127 of the Treaty.5 The ECB will be required to ensure that its activities within the SSM neither affect the ESCB’s performance of any of its tasks under the Treaty and the Statute of the European System of Central Banks and of the European Central Bank, nor compromise its institutional setting. Under the Treaty and the Statute,6 the ECB enjoys full independence7 in executing its tasks, which includes any supervisory tasks conferred on it by virtue of Article 127(6) of the Treaty.
Third, it is essential to strictly separate monetary policy and the supervisory tasks conferred on the ECB, to prevent potential conflicts of interest and ensure autonomous decision-making for the performance of these tasks, while ensuring compliance with the ESCB’s institutional framework. To that end, appropriate governance structures are needed to ensure separation between these tasks, while allowing the overall structure to benefit from synergies. In this respect, it should be ensured that, under the proposed SSM regulation and within the context of the Treaty framework, the new supervisory board will constitute the centre of gravity of the ECB’s supervisory function. Besides the heads of supervision of the competent authorities in the participating Member States,
4 See the ECB’s Opinion of 25 January 2012 on a proposal for a Directive on the access to the activity of credit institutions and the prudential supervision of credit institutions and investment firms and a proposal for a Regulation on prudential requirements for credit institutions and investment firms (CON/2012/5) (OJ C 105, 11.4.2012, p. 1).
5 See Articles 127(1) and 282(2) of the Treaty and Article 2 of the Statute.6 See Articles 130 and 282(3) of the Treaty and Article 7 of the Statute.7 The concept of central bank independence includes functional, institutional, personal and financial independence (see, for example, the
ECB’s Convergence Report 2012, p. 21).
The SSM will include all credit
institutions to preserve a level
playing field
The ECB or national authorities
should both be able to activate the macro-prudential
instruments
The separation between the
monetary policy and supervisory
mandates will be reflected in the organisational
arrangements and include appropriate
governance structures

123ECB
Financial Stability ReviewDecember 2012 123
sPecialfeatures
123
the supervisory board should also include, as observers, representatives of national central banks that perform supervisory activities ancillary to those of the national competent authorities when provided for by statute.
Furthermore, the supervisory board should have, to the largest extent possible, the necessary tools and expertise to perform its tasks effectively, while respecting the ultimate statutory responsibilities of the ECB’s decision-making bodies. In this context, the framework for the functioning of the supervisory board should ensure equal treatment with regard to the participation of representatives of the competent national authorities of all the participating Member States, including those which have established close cooperative links with the ECB. Lastly, also taking into account the experience of the various national central banks already performing supervision, the ECB will be required to establish appropriate internal rules and procedures to ensure adequate separation within the functions supporting these tasks.
Fourth, it is essential for the SSM to be able to leverage the expertise and resources of national supervisors in performing the new supervisory tasks. In-depth qualitative information and consolidated knowledge of credit institutions are essential, as well as reliable quantitative information. Through appropriate decentralisation procedures (to be defined within the SSM), while preserving the unity of the supervisory system and avoiding duplication, the SSM will be able to benefit from the closer proximity of national supervisors to the supervised entities and, at the same time, ensure the necessary continuity and consistency of supervision across participating Member States.
It will also be important to ensure that the ECB’s final responsibility for supervision within the SSM is matched by control powers over the SSM as a whole and the supervised entities, as well as by very close cooperation arrangements with the competent national authorities, including specific rules in emergency situations and adequate information flows. Therefore, there should be efficient arrangements for information flows within the SSM to also prevent any duplication of reporting obligations for credit institutions.
Fifth, the proposed SSM and EBA regulations must ensure that the new framework will be consistent with the Single Market. The following two main elements may contribute to achieving this aim. First, the proposed SSM regulation should allow Member States wishing to join the SSM to engage in appropriate close cooperation mechanisms and to participate fully in the activities of the supervisory board on an equal footing with euro area Member States, i.e. with the same rights and obligations. Second, the conferral on the ECB of tasks concerning the prudential supervision of credit institutions for euro area Member States creates a new institutional framework which may require adjustments to the governance of the EBA. The proposed EBA regulation should provide for the necessary adjustments to the governance structure and powers of the EBA, in particular by providing for equal treatment between the national supervisory authorities and the ECB, while safeguarding the ECB’s independence.
Moreover, in consideration of its new central role in the SSM, the ECB will contribute to ensuring that the national competent authorities participating in the SSM assume mutually consistent positions in the EBA’s decision-making bodies on issues falling within the scope of the ECB’s supervisory tasks, including the development of specific rules in this area as appropriate, without prejudice to the supervisory tasks remaining with national competent authorities. Lastly, appropriate arrangements might be developed in order to ensure smooth cooperation of the SSM with the non-participating Member States.
The national supervisors and the ECB will both be part of the same unified institutional framework so that the SSM should benefit from the essential knowledge of national supervisors
National competent authorities participating in the SSM will assume mutually consistent positions in the EBA’s decision-making bodies

124ECBFinancial Stability ReviewDecember 2012124124
Sixth, democratic accountability is the indispensable counterbalance to independence. The ECB is already subject to accountability and reporting obligations which should be fully maintained for its existing tasks. Similar obligations will be established under the proposed SSM regulation with a view to its new supervisory tasks. Building on those statutory obligations, separate and adequate forms of accountability should be designed, also in accordance with the Core Principles of the Basel Committee on Banking Supervision. These accountability mechanisms should reflect the following considerations. First, they should respect the ECB’s independence. Second, accountability should take place at the level at which decisions are taken and implemented. Accountability mechanisms should therefore be designed primarily at the European level, without prejudice to existing accountability arrangements of national supervisors, which also apply to their respective supervisory tasks not entrusted to the SSM, and occasional exchanges of views of the Chair or members of the supervisory board with national parliaments, as appropriate. Third, robust mechanisms should be in place to safeguard the confidentiality of supervisory information.
OtHer builDing blOcks Of a banking uniOn
While establishing the SSM would represent a major step forward towards a banking union, the banking union would be incomplete without commensurate progress towards a common resolution regime. The lack of such a common regime has increased the cost of bank failures for taxpayers and complicated their handling, particularly (but not exclusively) in cross-border cases. More harmonised deposit guarantee mechanisms would also contribute to achieving a more complete banking union.
A common resolution regime is crucial to manage crisis situations in an as orderly, effective and efficient manner as possible. A rapid adoption of the existing legislative proposals on bank recovery and resolution 8 is thus warranted as such a resolution regime does not exist in the EU at present. Many Member States do not yet have a fully adequate legal framework for swift and effective bank resolution, nor do they have adequately financed ex ante resolution funds at their disposal. As a result, during the present crisis, policy-makers have been faced with an augmented version of the classic supervisory dilemma of whether to let an institution fail, with a potential risk of undermining financial stability, or to bail out the institution using taxpayers’ money, thus fuelling moral hazard. For cross-border banks, the problems are even more severe. The number of authorities involved – each operating under a different legal framework and each focusing mainly on national interests – severely complicates a cost-effective and swift resolution of such institutions.
Moving towards a common supervisory system without corresponding progress towards a common resolution regime would therefore result in an incomplete institutional framework. Leaving resolution powers at the national level could stand in the way of a cost-effective and swift resolution of banking problems. National authorities – eager to avoid any costs to their taxpayers and reluctant to bail-in domestic parties – would have an incentive to procrastinate, exercise supervisory forbearance and seek generous central bank liquidity support for overly extensive periods of time.
The Commission’s recent proposals on bank recovery and bank resolution are an important first step towards an efficient and financially sound area-wide bank resolution regime. It aims to provide a harmonised toolbox at the EU level. Nonetheless, to overcome the challenges surrounding the orderly resolution of cross-border institutions, an independent European resolution authority is
8 See the proposal for a directive of the European Parliament and of the Central establishing a framework for the recovery and resolution of credit institutions and investment firms and amending Council Directives 77/91/EEC and 82/891/EC, Directives 2001/24/EC, 2002/47/EC, 2004/25/EC, 2005/56/EC, 2007/36/EC and 2011/35/EC and Regulation (EU) No 1093/2010 (COM/2012/0280 final).
Accountability is essential and warranted for a
well-functioning SSM
A common resolution regime is essential for the banking union…
… the lack of such a framework has complicated the management of
bank failures and increased costs to
taxpayers
Without a common resolution regime,
the institutional framework is
unbalanced and could lead to
costly delays in the resolution of
banking problems
The Commission’s recent proposal on bank recovery and bank resolution is an important and
positive first step in this direction

125ECB
Financial Stability ReviewDecember 2012 125
sPecialfeatures
125
urgently required to align the incentives of the SSM and the resolution function. To this end, a common authority, free of the constraints of national mandates, is needed to exercise the bank resolution function in an independent manner across the euro area. This authority should have the tools to address banking crises pre-emptively, safeguarding financial stability and minimising taxpayers’ exposure to losses. When created, the European resolution authority will use homogeneous tools, principles and procedures and implement them consistently across all banks and countries in its jurisdiction.
In a banking union, the resolution authority and the SSM are natural complements. The SSM removes what has thus far been the guiding principle of the EU’s cross-border supervisory framework, namely home country control. Under the current setting, national resolution authorities – responsible for funding resolution and covering insured depositors – have an incentive to request cheap emergency financing for as long as possible in the hope that this may “turn things around”, rather than to take swift resolution action. The ECB, on the other hand, as a supervisor, may be exposed to criticism for being excessively severe and putting national funds at risk in the event it pushes for resolution action at the national level. Therefore, once banks are regulated and supervised at the SSM-wide level, a common resolution authority is the inevitable complement.
macrO-PruDential POlicies
Another major component that is essential for an effective supervisory area is macro-prudential policy. Before the crisis, banking supervision in most (but not all) countries was fundamentally “micro-based”, i.e. it was focused on ensuring the safety and soundness of individual institutions, while taking the rest of the financial system as a given. From a policy perspective, as a result of the crisis, there has been an increased interest in the macro-prudential approach to bank regulation and supervision. Consequently, the international debate among academics and policy-makers has shifted focus to how to detect and prevent systemic risks, and how regulators and supervisors can reorient and complement their activity to curb these risks.
While risks to financial stability stemming from credit booms and other cyclical phenomena are well documented, the recent crisis suggests that the traditional supervisory approach is insufficient to prevent structural changes that facilitate a build-up of systemic risks. In this sense, it is broadly recognised that the deregulation of and financial innovation in the banking sector in most developed countries in the last 15 years have led to a profound overhaul of banks’ business models, altering their incentives to take on more risk, including new forms of tail risk.
The crisis has significantly raised awareness of these macro-prudential aspects and the endogenous nature of many systemic episodes of financial instability. It has also shown that individual credit institutions may be “systemic” for a variety of reasons: on account of their interconnectedness and cross-exposure with other banks, market interlinkages and through the domestic fiscal sector, to name just a few. As a result, banking fragility can more easily affect the real sector of the economy. The crisis has also illustrated that contagion can easily extend across countries, especially in a currency area, through a variety of channels, notably the interaction between the banking and fiscal sectors.
Under these conditions, the micro-based approach – which looks at the impact of deregulation on a single institution while the rest of the system is assumed to be stable – is likely to overestimate the efficiency gains and underestimate the potential negative externalities derived from the inherent risks in certain types of financial innovation.
Before the crisis, banking supervision was, in most countries, fundamentally “micro based”, i.e. it was focused on ensuring the safety and soundness of individual institutions
As the recent and previous crises have shown, the traditional approach is clearly insufficient to prevent the build-up of systemic risks

126ECBFinancial Stability ReviewDecember 2012126126
At the same time, in the long term, the macro-prudential perspective is an essential complement to the micro-prudential perspective. In this respect, the most basic objectives of micro-prudential supervision are, first, to safeguard depositors (and the taxpayer who might be liable to cover any losses on deposits) who are likely to be uninformed about the risks taken by the bank and, second, to tame the negative externalities for the economy derived from the failure of a single institution. From this perspective, operatively, it is important to note that in the long term, these micro-prudential objectives can only be achieved if an effective macro-prudential supervisory system is in place and working effectively in combination with the micro-prudential precautions.
In the presence of rapid financial innovation, a merely micro-prudential supervisory approach may lead to an underestimation of the build-up of systemic risks in the economy. An illustrative example is provided by a credit boom. During such a boom, most banks would typically show high levels of bank profitability and very contained measures of bank risk, thereby offering a comforting view of the solvency of individual banks from a micro-prudential supervisory perspective. Yet historical experience shows that strong credit growth often occurs at the cost of increasing systemic risks, for instance, by relaxing lending standards or by excessive reliance on short-term market funding.
Macro-prudential objectives can be reached using largely the same instruments used to achieve micro-prudential objectives, and such a holistic approach does not necessarily imply or require a new supervisory toolbox. Indeed, while some instruments have been developed with the express purpose of mitigating systemic risk (i.e. new macro-prudential instruments), the majority are already regularly used by national banking supervisors. In the latter case, what changes is that these instruments are applied with a broader perspective, internalising the systemic externalities that can be produced endogenously within the financial system.
In this regard, European legislation contains a variety of macro-prudential policy instruments, including counter-cyclical capital buffers, surcharges differentiated across banks according to their contribution to systemic risk, and liquidity and leverage requirements to be implemented over time. Others, such as loan-to-income or loan-to-value ratios, continue to be governed by national legislation. The proposed conferral of macro-prudential powers on the ECB will allow it to coordinate the use of macro- and micro-prudential policies. The proposed SSM regulation enables the macro-prudential instruments provided by EU law to be activated at the initiative of either the ECB or the national authorities. Hence, it recognises that the national authorities have an interest in using some of these instruments for domestic regulatory purposes. Overall, a balance would need to be found between recognising those interests and preserving the integrity and effectiveness of the single supervisor.
cOncluDing remarks
The establishment of a banking union will be a major component of the institutional framework required for a genuine EMU. The crisis has brought to the fore the limitations derived from participating Member States having national responsibility for banking policies in a currency area with a single monetary policy. It has shown that fragility in national banking systems can transmit quickly to domestic fiscal deficits, and vice versa, giving rise to adverse fiscal/financial feedbacks that are deleterious for both financial and monetary stability, and hinder the transmission of monetary policy. The SSM will ensure homogeneous standards of supervisory intensity across the euro area as a whole. It will address systemic risk in a more efficient manner by taking a wider perspective and considering externalities and spillovers. At the same time, competent national
In the long term, the micro-prudential
objectives can only be achieved
if an effective macro-prudential
supervisory system is in place
In fact, micro- and macro-prudential
instruments are largely the same, although each is
applied using a different perspective
The banking union will strengthen
EMU, in particular by ensuring
consistency in supervisory
standards and addressing systemic
risks.

127ECB
Financial Stability ReviewDecember 2012 127
sPecialfeatures
127
authorities will continue to bring their expertise to this area and will also address macro-prudential risks. The SSM will also be able to act more decisively to prevent the creation of strong imbalances over the economic cycle.
Even with a common supervisory system, however, a banking union would be incomplete without the establishment of a European resolution authority free of the constraints of national mandates. There must be certainty that each bank, however large and important, can exit the market if necessary, with the least possible cost in terms of systemic stability and use of collective resources. Only a dedicated authority, with jurisdiction over the same geographical area as the single supervisor, can perform this function effectively.
Yet only with an efficient European resolution authority can the banking union achieve its goals.


stat ist ical anneX
1. MACRO RISKS
S 1ECB
Financial Stability ReviewDecember 2012
S.1.1 Actual and forecast real GDP growth
S.1.2 Actual and forecast unemployment rates
(Q1 2004 - Q3 2012; annual percentage changes) (Jan. 2004 - Sep. 2012; percentage of the labour force)
-18-16-14-12-10
-8-6-4-202468
101214
-
-
2004 2005 2006 2007 2008 2009 2010 2011 2012 2013-18-16-14-12-10-8-6-4-202468101214
euro areaeuro area - forecast for 2013
United StatesUnited States - forecast for 2013
2
4
6
8
10
12
14
16
18
20
22
24
26
28
-
-2004 2005 2006 2007 2008 2009 2010 2011 2012 2013
2
4
6
8
10
12
14
16
18
20
22
24
26
28euro areaeuro area - forecast for 2013
United StatesUnited States - forecast for 2013
Sources: Eurostat and European Commission (AMECO, autumn 2012 forecast).Note: The hatched area indicates the minimum-maximum range across euro areacountries.
Sources: Eurostat and European Commission (AMECO, autumn 2012 forecast).Note: The hatched area indicates the minimum-maximum range across euro areacountries.
S.1.3 Slope of government bond yield curves
S.1.4 Citigroup Economic Surprise Index
(2 Jan. 2006 - 21 Nov 2012; basis points) (1 Jan. 2008 - 21 Nov 2012)
euro area (AAA-rated bonds)euro area (all bonds)United KingdomUnited States
-100
0
100
200
300
400
2006 2007 2008 2009 2010 2011 2012 Aug Sep Oct Nov2012
-100
0
100
200
300
400
euro areaUnited KingdomUnited StatesJapan
-200
-150
-100
-50
0
50
100
150
200
2008 2009 2010 2011 2012 Aug Sep Oct Nov2012
-200
-150
-100
-50
0
50
100
150
200
Sources: European Central Bank, Bank for International Settlements, Bank of Englandand Federal Reserve System.Notes: The slope is defined as the difference between ten-year and one-year yields.For the euro area and the United States, yield curves are modelled using the Svenssonmodel; a variable roughness penalty model is used to model the yield curve for theUnited Kingdom.
Source: Bloomberg.Note: A positive reading of the index suggests that economic releases have, on balance,been more positive than consensus expectations.
statistical anneX

S 2ECBFinancial Stability ReviewDecember 2012
S.1.5 Quarterly changes in gross external debt
S.1.6 Exchange rates
(2012 Q2; percentage of GDP) (1 Jan. 2007 - 21 Nov 2012; units of national currency per euro)
-30
-25
-20
-15
-10
-5
05
10
15
20
25
BE EE GR FR CY NL PT SKDE IE ES IT MT AT SI FI
0
120
240
360
480
600
720
840
960
1080
1200
general government (left-hand scale)MFIs (left-hand scale)other sectors (left-hand scale)direct investment/inter-company lending (left-hand scale)gross external debt (right-hand scale)
1
2+
USDGBPJPY (divided by 100)CHF
0.60
0.80
1.00
1.20
1.40
1.60
1.80
2007 2008 2009 2010 2011 2012 Aug Sep Oct Nov2012
0.60
0.80
1.00
1.20
1.40
1.60
1.80
Source: ECB.Notes: For Luxembourg, quarterly changes were 0.25% for general government, -4.51% for MFIs, 141% for other sectors and 44% for direct investment/inter-companylending. Gross external debt was 3,992% of GDP.1) Non-MFIs, non-financial corporations and households.2) Gross external debt as a percentage of GDP.
Sources: Bloomberg and ECB calculations.
S.1.7 Current account balances in selected external
surplus and deficit economies
S.1.8 Current account balances (in absolute amounts) in
selected external surplus and deficit economies(1997 - 2017; USD billions) (1997 - 2017; percentage of world GDP)
-1000
-500
0
500
1000
1500
1998 2000 2002 2004 2006 2008 2010 2012 2014 2016-1000
-500
0
500
1000
1500
euro areaUnited StatesJapan
Chinaoil exporters
0.0
0.5
1.0
1.5
2.0
2.5
3.0
3.5
4.0
1998 2000 2002 2004 2006 2008 2010 2012 2014 20160.0
0.5
1.0
1.5
2.0
2.5
3.0
3.5
4.0
all large surplus/deficit economiesUnited StatesChina
Source: IMF World Economic Outlook.Notes: Oil exporters refers to the OPEC countries, Indonesia, Norway and Russia.Figures for 2012 to 2017 are forecasts.
Source: IMF World Economic Outlook.Notes: All large surplus/deficit economies refers to oil exporters, the EU countries,the United States, China and Japan. Figures for 2012 to 2017 are forecasts.

stat ist ical anneX
S 3ECB
Financial Stability ReviewDecember 2012
S.1.9 Monthly net TIC flows into the United States
S.1.10 Foreign exchange reserve holdings
(Jan. 2007 - Aug. 2012; USD billions) (Sep. 2007 - Sep. 2012; percentage of 2009 GDP)
-200
-100
0
100
200
300
2007 2008 2009 2010 2011 2012-200
-100
0
100
200
300
net private flowsnet official flows
0
25
50
75
100
125
150
2008 2009 2010 2011 20120
25
50
75
100
125
150
advanced economiesemerging Asia
CEE/CISLatin America
Source: US Treasury International Capital System (TIC).Note: Net international transactions in long-term domestic and foreign securitiesbetween US residents and non-US residents.
Sources: Bloomberg, IMF World Economic Outlook and IMF International FinancialStatistics.Note: CEE/CIS stands for central and eastern Europe and the Commonwealthof Independent States.

2. CREDIT RISKS
S 4ECBFinancial Stability ReviewDecember 2012
S.2.1 Household debt-to-gross disposable income ratio
S.2.2 Household debt-to-total financial assets ratio
(percentage of disposable income) (Q1 2007 - Q2 2012; percentages)
-25
0
25
50
75
100
125
150
175
200
225
250
275
EA US DE IE ES IT LU AT SI FIUK JP BE EE GR FR CY NL PT SK
-25
0
25
50
75
100
125
150
175
200
225
250
2752007 debtchange in debt between 2007 and 2011 (1)
0
20
40
60
80
100
2007 2008 2009 2010 20110
20
40
60
80
100
euro areaUnited Kingdom
United StatesJapan
Sources: ECB, Eurostat, US Bureau of Economic Analysis and Bank of Japan.Notes: Gross disposable income adjusted for the change in net equity of householdsin pension fund reserves.(1) Data for Greece and Japan refer to 2010 and Luxembourg to 2009. Data for Maltais not available.
Sources: ECB and ECB calculations, Eurostat, US Bureau of Economic Analysisand Bank of Japan.Note: The hatched/shaded areas indicate the minimum-maximum and interquartile ranges across euro area countries.
S.2.3 Changes in residential property prices
S.2.4 Changes in commercial property prices
(Q1 1999 - Q2 2012; annual percentage changes) (Q4 2006 - Q4 2011; real capital value; annual percentage changes)
-60
-40
-20
0
20
40
60
2000 2002 2004 2006 2008 2010-60
-40
-20
0
20
40
60euro area United States
-60
-40
-20
0
20
40
60
2007 2008 2009 2010 2011-60
-40
-20
0
20
40
60euro area
Sources: National data and ECB calculations.Notes: The target definition for residential property prices is total dwellings (wholecountry), but there are national differences. The hatched/shaded areas indicate theminimum-maximum and interquartile ranges across euro area countries.
Sources: ECB experimental estimates based on Investment Property Databank data.Note: The hatched/shaded areas indicate the minimum-maximum and interquartileranges across euro area countries, excluding Estonia, Greece, Cyprus, Luxembourg,Malta, Slovenia, Slovakia and Finland.

stat ist ical anneX
S 5ECB
Financial Stability ReviewDecember 2012
S.2.5 Corporate debt-to-GDP and leverage ratios
S.2.6 iTraxx Europe five-year credit default swap
indices(percentages) (1 Jan. 2007 - 21 Nov 2012; basis points)
-200
-150
-100
-50
0
50
100
150
200
250
300
350
400
- -- -
- - -
--
--
- - - - --
-
EA US DE IE ES IT LU NL PT SKUK JP BE EE GR FR CY MT AT SI FI
-40-30-20-1001020
304050607080
2007 debt (left-hand scale)change in debt between 2007 and 2011 (left-hand scale)
- 2011 leverage (right-hand scale)
iTraxx EuropeiTraxx Europe High VolatilityiTraxx Europe Crossover Index (sub-investment-grade reference)
0
200
400
600
800
1000
1200
2007 2008 2009 2010 2011 2012 Aug Sep Oct Nov2012
0
200
400
600
800
1000
1200
Sources: ECB, Eurostat, US Bureau of Economic Analysis and Bank of Japan.Note: Leverage data for Cyprus, Ireland and the Netherlands is not avaialble.Corporate debt-to-GDP data for Cyprus is not available
Source: Bloomberg.
S.2.7 Sovereign credit default swap spreads for
euro area countries
S.2.8 General government deficit/surplus (+/-)
(1 Jan. 2007 - 21 Nov 2012; basis points; senior debt; five-year maturity) (percentage of GDP)
median
0
200
400
600
800
1000
1200
1400
1600
1800
2007 2008 2009 2010 2011 2012 Aug Sep Oct Nov2012
0
200
400
600
800
1000
1200
1400
1600
1800
-2
0
2
4
6
8
10
12
14
- -- -
-- -
--
-
- - - -- - -
-
EA BE EE GR FR CY MT AT SI FIDE IE ES IT LU NL PT SK
-2
0
2
4
6
8
10
12
14
four-quarter moving sum in 2012Q2
- European Commission forecast for 2012European Commission forecast for 2013
Sources: Thomson Reuters and ECB calculations.Notes: The hatched/shaded areas indicate the minimum-maixmum and interquartileranges across national sovereign CDS spreads in the euro area. Following the decision by the International Swaps Derivatives Association that a credit event had occurred,Greek sovereign CDS were not traded between 9 March 2012 and 11 April 2012. Forpresentational reasons, this chart has been truncated.
Sources: National data, European Commission (AMECO, autumn 2012 forecast) andECB calculations. Notes: Data on four quarter moving sum refer to accumulated deficit/surplus in the relevant quarter and the three previous quarters expressed as a percentage of GDP. Data for Germany and France are not available.

S 6ECBFinancial Stability ReviewDecember 2012
S.2.9 General government gross debt
S.2.10 Changes in credit standards for loans to large
enterprises(percentage of GDP, end of period) (Q1 2003 - Q3 2012; percentages)
0
20
40
60
80
100
120
140
160
180
200
- --
-
-
-
- --
-
-
- - -
-
- - -
EA BE EE GR FR CY MT AT SI FIDE IE ES IT LU NL PT SK
0
20
40
60
80
100
120
140
160
180
200
of which held by non-residentsgross debt at end-2012Q2
- European Commision forecast for 2012European Commision forecast for 2013
-50
-25
0
25
50
75
2003 2004 2005 2006 2007 2008 2009 2010 2011 2012-50
-25
0
25
50
75
euro area (loans to large enterprises)United States (commercial and industrial loans to large and medium-sized enterprises)United Kingdom (large and medium-sized enterprises)
Sources: National data, European Commission (AMECO, autumn 2012 forecast) and ECB calculations.
Sources: ECB, Federal Reserve System and Bank of England.Notes: Weighted net percentage over the past three months of banks contributing totightening standards. For the United Kingdom, data only start in the second quarterof 2007 and are weighted in addition with the market shares of the participatinglenders. The net percentage balances on corporate credit availability in the UnitedKingdom have been inverted.
S.2.11 Changes in credit standards for residential
mortgage loans
(Q1 2003 - Q3 2012; percentages)
-50
-25
0
25
50
75
2003 2004 2005 2006 2007 2008 2009 2010 2011 2012-50
-25
0
25
50
75
euro area (loans to households for house purchase)United States (all residential mortgage loans)United States (prime residential mortgage loans)United States (non-traditional residential mortgage loans)United Kingdom (secured credit to households)
Sources: ECB, Federal Reserve System and Bank of England.Notes: See the note of Chart S.2.10. The net percentage balances on secured creditavailability to households in the United Kingdom have been inverted. For the UnitedStates, the series for all residential mortgage loans has been discontinued owing to asplit into the prime, non-traditional and sub-prime market segments as from the April2007 survey.

stat ist ical anneX
3 MARKET RISKS
S 7ECB
Financial Stability ReviewDecember 2012
S.3.1 Global risk aversion indicator
S.3.2 Price/earnings ratio for the euro area stock market
(3 Jan. 2000 - 21 Nov 2012) (3 Jan. 2005 - 21 Nov 2012; ten-year trailing earnings)
-4
-2
0
2
4
6
8
10
2000 2002 2004 2006 2008 2010 2012 Aug Sep Oct Nov2012
-4
-2
0
2
4
6
8
10
main index banking sector non-financial corporations insurance sector
0
5
10
15
20
25
30
2005 2006 2007 2008 2009 2010 2011 2012 Aug Sep Oct Nov2012
0
5
10
15
20
25
30
Sources: Bloomberg, Bank of America Merrill Lynch, UBS, Commerzbank andECB calculations.Notes: The indicator is constructed as the first principal component of five currently available risk aversion indicators. A rise in the indicator denotes an increase of riskaversion. For further details about the methodology used, see ECB, ‘‘Measuringinvestors’ risk appetite’’, Financial Stability Review, June 2007.
Sources: Thomson Reuters and ECB calculations.Note: The price/earnings ratio is based on prevailing stock prices relative to an average ofthe previous ten years of earnings.
S.3.3 Equity indices
S.3.4 Implied volatility
(2 Jan. 2001 - 21 Nov 2012; index: Jan. 2001 = 100) (2 Jan. 2001 - 21 Nov 2012; percentages)
Standard & Poor’s 500 indexStandard & Poor’s 500 Banks indexKBW Bank Sector indexDow Jones EURO STOXX 50 indexDow Jones EURO STOXX Banks index
0
20
40
60
80
100
120
140
160
2002 2004 2006 2008 2010 2012 Aug Sep Oct Nov2012
0
20
40
60
80
100
120
140
160
Standard & Poor’s 500 indexKBW Bank Sector indexDow Jones EURO STOXX 50 indexDow Jones EURO STOXX Banks index
0
20
40
60
80
100
120
140
2002 2004 2006 2008 2010 2012 Aug Sep Oct Nov2012
0
20
40
60
80
100
120
140
Source: Bloomberg. Source: Bloomberg.

S 8ECBFinancial Stability ReviewDecember 2012
S.3.5 MFI credit to the private sector in the euro area
S.3.6 Annual growth of MFI credit to the private sector in
the euro area(Q1 2006 - Q2 2012; percentage of GDP) (Jan. 2006 - Sep. 2012; percentage change per annum)
0
100
200
300
400
500
600
2006 2007 2008 2009 2010 20110
100
200
300
400
500
600euro area
-20
-10
0
10
20
30
40
2006 2007 2008 2009 2010 2011 2012-20
-10
0
10
20
30
40euro area
Sources: ECB and ECB calculations.Notes: MFI sector excluding the Eurosystem. Credit to the private sector includesloans to, and holdings of securities other than shares of, non-MFI residents excludinggeneral government; MFI holdings of shares, which are part of the definition of creditused for monetary analysis purposes, are excluded. The chart shows the ratio between notional stocks of credit and GDP at current prices not adjusted for seasonal and calendar effects. The hatched/shaded areas indicate the minimum-maximum and interquartile ranges across euro area countries.
Sources: ECB and ECB calculations.Notes: MFI sector excluding the Eurosystem. Credit to the private sector includesloans to, and holdings of securities other than shares of, non-MFI residents excludinggeneral government; MFI holdings of shares, which are part of the definition of creditused for monetary analysis purposes, are excluded. The hatched/shaded areas indicatethe minimum-maximum and interquartile ranges across euro area countries.
S.3.7 Spreads over LIBOR of selected European AAA-rated
asset-backed securities
S.3.8 Return on shareholders' equity for global large and
complex banking groups(26 Jan. 2007 - 16 Nov 2012; basis points) (2008 - Q3 2012; percentages; minimum, maximum and interquartile distribution)
RMBS spread rangeauto loansconsumer loanscommercial mortgage-backed securities
0
300
600
900
1200
1500
1800
2100
2400
2007 2008 2009 2010 2011 2012 Aug Sep Oct Nov2012
0
300
600
900
1200
1500
1800
2100
2400
-60
-45
-30
-15
0
15
30
2008 2010 Q3 11 Q1 12 Q3 122009 2011 Q4 11 Q2 12
-60
-45
-30
-15
0
15
30
Source: JPMorgan Chase & Co.Note: In the case of residential mortgage-backed securities (RMBSs), the spreadrange is the range of available individual country spreads in Greece,Ireland, Spain, Italy, the Netherlands, Portugal and the United Kingdom.
Sources: Individual institutions’ reports, Bloomberg and ECB calculations.Notes: Quarterly figures are annualised. Annual and quarterly data are based on commonsamples of 13 and 10 global large and complex banking groups respectively.

stat ist ical anneX
S 9ECB
Financial Stability ReviewDecember 2012
S.3.9 Return on total assets for global large and
complex banking groups
S.3.10 Net loan impairment charges for global large and
complex banking groups(2008 - Q3 2012; percentages; minimum, maximum and interquartile distribution) (2008 - Q3 2012; percentage of total assets; minimum, maximum and interquartile
distribution)
-1.5
-1.0
-0.5
0.0
0.5
1.0
1.5
2.0
2008 2010 Q3 11 Q1 12 Q3 122009 2011 Q4 11 Q2 12
-1.5
-1.0
-0.5
0.0
0.5
1.0
1.5
2.0
-0.5
0.0
0.5
1.0
1.5
2.0
2.5
2008 2010 Q3 11 Q1 12 Q3 122009 2011 Q4 11 Q2 12
-0.5
0.0
0.5
1.0
1.5
2.0
2.5
Sources: Individual institutions’ reports, Bloomberg, ESCB and ECB calculations.Notes: Quarterly figures are annualised. Annual and quarterly data are based oncommon samples of 11 and ten global large and complex banking groups respectively.
Sources: Individual institutions’ reports, Bloomberg and ECB calculations.Notes: Annual and quarterly data are based on common samples of ten and eightglobal large and complex banking groups respectively.
S.3.11 Tier 1 capital ratio for global large and complex
banking groups
S.3.12 Credit default swap spreads for global large
and complex banking groups(2008 - Q3 2012; percentages; minimum, maximum and interquartile distribution) (3 Jan. 2007 - 21 Nov 2012; basis points; senior debt; five-year maturity)
6
8
10
12
14
16
18
20
22
2008 2010 Q3 11 Q1 12 Q3 122009 2011 Q4 11 Q2 12
6
8
10
12
14
16
18
20
22median
0
200
400
600
800
1000
1200
1400
2007 2008 2009 2010 2011 2012 Aug Sep Oct Nov2012
0
200
400
600
800
1000
1200
1400
Sources: Individual institutions’ reports, Bloomberg, ESCB and ECB calculations.Notes: Quarterly figures are annualised. Annual and quarterly data are based on common samples of 13 and 12 global large and complex banking groups respectively.
Sources: Thomson Reuters, Bloomberg and ECB calculations.Note: The hatched/shaded areas indicate the minimum-maximum and interquartileranges for the CDS spreads of selected large banks.

S 10ECBFinancial Stability ReviewDecember 2012
S.3.13 Stock performance of global large and complex
banking groups
(3 Jan. 2007 - 21 Nov 2012 ; index: 3 Jan. 2007 = 100)median
0
20
40
60
80
100
120
140
2007 2008 2009 2010 2011 2012 Aug Sep Oct Nov2012
0
20
40
60
80
100
120
140
Source: Thomson Reuters, Bloomberg and ECB calculations.Note: The hatched/shaded areas indicate the minimum-maximum and interquartile rangesfor equities of selected large banks.

stat ist ical anneX
4 LIQUIDITY AND FUNDING
S 11ECB
Financial Stability ReviewDecember 2012
S.4.1 Financial market liquidity indicator for the euro
area and its components
S.4.2 Liquid assets ratio for euro area domestic banks
(4 Jan. 1999 - 21 Nov 2012) (2009 - H1 2012; percentage of total assets; minimum, maximum and interquartiledistribution)
composite indicatorforeign exchange, equity and bond marketsmoney market
-6
-5
-4
-3
-2
-1
0
1
2
3
2000 2002 2004 2006 2008 2010 2012 Q3 Q42012
-6
-5
-4
-3
-2
-1
0
1
2
3
0
5
10
15
20
25
30
35
40
45
50
2009 2010 2011 H1 20120
5
10
15
20
25
30
35
40
45
50
Sources: ECB, Bank of England, Bloomberg, JPMorgan Chase & Co., Moody’s KMVand ECB calculations.Notes: The composite indicator comprises unweighted averages of individual liquiditymeasures, normalised from 1999 to 2006 for non-money market componentsand over the period 2000 to 2006 for money market components. The data shown have been exponentially smoothed. For more details, see Box 9 in ECB, Financial StabilityReview, June 2007.
Source: ESCB.Notes: All euro area domestic banks consolidated across borders and sectors,excluding insurers and non-financial corporations. Liquid assets comprise cashand trading assets. The distribution of the ratios is across euro area countries.
S.4.3 Customer loan-to-deposit ratios for euro area large
and complex banking groups
S.4.4 Ratio of short-term funding to loans for euro area
large and complex banking groups(2009 - Q3 2012; multiple; minimum, maximum and interquartile distribution) (2009 - Q3 2012; percentages; minimum, maximum and interquartile distribution)
0.0
0.5
1.0
1.5
2.0
2009 2011 Q3 11 Q1 12 Q3 122010 H1 12 Q4 11 Q2 12
0.0
0.5
1.0
1.5
2.0
all euro area domestic banks
0
10
20
30
40
50
60
70
80
90
2009 2011 Q3 11 Q1 12 Q3 122010 H1 12 Q4 11 Q2 12
0
10
20
30
40
50
60
70
80
90
all euro area domestic banks
Sources: Individual institutions’ reports, Bloomberg, ESCB and ECB calculations.Notes: Annual, semi-annual and quarterly data are based on common samples of 18,18 and 12 large and complex banking groups in the euro area respectively. Forpresentational reasons, a bank with an extreme value was excluded from the sample.Data for all euro area domestic banks are consolidated across borders and sectors,excluding insurers and non-financial corporations.
Sources: Individual institutions’ reports, Bloomberg, ESCB and ECB calculations.Notes: Interbank funding is used as the measure of short-term funding. Annual,semi-annual and quarterly data are based on common samples each consisting of 15, 18and 12 large and complex banking groups in the euro area respectively. Data for alleuro area domestic banks are consolidated across borders and sectors, excluding insurersand non-financial corporations.

S 12ECBFinancial Stability ReviewDecember 2012
S.4.5 Issuance profile of long-term debt securities for euro
area large and complex banking groups
S.4.6 Maturity profile of long-term debt securities for euro
area large and complex banking groups(Oct. 2011 - Apr. 2013; EUR billions) (2005 - Oct. 2012; EUR billions)
-60
-40
-20
0
20
40
60
Q4 Q1 Q2 Q3 Q4 Q12012
-60
-40
-20
0
20
40
60
corporate bonds medium-term notesasset-backed instruments net issuance
0
50
100
150
200
250
300
350
400
450
1 year 3 years 5 years 7 years 9 years2 years 4 years 6 years 8 years 10 years
0
50
100
150
200
250
300
350
400
450
average 2005-07 2008 20092010 2011 Oct. 2012
Sources: Dealogic DCM Analytics and ECB calculations.Notes: Net issuance is the total gross issuance minus scheduled redemptions. Dealogicdoes not trace instruments following their redemptions and therefore some of theseinstruments might have been redeemed early. Asset-backed instruments encompass asset-backed and mortgage-backed securities as well as covered bond instruments.
Sources: Dealogic DCM Analytics and ECB calculations.Notes: Data refer to all amounts outstanding at the end of the correspondingyear/month. Long-term debt securities include corporate bonds, medium-term notes, covered bonds, asset-backed securities and mortgage-backed securities with a minimum maturity of 12 months.
S.4.7 Lending and deposit margins of euro area MFIs
S.4.8 Syndicated loans and bonds issuance for euro area
banks(Jan. 2003 - Sep. 2012; percentage points) (Q1 2004 - Q3 2012; EUR billions)
-3
-2
-1
0
1
2
3
2003 2004 2005 2006 2007 2008 2009 2010 2011 2012-3
-2
-1
0
1
2
3
lending to householdslending to non-financial corporationsdeposits with agreed maturity by non-financial corporationsdeposits with agreed maturity by households
0
50
100
150
200
250
300
350
2004 2005 2006 2007 2008 2009 2010 2011 20120
50
100
150
200
250
300
350
bonds (excluding covered bonds, ABS/MBS)covered bondssyndicated loans granted to banksasset-backed securities (ABS)/mortgage-backed securites (MBS)
Sources: ECB, Thomson Reuters and ECB calculations.Notes: Lending margins are calculated as the average of the spreads for the relevantbreakdowns of new business loans, using volumes as weights. The individual spreadsare the difference between the MFI interest rate for new business loans and the swaprate with a maturity corresponding to the loan category’s initial period of rate fixation.For deposits with agreed maturity, margins are calculated as the average of the spreadsfor the relevant break-downs by maturity, using new business volumes as weights. The individual spreads are the difference between the swap rate and the MFI interest rateon new deposits, where both have corresponding maturities.
Sources: Dealogic DCM Analytics, Thomson Reuters and ECB calculations.

stat ist ical anneX
5. INTERLINKAGES
S 13ECB
Financial Stability ReviewDecember 2012
S.5.1 Payments settled by the large-value payment systems
TARGET2 and EURO1
S.5.2 Volumes and values of foreign exchange trades settled
via the Continuous Linked Settlement Bank(Jan. 2004 - Oct. 2012; volumes and values) (Jan. 2004 - Oct. 2012; volumes and values)
100
150
200
250
300
350
400
450
500
2004 2005 2006 2007 2008 2009 2010 2011 20120
500
1000
1500
2000
2500
3000
3500
volume EURO1 (thousands, left-hand scale)volume TARGET2 (thousands, left-hand scale)value EURO1 (billions, right-hand scale)value TARGET2 (billions, right-hand scale)
0
100
200
300
400
500
600
2004 2005 2006 2007 2008 2009 2010 2011 20120
500
1000
1500
2000
2500
volume of transactions (thousands, left-hand scale)value of transactions (billions equivalent, right-hand scale)
Source: ECB.Notes: TARGET2 is the real-time gross settlement system for the euro. TARGET2 isoperated in central bank money by the Eurosystem. TARGET2 is the biggest large-valuepayment system (LVPS) operating in euro. The EBA CLEARING Company’s EURO1is a euro-denominated net settlement system owned by private banks, which settles the final positions of its participants via TARGET2 at the end of the day. EURO1 is the second-biggest LVPS operating in euro.
Source: ECB.Notes: The Continuous Linked Settlement Bank (CLS) is a global financial marketinfrastructure which offers payment-versus-payment (PvP) settlement of foreignexchange (FX) transactions. Each PvP transaction consists in two legs. The figures abovecount only one leg per transaction. CLS transactions are estimated to cover about 60% ofthe global FX trading activity.
S.5.3 Value of securities held in custody by CSDs
and ICSDs
S.5.4 Value of securities settled by CSDs and ICSDs
(2011; EUR trillions; settlement in all currencies) (2011; EUR trillions; settlement in all currencies)
1
2
3
4
5
6
7
8
9
10
11
1 2 3 4 5 6 7 81
2
3
4
5
6
7
8
9
10
11
0
50
100
150
200
250
300
350
1 5 3 7 2 4 6 80
50
100
150
200
250
300
350
Source: ECB.Notes: CSDs stands for central securities depositaries and ICSDs for internationalcentral securities depositaries. 1 - Euroclear Bank (BE); 2 - Euroclear France;3 - Clearstream Banking Luxembourg-CBL; 4 - CRESTCo (UK); 5 - ClearstreamBanking Frankfurt - CBF (DE); 6 - Monte Titoli (IT); 7 - Iberclear (ES); 8 - Remaining 18 CSDs in the euro area.
Source: ECB.Note: See notes of Chart S.5.3.

S 14ECBFinancial Stability ReviewDecember 2012
S.5.5 Value of transactions cleared by central
counterparties
S.5.6 Interbank borrowing ratio for euro area large and
complex banking groups(2011; EUR trillions) (2009 - Q3 2012; percentage of total assets; minimum, maximum and interquartile
distribution)
0
100
200
300
1 2 3 4 5 60
100
200
300
0
5
10
15
20
25
2009 2011 Q3 11 Q1 12 Q3 122010 H1 12 Q4 11 Q2 12
0
5
10
15
20
25
Source: ECB.Notes: 1 - LCH.Clearnet Ltd (UK, 2009 data); 2 - EUREX Clearing AG (DE); 3 - LCHClearnet SA (FR); 4 - CC&G (IT); 5 - ICE Clear Europe (UK); - 6 Others.The chart includes outright and repo transactions, financial and commodity derivatives.
Sources: Individual institutions’ reports, Bloomberg and ECB calculations.Note: Annual, semi-annual and quarterly data are based on common samples of15, 17 and 12 large and complex banking groups in the euro area respectively.
S.5.7 Spreads between interbank rates and repo rates
S.5.8 Spreads between interbank rates and overnight
indexed swap rates(3 Jan. 2003 - 21 Nov 2012; basis points; 1-month maturity; 20-day moving average) (1 Jan. 2007 - 21 Nov 2012; basis points: 3-month maturity)
EURGBP
USDJPY
-50
0
50
100
150
200
250
300
2004 2006 2008 2010 2012 Aug Sep Oct Nov2012
-50
0
50
100
150
200
250
300
EURGBP
USDJPY
-50
0
50
100
150
200
250
300
350
400
2007 2008 2009 2010 2011 2012 Aug Sep Oct Nov2012
-50
0
50
100
150
200
250
300
350
400
Sources: Thomson Reuters, Bloomberg and ECB calculations. Sources: Thomson Reuters , Bloomberg and ECB calculations.

stat ist ical anneX
6 PROFITABILITY AND SOLVENCY OF KEY FINANCIAL INTERMEDIARIES
S 15ECB
Financial Stability ReviewDecember 2012
S.6.1 Return on shareholders' equity for euro area large
and complex banking groups
S.6.2 Return on risk-weighted assets for euro area large
and complex banking groups(2009 - Q3 2012; percentages; minimum, maximum and interquartile distribution) (2009 - Q3 2012; percentages; minimum, maximum and interquartile distribution)
-90
-80
-70
-60
-50
-40
-30
-20
-10
0
10
20
2009 2011 Q3 11 Q1 12 Q3 122010 H1 12 Q4 11 Q2 12
-90
-80
-70
-60
-50
-40
-30
-20
-10
0
10
20
-15
-12
-9
-6
-3
0
3
2009 2011 Q3 11 Q1 12 Q3 122010 H1 12 Q4 11 Q2 12
-15
-12
-9
-6
-3
0
3all euro area domestic banks
Sources: Individual institutions’ reports, Bloomberg and ECB calculations.Notes: Quarterly figures are annualised. Annual, semi-annual and quarterlydata are based on common samples of 17, 17 and 12 large and complex bankinggroups in the euro area respectively.
Sources: Individual institutions’ reports, Bloomberg, ESCB and ECB calculations.Notes: Quarterly figures are annualised. Annual, semi-annual and quarterly data arebased on common samples of 18, 16 and 14 large and complex banking groups in theeuro area respectively. Data for all euro area domestic banks are consolidated acrossborders and sectors, excluding insurers and non-financial corporations.
S.6.3 Breakdown of operating income for euro area large
and complex banking groups
S.6.4 Diversification of operating income for euro area large
and complex banking groups(2009 - Q3 2012; percentage of total assets; weighted average) (2009 - Q3 2012; individual institutions’ standard deviation dispersion)
-1.0
-0.5
0.0
0.5
1.0
1.5
2.0
2.5
3.0
2009 2011 Q3 11 Q1 12 Q3 122010 H1 12 Q4 11 Q2 12
-1.0
-0.5
0.0
0.5
1.0
1.5
2.0
2.5
3.0
loan loss provisions net interest incomenet fee and commission income net trading incomenet other operating income
0
5
10
15
20
25
30
35
40
45
2009 2011 Q3 11 Q1 12 Q3 122010 H1 12 Q4 11 Q2 12
0
5
10
15
20
25
30
35
40
45
Sources: Individual institutions’ reports, Bloomberg and ECB calculations.Note: Quarterly results are annualised. Annual, semi-annual and quarterlyindicators are based on common samples of 18, 18 and 14 large and complexbanking groups in the euro area respectively.
Sources: Individual institutions’ reports, Bloomberg, and ECB calculations.Notes: A value of "0" means full diversification, while a value of "50" meansconcentration on one source only. Annual, semi-annual and quarterly indicatorsare based on common samples of 15, 13 and 10 large and complex banking groups in the euro area respectively.

S 16ECBFinancial Stability ReviewDecember 2012
S.6.5 Net loan impairment charges for euro area large
and complex banking groups
S.6.6 Earnings per share and earnings per share forecasts
for large and complex banking groups in the euro area(2009 - Q3 2012; percentage of net interest income; minimum, maximum and interquartile (Q2 2004 - Q3 2013; EUR)distribution)
-20
0
20
40
60
80
100
120
140
2009 2011 Q3 11 Q1 12 Q3 122010 H1 12 Q4 11 Q2 12
-20
0
20
40
60
80
100
120
140
-8
-6
-4
-2
0
2
4
2004 2005 2006 2007 2008 2009 2010 2011 2012 2013-8
-6
-4
-2
0
2
4
median
Sources: Individual institutions’ reports, Bloomberg and ECB calculations.Notes: Annual, semi-annual and quarterly data are based on common samplesof 16, 15 and 10 large and complex banking groups in the euro area respectively.For presentational issues a bank with an extreme value was excluded from the sample.
Sources: Bloomberg and ECB calculations.Notes: The hatched/shaded areas indicate the minimum-maximum and interquartileranges accross earnings per shares of selected large and complex banking groups inthe euro area.
S.6.7 Total capital ratio for euro area large and complex
banking groups
S.6.8 Tier 1 capital ratio for euro area large and complex
banking groups(2009 - Q3 2012; percentages; minimum, maximum and interquartile distribution) (2009 - Q3 2012; percentages; minimum, maximum and interquartile distribution)
8
10
12
14
16
18
20
2009 2011 Q3 11 Q1 12 Q3 122010 H1 12 Q4 11 Q2 12
8
10
12
14
16
18
20all euro area domestic banks
6
8
10
12
14
16
18
2009 2011 Q3 11 Q1 12 Q3 122010 H1 12 Q4 11 Q2 12
6
8
10
12
14
16
18all euro area domestic banks
Sources: Individual institutions’ reports, Bloomberg, ESCB and ECB calculations.Notes: Annual, semi-annual and quarterly data are based on common samples of 16,15 and 12 large and complex banking groups in the euro area respectively. Data forall euro area domestic banks are consolidated across borders and sectors, excludinginsurers and non-financial corporations.
Sources: Individual institutions’ reports, Bloomberg, ESCB and ECBcalculations.Notes: Annual, semi-annual and quarterly data are based on common samplesof 18, 18 and 14 large and complex banking groups in the euro area respectively.Data for all euro area domestic banks are consolidated across borders andsectors, excluding insurers and non-financial corporations.

stat ist ical anneX
S 17ECB
Financial Stability ReviewDecember 2012
S.6.9 Tier 1 capital ratio components' contribution to ratio
changes for euro area large and complex banking groups
S.6.10 Net non-performing loan ratios for euro area
domestic banks(2009 - Q3 2012; percentages) (2009 - H1 2012; percentage of total own funds for solvency purposes; minimum,
maximum and interquartile distribution)
-0.2
0.0
0.2
0.4
0.6
0.8
1.0
1.2
1.4
1.6
- - - - - - - - -
2009 2011 Q3 11 Q1 12 Q3 122010 H1 12 Q4 11 Q2 12
-2
0
2
4
6
8
10
12
14
16
risk-weighted assets (left-hand scale)Tier 1 capital (left-hand scale)
- Tier 1 ratio (mean; right-hand scale)
-150
-100
-50
0
50
100
150
2009 2010 2011 H1 2012-150
-100
-50
0
50
100
150
Sources: Individual institutions’ reports, Bloomberg and ECB calculations.Notes: Annual, semi-annual and quarterly data are based on common samplesof 18, 18 and 14 large and complex banking groups in the euro area respectively.
Source: ESCB.Notes: All euro area domestic banks consolidated across borders and sectors, excludinginsurers and non-financial corporations. Data refers to net total doubtful and non-performing loans (net of provisions). The dispersion of ratios is across euro areacountries.
S.6.11 Leverage ratio for euro area large and complex
banking groups
S.6.12 Risk-adjusted leverage ratio for euro area large and
complex banking groups(2009 - Q3 2012; multiple; minimum, maximum and interquartile distribution) (2009 - Q3 2012; multiple; minimum, maximum and interquartile distribution)
10
20
30
40
50
60
2009 2011 Q3 11 Q1 12 Q3 122010 H1 12 Q4 11 Q2 12
10
20
30
40
50
60
4
6
8
10
12
14
16
2009 2011 Q3 11 Q1 12 Q3 122010 H1 12 Q4 11 Q2 12
4
6
8
10
12
14
16all euro area domestic banks
Sources: Individual institutions’ reports, Bloomberg and ECB calculations. Notes: Leverage is defined as the ratio of total assets to shareholders’ equity.Annual, semi-annual and quarterly data are based on common samples of 17, 17 and12 large and complex banking groups in the euro area respectively.
Sources: Individual institutions’ reports, Bloomberg, ESCB and ECB calculations.Notes: Risk-adjusted leverage is defined as the ratio of risk-weighted assets toshareholders’ equity. Annual, semi-annual and quarterly data are based on commonsamples of 17, 15 and 12 large and complex banking groups in the euro area respectively.Data for all euro area domestic banks are consolidated across borders and sectors, excluding insurers and non-financial corporations.

S 18ECBFinancial Stability ReviewDecember 2012
S.6.13 Distance to default for large and complex banking
groups
S.6.14 Investment income and return on equity for a sample
of large euro area insurers(Jan. 2002 - Oct. 2012; weighted average) (2009 - Q3 2012; percentages; minimum, maximum and interquartile distribution)
0
2
4
6
8
10
12
2002 2003 2004 2005 2006 2007 2008 2009 2010 2011 20120
2
4
6
8
10
12
euro areaglobal
0
1
2
3
4
5
6
7
8
2009 2011 Q3 12 2010 Q2 122010 Q2 12 2009 2011 Q3 12
-60
-50
-40
-30
-20
-10
0
10
20
30
Investment income(percentage of total assets)
Return onshareholders equity (percentages)
Sources: Moody’s KMV and ECB calculations.Notes: An increase in the distance to default reflects an improving assessment.The weighted average is based on the amounts of non-equity liabilities.
Sources: Bloomberg, individual institutions’ reports, and ECB calculations.Note: Based on available figures for 20 euro area insurers and 4 euro area reinsurers.
S.6.15 Gross-premium-written growth for a sample of large
euro area insurers
S.6.16 Distribution of combined ratios for a sample of large
euro area insurers(2007 - Q3 2012; percentage change per annum; minimum, maximum and interquartile (2007 - Q3 2012; percentages; minimum, maximum and interquantile distribution)distribution)
-40
-20
0
20
40
60
80
2007 2009 2011 Q2 122008 2010 Q1 12 Q3 12
-40
-20
0
20
40
60
80
80
85
90
95
100
105
110
115
2007 2009 2011 Q2 122008 2010 Q1 12 Q3 12
80
85
90
95
100
105
110
115
Sources: Bloomberg, individual institutions’ reports and ECB calculations.Notes: Based on available figures for 20 euro area insurers and 4 euro area reinsurers.
Sources: Bloomberg, individual institutions’ reports and ECB calculations.Notes: Based on available figures for 20 euro area insurers and 4 euro area reinsurers.

stat ist ical anneX
S 19ECB
Financial Stability ReviewDecember 2012
S.6.17 Capital distribution for a sample of large euro area
insurers
S.6.18 Investment distribution for a sample of large euro
area insurers(2007 - Q3 2012; percentage of total assets; minimum, maximum and interquartile (H1 2011 - H1 2012; percentage of total investments; minimum, maximum anddistribution) interquartile distribution)
0
10
20
30
40
50
2007 2009 2011 Q2 122008 2010 Q1 12 Q3 12
0
10
20
30
40
50
0
5
10
15
20
25
30
35
40
45
50
55
H1 11 H1 12 H2 11 H1 11 H1 12 H2 11 H1 11 H1 12H2 11 H1 11 H1 12 H2 11 H1 11 H1 12 H2 11
0
5
10
15
20
25
30
35
40
45
50
55Government
bondsCorporate
bondsStructured
creditEquity Commercial
property
Sources: Bloomberg, individual institutions’ reports and ECB calculations.Notes: Capital is the sum of borrowings, preferred equity, minority interests,policyholders’ equity and total common equity. Data are based on available figures for 20 euro area insurers and 4 euro area reinsurers.
Sources: Individual institutions’ financial reports and ECB calculations.Notes: Equity exposure data exclude investments in mutual funds. Data are basedon available figures for 14 euro area insurers and reinsurers.
S.6.19 Credit default swap spreads for euro area large and
complex banking groups
S.6.20 Credit default swap spreads for a sample of large
euro area insurers(3 Jan. 2007 - 21 Nov 2012; basis points; senior debt; five-year maturity) (3 Jan. 2007 - 21 Nov 2012; basis points; senior debt; five-year maturity)
median
0
200
400
600
800
1000
2007 2008 2009 2010 2011 2012 Aug Sep Oct Nov2012
0
200
400
600
800
1000
median
0
100
200
300
400
500
600
700
2007 2008 2009 2010 2011 2012 Aug Sep Oct Nov2012
0
100
200
300
400
500
600
700
Sources: Thomson Reuters, Bloomberg and ECB calculations.Note: The hatched/shaded areas indicate the minimum-maximum and interquartile ranges across the CDS spreads of selected large banks.
Sources: Thomson Reuters, Bloomberg and ECB calculations.Note: The hatched/shaded areas indicate the minimum-maximum and interquartile ranges across the CDS spreads of selected large insurers.

S 20ECBFinancial Stability ReviewDecember 2012
S.6.21 Stock performance for euro area large and complex
banking groups
S.6.22 Stock performance for a sample of large euro area
insurers(3 Jan. 2007 - 21 Nov 2012 ; index: 2 Jan. 2007 = 100) (3 Jan. 2007 - 21 Nov 2012 ; index: 2 Jan. 2007 = 100)
median
0
20
40
60
80
100
120
140
2007 2008 2009 2010 2011 2012 Aug Sep Oct Nov2012
0
20
40
60
80
100
120
140
median
0
20
40
60
80
100
120
140
160
180
2007 2008 2009 2010 2011 2012 Aug Sep Oct Nov2012
0
20
40
60
80
100
120
140
160
180
Sources: Thomson Reuters , Bloomberg and ECB calculations.Note: The hatched/shaded areas indicate the minimum-maximum and interquartileranges across equities of selected large banks.
Sources: Thomson Reuters , Bloomberg and ECB calculations.Note: The hatched/shaded areas indicate the minimum-maximum and interquartileranges across equities of selected large insurers.

F INANC IAL STAB I L I TY REV IEW DECEMBER 2012
EURO
PEAN
CEN
TRAL
BAN
K
FIN
ANCI
AL S
TABI
LITY
REV
IEW
D
ECEM
BER
2012
This is the last issue we are sending you. For cost and environmental reasons, we kindly ask you to obtain your copy of future Financial Stability Reviews online, at: www.ecb.europa.eu/pub/fsr
Should you wish to continue to receive a hard copy, please register at: www.ecb.europa.eu/FSR
YOUR SUBSCRIPTION