financial stability review - bnm
TRANSCRIPT

Second Half
2020
Financial Stability Review

Preface
This Financial Stability Review – Second Half 2020 provides Bank Negara Malaysia’s assessment on current and potential risks to financial stability and the resilience of the Malaysian financial system to sustain its financial intermediation role in the economy. It also reports on any actions that have been taken to manage risks to financial stability and contains box article(s) on topics of special interest.
This publication is intended to promote greater awareness on issues and developments affecting financial stability.
This document uses data available up to 31 December 2020, unless otherwise stated.
The Financial Stability Review - Second Half 2020 is available in Portable Document Format (PDF) at www.bnm.gov.my

Contents
Key Highlights
Overview
Coping with COVID-19: Key Developments in the Second Half of 2020
7 Market Risk 10 Credit Risk 25 Operational Risk
Financial Institution Soundness and Resilience
29 The Banking Sector41 The Insurance and Takaful Sector44 Assessing the Resilience of Financial Institutions
Annex

Key Highlights onFinancial Stability Review – Second Half 2020 Banks remain well-positioned to support economic recovery despite challenging credit risk outlook
Insurance and takaful operators (ITOs) continue to remain well-capitalised amid a recovery in businessactivities in the second half of the year
Financial intermediation remained supportive of the economy amid sustained orderly market conditions
Healthy liquidity positions supportedby stable funding conditions
Total provisions to total loans(Jun '20: 1.4%)
Credit risk to rise, but buffered byhigher provisions
Growth in total provisions (Jun '20: 9%)
Liquidity Coverage Ratio (Jun '20: 149%) 148%
Net Stable Funding Ratio¹(in force since 1 July 2020)²116%
Share of Stage 2 loans(Jun '20: 8.4%)
14.8%Common Equity
Tier 1 capital ratio(Jun '20: 14.6%)
10%
40.6%
1.7%
¹ Replaces the loan-to-fund (LTF) and loan-to-fund-and-equity (LTFE) ratios as a measure of banks’ funding profile² Minimum requirement of 80% and banks are expected to comply with minimum NSFR of 100% by 30 September 2021³ Loans/financing extended by banks and non-bank financial institutions. For businesses, figures include outstanding non-financial corporate bonds/sukuk. For SMEs, figures partly reflect the exercise by financial institutions to reclassify selected SMEs to non-SMEs in 2018 and 2019 Source: Bank Negara Malaysia
2H '19 1H '20 2H '20
Financial market stress receded from levels seen at the onsetof the pandemic with orderly market conditions preserved
220%(Jun '20: 227%)
RM36billion (Jun '20: RM37 billion)
Capital adequacy ratio
Excess capital buffers
-7.1%
9.2%
2.8%
ITOs maintained healthy capital buffers, well above regulatory minimum
Investment-linked and motor segments drove recovery in premium growth…
-2.9%
Life/Family: New businesspremium growth
General: Gross directpremium growth
…while impact from COVID-19 support measures and floodshas been manageable
Cumulative amount of premium deferred and on holiday as a percentage of
premium in force7.7%
3.2%Estimated gross claims from flood events as a percentage
of 2020 operating profits
RM126.7billion
Excess capitalbuffers
(Jun '20: RM122 billion)
Total capital ratio(Jun '20: 18.3%)18.5%
9.2% Return on equity(Jun '20: 10%)
18.4%
2.8%
Financing conditions remained conducive for economicgrowth, supported by various policy measures
Lower financing costs following OPR reductions in 2020
Various measures supporting financing activitiesincluding SST exemption, Home Ownership Campaign,guarantee schemes, BNM funds
%
Annual Growth ofFinancing Activities³
1H '20 2H '202H '19
107.9% Loan loss coverage ratio(Jun '20: 95.4%)
0
5
10
15
20
25
30
35
2018 2019 2020 2021
Financial Market Stress Index
Stress level, %
Financial institutions’ active riskmanagement and hedging strategieshave mitigated impact fromheightened market volatility
-4.9%
9.6%
-13.1%SMEs
5.5%4.0%
Households5.5%
2.6%Businesses 3.2%
3.4%
Strong financial buffers despite lower earnings

SMEs
Outlook for certain business segments remains challenging amid an uneven recoveryOverall financials sustained despite weaker earnings performance
Business Sector Indicators5
Firms-at-risk6 remained elevated with more businesses in COVID-19-affected sectors seeking repayment assistance
Share of Firms-at-risk to Total Listed Corporates
31.8%
(2Q '20: 32.9%; 5-year average: 21.7%) (% of total business loans)
Business Loans UnderRepayment Assistance
Share of R&R Loans for Selected Sectors7
Latest stress tests affirm resilience of financial system to simulated shocks under more severe economic conditions
Post-shock, banking and insurance sectors maintain capital levels well above regulatory minimum
Banking System Total Capital Ratio (%)
Insurance SectorCapital Adequacy Ratio9 (%)
Minimum requirement: 8
Minimum requirement: 130
Post-shock under Adverse Scenario 22020
Banks’ losses largely attributed to higher credit costs, while insurers’ losses driven by market risk, assumed reinsurance defaults and higher claims
4 Exclude credit cards5 Data as at 3Q 2020. Prudent thresholds of cash-to-short-term debt ratio and interest coverage ratio are one time and two times, respectively6 Defined as listed non-financial corporates with interest coverage ratio below the prudent threshold of two times7 Refers to percentage of loan exposures to the sector that have undergone rescheduling and restructuring (R&R) 8 The economic scenarios do not represent the Bank’s actual expectations for the economic trajectory but rather, have been developed specifically for stress test purpose. These scenarios are not likely to materialise 9 Includes both life and general insurers10 Largely driven by an increase in claims liability due to assumed higher claims ratio
Source: Bank Negara Malaysia and S&P Capital IQ
ProfitabilityOperating margin
Debt-to-equity ratio
(2Q '20: 5%)
(2Q '20: 24.2%)
4.7%
23.4%
Liquidity
Debt-servicing capacity
Cash-to-short-term debt ratio
Interest coverage ratio (2Q '20: 3.9 times)
(2Q '20: 1 time)1.1 times
4.1 times
9.7%By account By value
17%52.8%
Hotels and restaurants
Wholesale and retail trade
14.8%
Real estate 24.5%
Transport and storage
17.8%
18.5 218
16.8173
Banks’ Cumulative Credit Losses Drivers under Adverse Scenario 2
Insurers’ Key Loss Drivers under Adverse Scenario 2
Households Non-SMEs
Life Insurers
General Insurers
from increase in liabilities52%
from higher claims and insurance capital charges10
54%
from assumed reinsurance default42%
Leverage
Two hypothetical⁸ adverse scenarios are developed, with the horizon extended until the end of 2022
Adverse Scenario 2
• GDP remains negative in 2021 and below pre-pandemic levels throughout 2022
• Unemployment rate increases further and remains elevated
• Weaker commodity prices in 2021 and 2022 • Lower house price growth in 2021 and 2022, exacerbated
by weaker income growth, rising foreclosures and oversupply conditions
Debt-servicing capacity of most households has been sustained, supported by existing financial buffersand relief measures
2.2times
Financial assets-to-debt(Jun '20: 2.2 times)
Aggregate financial buffers are broadly intact
93%
Total Loan Repayments⁴ in 2H '20
of total loanrepayments
in 2H '19
Reached
1.5times
Liquid financial assets-to-debt(Jun '20: 1.4 times)
Household Financial Assets Indicators
Most households resumed loan repayments after automaticmoratorium ended…
… with support measures helping households that are morefinancially-stretched
Government support measures including direct cashtransfers, EPF withdrawals and reduction in employees’EPF contributions
8.9% of household loan accounts are under repayment assistance(11.1% by value) Note: Prudent threshold is one time for both indicators
48%38%
15%
Note: Figures may not add up dueto rounding


Overview
1Financial Stability REViEW - SEcOnD HalF 2020
Overview

Overview
2 Financial Stability REViEW - SEcOnD HalF 2020

3Financial Stability REViEW - SEcOnD HalF 2020
Overview
The COVID-19 pandemic continued to present significant challenges to global economic activity in the second half of 2020, although prospects for a firmer recovery in the global economy have improved in recent months. While the rapid roll-out of fiscal and monetary policy responses on an unprecedented scale helped to avert a deeper economic downturn, risks to financial stability remain elevated. Global financial conditions remain susceptible to bouts of heightened volatility, despite having eased significantly since March 2020. Credit risk remains a key risk for the global financial system going forward, as policymakers weigh the trade-off between sustaining short-term support and averting medium-term macro-financial stability risks.
Domestically, significant efforts to strengthen the resilience of the Malaysian financial system over the years have afforded banks the capacity to help households and businesses through this difficult period by deferring loan repayments. Despite the unprecedented scale of debt assistance provided, banks have also continued to extend new financing in an environment of heightened credit risks. So far, this underlying strength of banks is enabling them to play an important countercyclical role to support the economy, both in the initial and subsequent recovery phases of this crisis. Insurers and takaful operators, backed by healthy financial buffers, have also been able to extend financial relief to affected policyholders to preserve their coverage. In the domestic financial markets, conditions stabilised over the second half of 2020, amid a reversal of non-resident bond outflows, a sharp increase in retail investor participation in the equity market, and sustained demand by domestic institutional investors.
While the second half of 2020 saw some improvements in the operating environment for businesses, recovery has remained uneven across different business sectors. Improvements observed
were mainly in sectors that have returned to near-full operational capacity such as manufacturing. Meanwhile, companies in more severely affected industries such as hotels and restaurants have experienced further depletion of their financial buffers amid a persistent decline in revenue. Small and medium enterprises (SMEs), in particular, were significantly affected given more limited financial buffers and narrower profit margins. Repayment assistance, along with support measures introduced by the Government and the Bank, have helped businesses to sustain financing repayments and contained any notable increase in defaults. While defaults are expected to rise from current levels, loan repayment data suggests that most firms are able to service their debt as business activities resume. The easing of containment measures, vaccine roll-out and more targeted policy support going forward are expected to further support debt-servicing capacity and mitigate any material increase in defaults.
For households, financial asset growth continued to outpace that of debt, indicating that in aggregate, households have managed to increase their financial wealth during this period. Nonetheless, lower-income segments remain stretched financially. These borrowers are likely to face continued challenges in 2021 given an uneven recovery in the labour market. Similar to businesses, repayment assistance programmes and support measures are helping to ease cashflows of financially-stretched households. However, a sustained recovery in income will be key to maintain their debt-servicing capacity over the longer term. Outside this segment of household borrowers, most households are in reasonably good shape, with repayment levels by households in the banking system reaching over 90 percent of levels seen prior to the automatic moratorium.
In the Malaysian property market, housing market activity saw a slight rebound in the third quarter

Overview
4 Financial Stability REViEW - SEcOnD HalF 2020
of the year amid the low interest rate environment and ongoing measures to support demand. Average housing transaction values rose for a second consecutive quarter, lending support to house prices. Softer market conditions have also prompted supply shifts towards more affordable housing segments, a welcome adjustment in reducing the demand-supply mismatches weighing on housing affordability. This also helps to mitigate risks of future disorderly price corrections. The non-residential property segment, however, continued to face considerable challenges. The hotel segment remains severely affected by travel restrictions, while the recovery in footfall in shopping malls also faced headwinds from lingering concerns over the resurgence of COVID-19. Some businesses have started downsizing office space amid the prevalence of flexible working arrangements, weighing on occupancy and rental growth of office space. Taken together, risks of potential losses to financial institutions from prospects of weaker debt-servicing ability and valuations in the non-residential property market are judged to have increased due to COVID-19. Nonetheless, banks have built up adequate provisions against potential credit losses, which are expected to remain manageable given the low and declining share of bank exposures to segments of the property market exhibiting higher risks.
Overall credit costs of banks remained at an elevated level as banks continued to build up provisions in anticipation of higher credit losses. The various measures introduced since the onset of the crisis, including repayment assistance programmes by banks, targeted financing schemes and government relief programmes, have helped to stave off more severe scarring effects on the economy and the subsequent spillovers to the financial system. Nonetheless, banks face considerable challenges in assessing loan performance, in part due to reduced visibility around
the debt-servicing capacity of borrowers, particularly those that remain under loan moratoriums.
While downward pressure on earnings is likely to persist going into 2021, the impact is expected to be less severe than in 2020 partly owing to the front-loading of provisions by banks. Improvements in the domestic and global economy, coupled with continued support measures and the operational capacity of banks to engage and assist borrowers in distress, will further help sustain debt serviceability and support bank earnings. In the insurance and takaful sector, the impact of temporary relief measures and recent floods on the profitability of insurers and takaful operators has also remained limited to date. Going forward, the low interest rate environment will continue to pose challenges for life insurers and family takaful operators, while general insurers may face prospects of rising reinsurance costs following pandemic-related and natural catastrophe losses.
Overall, the financial system remains in a strong position to continue supporting the economic recovery, with strong capitalisation levels to absorb any potential losses and ample liquidity to facilitate financial intermediation activity. The Bank’s updated stress tests affirm the resilience of the financial system, with the banking system and insurance sector expected to maintain capital ratios above the regulatory minimum even under simulated scenarios of significantly weaker economic conditions. Financial institutions also remain operationally resilient and will continue to take steps to further strengthen their crisis response arrangements in light of operational challenges presented by the pandemic. This in turn will provide greater assurance of their ability to maintain critical operations and increase the speed with which financial institutions are able to adapt to changing operating conditions going forward.

Coping with COVID-19: Key Developments in the Second Half of 2020
5FINANCIAL STABILITY REVIEW - SECOND HALF 2020
Coping with COVID-19: Key Developments in the
Second Half of 2020
7 Market Risk 10 Credit Risk 25 Operational Risk

Coping with COVID-19: Key Developments in the Second Half of 2020
6 FINANCIAL STABILITY REVIEW - SECOND HALF 2020
7FINANCIAL STABILITY REVIEW - SECOND HALF 2020
MARKET RISK
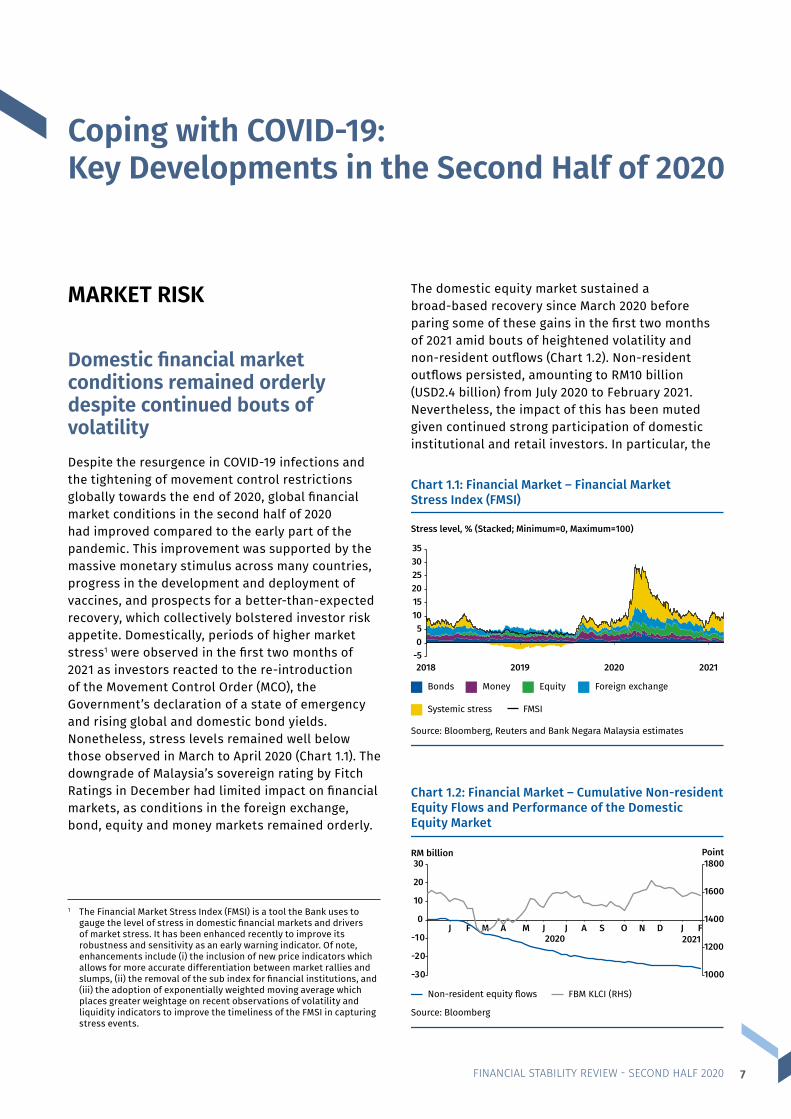
Domestic financial market conditions remained orderly despite continued bouts of volatility Despite the resurgence in COVID-19 infections and the tightening of movement control restrictions globally towards the end of 2020, global financial market conditions in the second half of 2020 had improved compared to the early part of the pandemic. This improvement was supported by the massive monetary stimulus across many countries, progress in the development and deployment of vaccines, and prospects for a better-than-expected recovery, which collectively bolstered investor risk appetite. Domestically, periods of higher market stress1 were observed in the first two months of 2021 as investors reacted to the re-introduction of the Movement Control Order (MCO), the Government’s declaration of a state of emergency and rising global and domestic bond yields. Nonetheless, stress levels remained well below those observed in March to April 2020 (Chart 1.1). The downgrade of Malaysia’s sovereign rating by Fitch Ratings in December had limited impact on financial markets, as conditions in the foreign exchange, bond, equity and money markets remained orderly.
The domestic equity market sustained a broad-based recovery since March 2020 before paring some of these gains in the first two months of 2021 amid bouts of heightened volatility and non-resident outflows (Chart 1.2). Non-resident outflows persisted, amounting to RM10 billion (USD2.4 billion) from July 2020 to February 2021. Nevertheless, the impact of this has been muted given continued strong participation of domestic institutional and retail investors. In particular, the
1 The Financial Market Stress Index (FMSI) is a tool the Bank uses to gauge the level of stress in domestic financial markets and drivers of market stress. It has been enhanced recently to improve its robustness and sensitivity as an early warning indicator. Of note, enhancements include (i) the inclusion of new price indicators which allows for more accurate differentiation between market rallies and slumps, (ii) the removal of the sub index for financial institutions, and (iii) the adoption of exponentially weighted moving average which places greater weightage on recent observations of volatility and liquidity indicators to improve the timeliness of the FMSI in capturing stress events.
Chart 1.1: Financial Market – Financial MarketStress Index (FMSI)
-505
101520253035
2018 2019 2020 2021
Bonds Money Equity Foreign exchange
Systemic stress FMSI
Stress level, % (Stacked; Minimum=0, Maximum=100)
Source: Bloomberg, Reuters and Bank Negara Malaysia estimates
Chart 1.2: Financial Market – Cumulative Non-residentEquity Flows and Performance of the DomesticEquity Market
Source: Bloomberg
Non-resident equity flows FBM KLCI (RHS)
1000
1200
1400
1600
1800
-30
-20
-10
0
10
20
30
J F M A M J J A S O N D J F
RM billion
2020 2021
Point
Coping with COVID-19:Key Developments in the Second Half of 2020

Coping with COVID-19: Key Developments in the Second Half of 2020
8 FINANCIAL STABILITY REVIEW - SECOND HALF 2020
participation of retail investors in the domestic equity market has risen significantly to account for 37% of total value traded in February 2021 (2020: 34%; 3-year average: 19%), exceeding that of domestic institutional investors (February 2021: 27%; 2020: 30%; 3-year average: 41%). With interest rates at a historical low level, retail investor activity is expected to be sustained in the near term as investors seek higher returns. Risks to banks from this activity, however, is assessed to be limited given that it is not driven by borrowings. Further, household loans to purchase quoted shares remain small at 0.5% of total banking system loans (5-year average: 0.5%), with borrowers largely coming from the higher-income group who typically have larger financial buffers to withstand potential price shocks. Loans to stockbroking and fund management firms also remain negligible at 0.05% of total banking system loans. Domestic institutional investors continued to provide countercyclical support during periods of outflows in the second half of 2020 as some entities increased net equity purchases to take advantage of the market correction after the retail investor-driven rally subsided temporarily.
The bond market recorded increased net non-resident inflows amid improving risk sentiment
The domestic bond market recorded net non-resident inflows amounting to RM33.5 billion (USD8.1 billion) in the July 2020 to February 2021 period (Chart 1.3), amid improved risk sentiment on emerging markets
and expectations of prolonged low interest rates in advanced economies. The share of non-resident holdings in the government bond market increased from 21% in April 2020 to 24.7% as at end-February 2021 (5-year average: 26%). Notwithstanding higher non-resident purchases, yields on 10-year Malaysian Government Securities (MGS) increased by 44 basis points (bps) to 3.09% as at end-February 2021 (end-December 2020: 2.65%), following higher expected government bond issuances in 2021 and rising US Treasury (UST) yields. The persistent increase in UST yields in the first two months of 2021 was mainly driven by expectations of higher growth and inflation amidst support from additional stimulus and the vaccine roll-out. This subsequently led to a steepening of government bond yield curves globally, including for the MGS where spreads between 3- and 10-year MGS yields increased to about 100 bps (5-year average: 55 bps). Despite this increase, the MGS-UST yield differential narrowed due to larger increases in UST yields (Chart 1.4). In the corporate bond market, credit spreads for 10-year AAA-rated papers normalised to around 57 bps (average between July 2020 and February 2021) after a temporary rise to 105 bps in April 2020. Coupled with actions by firms to shore up liquidity, the more favourable fund raising conditions have led to a recovery in gross corporate bond issuances, which amounted to RM65.5 billion in the second half of 2020 (1H 2020: RM38.6 billion).
The higher government bond supply in 2021 and persistent increase in UST yields could place upward pressure on domestic bond yields, thus increasing risks of mark-to-market losses and raising costs of
Chart 1.3: Financial Market – Cumulative Non-resident Bond Flows and Performance of the DomesticBond Market
Non-resident bond flows 10-year MGS yields (RHS)
RM billion %
Source: Bank Negara Malaysia and Bloomberg
0
1
2
3
4
-30
-20
-10
0
10
20
30
J F M A M J J A S O N D J F2020 2021
50
100
150
200
250
300Basis point
2019 average
Chart 1.4: Financial Market – 10-year MGS-USTYield Differential
0J F M A M J J A S O N D J F
Source: Bloomberg
2020 2021
Coping with COVID-19: Key Developments in the Second Half of 2020
9FINANCIAL STABILITY REVIEW - SECOND HALF 2020
funding for financial institutions, businesses and the Government. Given the active risk management and hedging strategies of financial institutions, any impact from heightened market volatility is expected to remain at manageable levels and will not pose a threat to the resilience of individual institutions. The higher yield environment is also not expected to have any significant impact on banks’ cost of funds given their low reliance on market-based funding instruments (19.3% of total banking system funding). Further, Malaysia’s deep and liquid market and diverse investor base are expected to alleviate some of the pressure on bond yields and preserve orderly market conditions, thus providing continued support to market confidence
and financial intermediation. Amid improved risk sentiment, MGS remain relatively attractive and continue to offer positive real yields and total returns to investors. This is expected to sustain overall demand for government bonds and mitigate the impact on yields from the anticipated diversion of some liquidity held by domestic institutional investors to support government relief measures.
Going forward, domestic factors, such as the management of the pandemic and political developments, will continue to weigh significantly on investor sentiment and portfolio allocations as economic recovery progresses amid the globalroll-out of vaccines.

FINANCIAL STABILITY REVIEW - SECOND HALF 202010
CREDIT RISK
Overall business sector remains resilient despite operational disruptions, but several sectors face challenging outlookThe second half of 2020 saw some recovery in the operating environment for businesses, as movement restrictions gradually eased in most parts of the country. Compared to the halt in economic activity across most business sectors in the first half of 2020, the containment measures implemented in the second half were less restrictive and more targeted. The recovery nevertheless has been uneven across different business sectors. There have been sustained improvements in the manufacturing sector. Consumer-related sectors such as wholesale and retail trade, and hotels and restaurants, which accounted for 7.5% of total banking system loans, benefitted from relaxations in domestic movement restrictions in the second half of 2020, but experienced a relatively slower recovery amid continued weakness in consumer sentiment. Business closures and retrenchments in tourism-related industries2 increased, as some firms in these segments incurred heavy losses and faced prospects of prolonged weakness in demand. Exposures in these industries remained small at 2.5% of total banking system loans. In the oil and gas sector,3 while oil prices have increased amid continued volatility in oil demand, a full recovery of the sector’s activity to pre-pandemic levels remains dependent on the pace of global economic recovery.
The financial performance of businesses4 has been affected by these developments, compelling many to undertake operational and financial adjustments. Amid declining profitability, listed corporates responded to cashflow stresses by reducing expenses and increasing holdings of liquid buffers,
with the median cash-to-short-term debt ratio (CASTD)5 rising to 1.1 times (2Q 2020: 1 time). There was also some deleveraging observed among firms, notably in the manufacturing and most services sub-sectors. As a result, the median interest coverage ratio (ICR)6 improved to 4.1 times (2Q 2020: 3.9 times) (Chart 1.5). The share of firms-at-risk7 moderated slightly to 31.8% of listed corporates, but remains at an elevated level (2Q 2020: 32.9%; 5-year average: 21.7%). These improvements, however, masked the uneven impact of the crisis on different business sectors. Companies in more severely hit industries have seen financial buffers depleting amid sharp contractions in revenue. In the hotels and restaurants segment8 for example, the median CASTD and ICR have declined significantly since the onset of the crisis, to 0.5 times and 0.3 times (4Q 2019: 0.7 times and 2.5 times), respectively. Companies in these sectors, and those entering the crisis from a highly leveraged position are more likely to face defaults and insolvencies if economic conditions remain weaker for longer (refer to the Information Box on ‘Debt Resolution Mechanisms for Viable Businesses Facing Temporary Financial Distress’).
2 The tourism-related sector includes companies in the following services sectors: airlines, land transport, hotels and restaurants, entertainment and theme parks, medical tourism, and travel agents.
3 Accounted for 0.3% of total banking system loans.4 The assessment on financial performance of listed corporates
is as at the end of third quarter of 2020. On 17 February 2021, the Securities Commission Malaysia and Bursa Malaysia Berhad announced additional temporary relief measures, including an automatic one-month extension to issue quarterly and annual reports for companies in the Main and ACE Markets, as well as semi-annual and annual audited financial statements for companies in the LEAP Market, which were initially due on 28 February, 31 March, and
30 April 2021, respectively.
5 Prudent threshold for CASTD is one time. 6 Prudent threshold for ICR is two times.7 Firms-at-risk are defined as listed non-financial corporates with ICR
below the prudent threshold of two times.8 Accounted for 1.1% of total banking system loans.
Chart 1.5: Business Sector – Key FinancialPerformance Indicators
25.5 24.223.4
5.7 5.0 4.7
4.8
3.94.1
1.0 1.0 1.1
0
3
6
0
15
30
4Q 2019 2Q 2020 3Q 2020
Times%
Debt-to-equity ratio Operating margin
Interest coverage ratio(ICR) (RHS)
Note: Prudent thresholds for ICR and CASTD are two times and one time, respectively
Source: S&P Capital IQ and Bank Negara Malaysia estimates
Cash-to-short-term debt ratio(CASTD) (RHS)

Coping with COVID-19: Key Developments in the Second Half of 2020
11FINANCIAL STABILITY REVIEW - SECOND HALF 2020
9 Refers to both loans and financing, unless otherwise stated.
While the impact of the health crisis has been felt across the business sector, small and medium enterprises (SMEs) were disproportionately impacted given their limited financial buffers and generally narrower profit margins. Surveys conducted throughout 2020 revealed that SMEs were less optimistic on survival prospects for their businesses through a prolonged pandemic, and were more constrained in their ability to re-engineer their businesses compared to larger firms (due to pre-existing limitations in financial and human capital and slower adoption of new technologies). Banks and development financial institutions have continued to provide repayment assistance to SMEs to weather protracted challenges in the economic environment. This was further augmented by the considerable support from the Government and the Bank, including targeted financing facilities and funds to alleviate cashflow constraints as well as facilitate capital investments in automation and digitalisation. Together with the gradual resumption of economic activities in the second half of 2020, these measures helped SMEs sustain financing repayments, with aggregate repayments by SMEs on existing and new loans returning to near pre-pandemic levels by the end of the automatic loan moratorium in September 2020. Additional relief measures introduced in the 2021 Budget, and PERMAI and PEMERKASA assistance packages are also expected to provide further support to SMEs going forward.
Business loan9 growth moderated in the second half of 2020 (0.9%; 1H 2020: 3.9%) as firms remained cautious of increasing their leverage amid the uneven recovery in business conditions. Banks also remained somewhat cautious in meeting demand for new credit in some borrower segments amid an uncertain macroeconomic outlook and lower visibility on debt-servicing capacity due to loan deferment programmes. In contrast, net non-financial corporate bond issuances have risen compared to the first half of 2020, as stronger large corporates took advantage of cheaper funding rates following successive Overnight Policy Rate (OPR) cuts to refinance debt and build cash buffers. Non-financial corporate sector external debt increased by 5.1%, driven by additional borrowings by manufacturers in the renewable energy and electrical and electronics (E&E) sectors, which remain relatively insulated from operational disruptions posed by the
reinstatement of movement restrictions in the second half of 2020. Among SMEs, which collectively account for 15.8% of total banking system loans, demand for financing remained relatively firm, with close to 162,000 loan applications received by banks in the second half of 2020 compared to an average of 123,500 in the same period between 2017 and 2019. However, amounts borrowed by SMEs were notably lower, with the average size of new working capital loan applications among SMEs up to 40% lower than prior to the onset of the pandemic. Overall, non-financial corporate debt-to-GDP ratio rose to 110%, attributable mainly to the weaker GDP in 2020 (Chart 1.6).
Chart 1.6: Business Sector – Non-financial Corporate Debt-to-GDP Ratio and Aggregate Debt AnnualGrowth Rate
0
20
40
60
80
100
120
Dec '19 Jun '20 Dec '20
% of GDP
99.4110.0108.1[1.0%] [3.8%] [3.7%]
Domestic loans / financing Domestic corporate bonds / sukuk
External debt
[...%] refers to aggregate non-financial corporate debt annualgrowth rate
Source: Bank Negara Malaysia
To assist businesses through this challenging period, financing support remains available to eligible and viable businesses through schemes such as the Danajamin PRIHATIN Guarantee Scheme (DPGS), and credit guarantees by Credit Guarantee Corporation Malaysia Berhad (CGC) and Syarikat Jaminan Pembiayaan Perniagaan Berhad (SJPP). The Bank has also allocated funds to manage the impact on industries hardest hit by the containment measures, via the PENJANA Tourism Financing (PTF) and Targeted Relief and Recovery Facility (TRRF), as well as to facilitate innovation and capital investments through the High Tech Facility – National Investment Aspirations (HTF-NIA). These funds, along with the Special Relief Facility which was allocated in the first half of the year, have augmented bank credit flows to businesses in an environment of higher risk aversion (refer to the Information Box on ‘Insights from Surveys on Credit Conditions’).

Coping with COVID-19: Key Developments in the Second Half of 2020
FINANCIAL STABILITY REVIEW - SECOND HALF 202012
Chart 1.7: Business Sector – Gross Impaired Loans
Source: Bank Negara Malaysia
2.6
2.4
2.0
2.5
3.0
J F M A M J J A S O N D
Ratio (%)
Overall business: Gross impaired loans
SME: Gross impaired loans
2020Risks from selected business sectors remain elevated, but banks are well-buffered to withstand potential credit losses
of December 2020). This indicates that the majority of borrowers are able to keep up with their loan repayments as their businesses recover. While the bulk of firms benefitting from repayment assistance are SMEs (accounting for 90% of total loan accounts approved for rescheduling and restructuring (R&R)), a sizeable share of non-SMEs operating within COVID-19-affected sectors have also sought R&R to manage their obligations. In value terms, total business loans under repayment assistance accounted for 17% of total business loans (Chart 1.8).
Chart 1.8: Business Sector – Share of R&R Loans by Sector
Source: Bank Negara Malaysia
6.6
7.8
9.8
9.9
13.7
14.5
14.8
17.2
17.8
24.5
29.6
52.8
17.0
0 10 20 30 40 50 60
Mining and quarrying
Electricity and gas
Information and communication
Others
Water supply and sewerage
Manufacturing
Wholesale and retail trade
Construction
Transport and storage
Real estate
Primary agriculture
Hotels and restaurants
Overall businesses
% of bank loans to the sector
10 Over 90% of outstanding rated bonds are rated AA and above, signalling strong ability to service payments on a timely basis.
11 Classified as Stage 2 loans under the Malaysian Financial Reporting Standard 9 (MFRS 9).
The repayment assistance extended by banks has so far contained any notable increase in defaults, with the overall business loan impairment ratio at 2.6% (Chart 1.7). Downgrades in domestically-rated corporate bonds and sukuk were also limited (2020: 7; 2019: 7), reflecting the relatively stronger financials10 of corporates that tap the domestic bond market.
However, leading indicators from banks are pointing to expectations of continued weakness in business conditions in the period ahead. The share of business loans with increased credit risks11 reported by banks increased further as at December 2020 (15.7%; June 2020: 14.1%) particularly for firms in sectors highly exposed to the pandemic. Businesses under repayment assistance plans have also increased, driven by SMEs after the end of the automatic loan moratorium, although the share of total business loan accounts remained modest (9.7% as

Coping with COVID-19: Key Developments in the Second Half of 2020
13FINANCIAL STABILITY REVIEW - SECOND HALF 2020
The resurgence of COVID-19 cases in early 2021 has temporarily set some businesses back, with firms in certain sectors revising earlier expectations of an improvement in operating conditions in 2021. While the outlook for these sectors is expected to remain highly challenging, the recent easing of containment measures, vaccine roll-out, and continued repayment assistance support from banks are expected to temper any material
increase in risky loans. Improvements in the global and domestic economy should further support debt-servicing capacity, amid more targeted policy support going forward. Banks remain well-buffered against an expected increase in credit losses from the business sector, supported by pre-emptive provisions built up in 2020 (refer to the Chapter on ‘Financial Institution Soundness and Resilience’ for further details).
Insights from Surveys on Credit ConditionsThis information box examines the credit conditions for businesses in 2020 and the outlook for 2021 amid rising credit risks and higher loan losses experienced by banks. It draws detailed insights from supply-12 and demand-side13 surveys conducted by the Bank in the fourth quarter of 2020.
Banks’ capacity to lend remains sound, but risk appetite turned cautious
In aggregate, preliminary lending targets for 2021 across banks suggest that the banking system will be more than able to support credit demand consistent with the projected GDP growth. This is underpinned by the ability of banks to lend, given strong capital, funding and liquidity buffers. However, heightened credit risks and rising impairments and other related costs are increasing risk aversion and could affect specific lending decisions by banks. Given the highly uncertain economic outlook and its dependency on the progress of vaccinations and evolution of the virus, banks are taking a more cautious approach in meeting demand for new credit. Heightened repayment risks and an uncertain macroeconomic outlook remain key factors that could weigh on credit conditions in 2021. Banks surveyed indicated that credit conditions could tighten a little more for corporate borrowers, while conditions are expected to ease for SMEs in the first half of 2021 compared to conditions in 2020 (Chart 1.9). This mainly reflects the larger loan sizes and typically unsecured nature of larger corporate loans. Conversely, SME loans are generally smaller in size, secured by collateral and continue to receive material support from various government measures.
The more cautious bank risk appetite was also consistent with businesses’ perception of financing conditions. Following the partial resumption of economic activity in May 2020 after movement restrictions were eased, businesses indicated an improvement in their demand for bank financing, but had lower perceived availability of bank financing. This resulted in a larger financing gap14 observed over the past six months. Smaller businesses were the most affected by this financing gap. Approximately 32% of SMEs indicated that the financing gap deteriorated. Larger businesses fared better, with 82% reporting either an unchanged or a decreased financing gap (Chart 1.10). Despite the greater tightening indicated by banks for non-SMEs, the more favourable credit conditions perceived by non-SMEs could be due to their more established relationship with banks, allowing for more bespoke negotiations for loans. Larger businesses can also rely on more diverse sources of financing such as capital markets and internal funds. Taken together, non-SMEs may therefore have lower perceived constraints when it comes to the availability of financing.
12 The Credit Conditions Survey to Banks (4Q 2020) surveyed 17 banks, comprising domestic banking groups, locally-incorporated foreign banks and development financial institutions.
13 The BNM Survey on Firms’ Access to Financing 2020 surveyed around 2,000 businesses comprising micro, small, medium and large businesses.14 The change in financing gap is defined as the difference between the change in firms’ demand for, and the change in perceived availability of bank
financing. An increase in financing gap would be represented by an increase in the demand for bank financing and/or a decrease in the perceived availability of bank financing.

Coping with COVID-19: Key Developments in the Second Half of 2020
FINANCIAL STABILITY REVIEW - SECOND HALF 202014
Consistent with higher concerns over repayment risks, supply of credit is likely to be more forthcoming for working capital financing which have shorter tenures compared to financing for investments and capital expenditure (Chart 1.11). This is generally aligned with the financing needs of businesses surveyed, which also indicated greater demand for working capital compared to capital expenditure financing over the first six months of 2021 (Chart 1.12). Looking further ahead, a pick-up in demand for investment financing is expected. Banks have the capacity to meet this demand growth, which would be more rooted in the improving strength and pace of economic recovery.
Chart 1.10: Firms’ Demand for Bank Financing vs Perceived Availability for Bank Financing, 2H 2020
Source: BNM Survey on Firms’ Access to Financing 2020
7
13
16
10
11
19
15
15
10
5
7
2
2
1
3
1
0 20 40 60 80 100
Non-SMEs
Medium
Small
Micro
% of respondents
Increased
Note: Chart represents the difference between individual respondents’ responses to their demand for bank financing and the perceived availability of bank financing in the last 6 months of 2020 on a scale of ‘Decreased’, ‘Unchanged’ and ‘Increased’. An increase in financing gap would be represented by an increase in the demand for bank financing and/or a decrease in the perceived availability of bank financing
Decreased somewhat DecreasedIncreased somewhat No change
72
60
62
70
Chart 1.9: Banks’ Expectations for Changes in Credit Supply Conditions by Size of Firms
Compared to 2019
Compared to 2019
0.0 0.1 0.2 0.3 0.4 0.5 0.6 0.7
SMEs
Corporates
Note: Weighted responses of banks surveyed. Scores are derived on a net basis, i.e. two banks with the same degree of easing and tightening will offset each other based on their share of loans. Scale: Ease significantly (-2); Ease somewhat (-1); Neutral (0); Tighten somewhat (+1); Tighten significantly (+2)
Source: Credit Conditions Survey to Banks (4Q 2020)
Tightening
Tightening to intensify inthe next 6 months
Less tightening for the next 6 months
Expectations for 1H 2021
Expectations for 1H 2021

Coping with COVID-19: Key Developments in the Second Half of 2020
15FINANCIAL STABILITY REVIEW - SECOND HALF 2020
The cumulative reductions of 125 bps of the OPR in 2020 have also reduced banks’ internal hurdle rates15 and helped stabilise financing rates. However, stiff competition for customers over the years have led to aggressive pricing and narrowing profitability. While banks generally maintain effective lending rates that are above hurdle rates, a significant increase in loan losses may erode profit buffers and affect the pricing for and supply of credit, especially to higher-risk segments.
In the nearer term, non-price tightening measures were expected to be more pervasive among the surveyed banks. These include tighter credit scoring criteria, more stringent collateral requirements, imposition of loan covenants and maximum loan size limits. More extensive background checks and more proactive actions, such as the use of alternative information sources, as well as more frequent engagements were also conducted with business borrowers to better assess their financial and operating conditions. These measures do not appear to have materially increased difficulties for borrowers, with 88% of businesses reporting either positive or neutral feedback on bank processes (Chart 1.13). Positive experiences were generally linked to process improvements that alleviated hardship and practical difficulties faced by borrowers during the MCO, which had helped expedite credit approvals and disbursements despite the challenging operating conditions.16 These process improvements include the increasing use of online processes and template financing to facilitate guarantor approvals, the conduct of virtual site visits and flexibilities on certain conditions precedent for loan disbursements.
Chart 1.11: Banks’ Expectations for Changes in Credit Supply Conditions by Financing Purpose
Compared to 2019
0.0 0.1 0.2 0.3 0.4 0.5 0.6
Workingcapital
Investmentpurpose
Corporates
SMEs
Note: Weighted responses of banks surveyed. Scores are derived on a net basis, i.e. two banks with the same degree of easing and tightening will offset each other based on their share of loans. Scale: Ease significantly (-2); Ease somewhat (-1); Neutral (0); Tighten somewhat (+1); Tighten significantly (+2)
Source: Credit Conditions Survey to Banks (4Q 2020)
Tightening
Expectations for 1H 2021
Compared to 2019
Workingcapital
Investmentpurpose Expectations for 1H 2021
15 Hurdle rate refers to the risk-adjusted breakeven point in pricing where banks’ income from giving out a loan is sufficient to cover expected credit losses, associated funding costs and overhead costs.
16 Corroborated by the Credit Conditions Survey to Banks (4Q 2020).
Chart 1.12: Firms’ Expectations for Changes in Demand for Financing by Financing Purpose
40
3336 35
45
31
42
3437
32
-10-13 -12 -10 -9
-13 -12-15
-8-14
-20
-10
0
10
20
30
40
50Outlook in the next 6-12 months*, % of respondents
Source: BNM Survey on Firms’ Access to Financing 2020
Overall Micro Small Medium Non-SMEs
Working capital Capital expenditure
DecreaseIncrease
* Respondents were asked on their expected demand for working capital and capital expenditure financing in the next 6-12 months on a scale of ‘Decrease’, ‘Unchanged’ and ‘Increase’. Respondents who responded ‘Unchanged’ or ‘Not applicable’ were not included in this chart. The net figure (in dots) is the difference between the percentage of respondents who responded with ‘Increase’ and ‘Decrease’ for each financing allocation category

Coping with COVID-19: Key Developments in the Second Half of 2020
FINANCIAL STABILITY REVIEW - SECOND HALF 202016
Measures introduced to address risks to financial stability
Adjustments observed to the risk appetite of banks are expected and prudent given the current environment. However, excessive risk aversion may also pose risks to financial stability. Policy responses during this crisis have therefore been aimed at supporting credit flows to the economy, in particular for viable borrowers and segments that are more likely to be disproportionately impacted by more cautious bank lending behaviour. The series of policy measures introduced has and will continue to lend support to intermediation activities in the current environment of heightened credit risks. First, financing conditions have remained conducive on the back of continued accommodative monetary policy. Second, Targeted Repayment Assistance programmes with flexible repayment options continue to be made available to borrowers who need them. Third, the extension of regulatory flexibilities serves to expand the financial and operational capacity of banks to support existing and new borrowers. Fourth, the various financing facilities under BNM’s Fund for SMEs, and the credit guarantee schemes for both SMEs and corporates have supported the continued flow of credit to viable businesses amid higher credit risk aversion.
Having entered this crisis with strong capital and liquidity positions, the banking industry continues to be well-placed to facilitate credit flows to the economy. Micro lending decisions by banks can, however, produce asymmetric outcomes on businesses affected by the pandemic. As the economic recovery becomes more entrenched, the effects are expected to dissipate and easing in credit conditions will become broader-based.
Chart 1.13: Firms' Opinion on Banking Processes
Banks’ speed in disbursement of funds
Conditions to fulfil before disbursement of funds
Banks’ speed in approving the financing
Simplicity / efficiency of application process
Overall experience
Satisfied Neutral Dissatisfied
Source: BNM Survey on Firms’ Access to Financing 2020
% of respondents
43
27
40
39
43
11
6
18
16
12

Coping with COVID-19: Key Developments in the Second Half of 2020
17FINANCIAL STABILITY REVIEW - SECOND HALF 2020
Debt Resolution Mechanisms for Viable Businesses Facing Temporary Financial Distress A strong debt resolution framework remains vital to mitigate an insolvency cliff and provide critical support to distressed but viable firms. During periods of crisis, large numbers of such firms could precipitate widespread premature bankruptcy proceedings and hamper economic recovery. Drawing upon experience from the Asian Financial Crisis (AFC), Malaysia has in place well-established out-of-court debt restructuring mechanisms for different business segments. Coupled with court-sanctioned corporate rescue mechanisms, businesses can avail themselves of different platforms that facilitate efficient and effective debt workouts with creditors. These mechanisms collectively aim to:
• Assistbalancesheetandcashflowrestorationandaverttheprematurefailureofviableborrowers;• Improvethespeedandvalueofdebtrecovery;and• Mitigatepotentiallossestofinancialinstitutionswhichcouldadverselyaffecteconomicgrowthand
recovery prospects.
The significant impact of COVID-19 on many businesses underscores the important role of these mechanisms which are being further strengthened to enhance their efficacy.
Court-sanctioned Corporate Rescue Mechanisms
Viable businesses that are facing difficulties in servicing their debt obligations can avail themselves of three different court-sanctioned rescue mechanisms under the Companies Act 2016 (CA 2016). The CA 2016 introduced two new rescue mechanisms, namely the Corporate Voluntary Arrangement (CVA) and Judicial Management (JM), in addition to the Scheme of Arrangement (SOA) which has been a widely used rehabilitative tool for businesses (Table 1.1). More recently, the Companies Commission of Malaysia had issued a consultative document on the Companies (Amendment) Bill 2020, which will widen the coverage of firms that will benefit from these rescue mechanisms while embedding sufficient safeguards17 against potential abuse. This would be complemented by ongoing efforts to enhance the capacity of the court system in Malaysia to support the effective implementation of these mechanisms. In 2020, the take-up for court-sanctioned rescue mechanisms already registered a notable increase (2020: 53; 2019: 30)18 as more borrowers sought redress, particularly given lingering uncertainties surrounding the pandemic.
Out-of-court Rescue Mechanisms
The Bank has established two out-of-court debt resolution platforms, namely the Corporate Debt Restructuring Committee (CDRC) and Small Debt Resolution Scheme (SDRS) (Diagram 1.1), which help businesses restructure debt without resorting to lengthy, costly and complex legal proceedings. The out-of-court mechanisms provide greater flexibility in terms of the scope, size and focus of debt workouts to take into account prevailing conditions. In crisis, this can include the ability to adapt processes and resources more quickly to mitigate systemic risks posed by distressed firms. They also help avoid overwhelming the court system, especially during a crisis. These out-of-court platforms, coupled with the increased capacity of banks to manage debt workouts since the AFC, have enabled successful debt restructuring plans for SMEs and corporates.
17 These safeguards include codifying provisions to, among others, empower the Court to grant automatic moratorium on SOA, allow super priority for rescue financing, introduce cross-class cramdown mechanism and restrain disposition of properties during moratorium.
18 Up to December 2020 (Source: Companies Commission of Malaysia).

Coping with COVID-19: Key Developments in the Second Half of 2020
FINANCIAL STABILITY REVIEW - SECOND HALF 202018
Table 1.1: Court-sanctioned Corporate Rescue Mechanisms
Corporate VoluntaryArrangement Judicial Management Scheme of Arrangement
Establishmentdate 2016 2016 1965
Process
• Restructuring is management-driven with minimal court involvement
• An insolvency practitioner, who may be nominated by the board of directors of the company, will assess the viability of the scheme
• The management power of a company will be placed under a court-appointed judicial manager who will prepare a restructuring scheme and manage the borrower’s company affairs and property
• A court-approved arrangement is made between the company and creditors
• Upon fi ling of the application, the court may appoint a liquidator to assess the viability of the scheme proposed for the arrangement
Moratorium
• Upon lodgement of documents to the court, an automatic moratorium of up to 28 days, which is extendable to a maximum of 60 days, is given
• Upon fi ling of the application, automatic moratorium will be in force for a period of 6 months and, with the approval of the court, may be extended for a further 6 months
• Upon application, the court may grant a restraining order for an initial period of 3 months, which may be renewed for a period of up to a further 9 months subject to fulfi lment of its pre-statutory requirements
Applicationeligibility
• Excludes:▪ Public companies▪ Private companies with
secured creditors▪ Licensees under the
Financial Services Act 2013 (FSA 2013), Islamic Financial Services Act 2013 (IFSA 2013) and Capital Market and Services Act 2007 (CMSA 2007)
• Excludes:▪ Public companies▪ Licensees under
the FSA 2013, IFSA 2013 and CMSA 2007
• For all companies
Courtsupervision
Minimal (for lodgement of corporate voluntary arrangement
documents only)
Minimal (for granting of judicial management order only) Yes
Source: Companies Act 2016

Coping with COVID-19: Key Developments in the Second Half of 2020
19FINANCIAL STABILITY REVIEW - SECOND HALF 2020
Diagram 1.1: Corporate Debt Restructuring Committee and Small Debt Resolution Scheme
Source: Corporate Debt Restructuring Committee and Credit Counselling and Debt Management Agency
¹ All commercial banks, Islamic banks, and development financial institutions as prescribed under the Development Financial Institution Act 2002
Corporate Debt Restructuring Committee(CDRC)
CDRC was first established in 1998 to facilitate debt workouts during the AFC. It was reactivated in 2009 as an out-of-court platform for viable corporations and their creditors to work out feasible and holistic solutions to resolve debt obligations (i.e. bank borrowings and/or debt securities). Drawing upon the experiences of the London Approach in the United Kingdom, CDRC is guided by principles that ensure the fair treatment of borrowers, while maximising value for financial creditors.
SDRS was established in 2003 as a platform for financial institutions and viable SMEs to work out debt rehabilitation solutions without resorting to legal recourse, allowing SMEs to focus on plans to revive their business.
CDRC assists in managing debt workouts of firms that meet the following criteria:
i. Aggregate indebtedness of RM10 million or more; ii. Debt is owed to at least two financial creditors; iii. Not in receivership or liquidation, except for those where receivers have been appointed only over certain specified assets and the directors remain in control over the companies’ overall operations; andiv. Experiencing difficulties in servicing their debt obligations but have not defaulted, provided they meet criteria (i) & (ii).
CDRC has assisted 38 firms to resolve RM14.1 billion in aggregate debt since 2009.
Small Debt Resolution Scheme(SDRS)
SDRS supports debt workouts for SMEs that meet the following criteria: i. SME has business-related financing from
participating financial institutions;1 ii. Business owner/shareholder(s)/guarantor(s) is
not bankrupt; and iii. Business is not under advanced legal action i.e.
winding-up order obtained, company wound-up, receivers and managers have been appointed/ in receivership, judicial manager has been appointed under judicial management.
In addition, businesses that have ceased operations would also be eligible to apply for SDRS, provided the business owner has other income sources to meet repayment obligations. SDRS has facilitated debt workouts for more than 1,300 SMEs with total debt amounting to RM2 billion since 2003.
19 The minimum threshold for aggregate debt was revised from RM100 million to RM30 million in 2010, and subsequently reduced to RM10 million in 2017. The minimum threshold for the number of financial creditors to whom debt is owed was revised from three to two financial creditors in 2010.
Since CDRC’s reactivation in 2009, its admission criteria19 have been refined several times to help more firms. Meanwhile, SDRS was absorbed into the Credit Counselling and Debt Management Agency (Agensi Kaunseling dan Pengurusan Kredit, AKPK) in September 2020 to foster greater synergy, expand its footprint through AKPK’s established online channels and create a one-stop platform that provides holistic debt restructuring as well as financial education and advisory services for individuals and SMEs, including micro entrepreneurs. These changes enable CDRC and SDRS to effectively support the potential increase in firms requiring restructuring assistance, thereby mitigating economic scarring and broader risks to financial stability.
The overall household sector has remained resilient throughout the crisis, but some segments are experiencing increased financial stress
The growth in household debt20 normalised to pre-COVID-19 levels in the second half of 2020 as the country emerged from stringent movement control restrictions (Chart 1.14). Growth was mainly driven by car and housing loans, which expanded by 6.1% and 7.4% (June 2020: -0.7% and 7.2%), respectively, lifted
by the strong response to the sales and service tax (SST)21 incentives for the purchase of cars and various home ownership incentives. Personal financing also registered higher annual growth of 7.1% (June 2020: 4.4%), partly due to the suspension of repayments during the automatic loan moratorium period. On aggregate, the household debt-to-GDP ratio rose to 93.3% mainly due to GDP remaining below pre-crisis levels (Chart 1.15). A concern over high household debt is that it may lead to a rapid deleveraging by households in the aftermath of a crisis, thus dampening or derailing economic recovery. There has not been significant evidence of this, with new banking system disbursements to households
21 Effective 15 June 2020 until 30 June 2021.20 Extended by both banks and non-bank financial institutions.

Coping with COVID-19: Key Developments in the Second Half of 2020
FINANCIAL STABILITY REVIEW - SECOND HALF 202020
Repayment assistance programmes by banks and government relief measures continued to provide support to households in distress, easing their cashflow constraints as they recover from income shocks and staving off more severe damage to both the financial system and the economy. The ability of banks to offer assistance to households at this unprecedented scale is enabled by their prudent build-up of buffers during good times. Following the end of the automatic moratorium on loan repayments, banks continue to offer more targeted assistance to those in need. As at December 2020, household loans covered under a repayment assistance plan25 amounted to 8.9% of total household loan accounts, or 11.1% of total outstanding household loan exposures. Of these accounts, 59% were under a loan moratorium, of which 54% were made up by borrowers earning less than RM5,000 monthly (Diagram 1.2). While repayment assistance is helping to temporarily support the debt-servicing capacity of borrowers, a recovery in income alongside a more entrenched resumption of economic activities will be key for financially-stretched borrowers to maintain their debt-servicing capacity over the longer term.
Repayment assistance continues to provide support to household borrowers impacted by the pandemic
With Targeted Repayment Assistance measures that have remained in place, household impairments and delinquencies in the banking system only marginally increased after the end of the blanket auto-moratorium (Chart 1.19). Banks have continued to actively engage borrowers, particularly those in the lower-income groups and in more-affected employment sectors, such as hotels, restaurants, transportation, and construction, to provide repayment assistance aligned with borrowers’ financial circumstances. Notwithstanding this, the share of household loans in Stage 2 has increased to 7.3% (June 2020: 5.6%), reflecting increased credit risks among household borrowers. Household asset quality is still expected to see some deterioration throughout 2021, but the credit losses materialising are projected to be within banks’ buffers.
22 Excludes credit cards. This statistic compares total disbursements in the second half of 2020 to total disbursements in the second half of 2019.
23 Excludes credit cards. 24 Measured as a ratio of outstanding debt to annual income.
reaching 112% of their corresponding levels in the same period last year.22 These disbursements have been mainly extended to middle- and high-income borrowers (71%) who can still afford to take on more loans. Among lower-income borrowers, measures over the years to encourage more responsible borrowing behaviour have partly mitigated more adverse impacts on their finances. Lending continued to be underpinned by sound underwriting standards, with stable overall median debt service ratios (DSR) for outstanding and newly-approved loans of 35% and 43%, respectively.
Recent shocks underscore the importance of households accumulating financial buffers during good times. These buffers allow households to tide over periods of economic displacement, thereby alleviating the impact to consumption and debt serviceability. For the vast majority of household borrowers, financial buffers remain broadly intact. Financial asset growth continued to outpace that of debt, driven by sustained deposit growth and a recovery in unit trust and equity holdings (Chart 1.16). This indicates that in aggregate, households have still managed to grow their financial wealth during this period. Consistent with these trends, in the second half of 2020, repayments by households in the banking system have reached 93% of levels observed in the corresponding period of the previous year,23 indicating most have resumed repayments.
However, as highlighted by the Bank in past publications, those earning less than RM3,000 monthly remain stretched financially, with low financial buffers and substantially higher leverage24 (Chart 1.17). Borrowers earning less than RM5,000 monthly (Chart 1.18) also appear to be showing some signs of financial stress as observed from the profile of households seeking repayment assistance. These borrowers are likely to face continued challenges in 2021 given an uneven recovery in the labour market. However, banks remain resilient against risks from the household sector, even under scenarios of assumed higher unemployment and underemployment affecting more household borrowers (refer to the Chapter on ‘Financial Institution Soundness and Resilience’ for a more detailed outlook).
25 Either in the form of a loan repayment moratorium or reduced instalment terms. Figures are based on repayment assistance applications that were approved by banks and subsequently accepted by customers.

Coping with COVID-19: Key Developments in the Second Half of 2020
21FINANCIAL STABILITY REVIEW - SECOND HALF 2020
Source: Bank Negara Malaysia, Bursa Malaysia Berhad, Department of Statistics, Malaysia, Employees Provident Fund and Securities Commission Malaysia
Unit trust funds
Chart 1.16: Household Sector – Annual Growth of Financial Assets
Annual growth: Liquid financial assets (LFA) (%)
Annual growth: Financial assets (%)
Deposits
Equity holdings
EPF contributions
Insurance policies (surrender value)
5.16.7 6.5
4.7
7.3
3.0
5.4 5.3
2.7
7.2
-2
0
2
4
6
8
Dec '18 Jun '19 Dec '19 Jun '20 Dec '20
Percentage point
Chart 1.14: Household Sector – Annual Growth of Debt
Dec '18 Jun '19 Dec '19 Jun '20 Dec '20
4.7 5.3 5.5
4.0
5.5
-1
0
1
2
3
4
5
6
7
Percentage point
Residential properties
Motor vehicles
Non-residential properties
Others
Credit cards
SecuritiesPersonal financing
Annual growth: Debt (%)
Chart 1.18: Household Sector – Debt by Monthly Income Group
28.4 17.9 17.8
23.3
20.4 20.1
20.8 29.0 29.5
27.5 32.7 32.6
0
20
40
60
80
100
Dec '13 Jun '20 Dec '20
<3
% of household debt
3-5 5-10 >10
Monthly income (RM'000)
Chart 1.15: Household Sector – Key Ratios
Financial assets-to-GDP
Debt-to-GDP: Banking system
Debt-to-GDP: Total
82.0 82.3 82.9
87.5 (previous
peak)
93.3 (new
peak)
175.7 177.6 179.3 190.2
205.3
68.0 67.8 68.2 71.8 76.5
0
50
100
150
200
250
% of GDP
Dec '19Jun '19 Dec '20Jun '20Dec '18
Monthly income (RM'000)
Leverage ratio: Jun 2020 Leverage ratio: Dec 2020
LFA-to-debt ratio
Chart 1.17: Household Sector – Leverage and LFA-to-Debt Ratios
Times
9.5
5.54.0
7.1
10.0
5.64.1
7.4
0.7 1.4 1.5 1.0
0
4
8
12
<3 3 - 5 5 - 10 <5
Chart 1.19: Household Sector – Loan Impairment and Delinquency Ratios in the Banking System
1.0 1.0 1.0 0.9
1.1
1.2 1.2 1.1
0.9 1.0
0.0
0.2
0.4
0.6
0.8
1.0
1.2
1.4
Dec '18 Jun '19 Dec '19 Jun '20 Dec '20
Loan impairment Loan delinquency
Ratio (%)

Coping with COVID-19: Key Developments in the Second Half of 2020
FINANCIAL STABILITY REVIEW - SECOND HALF 202022
Risks in the property market remained elevated
Activity in the housing market rebounded after hitting a historical low in the second quarter of 2020 (Chart 1.20). Transaction volumes grew at a pace comparable to the average quarterly growth seen before the COVID-19 pandemic. This reflected the positive response to measures introduced by the Government to support demand such as the Home Ownership Campaign and stamp duty exemptions. The low interest rate environment also encouraged purchases for both own occupancy and investment purposes. Demand for financing correspondingly rose in line with market activity, with housing loan application growth picking up across most price segments except for houses priced below RM300,000 (Chart 1.21). Meanwhile, average transaction values recorded a second consecutive quarter of positive annual growth as market activity was more concentrated in the mid- to higher-priced segments, mainly in the secondary market, where buyers are more likely to be those whose incomes have been less affected by the pandemic. This continued to
support the growth in average house prices, as measured by the Malaysian House Price Index (MHPI), although prices increased at a more moderate pace during the third quarter of 2020.
Unsold houses remain at an elevated level, driven by serviced apartments, small office home office (SOHO) units, and houses priced above RM500,000 in less popular locations. Softer housing market conditions are prompting developers to adjust supply towards more affordable housing segments. While overall launches declined significantly across all price segments in the first three quarters of 2020 (24,853 units; 1Q-3Q 2019: 60,955), the decline has been notably sharper for properties priced above RM500,000. As a result, the share of newly-launched properties in this segment fell to 20.5% of overall new launches (1Q-3Q 2019: 31.8%). This is a welcomed adjustment and will help reduce demand-supply mismatches that had worsened housing affordability and increased risks of price corrections in the past. These adjustments also do not appear to have induced a more broad-based decline in house prices in the secondary market, with average transaction prices continuing to rise, as noted earlier, owing to firm demand.
Diagram 1.2: Household Sector ‒ Profile of Accounts Under Loan Moratorium
Extended to borrowersearning less than RM5,000per month
54%
630,550 accounts(5.2% of total household loan accounts)
For loans to purchase carsand houses as well aspersonal financing
Of housing loans werefor affordable houses(<RM300,000)
84%
52%
Extended to borrowersearning more than RM5,000per month
60%
RM61.7 billion(5.3% of total household loans)
For loans to purchasehouses and cars
Of housing loans werefor houses pricedabove RM300,000
81%
79%
Outstandingamount
Number ofaccounts
Source: Bank Negara Malaysia
Note: Loan moratorium extended by commercial and Islamic banks as well as major development financial institutions

Coping with COVID-19: Key Developments in the Second Half of 2020
23FINANCIAL STABILITY REVIEW - SECOND HALF 2020
Among household borrowers, household investors26 in the property market are more likely to be influenced by price declines, given their relatively higher incentive to default should they fall into a negative equity position and experience a loss of rental income. Household investors account for about one-fifth of overall banking system loans, but largely comprise higher-income earners (those earning above RM5,000 per month) who typically have stronger debt-servicing capacity. Risks to banks remain well-contained, with the current impairment ratio and share of borrowers in negative equity for household investors at only 0.9% and 1.3%, respectively. The average loan-to-value ratio of outstanding housing loans remained below 60%, substantially mitigating the risk of more borrowers falling into negative equity as well as limiting the potential losses to banks.
The non-residential property segment continued to face considerable challenges. Average hotel occupancies have improved from the all-time low of 11% during the MCO, but remained well below pre-COVID-19 occupancy levels (Chart 1.22), as interstate travel restrictions were reinstated in October 2020 for some states. The outlook for the hospitality industry remains highly dependent on the stringency and duration of interstate and international border restrictions. Restrictions on international travel could take some time to ease despite the roll-out of vaccination programmes globally. Market conditions for hotels are likely to remain modest throughout 2021 amid intense competition for a smaller pool of travellers, higher operational costs due to the imposition of standard operating procedures, and slow recovery in travel demand.
Shopping malls have fared a little better, with some recovery in footfalls especially towards the end of 2020. However, some of the shifts observed in consumer behaviour towards online purchases are likely to persist and will continue to partly weigh on demand for retail space amid pre-existing excess supply. Similarly, some businesses have also begun downsizing office space and sub-leasing unused space as work from home arrangements remain largely in place. Vacancy rates and market rentals
in these segments have deteriorated further (Chart 1.22 and Chart 1.23), with some landlords already reducing their asking rents by up to 15%.27 Adjustments to incoming supply of office and retail space were also observed as some developers deferred the completion date of their projects. So far, the deferred projects have had only a limited impact on overall supply of office and retail space as they account for a relatively small share (12.5% and 9%, respectively) of incoming supply. The planned incoming supply of office and retail space in the Klang Valley over at least the next three years remains large, equivalent to 23% and 58% of the existing stock, respectively. Amid the prevailing oversupply and challenging business conditions, rental and occupancy rates for office and retail space are expected to remain depressed in the period ahead. Taken together, risks of potential losses to financial institutions from prospects of weaker debt-servicing ability and valuations as a result of depressed conditions in the non-residential property market are judged to have increased from the impact of COVID-19.
Banks’ exposures to vulnerable property segments have declined, but risks remain, prompting heightened scrutiny
While the property sector remains a significant contributor (52%) to banks’ total loans, exposures to the more vulnerable property segments remain low and have declined further in the second half of 2020 (Chart 1.24). The bulk of these exposures also continue to be performing. Nonetheless, a deterioration in the servicing of property construction loans and loans to purchase non-residential property has been observed in the second half of 2020 (Chart 1.25). Banks have built up adequate provisions against potential credit losses in these segments (refer to the Chapter on ‘Financial Institution Soundness and Resilience’ for further details).
26 A household investor is defined as an individual borrower with a non-residential property loan or more than one property loan (both residential and non-residential properties are considered in this assessment).
27 Source: Jones Lang Wootton.

Coping with COVID-19: Key Developments in the Second Half of 2020
FINANCIAL STABILITY REVIEW - SECOND HALF 202024
Note: 1. Average rents of the most prominent shops in major shopping complexes2. Construction loans for residential and non-residential property, and working capital for fi rms in the real estate sector
Source: Bank Negara Malaysia, Jones Lang Wootton, Knight Frank, Malaysian Association of Hotels, Malaysia Tourism Promotion Board, National Property Information Centre (NAPIC) and Savills Malaysia
Chart 1.22: Property Market – Occupancy Rate for Hotelsand Vacancy Rates for Office and Retail Space
59.7
0
30
60
26.0 24.3
11.0
26.4 25.428.4 27.5 26.3
Hotels Office space Retail space
4Q '19 2Q '20 4Q '20
Occupancy rate (%) Vacancy rate - Klang Valley (%)
Chart 1.25: Property Market – Loan Impairment Ratios by Segment
1.31.1
1.4
2.4
1.2 1.11.4
2.3
1.31.2
1.5
3.1
0
1
2
3
4
%
Overall Residentialproperty
Non-residentialproperty
Construction2
Dec '19 Jun '20 Dec '20
Chart 1.20: Property Market – Housing Transactions
Annual growth (%)
10
5.12.9
1.7
-5.0
-0.4
-9.9
-40.7
0
-10
-40Volume Average value
1Q-4Q '19 average 1Q '20 3Q '202Q '20
//
6.0
Chart 1.21: Property Market – Volume of Housing LoanApplications by Price Segment
RM500,000-RM1,000,000
4Q '19 2Q '20 4Q '20
Annual growth (%)
>RM1,000,000
RM300,000-RM500,000<RM300,000
3.2
-46.5
-2.9
6.7
-60
-40
-20
0
20
Percentage points
3Q '20
Chart 1.23: Property Market – Rentals for Prime Office and Retail Space in Kuala Lumpur
1.50.9
1.40.9
-3.4-2.6
-4
-2
0
2
Prime office space Prime retail space1
Annual growth (%)
4Q '19 2Q '20 4Q '20
Financing of office space and shopping complexes
Financing to property developers with unsold residential property
Financing to hotel sector
Chart 1.24: Property Market – Banking System's Exposure to Vulnerable Segments in the Property Market
% of total loans inbanking system8
4
0Dec '19 Mar '20 Jun '20 Sep '20 Dec '20
0.9
3.3 3.3
0.9
3.2
0.8
3.2 3.2
1.9 1.9 1.9 1.70.8
1.70.8

25FINANCIAL STABILITY REVIEW - SECOND HALF 2020
Financial institutions remained operationally resilient despite challengesThe pandemic has continued to test the operational resilience and business continuity frameworks of financial institutions, with the resurgence of infection risks and an extended period of remote working arrangements now built into baseline scenarios for the foreseeable future. Adaptations made to business continuity plans (BCPs) since the first MCO in March 2020 have enabled financial institutions to remain operationally resilient without any major operational, information technology (IT) and cyber disruptions, thus ensuring the continued provision of essential financial services to the public.
Notwithstanding this, financial institutions are continuing to review and update their BCPs and disaster recovery plans (DRPs). This aims to provide greater assurance of their ability to maintain critical operations and increase the speed with which business operations are able to adapt to changing conditions in the event of a prolonged full-scale lockdown at critical premises, sudden unavailability
of key third-party service providers, and major breakdowns in IT infrastructure supporting remote working arrangements (Diagram 1.3). These enhanced BCPs and DRPs will reinforce financial institutions’ capacity to anticipate, prepare for, and adapt to future shocks.
Despite the pandemic coinciding with the technology refresh cycle of key operating platforms used in the banking industry, financial institutions have generally been able to keep to their committed plans for the implementation of critical IT projects. While temporary delays have been unavoidable in some cases due to prolonged movement restrictions, adjustments to implementation timelines have not been material. The industry remains committed to completing these technology refresh projects in a timely manner, given the importance of strictly observing IT lifecycle management policies for high-risk systems reaching end-of-life to reduce operational risks. With the increasing prevalence of mobile and internet banking since the MCO, banking institutions are also reviewing plans to expedite the migration to alternative authentication methods for internet banking transactions. This will serve to avoid potential disruptions to online transactions by putting in place back-up solutions to the one-time password (OTP) to allow for the safe use of alternative forms of multi-factor authentication.
OPERATIONAL RISK
Diagram 1.3: Enhancements to Business Continuity Plans and Disaster Recovery Plans Observed AmongFinancial Institutions
Establishment of policies and procedures to facilitate operational workflows during large-scale split operations
Establishment of additional strategic alternate sites in the event the head office becomes inaccessible and to support split operations
Contingency plans that identify alternate third-party service providers, or establish internal capability
Better coordination with third-party service providers to facilitate their operations during MCO (e.g.: travel authorisations)
Improvements to crisis communications to support swift adaptations to directives from the Government, regulators and relevant authorities
Strengthened preparedness to deploy manual processes
Expanded capacity and strengthened operational readiness of disaster recovery centres (DRCs)
Established additional alternate sites equipped with backup infrastructure to continue essential business operations
Readiness for a prolonged full-scale lockdown at
critical premises
Preparation for sudden unavailability of key
third-party service providers
Provisions for major breakdown in IT infrastructure
Source: Bank Negara Malaysia

Coping with COVID-19: Key Developments in the Second Half of 2020
26 FINANCIAL STABILITY REVIEW - SECOND HALF 2020
Total operational risk losses among financial institutions in the second half of 2020 remained stable and insignificant, similar to previous years. Losses from the materialisation of operational risk events amounted to 0.5% and 0.04% of total profit before tax of banking institutions (including development financial institutions) and insurance and takaful operators, respectively. The Bank and financial institutions remain vigilant against heightened risks, particularly from extended remote working arrangements which have required financial institutions to enable staff to access critical information and systems remotely, either on a business-as-usual or exceptional basis to support business continuity.
Payment and settlement systems continued to operate with minimal disruptions
Malaysia’s payment systems continued to operate smoothly without major disruptions, with the large-value payment system, Real-time Electronic Transfer of Funds and Securities System (RENTAS),28 and retail payment systems (RPS) maintaining high system availability at above 99.9%. Online payment transactions continued to increase, driven by e-commerce activity as consumers adjusted to
movement restrictions, with a total of 1.1 billion transactions amounting to RM 1.3 trillion conducted in RPS in the second half of 2020 (1H 2020: 0.8 billion transactions amounting to RM1 trillion). For RPS, a slightly higher number of incidents of isolated disruptions were reported in the second half of 2020 compared to the first half of the year. However, these were swiftly resolved and did not cause major disruptions, with contingency and recovery plans operating as expected. For RENTAS, the completion of technology refresh efforts since the first quarter of 2020 has further reduced potential risks of disruptions. As a result, the number of incidents that caused isolated disruptions to RENTAS declined by 32% in the second half of 2020, compared to the first half of 2020.
Both RENTAS and RPS operators have maintained split operations despite the lifting of movement restrictions following the first MCO in the first half of the year. These operators have also further enhanced their BCPs to incorporate remote access capabilities and security to enable more staff to work from home. Personnel were also identified and trained to increase the number of reserve staff available to readily take over critical operations if necessary. These payment system operators also continued to conduct planned business continuity exercises under the ‘new normal’ to test response and recovery measures in order to minimise service disruptions.
28 RENTAS is a real-time gross settlement system for interbank fund transfers, debt securities settlement and depository services for scripless debt securities.

Financial Institution Soundness and Resilience
27FINANCIAL STABILITY REVIEW - SECOND HALF 2020
Financial Institution Soundness and Resilience
29 The Banking Sector41 The Insurance and Takaful Sector44 Assessing the Resilience of Financial Institutions

Financial Institution Soundness and Resilience
28 FINANCIAL STABILITY REVIEW - SECOND HALF 2020

29FINANCIAL STABILITY REVIEW - SECOND HALF 2020
THE BANKING SECTOR
Banking system liquidity conditions remained supportive of financial intermediation activities amid sustained growth in deposits and improvement in loan repayments Banks continued to record healthy liquidity positions throughout the second half of 2020, with the aggregate banking system Liquidity Coverage Ratio (LCR) at 148.2% (Chart 2.1). This was supported by the resumption in loan repayments by most household and SME borrowers since October following the end of the automatic moratorium on these loans, with overall repayments
almost returning to levels prior to the automatic moratorium. Banking institutions’ placements with the Bank also increased significantly (+RM14.7 billion) as some banks shored up cash buffers in anticipation of potential withdrawals by the Government and/or non-bank financial institutions (NBFIs) to support various relief measures. Banks’ operations continued to be supported by stable funding sources, with the aggregate Net Stable Funding Ratio (NSFR)1 at 116%. Growth in banking system deposits remained firm, above the 5-year compounded annual growth rate (CAGR) of 4%, as households and businesses continued to hold precautionary cash buffers amid the challenging operating environment (Chart 2.2). Deposits from NBFIs also grew further, especially during the third quarter, as some of these institutions rebalanced
1 Banks’ funding profile is assessed using the NSFR, replacing the loan-to-fund (LTF) and loan-to-fund-and-equity (LTFE) ratios which were previously developed as interim funding indicators prior to the NSFR implementation. The LTF and LTFE ratios stood at 82.5% and 72%, respectively, as at December 2020 (June 2020: 82% and 71.5%).
Chart 2.1: Banking System – Liquidity Coverage Ratio
148
162
100
110
120
130
140
150
160
170
180
J F M A M J J A S O N D2020
%
Source: Bank Negara Malaysia
Automatic loan repaymentmoratorium period
Overall MYR
Chart 2.2: Banking System – Contribution to Growth in Deposits Accepted
4.5
-4
-2
0
2
4
6
8
J F M A M J J A S O N D2020
Percentage point
2014-2019 CAGR: 4.0%
Others
Non-bank financial institutionsNon-financial public enterprises
BusinessesIndividuals
Annual growth (%):Total deposits
Government Non-residents
Source: Bank Negara Malaysia
Financial Institution Soundnessand Resilience

Financial Institution Soundness and Resilience
30 FINANCIAL STABILITY REVIEW - SECOND HALF 2020
2 Banks’ external ‘debt-at-risk’ comprises financial institutions’ deposits, interbank borrowings and short-term loans from unrelated non-resident counterparties which are considered more susceptible to sudden withdrawal shocks.
their portfolios amid market developments and to accommodate the implementation of relief measures. Some banks have used the regulatory flexibilities accorded earlier by the Bank, which enables them to draw down on liquidity buffers and correspondingly, lower their internal LCR and/or NSFR limits. This has helped to support earnings while enabling these banks to continue lending to the economy and facilitate repayment assistance to borrowers facing temporary financial difficulties. Banks that have reduced available liquidity buffers are expected to be able to restore these buffers with relative ease. All banks are also well-positioned to meet the minimum NSFR requirement of 100% by 30 September 2021.
Banks’ reliance on external funding continued to be limited (Chart 2.3). During the second half of 2020, overall banking system external debt declined by RM48 billion, primarily due to maturing intragroup borrowings by banks in the Labuan International Business and Financial Centre (LIBFC). At the same time, lower demand for foreign currency (FCY) financing domestically reduced banks’ need for external FCY borrowings. The decline in external debt in the third quarter was partially offset by higher precautionary buffers accumulated by domestic banking groups (DBGs) in the fourth quarter. This was in anticipation of a potential tightening in domestic USD liquidity conditions towards year end, particularly amid uncertainty ahead of the US Presidential election in November. Valuation effects following the stronger ringgit against selected
major and regional foreign currencies during the period further reduced the amount of external debt.
Funding and currency risks from banks’ external debt exposures remained manageable
Risks from external debt exposures remained low. A large proportion (almost 60%) of external debt comprises intragroup placements and long-term debt securities that are generally more stable, thereby reducing withdrawal or rollover risks (Chart 2.4). 18% of external debt are also ringgit-denominated, which are not subject to valuation changes from fluctuations in the exchange rate. Risks associated with cross-currency mismatches are contained, with the foreign exchange net open position (FX NOP) remaining well within levels recorded in recent periods (December 2020: 5.3%; June 2020: 4.9%; 5-year average: 5.7%) (Chart 2.5). Banks also continued to maintain sufficient FCY liquid assets to cover almost three times the level of FCY external debt-at-risk (Chart 2.6).2
Chart 2.3: Banks' External Debt – by Instrument
362.3396.2 385.2
342.6 337.2
8.1%9.1%
7.8% 7.4% 7.6%
0
100
200
300
400
500
Dec Mar Jun Sep Dec2019 2020
RM billion
Deposits accepted from non-FIs
Onshore banks' external debt (% of total funding)
Others
Debt securities
FI placement & vostroInterbank borrowings
Note: 1. Banking system or onshore banks refer to only DBGs and locally-incorporated foreign banks (LIFBs)
2. Banks' external debt in this context refers to external debt of DBGs, LIFBs, and LIBFC banks
Source: Bank Negara Malaysia
Chart 2.4: Banks' External Debt – by Type of Exposure and Instrument
148.8, 44%
42.6, 13%
15.9, 5%
75.4, 22%
42.2, 12%
12.3, 4%
Intragroup exposures
Interbank borrowings FI placement & vostro
Deposits accepted from non-FIs Debt securities
Others
Intragroup exposures (44%)
RM337.2 bil,23.8% of GDP
139.5, 41%
2.9, 1%
6.4, 2%
Note: Banks' external debt in this context refers to external debt of DBGs, LIFBs, and LIBFC banks
Source: Bank Negara Malaysia

Financial Institution Soundness and Resilience
31FINANCIAL STABILITY REVIEW - SECOND HALF 2020
Overall, banks’ funding costs continued to be on a declining trend amid strong pass-through of the earlier Overnight Policy Rate (OPR) cuts and ample liquidity conditions (Chart 2.7). While funding conditions are expected to remain broadly favourable in the near term, adverse changes in global market sentiment could lead to capital
outflows and drive funding costs higher. Chunky withdrawals by the Government and/or NBFIs to support the implementation of further relief measures, as well as sizeable deposit drawdowns by distressed individuals and businesses following the implementation of MCO 2.0, could also put pressure on the liquidity position of some banks. Despite these challenges, banks are expected to remain resilient on account of their sizeable liquidity buffers and sound liquidity risk management practices, as well as continued progress in accumulating stable sources of longer-term funding. The extension of the flexibility for banking institutions to use Malaysian Government Securities (MGS) and Malaysian Government Investment Issues (MGII) to meet the Statutory Reserve Requirement (SRR) until 31 December 2022 will also augment liquidity in the banking system to support financial intermediation activity.
Chart 2.7: Banking System – Average Cost of Deposits, Kuala Lumpur Interbank Offered Rate (KLIBOR) and Overnight Policy Rate (OPR)
3M KLIBOR Average cost of deposits OPR
Source: Bank Negara Malaysia
3.10
1.94
2.66
1.52
2.75
1.75
1
2
3
4
J F M A M J J A S O N D2020
%
Chart 2.5: Banking System – FX and USD NetOpen Positions
5.3
4.5
0
2
4
6
J F M A M J J A S O N D2020
% of total capital
USDFX
Note: Banking system or onshore banks refer to only DBGs and LIFBs
Source: Bank Negara Malaysia
Chart 2.6: Banking System – FCY External ‘Debt-at-Risk’ and Liquid Assets
58.4
161.4
0
100
200
300
FCY short-term externaldebt
FCY liquid assets
FCY external 'debt-at-risk'
RM billion
222.2
Note: 1. Banking system or onshore banks refer to only DBGs and LIFBs 2. Liquid assets comprise cash and cash equivalents, unencumbered debt securities held and interbank placements
Source: Bank Negara Malaysia

Financial Institution Soundness and Resilience
32 FINANCIAL STABILITY REVIEW - SECOND HALF 2020
Developments of the Benchmark Rate Reform in Malaysia
London Interbank Offered Rate (LIBOR) Transition: Recalibration of Malaysia’s Transition Signposts
There has been considerable progress since the first publication of the Bank’s LIBOR transition3 signposts in 2020.4 Banks in Malaysia have been proactively engaging borrowers to renegotiate benchmark replacements and to develop fallback provisions in existing LIBOR-based loan contracts in an effort to manage tough legacy5 contracts and reduce the consequential legal risk. Banks are also working through system enhancements needed to ensure their operational readiness to support products priced off alternative risk-free rates (RFR). These efforts were interrupted by COVID-19 in some banks, but are expected to pick up pace again in 2021. Malaysian banks with significant derivative exposures have also adhered to the International Swaps and Derivatives Association (ISDA) 2020 Interbank Offered Rate (IBOR) Fallbacks Protocol, which enables market participants to amend the terms of their derivative contracts. The Malaysian banking industry’s LIBOR exposures6 stood at RM963 billion as of 31 December 2020 (Diagram 2.1). Cash products present a different hurdle in transitioning to RFRs due to the lack of a forward-looking term structure. While borrowers prefer certainty in their future monthly cashflows, the actual rate under the compounded-in-arrears convention of term RFRs is known only at the end of the interest period. Hence, there is a mismatch between the demand and supply of RFR-referenced products without a forward-looking term structure. In order to address the lagging demand, the Alternative Reference Rate Committee (ARRC)7 in the United States of America (US) is working towards identifying a potential administrator to publish the forward-looking term Secured Overnight Financing Rate (SOFR) by the end of 2021. The success of this hinges upon liquidity conditions of the SOFR derivatives markets, from which the forward rate is derived.
Recently, the ICE Benchmark Administration (IBA), the global administrator of LIBOR, announced a delay to the cessation of the publication of USD LIBOR for the overnight, 1, 3, 6, and 12-month tenures by 18 months to 30 June 2023. The publication of all other USD LIBOR tenures and LIBOR currencies will, however, cease on 31 December 2021 as planned.
Diagram 2.1: Malaysian Banks’ LIBOR Exposures asof 31 December 2020
Source: Bank Negara Malaysia
10%Loans
1%Bonds
9%Others**
80%Derivatives*
* Refers to notional amount** Mainly interbank lending/borrowing and customer deposits
Note: At consolidated banking group level
RM963b
3 As part of the global reform of benchmark interest rates, LIBOR will be discontinued and replaced with alternative risk-free rates (RFR).4 Refer to the Information Box on ‘Benchmark Rate Reform: LIBOR Transition’ in the BNM Financial Stability Review for Second Half 2019 for
further details.5 Existing LIBOR referencing contracts that are unable to be converted into non-LIBOR rates or amended to include fallback provisions when
LIBOR is discontinued.6 Refer to the outstanding amount of on-balance sheet exposures and notional amount of derivatives at the consolidated banking group level.7 ARRC consists of a group of private-market participants, convened by the Federal Reserve Board and the New York Fed, to help ensure a successful
transition from the USD LIBOR to the Secured Overnight Financing Rate.

Financial Institution Soundness and Resilience
33FINANCIAL STABILITY REVIEW - SECOND HALF 2020
In line with this development, the Bank is recalibrating key signposts to facilitate renegotiations and provide sufficient time for the demand of SOFR-based cash products to grow, as the forward-looking term SOFR is expected to be published before end-2021. Two signposts will be shifted from the original target of the second quarter of 2021 to the fourth quarter of 2021. First, the cessation of new products referencing the overnight, 1, 3, 6, and 12-month USD LIBOR, and second, the incorporation of fallback provisions in existing USD LIBOR-referenced contracts maturing beyond June 2023 (Diagram 2.2).
Diagram 2.2: Recalibrated Key Transition Signposts
Note: Signposts may be reviewed if there is any change in the global transition timelineSource: Bank Negara Malaysia
End of Dec 2021: GBP, EUR, JPY, CHF, 1-week and 2-month USD LIBOR cease to existEnd of Jun 2023: Overnight, 1, 3, 6 and 12-month USD LIBOR cease to exist
LIBOR transition signposts
For contracts referencing overnight, 1, 3, 6 and 12-month USD LIBOR:1. These LIBOR loan contracts that are maturing beyond June 2023 to have fallback provisions 2. Ensure and test capability to execute fallback 3. Cease issuance of products referenced to these LIBORs
For contracts referencing GBP, EUR, JPY, CHF, 1-week and 2-month USD LIBOR:1. These LIBOR loan contracts that are maturing beyond end-2021 to have fallback provisions 2. Ensure and test capability to execute fallback 3. Cease issuance of products referenced to these LIBORs
1. All LIBOR derivative contracts to have fallback provisions 2. Submission of quantitative financial impact assessment and detailed transition plans and
progress for engaging LIBOR loan borrowers by top 5 banks with the largest LIBOR exposures
Take stock of transition plans, identify and resolve all residual risks and impediments to issue products referenced to risk-free rates (including systems, expertise, tax and risk management issues)
Engage borrowers to renegotiate contracts and incorporate fallback provisions for existing LIBORloan contracts
Complete assessment on operational readiness and capability to support products referenced to risk-free rates
New
Q3 2020
Q4 2020
Q2 2021
Q3 2021
Q1 2021
Q4 2021
Development of an Alternative Reference Rate (ARR) and Refinements to the Kuala Lumpur Interbank Offered Rate (KLIBOR)As for domestic benchmark rates, in line with global benchmark reform efforts recommended by the Financial Stability Board (FSB), the Financial Markets Committee (FMC) will oversee efforts in developing an ARR, which adheres to the Principles for Financial Benchmarks by the International Organization of Securities Commissions (IOSCO). The ARR will run parallel to the existing KLIBOR, providing sufficient time for market participants to prepare for its adoption.
In the first half of 2021, the FMC will conduct a public consultation to gather feedback on the proposed ARR and methodology. This is to ensure that the development of the ARR will take into account views from key stakeholders, including both the sell and buy side (e.g. banks and institutional clients), and will serve as an effective reference rate for all products including derivatives, loans and securities. Upon its finalisation, the Bank intends to commence publication of the ARR in the second half of 2021, which will allow market participants to start designing and pricing financial products based on the ARR.
Alongside this exercise, the Bank also intends to introduce additional refinements to the KLIBOR framework, including the incorporation of fallbacks, to further enhance its integrity and reliability as a financial benchmark.

Financial Institution Soundness and Resilience
34 FINANCIAL STABILITY REVIEW - SECOND HALF 2020
Weaker credit risk outlook and uncertain economic recovery prospects raised credit costs and weighed down earnings
The impact of the pandemic on bank impairment levels remained largely contained in the second half of 2020 due to repayment assistance programmes offered by banks to help household and business borrowers manage temporary cashflow constraints. Gross impairment ratio of the banking system edged slightly higher to 1.6% (June 2020: 1.4%; 2019 average: 1.5%) (Chart 2.8) following the end of the blanket automatic moratorium, mainly driven by a slight increase in household impairments. However, with uncertainty around the ongoing pandemic and uneven economic recovery, the credit risk outlook remains challenging. The overall proportion of loans classified as Stage 28 under MFRS 9 rose to 10% of total banking system loans (June 2020: 8.4%), given expectations of rising impairments from households and a further deterioration in the financial performance of some businesses. In light of that, banks continued to build up provisions in anticipation of higher credit losses. On a year-on-year basis, provisions grew by 40.6% (June 2020: +9%) (Chart 2.9). Higher overall provisions set aside by banks in the second half of 2020 (+RM6.1 billion to RM30.9 billion as at end-December 2020) reflected adjustments to banks’ provisioning model parameters to account for the downside risks to domestic economic growth. In addition, around 40% of additional provisions for the year were from the application of management overlays by banks over and above the expected credit loss (ECL) model provisions. This reflects continued challenges faced by banks in incorporating forward-looking information in the measurement of ECL given prevailing uncertainties in the economic recovery path, and reduced visibility on the debt-servicing capacity of borrowers under loan moratoriums.
Overall credit costs9 remained at an elevated level, rising further to 78 basis points (bps) for the full year
of 2020 (June 2020: 57 bps; 5-year average: 15 bps) (Chart 2.10). Correspondingly, banks’ profit before tax fell the most since the Asian Financial Crisis (AFC) (2020: -24.8%; 2H 2020: -31%), despite improvements in other sources of profits in the second half of the year (Chart 2.11). Net interest income recovered, supported by stabilising interest margins given the repricing of deposits from earlier OPR cuts (Chart 2.12). In addition, banks’ trading and investment income was boosted by the sale of debt securities and fair value changes amid declining yields. Fee income also improved, mainly from equity brokerage and credit-related fees, amid a resumption in economic activity and higher retail participation in the equity market.
In line with weaker bank earnings throughout 2020, returns on equity and assets of the banking system declined to 9.2% and 1.1% (June 2020: 10% and 1.2%), respectively (Chart 2.13). Market valuations for listed banks, as measured by the median price-to-book (P/B) and price-to-earnings (P/E) ratios, however, improved towards the end of 2020 and into 2021, partly lifted by prospects of earnings support from pre-emptive provisions made by banks in 2020 and lower pressure on banks’ interest margins moving forward. Notwithstanding this, the cautious credit risk outlook will continue to weigh on banks’ profitability.
While downside pressure on earnings is likely to persist in the first half of 2021, the impact is expected to be less severe than that experienced in 2020. Banks are operationally better prepared to support borrowers affected by MCO 2.0 who are in need of temporary repayment assistance. The number of affected borrowers requiring assistance is also expected to be lower, with most household and SME borrowers resuming their loan repayments since the fourth quarter of 2020. The additional relief measures introduced by the Government under the 2021 Budget and fiscal stimulus packages will further help sustain debt serviceability. Credit costs are expected to begin normalising in the second half of 2021 following banks’ pre-emptive provisioning in 2020.
8 Stage 2 loans refer to loans that have exhibited deterioration in credit risk, for which banks are required to set aside provisions based on lifetime expected credit losses.
9 Refers to annualised year-to-date loan loss impairment and other provisions charged to the income statement over outstanding loans. Excludes loans from DBGs’ overseas operations.

Financial Institution Soundness and Resilience
35FINANCIAL STABILITY REVIEW - SECOND HALF 2020
Note: 1. Annual growth computed based on fi gures for 2H 2019 and 2H 2020 2. Interest margin is the difference between interest rates at which banks extend fi nancing and interest rates banks pay for funding, including
deposits
Source: Bank Negara Malaysia
Chart 2.10: Banking System – Annualised Credit Cost Ratio
8
62 57 62
78
0
10
20
30
40
50
60
70
80
Dec '19
2015-2019 average: 15 bps
Mar '20 Jun '20 Sep '20 Dec '20
Basis point
Chart 2.8: Banking System – Gross Impaired Loans Ratio
1.1 0.9 0.81.1
2.6 2.5 2.5 2.52.6
1.5 1.6 1.4 1.41.6
0.0
0.5
1.0
1.5
2.0
2.5
3.0
2019average
Mar '20 Jun '20 Sep '20 Dec '20
Household loans Business loans Overall loans
%
1.0
Chart 2.12: Banking System – Interest Margin and Average Cost of Deposits
1.94
1.521.4
1.6
1.8
2.0
2.2
2.4
2.6
2.8
Dec '19 Mar '20 Jun '20 Sep '20 Dec '20
Interest margin2 Average cost of deposits
%
Chart 2.9: Banking System – Provisions
-1.1
1.2 1.6
2.4
3.7
40.6
-1.5
-1.0
-0.5
0.0
0.5
1.0
1.5
2.0
2.5
3.0
3.5
4.0
4.5
-15
-10
-5
0
5
10
15
20
25
30
35
40
45
Dec '19 Mar '20 Jun '20 Sep '20 Dec '20
Quarterly increase/decreasein provisions (RHS)
Annual growth inoutstanding provisions
Annual growth (%) RM billion
Chart 2.11: Banking System – Income, Cost and Profit before Tax
18.3 20.4 21.116.6 14.6
-30-20-10
010203040
2H '18 1H '19 2H '19 1H '20 2H '20
Net interest income Credit cost Operating cost
Trading and investment income
Fee income Other income
Profit before tax
Annual growth (%)1
-3.1%
+970.6%
-2.5%
-31%
+6.2%
RM billion
Chart 2.13: Banking System – Profitability
Return on assets (RHS)Return on equity
1.1
9.2
0
2
4
6
8
10
12
14
Dec '19 Mar '20 Jun '20 Sep '20 Dec '200.00.20.40.60.81.01.21.41.61.82.0
% %

Financial Institution Soundness and Resilience
36 FINANCIAL STABILITY REVIEW - SECOND HALF 2020
The financial performance of the overseas operations of DBGs10 remained subdued over the past year amid the COVID-19 pandemic and contraction in economic activities across most countries. Nevertheless, improvements in the performance of selected DBGs’ overseas operations in Singapore (51% share of total overseas operations’ assets) during the fourth quarter of 2020 lifted the overall average11 return on equity (ROE) to -2.2% (1H 2020: -4.2%). Operations in Singapore recorded lower losses (average ROE of -5.1%; 1H 2020: -14.5%),12 mainly due to lower provisions compared to the first half of 2020, but remained under pressure amid lower earnings from interest-related activities. On the other hand, operations’ in Indonesia and Thailand continued to record profits, albeit at a lower ROE of 8.7% and 2.3% (1H 2020: 11.9% and 5.3%), respectively due to higher impairment allowances. Meanwhile, operations in Hong Kong SAR were impacted by higher provisions by some DBGs for exposures to large corporates affected by the pandemic, as well as lower trading and investment income. Collectively, overall asset quality of the DBGs’ overseas operations improved slightly, with the gross impaired loans ratio13 at 3.9% (June 2020: 4.2%), supported by ongoing moratorium and debt relief measures (Chart 2.14).
Challenging credit conditions amid COVID-19 pressures continue to weigh on financial performance of banks’ overseas operations
Risks posed by the overseas operations of DBGs are assessed to be limited as exposures to sectors directly and indirectly affected by the pandemic are small relative to DBGs’ total gross loans. Moreover, funding of DBGs’ overseas operations, mainly from local currency deposits (Chart 2.15), remained stable. Although pressure on asset quality remains
elevated given continued uncertainty on regional growth prospects, major overseas subsidiaries continue to maintain relatively high levels of capital, which serve to buffer against potential credit losses without having to draw on parental support. Based on stress tests conducted by DBGs on their overseas operations, all major foreign subsidiaries continued to maintain sufficient capital to withstand severe shocks associated with higher
Chart 2.14: Banking System − Key Financial Indicatorsof Overseas Operations
19.8
6.03.6
19.1
-4.2
4.2
19.2
-2.2
3.9
-10
-5
0
5
10
15
20
25
Total capital ratio Return on equity Gross impairedloans ratio
Dec '19 Jun '20 Dec '20
%
Note: The average key financial indicators are weighted by the asset size of selected overseas operations
Source: Bank Negara Malaysia
Chart 2.15: Banking System ‒ Funding Profile of MajorOverseas Operations
71.380.8
74.6
52.8
69.6
18.0 2.321.3
11.1
15.7
10.716.9
4.2
36.0
14.6
Singapore Indonesia Hong KongSAR
Thailand Total
Customers’ deposits Others
0
10
20
30
40
50
60
70
80
90
100%
Interbank borrowing
Source: Bank Negara Malaysia
Note: Figures may not add up due to rounding
10 Refers to DBGs’ overseas offices (branches and subsidiaries) operating outside of Malaysia and LIBFC. Cumulatively, DBGs have presence in 14 overseas jurisdictions, with major operations in Singapore, Indonesia, Thailand and Hong Kong SAR.
11 Average figures are weighted by asset size of operations of each DBG in respective jurisdictions.
12 Higher provisions made during the first half of the year were driven primarily by sizeable exposures to impaired borrowers from the oil and gas sector.
13 Ratio is weighted by asset size of operations of each DBG in respective jurisdictions.

Financial Institution Soundness and Resilience
37FINANCIAL STABILITY REVIEW - SECOND HALF 2020
credit risks arising from the pandemic, weaker oil prices and a delayed recovery in global growth. Post-shock total capital ratios of these subsidiaries remained well above the regulatory minimum, ranging between 17% and 27%.
The capitalisation of the banking system remains strong, bolstering banks’ capacity to absorb potential shocks and support economic recovery
Despite lower profits during the period, banks continued to maintain strong capitalisation levels throughout the second half of 2020 (December 2020: 18.5%; 2019 average: 17.9%), with aggregate excess capital buffers14 amounting to RM126.7 billion (Chart 2.16). Banks have sought to preserve their buffers in anticipation of higher credit losses going into 2021, by lowering dividends to shareholders, implementing dividend reinvestment programmes, and raising new equity. Some banks also issued Additional Tier 1 and Tier 2 capital instruments, replacing Tier 2 capital instruments that were being phased out as regulatory capital under the Basel III transitional arrangements. The stable capital buffers of
Chart 2.16: Banking System ‒ Capital Ratios
14.8 15.3
18.5
0
5
10
15
20
Dec '19 Jun '20 Dec '20
126.7
0
40
80
120
160
RM billion% of risk-weighted assets
CommonEquity Tier 1capital ratio
Tier 1capital ratio
Total capitalratio
Excess total capital
Note: Excess total capital refers to total capital above the regulatory minimum, which includes the capital conservation buffer requirement of 2.5% and bank-specific higher minimum requirements
Source: Bank Negara Malaysia
banks have been maintained, as the ratio of risk-weighted assets to total assets returned to pre-COVID-19 levels (December 2020: 57.4%; March 2020: 56.5%; December 2019: 57.5%), indicating that banks continued to support credit flows to the economy.
14 Refers to capital held in excess of regulatory minimum, which includes the capital conservation buffer (2.5%) and bank-specific requirements.
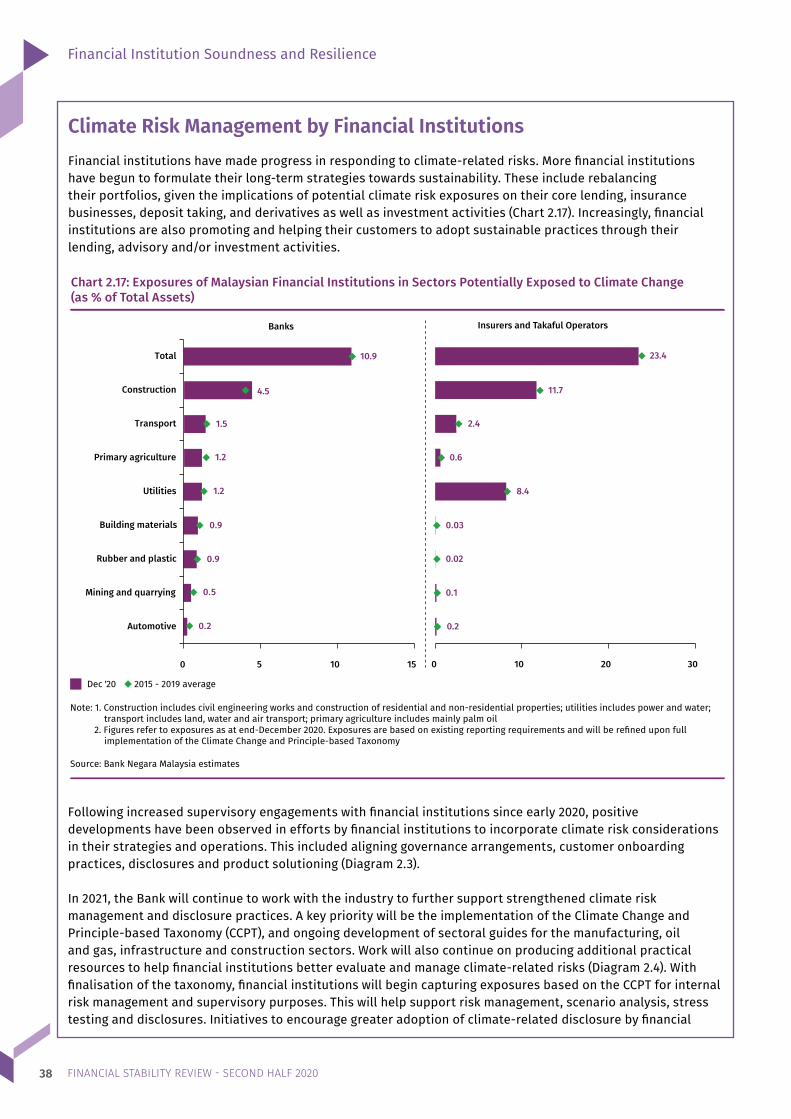
Financial Institution Soundness and Resilience
38 FINANCIAL STABILITY REVIEW - SECOND HALF 2020
Climate Risk Management by Financial Institutions Financial institutions have made progress in responding to climate-related risks. More financial institutions have begun to formulate their long-term strategies towards sustainability. These include rebalancing their portfolios, given the implications of potential climate risk exposures on their core lending, insurance businesses, deposit taking, and derivatives as well as investment activities (Chart 2.17). Increasingly, financial institutions are also promoting and helping their customers to adopt sustainable practices through their lending, advisory and/or investment activities.
Following increased supervisory engagements with financial institutions since early 2020, positive developments have been observed in efforts by financial institutions to incorporate climate risk considerations in their strategies and operations. This included aligning governance arrangements, customer onboarding practices, disclosures and product solutioning (Diagram 2.3). In 2021, the Bank will continue to work with the industry to further support strengthened climate risk management and disclosure practices. A key priority will be the implementation of the Climate Change and Principle-based Taxonomy (CCPT), and ongoing development of sectoral guides for the manufacturing, oil and gas, infrastructure and construction sectors. Work will also continue on producing additional practical resources to help financial institutions better evaluate and manage climate-related risks (Diagram 2.4). With finalisation of the taxonomy, financial institutions will begin capturing exposures based on the CCPT for internal risk management and supervisory purposes. This will help support risk management, scenario analysis, stress testing and disclosures. Initiatives to encourage greater adoption of climate-related disclosure by financial
Chart 2.17: Exposures of Malaysian Financial Institutions in Sectors Potentially Exposed to Climate Change(as % of Total Assets)
Automotive
Mining and quarrying
Rubber and plastic
Building materials
Utilities
Primary agriculture
Transport
Construction
Total
Banks
Dec '20 2015 - 2019 average
Source: Bank Negara Malaysia estimates
Insurers and Takaful Operators
0 5 10 15 0 10 20 30
10.9
4.5
1.5
1.2
1.2
0.9
0.9
0.5
0.2
23.4
11.7
2.4
0.6
8.4
0.03
0.02
0.1
0.2
Note: 1. Construction includes civil engineering works and construction of residential and non-residential properties; utilities includes power and water;transport includes land, water and air transport; primary agriculture includes mainly palm oil
2. Figures refer to exposures as at end-December 2020. Exposures are based on existing reporting requirements and will be refined upon full implementation of the Climate Change and Principle-based Taxonomy

Financial Institution Soundness and Resilience
39FINANCIAL STABILITY REVIEW - SECOND HALF 2020
institutions in line with the Task Force on Climate-related Financial Disclosures (TCFD) recommendations, as well as to expand the range of financial products, solutions and activities that support sustainable activities, will be pursued as part of the work of the Joint Committee on Climate Change (JC3). The JC3 will also establish a dedicated workstream to identify and bridge gaps in climate- and environmental-related data required by financial institutions to support risk assessments. In addition, efforts to scale up capacity building programmes for industry players to accelerate their knowledge and skill sets in climate risk management will continue (refer to the BNM Annual Report 2020 for further information on the role and initiatives of the Bank in addressing climate-related financial risks).
Diagram 2.3: Key Developments Observed in Financial Institutions
Climate-related risk management is gaining traction but at an uneven pace across the industry
Governance& strategy
Key observations Leading initiatives
• Stronger leadership by Board and senior management on the need to integrate climate-related considerations in business strategies and decisions, and risk management practices
• Established dedicated teams and senior management sponsors for climate-related initiatives
• Specific focus on climate risks as permanent agenda in Board and management committee meetings
Policy & framework
Reporting & disclosure
Product development & solutions
Capacity building
More financial institutions have become signatories to the United Nations Environment Programme Finance Initiative Principles for Responsible Banking as well as Principles for Sustainable Insurance
• Greater focus on enhancing staff awareness and technical capabilities
• Increasing integration of climate-related considerations into risk management framework and practices
• Established group climate risk framework and policies, and risk appetite
• Subjecting segments of customers to climate risk assessments including in underwriting practices
• Climate risks embedded in enterprise wide risk management. Developed transition risk management framework for effective monitoring and management of credit risk
• Established structured training roadmap for staff • Hired subject matter experts to provide
technical support and expedite knowledge development
• Introduction of new products such as sustainability-linked loans, insurance/takaful cover for weather and climate risks, and preferential rates for purchase of green products and solutions
• Preferential rates for renewable energy technology
• Invested in alternative technologies and relevant infrastructure projects to support climate risk mitigation and adaptation
• More financial institutions committing and taking active steps to adopt the TCFD recommendations and better quality disclosures
• Embarked on data collection initiative • Developed Malaysia Flood Catastrophe Modeling to
enhance risk monitoring and reporting
Source: Bank Negara Malaysia

Financial Institution Soundness and Resilience
40 FINANCIAL STABILITY REVIEW - SECOND HALF 2020
Diagram 2.4: Key Achievements in 2020 and Priorities in 2021
2020Key Achievements
2021Key Priorities
Pilot implementation of ClimateChange and Principle-basedTaxonomy
Increased awareness on climaterisk-related areas among the publicand industry through awarenessand education programmes
Conducted assessment on disclosurepractices of financial institutions andgaps against the TCFD recommendations
Finalisation and implementationof Climate Change andPrinciple-based Taxonomy Issuance of industry consultativepaper on Guides for Climate RiskManagement and Scenario Analysis,and TCFD Application Guide
Scale-up capacity buildingprogrammes
Consultation on Value-BasedIntermediation Financing andInvestment Impact AssessmentFramework (VBIAF) sectoral guideson renewable energy, energyefficiency and palm oil
Finalisation of VBIAF sectoral guideson renewable energy, energyefficiency and palm oil
Issuance of VBIAF sectoral guidesconsultative documents onmanufacturing, oil & gas andconstruction & infrastructure
GUIDE
Supported by collaboration with industry and partners through the Joint Committee on Climate Change and Value-Based Intermediation Community of Practitioners
to promote an orderly transition
Source: Bank Negara Malaysia

41FINANCIAL STABILITY REVIEW - SECOND HALF 2020
The insurance and takaful sector registered higher profitability, driven by stronger equity investment performance
Insurance and takaful funds recorded higher profitability in the second half of 2020 compared to the same period in 2019, driven by stronger investment performance of life insurance and family takaful funds. Excess income over outgo more than doubled to RM16.8 billion (2H 2019: RM7.7 billion) on the back of gains from equity and bond investments (Chart 2.18). In the life and family takaful sector, underwriting performance was sustained despite a markedly slower growth in new business premiums15 (9.2%; 2H 2019: 18.4%) (Chart 2.19). This reflected the lower demand for mortgage insurance and takaful products amid weaker property market conditions in the second half of 2020 compared to the same period in 2019. Takaful operators have higher exposures to the Mortgage Reducing Term Takaful (MRTT) business and were therefore more affected than conventional insurers. Overall net premium growth remained below pre-COVID-19 levels but has picked up since the first half of the year, mainly due to higher growth in new investment-linked business premiums (23.6%; 1H 2020: -25%; 2H 2019: 10.9%). Insurers and takaful operators (ITOs) have observed that Malaysians are increasingly aware of the importance of insurance and takaful products in providing financial protection. This has continued to support demand for insurance despite renewed containment measures in the second half of 2020 and early 2021.
In view of the resurgence in COVID-19 cases and the reintroduction of MCO in most states in early 2021, ITOs have extended16 the option for affected
consumers17 to defer premiums due under life insurance policies and family takaful certificates for three months without affecting the coverage. This option is now available for applications received until 30 June 2021. The impact of the temporary relief measures on ITOs’ profitability has been limited as the cumulative amount of premiums deferred and on holiday18 remained minimal at 7.7% of premiums in force. Total net policy benefit payouts have also remained largely stable. In 2021, total net policy benefit payouts could increase due to additional costs associated with COVID-19-related procedures and treatments that are incidental to covered conditions. However, the impact of this is expected to remain manageable. While death due to the COVID-19 pandemic is claimable under all life insurance policies and family takaful certificates, the low mortality rate observed among COVID-19 patients in Malaysia (0.4%; global: 2.2%)19 will likely limit the impact from any additional death claims. Medical and health insurance policies/takaful certificates (MHIT) in Malaysia generally carry a pandemic exclusion clause in line with practices globally. These exclusions reflect the complexity of pricing for such events due to the incalculable impact and costs, an absence of viable risk diversification instruments for ITOs, and to avoid significant premium hikes following a pandemic event. Some ITOs have made adjustments to their re-pricing plans in 2020 to reduce the financial burden on policyholders and preserve their MHIT coverage. These adjustments include deferring re-pricing plans to 2021, providing refunds to minimise the impact of price increases, and permitting extended deferral of premiums. ITOs are expected to be able to comfortably support the financial impact of these adjustments without affecting their overall resilience in the short term. Nevertheless, deferment of re-pricing over an extended period will not be financially sustainable for both the MHIT providers and policyholders as over the longer term, medical claims would reflect the underlying trends in medical inflation. Medical claims in 2021 are
THE INSURANCE AND TAKAFUL SECTOR
15 Refers to both premiums and contributions, unless otherwise stated.
16 The three-month premium deferment option that was announced in March 2020 and expired on 31 December 2020.
17 Affected consumers are individuals who have been infected, home quarantined or suffered a loss of income; and SMEs which have suffered a loss of income, as a result of the economic impact of COVID-19.
18 Premium holiday refers to continued insurance/takaful coverage despite an absence of premium payments and applies to products with the premium holiday feature already in place such as investment-linked products. This flexibility is available to policyholders as long as the investment value in the unit fund remains sufficient to meet the necessary insurance cost during the holiday period.
19 Based on the cumulative number of cases and deaths reported by the World Health Organization as at 23 March 2021.

Financial Institution Soundness and Resilience
42 FINANCIAL STABILITY REVIEW - SECOND HALF 2020
expected to increase compared to 2020 as a result of the resumption of treatments and procedures that were earlier delayed by policyholders due to COVID-19 concerns. Thus, further delays in re-pricing plans can lead to much steeper premium increases or reduced capacity of the industry to provide coverage in the future.
General insurance and takaful funds recorded higher operating profit, supported by better underwriting results as claims paid declined (Chart 2.20), mainly due to lower motor claims during the movement control period. Meanwhile, growth of gross direct premiums was sustained (2.8%; 2H 2019: 2.8%) (Chart 2.21). Motor premiums grew at a faster pace, supported by higher car sales in the second half of 2020 that was bolstered by the introduction of sales tax incentives. Under the phased liberalisation of the motor and fire tariffs, premium rates continued to adjust in line with policyholder risk profiles and recent loss experience. Based on recent motor claims data, certain theft-prone models and the younger drivers’ segment consistently recorded higher than average loss experience, while new cars tended to be below the average. Several providers also reduced rates significantly for the optional ‘special perils’ coverage that provides protection against vehicle damage due to flood events. In 2020, the premiums for 56% of private car comprehensive and third party fire and theft policies were higher than under the tariff, while 38% of rates were lower. Over 95% of policies experienced premium rate adjustments that were within 10% of the previous tariff rates. While these adjustments may be insufficient to achieve technical pricing20 levels for some risks, this is in line with the current phase of liberalisation. The phased approach aims to avoid sharp adjustments that would otherwise occur, particularly for motor risks where losses have persistently exceeded premiums for many years under the tariff. General ITOs also continued to introduce new products which are better tailored to meet customer needs and enabled policyholders to save on premiums, including usage-based motor policies which saw a two-fold increase in take-up, and products which provide flexibility for policyholders to select the coverage options that they need.
Meanwhile, personal accident premiums contracted as demand for travel insurance waned amid travel restrictions due to the pandemic. Claims from the floods in the east coast of Malaysia and several other states from late 2020 to early 2021 had a limited impact on general ITOs’ profitability. Total gross claims from the floods were estimated to only account for 3.2% of general ITOs’ operating profits for 2020.
Nevertheless, the insurance and takaful sector could face several challenges in the near future. ITOs continue to be exposed to heightened volatility in the financial markets from their sizeable bond and equity investments. The low interest rate environment also continues to pose challenges, especially for asset-liability management of life insurers and family takaful operators. Life insurers and family takaful operators generally operate with a negative duration gap given the lack of long-term financial assets available to match the duration of their liabilities (more than 15 years). Therefore, sustained periods of declining interest rates can have a detrimental impact on their solvency positions due to greater upward adjustments in the value of liabilities compared to assets.21 A stronger recovery in new business growth will also depend on the easing of containment measures and a more entrenched economic recovery. Additionally, some general ITOs have indicated that they may face prospects of rising reinsurance costs during the next contract renewal following pandemic-related and natural catastrophe losses incurred by global reinsurers.
These developments could weigh on near-term profitability, but are unlikely to have a material impact on overall resilience. ITOs remain resilient, with strong capital positions. The aggregate capital adequacy ratio (CAR) stood at 219.7%, well above the regulatory minimum of 130% (Chart 2.22). Recent stress tests conducted also affirm that insurers are expected to have sufficient capital buffers to withstand potential shocks (refer to the section on stress test for insurers for further details).
21 While the impact could be amplified as asset and liability sensitivities, defined as the change in values of assets and liabilities from a 1% change in interest rates, tend to increase faster in a low interest rate environment partly due to the effects of convexity, the actual impact to the balance sheet would vary depending on the shape of the yield curve.
20 The level of premiums required to cover the actual claims experience of a group of similar risks and the relevant expenses incurred.
1 Excess of net premium after deducting benefi t payouts, agency remuneration and management expenses Source: Bank Negara Malaysia
Chart 2.20: General Insurance and Takaful Fund –Composition of Operating Profits
2H 2018 1H 2019 2H 2019 1H 2020 2H 2020
1.6 1.4 1.5 1.7 1.7
-1
0
1
2RM billion
Underwriting profit Net investment income
Net unrealised gain/(loss)
Net profit/(loss) from disposal of assets
Net other income/(loss) Operating profit/(loss)
Chart 2.18: Life Insurance and Family Takaful Fund – Composition of Income and Outgo
-10
-5
0
5
10 6.6
16.5
7.74.7
15
20
2H 2018 1H 2019 2H 2019 1H 2020 2H 2020
RM billion
Balance of transaction1
Net unrealised gain/(loss) Net profit/(loss) from disposal of assets
Net investment income
Net other income/(loss) Excess income over outgo
16.8
Chart 2.22: Insurance and Takaful Sector – Capital Adequacy Ratio
100
130
160
190
220
250
280
0
20
40
60
80
100
Dec '18 Jun '19 Dec '19 Jun '20 Dec '20
%RM billion
Total capital available Total capital required Capital adequacy ratio (RHS)
243.9230.0 226.9 227.1
219.7
Participating
Chart 2.19: Life Insurance and Family Takaful Sector – New Business Premium Growth and Product Composition
2H 2018 1H 2019 2H 2019 1H 2020 2H 2020
Investment-linked Ordinary takaful
Non-participating
Total new business premium growth (RHS)
3.1
18.1 18.4
-7.1
9.2
-10
-5
0
5
10
15
20
25
0
2
4
6
8
10
12
%RM billion
Chart 2.21: General Insurance and Takaful Sector – Gross Direct Premium Growth and Product Composition
-6
-4
-2
0
2
4
6
0
3
6
9
12
2H 2018 1H 2019 2H 2019 1H 2020 2H 2020
RM billion %
Others
Fire
Marine, aviation and transit
Motor
Total gross direct premium growth (RHS)
4.0 4.32.8
-2.9
2.8

Financial Institution Soundness and Resilience
43FINANCIAL STABILITY REVIEW - SECOND HALF 2020
1 Excess of net premium after deducting benefi t payouts, agency remuneration and management expenses Source: Bank Negara Malaysia
Chart 2.20: General Insurance and Takaful Fund –Composition of Operating Profits
2H 2018 1H 2019 2H 2019 1H 2020 2H 2020
1.6 1.4 1.5 1.7 1.7
-1
0
1
2RM billion
Underwriting profit Net investment income
Net unrealised gain/(loss)
Net profit/(loss) from disposal of assets
Net other income/(loss) Operating profit/(loss)
Chart 2.18: Life Insurance and Family Takaful Fund – Composition of Income and Outgo
-10
-5
0
5
10 6.6
16.5
7.74.7
15
20
2H 2018 1H 2019 2H 2019 1H 2020 2H 2020
RM billion
Balance of transaction1
Net unrealised gain/(loss) Net profit/(loss) from disposal of assets
Net investment income
Net other income/(loss) Excess income over outgo
16.8
Chart 2.22: Insurance and Takaful Sector – Capital Adequacy Ratio
100
130
160
190
220
250
280
0
20
40
60
80
100
Dec '18 Jun '19 Dec '19 Jun '20 Dec '20
%RM billion
Total capital available Total capital required Capital adequacy ratio (RHS)
243.9230.0 226.9 227.1
219.7
Participating
Chart 2.19: Life Insurance and Family Takaful Sector – New Business Premium Growth and Product Composition
2H 2018 1H 2019 2H 2019 1H 2020 2H 2020
Investment-linked Ordinary takaful
Non-participating
Total new business premium growth (RHS)
3.1
18.1 18.4
-7.1
9.2
-10
-5
0
5
10
15
20
25
0
2
4
6
8
10
12
%RM billion
Chart 2.21: General Insurance and Takaful Sector – Gross Direct Premium Growth and Product Composition
-6
-4
-2
0
2
4
6
0
3
6
9
12
2H 2018 1H 2019 2H 2019 1H 2020 2H 2020
RM billion %
Others
Fire
Marine, aviation and transit
Motor
Total gross direct premium growth (RHS)
4.0 4.32.8
-2.9
2.8

44 FINANCIAL STABILITY REVIEW - SECOND HALF 2020
ASSESSING THE RESILIENCE OF FINANCIAL INSTITUTIONSStress testing is an integral component of the Bank’s financial stability framework, used to assess and manage risks to financial stability. The Bank typically performs a multi-year, top-down solvency stress test exercise in addition to regular supervisory stress tests. These exercises aim to assess the potential impact of financial and macroeconomic strains under two hypothetical adverse scenarios on the resilience of individual financial institutions and the broader financial system. The adverse scenarios are designed to capture extreme shocks that are plausible but have a low probability of occurring.
In the BNM Financial Stability Review for First Half 2020, the actual severe economic fallout from the COVID-19 pandemic prompted the Bank to shift the focus of its top-down, scenario-based stress tests towards assessing the ability of banks to withstand the unfolding stress based on assumptions around a likely recovery path at the time. This was supplemented with additional sensitivity analyses performed under a bottom-up approach to provide more granular assessments of resilience based on the specific risk profile of individual banks. As reported, the stress tests22 affirmed the resilience of banks.
The prospects of an economic recovery are clearer now than before, but considerable uncertainty remains. The Bank’s latest top-down macro solvency stress test therefore seeks to further stress the resilience of financial institutions in the event the economic recovery path turns out significantly weaker than anticipated. Two hypothetical adverse scenarios are applied, with the horizon of the test extended until the end of 2022. The first adverse scenario (AS1) assumes a sharp economic downturn in the first quarter of 2021 of similar magnitude to the downturn experienced in the second quarter of 2020, before recovering at a gradual pace akin to a V-shape. Under this scenario, the initial recovery, driven by pent-up demand, is unevenly distributed across industries before gradually normalising across all sectors by 2022. Simultaneously, broad success with vaccination efforts in most countries
results in global GDP returning to pre-pandemic levels by the third quarter of 2021, further bolstering domestic economic recovery. The second adverse scenario (AS2) assumes a much sharper economic contraction in the first quarter of 2021 surpassing the deepest slump experienced in the crisis thus far. In AS2, the recovery is assumed to be sluggish and L-shaped, with GDP recording negative growth in 2021 and remaining below pre-pandemic levels even by end-2022. This scenario assumes an ineffective vaccine and a marginal contraction in global growth in 2021, which will adversely impact Malaysian exports, investment and consumption. Given extended lockdown restrictions, domestic demand suffers a prolonged slump, with labour market conditions continuing to worsen throughout 2021. Both AS1 and AS2 assume sovereign rating downgrades in 2021. The economic scenarios used in this stress test do not represent the Bank’s actual expectations for the trajectory of the economy, but rather, have been developed for the specific purpose of testing the ability of financial institutions to withstand more severe and prolonged economic shocks even as economic prospects are expected to continue to improve.
The latest banking system stress test broadly follows the enhanced methodology set out in the BNM Financial Stability Review for First Half 2020, with some key enhancements to selected assumptions (Table 2.1). Notably, the test continues to assume no further repayment assistance to household borrowers after the first quarter of 2021. Any rescheduling and restructuring (R&R) of business loans is assumed to end after the second quarter of 2021.
Financial institutions continue to remain resilient under simulated severe credit, income and funding shocks
Under the two adverse scenarios described earlier, banks may see overall impairments rise to 4.0% under AS1 and 5.4% under AS2 by end-2022 (Chart 2.23), with businesses driving the larger share of new impairments in 2021 and households contributing the larger share in 2022. Despite the greater degree of economic stress assumed in this exercise, impairments by end-2021 are expected to be lower than the results in the previous exercise (AS1: 2.9%, AS2: 3.3%, previous: 4.1%). This is
22 Refer to the information boxes on ‘Key Features of the Enhanced Macro Solvency Simulation for Banks’, ‘Forecasting Business Impairments: Two-pronged Approach’, and ‘Forecasting Households’ Time to Default’ in the BNM Financial Stability Review for First Half 2020 for further details.
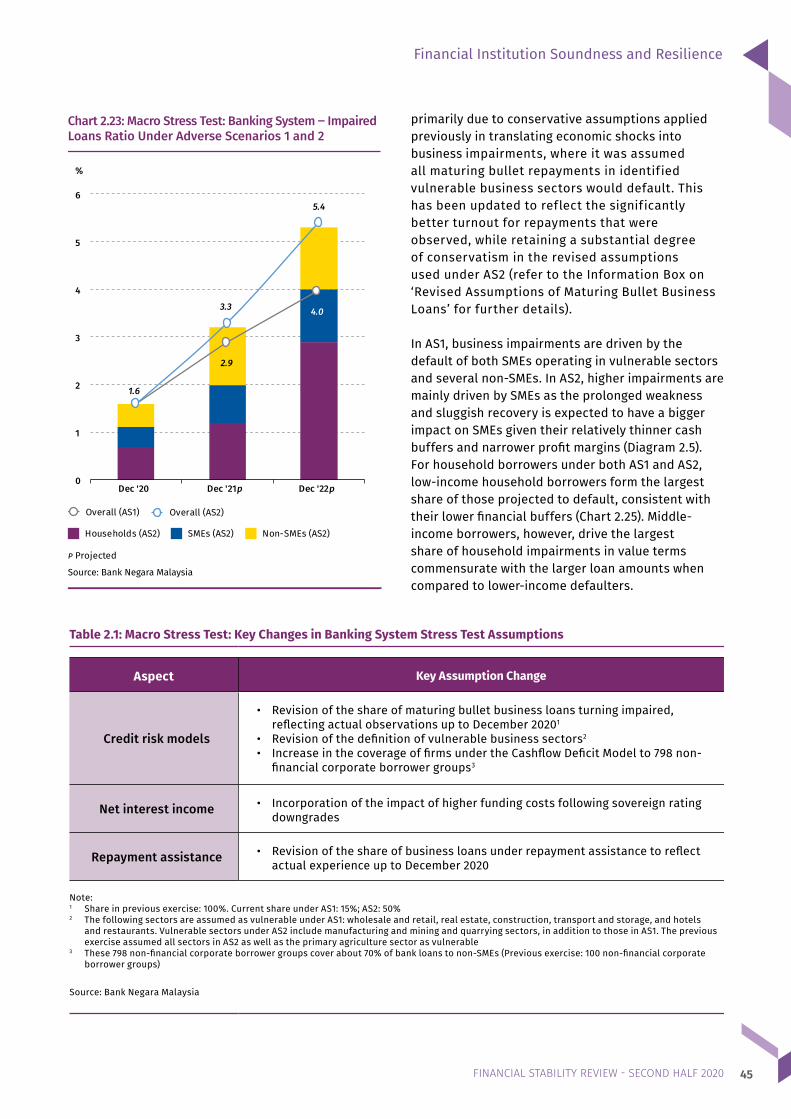
Financial Institution Soundness and Resilience
45FINANCIAL STABILITY REVIEW - SECOND HALF 2020
Chart 2.23: Macro Stress Test: Banking System ‒ ImpairedLoans Ratio Under Adverse Scenarios 1 and 2
Source: Bank Negara Malaysia
1.6
3.3
5.4
0
1
2
3
4
5
6
Dec '20 Dec '21p Dec '22p
Households (AS2) SMEs (AS2) Non-SMEs (AS2)
%
p Projected
2.9
4.0
Overall (AS2)Overall (AS1)
Table 2.1: Macro Stress Test: Key Changes in Banking System Stress Test Assumptions
Aspect Key Assumption Change
Credit risk models
• Revisionoftheshareofmaturingbulletbusinessloansturningimpaired,refl ecting actual observations up to December 20201
• Revisionofthedefinitionofvulnerablebusinesssectors2
• IncreaseinthecoverageoffirmsundertheCashflowDeficitModelto798non-fi nancial corporate borrower groups3
Net interest income • Incorporationoftheimpactofhigherfundingcostsfollowingsovereignratingdowngrades
Repayment assistance • Revisionoftheshareofbusinessloansunderrepaymentassistancetoreflectactual experience up to December 2020
Note: 1 Share in previous exercise: 100%. Current share under AS1: 15%; AS2: 50%2 The following sectors are assumed as vulnerable under AS1: wholesale and retail, real estate, construction, transport and storage, and hotels
and restaurants. Vulnerable sectors under AS2 include manufacturing and mining and quarrying sectors, in addition to those in AS1. The previous exercise assumed all sectors in AS2 as well as the primary agriculture sector as vulnerable
3 These 798 non-fi nancial corporate borrower groups cover about 70% of bank loans to non-SMEs (Previous exercise: 100 non-fi nancial corporate borrower groups)
Source: Bank Negara Malaysia
primarily due to conservative assumptions applied previously in translating economic shocks into business impairments, where it was assumed all maturing bullet repayments in identified vulnerable business sectors would default. This has been updated to reflect the significantly better turnout for repayments that were observed, while retaining a substantial degree of conservatism in the revised assumptions used under AS2 (refer to the Information Box on ‘Revised Assumptions of Maturing Bullet Business Loans’ for further details).
In AS1, business impairments are driven by the default of both SMEs operating in vulnerable sectors and several non-SMEs. In AS2, higher impairments are mainly driven by SMEs as the prolonged weakness and sluggish recovery is expected to have a bigger impact on SMEs given their relatively thinner cash buffers and narrower profit margins (Diagram 2.5). For household borrowers under both AS1 and AS2, low-income household borrowers form the largest share of those projected to default, consistent with their lower financial buffers (Chart 2.25). Middle-income borrowers, however, drive the largest share of household impairments in value terms commensurate with the larger loan amounts when compared to lower-income defaulters.
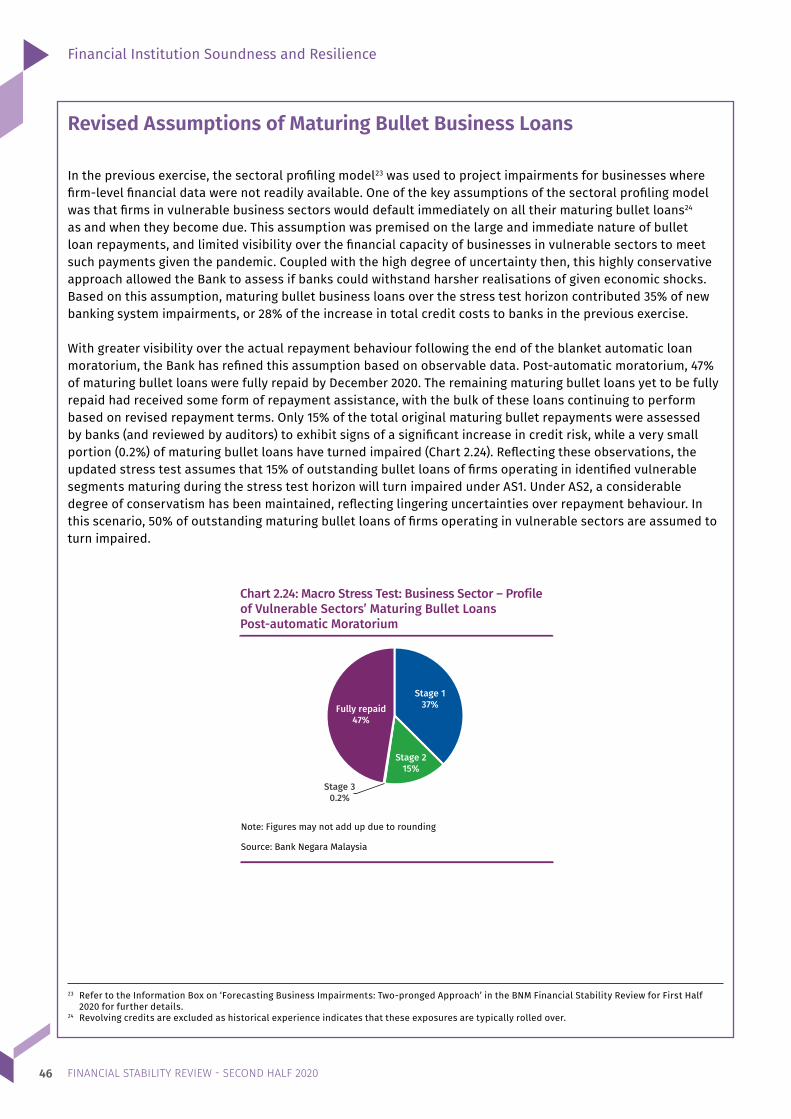
Financial Institution Soundness and Resilience
46 FINANCIAL STABILITY REVIEW - SECOND HALF 2020
23 Refer to the Information Box on ‘Forecasting Business Impairments: Two-pronged Approach’ in the BNM Financial Stability Review for First Half 2020 for further details.
24 Revolving credits are excluded as historical experience indicates that these exposures are typically rolled over.
Revised Assumptions of Maturing Bullet Business Loans
In the previous exercise, the sectoral profiling model23 was used to project impairments for businesses where firm-level financial data were not readily available. One of the key assumptions of the sectoral profiling model was that firms in vulnerable business sectors would default immediately on all their maturing bullet loans24 as and when they become due. This assumption was premised on the large and immediate nature of bullet loan repayments, and limited visibility over the financial capacity of businesses in vulnerable sectors to meet such payments given the pandemic. Coupled with the high degree of uncertainty then, this highly conservative approach allowed the Bank to assess if banks could withstand harsher realisations of given economic shocks. Based on this assumption, maturing bullet business loans over the stress test horizon contributed 35% of new banking system impairments, or 28% of the increase in total credit costs to banks in the previous exercise.
With greater visibility over the actual repayment behaviour following the end of the blanket automatic loan moratorium, the Bank has refined this assumption based on observable data. Post-automatic moratorium, 47% of maturing bullet loans were fully repaid by December 2020. The remaining maturing bullet loans yet to be fully repaid had received some form of repayment assistance, with the bulk of these loans continuing to perform based on revised repayment terms. Only 15% of the total original maturing bullet repayments were assessed by banks (and reviewed by auditors) to exhibit signs of a significant increase in credit risk, while a very small portion (0.2%) of maturing bullet loans have turned impaired (Chart 2.24). Reflecting these observations, the updated stress test assumes that 15% of outstanding bullet loans of firms operating in identified vulnerable segments maturing during the stress test horizon will turn impaired under AS1. Under AS2, a considerable degree of conservatism has been maintained, reflecting lingering uncertainties over repayment behaviour. In this scenario, 50% of outstanding maturing bullet loans of firms operating in vulnerable sectors are assumed to turn impaired.
Stage 137%
Stage 215%
Stage 30.2%
Fully repaid47%
Chart 2.24: Macro Stress Test: Business Sector – Profileof Vulnerable Sectors’ Maturing Bullet LoansPost-automatic Moratorium
Source: Bank Negara Malaysia
Note: Figures may not add up due to rounding

Financial Institution Soundness and Resilience
47FINANCIAL STABILITY REVIEW - SECOND HALF 2020
Source: Bank Negara Malaysia
Diagram 2.5: Macro Stress Test: Business Sector – Impairment Profile Under Adverse Scenario 2
Non-SMEs(Cashflow Deficit Model)
51%
SMEs(Sectoral Profiling Model)
49%
83% Of the additional impairmentsare from the vulnerable sectors
Of total non-SME loans 10%
Share of business impairments as at end-2022
4%
<3 3-5 5-10 >10
Share ofHousehold
Defaults(Number ofBorrowers)
Monthly Income (RM ‘000)
Share ofHousehold
Impairments (RM Value)
Source: Bank Negara Malaysia
Chart 2.25: Macro Stress Test: Household Sector —Impairment Profile Under Adverse Scenario 2
33%
39%24%
4%17%
31%37%
16%
Note: Figures may not add up due to rounding
Credit costs under the stress scenarios are projected to amount to RM19.3 billion and RM26.2 billion (or 1% and 1.5% of total loans) for AS1 and AS2, respectively, over the two-year horizon (Chart 2.26). Banks are expected to be adequately buffered against potential credit losses, having already bolstered provisions significantly in 2020 based on banks’ internal stress tests (refer to the Banking Sector section in this chapter for further information). Banks are also projected to experience lower net interest income due to higher funding costs following sovereign
rating downgrades and weaker credit growth, although higher credit costs remain the main driver of the impact on banks’ solvency positions. At the end of the stress test horizon, the banking system’s capital ratio is projected to remain comfortably above the regulatory minimum, including the capital conservation buffers (Chart 2.27). Excess capital buffers are projected to decline by RM6.3 billion and RM9.8 billion under AS1 and AS2, respectively.
For insurers, the latest macro solvency stress test adopts the same adverse scenarios described earlier and additionally incorporates (i) COVID-19-related ex-gratia payments given to policyholders and higher claims for insurers without a pandemic exclusion clause, and (ii) a conservative increase in the general claims ratio by up to 17%.25 Under both AS1 and AS2, the insurance sector is assessed to maintain aggregate CAR above the regulatory minimum (Chart 2.28), with capital buffers declining by RM11 billion under AS2. Market risk shocks remain the largest loss driver for life insurers under both scenarios. Meanwhile, general insurers are expected to see lower capitalisation, particularly in AS2, driven by higher claims for the motor and fire segments, and assumed reinsurance defaults (Chart 2.29). The solvency stress test exercise is supplemented with a liquidity assessment to gauge the ability of life insurers to honour expected short-term net outflows under stressed conditions,
25 The average claims ratio during 2018-2019 was 59%. During the Asian Financial Crisis, the claims ratio was observed to rise by 17% to 69%.

Financial Institution Soundness and Resilience
48 FINANCIAL STABILITY REVIEW - SECOND HALF 2020
including potentially higher surrenders and COVID-19-related claims. The liquidity assessment affirmed that all life insurers have sufficient liquid assets26 to fulfil these obligations.
While the overall financial system is expected to remain resilient under both simulated adverse
scenarios, heightened risk aversion by financial institutions given the uncertain and still-evolving pandemic situation could weigh on economic growth and recovery prospects. This in turn could increase risks to financial stability from more severe economic scarring. Such pro-cyclical behaviour could arise if banks are reluctant to draw down on their capital buffers despite the regulatory flexibilities accorded. The strong buffers of banks
30%
37%
29%Households:
RM12.4 bil (48%)
Construction
Mining & quarrying
Transport, storage & communication
Real estate
Manufacturing
Primary agriculture
Wholesale & retail trade, restaurants & hotels
Financial & insurance/takaful activities
Others
Residential properties Cars
Unsecured financing Securities
Others
30%
16%32%
3%4%
12%
SMEs: RM3.9 bil
(15%)
Non-SMEs: RM9.8 bil
(38%)
8% 9%
9%
25%
7%
36%
Chart 2.26: Macro Stress Test: Banking System ‒ Drivers of Cumulative Credit Losses Under Adverse Scenario 2
Cumulative credit losses (2021p + 2022p): RM26.2 bil
p Projected
Note: 1. (...) refers to % of overall cumulative credit costs 2. Figures may not add up due to rounding
Source: Bank Negara Malaysia
Chart 2.27: Macro Stress Test: Banking System ‒Capital Ratios Under Adverse Scenarios 1 and 2
Source: Bank Negara Malaysia
18.518.3
17.0
18.3
16.8
16
17
18
19
20
Dec '20 Dec '21p Dec '22p
Adverse Scenario 1 Adverse Scenario 2
%
p Projected
Total capital ratio
14.8 14.8
14.114.7
13.9
12
13
14
15
16
Dec '20 Dec '21p Dec '22p
%
Common Equity Tier 1 capital ratio
Chart 2.28: Macro Stress Test: Insurance Sector - Capital Adequacy Ratio Under Adverse Scenario 2
Source: Bank Negara Malaysia
157
269203
287
Life Insurers General Insurers
%
0
50
100
150
200
250
300
Post-shock CAR as at end-2022
Initial CAR
26 Refers to cash and deposits, and MGS.

Financial Institution Soundness and Resilience
49FINANCIAL STABILITY REVIEW - SECOND HALF 2020
remain important to mitigate this risk. Other factors that would reduce the resulting impact from the adverse economic shocks assumed under the stress tests include:• Proactivemanagementactionsbyfinancial
institutions to shore up buffers through earnings retention strategies, new capital issuances, or capital injections from parent institution(s);
• Continuedinitiativesfromfinancialinstitutions to offer short-term repayment assistance to viable borrowers, which would serve to rehabilitate and maximise the long-term viability of loans that are otherwise projected to turn impaired in the short term;
• Curesandrecoveriesbybanksafterloansturn impaired; and
• AdditionalpolicyinterventionsbytheBank,Government and/or other authorities to support the economy.
Chart 2.29: Macro Stress Test: Insurance Sector - LossDrivers Under Adverse Scenario 2
Source: Bank Negara Malaysia
Note: Figures may not add up due to rounding
52%34%
10%5%
Life Insurers
Increase in liabilities valuation
42%
40%
14%
3%
General Insurers
Reinsurance defaults
Increase in general insurancecapital charges
Operating loss
Increase in life insurancecapital charges
COVID-19-related claims
Others Others

Financial Institution Soundness and Resilience
50 FINANCIAL STABILITY REVIEW - SECOND HALF 2020

Annex
51FINANCIAL STABILITY REVIEW - SECOND HALF 2020
Annex

Annex
52 FINANCIAL STABILITY REVIEW - SECOND HALF 2020
Annex
Key Financial Soundness Indicators
As at end1H 2018 2H 2018 1H 2019 2H 2019 1H 2020 2H 2020p
% (or otherwise stated)
Banking SystemTotal Capital RatioTier 1 Capital RatioCommon Equity Tier 1 Capital RatioReturn on AssetsReturn on EquityLiquidity Coverage RatioNet Impaired Loans RatioCapital Charge on Interest Rate Risk in the Trading Book to Capital Base
FX Net Open Position to Capital BaseEquity Holdings to Capital Base
17.614.213.41.5
13.3139.3
0.9
1.15.00.6
18.114.613.91.4
12.7143.2
0.9
1.15.50.9
18.014.714.0
1.513.0
153.01.0
1.14.90.7
18.615.114.6
1.513.0
149.11.0
1.24.41.6
18.315.114.6
1.210.0
149.20.9
1.24.91.3
18.515.314.8
1.19.2
148.21.0
1.15.31.5
Insurance and Takaful SectorCapital Adequacy RatioLife Insurance and Family Takaful
Excess Income over Outgo (RM billion)New Business Premium / Contribution (RM billion)
Capital Adequacy RatioGeneral Insurance and General Takaful
Underwriting Profi t (RM billion)Operating Profi t (RM billion)Gross Direct Premium / Contribution (RM billion)
Claims Ratio Capital Adequacy Ratio
238.7
2.9
8.2237.9
0.71.3
10.257.9
262.5
243.9
6.6
7.6234.8
0.81.6
9.958.2
278.3
230.0
16.5
9.7213.2
0.51.4
10.659.3
273.2
226.9
7.7
9.0206.2
0.61.5
10.259.1
279.8
227.1
4.7
9.0210.6
0.91.7
10.355.9
287.1
219.7
16.8
9.9203.5
0.81.7
10.554.6
282.6
Household (HH) SectorHH Debt (RM billion)HH Financial Assets (RM billion)HH Debt-to-GDP RatioHH Financial Assets-to-Total HH Debt RatioHH Liquid Financial Assets-to-Total HHDebt Ratio
Impaired Loans Ratio of HH Sector1
1,156.82,462.5
82.1212.9
145.41.3
1,186.72,543.5
82.0214.3
143.41.2
1,217.72,627.6
82.3215.8
145.61.2
1,251.82,708.8
82.9216.4
143.21.2
1,265.92,751.9
87.5217.4
143.81.0
1,320.62,905.7
93.3220.0
145.51.1
Business Sector2
Return on AssetsReturn on EquityDebt-to-Equity RatioInterest Coverage Ratio (times)Operating MarginImpaired Loans Ratio of Business Sector
2.23.9
23.56.16.42.6
1.63.0
24.94.95.62.4
1.52.8
25.14.85.72.6
1.53.0
25.54.85.72.5
0.81.6
24.23.95.02.5
1.01.9
23.44.14.72.6
Development Financial Institutions3
Lending to Targeted Sectors (% change)Deposits Mobilised (% change)Impaired Loans RatioReturn on Assets
-1.91.36.01.2
-0.30.45.81.5
0.41.86.71.5
-0.32.56.41.5
3.92.05.91.1
7.76.65.11.1
1 Refers to both banks and non-bank fi nancial institutions2 The fi nancial performance metrics of publicly listed corporates are as at the third quarter of 20203 Refers to development fi nancial institutions under the Development Financial Institutions Act 2002p PreliminaryNote: Figures may not necessarily add up due to rounding Source: Bank Negara Malaysia, Bursa Malaysia, Department of Statistics, Malaysia, Employees Provident Fund, Securities Commission Malaysia, S&P Capital IQ and Bank Negara Malaysia estimates
Table A.1

Annex
53FINANCIAL STABILITY REVIEW - SECOND HALF 2020
Annex
Key Financial Soundness Indicators
As at end1H 2018 2H 2018 1H 2019 2H 2019 1H 2020 2H 2020p
% (or otherwise stated)
Banking SystemTotal Capital RatioTier 1 Capital RatioCommon Equity Tier 1 Capital RatioReturn on AssetsReturn on EquityLiquidity Coverage RatioNet Impaired Loans RatioCapital Charge on Interest Rate Risk in the Trading Book to Capital Base
FX Net Open Position to Capital BaseEquity Holdings to Capital Base
17.614.213.41.5
13.3139.3
0.9
1.15.00.6
18.114.613.91.4
12.7143.2
0.9
1.15.50.9
18.014.714.0
1.513.0
153.01.0
1.14.90.7
18.615.114.6
1.513.0
149.11.0
1.24.41.6
18.315.114.6
1.210.0
149.20.9
1.24.91.3
18.515.314.8
1.19.2
148.21.0
1.15.31.5
Insurance and Takaful SectorCapital Adequacy RatioLife Insurance and Family Takaful
Excess Income over Outgo (RM billion)New Business Premium / Contribution (RM billion)
Capital Adequacy RatioGeneral Insurance and General Takaful
Underwriting Profi t (RM billion)Operating Profi t (RM billion)Gross Direct Premium / Contribution (RM billion)
Claims Ratio Capital Adequacy Ratio
238.7
2.9
8.2237.9
0.71.3
10.257.9
262.5
243.9
6.6
7.6234.8
0.81.6
9.958.2
278.3
230.0
16.5
9.7213.2
0.51.4
10.659.3
273.2
226.9
7.7
9.0206.2
0.61.5
10.259.1
279.8
227.1
4.7
9.0210.6
0.91.7
10.355.9
287.1
219.7
16.8
9.9203.5
0.81.7
10.554.6
282.6
Household (HH) SectorHH Debt (RM billion)HH Financial Assets (RM billion)HH Debt-to-GDP RatioHH Financial Assets-to-Total HH Debt RatioHH Liquid Financial Assets-to-Total HHDebt Ratio
Impaired Loans Ratio of HH Sector1
1,156.82,462.5
82.1212.9
145.41.3
1,186.72,543.5
82.0214.3
143.41.2
1,217.72,627.6
82.3215.8
145.61.2
1,251.82,708.8
82.9216.4
143.21.2
1,265.92,751.9
87.5217.4
143.81.0
1,320.62,905.7
93.3220.0
145.51.1
Business Sector2
Return on AssetsReturn on EquityDebt-to-Equity RatioInterest Coverage Ratio (times)Operating MarginImpaired Loans Ratio of Business Sector
2.23.9
23.56.16.42.6
1.63.0
24.94.95.62.4
1.52.8
25.14.85.72.6
1.53.0
25.54.85.72.5
0.81.6
24.23.95.02.5
1.01.9
23.44.14.72.6
Development Financial Institutions3
Lending to Targeted Sectors (% change)Deposits Mobilised (% change)Impaired Loans RatioReturn on Assets
-1.91.36.01.2
-0.30.45.81.5
0.41.86.71.5
-0.32.56.41.5
3.92.05.91.1
7.76.65.11.1
1 Refers to both banks and non-bank fi nancial institutions2 The fi nancial performance metrics of publicly listed corporates are as at the third quarter of 20203 Refers to development fi nancial institutions under the Development Financial Institutions Act 2002p PreliminaryNote: Figures may not necessarily add up due to rounding Source: Bank Negara Malaysia, Bursa Malaysia, Department of Statistics, Malaysia, Employees Provident Fund, Securities Commission Malaysia, S&P Capital IQ and Bank Negara Malaysia estimates
Table A.1

Annex
54 FINANCIAL STABILITY REVIEW - SECOND HALF 2020
Annex
55FINANCIAL STABILITY REVIEW - SECOND HALF 2020
Key Financial Indicators: Islamic Banking and Takaful Sectors
As at end1H 2018 2H 2018 1H 2019 2H 2019 1H 2020 2H 2020p
Islamic Banking System RM million (or otherwise stated)Total Assets1 890,899.8 948,518.5 979,393.3 1,020,371.0 1,041,629.6 1,090,054.8 % of total assets of entire banking system1 31.1 32.2 32.8 33.5 33.3 34.2 Total Financing1 667,179.9 701,013.7 720,748.1 753,609.9 780,376.6 817,398.2 % of total loans / fi nancing of entire banking system1 37.0 37.7 38.4 39.2 39.9 41.0
Total Deposits and Investment Accounts1 727,777.4 771,114.2 804,959.9 826,167.2 859,946.8 889,951.4 Total Deposits1 651,459.5 688,468.9 724,326.0 739,130.3 761,993.4 790,905.4 Total Investment Accounts1 76,317.9 82,645.3 80,633.9 87,036.9 97,953.4 99,046.0
% of total deposits and investment accounts ofentire banking system1 35.4 36.3 37.4 37.7 38.1 38.9
%Total Capital Ratio 17.3 18.5 17.6 18.5 18.3 18.4Tier 1 Capital Ratio 13.7 14.7 14.3 14.6 14.6 14.8Common Equity Tier 1 Capital Ratio 13.3 14.1 13.8 14.1 14.0 14.3Return on Assets 1.1 1.1 1.1 1.2 0.6 0.7Net Impaired Financing Ratio 0.8 0.8 1.0 1.0 0.9 0.9
Takaful Sector RM million (or otherwise stated)Takaful Fund Assets 29,833.6 31,323.1 34,522.0 36,517.6 39,040.1 41,329.2
Family 26,312.5 27,594.8 30,601.4 32,283.8 34,538.5 36,485.4General 3,521.1 3,728.3 3,920.6 4,233.9 4,501.6 4,843.8% of insurance and takaful industry 10.3 10.5 10.9 11.2 11.8 11.8
Net Contribution Income 4,790.0 4,770.9 5,788.3 5,542.4 5,642.8 5,986.5Family 3,671.4 3,644.0 4,456.0 4,150.9 4,336.5 4,528.6General 1,118.5 1,126.9 1,332.3 1,391.4 1,306.3 1,457.9% of insurance and takaful industry 16.8 16.4 18.9 17.7 18.6 18.2
Family TakafulNew Business Contribution 2,510.3 2,403.0 3,253.9 2,904.0 3,191.8 3,397.7
General TakafulGross Direct Contribution 1,400.4 1,388.5 1,631.3 1,677.2 1,641.2 1,817.1Claims Ratio (%) 54.5 57.4 56.6 59.5 53.3 58.0
1 Including development fi nancial institutions under the Development Financial Institutions Act 2002 p Preliminary Note: Figures may not necessarily add up due to rounding
Source: Bank Negara Malaysia
Table A.2