financial stability report 2017 - bot.or.th · 3.2 corporate bond issuance 33 ... offshore funds...
TRANSCRIPT


Financial Stability Report 2017
Financial Stability Report 2017


Financial Stability Report 2017
Message from the Governor 2017 marked a year of global economic recovery led by sustained momentum in
G3 economies, while Thai economic growth also appeared more robust and sustained than
before. Accommodative monetary conditions globally were conducive to buoyant global
stock markets and a suppressed level of financial market volatility, both of which reflected
investors’ unrelenting search for yield. Going forward, however, monetary policy normalization
in G3 economies may lead to volatile cross-border capital flows and thus continue to
warrant monitoring.
Thailand’s overall financial stability remained sound thanks to solid standings on
the external front and strong financial institutions system, as well as large corporates that
benefitted from the upturn of the economy. But attention should be paid on a build-up of
risks in some areas. First, debt serviceability has been low for SMEs in certain industries
and low-income households, both of which have not benefitted fully from the ongoing
economic expansion. Second, the search-for-yield behavior, which has persisted in the
prolonged low interest rate environment, could lead to underpricing of risks at a broader
scale. This includes high debt accumulation among households, rising investment in risky
assets, high investment in foreign investment funds (FIFs), savings cooperatives’ growing
asset base despite having slowed down recently, as well as the underpricing of risks that
could be associated with large conglomerates’ funding and investment activities.
The year 2017 also witnessed a sweeping influence of technological advances in
reshaping consumer behaviors, ways of conducting financial transactions, and business
models. This has also brought new risks to the financial system, such as the rise in cyber
threats due to heightened activity via electronic platforms, and the speculation in
cryptocurrencies whose prices fluctuate wildly and call for investors’ understanding of the
risks involved. All these reflect challenges to regulators in striking a balance between
promoting financial innovation and preserving financial stability, so that financial
innovation could benefit the society at large in a broad-based and sustainable manner. In
2017, the Bank of Thailand devoted its efforts on developing national financial infrastructure
with an aim to enhance efficiency and access to financial services. This was achieved by
launching the PromptPay service and promoting QR codes as a means of making payments.
In addition, the regulatory sandbox was created to allow entrepreneurs to test new
innovative financial products before offering them to the general public.
The relevant regulators including the Bank of Thailand, the Office of the Securities
and Exchange Commission (SEC), and the Office of Insurance Commission (OIC) have been
assessing and monitoring financial stability risks together on a regular basis. The three
regulators have also been improving regulations to cope with emerging risks appropriately.
This Financial Stability Report has been prepared in collaboration with the SEC and the OIC
to ensure that risk assessments are done in an integrated and comprehensive manner. The
Bank of Thailand hopes that this Report will inform the general public about key developments

Financial Stability Report 2017
in the economic and financial system, together with their impact on financial stability. This
will prove useful for all parties in assessing risks and preparing for future challenges.
Mr. Veerathai Santiprabhob
Governor
11 January 2018

Financial Stability Report 2017
Contents
Chapter 1 Introduction 1 Chapter 2 Recent developments in global and Thai economies and their implications on Thailand’s financial stability 5
2.1 Global economic developments and Thailand’s external stability 6 2.2 Business sector 9 2.3 Real estate sector 12 2.4 Household sector 16 2.5 Financial institutions sector 21 Box 1: Measuring interconnectedness between business and banking sectors using CoVaR and Diebold-Yilmaz methods 26
Chapter 3 The search-for-yield behavior leading to underpricing of risks 29
3.1 Thai financial markets 30 3.2 Corporate bond issuance 33 3.3 Mutual funds 35 3.4 Savings cooperatives 37 3.5 Insurance businesses 39 Box 2: Lessons from corporate bond defaults and policy implications by the Office of the Securities and Exchange Commission (SEC) 41 Box 3: Insurance businesses in the low-for-long environment by the Office of Insurance Commission (OIC) 45
Chapter 4 Key supervisory developments and safeguarding financial stability
going forward 47 Box 4: Cryptocurrencies and implications on Thailand’s financial stability 55
Annex Thai financial system 58


Financial Stability Report 2017 | 1
Chapter 1: Introduction Thailand’s overall financial stability remained sound. Thai and global economies’
more sustained growth trajectory in 2017 helped strengthen businesses’ financial positions, especially those of large corporates and firms relying on export revenue. Meanwhile, financial institutions maintained high levels of provisions and capital buffers, which served to cushion against the deterioration in loan quality of some borrower groups. These included small and medium enterprises (SMEs) and low-income households, both of which had not yet benefitted fully from the ongoing economic expansion. On the external front, solid standings on external debt, current accounts, and international reserves could provide cushion against spillovers from external risk factors in the periods ahead.
The search-for-yield behavior continued to persist amid the prevailing low interest rate environment. This was reflected in institutional investors’ investment in risky assets to satisfy clients’ demand for returns, as well as investment in foreign investment funds (FIFs) that remained elevated and was concentrated in some countries. Meanwhile, unrated bond issuance and accredited investor mutual funds, which surged in 2016, slowed down following defaults by some bond issuers. Therefore, investors must pay close attention to assessing risks of the products that they invest in, so as to prevent underpricing of risks. In addition, the search-for-yield through savings cooperatives continued. Growth of savings cooperatives’ assets and deposits slowed a little from the years before, but remained high overall. The linkages between the savings cooperatives system and the overall financial system, through both money and capital markets, had also grown stronger.
Going forward, risks in certain areas could have implications on Thailand’s financial stability and continue to warrant monitoring. These include debt serviceability of SMEs and certain groups of households, risks related to savings cooperatives, as well as the search for yield in the low interest rate environment, which could lead to widespread underpricing of risks and a build-up of vulnerabilities in the financial system.
1. Although domestic growth gained traction more visibly in 2017, the benefits of the recovery were not broadly distributed to all economic sectors. Financial positions of SMEs and low-income households, in particular, remained fragile. Meanwhile, the financial institutions sector showed strength, partly due to effective cost management. The real estate sector improved overall, but risks from oversupply need to be monitored in the periods ahead.
During the past year, businesses benefitted from more sustained expansion in Thai and global economies. Key beneficiaries were large corporates and businesses relying on revenue from exports of merchandise and services. However, some SMEs continued to have weak financial positions and risk defaulting on their debt. These included SMEs in the trade, manufacturing, service, real estate, and construction sectors, whose ratio of non-performing loan (NPL) to total loan continued to rise. Part of their problems stemmed from structural factors, which made their current business models uncompetitive. Meanwhile, the real estate sector saw an overall improvement from 2016, as demand for housing improved in line with economic conditions and supply growth. House prices rose gradually, while the markets for office and retail spaces continued to expand. Risks from oversupply in certain locations continue to warrant monitoring in the periods ahead, as well as the

2 | Financial Stability Report 2017
ongoing rush in investment in mixed-use projects, which could lead to a surge in oversupply should demand do not rise accordingly.
Household debt remained at an elevated level. While the ratio of household debt to GDP appeared to be on a mild downward trend (i.e. deleveraging), the improvement came solely from households in certain income groups and regions. Indeed, households’ capacity to withstand shocks seemed to diminish, especially for low-income households. This was reflected in the higher ratio of households’ debt to their financial assets, as well as the debt serviceability of low-income households that had not improved materially.
The unevenness of the ongoing economic expansion was also reflected in diverging developments in loan quality across business sectors. More specifically, the quality of loans extended to export-oriented and tourism businesses began to improve cyclically in tandem with economic conditions. On the other hand, structural factors seemed to weigh on recovery in loan quality of some businesses, especially SMEs in certain sectors that faced competitiveness issues.
2. The search-for-yield behavior persisted amid the prolonged low interest rate environment, which could lead to underpricing of risks. Investment in FIFs remained at an elevated level, while unrated bond issuance dropped following defaults by some issuers. Savings cooperatives continued to grow rapidly and became more integrated with the overall financial system.
Offshore funds continued to flow into emerging markets including Thailand, partly driven by improved sentiment in global financial markets, as well as the expectation that monetary policy normalization in G3 economies would remain gradual. Given the stream of capital inflows and market’s anticipation of a weaker US dollar, the Thai baht appreciated against the US dollar, broadly in line with other regional currencies. The SET Index advanced since late August 2017, partly attributable to improved economic outlook and investors’ abated concerns over domestic political situations. At present, risks from overheating in the stock market are assessed to be limited, as indicated by the price-to-earnings (P/E) ratio that stayed close to its historical average and not lofty compared to P/E ratios of regional stock markets. Meanwhile, short-term bond yields dropped and stayed below the policy rate, particularly in July 2017, mainly due to bond supply. This prompted some investors to switch to higher-yielding assets, such as FIFs especially those focusing on fixed-income securities. Investors also increased holdings of long-term bonds so as to lengthen portfolio duration.
Corporate bond issuance slowed down following default incidents of some issuers. This impaired market sentiment especially in the unrated bond segment, where unrated bond outstanding plunged from the end of 2016. Most default cases stemmed from company-specific problems, such as financial losses, conflicts among shareholders, and corporate governance issues. The spillover to the financial system at large, however, has been limited, as the total defaulted amount was not that large. Besides, investors started to get better at differentiating risks of individual issues. The Office of the Securities and Exchange Commission (SEC) has been monitoring the situation closely, and is in the process of improving regulations in several aspects so as to enhance product offering and underwriting standards, responsibilities of arrangers, as well as investor protection.

Financial Stability Report 2017 | 3
Mutual fund businesses recorded robust growth, with high volume of investment in FIFs, which reflected investors’ search for yield abroad as domestic short-term interest rates stayed low. Meanwhile, significant structural shifts were observed for the term fund business. The size of term funds for accredited investors (AI) declined sharply following unrated bond default incidents. And to replace AI term funds, term funds for retail investors with focus on foreign investment were offered instead. In addition, considering the entire mutual fund industry, investment in debt securities and deposits was concentrated in some countries. Such concentration risks could accumulate to the point that has systemic risk implications in the future.
Life insurance companies continued to increase their investment abroad, while investment in lower-rated bonds accounted for a greater proportion of total investment. Similarly, non-life insurance companies also invested more in higher-yielding assets to seek higher returns. The prolonged low interest rate environment affected insurance companies especially the life insurance sector, given that most life insurance policies have long coverage periods along with guaranteed returns. Life insurance companies were thus pressured to adjust both their product offerings and investment strategies to facilitate better asset-liability management.
Savings cooperatives’ assets continued to expand from both deposits and shares raised from cooperatives’ members. While asset growth remained rapid overall, it slowed a little from the years before. This was partly due to related regulators’ collaboration in improving regulations to strengthen the supervisory standard to a more appropriate level. In the meantime, many savings cooperatives invested their excess liquidity in bonds and stocks to seek additional returns, which also made the savings cooperatives system more integrated with the overall financial system. Furthermore, risks started to accumulate in the savings cooperatives system as many cooperatives faced similar management problems. For example: (1) there seemed to be a lenient practice of assisting borrowers by allowing debt rollover. (2) Borrowers’ risks were likely to be underestimated, given that most savings cooperatives are not members of the National Credit Bureau and thus unaware of borrowers’ total debt obligations. (3) Lastly, in funding long-term loans given to members, savings cooperatives often relied on short-term borrowings from financial institutions and fellow savings cooperatives, given that short-term borrowings were less costly than long-term ones. Such practice gave rise to maturity mismatch, which could add to liquidity risks. Indeed, a financial or liquidity issue in any single savings cooperative, especially a large one, could impair the public’s confidence in the savings cooperatives system. Thus, it is necessary to quickly upgrade the legal framework and the surveillance process for savings cooperatives, so as to ensure that they have proper risk management systems and good governance, and that their operations are in alignment with the underlying philosophy of cooperatives.

4 | Financial Stability Report 2017
3. Key supervisory developments and policies to safeguard financial stability. In 2017, the Bank of Thailand and relevant regulators collaborated to upgrade various aspects of the financial system surveillance process, encompassing the household sector, the financial institutions sector, and the cooperatives system. Key developments were as follows: (1) The prudential measure on credit card loans and personal loans under regulation was issued to moderate household debt problems and mitigate risks that financially fragile households would over-leverage beyond their ability to service debt. (2) The regulation on supervision of domestic systemically important banks (D-SIBs) was implemented to safeguard their strength and ensure that they could continue to provide financial services in stress times. (3) The law on supervision of the payment systems was upgraded, with the enactment of the Payment Systems Act, B.E. 2560 (2017) driven by the Bank of Thailand and the Ministry of Finance. The primary purposes of the law are to promote efficiency in the payment systems, expand the law’s coverage to include the entire payment systems, and upgrade Thai payment systems to be on par with the international standards. (4) The supervision process of the cooperatives system was upgraded. The Cooperative Promotion Department, the Cooperative Auditing Department, the Fiscal Policy Office, and Bank of Thailand collaborated in reforming the management and supervision of savings cooperatives and credit union cooperatives. Recent major progresses included the issuance of regulation on cooperatives’ borrowing limit and the development of supervisory database. In addition, the Office of the Council of State is in the process of amending the draft of the Cooperatives Act to upgrade the supervisory standards for cooperatives
In summary, Thailand’s financial system stability remains sound, but there are risks in certain areas that could add to vulnerabilities and thus continue to warrant monitoring. (1) For some SMEs, debt serviceability continues to deteriorate, partly due to structural factors and changes in business models that erode the competitiveness of SMEs in some industries. (2) Low-income households and households owning SMEs are more vulnerable than other household groups, given that both groups are highly leveraged and their incomes have not recovered materially. Defaults on mortgage loans also need to be monitored. (3) For the real estate sector, risks that should be monitored include oversupply conditions especially for condominiums in certain areas, as well as the possibility that the acceleration in investment in mixed-use projects could affect the markets for office and retail spaces. Lastly, (4) the search-for-yield behavior persists in the low interest rate environment. This includes concentration risks from investment in FIFs, savings cooperatives’ rapid growth and stronger linkages with the overall financial system, as well as the underpricing of risks associated with large business conglomerates’ funding and investment activities.

Financial Stability Report 2017 | 5
Chapter 2: Recent developments in global and Thai economies and their implications on Thailand’s financial stability
Sustained growth momentum in global and Thai economies last year benefitted Thai businesses especially the large ones. On top of this, financial institutions’ overall health strengthened and Thai external stability remained solid. But the benefits from the ongoing economic recovery were not broadly distributed to all economic sectors. More specifically, financial positions of some small and medium enterprises (SMEs) remained fragile. The household sector was still in an adjustment process and household debt remained at an elevated level, with deleveraging observed only in certain income groups and regions. Debt serviceability of businesses and households will thus continue to warrant close monitoring in the periods ahead.
Summary of key risks to Thailand’s financial stability
Impact from uneven economic recovery
- Debt serviceability of SMES, especially the smaller ones, continues to deteriorate, with high level of debt at risk. This includes SMEs in the trade, manufacturing, services, real estate, and construction sectors.
- Deleveraging is observed only in some groups of households. Low-income households and households owning SMEs are particularly vulnerable, given their high debt and still-recovering income.
- Oversupply of condominiums in some locations continues to rise, while oversupply in office and retail spaces could pick up in the future due to new mixed-use projects.
Risks to monitor going forward
- Defaults could rise in some groups of SMEs, especially for smaller businesses with limited ability to generate revenue. These include businesses in the trade, manufacturing, services, and construction sectors, whose loan quality continues to deteriorate.
- For households, debt burden stays elevated while their ability to service debt has not improved materially. The household sector thus remains vulnerable to economic shocks.

6 | Financial Stability Report 2017
2.1 Global economic developments and Thailand’s external stability
The global economy continued to recover in 2017. But going forward, there remain key risks to monitor including G3’s economic and monetary policies, China’s macro-financial stability, geopolitical risks, as well as structural shifts that could weigh on the global economy’s potential output.
Thailand’s external stability remained sound. While monetary policy normalization by G3 central banks could induce capital outflows from emerging markets, the impact is assessed to be limited in Thailand’s case. This is because of Thailand’s low reliance on external debt, sustained current account surplus, and high level of international reserves, all of which help cushion against volatility in cross-border capital flows.
Global economic growth gained further traction in 2017, led by sustained recovery in G3 economies (Chart 2.1.1). Consumption expanded well in line with labor market indicators, such as robust employment, while investment started to show signs of picking up gradually. Recovery in G3 economies, in turn, also helped support recovery in Asian economies. This was reflected in Asian countries’ exports that continued to expand well, especially for electronic products. At the same time, the gradual recovery in the manufacturing sector also led to improvements in investment and consumption in Asia, with healthier signs of industrial employment seen in some countries. China’s economy grew at a rate close to that of the previous year, as the export and manufacturing sectors improved with the global economy. However, structural reform measures and prudential measures aimed at the real estate sector started to weigh on real
economic activities more visibly, as seen in investment that started to subside.
Going forward, global economic growth is assessed to be gradual, with sustained momentum in G3 and Asian economies (excluding China). Economic growth in China, however, is expected to decelerate amid the ongoing economic and financial reforms. Key risks to monitor are as follows:
1. The US foreign trade policy gearing toward protectionism. Although no concrete measure has been issued so far, the prospect of such trade measure has repeatedly worried businesses and investors. But recently, the US appeared less insistent and more inclined toward using bilateral negotiations and imposing trade measures only on certain product categories and trading partners. Still, the prospect of such trade measure remains, and this continues to weigh on trading and investment activities of US trading partners including Thailand.
2. The repercussions of monetary policy normalization by G3 central banks, with key actions including the policy rate hike and balance sheet reduction by the Federal Reserve and the reduction in asset purchases by the European Central Bank (ECB). All these are milestones that could have implications on cross-border capital flows and financial stability in emerging market (EM) economies. This is
Chart 2.1.1 Economic growth in different regions
Source: CEIC.
0
1
2
3
4
5
6
7
8
Euro area U.S. Japan Asia(excluding China)
China
2015 2016 Q1/2017 Q2/2017 Q3/2017
(excluding China)
% YoY
Financial Stability Report 2017 | 7
particularly crucial in the context where vulnerabilities have built up in EM economies over the post-crisis years of low interest rates. More specifically: (1) Capitals continued to flow into EMs in the recent years, which were attributable to both investors’ search for yield in the low-rate environment and improved growth prospects in EMs. Such inflows played a role in suppressing bond yields in many countries below normal levels and supporting buoyant asset valuation. Also, (2) non-financial firms had increased their leverage throughout the low-rate years, thereby becoming more sensitive to changes in interest rates. Should the normalization process in G3 countries happen faster than anticipated, capital outflows from EMs could be abrupt and this might affect EMs in several ways. Against the backdrop of such outflows, EM currencies could depreciate, asset prices could correct sharply, and bond yield could decompress quickly from the current lower-than-normal rates, which could lead to higher borrowing costs for businesses. The impact would likely vary across EM countries depending on their respective macro-financial strengths.
3. Risks to China’s macro-financial stability, arising from corporates’ high debt burden as well as shadow banks’ growth and increasing role in the financial system. In 2017, Chinese authorities imposed several prudential measures to control risks in the financial system. And to this end, governmental agencies, both central and local, and financial institutions regulators collaborated in monitoring risks to the financial system more closely and in a wider scope. At the same time, Chinese authorities continued to engineer a more balanced economic growth with a decreasing role of investment. This has resulted in improved signs in China’s macro-financial stability.
Currently, there are several risks to China’s macro-financial system that have shown positive developments, as follows: (1) Corporate debt issues have improved, especially for state-owned enterprises’ debt that started to subside. This was a result of several measures including the signals to regulate local administrations’ expenses, the debt-to-equity swap measure, and the shutdown of companies with low potential and balance sheet problems. (2) Chinese authorities have enhanced their supervision of financial system risks to the one that is closer and in a wider scope. For instance, with regard to the supervision of shadow banks, wealth management has also been incorporated into the macroprudential assessment framework. (3) Real-estate prices especially in China’s major cities have slowed down, thanks to the measures introduced to curb speculative activity in the real estate sector since 2016 and the tighter monetary policy since early 2017. Lastly, (4) concerns on capital outflows have eased. Several factors contributed to this, including the measures to restrict capital outflows introduced in early 2017, the weakening of US dollar, as well as China’s improved growth prospect and financial stability.
4. Geopolitical risks, especially in the Korean Peninsula and the Middle East. Recent attempts made by several parties to resolve these conflicts were unsuccessful. Should the situations prolong further, a more material impact could be felt on regional economies and financial markets.
Looking ahead, global economic growth is expected to gain further traction. But there remain some key structural headwinds that could weigh on potential output and the ongoing economic expansion. This includes a

8 | Financial Stability Report 2017
move toward an ageing society, which results in a lower ratio of working-age to total population. Another is the ongoing structural changes in global trade due to the relocation of production bases back to home countries or neighboring countries of major economies, which could materially impact the outlook and the dynamics of regional economies in the future in the future.
With regard to external stability, Thailand’s standings on this front were solid and would help cushion against the potential rise in volatilities of cross-border capital flows going forward. This was reflected in external risks that were limited in all three key areas, namely (1) external debt leveraging, (2) valuation changes of external debt, and (3) foreign-currency liquidity risks. More details are discussed as follows:
1. Risks pertaining to the level of external debt leveraging were still not concerning. This was due to Thailand’s low reliance on external funding, with external debt to GDP ratio of 35.9 percent in 2017Q3 (Chart 2.1.2). This was considered low relative to the international standard 1 and lower than
the median level of EMs.
2. Risks due to valuation changes or exchange rate volatility were limited, as about one-third (31.1 percent) of the external debt was denominated in Thai baht and thus would not be affected by exchange rate movements. A closer inspection revealed that: (1) of all public sector external debt, which accounted for 17.1 percent of total external debt, more than half was hedged for exchange
1 This is in reference to the World Bank’s guidelines, which categorize concerns over external debt burden into three levels: (1) low – countries with the external debt to GDP ratio lower than 48 percent; (2) medium – countries with the external debt to GDP ratio of 48-80
rate risks; and (2) corporate sector external debt, which accounted for 45.2 percent of total external debt, had proper exchange rate risk management. Based on an analysis of the top 200 firms with highest external debt in 2017Q22, debt
obligations of firms earning revenue in Thai baht were largely hedged for exchange rate risks. In addition, over 30 percent of the debt obligations of these 200 firms belonged to firms that had both revenues and assets in foreign currencies, which could help reduce some exchange rate risks (i.e. natural hedge).
3. Thailand’s foreign-currency liquidity remained high, which helped cushion against volatile capital flows. This was evident from two metrics. (1) The current account continued to record a surplus. The current account surplus was at a high level of 11.9 percent of GDP in 2016, and was projected to be in the range of 9-11 percent of GDP 3 in the periods ahead, which could help reduce risks to the overall financial system if capital flights were to occur. (2) Thai international reserves remained high. The international reserves stood at 199 billion US dollars in 2017Q3, or at a ratio
percent; and (3) high – countries with the external debt to GDP ratio higher than 80 percent. 2 53 percent of total corporate sector external debt was concentrated among the top 200 firms with highest external debt. 3 Monetary Policy Report, December 2017.
Chart 2.1.2 Thailand’s external debt by currency and the ratio of external debt to GDP
Source: Bank of Thailand.
0510152025303540
0%
25%
50%
75%
100%
20
05
20
06
20
07
20
08
20
09
20
10
20
11
20
12
20
13
20
14
20
15
20
16
Q1
Q2
Q3
2017
USD JPY THB EUR Other External Debt/GDP (RHS)
% GDP
Financial Stability Report 2017 | 9
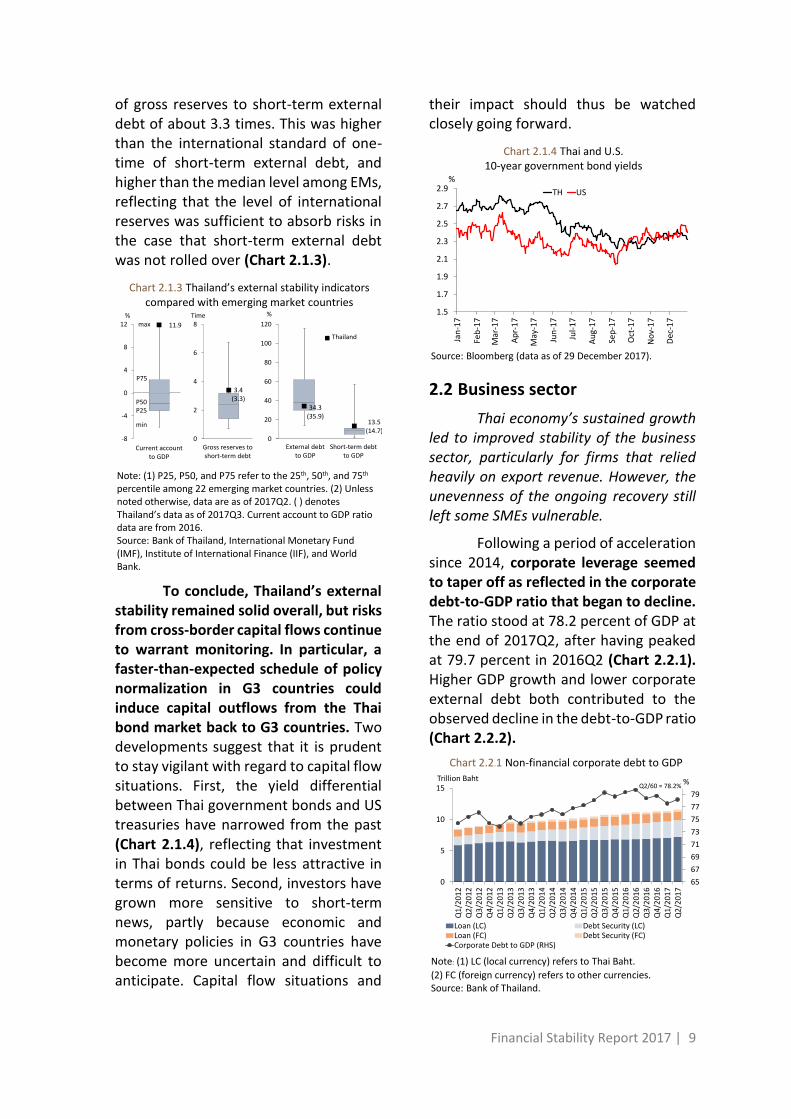
of gross reserves to short-term external debt of about 3.3 times. This was higher than the international standard of one-time of short-term external debt, and higher than the median level among EMs, reflecting that the level of international reserves was sufficient to absorb risks in the case that short-term external debt was not rolled over (Chart 2.1.3).
To conclude, Thailand’s external stability remained solid overall, but risks from cross-border capital flows continue to warrant monitoring. In particular, a faster-than-expected schedule of policy normalization in G3 countries could induce capital outflows from the Thai bond market back to G3 countries. Two developments suggest that it is prudent to stay vigilant with regard to capital flow situations. First, the yield differential between Thai government bonds and US treasuries have narrowed from the past (Chart 2.1.4), reflecting that investment in Thai bonds could be less attractive in terms of returns. Second, investors have grown more sensitive to short-term news, partly because economic and monetary policies in G3 countries have become more uncertain and difficult to anticipate. Capital flow situations and
their impact should thus be watched closely going forward.
2.2 Business sector
Thai economy’s sustained growth led to improved stability of the business sector, particularly for firms that relied heavily on export revenue. However, the unevenness of the ongoing recovery still left some SMEs vulnerable.
Following a period of acceleration since 2014, corporate leverage seemed to taper off as reflected in the corporate debt-to-GDP ratio that began to decline. The ratio stood at 78.2 percent of GDP at the end of 2017Q2, after having peaked at 79.7 percent in 2016Q2 (Chart 2.2.1). Higher GDP growth and lower corporate external debt both contributed to the observed decline in the debt-to-GDP ratio (Chart 2.2.2).
Chart 2.1.3 Thailand’s external stability indicators compared with emerging market countries
Note: (1) P25, P50, and P75 refer to the 25th, 50th, and 75th percentile among 22 emerging market countries. (2) Unless noted otherwise, data are as of 2017Q2. ( ) denotes Thailand’s data as of 2017Q3. Current account to GDP ratio data are from 2016. Source: Bank of Thailand, International Monetary Fund (IMF), Institute of International Finance (IIF), and World Bank.
13.5(14.7)
Short-term debtto GDP
34.3(35.9)
0
20
40
60
80
100
120
External debtto GDP
%
3.4(3.3)
0
2
4
6
8
Gross reserves to short-term debt
Time
11.9
-8
-4
0
4
8
12
Current accountto GDP
%
P75
P50P25
max
min
Thailand
Chart 2.1.4 Thai and U.S. 10-year government bond yields
Source: Bloomberg (data as of 29 December 2017).
1.5
1.7
1.9
2.1
2.3
2.5
2.7
2.9
Jan
-17
Feb
-17
Mar
-17
Ap
r-1
7
May
-17
Jun
-17
Jul-
17
Au
g-1
7
Sep
-17
Oct
-17
No
v-1
7
Dec
-17
TH US
%
Chart 2.2.1 Non-financial corporate debt to GDP
Note: (1) LC (local currency) refers to Thai Baht.
(2) FC (foreign currency) refers to other currencies. Source: Bank of Thailand.
65
67
69
71
73
75
77
79
0
5
10
15
Q1
/20
12
Q2
/20
12
Q3
/20
12
Q4
/20
12
Q1
/20
13
Q2
/20
13
Q3
/20
13
Q4
/20
13
Q1
/20
14
Q2
/20
14
Q3
/20
14
Q4
/20
14
Q1
/20
15
Q2
/20
15
Q3
/20
15
Q4
/20
15
Q1
/20
16
Q2
/20
16
Q3
/20
16
Q4
/20
16
Q1
/20
17
Q2
/20
17
Loan (LC) Debt Security (LC)Loan (FC) Debt Security (FC)Corporate Debt to GDP (RHS)
Trillion BahtQ2/60 = 78.2%
%

10 | Financial Stability Report 2017
Financial positions of companies listed in the Stock Exchange of Thailand (SET) were sound overall. Their ability to generate revenues and profits was rather high, as indicated by an improvement in operating profit margin (OPM) in 2017Q3. At the same time, asset turnover ratio (ATO) and return on asset (ROA) stayed comparable to the end of 2016 (Chart 2.2.3).
Meanwhile, liquidity risks and maturity mismatches between the assets and liabilities of listed firms did not pose a concern. The median current ratio was greater than one, indicating a sufficient level of liquidity to cover short-term debt obligations. Moreover, the ratio between current liabilities and total liabilities remained stable at 0.76 times, with a decline in the ratio observed for several sectors such as real estate and construction. This pointed toward an improvement in maturity mismatches (Chart 2.2.4).
A closer inspection at corporate profitability revealed that most of the decline in overall operating profits was contributed by small businesses with limited ability to generate revenue. However, large corporates, especially those with revenues from exports of goods and services, recorded a high level of profitability. This was consistent with recovery in the export sector that gained momentum since 2016H2 (Chart 2.2.5).
Given that the benefits from the recent economic growth have been mostly concentrated among large and export-related businesses, the risks of defaults were found mainly in SMEs. This vulnerability can be seen in the following indicators.
Chart 2.2.2 Contributions to percentage change in corporate debt to GDP
Note: *Debt creation series are calculated based on four-
quarter moving averages. Source: Bank of Thailand.
-0.50
0.25
1.00
1.75
2.50
3.25
4.00
Q1
/20
12
Q2
/20
12
Q3
/20
12
Q4
/20
12
Q1
/20
13
Q2
/20
13
Q3
/20
13
Q4
/20
13
Q1
/20
14
Q2
/20
14
Q3
/20
14
Q4
/20
14
Q1
/20
15
Q2
/20
15
Q3
/20
15
Q4
/20
15
Q1
/20
16
Q2
/20
16
Q3
/20
16
Q4
/20
16
Q1
/20
17
Q2
/20
17
RGDP Growth Deflator NGDP Growth
Debt Creation* FC Debt Creation*
% change in corporate debt to GDP, compared to previous quarter
Chart 2.2.3 Revenue generation and profitability of
listed companies, classified by asset size
Note: The 50th percentiles are presented. Firms are classified into
quintiles based on their asset size. Source: Stock Exchange of Thailand and Bank calculations.
-0.10.10.30.50.70.91.11.31.5
0
5
10
15
20
Q1
/20
16
Q3
/20
16
Q1
/20
17
Q3
/20
17
Q1
/20
16
Q3
/20
16
Q1
/20
17
Q3
/20
17
Q1
/20
16
Q3
/20
16
Q1
/20
17
Q3
/20
17
Q1
/20
16
Q3
/20
16
Q1
/20
17
Q3
/20
17
Q1
/20
16
Q3
/20
16
Q1
/20
17
Q3
/20
17
Q1
/20
16
Q3
/20
16
Q1
/20
17
Q3
/20
17
Quintile 1 Quintile 2 Quintile 3 Quintile 4 Quintile 5 Total
ROA OPM ATO (RHS)
% Time
(Smallest firm) (Largest firm)
Chart 2.2.4 The current ratio and the share of current liabilities in total liabilities of listed companies
Note: The 50th percentiles are presented. Current ratio is calculated as
the ratio of current assets to current liabilities. Source: Stock Exchange of Thailand and Bank calculations.
0.0
0.5
1.0
1.5
2.0
2.5
Q1
/20
16
Q3
/20
16
Q1
/20
17
Q3
/20
17
Q1
/20
16
Q3
/20
16
Q1
/20
17
Q3
/20
17
Q1
/20
16
Q3
/20
16
Q1
/20
17
Q3
/20
17
Q1
/20
16
Q3
/20
16
Q1
/20
17
Q3
/20
17
Q1
/20
16
Q3
/20
16
Q1
/20
17
Q3
/20
17
Q1
/20
16
Q3
/20
16
Q1
/20
17
Q3
/20
17
Q1
/20
16
Q3
/20
16
Q1
/20
17
Q3
/20
17
Q1
/20
16
Q3
/20
16
Q1
/20
17
Q3
/20
17
Current Ratio Current Liabilities/Total LiabilitiesTime

Financial Stability Report 2017 | 11
(1) The debt serviceability of small businesses deteriorated, as indicated by the decline in the median interest coverage ratio (ICR) of small businesses. Moreover, the persistently negative ICR of the 25th percentile of this group suggested that a number of small businesses continued to suffer losses (Chart 2.2.6).
(2) Limited debt serviceability of small businesses meant higher risks of defaults. This was suggested by the
increase in the ratio of debt at risk for the group of smallest firms (1st quintile) (Chart 2.2.7).
(3) The quality of credit given to SMEs worsened. In particular, credits to SMEs in the trade, manufacturing, service, real estate, and construction sectors saw a continued rise in NPL, partly as a result of structural factors and the firms’ business models. As of 2017 Q3, the ratio of non-performing loans to total loans (NPL ratio) for SMEs was at 4.6 percent (Chart 2.2.8).
Chart 2.2.5 Revenue generation and profitability of
listed companies, classified by proportion of revenue coming from exports
Note: The series presented are four-quarter moving averages of seasonally adjusted data. Source: Stock Exchange of Thailand and Bank calculations.
0
50
100
150
200
Q…
Q…
Q…
Q…
Q…
Q…
Q…
Q…
Q…
Q…
Q…
Q…
Q…
Q…
Q…
Q…
Q…
Q…
Q…
Q…
Q…
Q…
Q…
Index (Q1/2012 = 100)
020406080
100120140160180
Q1
/25
55
Q2
/25
55
Q3
/25
55
Q4
/25
55
Q1
/25
56
Q2
/25
56
Q3
/25
56
Q4
/25
56
Q1
/25
57
Q2
/25
57
Q3
/25
57
Q4
/25
57
Q1
/25
58
Q2
/25
58
Q3
/25
58
Q4
/25
58
Q1
/25
59
Q2
/25
59
Q3
/25
59
Q4
/25
59
Q1
/25
60
Q2
/25
60
Q3
/25
60
Index (Q1/2012 = 100) Return on Asset: ROA
Operating Profit Margin: OPM
Q2
/20
17
Q3
/20
17
Q2
/20
15
Q3
/20
15
Q4
/20
15
Q1
/20
16
Q2
/20
16
Q3
/20
16
Q4
/20
16
Q1
/20
17
Q4
/20
14
Q1
/20
15
Q4
/20
12
Q1
/20
13
Q2
/20
13
Q3
/20
13
Q4
/20
13
Q1
/20
14
Q2
/20
14
Q3
/20
14
Q1
/20
12
Q2
/20
12
Q3
/20
12
Export revenue < 30%
30% ≤ Export revenue ≤ 60%
Export revenue > 60%
Chart 2.2.6 Interest coverage ratio (ICR) and
debt to equity (D/E) of listed companies, classified by asset size
Note: (1) The 25th percentiles represent firms with low debt serviceability. (2) D/E ratios shown are median values. (3) Firms are classified into five quintiles based on their asset size, from smallest to largest. Source: Stock Exchange of Thailand and Bank calculations.
-0.2
0.0
0.2
0.4
0.6
0.8
1.0
1.2
1.4
-10
-5
0
5
10
15
Q1
/20
16
Q3
/20
16
Q1
/20
17
Q3
/20
17
Q1
/20
16
Q3
/20
16
Q1
/20
17
Q3
/20
17
Q1
/20
16
Q3
/20
16
Q1
/20
17
Q3
/20
17
Q1
/20
16
Q3
/20
16
Q1
/20
17
Q3
/20
17
Q1
/20
16
Q3
/20
16
Q1
/20
17
Q3
/20
17
Q1
/20
16
Q3
/20
16
Q1
/20
17
Q3
/20
17
Quintile 1 Quintile 2 Quintile 3 Quintile 4 Quintile 5 Total
ICR Percentile 25
ICR Percentile 50
D/E Percentile 50 (RHS)
Time Time
(Smallest firm) (Largest firm)
Chart 2.2.7 Debt at risk of listed companies,
classified by asset size
Note: (1) Debt at risk refers to the ratio of debt with ICR below 1.5 to total debt of non-financial listed firms in SET and mai. (2) ICR is calculated as the ratio of earnings before interest and taxes (EBIT) to total annual interest payments. Source: Stock Exchange of Thailand and Bank calculations.
39.934.8 35.0 30.8
17.5 19.1
0102030405060708090
100
Q1
/20
16
Q3
/20
16
Q1
/20
17
Q3
/20
17
Q1
/20
16
Q3
/20
16
Q1
/20
17
Q3
/20
17
Q1
/20
16
Q3
/20
16
Q1
/20
17
Q3
/20
17
Q1
/20
16
Q3
/20
16
Q1
/20
17
Q3
/20
17
Q1
/20
16
Q3
/20
16
Q1
/20
17
Q3
/20
17
Q1
/20
16
Q3
/20
16
Q1
/20
17
Q3
/20
17
Quintile 1 Quintile 2 Quintile 3 Quintile 4 Quintile 5 Total
ICR<0 0≤ICR<1.5 1.5≤ICR<5 5≤ICR<10 ICR≥10 %Debt at Risk%
(Smallest firm) (Largest firm)
Chart 2.2.8 NPL and NPL ratio of corporate loans
Note: ( ) denotes shares of total SME loans. Source: Bank of Thailand.
3.1
1.7
4.6
0
1
2
3
4
5
Q1
/20
12
Q2
/20
12
Q3
/20
12
Q4
/20
12
Q1
/20
13
Q2
/20
13
Q3
/20
13
Q4
/20
13
Q1
/20
14
Q2
/20
14
Q3
/20
14
Q4
/20
14
Q1
/20
15
Q2
/20
15
Q3
/20
15
Q4
/20
15
Q1
/20
16
Q2
/20
16
Q3
/20
16
Q4
/20
16
Q1
/20
17
Q2
/20
17
Q3
/20
17
%NPL Corporate loan %NPL Large corporate loan
%NPL SMEs loan
%NPL
Share of Non-performing loan (NPL)
6.77 6.33 7.38
4.06
5.22
012345678
020406080
100120
Q1
/20
16
Q3
/20
16
Q1
/20
17
Q3
/20
17
Q1
/20
16
Q3
/20
16
Q1
/20
17
Q3
/20
17
Q1
/20
16
Q3
/20
16
Q1
/20
17
Q3
/20
17
Q1
/20
16
Q3
/20
16
Q1
/20
17
Q3
/20
17
Q1
/20
16
Q3
/20
16
Q1
/20
17
Q3
/20
17
Commerce(29%)
Manufacturing(20%)
Construction(3%)
Services(11%)
Real estate(10%)
Tho
usa
nd
s
NPL outstanding NPL Ratio (RHS)
Billion Baht %SME loan quality classified by sector

12 | Financial Stability Report 2017
The vulnerability found in certain groups of businesses was confirmed by the stress test4, which assessed the sensitivity of debt serviceability among listed companies under stress conditions. Specifically, the stress test examined the sensitivity of debt at risk to changes in sales. The result showed that the majority of businesses could withstand a 10 percent drop in sales, but would be vulnerable under a 30 percent sales drop. However, businesses in the trade, services, and certain manufacturing sectors such as rubber and plastic appeared more vulnerable to sales shocks than others. This finding was in line with information from credit data, which indicated that firms in manufacturing and trade saw a persistent decline in credit quality, partly as a result of the still-uneven economic recovery (Chart 2.2.9).
The analysis outlined above suggested that the overall stability of the business sector was not a concern. Supporting evidence included corporate debt that trended downward, liquidity risks that were contained, and debt serviceability that was sound overall, although some fragility remained among
4 Scenarios include a 10-50 percent decline in sales, assuming interest payments to be constant.
SMEs. Going forward, a more sustained and broad-based economic expansion would further strengthen the business sector. However, volatility in the global financial market and monetary policy directions of G3 countries need to be monitored closely, for they may have a significant impact on funding costs in the financial market and borrowing costs of businesses.
With regard to large business conglomerates, although they have benefitted from the ongoing economic expansion and maintained strong financial positions, their funding and investment activities could have implications on financial stability and thus warrant monitoring. Large business conglomerates have become highly integrated with the overall financial system, particularly via their funding activities in the financial market through several channels. These include bank loan, corporate bond issuance, equity issuance, and borrowing from abroad. Indeed, corporate bond issuance picked up rather quickly over the past 2-3 years, while borrowing from banks and abroad stayed roughly flat. Another important issue that needs to be monitored is the underpricing of risks that could be associated with large conglomerates’ funding and investment activities.
2.3 Real estate sector
The real estate sector improved from 2016 both in terms of demand and supply conditions. On top of this, financial positions of large developers were robust. But going forward, some risks continue to warrant monitoring including oversupply of condominiums in certain locations, as well as the impact of the ongoing rush in
Chart 2.2.9 Stress test results
Source: Bank calculations.
0102030405060708090
100
Tota
l
Rea
l est
ate
Serv
ices
Uti
litie
s
Trad
e
Co
nst
ruct
ion
Foo
d
Ru
bb
er a
nd
pla
stic
Pet
role
um
Oth
er m
anu
fatu
rin
g
Qu
inti
le 1
Qu
inti
le 2
Qu
inti
le 3
Qu
inti
le 4
Qu
inti
le 5
Classified by sector Classified by firm size
Baseline Sales decrease by 10% Sales decrease by 20%
Sales decrease by 30% Sales decrease by 40% Sales decrease by 50%
% Debt at risk
Classified by sector Classified by size

Financial Stability Report 2017 | 13
investment in mixed-use projects5 on the oversupply conditions in office and retail spaces.
The housing market in 2017 showed a moderate improvement from the preceding year. Housing demand picked up as the economy recovered, and also partly supported by the progress in several train line extension projects. The improved demand in housing was indicated by the rise in the number of residential units in Bangkok and its vicinity that were financed by newly approved mortgage loans (Chart 2.3.1). Housing supply rose in tandem with housing demand. Initially at the beginning of 2017, developers delayed launches of new projects but focused instead on selling completed units. Later in the year, they switched to launching new projects, as shown by the rise in the number of new residential units offered in 2017H2 (Chart 2.3.2). In the meantime, financial positions of large developers were robust, as both profitability and debt serviceability of listed real estate firms improved in 2017Q3. This suggests that they have capacity to withstand shocks that could arise in the future.
5 Mixed-use real estate projects are development projects that integrate multiple uses of land or
House prices rose at a gradual pace in 2016 as land prices stabilized from the previous year (Chart 2.3.3). Despite the likely rise in housing demand with economic growth going forward, the possibility of a sharp increase in house prices is assessed to be limited. This is because the oversupply in condominiums stays elevated and banks remain cautious in giving out loans. Indeed, indicators of banks’ lending standards showed that lending standards remained tight for both buyers (post-finance) and
buildings. Most mixed-use projects involve a mixture of residential and commercial uses.
Chart 2.3.1 Residential units in Bangkok and its vicinity financed by newly approved mortgage loans
from commercial banks
Note: * This refers to six-year average (2011-2016), excluding the periods with stimulus measures (October 2011 – December 2012 and November 2015 – April 2016). Source: Bank of Thailand.
0
5
10
15
20
25
30
Q1
/20
11
Q3
/20
11
Q1
/20
12
Q3
/20
12
Q1
/20
13
Q3
/20
13
Q1
/20
14
Q3
/20
14
Q1
/20
15
Q3
/20
15
Q1
/20
16
Q3
/20
16
Q1
/20
17
Q3
/20
17
Low-rise residence
Condominium
Total
Average*
Thousand units
Chart 2.3.2 New residential units for sale in Bangkok and its vicinity
Note: * This refers to six-year average (2011-2016), excluding the flood period (2011Q3 and Q4). Source: Bank of Thailand.
0
5
10
15
20
25
30
35
40Q
1/2
01
1
Q3
/20
11
Q1
/20
12
Q3
/20
12
Q1
/20
13
Q3
/20
13
Q1
/20
14
Q3
/20
14
Q1
/20
15
Q3
/20
15
Q1
/20
16
Q3
/20
16
Q1
/20
17
Q3
/20
17
Low-rise residence
Condominium
Total
Average*
Thousand units
14 | Financial Stability Report 2017
developers (pre-finance). Furthermore, given that the rise in house prices has been slow and on a gradual path, a sharp correction in house prices is deemed unlikely.
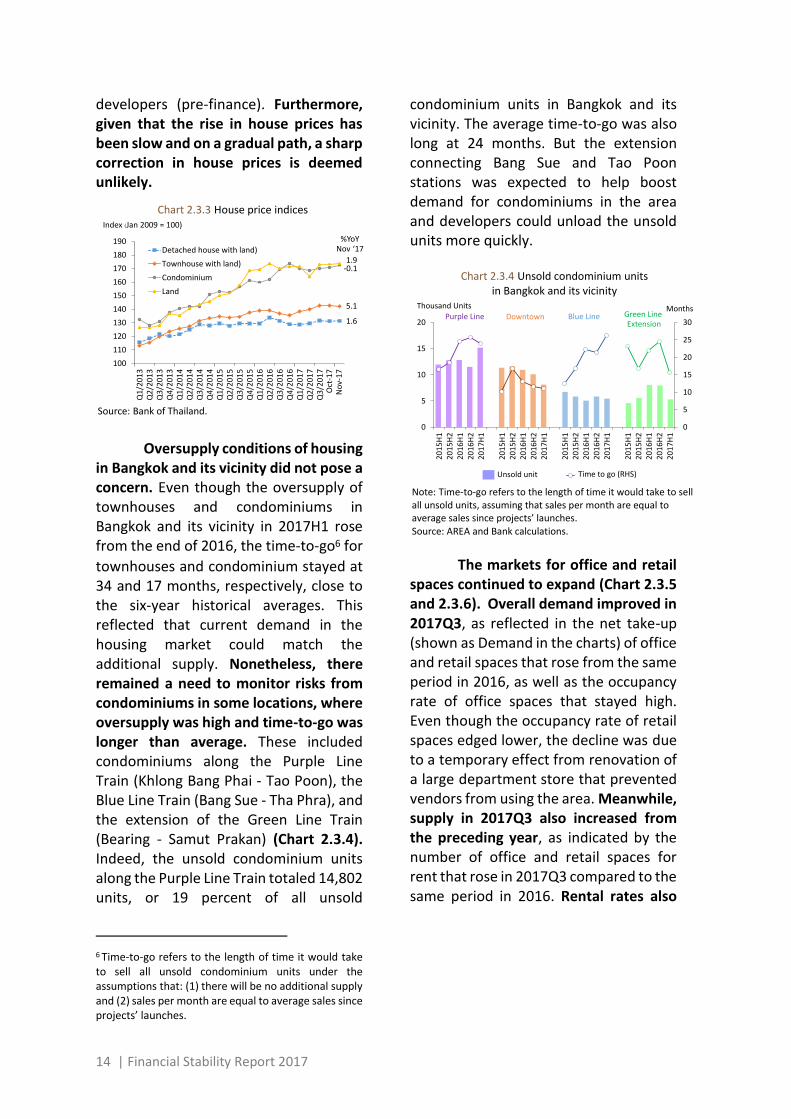
Oversupply conditions of housing in Bangkok and its vicinity did not pose a concern. Even though the oversupply of townhouses and condominiums in Bangkok and its vicinity in 2017H1 rose from the end of 2016, the time-to-go6 for
townhouses and condominium stayed at 34 and 17 months, respectively, close to the six-year historical averages. This reflected that current demand in the housing market could match the additional supply. Nonetheless, there remained a need to monitor risks from condominiums in some locations, where oversupply was high and time-to-go was longer than average. These included condominiums along the Purple Line Train (Khlong Bang Phai - Tao Poon), the Blue Line Train (Bang Sue - Tha Phra), and the extension of the Green Line Train (Bearing - Samut Prakan) (Chart 2.3.4). Indeed, the unsold condominium units along the Purple Line Train totaled 14,802 units, or 19 percent of all unsold
6 Time-to-go refers to the length of time it would take to sell all unsold condominium units under the assumptions that: (1) there will be no additional supply and (2) sales per month are equal to average sales since projects’ launches.
condominium units in Bangkok and its vicinity. The average time-to-go was also long at 24 months. But the extension connecting Bang Sue and Tao Poon stations was expected to help boost demand for condominiums in the area and developers could unload the unsold units more quickly.
The markets for office and retail spaces continued to expand (Chart 2.3.5 and 2.3.6). Overall demand improved in 2017Q3, as reflected in the net take-up (shown as Demand in the charts) of office and retail spaces that rose from the same period in 2016, as well as the occupancy rate of office spaces that stayed high. Even though the occupancy rate of retail spaces edged lower, the decline was due to a temporary effect from renovation of a large department store that prevented vendors from using the area. Meanwhile, supply in 2017Q3 also increased from the preceding year, as indicated by the number of office and retail spaces for rent that rose in 2017Q3 compared to the same period in 2016. Rental rates also
Chart 2.3.3 House price indices
Source: Bank of Thailand.
100
110
120
130
140
150
160
170
180
190
Q1
/20
13
Q2
/20
13
Q3
/20
13
Q4
/20
13
Q1
/20
14
Q2
/20
14
Q3
/20
14
Q4
/20
14
Q1
/20
15
Q2
/20
15
Q3
/20
15
Q4
/20
15
Q1
/20
16
Q2
/20
16
Q3
/20
16
Q4
/20
16
Q1
/20
17
Q2
/20
17
Q3
/20
17
. .
. .
Detached house with land)
Townhouse with land)
Condominium
Land
Index Jan 2009 = 100)
%YoY Nov ‘17
Oct
-17
No
v-1
7
1.9-0.1
5.1
1.6
Chart 2.3.4 Unsold condominium units in Bangkok and its vicinity
Note: Time-to-go refers to the length of time it would take to sell all unsold units, assuming that sales per month are equal to average sales since projects’ launches. Source: AREA and Bank calculations.
0
5
10
15
20
25
30
0
5
10
15
20
20
15
H1
20
15
H2
20
16
H1
20
16
H2
20
17
H1
20
15
H1
20
15
H2
20
16
H1
20
16
H2
20
17
H1
20
15
H1
20
15
H2
20
16
H1
20
16
H2
20
17
H1
20
15
H1
20
15
H2
20
16
H1
20
16
H2
20
17
H1
Time to go (RHS)
Thousand Units MonthsPurple Line Downtown Blue Line Green Line
Extension
Unsold unit

Financial Stability Report 2017 | 15
continued to grow. But the growth rate was expected to slow down in the periods ahead due to the launches of new projects, especially the mixed-use ones.
Going forward, a key driver that could affect the oversupply of office and retail spaces is the surge in investment in mixed-use development projects. While the expansion in mixed-use projects will likely benefit the real estate market by increasing competition and maximizing the use of limited land resources, there are related risks that need to be monitored, as follows:
(1) The supply of office and retail spaces may surge quickly. With 7 large mixed-use projects 7 in Bangkok, both
7 Large mixed-use projects include those worth more than 10,000 million baht, based on information from the Bangkok Property Report by CBRE, which surveyed office and retail spaces in Bangkok. In estimating new supply, exact figures of new annual supply could be
currently under construction and in the planning phase, new office spaces in mixed-use projects from 2017 onward are estimated to total around 900,000 square meters, with a steep pick-up in supply expected from 2020 onward. Similarly, new retail spaces in Bangkok coming from these mixed-use projects from 2017 onward are estimated to total around 200,000 square meters.
(2) Because mixed-use projects combine multiple types of real estates, each of which have different demand and supply conditions at a given time, managing such projects will prove to be a complicated task. First, most mixed-use projects consist of both residential and commercial real estates, whose demand and supply conditions often depend on a different set of determinants. On top of this, large mixed-use projects are often built on leasehold land, which impels developers to rush construction. With these two factors combined, it is thus challenging to manage risks of these projects and ensure the right timing for a launch given different market conditions for each type of real estate, calling for professional expertise from developers. Indeed, oversupply could possibly pick up in the periods ahead if demand turns out weaker than expected or developers fail to time project launches appropriately.
(3) Financial institutions may face additional risks from the complexity in assessing incomes and risks of mixed-use development projects. Mixed-use projects bring together multiple types of real estates, which are combined in a highly integrated way. For this reason, income projection for these projects is
determined only for projects that are already under construction. For the projects where construction has not started, exact figures of new supply cannot be specified.
Chart 2.3.5 Demand and supply for office spaces
Source: CBRE and Bank calculations.
50%
55%
60%
65%
70%
75%
80%
85%
90%
95%
100%
0
1
2
3
4
5
6
7
8
9
10
20
11
20
12
20
13
20
14
20
15
20
16
Q1
/20
17
Q2
/20
17
Q3
/20
17
Demand Excess supply Occupancy rate (RHS)
Million units
Chart 2.3.6 Demand and supply for retail spaces
Source: CBRE and Bank calculations.
50%
55%
60%
65%
70%
75%
80%
85%
90%
95%
100%
0
1
2
3
4
5
6
7
8
20
11
20
12
20
13
20
14
20
15
20
16
Q1
/20
17
Q2
/20
17
Q3
/20
17
Demand Excess supply Occupancy rate (RHS)
Million units

16 | Financial Stability Report 2017
more complicated and potentially more sensitive to assumptions used compared to traditional projects. This could affect banks’ ability to assess risks and thus loan decisions for mixed-use projects.
2.4 Household sector
Although the household debt to GDP ratio continued to decline slowly for seven consecutive quarters, households remained fragile given their elevated debt burden. In addition to this, deleveraging seemed to occur only in certain groups of households and could be short-lived, without noticeable improvement in debt serviceability.
Debt accumulation by households increased overall. In 2017Q3, a pick-up in year-on-year growth of household debt was observed for the first time in five years8. However, household debt grew
at a pace slower than income, resulting in a continued decline in the household debt to GDP ratio 9 , 10 (i.e. deleverage).
Indeed, the ratio stood at 78.3 percent in 2017Q3, falling for seven consecutive quarters (Chart 2.4.1). This could be viewed as a positive development that helped lessen financial vulnerability and strengthened households’ overall balance sheets.
8 Alternatively, if household debt growth were to be calculated on a QoQSA basis (i.e. quarter-on-quarter growth of seasonally adjusted values of household debts), the growth would be positive and signal a pick-up starting from 2017Q1. 9 Many analysts use the “debt-to-GDP ratio” in place of the “debt-to-income ratio” because GDP data are available in higher frequency, comparable across countries, and released to the public in advance of household disposable income data. However, the use of GDP instead of household disposable income might not reflect households’ financial adjustments, especially when the ratio of household disposable income to GDP changes significantly.
Despite the ongoing deleveraging process, Thailand’s household debt level remained high relative to peer countries in the region, with Thailand having lower per capita income compared to countries with similar levels of household debt. Furthermore, the deleveraging was still concentrated in households in certain income groups and regions. The data from the Socioeconomic Survey (SES)11 revealed that deleveraging was evident only for some high-income households (the 4th quintile) as well as households residing in Bangkok and its vicinity and the central region. This was found to be mainly due to the decrease in debt burden. On the contrary, the debt levels of households in low-to-medium income groups or those residing in other regions, especially the northern and north-eastern regions, were either stable or showing further leveraging from 2015.
10 The ratio of household debt to GDP does not include debt under litigation and debt under the Student Loan Fund. If included, the ratio would be higher and the increase would be a parallel shift. Therefore, a deleveraging trend could still be observed. 11 These data were surveyed by the National Statistical Office (income data available every other year). The data used in Chart 2.4.2 and 2.4.3 were annual data from 2007 to 2015 and half-year data for 2017H1, which were averages of 2017Q1 and 2017Q2. The data for each quarter were based on a sample size of about 10,000 households.
Chart 2.4.1 Household debt
Note: (1) Household debt refers to loans given to households by financial institutions, excluding debt under litigation and debt under the Student Loan Fund. (2) GDP is calculated using four-quarter moving average. Source: Bank of Thailand.
. .
% of GDP
.
3.2 3.13.7
0
5
10
15
20
0
20
40
60
80
100
Q4Q1Q2Q3Q4Q1Q2Q3Q4Q1Q2Q3Q4Q1Q2Q3Q4Q1Q2Q3Q4Q1Q2Q3
2554 2555 2556 2557 2558 2559 2560
GDP Househould debt growth (RHS)
% YoYHousehould debt to GDP
2011 2012 2013 2014 2015 2016 2017

Financial Stability Report 2017 | 17
This was due to an acceleration in debt burden while income remained stagnant (Chart 2.4.2).
Viewing by types of loans given to households, the ongoing deleveraging was attributable to slower growth in almost all types of loans (Chart 2.4.3). This was particularly the case for auto loans, as these loans had been gradually repaid following the end of the first-car scheme in 2016. But deleveraging in mortgage loans, which constituted the largest share of total loans, was rather sluggish. Looking ahead, the impact of the new regulations on credit card loans and personal loans under regulation (PLR) needs to be monitored, especially the impact on deleveraging among low-income households. (Details in Section 4.1: Implementation of regulations on credit card loans and personal loans under regulation)
Furthermore, a closer inspection on the distribution of loans by interest rate arrangements showed that indebted households had become slightly more sensitive to changes in interest rates. This was reflected in the decreasing share of fixed-rate loans to about 37 percent of total loans in 2017Q3 (Chart 2.4.4). On the other hand, the share of floating-rate loans was on an upward trend, both for installment loans (where a higher interest rate leads to a longer repayment period) and non-installment loans (where a higher interest rate affects monthly debt payments directly). The upward trend for the shares of floating-rate loans, as discussed above, was consistent with recent household debt dynamics, where growth came mainly from floating-rate loans such as mortgages and business loans.
Chart 2.4.2 Indices of household debt to
annual income, classified by income and region
Note: Households are classified into five quintiles based on their income, with the 1st quintile having lowest income and the 5th quintile having highest income. Source: Socioeconomic Survey (SES) by National Statistical Office and Bank calculations.
Index 2007 = 100)
50
70
90
110
130
150
2007 2009 2011 2013 2015 2017H1
Quintile 1 Quintile 2 Quintile 3 Quintile 4 Quintile 5
Classified by income
Index 2007 = 100)
020406080
100120140160180200
2007 2009 2011 2013 2015 2017H1
Bangkok Central region (excluding Bangkok)Northern region Northeastern regionSouthern region
Classified by region
Quintile 1 = Lowest-income household Quintile 5 = Highest-income household
Chart 2.4.3 Indices of household debt to GDP
classified by loan type
Note: Personal loans here exclude debt under the Student Loan Fund. Source: Bank of Thailand
80
90
100
110
120
130
140
150
Q4Q1Q2Q3Q4Q1Q2Q3Q4Q1Q2Q3Q4Q1Q2Q3Q4Q1Q2Q3Q4Q1Q2Q3
2554 2555 2556 2557 2558 2559 2560
PLR +
Index (Q4/2011 = 100)
2011 2012 2013 2014 2015 2016 2017
Credit card (seasonal adjusted)
Business
Personal loan under regulation (PLR) and loan for education purpose
Other
Auto loan/leasing
Mortgage loan

18 | Financial Stability Report 2017
Domestic interest rates that stayed low for an extended period not only encouraged debt creation, but also discouraged savings by households. This impaired households’ capacity to withstand shocks. The SES data pointed to an increase in the debt to financial assets (savings) ratio in all household groups (Chart 2.4.5). This was consistent with the deterioration in households’ debt serviceability as discussed earlier.
A stress test was also conducted on households’ resilience, assuming a 20 percent drop in household income while leaving household consumption spending unchanged. The stress test results showed that the proportion of indebted households that were considered vulnerable (i.e. having incomes net of consumption and taxes that were insufficient to make full monthly debt payments) would rise from 48 to 74 percent under stress conditions. Among all household groups, professionals appeared to be the most resilient (Chart 2.4.6).
All these discussions suggest that default risks continue to be a key issue that warrant monitoring. This is consistent with the NPL ratio for commercial banks’ consumer loans that rose to 2.74 percent in 2017Q3 from 2.71 percent at the end of 2016, mainly from mortgage loans. (Details in Section 2.5: Financial institutions sector)
Chart 2.4.4 Composition of consumer loans
classified by interest rate type
Note: (1) The fixed rate category includes “other loans that cannot be classified”, which accounted for 4.85 percent as of 2017Q3. (2) An increase in interest rate would affect borrowers of two types of loans, namely, installment loans (where a higher interest rate leads to a longer repayment period) and non-installment loans (where a higher interest rate affects monthly debt payments directly). Source: Bank of Thailand
%
36.98
34.10
28.92
2527293133353739414345
Q4Q1Q2Q3Q4Q1Q2Q3Q4Q1Q2Q3Q4Q1Q2Q3Q4Q1Q2Q3Q4Q1Q2Q3
2554 2555 2556 2557 2558 2559 2560
non-installment loan installment loan
2011 2012 2013 2014 2015 2016 2017
Fixed rate e.g. credit card, personal loan
Floating rate or Installment loan e.g. housing loan
Floating rate or Non-installment loan e.g. co-op loan, business loan
Chart 2.4.5 Debt to financial assets
classified by income and occupation
Note: (1) Calculations include only indebted households. (2) Households are classified into five quintiles based on their income per capita, with the 1st quintile having lowest monthly income per capita and the 5th quintile having highest monthly income per capita. (3) “Professional” households include managers, academicians and professionals, technicians, etc. (4) “Worker” households include those working in agriculture, forestry, fishery, machine control, clerkship, services, craftsmanship, manufacturing operation, etc. Source: Socioeconomic Survey (SES) by National Statistical Office and Bank calculations.
02468
1012141618
56
58
60
H1
56
58
60
H1
56
58
60H
1
56
58
60
H1
56
58
60
H1
56
58
60
H1
Classified by income
p25 p50
20
13
20
17
H1
20
15
20
13
20
17
H1
20
15
20
13
20
17
H1
20
15
20
13
20
17
H1
20
15
20
13
20
17
H1
20
15
20
13
20
17
H1
20
15
Quintile 1 Quintile 2 Quintile 3 Quintile 4 Quintile 5 Total
0123456789
10
20
13
20
15
20
17
H1
20
13
20
15
20
17
H1
20
13
20
15
201
7H
1
20
13
20
15
20
17
H1
20
13
20
15
20
17
H1
Farmbusiness
Non-farmbusiness
Professional Worker Total
Classified by occupation
p25 p50 p75Time

Financial Stability Report 2017 | 19
The upward trend in defaults on
mortgage loans also call for attention going forward. This is because from lenders’ perspective, mortgage loans are perceived to have low risks given that such loans require high-quality collaterals and their purposes are to purchase assets that are fundamental to living and conducive to wealth accumulation. However, if such loans are given in an amount that is too high relative to borrower’s incomes or collateral values, mortgage loans could then act as a pocket where risks could build up. A closer look into the database of new mortgage loans given by the commercial bank system during the first three quarters of 2017 suggests three observations, as follows:
(1) The fact that growth in house
prices outpaced growth in household
income meant that borrowers had to
bear higher debt burden relative to their
income, especially for low-income
households. This was reflected in higher
loan-to-income (LTI) ratio of households
with average monthly income below
30,000 baht that rose more than those of
other groups, from 4.4 times in 2013 to
5.9 times in the first three quarters of
2017 (Chart 2.4.7). This pointed to a
deterioration in housing affordability of
households.
(2) Mortgagors, especially those with low income, had monthly payments that were quite high. This was seen in the average mortgage debt service ratio (i.e. the ratio of monthly mortgage payment to monthly income) for borrowers with average monthly income below 30,000 baht that rose to 41 percent. The increase was in spite of the fact that commercial banks had extended the repayment period and mortgage rates had gone down (Chart 2.4.8). This reflected that households were vulnerable to potential
Chart 2.4.6 Stress testing households
that are vulnerable to liquidity shocks
Note: (1) Income stress assumes that households keep their consumption level unchanged and do not liquidate assets to service their debts. (2) Households that are “vulnerable” to liquidity shocks refer to those having incomes net of consumption and taxes that are insufficient to make full monthly debt payments. (3) “Professional” households include managers, academicians and professionals, technicians, etc. (4) “Worker” households include those working in agriculture, forestry, fishery, machine control, etc. Source: Socioeconomic Survey (SES) by National Statistical Office and Bank calculations.
0102030405060708090
Farm
bu
sin
ess
No
n-f
arm
bu
sin
ess
Pro
fess
ion
al
Wo
rker
Inac
tive
Tota
l
% of household in each group
% of vulnerable household to liquidity problem (income shock -20%)
% of vulnerable household to liquidity problem
Chart 2.4.7 House price to income (PTI) ratio
and mortgage loan to income (LTI) ratio, classified by monthly income
Source: Database of commercial banks’ new mortgage loans and Bank calculations.
5.2
6.6
4.14.9
3.13.7
1.5 1.8
0
2
4
6
8
2013 2014 2015 2016 Q3/2017
Total < 30,000 Baht
30,000 - 50,000 Baht 50,000 - 100,000 Baht
> 100,000 Baht
House price to income ratioTime
Loan to income ratio
3.54.4
5.9
3.5
4.4
2.7 3.2
1.2 1.5
0
2
4
6
8
2013 2014 2015 2016 Q3/2017
Time
5.2
6.6
4.14.9
3.13.7
1.5 1.8
0
2
4
6
8
2013 2014 2015 2016 Q3/2017
Total < 30,000 Baht
30,000 - 50,000 Baht 50,000 - 100,000 Baht
> 100,000 Baht
House price to income ratioTime
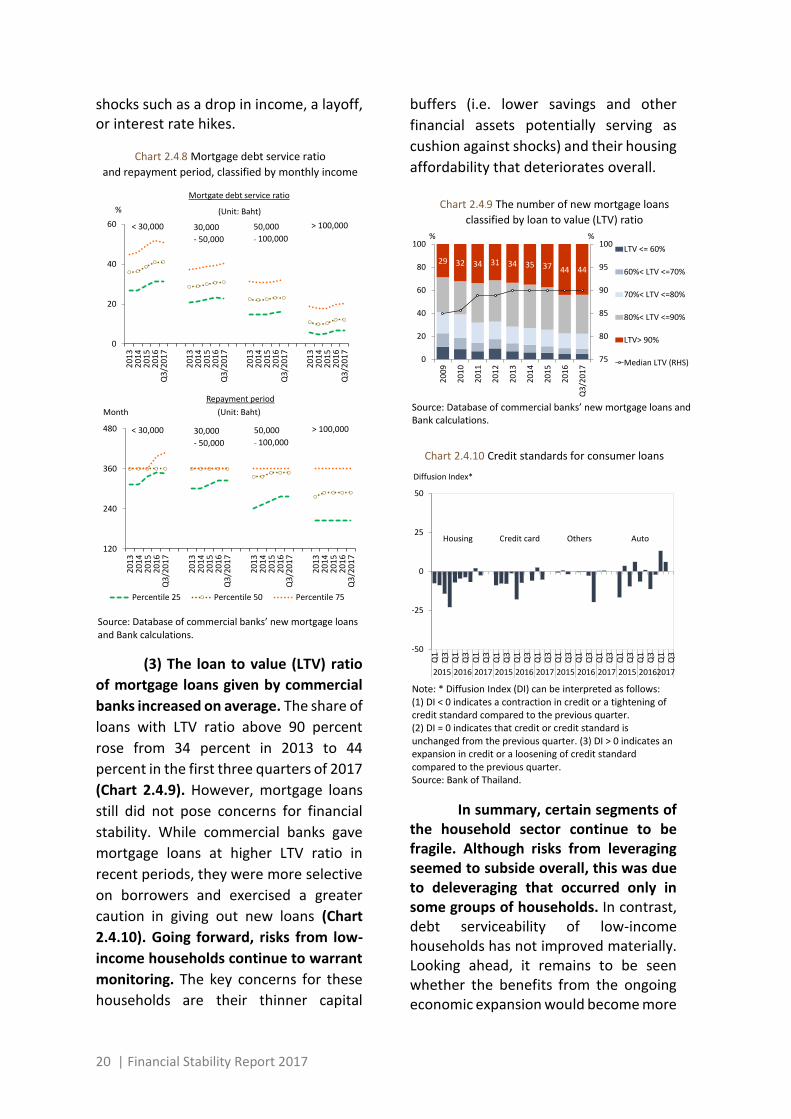
20 | Financial Stability Report 2017
shocks such as a drop in income, a layoff, or interest rate hikes.
(3) The loan to value (LTV) ratio
of mortgage loans given by commercial
banks increased on average. The share of
loans with LTV ratio above 90 percent
rose from 34 percent in 2013 to 44
percent in the first three quarters of 2017
(Chart 2.4.9). However, mortgage loans
still did not pose concerns for financial
stability. While commercial banks gave
mortgage loans at higher LTV ratio in
recent periods, they were more selective
on borrowers and exercised a greater
caution in giving out new loans (Chart
2.4.10). Going forward, risks from low-
income households continue to warrant
monitoring. The key concerns for these
households are their thinner capital
buffers (i.e. lower savings and other
financial assets potentially serving as
cushion against shocks) and their housing
affordability that deteriorates overall.
In summary, certain segments of the household sector continue to be fragile. Although risks from leveraging seemed to subside overall, this was due to deleveraging that occurred only in some groups of households. In contrast, debt serviceability of low-income households has not improved materially. Looking ahead, it remains to be seen whether the benefits from the ongoing economic expansion would become more
Chart 2.4.8 Mortgage debt service ratio
and repayment period, classified by monthly income
Source: Database of commercial banks’ new mortgage loans and Bank calculations.
0
20
40
60
20
13
20
14
20
15
20
16
Q3
/20
17
20
13
20
14
20
15
20
16
Q3
/20
17
20
13
20
14
20
15
20
16
Q3
/20
17
20
13
20
14
20
15
20
16
Q3
/20
17
Percentile 25Percentile 50Percentile 75
%
< 30,000 30,000
- 50,000
50,000 100,000
> 100,000
Mortgate debt service ratio
(Unit: Baht)
120
240
360
480
20
13
20
14
20
15
20
16
Q3
/20
17
20
13
20
14
20
15
20
16
Q3
/20
17
20
13
20
14
20
15
20
16
Q3
/20
17
20
13
20
14
20
15
20
16
Q3
/20
17
Percentile 25 Percentile 50 Percentile 75
Month
Repayment period
(Unit: Baht)
< 30,000 30,000
- 50,000
50,000 100,000
> 100,000
Chart 2.4.9 The number of new mortgage loans
classified by loan to value (LTV) ratio
Source: Database of commercial banks’ new mortgage loans and Bank calculations.
29 32 34 31 34 35 37 44 44
75
80
85
90
95
100
0
20
40
60
80
100
20
09
20
10
20
11
20
12
20
13
20
14
20
15
20
16
Q3
/20
17
LTV <= 60%
60%< LTV <=70%
70%< LTV <=80%
80%< LTV <=90%
LTV> 90%
Median LTV (RHS)
%%
Chart 2.4.10 Credit standards for consumer loans
Note: * Diffusion Index (DI) can be interpreted as follows: (1) DI < 0 indicates a contraction in credit or a tightening of credit standard compared to the previous quarter. (2) DI = 0 indicates that credit or credit standard is unchanged from the previous quarter. (3) DI > 0 indicates an expansion in credit or a loosening of credit standard compared to the previous quarter. Source: Bank of Thailand.
-50
-25
0
25
50
Q1
Q3
Q1
Q3
Q1
Q3
Q1
Q3
Q1
Q3
Q1
Q3
Q1
Q3
Q1
Q3
Q1
Q3
Q1
Q3
Q1
Q3
Q1
Q3
2015 2016 2017 2015 2016 2017 2015 2016 2017 2015 20162017
Diffusion Index*
OthersHousing Credit card Auto
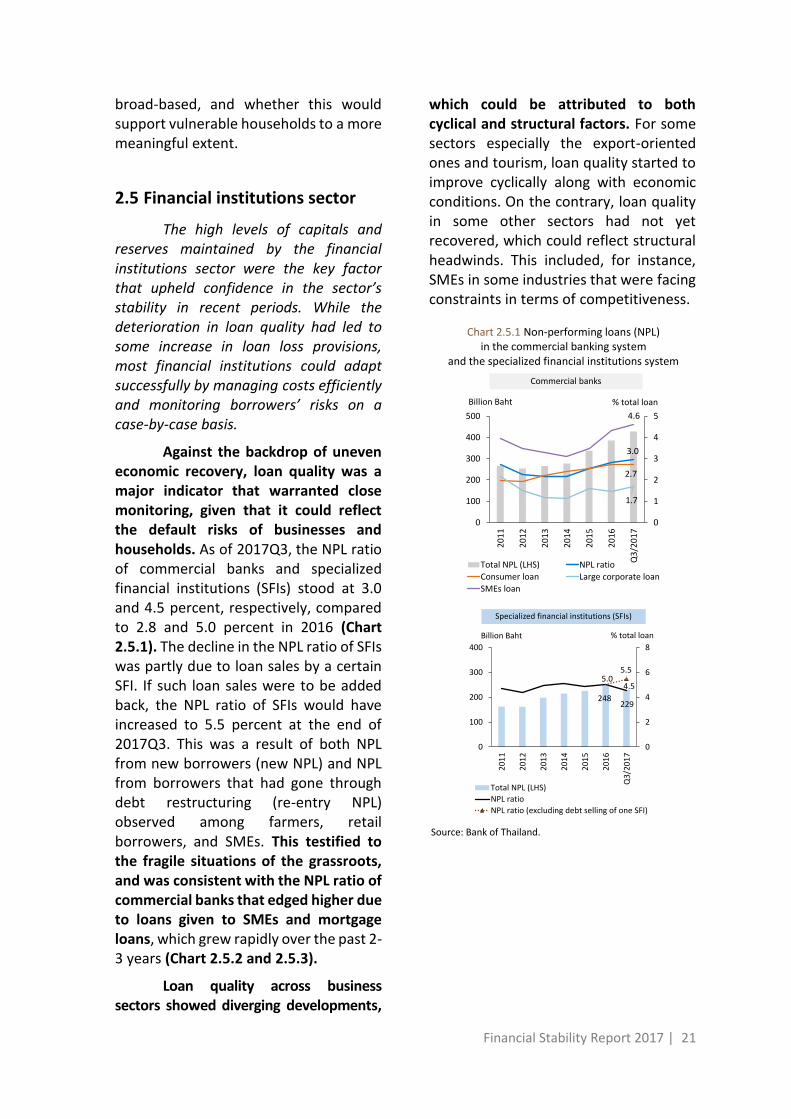
Financial Stability Report 2017 | 21
broad-based, and whether this would support vulnerable households to a more meaningful extent.
2.5 Financial institutions sector
The high levels of capitals and reserves maintained by the financial institutions sector were the key factor that upheld confidence in the sector’s stability in recent periods. While the deterioration in loan quality had led to some increase in loan loss provisions, most financial institutions could adapt successfully by managing costs efficiently and monitoring borrowers’ risks on a case-by-case basis.
Against the backdrop of uneven economic recovery, loan quality was a major indicator that warranted close monitoring, given that it could reflect the default risks of businesses and households. As of 2017Q3, the NPL ratio of commercial banks and specialized financial institutions (SFIs) stood at 3.0 and 4.5 percent, respectively, compared to 2.8 and 5.0 percent in 2016 (Chart 2.5.1). The decline in the NPL ratio of SFIs was partly due to loan sales by a certain SFI. If such loan sales were to be added back, the NPL ratio of SFIs would have increased to 5.5 percent at the end of 2017Q3. This was a result of both NPL from new borrowers (new NPL) and NPL from borrowers that had gone through debt restructuring (re-entry NPL) observed among farmers, retail borrowers, and SMEs. This testified to the fragile situations of the grassroots, and was consistent with the NPL ratio of commercial banks that edged higher due to loans given to SMEs and mortgage loans, which grew rapidly over the past 2-3 years (Chart 2.5.2 and 2.5.3).
Loan quality across business sectors showed diverging developments,
which could be attributed to both cyclical and structural factors. For some sectors especially the export-oriented ones and tourism, loan quality started to improve cyclically along with economic conditions. On the contrary, loan quality in some other sectors had not yet recovered, which could reflect structural headwinds. This included, for instance, SMEs in some industries that were facing constraints in terms of competitiveness.
Chart 2.5.1 Non-performing loans (NPL) in the commercial banking system
and the specialized financial institutions system
Source: Bank of Thailand.
Commercial banks
Billion Baht % total loan
3.0
2.7
1.7
4.6
0
1
2
3
4
5
0
100
200
300
400
500
20
11
20
12
20
13
20
14
20
15
20
16
Q3
/20
17
Total NPL (LHS) NPL ratio
Consumer loan Large corporate loan
SMEs loan
Specialized financial institutions (SFIs)
Billion Baht % total loan
248229
5.04.5
5.5
0
2
4
6
8
0
100
200
300
400
20
11
20
12
20
13
20
14
20
15
20
16
Q3
/20
17
Total NPL (LHS)
NPL ratio
NPL ratio (excluding debt selling of one SFI)

22 | Financial Stability Report 2017
While the overall NPL ratio of the commercial banking system still edged higher, growth had been slowing since 2016Q4, as indicated by the deceleration in new and re-entry NPL (Chart 2.5.4). This was partly due to banks’ efforts in monitoring individual borrowers closely to reduce the likelihood of defaults.
As the economy recovered more evidently, loan demand started to return in 2017H2. Loan growth of commercial banks was at 3.3 percent in 2017Q3, compared to 2.0 percent in 2016. Loans given to large corporates and SMEs continued to expand, although they remained concentrated only in a small
number of sectors such as energy, real estate, and some businesses in the manufacturing and commerce sector. Consumer loans, especially mortgages and auto loans, continued to be the key contributor to commercial banks’ overall loan growth. Concurrently, SFIs showed loan growth as well. The growth was at 8.0 percent in 2017Q3, up from a 2.1 percent growth in 2016. The higher growth was partly due to loans given to the public sector. Excluding this amount, SFIs would have recorded a loan growth of 3.3 percent, compared to a 3.9 percent growth at the end of 2016 (Chart 2.5.5).
Chart 2.5.2 NPL ratios of corporate and consumer loans in the commercial banking system
Source: Bank of Thailand.
4.8
5.4
5.55.6
4.1
0.7
3.3
0
2
4
6
8
20
11
20
12
20
13
20
14
20
15
20
16
Q3
/20
17
Agriculture and forestry Manufacturing
Commerce Construction
Real estate Utilities
Services
3.3
1.6
2.8
2.7
0
1
2
3
4
5
20
11
20
12
20
13
20
14
20
15
20
16
Q3
/20
17
Mortgage Auto
Credit card Personal loan
Non-performing consumer loan
% total loan
Non-performing corporate loan
% total loan
Chart 2.5.3 NPL ratios of corporate loans in the commercial banking system, classified by firm size and sector
Source: Bank of Thailand.
4.6
1.9
1.11.7
2.1
0.3
1.81.7
6.36.8 7.4
5.24.1
1.3
5.7 4.6
012345678
20
11
20
13
20
15
Q3
/20
17
20
11
20
13
20
15
Q3
/20
17
20
11
20
13
20
15
Q3
/20
17
20
11
20
13
20
15
Q3
/20
17
20
11
20
13
20
15
Q3
/20
17
20
11
20
13
20
15
Q3
/20
17
20
11
20
13
20
15
Q3
/20
17
20
11
20
13
20
15
Q3
/20
17
Manufacturing Commerce Construction Real estate Services Utilities Agriculture andforestry
Total
Large corporate loan SMEs loan% total loan

Financial Stability Report 2017 | 23
Despite some deterioration in
the overall loan quality, high levels of capitals and reserves were the key factor that upheld confidence in the stability of the financial institutions system. This also reflected the readiness of financial intermediaries in supporting the real sector. At the end of 2017Q3, the ratio of capital to risk-weighted assets (BIS ratio) of the commercial banking system and the Tier 1 ratio stood at 18.5 and 15.8 percent, respectively, while the ratio of actual to regulatory loan loss provision stood at 166.2 percent (Chart 2.5.6). For the same period, the BIS ratio and the Tier 1 ratio of SFIs stood at 12.5 and 11.5 percent, respectively. Both ratios were above Bank of Thailand’s minimum requirements, except for some SFIs currently under the restructuring
process. The NPL coverage ratio of SFIs stood at 181.3 percent in the same period.
Importantly, the banking sector continued to face challenges in maintaining profitability amid the changing environment. The overall deterioration in loan quality since 2015 for banks to raise loan loss provision, which became a significant portion of banks’ funding costs (Chart 2.5.7). In response to this, commercial banks had made major adjustments in several ways, as follows: (1) Banks had reduced funding costs by managing interest expenses. This was achieved primarily by increasing the proportion of current accounts and savings accounts (CASA), which carried lower interest costs than term or fixed deposit accounts. (2) Operating costs had also been reduced through closing bank
Chart 2.5.4 NPL formation
in the commercial banking system
Source: Bank of Thailand.
0.5
0.0
0.2
0.4
0.6
0.8
1.0
0102030405060708090
100Q
1/2
01
1
Q3
/20
11
Q1
/20
12
Q3
/20
12
Q1
/20
13
Q3
/20
13
Q1
/20
14
Q3
/20
14
Q1
/20
15
Q3
/20
15
Q1
/20
16
Q3
/20
16
Q1
/20
17
Q3
/20
17
Billion BahtNew NPL
Re-entry NPL
%NPL formation (RHS)
% NPL formation
Chart 2.5.5 Loan growth in the commercial banking
system and the specialized financial institutions system
Source: Bank of Thailand.
3.3
8.0
5.3
-5
0
5
10
15
20
25
Q1
/20
11
Q3
/20
11
Q1
/20
12
Q3
/20
12
Q1
/20
13
Q3
/20
13
Q1
/20
14
Q3
/20
14
Q1
/20
15
Q3
/20
15
Q1
/20
16
Q3
/20
16
Q1
/20
17
Q3
/20
17
Real GDP growth
Commercial banks
SFIs
Commercial banks+SFIs+bond
Commercial banks+bond
%YoY
Chart 2.5.6 Capital buffer and provision in the
commercial banking system and the specialized financial institutions system
Source: Bank of Thailand.
166.2
18.5
15.8
100
125
150
175
200
0
5
10
15
20
Q1
/20
11
Q3
/20
11
Q1
/20
12
Q3
/20
12
Q1
/20
13
Q3
/20
13
Q1
/20
14
Q3
/20
14
Q1
/20
15
Q3
/20
15
Q1
/20
16
Q3
/20
16
Q1
/20
17
Q3
/20
17
Ratio of actual to regulatory provision (RHS)
BIS ratio
Tier 1 ratio
%
Commercial banks
%
Commercial banks
181.3
12.5
11.5
100
125
150
175
200
0
5
10
15
20Q
1/2
01
1
Q3
/20
11
Q1
/20
12
Q3
/20
12
Q1
/20
13
Q3
/20
13
Q1
/20
14
Q3
/20
14
Q1
/20
15
Q3
/20
15
Q1
/20
16
Q3
/20
16
Q1
/20
17
Q3
/20
17
NPL coverage raio (RHS)
BIS ratio
Tier 1 ratio
% %
Specialized financial institutions

24 | Financial Stability Report 2017
branches and shifting more focus toward electronic platforms. In addition, (3) loan and investment portfolios had been adjusted to enhance yields. This included growing the proportion of consumer loan and increasing investment in long-term and foreign debt securities. All these moves helped commercial banks to maintain profitability, as reflected in their net interest margin (NIM) and return on assets (ROA) that remained quite stable (Chart 2.5.8).
Concurrently, commercial banks also continued to improve liquidity risk management to be on par with the international standard. At the end of 2017Q3, the liquidity coverage ratio (LCR) of the commercial banking system stood at 169.4 percent, above the regulatory requirement12 (Chart 2.5.9). Commercial
banks were also preparing for the upcoming enforcement of requirements on net stable funding ratio (NSFR) in mid-2018. On the whole, liquidity risks were assessed to be limited since most Thai commercial banks 13 relied mainly on
retail deposit, which accounted for 57.5 percent of total deposit in 2017Q3. While this testified to commercial banks’ stable sources of funding, the share of retail deposit started to edge lower from 2-3 years ago. Part of this was due to the fact that investors had more investment options and were constantly seeking higher yields. Should commercial banks need to depend on wholesale funding to a greater extent in the periods ahead, the stability of their funding sources could be affected and funding costs could also rise.
12 The LCR regulation has been effective since 2016. The initial requirement was set at 60 percent, with a 10 percent increment phased in annually until the ratio reaches 100 percent in 2020. 13 Thai commercial banks consist of 15 commercial banks: Bangkok Bank, Krung Thai Bank, Bank of Ayudhya, Kasikornbank, Kiatnakin Bank, CIMB Thai Bank, TMB Bank, Tisco Bank, Siam Commercial Bank, Thanachart Bank, United Overseas Bank (Thai), Land
and Houses Bank, Standard Chartered Bank (Thai), Industrial and Commercial Bank of China (Thai), and Thai Retail Credit Bank. Thai commercial banks are part of the commercial banking system, which is composed of 30 institutions that belong to the following groups: (1) Thai commercial banks (15) (2) branches of foreign banks (11) and (3) commercial banks that are subsidiaries of foreign banks (4).
Chart 2.5.7 Composition of commercial banks’
funding cost
Source: Bank of Thailand.
1.7 2.0 2.0 1.8 1.6 1.2 1.1 1.1 1.1
0.30.4 0.4 0.4 0.4 0.4 0.4 0.4 0.4
0.80.8 0.8 0.8 1.2 1.2 1.2 1.4 1.4
2.02.0 1.8 1.9 1.9 2.0 1.9 1.9 1.9
5.5 5.7 5.7 5.5 5.3 5.1 5.0 5.0 5.0
0
2
4
6
20
11
20
12
20
13
20
14
20
15
20
16
Q1
/20
17
Q2
/20
17
Q3
/20
17
Operating expense
Loan loss reserve
Premium to deposit insurance
Interest expense
Interest income
%
Chart 2.5.8 Profitability of the commercial banking system
Source: Bank of Thailand.
8.27.2
2.5 2.6
1.1 1.1 1.1
8.8 8.68.1
0
3
6
9
12
0
1
2
3
4
5
2011 2012 2013 2014 2015 2016 9M/2017
Asset/Equity (RHS) NIM ROA ROE (RHS)
% total asset % total equity
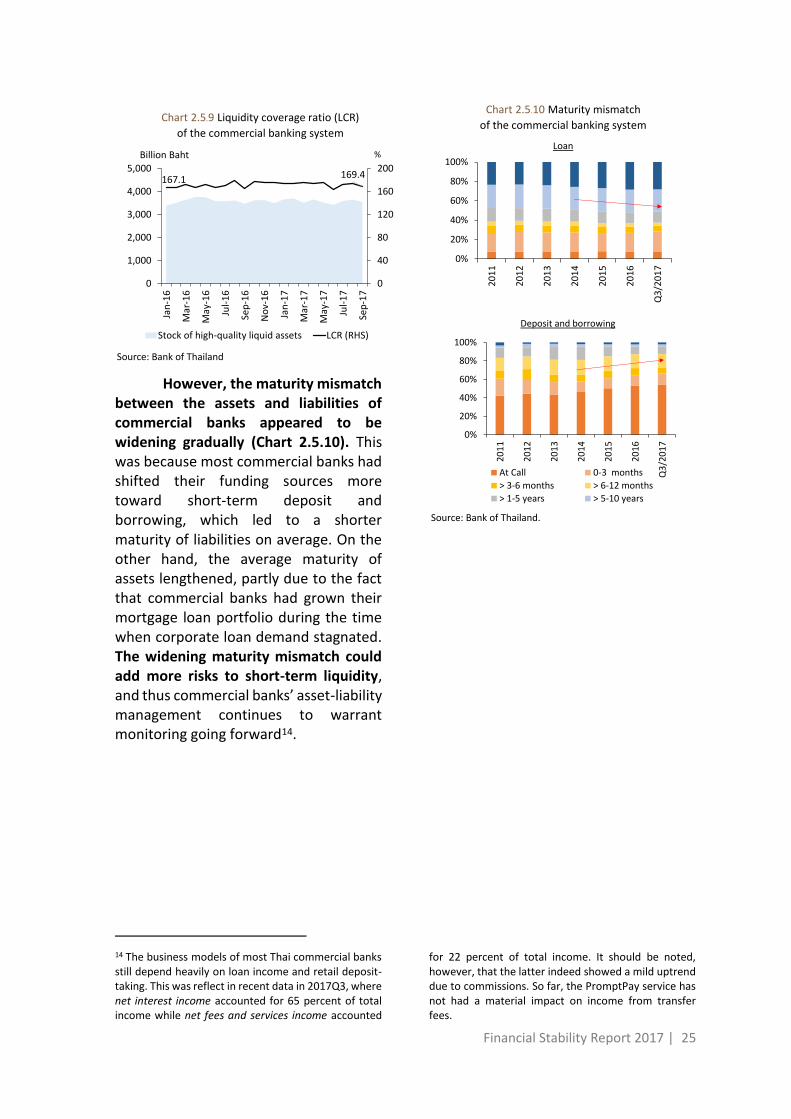
Financial Stability Report 2017 | 25
However, the maturity mismatch
between the assets and liabilities of commercial banks appeared to be widening gradually (Chart 2.5.10). This was because most commercial banks had shifted their funding sources more toward short-term deposit and borrowing, which led to a shorter maturity of liabilities on average. On the other hand, the average maturity of assets lengthened, partly due to the fact that commercial banks had grown their mortgage loan portfolio during the time when corporate loan demand stagnated. The widening maturity mismatch could add more risks to short-term liquidity, and thus commercial banks’ asset-liability management continues to warrant monitoring going forward14.
14 The business models of most Thai commercial banks still depend heavily on loan income and retail deposit-taking. This was reflect in recent data in 2017Q3, where net interest income accounted for 65 percent of total income while net fees and services income accounted
for 22 percent of total income. It should be noted, however, that the latter indeed showed a mild uptrend due to commissions. So far, the PromptPay service has not had a material impact on income from transfer fees.
Chart 2.5.9 Liquidity coverage ratio (LCR)
of the commercial banking system
Source: Bank of Thailand
167.1 169.4
0
40
80
120
160
200
0
1,000
2,000
3,000
4,000
5,000Ja
n-1
6
Mar
-16
May
-16
Jul-
16
Sep
-16
No
v-1
6
Jan
-17
Mar
-17
May
-17
Jul-
17
Sep
-17
Billion Baht
Stock of high-quality liquid assets LCR (RHS)
%
Chart 2.5.10 Maturity mismatch
of the commercial banking system
Source: Bank of Thailand.
0%
20%
40%
60%
80%
100%
20
11
20
12
20
13
20
14
20
15
20
16
Q3
/20
17
Loan
0%
20%
40%
60%
80%
100%
20
11
20
12
20
13
20
14
20
15
20
16
Q3
/20
17
Deposit and borrowing
At Call 0-3 months
> 3-6 months > 6-12 months
> 1-5 years > 5-10 years

26 | Financial Stability Report 2017
Box 1: Measuring interconnectedness between business and banking sectors using CoVaR and Diebold-Yilmaz methods
Following the global financial crisis in 2008, systemic risk assessments have become increasingly important. A particular attention has been paid on studying the interconnectedness between players in the financial market and the real sector, which is a key tool that could shed light on the channels through which shocks could propagate during crisis times. This tool could also assist regulators in issuing appropriate measures to prevent and contain risks before the risks escalate into a systemic level. To this end, the Bank of Thailand has been developing quantitative models to measure interconnectedness in the financial system. The main goal is to upgrade the systemic risk assessment toolkits to ensure that they are suitable for the Thai financial landscape that is constantly evolving. This article presents an initial attempt to assess the interconnectedness between business and banking sectors using the Conditional Value at Risk (CoVaR) approach, which measures connectedness through the impact on asset values in crisis times, and the Diebold-Yilmaz framework, which measures connectedness through volatility spillover in asset prices. Both methods use data from commercial banks and companies listed on the Stock Exchange of Thailand (SET), spanning over the period of 2004-201715.
1. Measuring interconnectedness using the CoVaR method
The CoVaR approach, as developed in Adrian and Brunnermeier (2008)16, is based on co-movements in asset returns. That is, if two assets have returns that co-move negatively, this could mean that the two assets are connected and shocks could propagate between them. Calculations would give ∆𝐶𝑜𝑉𝑎𝑅, which is a product of two parts: 𝛽, which captures the extent to which two asset returns co-move negatively, and stand-alone VaR, which captures the severity of loss in an individual asset. A high value of ∆𝐶𝑜𝑉𝑎𝑅, which reflects a potentially greater transmission of risk, could thus be a result of either high 𝛽 or high stand-alone VaR, or both17. Both components of ∆𝐶𝑜𝑉𝑎𝑅 are estimated using quantile
regressions18.
Results from the CoVaR method
Based on the assessment covering all 27 sectors, the ten sectors that are most connected to the overall stock market (i.e. having largest impact on total assets of the SET) are shown in Chart 1.1 (left panel). A closer look at the interconnectedness across sectors (Chart 1.1 right panel) reveals that sectors that are most connected to or exert high impact
15 The dataset used in the study includes 9 commercial banks and 552 companies listed in the SET. The companies are from 27 sectors as follows: agribusiness (AGRI), automotive (AUTO), banking (BANK), commerce (COMM), construction materials (CONMAT), construction services (CONS), electronic components (ETRON), energy and utilities (ENERG), fashion (FASHION), finance and securities (FIN), food and beverage (FOOD), health care services (HELTH), home and office products (HOME), industrial materials and machinery (IMM), information and communication technology (ICT), insurance (INSUR), media and publishing (MEDIA), mining (MINE), packaging (PKG), paper and printing materials (PAPER), personal products and pharmaceuticals (PERSON), petrochemicals and chemicals (PETRO), professional services (PROF), property development (PROP), steel (STEEL), tourism and leisure (TOURISM), and transportation and logistics (TRANS). Note that property funds and REITs are excluded from this study, because they have unique price determinants (e.g. rental incomes and discount rates), which result in price movements that are not in line with other sectors. 16 Adrian, Tobias, and Markus K. Brunnermeier. “CoVaR.” Staff Reports 348 (2008), Federal Reserve Bank of New York. 17 That is, if company i is highly connected with company j (i.e. as reflected in co-movements of returns) or is itself bound to suffer severe loss under distress, then the impact from company i could transmit to company j more severely. 18∆𝐶𝑜𝑉𝑎𝑅 is calculated from ∆𝐶𝑜𝑉𝑎𝑅𝑞
𝑗|𝑖= 𝛽𝑞
𝑗|𝑖(𝑉𝑎𝑅𝑞
𝑖 − 𝑉𝑎𝑅50%𝑖 ), where 𝑉𝑎𝑅𝑞
𝑖 is the stand-alone VaR of the risk originator (i.e. sector i) and 𝛽𝑞𝑗|𝑖
represents the 𝛽 of sector i with respect to sector j (with q capturing the worst loss at 99 percent to reflect distressed conditions).

Financial Stability Report 2017 | 27
on other sectors (shown by nodes in the center) might not necessarily be large sectors19;
rather, such sectors tend to be the ones whose supply chains involve multiple sectors. For instance, while the energy and utility sectors are large, they are not so connected with other sectors as the construction services sector. Next, applying the same analysis but restricting attention only to the commercial banking system, it is found that large banks are the most connected with the overall banking system. A decomposition of ∆𝐶𝑜𝑉𝑎𝑅 reveals that high ∆𝐶𝑜𝑉𝑎𝑅 of large banks often come from high 𝛽, reflecting that their large impact comes mainly from their high interconnection with the overall banking system. In contrast, some medium-sized banks have high ∆𝐶𝑜𝑉𝑎𝑅 as well, but in such cases the high value of ∆𝐶𝑜𝑉𝑎𝑅 would come from high stand-alone VaR, reflecting that their large impact comes mainly from the severity of loss incurred by the banks themselves.
2. Measuring interconnectedness using the Diebold-Yilmaz method
Diebold and Yilmaz (2014) 20 develop an approach to measure interconnectedness that is based on volatility spillovers in asset returns. The main idea is to calculate the interconnectedness between a given pair of assets based on forecast error variances of asset returns (with respect to a model such as VAR). If much of one asset’s forecast error variance could be attributed to shocks in the other asset, then both assets are interpreted to be highly connected. Two major strengths of this methodology are as follows: (1) Daily stock prices can be used, so this tool could serve well in monitoring interconnectedness in a short timeframe. (2) Each asset’s contribution to the overall connectedness of the system can be calculated. This could reveal whether an asset is importing spillover from (or exporting spillover to) the system at a given point in time21.
19 Size is measured by mark-to-market asset. 20 Diebold, Francis X., and Kamil Yilmaz. “On the Network Topology of Variance Decompositions: Measuring the Connectedness of Financial Firms.” Journal of Econometrics 182, no. 1 (2014): 119-134. 21 An implementation of the Diebold-Yilmaz framework here consists of two main steps: (1) A VAR model of asset return volatility is estimated. The model uses daily volatility estimators that take into account the opening, closing, high, and low prices of stocks on each trading day. (2) Connectedness measures are constructed based on variance decomposition. The contribution of asset j to the H-step-ahead generalized forecast error variance of asset i (𝜃𝑖𝑗
𝑔(𝐻)) is calculated. This could be used to compute three types of connectedness measures:
(1) “from” connectedness, which reflects volatility spillover that each asset receives from the system; (2) “to” connectedness, which reflects spillover that each asset sends to the system; and (3) “net” connectedness, which is the difference between “to” and “from”
Chart 1.1 Interconnectedness between sectors and the overall stock market, and among the sectors themselves (as measured by CoVaR method)
10 sectors that are most interconnected with the SET (ordered by ∆𝐶𝑜𝑉𝑎𝑅)
Interconnectedness among sectors
Note: (1) Each number in ( ) denotes the sector’s share of mark-to-market asset to total asset of the SET. (2) Node size indicates each sector’s asset size, while node color indicates the total value of ∆𝐶𝑜𝑉𝑎𝑅 exported to other sectors (darker color represents higher outward spillover). Lastly, (3) edge thickness represents the magnitude of ∆𝐶𝑜𝑉𝑎𝑅. Source: Bank calculations.
0.0
0.2
0.4
0.6
0.8
1.0
INSU
R (
0.6
%)
CO
NM
AT
(7.2
%)
PR
OP
(5
.3%
)
BA
NK
(1
6.4
%)
CO
NS
(1.1
%)
ENER
G (
21
.4%
)
PET
RO
(1
.4%
)
FOO
D (
4.1
%)
ETR
ON
(1
.4%
)
PER
SON
(0
.3%
)

28 | Financial Stability Report 2017
Results from the Diebold-Yilmaz method
Based on the assessment covering all 27 business sectors, the ten sectors that are most connected to the overall SET are shown in Chart 1.2 (left panel). At the same time, an analysis on the interconnectedness across sectors (Chart 1.2 right panel) reveals the following: (1) The sectors that have high volatility connectedness with other sectors (shown by nodes in the center) often do not have large assets (shown by small nodes). Rather, these sectors tend to have stock prices that are more volatile than those of other sectors. (2) The sectors that export volatility spillover to others (shown by red nodes) are often the smaller ones, except the commerce sector which is large. (3) The banking sector has low volatility connectedness with other sectors, and is a net receiver of shocks from the system (shown by the BANK node that is located on the outer ring of the network). Meanwhile, when considering connectedness only within the commercial banking system, it is found that large banks tend to be the ones that are most connected with the banking system, consistent with the findings from the CoVaR approach.
Summary
The assessment of interconnectedness through the two methods yield findings that are in alignment. But some disparity exists given their different focuses: the CoVaR method considers the overall connectedness structure under distress, while the Diebold-Yilmaz method focuses on short-term volatility spillover in asset returns. Two observations should be noted from this study. (1) The sectors that are highly connected with other sectors are not necessarily the largest ones. Thus, to conduct system risk assessments, it is not enough to rely on asset sizes or market shares in the SET. Rather, a comprehensive assessment in several dimensions is needed to ensure that policy implications are based on sound analysis. (2) Large commercial banks tend to be highly connected to the overall commercial banking system. Thus, prudential measures targeted at systemically important banks should be an essential part of supervisory toolkits. This is also the direction that the international best practice in banking supervision is heading to. (Details in Section 4.2: Regulations regarding domestic systemically important banks (D-SIBs))
measures, reflecting the net effect of each asset whether it is receiving spillover from (or sending spillover to) the system.
Chart 1.2 Interconnectedness between sectors and the overall stock market, and among the sectors themselves (as measured by Diebold-Yilmaz method)
10 sectors that are most interconnected with the SET (ordered by net connectedness) Interconnectedness among sectors
Note: (1) Each number in ( ) denotes the sector’s share of mark-to-market asset to total asset of the SET. (2) Node size indicates each sector’s asset size, while node color indicates total net connectedness red node for net volatility exporter and green node for
net volatility importer). Lastly, (3) edge thickness represents the magnitude of net connectedness. Source: Bank calculations.
-15
-10
-5
0
5
10
15
20
MED
IA (
1.7
%)
STEE
L (0
.4%
)
AG
RI (
0.5
%)
CO
MM
(5
.5%
)
ETR
ON
(1
.4%
)
IMM
(0
.1%
)
FOO
D (
4.1
%)
TRA
NS
(3.9
%)
AU
TO (
0.5
%)
ICT
(9.4
4%
)
connectedness "to" SET connectedness "from" SET
"net" connectedness
Financial Stability Report 2017 | 29
Chapter 3: The search-for-yield behavior leading to underpricing of risks
The search-for-yield behavior continues to persist amid the prolonged period of low interest rates. This was partly reflected in investment in foreign investment funds (FIFs), which stayed elevated in 2017 and showed concentration in some countries. Meanwhile, unrated bond issuance and mutual funds for accredited investors, which had growth rapidly in the years before, slowed down in 2017 following default incidents by some issuers. Investors must carefully assess risks of the products that they invest in, and be cautions of underpricing of risks especially in the case where future returns are highly uncertain.
Savings cooperatives continue to be a venue for the search for yield. Growth of savings cooperatives’ assets and deposits slowed a little from the years before, but remained high overall. In addition, the interlinkages between the savings cooperatives system and the overall financial system, through both money and capital markets, have also grown stronger. Therefore, it is of paramount importance to quickly upgrade the surveillance process and improve governance of the savings cooperatives system.
Summary of key risks to Thailand’s financial stability
Risks from the search-for-yield behavior in the low interest rate environment
- Investment in mutual funds continues to rise, especially in FIFs where positions are concentrated in some countries.
- Corporate bond issuance declines partly due to recent defaults by some issuers.
- Savings cooperatives' asset size continues to increase due to growth in both deposits and shares raised from members. The cooperatives also invest more in securities to seek higher returns. However, growth in assets and investment has slowed a little from the years before.
Risks that warrant monitoring going forward
- Investors could potentially underprice risks. Investors should be provided with complete and accurate information regarding risks associated with their investment.
- Concentration risks due to investment abroad could rise, both in terms of destination countries and asset classes.
- Volatilities in cross-border capital flows and interest rates in the financial market could heighten in the periods ahead. This could have an impact on funding costs and financial positions of the corporate sector.
- Savings cooperatives have expanded in size and become more integrated with the overall financial system. Should problems arise in the cooperatives system, the impact could thus affect many and spread throughout the financial system.

30 | Financial Stability Report 2017
3.1 Thai financial markets
Offshore funds continued to flow into emerging markets including Thailand, partly driven by investors’ confidence due to improved economic growth prospects. The SET Index, despite its rapid increase, has not yet shown signs of overheating. Meanwhile, the decline in short-term government bond yields led some investors to shift their investment to higher-yielding assets. Volatilities in cross-border capital flows and investors’ search for yield continue to warrant monitoring in the periods ahead.
Offshore funds continued to flow into emerging markets especially those in Asia (Chart 3.1.1). This could be attributed to investors’ confidence in global financial markets, which improved as global economic recovery became more pronounced. At the same time, investors continued to expect that the pace of policy rate normalization in G3 economies would be gradual.
Nonetheless, cross-border capital flows remain volatile due to uncertainties in global financial markets. Several factors contribute to this including: (1) the anticipation regarding the pace of policy rate normalization and balance sheet reduction by G3 central banks; (2) geopolitical risks, especially from the
tension in the Korean Peninsula since the end of August 2017; and (3) the uncertainty surrounding economic and political policies of major economies, most notably the US tax reform.
Thai financial markets, especially the bond markets, have also been a destination of foreign funds seeking returns. But the amount of the inflows was not that high compared to peer countries in the region. Throughout 2017, the net inflows into Thai financial markets totaled USD 5.7 billion. Thai bond markets, in particular, received a net inflow of around USD 6.5 billion, which was a large increase from 2016. In contrast, a net outflow of around USD 0.8 billion was recorded for Thai equity markets, partly due to lower-than-expected earnings of some listed companies and profit taking by investors (Chart 3.1.2).
Continuing capital inflows into Thai and regional financial markets, coupled with market’s anticipation of a weaker US dollar partly due to the uncertainty surrounding the US tax reform, led the Thai baht to strengthen vis-à-vis the US dollar. This appreciation trend was broadly in line with other regional currencies, but the Thai baht appreciated at a relatively faster pace except only the Korean won and the
Chart 3.1.1 Capital flows into emerging market
economies
Source: Institute of International Finance (IIF).
Chart 3.1.2 Non-resident investors’ net capital flows in regional bond and stock markets in 2017
Note: The capital flow data for Indonesia’s bond market are as of 14 December 2017. Source: Bank of Thailand.
Million USD
0
5,000
10,000
15,000
20,000
25,000
30,000
35,000
Malaysia Thailand Indonesia Korea India

Financial Stability Report 2017 | 31
Malaysian ringgit22 (Chart 3.1.3). Part of
this was due to Thailand’s high current account surplus, which also prompted USD selling pressures from Thai exporters. In addition, investors were confident in Thailand’s external stability, which was strong compared to peer countries in the region.
In 2017H1, the SET Index rose at a pace slower than those of regional stock market indices. This was partly because the decline in global oil prices exerted pressure on energy stocks, while the rise in non-performing loan in 2017H1 weighed on bank stocks. However, the SET Index started to pick up since late August 2017, partly attributable to investors’ abated concerns over domestic political situations
22 The Korean won and the Malaysian ringgit appreciated materially following the signaling of interest rate hikes and the economic data outturns that beat estimates. The Bank of Korea raised its policy rate in November 2017, the first time since 2011.
and the progress made on the upcoming general election in Thailand. The SET Index closed the year 2017 at 1,753.71, rising by 13.7 percent from the end of 2016. This increase was primarily driven by domestic institutional investors’ stock purchases. Despite the rapid advance in the SET Index, risks from overheating in the stock market were assessed to be limited as indicated by: (1) the turnover ratio that remained stable, reflecting that trading volume was not at an overheating level; and (2) the margin loan amount that stayed low (Chart 3.1.4). Nonetheless, future developments in the stock markets continue to warrant monitoring. Currently, while the price-to-earnings (P/E) ratio of the SET was still not that high compared to those of regional and major stock markets, the P/E ratio began to rise above its historical average (Chart 3.1.5).
With regard to government bond yields, short-term yields fell and stayed below the policy rate mainly due to bond supply. In particular, the Bank of Thailand has reduced its short-term bond issuance since April 201723; similarly, the Ministry of
Finance reduced its 28-day treasury bill issuance at the end of FY201724. Another
factor that also drove the yields lower was strong demand from both local and non-resident investors. In recent periods, the lower bond yields were part of the pressure that led investors to increase holdings of bonds with longer maturities.
23 SInce April 2017, the Bank of Thailand has reduced the auction amount of 3-month and 6-month discount bills from 40 to 30 billion baht for each maturity per auction. 24 The Ministry of Finance revised its treasury bill issuance plan in the fourth quarter of FY2017.
Chart 3.1.3 Regional exchange rate movements
Source: Thomson Reuters, Bloomberg, and Bank calculations (data as of 29 December 2017).
85
90
95
100
105
110
115
30
-Dec
-16
30
-Jan
-17
28
-Feb
-17
31
-Mar
-17
30
-Ap
r-1
7
31
-May
-17
30
-Ju
n-1
7
31
-Ju
l-1
7
31
-Au
g-1
7
30
-Sep
-17
31
-Oct
-17
30
-No
v-1
7
USDTHB
ADXY Index
DXY Index
= Appreciation
Index (30 Dec 16 = 100)
Movements of the Thai baht, regional currencies, and the U.S. dollar
12.8%
10.9%
9.9%
8.1%
8.1%
6.7%
6.4%
3.8%
-0.4%
-0.7%
-9.9%
-15% -10% -5% 0% 5% 10% 15%
KRW
MYR
THB
TWD
SGD
CNY
INR
JPY
PHP
IDR
DXY
+ = Appreciation
Change in regional currencies against the U.S. dollar since the end of 2016

32 | Financial Stability Report 2017
Meanwhile, medium- and long-term government bond yields in 2017 also fell but mainly due to external factors. One of these was investors’ expectation back then that the Federal Reserve would increase its policy rate at a pace slower than previously assessed. On top of this, non-residents’ continuing demand for long-term government bonds also put a further downward pressure on long-term government bond yields. But late in the year, medium- and long-term government bond yields rebounded briefly in line with the rise in US treasury yields, as US economic data outturns beat estimates and the legislation on tax reform was passed. In addition, improved supply of Thai government bonds also contributed to the late-year rebound in government bond yields (Chart 3.1.6). Consistent with the government bond yields that trended lower and stayed depressed, the costs of corporate bond financing declined as well
especially for higher-rated bonds (Chart 3.1.7).
Going forward, key factors that could contribute to heightened volatility in global financial markets and capital flows include: (1) uncertainty surrounding economic and political policies of major countries; (2) the anticipation regarding
Chart 3.1.4 Trading volumes of margin and cash accounts
Source: Stock Exchange of Thailand.
1,250
1,300
1,350
1,400
1,450
1,500
1,550
1,600
1,650
1,700
1,750
0%
20%
40%
60%
80%
100%
Jan
-16
Mar
-16
May
-16
Jul-
16
Sep
-16
No
v-1
6
Jan
-17
Mar
-17
May
-17
Jul-
17
Sep
-17
No
v-1
7
Margin Account Cash Account SET Index (RHS)
% of total trading volume of domestic clients SET Index
Chart 3.1.5 SET’s forward P/E compared to those of regional stock markets
Source: Bloomberg (data as of 29 December 2017).
0.0
5.0
10.0
15.0
20.0
25.0
US EU UK JP TH PH ID MY IN KR CN TW
29-Dec-17 5-Year average
Time
5-Year band
Chart 3.1.6 Thai government bond yields
Source: Thai Bond Market Association and Bank of Thailand (data as of 29 December 2017).
0.9
1.0
1.1
1.2
1.3
1.4
1.5
1.6
Jan
-17
Feb
-17
Mar
-17
Ap
r-1
7
May
-17
Jun
-17
Jul-
17
Au
g-1
7
Sep
-17
Oct
-17
No
v-1
7
Dec
-17
Policy rate O/N InterbankO/N Private Repo CMB1M Bill 3M Bill6M Bill
%
Money market interest rates and short-term bond yields
Medium-term and long-term bond yields
1.0
1.5
2.0
2.5
3.0
3.5Ja
n-1
6
Mar
-16
May
-16
Jul-
16
Sep
-16
No
v-1
6
Jan
-17
Mar
-17
May
-17
Jul-
17
Sep
-17
No
v-1
7
1Y 2Y 3Y 5Y 7Y 10Y 15Y%
Chart 3.1.7 Coupon rates of A-rated Thai corporate bonds, classified by maturity (year)
Source: Thai Bond Market Association and Bank of Thailand (data as of 29 December 2017).
0.0
0.5
1.0
1.5
2.0
2.5
3.0
Q2
/16
Q4
/16
Q2
/17
Q4
/17
Q2
/16
Q4
/16
Q2
/17
Q4
/17
Q2
/16
Q4
/16
Q2
/17
Q4
/17
Q2
/16
Q4
/16
Q2
/17
Q4
/17
0.0
1.0
2.0
3.0
4.0
5.0Corporate bond's coupon rate
Quarterly average government bond yields (RHS)
3-51-3 5-7 7-10
% %

Financial Stability Report 2017 | 33
policy rate normalization and balance sheet reduction by G3 central banks; and (3) geopolitical risks, which could affect investors’ confidence and asset prices in global financial markets. On the domestic front, one factor that needs monitoring is local investors’ ability to adapt and search for higher returns in the current environment where domestic bond yields remain low.
3.2 Corporate bond issuance
Recent defaults by some bond issuers weighed on market sentiment especially in the unrated bond segment. However, this led issuers to adjust their behavior, while investors became more aware of related risks and exercised more caution in their investment decisions.
Corporate bond outstanding in 2017 fell from the preceding year. At the end of October 2017, corporate bond outstanding stood at 3.5 trillion baht 25 ,
most of which (93 percent of this amount) was investment-grade bonds (Chart 3.2.1). In addition, 61 percent of the total amount outstanding was sold to institutional investors or high net worth clients (PP-II &HNW)26.
25 Had foreign juristic persons and public entities seeking approval from or submitting filing or sales report to the SEC been included, the total outstanding amount would increase to 3.8 trillion baht. 26 PP-II&HNW refers to private placement of securities to institutional investors (II) or high net worth investors (HNW) as defined in the Notification of the Securities and Exchange Commission No. Kor. Jor. 4/2560 on Determination of Definitions of Institutional Investors, Ultra High Net Worth Investors, and High Net Worth Investors. A High Net Worth investor is defined as: (1) an individual, including spouse, who has net asset of at least 50 million baht, or annual income of at least 4 million baht, or direct investment in securities of at least 10 million baht or at least 20 million baht if bank deposits are included; (2) a juristic person with shareholder’s equity as stated in the
With regard to unrated 27 bonds,
the amount outstanding and the number of issuers declined steadily from the end of 2016. As of the end of October 2017, unrated bond outstanding was at 195.5 billion baht, down from 285.1 billion baht at end-2016. In addition, there were only 405 unrated bond issuers, down from 490 at end-2016. Most of the drop in unrated bond outstanding was attributable to bills of exchange (B/E) and issues sold via the PP-limited method 28 (Chart 3.2.2 and
3.2.3). Considering the unrated segment in relation to the whole corporate bond market, it was observed that the ratio of unrated bond outstanding to total corporate bond outstanding continued to decline. The ratio stood at 5.6 percent at the end of October 201729, down from 8.3
percent at end-201630.
latest audited annual financial statements of at least 100 million baht, or direct investment in securities of at least 20 million baht or at least 80 million baht if bank deposits are included. 27 “Unrated” means that neither the bond nor its issuer is given a credit rating. 28 PP-Limited Offer refers to private placement to specific groups of investors. This involves offering of bills in no more than 10 issues at any point in time, or offering of debentures to no more than 10 investors within any 4-month period. 29 This is equivalent to 5.1 percent of total bond outstanding in the SEC system. 30 This is equivalent to 7.5 percent of total bond outstanding in the SEC system.
Chart 3.2.1 Corporate bond outstanding
classified by credit rating
Source: Office of the Securities and Exchange Commission.
0
1,000
2,000
3,000
4,000
Q1
/20
17
Q2
/20
17
Q3
/20
17
Oct
20
17
Billion baht A to AAA Group BBB Group Non-Investment Unrated
20
15
20
16

34 | Financial Stability Report 2017
The steady decline both in the outstanding amount and the number of issuers of unrated bonds could be largely attributed to the recent defaults by some issuers, which weighed on sentiment in the corporate bond market and made it challenging for other issuers to issue new bonds or roll-over existing ones. However, issuers especially unrated ones started to make adjustments in the past year. Some had redeemed their issues in full31, while
others began the credit rating process32.
Furthermore, some issuers had made adjustments on the bonds offered for sales. In particular, some issuers that were
31 The total redemption by this group of issuers totaled 38.5 billion baht, or 20 percent of total unrated bond outstanding.
rated BBB or below could not attract enough demand to fill their offers, so they switched to issuing bonds that were of longer maturities or secured by collateral.
Subsequently, default cases also started to emerge for investment-grade bonds, raising investors’ risk awareness and caution. Investors began to rebalance their portfolios toward low-risk corporate bonds, especially those with good ratings (from A to AAA). As a result, corporate bonds in this group grew both in amount and market share. Indeed, the A-rated segment accounted for 80 percent of total corporate bond outstanding at the end of October 2017, compared with 73 percent at end-2016. Consistent with this, the corporate bond spreads of A-rated bonds continued to narrow. This was in contrast with the corporate bond spreads of BBB-rated issues, which widened compared to the beginning of 2017 (Chart 3.2.4).
The Office of the Securities and Exchange Commission (SEC) has been monitoring the situation in the corporate bond market closely. Also, the SEC is currently in the process of improving regulations in several aspects so as to enhance product offering and underwriting standards, responsibilities of arrangers, as well as investor protection. (Details in Box 2: Lessons from corporate bond defaults and policy implications)
32 This group consisted of 11 issuers, with total unrated bond outstanding of 38.5 billion baht, or 20 percent of total unrated bond outstanding.
Chart 3.2.2 Unrated bond outstanding classified by type of instrument
Source: Office of the Securities and Exchange Commission. Note: * Others include subordinated bonds, convertible
debentures, perpetual bonds, Basel III subordinated debts, structured notes, and debentures under securitization project.
326
490 494
459 417 405
0
100
200
300
400
500
600
0
50,000
100,000
150,000
200,000
250,000
300,000
Q1
/20
17
Q2
/20
17
Q3
/20
17
Oct
20
17
Million baht
Others* Debenture B/E Number of unrated bond issuers
Issuers2
01
5
20
16
Chart 3.2.3 Unrated bond outstanding classified by offering manner
Source: Office of the Securities and Exchange Commission.
0
50,000
100,000
150,000
200,000
250,000
300,000
Q1
/20
17
Q2
/20
17
Q3
/20
17
Oct
20
17
Million baht II&HNW PP-limited offer
20
15
20
16
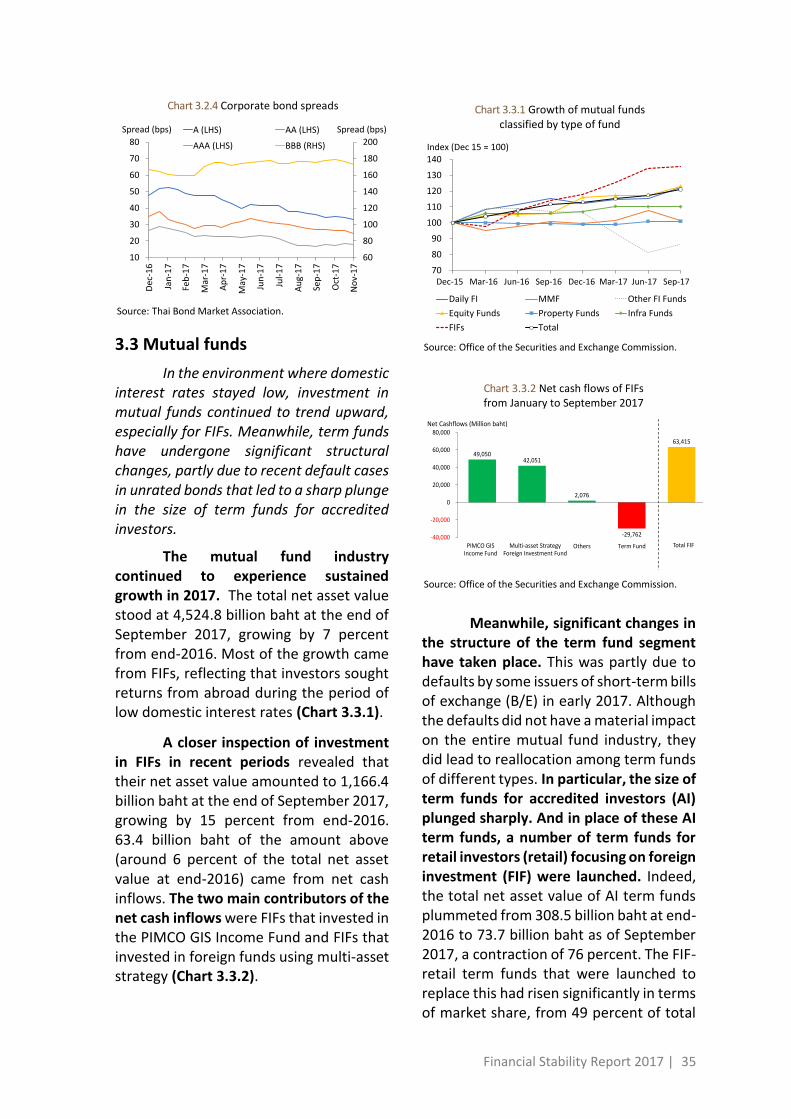
Financial Stability Report 2017 | 35
3.3 Mutual funds
In the environment where domestic interest rates stayed low, investment in mutual funds continued to trend upward, especially for FIFs. Meanwhile, term funds have undergone significant structural changes, partly due to recent default cases in unrated bonds that led to a sharp plunge in the size of term funds for accredited investors.
The mutual fund industry continued to experience sustained growth in 2017. The total net asset value stood at 4,524.8 billion baht at the end of September 2017, growing by 7 percent from end-2016. Most of the growth came from FIFs, reflecting that investors sought returns from abroad during the period of low domestic interest rates (Chart 3.3.1).
A closer inspection of investment in FIFs in recent periods revealed that their net asset value amounted to 1,166.4 billion baht at the end of September 2017, growing by 15 percent from end-2016. 63.4 billion baht of the amount above (around 6 percent of the total net asset value at end-2016) came from net cash inflows. The two main contributors of the net cash inflows were FIFs that invested in the PIMCO GIS Income Fund and FIFs that invested in foreign funds using multi-asset strategy (Chart 3.3.2).
Meanwhile, significant changes in the structure of the term fund segment have taken place. This was partly due to defaults by some issuers of short-term bills of exchange (B/E) in early 2017. Although the defaults did not have a material impact on the entire mutual fund industry, they did lead to reallocation among term funds of different types. In particular, the size of term funds for accredited investors (AI) plunged sharply. And in place of these AI term funds, a number of term funds for retail investors (retail) focusing on foreign investment (FIF) were launched. Indeed, the total net asset value of AI term funds plummeted from 308.5 billion baht at end-2016 to 73.7 billion baht as of September 2017, a contraction of 76 percent. The FIF-retail term funds that were launched to replace this had risen significantly in terms of market share, from 49 percent of total
Chart 3.2.4 Corporate bond spreads
Source: Thai Bond Market Association.
60
80
100
120
140
160
180
200
10
20
30
40
50
60
70
80D
ec-1
6
Jan
-17
Feb
-17
Mar
-17
Ap
r-1
7
May
-17
Jun
-17
Jul-
17
Au
g-1
7
Sep
-17
Oct
-17
No
v-1
7
Spread (bps)Spread (bps) A (LHS) AA (LHS)
AAA (LHS) BBB (RHS)
Chart 3.3.1 Growth of mutual funds classified by type of fund
Source: Office of the Securities and Exchange Commission.
70
80
90
100
110
120
130
140
. . . . . . . . . . . . . . . . Daily FI MMF Other FI Funds
Equity Funds Property Funds Infra Funds
FIFs Total
Index (Dec 15 = 100)
Dec-15 Mar-16 Jun-16 Sep-16 Dec-16 Mar-17 Jun-17 Sep-17
Chart 3.3.2 Net cash flows of FIFs from January to September 2017
Source: Office of the Securities and Exchange Commission.
49,05042,051
2,076
-29,762
63,415
-40,000
-20,000
0
20,000
40,000
60,000
80,000
PIMCO)
Multi-asset
Strategy)
Others Term Fund FIF
Net Cashflows (Million baht)
PIMCO GIS Income Fund
Total FIFMulti-asset Strategy Foreign Investment Fund

36 | Financial Stability Report 2017
term fund outstanding at end-2016 to 78 percent at the end of September 2017 (Chart 3.3.3).
Looking at the term fund segment by investor type and destination country, the shares of retail and FIF term funds had risen. The ratio of retail term fund to total term fund outstanding rose materially from 60 percent at the end of 2016 to 89 percent in September 2017. Concurrently, the ratio of FIF term fund to total term fund outstanding rose from 76 percent at the end of 2016 to 84 percent as of September 2017 (Chart 3.3.4).
With respect to the riskiness of their investment, mutual funds seemed to invest less in risky assets. At the end of September 2017, mutual funds’ holdings of non-investment grade and unrated bonds accounted for 0.8 and 0.2 percent of total assets of fixed-income funds, respectively (Chart 3.3.5). In Thai baht, the holdings were 20.5 and 6.6 billion baht, respectively, down from 31.0 and 46.4 billion baht at the end of 2016.
An assessment of mutual funds’ investment in foreign bonds and deposits, which saw a continued increase in recent periods, revealed that positions were concentrated in a handful of countries. As of September 2017, the top three destinations namely China, UAE, and Qatar accounted for 55, 16, and 15 percent of mutual funds’ investment in foreign
Chart 3.3.3 Net asset values of term funds
classified by investor type and destination
Source: Office of the Securities and Exchange Commission.
5%
0
100,000
200,000
300,000
400,000
500,000
600,000
700,000
800,000
900,000
. . . . . . . . . . . . . . . .
AI-FIF Retail-FIF AI-Domestic Retail-DomesticNAV (Million baht)
683,882
745,652 754,106 771,149 746,063 730,183
670,567668,067
Dec-15 Mar-16 Jun-16 Sep-16 Dec-16 Mar-17 Jun-17 Sep-17
Chart 3.3.4 Structural shifts within the term fund
segment, classified by investor type and destination
Source: Office of the Securities and Exchange Commission.
0%
20%
40%
60%
80%
100%
. . . . . . . . . . . . . . . .
AI
Retail
70%
11%
30%
89%40%
60%
Dec-15 Mar-16 Jun-16 Sep-16 Dec-16 Mar-17 Jun-17 Sep-17
0%
20%
40%
60%
80%
100%
. . . . . . . . . . . . . . . .
FIF
Domestic
73%
84%27%
16%
76%
24%
Dec-15 Mar-16 Jun-16 Sep-16 Dec-16 Mar-17 Jun-17 Sep-17
Chart 3.3.5 Investment in high-risk securities
as a percentage of total AUM, where the total AUM is that of equity and mixed funds (for high-risk equities) and that of fixed income funds (for high-risk bonds)
Source: Office of the Securities and Exchange Commission.
5%8% 8%
6%
14%
25%
18%18%
11%8%
1.2%0.8% 1% 2%1.8%0.2%
0%
5%
10%
15%
20%
25%
30%
35%
40%
. .
. .
. .
. .
. .
. .
. .
. .
. .
. .
. .
. .
. .
. .
. .
. .
non-investment grade bond
unrated bond
Equities Bonds
(1) non-SET100(2) mai(3) others
global equity
Dec Dec Dec Sep14 15 16 17
Dec Dec Dec Sep14 15 16 17
Dec Dec Dec Sep14 15 16 17
Dec Dec Dec Sep14 15 16 17

Financial Stability Report 2017 | 37
bonds and deposits, respectively33 (Chart
3.3.6). But for now concentration risks were assessed to remain limited, as fund managers continued to focus on high-rated issuers and hedged their foreign exchange rate risks appropriately.
Deposit-like mutual funds, which include money market funds (MMF) and daily fixed income funds (daily FI), continued to expand mainly from growth in daily FI funds. The total size of daily FI funds stood at 1,514.3 billion baht as of September 2017, or 23 percent of savings and demand deposits (Chart 3.3.7). The large size of such funds reflected investors’ need to obtain higher returns than usual deposit rates. Although daily FI funds were allowed to invest in riskier assets compared to MMFs, their investment in the past carried low risks - whether in terms of market risk, credit risk, or liquidity risk34. The SEC has been monitoring these
deposit-like funds closely, and has been focusing on highlighting the differences
33 Investment destination country is determined using issuer’s country of residence. 34 According to data as of the end of September 2017, risks related to daily FIs due to market risks, credit risks, and liquidity risks appeared to be limited as follows: (1) Market risks: over 78 percent of daily FI funds had a portfolio duration of less than one year. (2) Credit risks: for daily FI funds, investment in government bonds, deposits, and corporate bonds with credit rating of A or above constituted over 92 percent of total portfolio. (3) Liquidity risks: for daily FI funds, investment in highly
between daily FI funds and MMFs35. This
was to ensure that investors could make investment decisions that were consistent with their risk tolerance.
3.4 Savings cooperatives
Savings cooperatives’ asset base continued to expand rapidly, although the growth rate slowed a little from the years before. Their investment in securities had also increased, which made them grown more integrated with the overall financial system. Thus, it is still necessary to quickly upgrade the related legal framework, as well as the risk management oversight and good governance of savings cooperatives.
The savings cooperatives system continued to grow in size. As of October 2017, the system’s total asset stood at 2.6 trillion baht, expanding by 7.1 percent over the same period in 2016. This was mainly due to deposits that rose by 10.2 percent over the same period in 2016. The deposit growth rate recorded above was
liquid securities, which could be redeemed within one day, accounted for 31 percent of total portfolio. 35 Because most daily FI funds adopt t+1 settlement for redemption, similar to the convention used by MMFs, investors could be mistaken that daily FI funds and MMFs are similar. But in fact, daily FI funds could entail higher risks. This is because MMFs are required to invest only in high-quality and highly liquid assets with low price volatility, while daily FI funds are allowed to invest in riskier assets.
Chart 3.3.6 Composition of mutual funds’ investment in foreign bonds and deposits,
classified by destination country
Source: Office of the Securities and Exchange Commission.
35% 33% 26% 25%35%
44% 52% 55%
19% 27%32% 30%
27%19%
15% 16%7%
15% 14% 18%21% 22% 20% 15%
0%
20%
40%
60%
80%
100%
. . . . . . . . . . . . . . . . China UAE Qatar Malaysia HK
Korea Turkey Indonesia Brazil Others
Dec-15 Mar-16 Jun-16 Sep-16 Dec-16 Mar-17 Jun-17 Sep-17
Chart 3.3.7 Size and growth of Daily FI funds and MMFs
Source: Office of the Securities and Exchange Commission.
0.24 0.33 0.32 0.25 0.26 0.26 0.26
0.240.34 0.43
0.8
1.231.38 1.51
0.0
0.5
1.0
1.5
2.0
. .
MMF Daily Fixed
Trillion baht
2011 2012 2013 2014 2015 2016 Sep-17

38 | Financial Stability Report 2017
indeed a deceleration from 20 percent growth in 2016. Part of this was due to related regulators’ collaboration in strengthening the supervisory standard to a more appropriate level. Meanwhile, growth in members’ equity picked up marginally from the preceding year to 7.2 percent (Chart 3.4.1).
While savings cooperatives’ assets grew rapidly from members’ deposits and equities, loan extension in October 2017 increased by only 3.9 percent over the same period of 2016. This resulted in excess liquidity, which was used to invest in securities to obtain higher returns. As of October 2017, savings cooperatives’ investment in bonds and stocks grew by 21.3 and 25.1 percent, respectively, from the same period of 2016. Thus, the share of investment in securities to total assets continued on an upward trend, reaching 16.2 percent in October 2017 (Chart 3.4.2). Furthermore, the members came to expect higher returns from savings cooperatives compared to banks’ persistently low deposit rates. Such expectation exerted pressure on savings cooperatives to invest more in securities to enhance yields. The increased investment in securities, in turn, also made the savings cooperatives system more integrated with the overall financial system.
Despite their higher investment in securities, the amount invested was still not that high. Indeed, the majority (88.1 percent) of the total amount invested was in high-rated bonds. This was partly due to the fact that the investment choices were restricted by regulations, which allowed savings cooperatives to invest only in certain types of assets. That is, they were allowed to invest only in high-quality low-risk securities, such as government and state-owned enterprise bonds, bonds issued by financial institutions, and corporate bonds with good ratings (A- or above). Thus, the credit risks of savings cooperatives’ investment were limited. But market risks were still present and should be monitored, as this could lead to fluctuations in the investment value.
Furthermore, risks started to accumulate in the savings cooperatives system as many cooperatives faced similar management problems. For example: (1) there seemed to be a lenient practice of assisting borrowers by allowing debt rollover. This could distort NPL levels of the savings cooperatives system, as well as their ability to accurately reflect true risk exposure and loan quality. In addition, such practice did not address borrowers’ underlying problems. (2) Borrowers’ risks were likely to be underestimated. It is true that savings cooperatives have preferred rights to deduct borrowers’ monthly
Chart 3.4.1 Growth in assets and liabilities of the savings cooperatives system
Source: Cooperative Auditing Department and Bank calculations.
0
10
20
30
40
50
Dec-12 Dec-13 Dec-14 Dec-15 Dec-16 .
Assets Investment in stocks
Loan Investment in debt instruments
Deposit Equity funds
%YoY
Oct-17
Chart 3.4.2 Sources and uses of funds of the savings cooperatives system
Source: Cooperative Auditing Department and Bank calculations.
0.0
0.5
1.0
1.5
2.0
2.5
3.0
Dec-11 Dec-12 Dec-13 Dec-14 Dec-15 Dec-16 .
Loan
Cash and deposit
Investment
Equity funds
Deposit
Borrowing
Trillion baht
Oct-17

Financial Stability Report 2017 | 39
income before other creditors. But given that most savings cooperatives are not members of the National Credit Bureau, it was likely that they were unaware of borrowers’ total debt obligations in the case that the borrowers had debts with multiple financial institutions. (3) Lastly, in funding long-term loans given to members, savings cooperatives often relied on short-term borrowings form financial institutions and fellow savings cooperatives, given that short-term borrowings were less costly than long-term ones. Such practice gave rise to maturity mismatch, which could add to liquidity risks. Indeed, a financial or liquidity issue in any single savings cooperative, especially a large one, could impair the public’s confidence in the cooperatives system. Preserving members’ confidence is thus important for proper functioning of the cooperatives system, and is also important for the economy because the cooperatives system is closely linked with the household sector, which is their main member base.
Although relevant regulators have taken a number of steps to improve on prudential regulations, there remains an urgent need to upgrade the legal framework and the surveillance process for savings cooperatives. This is to ensure that savings cooperatives have proper risk management and good governance, and that their operations are in alignment with the underlying philosophy of cooperatives.
3.5 Insurance businesses
Insurance businesses continued to grow, with more investment abroad and a greater allocation into risky assets both to diversify and seek returns. In addition, the prolong period of low interest rates had forced insurance businesses to adapt their
strategy both in terms of products offered and investment.
Insurance businesses continued to grow. In 2017Q3, the overall insurance industry expanded by 5.7 percent from the same period last year, with life and non-life segments growing by 6.2 and 3.0 percent, respectively.
Overall, life insurance companies’ investment grew steadily. As of 2017Q3, the total value of life insurers’ investment portfolio stood at 3.2 trillion baht, an increase of 9.4 percent from the same period of 2016. Despite the growing size, there was no significant change in the composition of the investment portfolios, with domestic government and corporate bonds accounting for 71.8 percent of the total portfolio value similar to 2016 (Chart 3.5.1). With respect to asset classes, life insurers seemed to have a tendency to continue expanding their investment abroad both to diversify risks and seek additional returns. Despite some slowdown in 2017Q1 due to geopolitical concerns, life insurers’ foreign investment resumed expansion for the rest of the year. As of 2017Q3, life insurers’ foreign investment totaled 225.7 billion baht, or 7.1 percent of their total investment value, most of which were in foreign bonds (Chart 3.5.2). On top of their investment abroad, life insurers also invested broadly in various classes of domestic assets. As of 2017Q3, the investment in property funds, real estate investment trusts (REITs), traditional funds, and infrastructure funds increased to 66.6 billion baht, or 2.1 percent of their total investment portfolio. Meanwhile, investment in fixed income securities was still largely concentrated in investment grade bonds, but there seemed to be a marginal increase in the share of investment in lower-rated bonds so as to enhance yields.

40 | Financial Stability Report 2017
Furthermore, the prolonged low interest rate environment began to affect life insurance companies. Life insurers were under pressure to modify their investment strategies, as discussed earlier, and adjust their products offerings to address the challenges in asset-liability management in the low-rate environment. (Details in Box 3: Insurance businesses in the low-for-long environment).
With regard to non-life insurance companies, they invested a greater proportion of their portfolio in property funds and infrastructure funds, as well as lower-quality bonds to enhance returns. Their total investment portfolio was worth 309.1 billion baht as of 2017Q3, an increase of 3.0 percent from the same period of 2016. Investment in domestic government and corporate bonds, bank deposits, and equities accounted for 38,
29, and 28 percent of the total investment portfolio, respectively. This was largely unchanged from 2016 (Chart 3.5.3). Moreover, non-life insurers also invested more in property funds, REITs, and infrastructure funds, with the amount invested growing to 12.8 billion baht or 4.1 percent of their total investment portfolio. Similar to life insurance companies, non-life insurers invested a greater proportion of their portfolio in lower-quality bonds, although the increase was marginal.
Chart 3.5.1 Composition of life insurance companies’ investment portfolio
Source: Office of Insurance Commission.
52% 51% 51% 52% 53% 52% 51% 50% 51% 52% 51%
22% 21% 22% 21% 21% 21% 21% 21% 21% 21% 21%
7% 7% 6% 6% 6% 6% 6% 6% 7% 6% 7%
5% 6% 7% 7% 7% 7% 7% 7% 7% 7% 7%
0%
20%
40%
60%
80%
100%Q
1/2
01
5
Q2
/20
15
Q3
/20
15
Q4
/20
15
Q1
/20
16
Q2
/20
16
Q3
/20
16
Q4
/20
16
Q1
/20
17
Q2
/20
17
Q3
/20
17
1. Deposit 2. Public-sector bond3. Corporate bond 4. Equity5. Property fund / REIT / infra fund 6. Commodity fund7. Futures contract 8. Policy loan9. Loan 10. Other assets11.Foreign investment
Chart 3.5.2 Composition of life insurance companies’ foreign investment portfolio
Source: Office of Insurance Commission.
12%
5%
10%
20%
14%
1%
5%9% 7%
2%-1%
3% 3%
-5%
0%
5%
10%
15%
20%
25%
30%
0
50,000
100,000
150,000
200,000
250,000
Q3/2
557
Q4/2
557
Q1/2
558
Q2/2
558
Q3/2
558
Q4/2
558
Q1/2
559
Q2/2
559
Q3/2
559
Q4/2
559
Q1/2
560
Q2/2
560
Q3/2
560
Million baht
Series5
% QoQ
Percentage change QoQ
Deposit
Mutual fund
Debt instrument Equity
12%
5%10%
20%
14%
1%
5%9% 7%
2%-1%
3% 3%
-5%0%5%10%15%20%25%30%
0
50,000
100,000
150,000
200,000
250,000
Q3/2
557
Q4/2
557
Q1/2
558
Q2/2
558
Q3/2
558
Q4/2
558
Q1/2
559
Q2/2
559
Q3/2
559
Q4/2
559
Q1/2
560
Q2/2
560
Q3/2
560
Million baht
Series5
% QoQ
Q3
/20
14
Q4
/20
14
Q1
/20
15
Q2
/20
15
Q3
/20
15
Q4
/20
15
Q1
/20
16
Q2
/20
16
Q3
/20
16
Q4
/20
16
Q1
/20
17
Q2
/20
17
Q3
/20
17
Chart 3.5.3 Composition of non-life insurance companies’ investment portfolio
Source: Office of Insurance Commission.
37% 36% 35% 34% 34% 32% 31% 29% 30% 29% 29%
23% 22% 22% 22% 22% 22% 23% 23% 24% 25% 23%
10% 10% 10% 11% 11% 12% 13% 13% 13% 13% 12%
26% 27% 28% 28% 28% 28% 27% 29% 28% 28% 29%
0%
20%
40%
60%
80%
100%
Q1
/20
15
Q2
/20
15
Q3
/20
15
Q4
/20
15
Q1
/20
16
Q2
/20
16
Q3
/20
16
Q4
/20
16
Q1
/20
17
Q2
/20
17
Q3
/20
17
1. Deposit 2. Public-sector bond
3. Corporate bond 4. Equity
5. Property fund / REIT / infra fund 6. Commodity fund
7. Futures contract 8. Loan
9. Other assets 10. Foreign investment

Financial Stability Report 2017 | 41
Box 2: Lessons from corporate bond defaults and policy implications by the Office of the Securities and Exchange Commission (SEC)
The unrated bond market had grown rapidly over the 2015-2016 period. Indeed, the outstanding amount of unrated bonds had risen from 160.7 billion baht at end-2015 (5.2 percent of total corporate bond outstanding36) to 285.1 billion baht at end-2016 (7.5 percent of total corporate bond outstanding). Following the period of rapid growth, default cases then started to emerge. From the beginning of 2016 to October 2017, there were defaults by a total of 10 issuers37, most of which were in unrated bonds and 7 of them were listed on the stock exchange. These incidents had a significant impact on corporates’ ability to raise funds via bond issuance. The impact was particularly severe for the unrated segment, where both the outstanding amount and the number of issuers plummeted. As of October 2017, the total amount of unrated bond outstanding fell to 195.5 billion baht38 (5.1 percent of total corporate bond outstanding) while the number of unrated bond issuers was down to 405 issuers (Chart 2.1). A closer inspection into unrated bond investors revealed that the majority of unrated bonds were sold via private placement to a limited number of investors, with high net worth (HNW) investors being the key investor group. In contrast, institutional investors (II) had reduced their holdings of unrated bonds materially from 117.9 billion baht (41 percent of unrated bond outstanding) as of end-2016 to only 49.2 billion baht (25 percent of unrated bond outstanding) as of October 2017.
Chart 2.1 Unrated bond outstanding and the number of unrated bond issuers
Source: Office of the Securities and Exchange Commission.
For the defaulted issuers who had not repaid their debt, a closer inspection reveals that most were plagued by company-specific problems (i.e. idiosyncratic factors). These telltale signs include operating loss, allegations of fraud, misuse of funds, and conflicts among shareholders.
36 This included all debt securities that were issued by Thai or non-resident issuers, who offered debt securities for domestic sales, sought approval from, or submitted filing or sales report to the SEC. 37 Three of the defaulted issuers had redeemed their debt securities in full. 38 Restricting our attention to unrated bills, which were the type of instrument where defaults occurred, the amount of unrated bill outstanding declined from 133.7 billion baht at end-2016 to only 67.7 billion baht as of October 2017.
160,662 5.2%
173,605 5.5%
209,757 6.0%
257,025 7.2%
285,133 7.5% 265,052
7.0% 215,293 5.7%
198,705 5.3%
195,450 5.1%
326 343
386
431 490
494 459
417 405
0
100
200
300
400
500
600
0
50,000
100,000
150,000
200,000
250,000
300,000
Q4
/20
15
Q1
/20
16
Q2
/20
16
Q3
/20
16
Q4
/20
16
Q1
/20
17
Q2
/20
17
Q3
/20
17
Oct
20
17
Million baht Outstanding Number of issuers Companies

42 | Financial Stability Report 2017
Up to this point, risks from the default situation to overall financial stability are assessed to be limited because of the following: (1) The amount defaulted so far is still a small portion of the overall market. Over the period spanning from early 2016 to October 2017, the total amount defaulted was 6.2 billion baht, or 0.16 percent of total corporate bond outstanding. (2) Investors understand the situation well and could differentiate risks of individual issues. Although the defaults in unrated bonds made it harder for corporate bonds rated BBB or below to be sold, some issuers with robust fundamentals could still seek funding through new bond issuance. In contrast, corporate bonds rated A or above remained largely unaffected and well-bid. This illustrates that investors could differentiate risks of individual issuers and did not lose confidence in the corporate bond market as a whole.
Problems in the corporate bond market
Several factors – issues’ characteristics, issuers, arrangers, and investors – all played a role in the default incidents that occurred in the bond market, as follows.
Types of issues: The defaults occurred mostly in bills of exchange (B/E), which had been sold to general investors. But in fact, the characteristics of B/Es make them unsuited for raising funds from the general investor base. This is because B/Es have restrictions on legal rights and lack investor protection mechanism. For instance, B/Es do not have terms of rights or bondholder representatives, unlike debentures.
Issuers: Many companies issue short-term debts to fund long-term projects, and roll-over debts as they come due. This leads to maturity mismatch between companies’ assets and liabilities. Part of this could also be due to arrangers’ negligence in offering appropriate advice on such matter. Should a large amount of bonds fail to be rolled over, systemic risks could arise.
Meanwhile, some issuers have sold bonds through private placement to a limited number of investors (PP-Limited Offer) via arrangers in a way that deviates from the original intention of PP-Limited Offer. In particular, the original intention was to allow offering to no more than 10 investors within a 4-month period, or no more than 10 bills at a given point in time, to investors who know the issuing companies very well. But in practice, there have been issuers who raised funds through PP-Limited Offer with more than 10 investors. These issuers also sold the issues via arrangers, which caused the issues to reach investors who do not know the issuing companies well. Neither had these investors been provided with sufficient information for making prudent investment decisions.
There was also an issue of regulatory arbitrage between the corporate bond market and the equity market. That is, even companies with corporate governance issues could raise funds by issuing bonds via public offering (PO), in spite of the fact that these companies were concurrently prohibited from issuing equity via PO.
Arrangers: Several arrangers lack a clear separation of roles between the product origination unit, who liaises with issuers and is responsible for product screening, and the sales unit, who is in contact with investors. This impairs the overall quality of the due diligence process. Moreover, the sales protocols might not be in alignment with the sales

Financial Stability Report 2017 | 43
conduct prescribed by the SEC. In such cases, it is possible that the sales process could be in disregard of investors’ suitability and understanding or fail to provide sufficient information related to the products to investors.
Investors: Investors are also considered part of the problems. Some HNW investors make investment decisions based solely on returns, without assessing the associated risks properly. It is also possible that some lack understanding and the key information that could be used for risk assessment.
Policy implications
To address the issues outlined above, the SEC has revised the regulations on the issuance and sales process for corporate bonds. The primary objectives are as follows: (1) to improve investor protection mechanism by restricting the use of B/Es for raising funds from the general investor base; (2) to prevent issuers from using PP-Limited Offer in a manner that deviates from its original intention, which could lead to widespread risks and losses for many; and (3) to enhance protection for investors, especially HNWs, and ensure that they receive sufficient information for making sound investment decisions. Concurrently, the SEC has also revised the regulations on the bond issuance process to make it more convenient for issuers. Details are summarized as follows.
1. Revisions on the supervision of several types of bond offerings to enhance investor protection
(1) Private placement to a limited number of investors (PP-Limited Offer): Debt securities could only be sold to investors who are related to the issuing companies, HNWs, or institutional investors. This is to ensure that such financing activity is restricted, following the original intention of private placement. If the bonds are to be sold to HNWs, sales must be executed via arrangers, so that investors could receive information and advice for making sound investment decisions.
(2) High Net Worth (HNW): HNWs are now classified separately from IIs, since the former need more protection. As an additional requirement, the SEC requires that issuers submit filings to the SEC for approval prior to offering, so that the SEC could assess issuers’ qualifications and disclosures. This aims to prevent unqualified issuers from raising funds from HNWs. Examples of the characteristics that disqualify issuers include, but not limited to: history of violations of laws and regulations related to deceit, fraud, and corruption; providing misleading information to investors; and being managed by untrustworthy board members, executives, or authorities.
(3) Public Offering (PO): As an additional requirement, issuing companies must not have poor record on corporate governance. This includes, for example, doubts that the board members, executives, or major shareholders have a conflict of interest or engage in a transfer of benefits away from the companies.
2. Revisions on the issuance and offering of B/Es
B/Es have restrictions on legal rights and their investor protection mechanism is inferior to debentures, making them unsuited for raising funds from the general investor base. The SEC thus restricts the sales of B/Es only to investors who are related to the

44 | Financial Stability Report 2017
issuing companies and investors classified as IIs or HNWs. Prior to this change, B/Es could be sold to all types of investors.
3. Enhancement of investor protection mechanism
The SEC has issued additional requirements to enhance investor protection. For instance, in an offering of short-term debenture to general investors and HNWs, an issuer must appoint bondholder representatives to protect the interest of bondholders. Also, in any HNW or PO offering, the issuer must disclose key financial ratios39 in the debenture’s
sales report and factsheet to ensure that investors have additional information for making investment decisions.
4. Enhancement of arrangers’ operational standards
For arrangers who liaise with issuers, there must be a clear separation of roles between the product origination unit, who liaises with issuers and is responsible for product screening, and the sales unit, who is in contact with investors. This is to provide checks and balances between the interests of issuers and investors. The SEC has provided operational guidelines as follows:
(1) The product origination unit, who liaises with issuers, is responsible for monitoring and analyzing issuers’ business types, funding objectives, future business plans, key financial ratios, profitability, funding sources, collaterals for secured loans (if any), debt serviceability, as well as additional funding sources for debt repayment.
(2) The sales unit, who is in contact with investors, must have a thorough understanding of the characteristics and associated risks of securities before offering to investors. The sales unit must also provide investment recommendations that fit investors’ risk tolerance.
5. Revisions to make the approval process more convenient for issuers For issuers who have several bond offerings within a short timeframe, having to
submit filing for approval for each offering separately could be inconvenient and burdensome. To address this issue, the SEC has established the Medium Term Note Program (MTN) to streamline the approval process, so that issuers could sell securities in a manner that is convenient, quick, and in line with international practices. The program, which lasts for 2 years from the date of approval, allows issuers to submit approval and disclosure forms only once for the purpose of offering plain vanilla debt securities of any type40 and maturity (sold via PO, HNW, or II) within the 2-year period.
The regulatory changes outlined above are expected to be effective from 2018 onward.
39 Key financial ratios include: (1) net debt to earnings before interest, tax, depreciation, and amortization (EBITDA) ratio; (2) interest coverage ratio (ICR); (3) debt service coverage ratio (DSCR); (4) debt to equity (D/E) ratio; (5) current interest-bearing debt to total interest-bearing debt ratio; (6) current ratio; (7) BE size to interest-bearing debt ratio; and (8) bank loan to total debt ratio. 40 This excludes perpetual bonds, subordinated bonds, structured notes, debentures under securitization project, and Basel III subordinated debts.
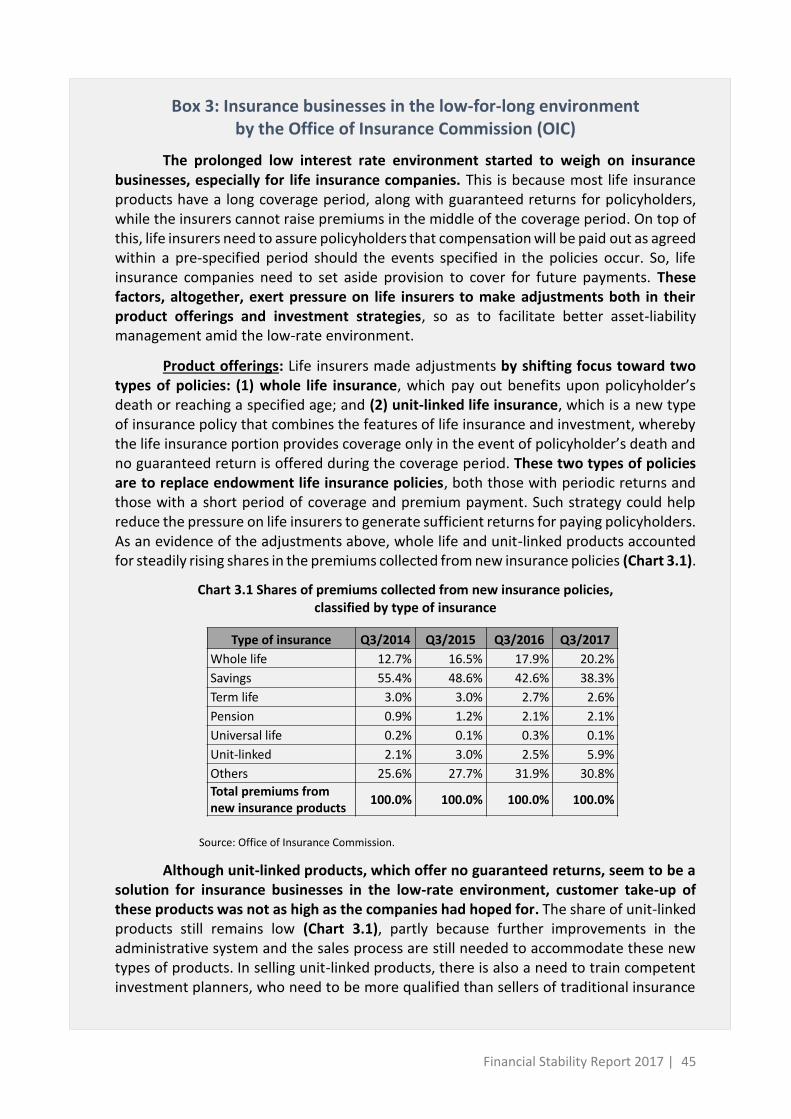
Financial Stability Report 2017 | 45
Box 3: Insurance businesses in the low-for-long environment by the Office of Insurance Commission (OIC)
The prolonged low interest rate environment started to weigh on insurance businesses, especially for life insurance companies. This is because most life insurance products have a long coverage period, along with guaranteed returns for policyholders, while the insurers cannot raise premiums in the middle of the coverage period. On top of this, life insurers need to assure policyholders that compensation will be paid out as agreed within a pre-specified period should the events specified in the policies occur. So, life insurance companies need to set aside provision to cover for future payments. These factors, altogether, exert pressure on life insurers to make adjustments both in their product offerings and investment strategies, so as to facilitate better asset-liability management amid the low-rate environment.
Product offerings: Life insurers made adjustments by shifting focus toward two types of policies: (1) whole life insurance, which pay out benefits upon policyholder’s death or reaching a specified age; and (2) unit-linked life insurance, which is a new type of insurance policy that combines the features of life insurance and investment, whereby the life insurance portion provides coverage only in the event of policyholder’s death and no guaranteed return is offered during the coverage period. These two types of policies are to replace endowment life insurance policies, both those with periodic returns and those with a short period of coverage and premium payment. Such strategy could help reduce the pressure on life insurers to generate sufficient returns for paying policyholders. As an evidence of the adjustments above, whole life and unit-linked products accounted for steadily rising shares in the premiums collected from new insurance policies (Chart 3.1).
Chart 3.1 Shares of premiums collected from new insurance policies, classified by type of insurance
Source: Office of Insurance Commission.
Although unit-linked products, which offer no guaranteed returns, seem to be a solution for insurance businesses in the low-rate environment, customer take-up of these products was not as high as the companies had hoped for. The share of unit-linked products still remains low (Chart 3.1), partly because further improvements in the administrative system and the sales process are still needed to accommodate these new types of products. In selling unit-linked products, there is also a need to train competent investment planners, who need to be more qualified than sellers of traditional insurance
Type of insurance Q3/2014 Q3/2015 Q3/2016 Q3/2017
Whole life 12.7% 16.5% 17.9% 20.2%
Savings 55.4% 48.6% 42.6% 38.3%
Term life 3.0% 3.0% 2.7% 2.6%
Pension 0.9% 1.2% 2.1% 2.1%
Universal life 0.2% 0.1% 0.3% 0.1%
Unit-linked 2.1% 3.0% 2.5% 5.9%
Others 25.6% 27.7% 31.9% 30.8%
Total premiums from new insurance products
100.0% 100.0% 100.0% 100.0%

46 | Financial Stability Report 2017
policies. Another factor that discourages buyers is the fact that returns of unit-linked products are uncertain and could fluctuate with financial markets.
Investment strategies: Life insurance companies made adjustments by continuing to invest more in foreign assets, property funds, REITs, and infrastructure funds, both to diversify risks and search for additional yields in the low-rate environment. But overall, life insurers’ investment has not changed much. Their portfolio is still concentrated in long-term domestic government and corporate bonds, as these securities have low risk and stable returns, which facilitate insurance companies’ asset-liability management.
Despite the fact that life insurers sold policies with lower returns in the low-rate environment, life insurance businesses continued to show strength. In particular, their collected premiums and net profits maintained positive growth (Chart 3.2). The reason is that their products still offer relatively higher returns compared to bank deposits and short-term bonds, and also come with additional tax benefits.
Chart 3.2 Growth in insurance premiums and net profit of life insurance businesses
Source: Office of Insurance Commission.
19%
13% 14%
7%
4%
0%
4%
8%
12%
16%
20%
0
10,000
20,000
30,000
40,000
50,000
60,000
Million baht %YoY
2012 2013 2014 2015 2016
Net profit Growth of insurance premiums

Financial Stability Report 2017 | 47
Chapter 4: Key supervisory developments and safeguarding financial stability going forward
The Bank of Thailand (BOT), the Office of the Securities and Exchange Commission (SEC), and the Office of Insurance Commission (OIC) have been collaborating closely in safeguarding Thailand’s financial stability system, as well as developing the surveillance process and issuing necessary measures to prevent a single pocket of vulnerability from escalating into systemic risks. In 2017, the regulators introduced important prudential measures and regulatory revisions to safeguard stability in several areas, encompassing the financial institutions sector, the household sector, and the payment system. At the same time, the risk assessment exercise via a common risk assessment matrix (RAM) was further developed from the previous year. This was to enhance our stress testing framework to ensure that it fits the current economic and financial context, which has become more complex and challenging to assess.
As the financial system becomes more complex and interconnected, the challenges in safeguarding financial stability in the future lie with the regulators to work together to ensure that the work process for implementing macroprudential policy and the associated institutional arrangement are well-designed and ready for use. This will, in turn, strengthen the overall risk oversight process and thus prevent a pocket of fragility from evolving into systemic risks that could threaten national macro-financial stability.
4.1 Prudential measure on credit card loans and personal loans under regulation
Thailand’s household debt has stayed elevated in recent years. In particular, credit card loans and personal loans under regulation are the loans that are easily accessible by the public, and this could lead the fragile segment of the population such as low-income earners to accumulate debt to the extent that exceeds their ability to repay. To prevent household debt accumulation from weighing on financial stability in the longer term, the BOT has revised the regulation on the supervision of credit card loans and personal loans under regulation, with effect from 1 September 2017 onward. The regulation specifies credit line limits for credit card loans and personal loans under regulation based on borrowers’ income (Table 4.1.1).
Nevertheless, to ensure that the regulation does not impede financial access in case of personal emergency, the BOT allows operators of credit card services and personal loans under regulation to grant temporary credit lines in such case.
Moreover, the BOT has lowered the maximum interest rate that credit card operators can charge from 20 to 18 percent. This aims to reflect lower domestic financial costs and encourage credit card operators to focus more on the management of credit risks and internal business units.

48 | Financial Stability Report 2017
Credit card loans
Monthly income (baht)
Credit line for each operator (times of monthly income)
15,000 to less than 30,000
< 1.5 times
30,000 to less than 50,000
< 3 times
50,000 and above < 5 times
Personal loans under regulation
Monthly income (baht)
Credit line for each operator (times of monthly income)
Less than 30,000 < 1.5 times from a maximum of 3 operators
30,000 and above < 5 times
4.2 Regulation on the supervision of domestic systemically important banks (D-SIBs)
The supervision of D-SIBs, with an aim to safeguard their strength and continuation of financial services, is crucial to the overall stability of the financial system. Therefore, the BOT has issued the regulation on identifying and supervising D-SIBs. The main objectives are to strengthen the supervision of D-SIBs to reinforce their resilience and ensure that they can withstand greater operational losses. This is consistent with the international best practice in banking supervision.
In identifying D-SIBs, the BOT adopts four main criteria as follows: (1) the size of the bank; (2) the interconnectedness with other banks, as measured by interbank transactions and financing activity via capital markets; (3) the role as a key provider of financial services or a key service provider in the financial infrastructure; and (4) the
complexity of financial products or business operations. Based on these criteria, five commercial banks are classified as D-SIBs, namely Bangkok Bank, Krung Thai Bank, Bank of Ayudhya, Kasikornbank, and Siam Commercial Bank. This list will be revised on an annual basis.
D-SIBs are required to maintain an additional 1 percent of common equity tier 1 on top of the usual minimum requirement. This new requirement will be phased in starting from 0.5 percent in 2019 and reaching 1 percent in 2020. Additionally, D-SIBs are also subject to other supervisory measures prescribed by the BOT, such as more frequent and timely reporting of their business groups’ financial positions and risks.
As of September 2017, all five D-SIBs were robust, with an average common equity tier 1 capital ratio of 14.8 percent and an average total capital adequacy ratio of 17.5 percent. These figures were significantly above BOT’s minimum requirements of 7.5 and 11.5 percent for 2019 (8 and 12 percent for 2020), respectively. This reflected strong capital positions of D-SIBs in Thailand.
4.3 Revisions of the supervisory laws for the payment systems
The BOT and the Ministry of Finance (MOF) have together put forward the introduction of the Payment Systems Act, B.E. 2560 (2017), in order to make the supervision of the payment systems more efficient, comprehensive, and supportive for developing Thailand’s payment systems to be on par with the international standard. The Act was published in the Royal Thai Government Gazette on 18 October 2017, and will become effective on 16 April 2018. Existing licensed e-
Table 4.1.1 The specified credit line limits for credit card loans and personal loans under regulation
Source: Bank of Thailand.

Financial Stability Report 2017 | 49
payment service providers who wish to continue their operations must submit an application for a new license to the MOF or register with the BOT by 13 August 2018, or within 120 days from the effective date of the Act.
Once the Act becomes effective, three related laws will then be repealed: (1) the Notification of the Ministry of Finance on Business that Requires a Permit According to Section 5 of the Notification of the Revolution Council No. 58 (Business of Electronic Money Card) dated 4 October 2004; (2) the Royal Decree Regulating Electronic Payment Service Business, B.E. 2551 (2004); and (3) the Royal Decree Regulating Electronic Payment Service of Specialized Financial Institution, B.E. 2559 (2016). This replacement will result in a more unified body of laws on the supervision of the payment systems, higher efficiency in maintaining the stability of the payment systems, as well as lower compliance costs for businesses given that they no longer have to comply with many laws.
Under the Payment Systems Act, B.E. 2560 (2017), the supervision of the payment systems is divided into three parts, as follows:
(A) Important payment systems refer to payment systems that serve as the nation’s primary infrastructure that accommodates fund transfers, clearing, or settlement between financial institutions. An interruption in such payment system could disrupt the entire financial system. Examples are the Bank of Thailand Automated High-Value Transfer Network (BAHTNET) and the Imaged Cheque Clearing and Archive System (ICAS).
(B) Payment systems under regulation refer to central systems that provide the services of receiving and
transmitting payment data, calculating net payments, or conducting settlements (i.e. switching, clearing, or settlement services) for member institutions. Examples are the National Interbank Transaction Management and Exchange (NITMX), the Processing Center Company (PCC), and the ATM Pool.
(C) Payment services under regulation refer to payment services provided to customers or the general public through certain instruments or channels. Examples are credit cards, debit cards, e-Money cards, payment services, and money transfers.
Service providers under category (B) and (C) can be commercial banks, specialized financial institutions, and non-banks.
Under the Payment Systems Act, B.E. 2560 (2017), the Minister of Finance is designated as the minister responsible, with full legal authority to prescribe the characteristics and types of payment systems and payment services under regulation that require an approval from the Minister of Finance or a registration with the BOT, on a case-by-case basis. In addition, the BOT is responsible for supervising and prescribing the regulations on the payment systems and payment services businesses under regulation. This encompasses the entire process from application or registration, supervision, to providing steps to amend weak financial positions or operational losses. The key components of the supervisory framework are as follows:
(1) Risk management and security: This is to ensure that the management of risks of various nature such as systemic risks, settlement risks, and operational risks are suitable for the payment systems and payment services businesses. This component of the framework also includes the overall

50 | Financial Stability Report 2017
security of the information system, encompassing the key areas namely security, integrity, and availability.
(2) Financial strength of service providers: This is to ensure that service providers have strong financial positions and can continue providing services. One example of the regulations in this area is to require a minimum paid-up capital.
(3) Governance: This is to ensure that service providers’ internal management process and organization structure have proper checks and balances, and that their board members and executives are qualified.
(4) Consumer protection: This is to ensure that customers are justly protected especially in the areas of float protection, complete and accurate information disclosure, handling and processing of complaints, as well as the determination of fee structure.
(5) Efficiency and competitiveness: This is to ensure that the supervision is applied equitably, promotes competition, and encourages innovation. This will enhance efficiency and further enhance Thailand’s payment systems and payment services.
4.4 Enhancing the supervision of the cooperatives system
Recently, savings cooperatives have grown in size, importance, and their interconnectedness with other players in the financial system. Such interconnectedness arises from both interbank borrowing for the purpose of liquidity enhancement and investment of excess liquidity in the capital markets to seek additional returns. Furthermore, members typically expect their savings cooperatives to pay decent returns on savings while granting loans with low
interest rates. Such expectations force the cooperatives to take on more risks. It is therefore essential that these cooperatives have good governance and risk management system in place, so that they remain resilient and can continue their operations without affecting the overall financial stability.
The relevant regulators worked together and viewed that the efforts to enhance the supervision of savings cooperatives should cover four key dimensions as follows: (1) Legal authority should be granted to regulators of savings cooperatives, so as to ensure that the supervision process is efficient and timely. (2) The regulations related to governance and key risks including credit risk, liquidity risk, and operational risk should be issued so as to strengthen the cooperatives system. (3) Key infrastructure such as the data and information systems must be reformed. This will prove useful for future planning, analysis, and monitoring of risks. (4) Lastly, a centralized liquidity management center for the cooperatives system should be established. Indeed, managing liquidity within the cooperatives system could lessen the need to borrow from other financial institutions, and thus limit liquidity spillover from the cooperatives system to other parts of the financial system.
The Cooperative Promotion Department, the Cooperative Auditing Department, the Fiscal Policy Office, and the BOT have worked together to reform the management and supervision of savings cooperatives and credit union cooperatives. This aims to preserve stability and confidence in Thai financial institutions system. Collaboration among the organizations has been regular, with key developments including the introduction of ceiling on

Financial Stability Report 2017 | 51
deposit rates offered by cooperatives and borrowing limit for cooperatives. The purpose is to restructure the funding sources of cooperatives and discourage fierce competition for funds via high deposit rates. Going forward, other important regulations will subsequently be issued as deemed appropriate. With regard to the development of database for the purpose of supervising cooperatives, the initial phase of the project requires savings cooperatives and credit union cooperatives with an asset size above five billion baht to report their data to the Cooperative Promotion Department. In parallel to this, the regulators have to develop their own database systems as well so that they are able to accommodate data reporting from cooperatives. These developments will facilitate timely monitoring of cooperatives’ financial positions and risks. Moreover, the Office of the Council of State is currently in the process of revising the draft of the Cooperatives Act. The primary objectives are to make the Act more conducive to cooperatives’ promotion and development, as well as to empower the regulators with more supervisory power. These will serve to enhance the supervision of cooperatives and strengthen the cooperatives system going forward.
4.5 Assessment of risks to the Thai financial system using the Risk Assessment Matrix (RAM)
The BOT, the SEC, and the OIC have worked together in creating a common risk assessment matrix (RAM)41,
41 After the global financial crisis, the International Monetary Fund (IMF) along with regulatory agencies in several countries have developed systematic and interconnected processes for assessment of risks to the financial system. RAM is used as a starting point
which is a key tool for assessing risks to financial stability through the means of scenario analysis. The scenarios are constructed to fit the current economic context, which has become increasingly complex and makes it more challenging to safeguard financial stability. The RAM exercise is conducted on an annual basis.
(1) Risk assessment via RAM for 2017 focuses on assessing key risk factors that involve linkages among the regulators, taking into account the current economic and financial context. There scenarios are specified, as follows (Table 4.5.1):
Scenario 1: Fragile global economic recovery. Under this scenario, the global economic recovery is viewed to be fragile due to slowdown in China, which results from unsuccessful rebalancing and intensified corporate debt problems. On the other hand, the Federal Reserve delays its rate hikes, while the European Central Bank (ECB) and the Bank of Japan (BOJ) maintain their accommodative monetary policy. Moreover, there are risks from the US economic and trade policies as well as geopolitical risks, which contribute to heightened volatility in cross-border capital flows and global financial markets.
Scenario 2: Fragile global economic recovery, combined with contraction in domestic demand. On top of fragile global economic recovery, domestic demand is assumed to contract due to additional domestic issues, which in turn undermine confidence and trigger capital outflows. Meanwhile, the government is constrained in its ability to stimulate the economy. All these factors
and a communication tool with the public, as reflected in the IMF Staff Reports for the Article IV Consultation with member countries, as well as the Financial Sector Assessment Program (FSAP).

52 | Financial Stability Report 2017
weigh on household income as well as businesses’ financial positions, especially those of certain SMEs that are already fragile. This would cause NPLs of both businesses and households to rise. In the meantime, capital outflows put a downward pressure on prices of financial assets, which cause some mutual funds to face higher redemption from unitholders, while businesses’ funding costs increase overall.
Scenario 3: Weak global and domestic economies trigger corporate debt defaults. In addition to the gloomy economic backdrop at home and abroad, this scenario further assumes that a large real estate company defaults on its debt security, which in turn generates spillover to other related sectors. As a result, financial market sentiment is severely damaged, asset prices plummet, and investors rush to redeem their investment in mutual funds en masse. This results in a surge in businesses’ financing costs. Meanwhile, weaknesses in the economy cause debt serviceability of the private sector, particularly households and SMEs, to deteriorate further.
The three scenarios are ranked by the severity of their impact on the Thai economic and financial system, from low to high. It should be stressed that the scenarios are not linked with probability of occurring.
(2) The use of RAM in stress testing: After assessing the overall risks using RAM, the BOT translates the three scenarios into quantitative economic and financial variables (Table 4.5.2). These assumptions will then be used as inputs in stress testing exercises to assess the resiliency of financial institutions under such scenarios.
Going forward, the financial system is likely to become even more
complex and interconnected. The challenges therefore lie with the regulators to collaborate closely especially on two key aspects: (1) The regulators need to prepare a setup to accommodate the potential introduction of macroprudential policy. In particular, there is an urgent need for supervisory databases that facilitate risk monitoring, which in turn enables policymakers to prescribe policies that are well-designed and targeted. Also, (2) the regulators need to enhance and re-design the current institutional arrangement. This is to make the risk oversight process and the inter-agency collaboration in overseeing systemic risks more efficient, covering all financial institutions that are significant to the financial system, and flexible enough to cope with new forms of risks in a timely manner.

Financial Stability Report 2017 | 53
Table 4.5.1 Scenarios in the 2017 Risk Assessment Matrix (RAM)
Sources of risk Key events Expected impact
Scenario 1 : Fragile global economic recovery
China’s economic
slowdown and
financial problems
in the corporate
sector weigh on
global economic
recovery.
Meanwhile,
geopolitical risks
stay elevated.
- The global economy recovers at a slower pace due to China’s unsuccessful rebalancing policy and intensified corporate debt problems.
- Businesses related to exports and tourism with exposure to China become more fragile.
- Financial markets become more volatile, particularly for funds that invest in China.
Expected impact: medium
Economy: GDP growth decelerates, as both merchandise
exports and tourism are affected by China’s economic
slowdown and softening global recovery.
G3 monetary policy: The Federal Reserve delays rate hikes but
continues to shrink its balance sheet gradually, while the ECB
and the BOJ maintain their accommodative monetary policy.
Financial markets: Cross-border capital flows become more
volatile. Government bond yields rise due to deteriorated
confidence in emerging markets (EMs). In the meantime,
China’s corporate debt problems have an adverse impact on:
(1) confidence in EM financial markets and the SET;
(2) confidence in funds that invest in China, triggering
redemption and a fall in NAVs; and (3) for Thai companies that
trade heavily with China, some could see a decline in debt
serviceability and defaults could emerge. Meanwhile, prices of
other assets, such as real estate, could start to fall.
Government: The government maintains its role in stimulating
the economy.
Businesses and households: Businesses’ financial positions
deteriorate especially for those related to exports and tourism.
Households’ financial positions also weaken in line with falling
incomes.
Financial institutions: NPLs rise both for consumer and SME
loans. NPLs are also higher for loans given to businesses with
high exposure to China.
Scenario 2 : Fragile global economic recovery, combined with contraction in domestic demand
On top of the
external risk factors
from Scenario 1,
additional domestic
issues are assumed
to affect the Thai
economy further,
resulting in a
contraction in GDP.
- Domestic demand contracts, especially from consumption and investment. Meanwhile, the government is constrained in its ability to stimulate the economy.
- Corporate financial positions deteriorate, with closures seen among SMEs and more fragility in the real estate sector. Households’ financial positions worsen in line with income and employment.
- There is a loss of confidence across financial markets, with some funds facing even more redemption. Corporate funding costs rise somewhat.
Expected impact: high
Economy: GDP growth contracts mainly due to a slowdown in
government spending, consumption, and exports, as well as a
contraction in tourism. Export growth, though still in the
positive territory, is not enough to offset falling incomes. In
addition, more workers are replaced by machines.
Financial markets: Capital outflows and higher volatility are
observed. Bond yields rise, while the SET Index falls. Given the
capital outflows, which are induced by both external and
domestic factors, Thai baht is on a depreciating trend and
becomes more volatile.
Government: The government is constrained in its ability to
stimulate the economy.
Businesses and households: Although large corporates
continue to make profits, some SMEs that are domestic-
oriented have to close their businesses. Fragility increases in the
real estate sector. Meanwhile, households’ financial positions
worsen in line with employment.
Financial institutions: NPLs rise both for consumer and SME loans, as well as loans given to some large corporates.

54 | Financial Stability Report 2017
Sources of risk Key events Expected impact
Scenario 3 : Weak global and domestic economies, triggering corporate debt defaults
On top of Scenario 2 (weak global and domestic demand), this scenario further assumes a default in the corporate bond market.
- A large real estate company faces difficulty in repaying its debt, leading to a corporate bond default and a surge in NPL.
- There is a loss of confidence across financial markets. Prices of securities and real estates plunge sharply. Corporate funding costs rise.
Expected impact: extremely high
Economy: GDP contracts sharply. Massive layoffs occur in the
real estate sector and related businesses.
Financial markets: There are widespread corporate debt
defaults.
- A large real estate company defaults on its debt securities, while companies in related businesses also see their debt serviceability declining. This results in a widening in corporate bond spreads particularly in the first month following the default. Also, the loss of confidence across financial markets trigger a fire sale of assets, causing stock and bond prices to plummet. For mutual funds, this accelerates redemption by unitholders, which in turn forces fund managers to withdraw their deposits and liquidate other liquid assets such as government bonds. Consequently, this causes medium- to long-end government bond yields to rise.
- Real estate prices and the SET Index tumble.
- Severe liquidity shortage in the financial markets, especially in the first month following the default, hurts commercial banks’ balance sheets and funds’ NAVs.
- Capital outflows ensue due to loss of confidence, pressuring Thai baht to depreciate along with heightened short-term volatility.
Businesses and households: Corporate financial positions
worsen, especially for firms in the real estate sector and related
businesses. Households start to default on their debts as debt
burden rises while liquidity dries up.
Financial institutions: NPLs rise in all sectors, particularly the real estate sector and related businesses. At the same time, financial positions of securities companies and asset management companies weaken, while liquidity need rises.
Table 4.5.2 Economic and financial variables for the 2017 RAM exercise
Factors Scenario 1 Scenario 2 Scenario 3
2018 2019 2020 2018 2019 2020 2018 2019 2020
1. GDP growth (real GDP) 2.2% 2.2% 2.5% -1.5% -0.3% 1.5% -3.0% -1.0% 1.0%
2. Number of tourists (million) 35.0 35.5 36.5 29.0 26.5 28.0 29.0 26.5 28.0
3. Agricultural price index (%YoY) -7.5% 3.0% 4.5% -8.0% 2.0% 4.0% -9.5% 1.0% 3.5%
4. Real GDP growth: US 1.7% 1.7% 1.9% 1.7% 1.7% 1.9% 1.7% 1.7% 1.9%
5. Real GDP growth: China 4.0% 4.0% 4.5% 4.0% 4.0% 4.5% 4.0% 4.0% 4.5%
Source: Bank of Thailand.

Financial Stability Report 2017 | 55
Box 4: Cryptocurrency and its implications on Thailand’s financial stability
What is cryptocurrency?
Cryptocurrency, such as Bitcoin, Ether, and Litecoin has been created as a medium of exchange via computer network systems. Its key characteristics are: (1) the use of cryptography to enhance security of data transmission; (2) the use of consensus mechanism for validating and verifying transactions without a need for an intermediary responsible for validating transactions; and (3) the use of decentralized control through a blockchain, which functions as a distributed ledger that stores a growing list of transaction records in chronological order and replicates the records across nodes, making the system resistant to modification of data because the modified data would not match the ones stored by peers.
Another feature that distinguishes cryptocurrency from e-money (e.g. stored-value card and digital wallet) is that no single authority monopolizes the issuing of new currency supply. Instead, an alternative mechanism is in place, where participants could participate by sacrificing their resources (e.g. computer’s processing power and electricity) to help validate transactions and, in return, receive an agreed amount of cryptocurrency as a reward – a process known as “mining”. In the case of Bitcoin, the first cryptocurrency launched in 2009, the system has specified that the amount of bitcoins rewarded through the mining process will reduce automatically, and no new bitcoin will be issued after the total number of bitcoins reaches 21 million. E-money, in contrast, has a centralized intermediary and is required by law to be fully backed by money issued by central bank.
Developments and popularity of cryptocurrency
Initially, cryptocurrency was mainly used as a medium of exchange. Its distinctive feature, compared to other means of electronic payment (e.g. bank transfers and debit and credit cards), is its ability to conceal user’s identity. Subsequently, cryptocurrency began to be used as a medium of international money transfers, as it is faster than a conventional wire transfer and transactions can be completed easily using a smartphone. Until now, thousands more cryptocurrencies have emerged, with varying characteristics and purposes. Ether, for instance, supports a smart contract, which can be programmed to undertake transactions automatically based-on specified conditions. Another cryptocurrency, Zcoin, can mask user’s identity better than Bitcoin.
In the past 2-3 years, the usage of cryptocurrency has been developed further as a tool for raising funds via Initial Coin Offering (ICO). In this process, companies issue a digital token instead of a security, or issue a new cryptocurrency to be exchanged with popular cryptocurrencies such as Bitcoin or Ether from investors. The funds will then be invested in tech-related businesses. From 2007 to September 2017, it is estimated that around 2.7 billion USD was raised via ICO globally, 1.7 billion USD of which occurred during January and September 2017. Such dramatic expansion in ICOs has led several countries to explore appropriate ways to supervise and enhance investor protection. This is because of potentially high risks from ICOs, given that most ICOs are done by small businesses and there could also be an issue of fraud or breach of contract.
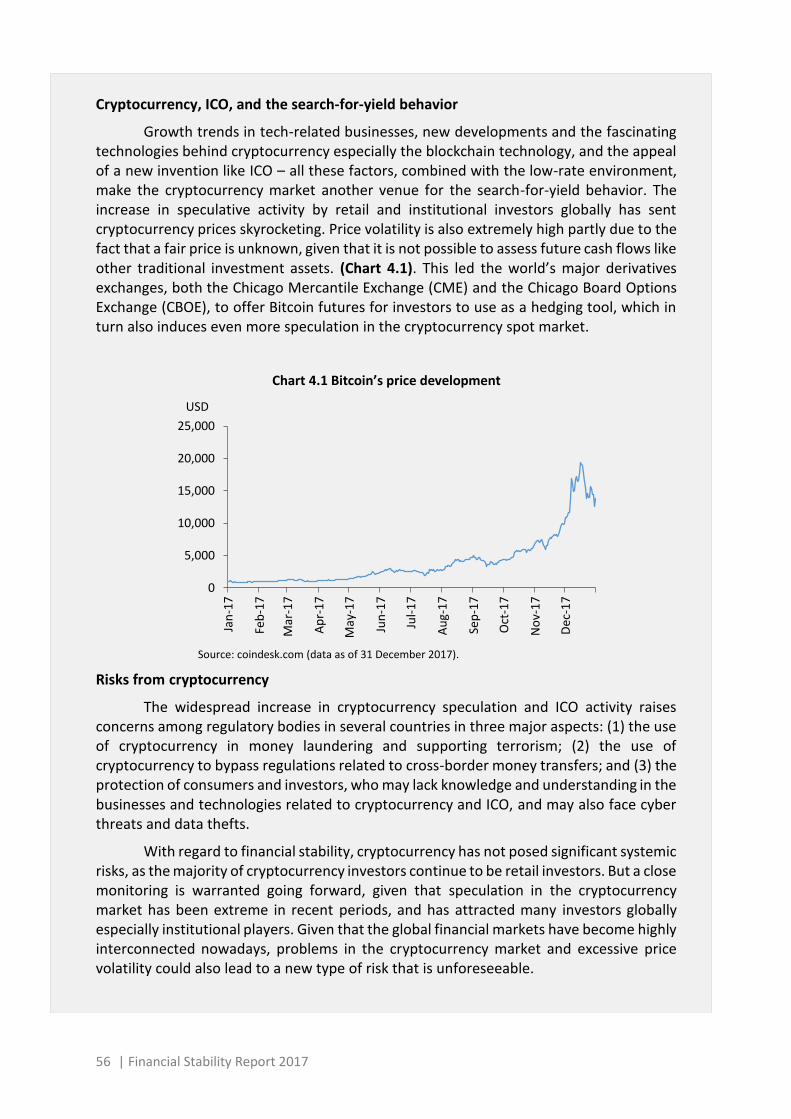
56 | Financial Stability Report 2017
Cryptocurrency, ICO, and the search-for-yield behavior
Growth trends in tech-related businesses, new developments and the fascinating technologies behind cryptocurrency especially the blockchain technology, and the appeal of a new invention like ICO – all these factors, combined with the low-rate environment, make the cryptocurrency market another venue for the search-for-yield behavior. The increase in speculative activity by retail and institutional investors globally has sent cryptocurrency prices skyrocketing. Price volatility is also extremely high partly due to the fact that a fair price is unknown, given that it is not possible to assess future cash flows like other traditional investment assets. (Chart 4.1). This led the world’s major derivatives exchanges, both the Chicago Mercantile Exchange (CME) and the Chicago Board Options Exchange (CBOE), to offer Bitcoin futures for investors to use as a hedging tool, which in turn also induces even more speculation in the cryptocurrency spot market.
Chart 4.1 Bitcoin’s price development
Source: coindesk.com (data as of 31 December 2017).
Risks from cryptocurrency
The widespread increase in cryptocurrency speculation and ICO activity raises concerns among regulatory bodies in several countries in three major aspects: (1) the use of cryptocurrency in money laundering and supporting terrorism; (2) the use of cryptocurrency to bypass regulations related to cross-border money transfers; and (3) the protection of consumers and investors, who may lack knowledge and understanding in the businesses and technologies related to cryptocurrency and ICO, and may also face cyber threats and data thefts.
With regard to financial stability, cryptocurrency has not posed significant systemic risks, as the majority of cryptocurrency investors continue to be retail investors. But a close monitoring is warranted going forward, given that speculation in the cryptocurrency market has been extreme in recent periods, and has attracted many investors globally especially institutional players. Given that the global financial markets have become highly interconnected nowadays, problems in the cryptocurrency market and excessive price volatility could also lead to a new type of risk that is unforeseeable.
0
5,000
10,000
15,000
20,000
25,000
Jan
-17
Feb
-17
Mar
-17
Ap
r-1
7
May
-17
Jun
-17
Jul-
17
Au
g-1
7
Sep
-17
Oct
-17
No
v-1
7
Dec
-17
USD

Financial Stability Report 2017 | 57
Developments of cryptocurrency in Thailand
In Thailand, cryptocurrency has gained its popularity as an investment asset rather than a medium of exchange. This is reflected in the fact that only 70 stores nationwide accept cryptocurrency as a means of payment for goods and services. The majority of such stores are located in Bangkok and its vicinity, Pattaya, and Chiang Mai. Most are restaurants, hotels, or spas servicing tourists42. In addition, the average daily turnover in
Thailand’s largest cryptocurrency exchanges is around 300 million baht, while market participants have increased in numbers from hundreds in 2013 to several ten thousands in 201743.
From the BOT’s assessment, the expansion of cryptocurrency in Thailand has not yet posed a systemic-level risk, given that the Thai cryptocurrency market still involves only a limited number of participants and institutional players have not joined. Nevertheless, the BOT will continue to monitor the situation closely, as the features of cryptocurrency and its related investment schemes could change rapidly. This could have implications on the supervision of cross-border money transfers and consumer protection. For ICOs, the SEC has already initiated a public hearing to determine an appropriate supervisory framework.
Since March 2014, the BOT has communicated to the general public regarding the risks associated with cryptocurrency in four aspects, summarized as follows: (1) Such electronic data unit does not have a legal tender status under Thai laws, and has no intrinsic value. Therefore, the electronic data unit could be rejected by vendors as a means of payment for goods and services. (2) There is a risk that the value of the electronic data unit could fluctuate rapidly, because the value arises only from users’ demand to trade and exchange the unit. (3) Such data unit is susceptible to hacking. The data unit has to be stored in a computer system and thus risks being stolen. (4) Lastly, users might not be protected. Given that such electronic data unit is not a legal means of payment, it could be difficult to trace transaction data as an evidence to supplement a lawsuit. This is in contrast to money transfers undertaken via commercial banks or payment service providers under regulation, which could be traced more easily.
On top of the risks discussed above, the public also needs to beware of fraud when investing in cryptocurrency or related securities. A special attention should be paid on any investment scheme that claims to be related with cryptocurrency or guarantees unrealistically high returns, since it is possible that the currently widespread popularity in cryptocurrency is used merely to attract investors’ attention.
42 Source: coinmap.org 43 Source: bx.in.th

58 | Financial Stability Report 2017
Annex: Thai financial system
1. Thai financial system: Types of funding
1/
Loans given to households and non-financial corporations. 2/
Market values of equities listed in SET and mai, excluding equities issued by issuers in the financial sector. 3/ Par values of bonds issued in Thailand, excluding bonds issued by issuers in the financial sector and non-residents.
2. Financial institutions system: Number and asset size of major financial institutions
P Preliminary data. 1/ Savings cooperatives data do not include credit union cooperatives. 2/ Agricultural cooperatives data are as of end-2016. 3/ Credit cards and personal loans under regulation include only financial institutions that operate with licenses issued by the Bank of Thailand and satisfy the definition of financial institutions according to the IMF Monetary and Financial Statistics Manual (2000). 4/ There were 25 nano-finance operators as of 2017Q3.
0
5,000
10,000
15,000
20,000
25,000
30,000
35,000
40,000
45,000
Q1 Q2 Q3 Q4 Q1 Q2 Q3
2555 2556 2557 2558 2559 2560
SFIs
Billion Baht
2012 2013 2014 2015 2016 2017
Loan - Other financial institutions 1/
Loan - Finance Companies 1/
Loan - Saving cooperatives 1/
Loan - SFIs 1/
Loan - Commercial banks 1/
Equity market 2/
Bond market 3/
Number% of total assets of
financial institutions
Depository corporations
Commercial banks 30 45.80
Specialized financial institutions (SFIs) 6 15.36
Savings cooperatives 1/
1,433 6.38
Finance companies 2 0.04
Money market mutual funds (MMFs) 39 0.66
Other financial corporations
Mutual funds (excluding MMFs) 1,406 11.41
Insurance companies 84 8.98
Leasing companies 859 1.83
Credit card, personal loan and nano finance companies under regulation 3 /4/38 2.28
Provident funds 395 2.58
Government pension fund 1 2.04
Asset management companies 45 0.73
Securities companies 49 0.98
Agricultural cooperatives 2/3,523 0.58
Pawnshops 629 0.20
Secondary martgage corporation (SMC) 1 0.02
Thai credit guarantee corporation (TCG) 1 0.12
Types of financial institutions2017 Q3 P

Financial Stability Report 2017 | 59
3. Loan: Corporate and consumer loans
Share of corporate loan providers as of 2017 Q3
Share of consumer loan provider as of 2017 Q3
4. Structure of the commercial banking system
Share of commercial banks by asset size
Asset and liability structure of commercial banking system
5. Structure of the depository specialized financial institutions (depository SFIs)
Share of depository SFIs by asset size
Asset and liability structure of depository SFIs
Commercial banks72%
SFIs16%
Others12%
2560
Commercial banks41%
SFIs25%
Savingcooperatives
19%
Others15%
1. Bankgkok BankPCL 17%
3. Krung ThaiBank PCL
14%
2. Siam CommercialBank PCL
15%
4. KasikornBank PCL
14%
5. Bank ofAyudhya PCL
10%
Other domesticallyregistered banks
21%
Brances offoreign banks
9%
Cash and deposit
Deposit
Investment in debt securities
Debt securities
Loan
Borrowing
Investment in shares andother equities Equity
Other financial assets Other liabilities
Non-financial assets
0%
10%
20%
30%
40%
50%
60%
70%
80%
90%
100%
Assets Liabilities
GovernmentSavings Bank
46%
Bank for Agricultureand Agricultural
Cooperatives29%
GovernmentHousing Bank
20%
Other depository SFIs5%
Cash and deposit
Deposit
Investment in debt securities
Debt securities
Loan
BorrowingInvesment in shares and…
Equity
Other financia…
Other liabilities
Non-financial assets
0%
10%
20%
30%
40%
50%
60%
70%
80%
90%
100%
Assets Liabilities

60 | Financial Stability Report 2017
Nominal GDP (or GDP at current price) data have been revised from 2012 onward. Quarterly data presented are calculated from four-
quarter moving average.
Q1 Q2 Q3
Overall financial system
Nominal GDP (million baht)1/12,357,397 12,921,166 13,203,739 13,672,865 14,366,557 14,604,792 14,796,062 15,023,789
Funding structures
Private credit to GDP (times) 1.3 1.3 1.4 1.4 1.4 1.3 1.3 1.3
Stock market capitalization to GDP (times) 0.8 0.7 0.9 0.8 0.9 0.9 0.9 0.9
Bonds market capitalization to GDP (times) 0.4 0.4 0.4 0.4 0.5 0.5 0.5 0.5
1. Financial institutions
1.1 Commercial banks
Total asset (billion baht) 14,774 16,182 16,746 17,314 17,721 17,658 17,832 17,924
% YoY 13.8 9.5 3.5 3.4 2.3 0.0 0.7 2.8
Deposit (excluding Interbank) 10,000 10,930 11,693 12,022 12,346 12,419 12,526 12,580
% YoY 27.1 9.3 7.0 2.8 2.7 1.8 3.0 4.0
Loan (excluding Interbank) 9,637 10,701 11,240 11,729 11,958 11,952 12,164 12,168
% YoY 13.7 11.0 5.0 4.3 2.0 2.8 3.3 3.3
Corporate loan 6,723 7,473 7,774 8,017 8,069 8,060 8,216 8,149
% YoY 10.6 11.2 4.0 3.1 0.6 2.0 2.7 2.2
- Small and medium-sized enterprises (SMEs) 10.7 14.0 7.5 5.6 1.5 2.6 2.4 2.3
- large corporate 10.5 8.1 0.1 0.1 -0.4 1.2 3.0 2.1
Consumer loan 2,914 3,228 3,467 3,711 3,889 3,892 3,947 4,019
% YoY 21.6 10.8 7.4 7.1 4.8 4.5 4.5 5.6
- Housing loan 11.7 12.5 12.1 9.3 6.9 6.0 5.0 5.6
- Car loan 39.0 8.4 -3.4 1.0 0.9 2.4 4.5 7.0
- Credit card and personal loan under regulation 20.3 14.6 5.0 2.8 3.0 1.5 0.7 1.3
- Other personal loan 27.1 7.3 14.2 12.2 5.0 4.2 4.6 5.8
Liquidity (%)
Loan to deposit 96.4 97.9 96.1 97.6 96.9 96.2 97.1 96.7
Loan to deposit and B/E 93.1 96.6 95.7 97.0 96.3 95.6 96.5 96.4
Asset quality
NPL Ratio (%) 2.25 2.15 2.15 2.55 2.83 2.94 2.95 2.97
SM Ratio (%) 2.16 2.40 2.61 2.38 2.63 2.61 2.55 2.72
Actual/Regulatory loan loss provision (%) 157.2 168.3 169.4 156.3 159.6 161.8 160.0 166.2
NPL coverage ratio (%) 132.8 143.7 142.8 131.0 136.5 134.0 133.5 135.6
Profitability
Operating profit (billion baht) 288 338 345 370 383 97 101 100
Net profit (billion baht) 174 204 214 192 199 51 49 47
Return on asset (ROA) 1.2 1.3 1.3 1.1 1.1 1.2 1.1 1.0
Net interest margin (%) 2.7 2.7 2.8 2.7 2.8 2.7 2.8 2.8
Capital adequacy
Regulatory capital to risk-weighted asset (%) 16.3 15.7 16.8 17.4 18.0 17.8 17.9 18.5
Tier-1 Ratio (%) 11.8 12.6 13.7 14.6 15.1 15.1 15.2 15.8
Common equity tier 1 (%) - 12.4 13.6 14.5 15.1 15.1 15.2 15.8
Interest rates
Minimum loan rate (MLR) 7.6 7.6 7.5 7.4 7.3 7.3 7.2 7.2
12-month fixed deposit 2.5 2.4 2.1 1.5 1.3 1.3 1.3 1.3
2014
Indicators for financial condition and assessing risk to financial stability
Indicators 2012 20132017
2015 2016

Financial Stability Report 2017 | 61
2 Specialized financial institutions include Government Savings Bank, Bank for Agriculture and Agricultural Cooperatives, Government
Housing Bank, Islamic Bank of Thailand, SME Bank, Export-Import Bank of Thailand, Thai Credit Guarantee Corporation, and Secondary Mortgage Corporation. 3 Current account to GDP ratio is calculated using quarterly nominal GDP in the same period. 4 External debt to GDP ratio is calculated as the ratio of external debt to three-year average of nominal GDP.
Q1 Q2 Q3
1.2 Specialized financial institutions2/
Total asset (billion baht) 4,140 4,492 4,678 5,006 5,370 5,384 5,527 5,501
% YoY 9.8 8.5 4.1 7.0 7.3 4.7 6.3 7.0
Deposit (excluding Interbank) 3,348 3,692 3,867 4,181 4,421 4,448 4,495 4,513
% YoY 9.0 10.3 4.8 8.1 5.7 3.8 5.1 7.1
Loan (excluding Interbank) 3,405 3,523 3,717 3,979 4,062 4,195 4,239 4,315
% YoY 11.1 3.4 5.5 7.1 2.1 5.8 6.7 8.0
Asset quality
NPL Ratio (%) 4.4 4.9 5.1 4.9 5.0 5.0 4.2 4.5
SM Ratio (%) 1.9 2.3 3.2 2.9 3.3 3.3 3.9 3.4
Profitability
Operating profit (billion baht) 70 80 79 91 101 28 25 27
Net profit (billion baht) 20 44 34 38 47 13 12 15
Return on asset (ROA) 0.5 1.0 0.7 0.8 0.9 1.0 0.9 1.1
Net interest margin (%) 3.0 2.9 2.8 2.9 2.9 3.0 2.7 3.2
Capital adequacy
Regulatory capital to risk-weighted asset (%) 9.5 11.3 10.8 11.3 12.2 12.1 12.2 12.5
2. Financial markets
Government bond market
Bond spread (10years-2years)
0.4 1.0 1.3 1.1 0.6 1.1 1.1 1.0
Non-Resident holdings (%) 10.6 10.3 10.0 7.8 8.1 8.5 9.2 10.5
Stock markets (SET and mai)
SET Index (End of period) 1,391.9 1,298.7 1,497.7 1,288.0 1,542.9 1,575.1 1,574.7 1,673.2
SET Actual volatility (%) 12.2 20.9 13.0 13.9 14.2 7.0 4.8 5.8
SET Price to earning ratio (times) 18.3 14.6 17.8 22.6 18.6 17.4 16.3 17.9
mai Index (end of period) 415.7 356.8 700.1 522.6 616.3 597.5 565.7 570.7
mai Actual volatility (%) 13.1 26.4 19.0 21.2 18.9 12.6 10.5 10.6
mai Price to earning ratio (times) 22.8 28.3 69.6 52.9 63.3 90.9 92.1 99.1
Foreign exchange market
Exchange rates (End of period) (USD/THB) 30.6 32.9 32.9 36.0 35.8 34.4 34.0 33.3
Actual volatility (%annualized) 4.6 5.9 4.0 5.1 4.4 3.5 3.9 2.9
Nominal effective exchange rate (NEER) 100.0 107.0 104.3 108.5 106.2 108.7 109.8 111.2
Real effective exchange rate (REER) 100.0 106.5 103.1 104.3 100.6 102.3 102.7 104.0
3. External sector
Current account to GDP3/ -0.4 -1.2 3.7 8.0 11.9 13.9 6.8 12.0
External debt to GDP4/ 35.3 35.8 34.7 32.0 32.7 33.5 34.3 35.9
Foreign currency external debt to GDP 24.1 25.8 24.6 23.7 23.3 23.2 23.6 24.1
External debt (million USD) 130,747 141,933 141,715 131,078 132,194 136,152 140,278 148,338
Short-term (%) 44.5 43.6 40.2 40.1 41.2 40.5 39.4 40.9
Long-term (%) 55.5 56.4 59.8 59.9 58.8 59.5 60.6 59.1
International reserves
Net reserves (million USD) 205,751 190,239 180,238 168,164 197,613 207,515 216,855 230,519
Gross reserves to short-term debt (times) 3.1 2.7 2.8 3.0 3.2 3.3 3.4 3.3
Indicators for financial condition and assessing risk to financial stability
Indicators 2012 2013 2014 20162017
2015

62 | Financial Stability Report 2017
Q1 Q2 Q3
Capital flow
Net capital flow (million USD) 13,024 -2,207 -15,854 -16,799 -21,010 -7,010 -5,747 746
Direct investment (flow)
Thailand direct investment abroad -14,261 -12,121 -5,742 -4,991 -13,409 -3,487 -5,529 -4,151
Foreign direct investment in Thailand 12,899 15,936 4,975 8,928 3,063 2,483 1,517 2,248
Portfolio investment (flow)
Thailand portfolio investment abroad -6,960 -3,399 -7,318 -3,817 -4,279 -3,749 -2,744 -2,900
Foreign portfolio investment in Thailand 10,358 -1,368 -4,695 -12,691 1,481 2,318 1,490 5,327
4. Households
Household debt to GDP (%) 71.8 76.5 79.9 81.2 79.8 78.7 78.4 78.3
%YoY 18.5 11.5 6.7 5.2 3.4 3.2 3.1 3.7
Financial asset to debt (times) 2.5 2.3 2.5 2.5 2.6 2.7 2.7 n.a.
Commercial banks NPL and SM ratio (%)
- Housing loan 3.7 3.9 3.8 4.1 4.7 4.9 4.8 5.2
- Car loan 7.4 9.8 10.8 10.1 9.2 8.8 9.0 9.0
- Credit card and personal loan under regulation 4.7 6.0 6.8 7.1 6.5 6.6 6.0 5.6
- Other personal loan 2.8 3.7 4.0 4.2 4.7 4.7 4.6 4.8
5. Corporates
Corporate debt to GDP (%) 74.4 75.4 76.8 78.7 78.8 77.6 78.2 n.a.
Commercial banks NPL and SM ratio (%) :
- Small and medium-sized enterprises (SMEs) 5.7 5.5 5.5 5.7 6.8 7.0 6.9 7.6
- Large corporate 3.2 3.0 3.3 3.5 3.8 3.9 3.9 3.8
Performance of non-financial listed companies
Net profit margin (%) 9.0 8.4 7.0 7.4 8.2 8.5 7.5 8.6
Debt to equity ratio 0.8 0.8 0.8 0.7 0.7 0.7 0.7 0.7
Interest coverage ratio (times) 6.6 6.6 5.8 5.8 6.6 6.2 6.2 6.6
Current ratio (times) 1.5 1.5 1.6 1.7 1.6 1.7 1.7 1.7
6. Real estates
Number of approved mortgages from commercial
banks (Bangkok and vicitnity)
Single-detached and semi-detached house (unit) 22,949 18,353 15,694 13,152 13,409 2,802 3,544 3,768
Townhouse and commercial building (unit) 26,277 25,261 21,764 19,210 20,187 4,315 4,947 5,630
Condominium (unit) 26,477 28,087 25,381 27,305 27,856 5,127 6,595 7,594
Number of new housing units launched for sale
(Bangkok and vicinity)
Single-detached and semi-detached house (unit) 15,100 17,226 18,933 17,637 19,433 2,054 2,413 4,432
Townhouse and commercial building (unit) 24,390 30,074 26,980 27,518 32,792 10,413 7,102 9,155
Condominium (unit) 62,548 84,250 65,298 62,833 58,350 12,837 16,014 20,782
House price index (January 2009 = 100)
Single-detached house (including land) 110.3 119.0 125.8 129.0 130.8 128.6 129.6 131.6
Townhouse (including land) 107.5 117.9 132.4 135.9 137.6 138.3 140.0 142.6
Condominium 127.8 132.1 146.4 158.7 166.2 169.8 168.8 169.8
Land 118.2 129.2 141.4 157.2 171.2 171.3 164.2 172.9
7. Fiscal sector
Public debt to GDP (%) 40.1 42.2 43.4 43.9 41.2 42.2 41.8 42.3
Indicators 2012 2013
Indicators for financial condition and assessing risk to financial stability
2014 201620152017

