financial resultsfor 2012 and strategic outlook for 2013 · financial resultsfor 2012 and strategic...
TRANSCRIPT
Solutions for Demanding Business
Date: February 21st, 2013
Place: Warsaw
Financial Results for 2012
and
Strategic Outlook for 2013
Solutions for Demanding Business
CONTENTS
1. 2012 SUMMARY
2. MERGERS AND ACQUISITIONS
3. VISION AND STRATEGY – OUTLOOK FOR 2013
4. APPENDIX - DETAILED FINANCIAL DATA
2

Solutions for Demanding Business
Q1-4 shows drop in EBIT compared to last year
3
* adjusted by one-offs | NPAT Q1-4'12 = 11.9mEUR {49.6mPLN}; NPAT Q1-4'11 = 13.2mEUR {54.7mPLN}|** in EBIT included 0.2mEUR {0.9mPLN} reversal of tax provision
organic growth
-4%
-10%
-11%
mEUR FY 2012 FY 2011 Growth
Revenue Total 110,8 111,6 -1%
EBIT 12,6 13,3 -5%
NPAT normalised* 11,2 12,0 -6%
mPLN FY 2012 FY 2011 Growth
Revenue Total 462,5 461,9 +0%
EBIT 52,6 54,9 -4%
NPAT normalised* 46,8 49,5 -5%
-3%
- 9%
-10%
organic growth
Solutions for Demanding Business
4
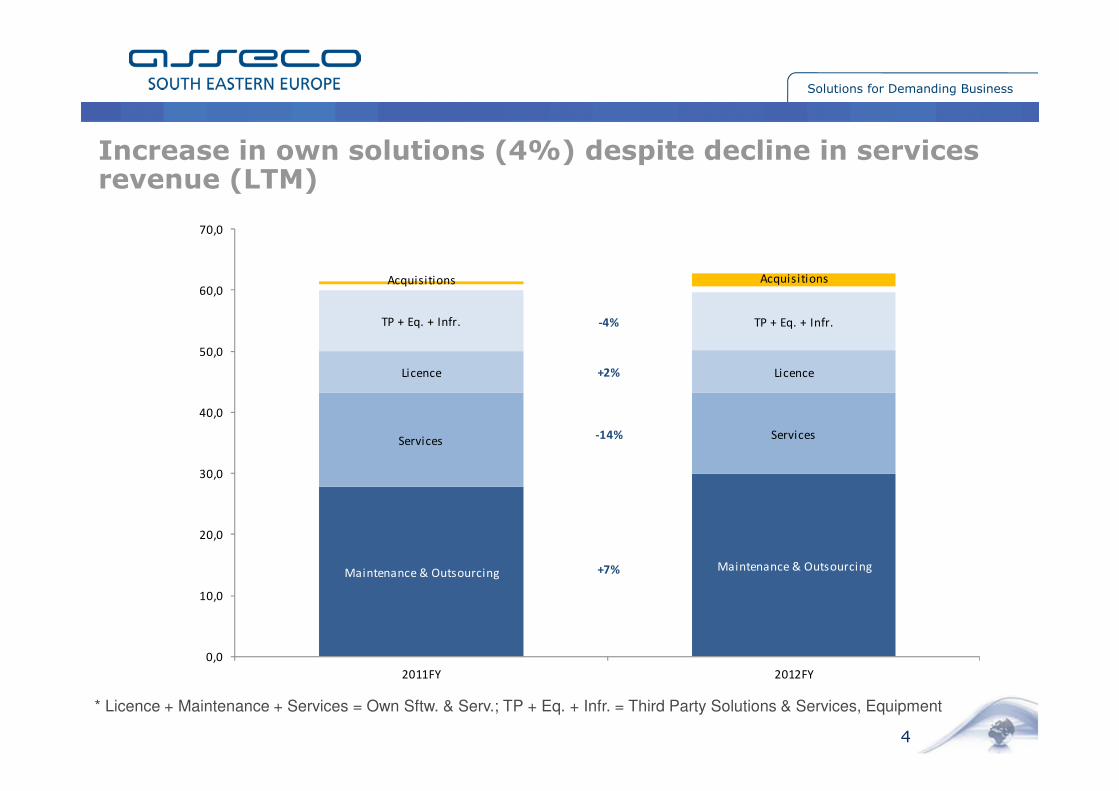
* Licence + Maintenance + Services = Own Sftw. & Serv.; TP + Eq. + Infr. = Third Party Solutions & Services, Equipment
Increase in own solutions (4%) despite decline in services revenue (LTM)
Maintenance & OutsourcingMaintenance & Outsourcing
ServicesServices
LicenceLicence
TP + Eq. + Infr.TP + Eq. + Infr.
AcquisitionsAcquisitions
0,0
10,0
20,0
30,0
40,0
50,0
60,0
70,0
2012FY2011FY
-4%
+2%
-14%
+7%
Solutions for Demanding Business
5
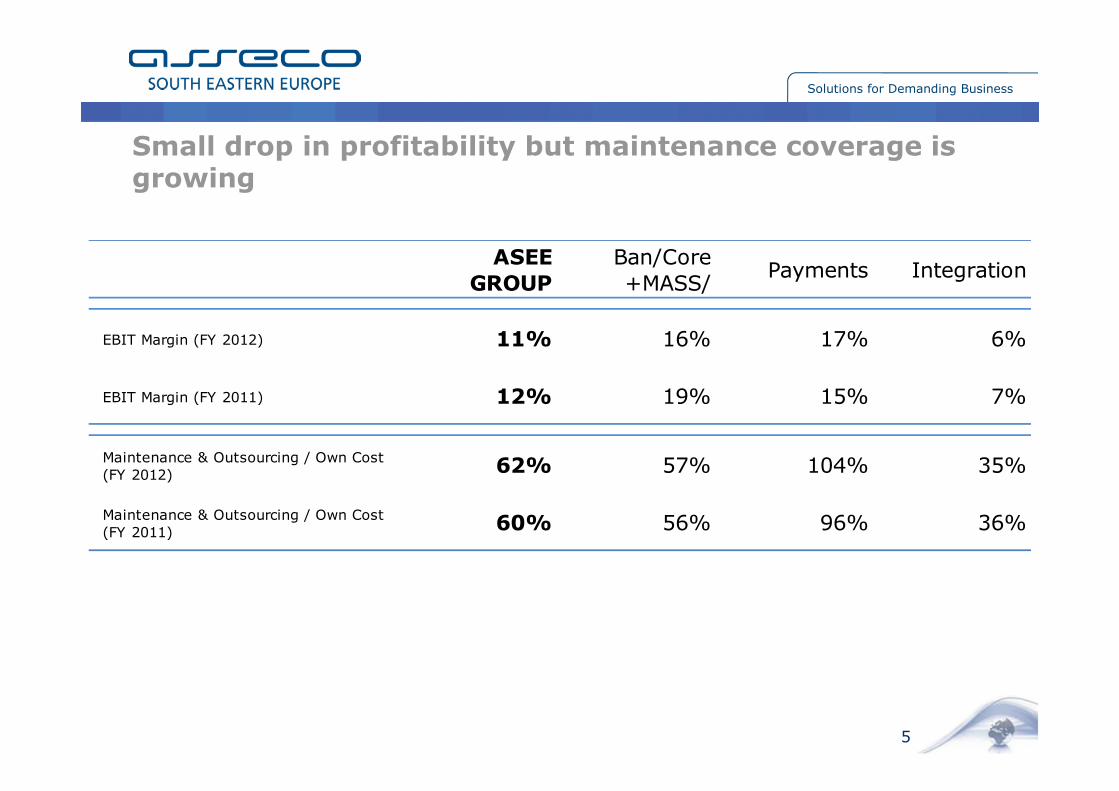
Small drop in profitability but maintenance coverage is growing
ASEE
GROUP
Ban/Core
+MASS/Payments Integration
EBIT Margin (FY 2012) 11% 16% 17% 6%
EBIT Margin (FY 2011) 12% 19% 15% 7%
Maintenance & Outsourcing / Own Cost
(FY 2012)62% 57% 104% 35%
Maintenance & Outsourcing / Own Cost
(FY 2011) 60% 56% 96% 36%

Solutions for Demanding Business
Product and Market development summary
6
1.2mE additional costs compared to 2011
mEUR Ttl FY'12 Exp FY'12 Ttl FY'11 Exp FY'11
R&D 2,2 0,4 0,9 0,3
Market development 0,8 0,8 0,1 0,1
New Departments in Holdco 0,4 0,4
Development
investments3,4 1,6 1,0 0,4
Solutions for Demanding Business
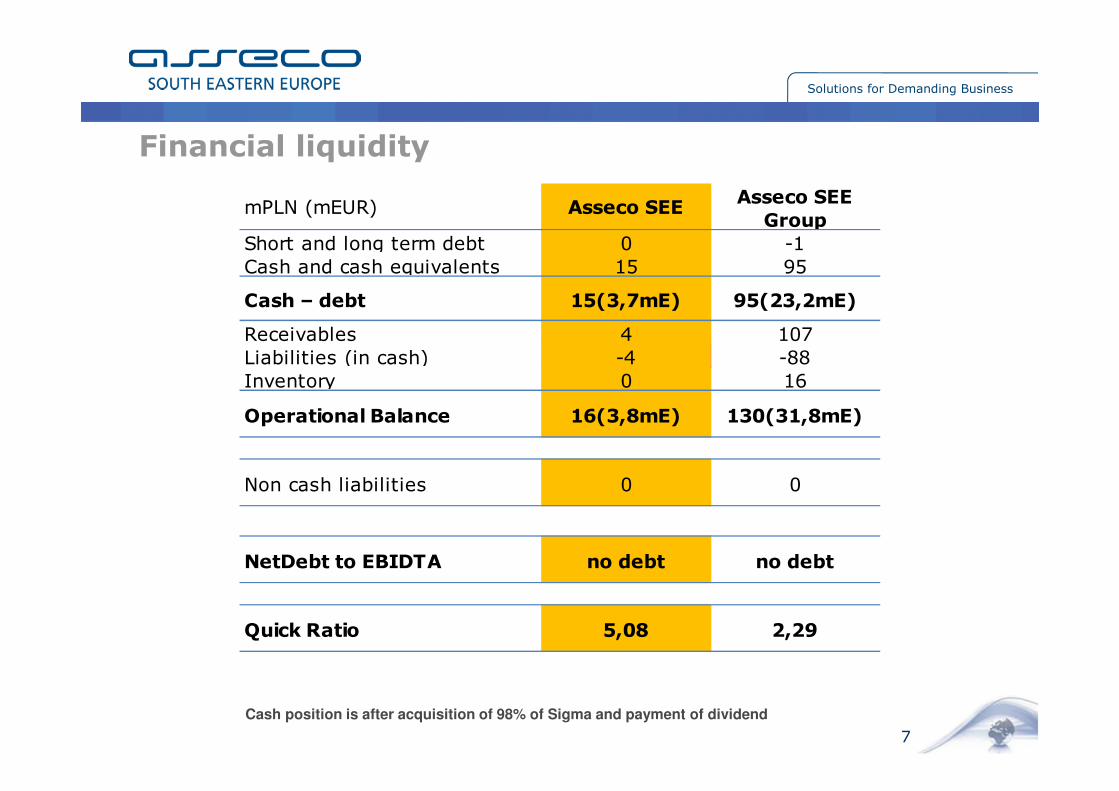
Asseco SEE
Group
Short and long term debt 0 -1
Cash and cash equivalents 15 95
Cash – debt 15(3,7mE) 95(23,2mE)
Receivables 4 107
Liabilities (in cash) -4 -88
Inventory 0 16
Operational Balance 16(3,8mE) 130(31,8mE)
Non cash liabilities 0 0
NetDebt to EBIDTA no debt no debt
Quick Ratio 5,08 2,29
mPLN (mEUR) Asseco SEE
Financial liquidity
7
Cash position is after acquisition of 98% of Sigma and payment of dividend
Solutions for Demanding Business
CONTENTS
1. 2012 SUMMARY
2. MERGERS AND ACQUISITIONS
3. VISION AND STRATEGY – OUTLOOK FOR 2013
4. APPENDIX - DETAILED FINANCIAL DATA
8
Solutions for Demanding Business
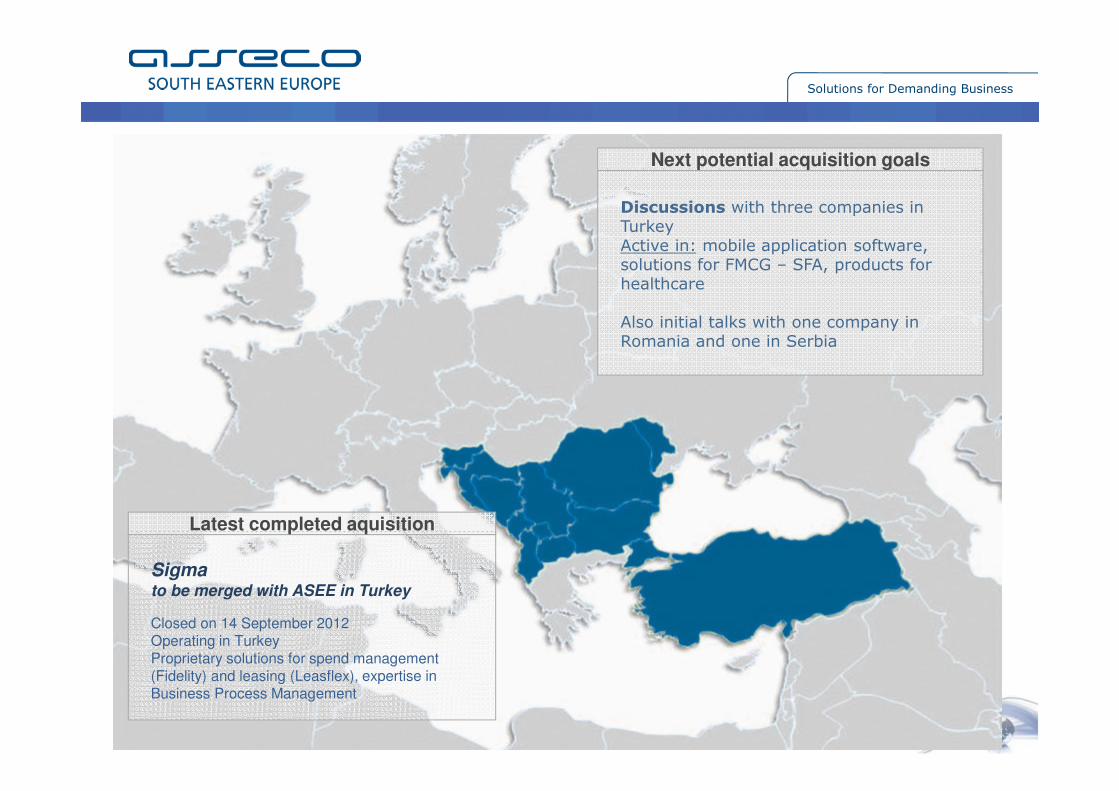
Next potential acquisition goals
Discussions with three companies in TurkeyActive in: mobile application software, solutions for FMCG – SFA, products for healthcare
Also initial talks with one company in Romania and one in Serbia
Sigmato be merged with ASEE in Turkey
Closed on 14 September 2012Operating in TurkeyProprietary solutions for spend management (Fidelity) and leasing (Leasflex), expertise in Business Process Management
Latest completed aquisition
Solutions for Demanding Business
CONTENTS
1. 2012 SUMMARY
2. MERGERS AND ACQUISITIONS
3. VISION AND STRATEGY – OUTLOOK FOR 2013
4. APPENDIX - DETAILED FINANCIAL DATA
10

Solutions for Demanding Business
11
� Organisation with well implemented three matrix management layers:
� Geography (Countries)
� Business Area (BU)
� Function (Sales, PM, R&D, HR, Marketing, Finance, Legal...)
Company Structure - Vision

Solutions for Demanding Business
12
• Centralised Group Sales Function
• Alignment of sales organisations:
• One regional for Payment business (PG&Card)
• One regional for Banking software (Core Banking & MASS)
• One per country for SI
• Introduction of Solution Sales function – focus on strategic
solutions and New Markets
• Unified sales standards (including one CRM)
• Enhancement of cross selling
ASEE – New Sales Organisation

Solutions for Demanding Business
13
� Product organisation (innovative organisation) with focus on:
� Concentrating on selected core competencies and solutions with international potential
� Integrating portfolio
� Organisation with group product ownership (de-nationalised )
� SI divided to TP related solutions and own solutions
ASEE – Product Organisation

Solutions for Demanding Business
14
� Expand Turkish operations to above 400 people own solutions and service based organisation with above 5 m E profit operation (both organic and acquisitions)
� Have average own solution revenue growth of at least 15%
� Generate above 30% revenues from out of our region
� Have a partnership network on international markets (20% revenues generated through partners in 5 years)
� Enter and focus on emerging markets in the future includingAfrican markets (Arabic and central Africa)
� Be one of top three recognised brands in each country of core operations
OUR Future - Vision

Solutions for Demanding Business
New Markets
15* incl. 5 years (2009 – 2013)

Solutions for Demanding Business
Outsourcing
16* incl. 5 years (2009 – 2013)

Solutions for Demanding Business
Own Solutions
17* incl. 5 years (2009 – 2013)
Solutions for Demanding Business
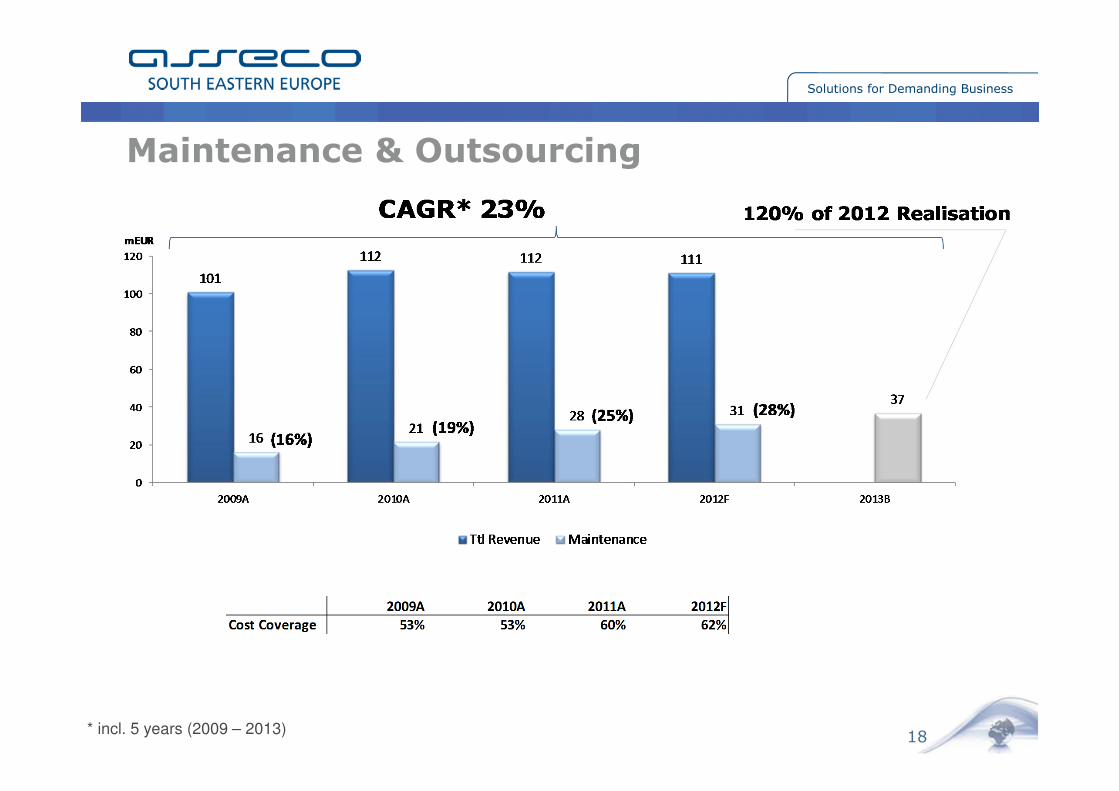
Maintenance & Outsourcing
18* incl. 5 years (2009 – 2013)
Solutions for Demanding Business
19
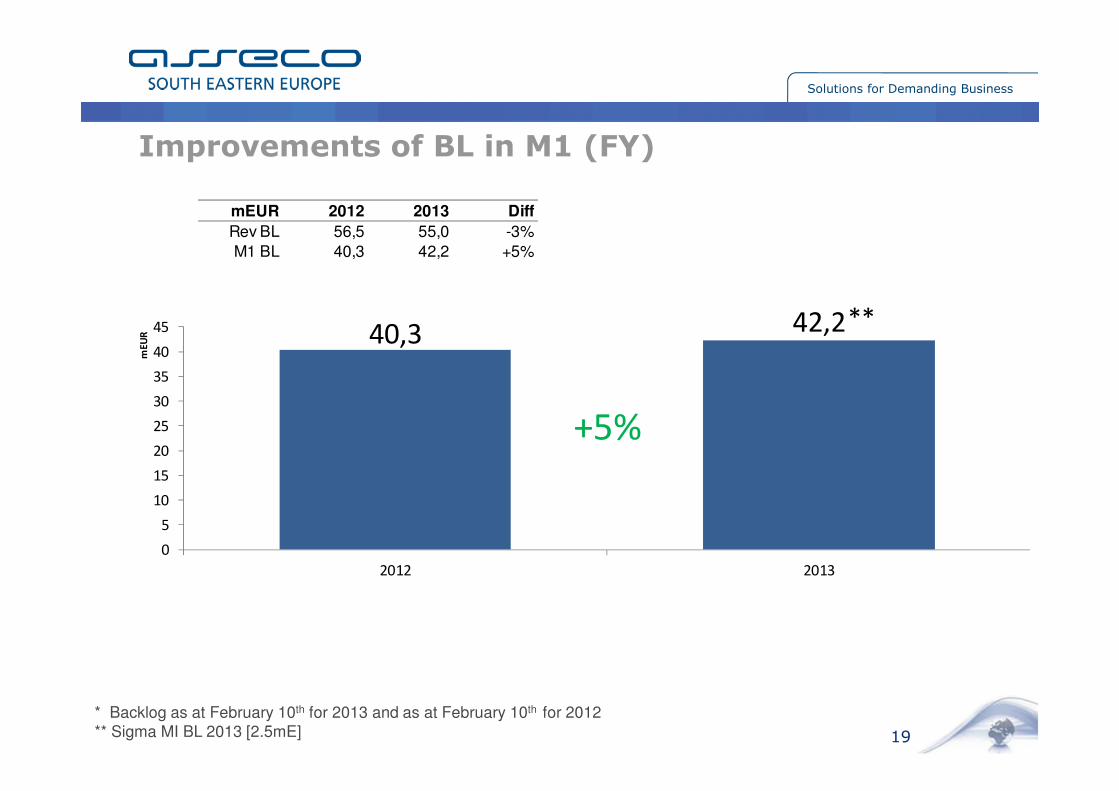
* Backlog as at February 10th for 2013 and as at February 10th for 2012
** Sigma MI BL 2013 [2.5mE]
Improvements of BL in M1 (FY)
42,240,3
0
5
10
15
20
25
30
35
40
45
20132012
mE
UR
+5%
**
mEUR 2012 2013 Diff
Rev BL 56,5 55,0 -3%
M1 BL 40,3 42,2 +5%

Solutions for Demanding Business
CONTENTS
1. 2012 SUMMARY
2. MERGERS AND ACQUISITIONS
3. VISION AND STRATEGY – OUTLOOK FOR 2013
4. APPENDIX - DETAILED FINANCIAL DATA
20
Solutions for Demanding Business
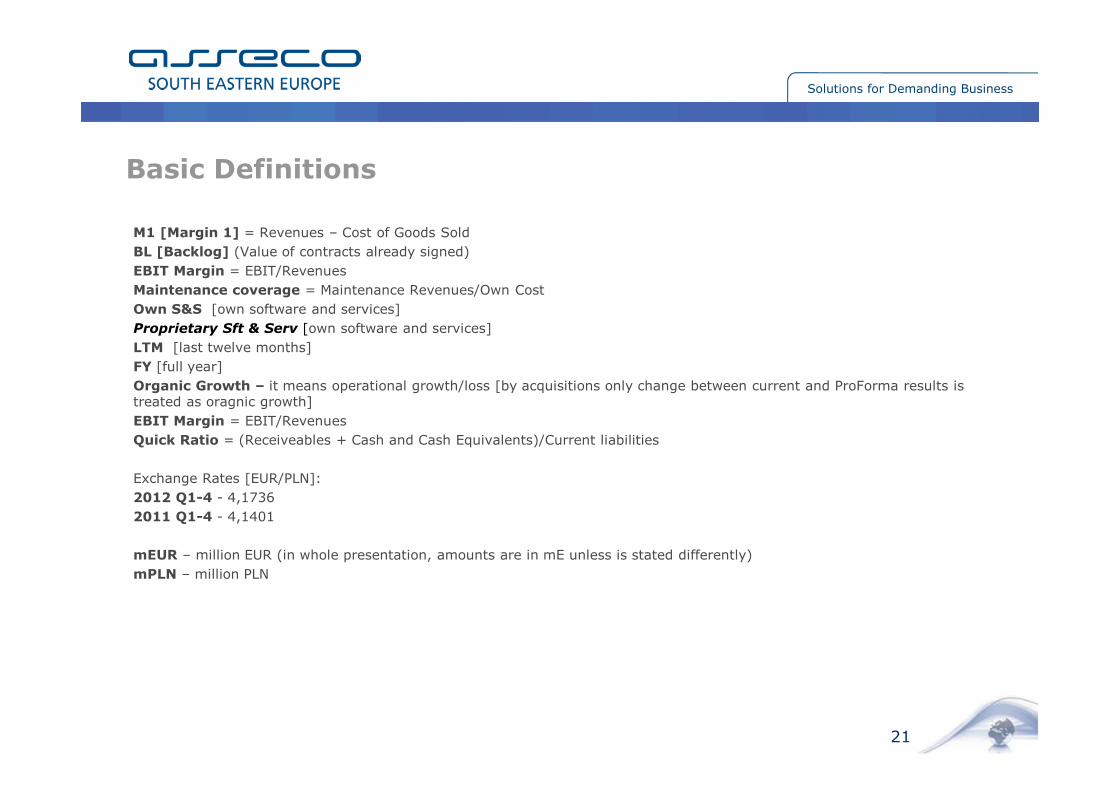
M1 [Margin 1] = Revenues – Cost of Goods Sold
BL [Backlog] (Value of contracts already signed)
EBIT Margin = EBIT/Revenues
Maintenance coverage = Maintenance Revenues/Own Cost
Own S&S [own software and services]
Proprietary Sft & Serv [own software and services]
LTM [last twelve months]
FY [full year]
Organic Growth – it means operational growth/loss [by acquisitions only change between current and ProForma results is treated as oragnic growth]
EBIT Margin = EBIT/Revenues
Quick Ratio = (Receiveables + Cash and Cash Equivalents)/Current liabilities
Exchange Rates [EUR/PLN]:
2012 Q1-4 - 4,1736
2011 Q1-4 - 4,1401
mEUR – million EUR (in whole presentation, amounts are in mE unless is stated differently)
mPLN – million PLN
21
Basic Definitions
Solutions for Demanding Business
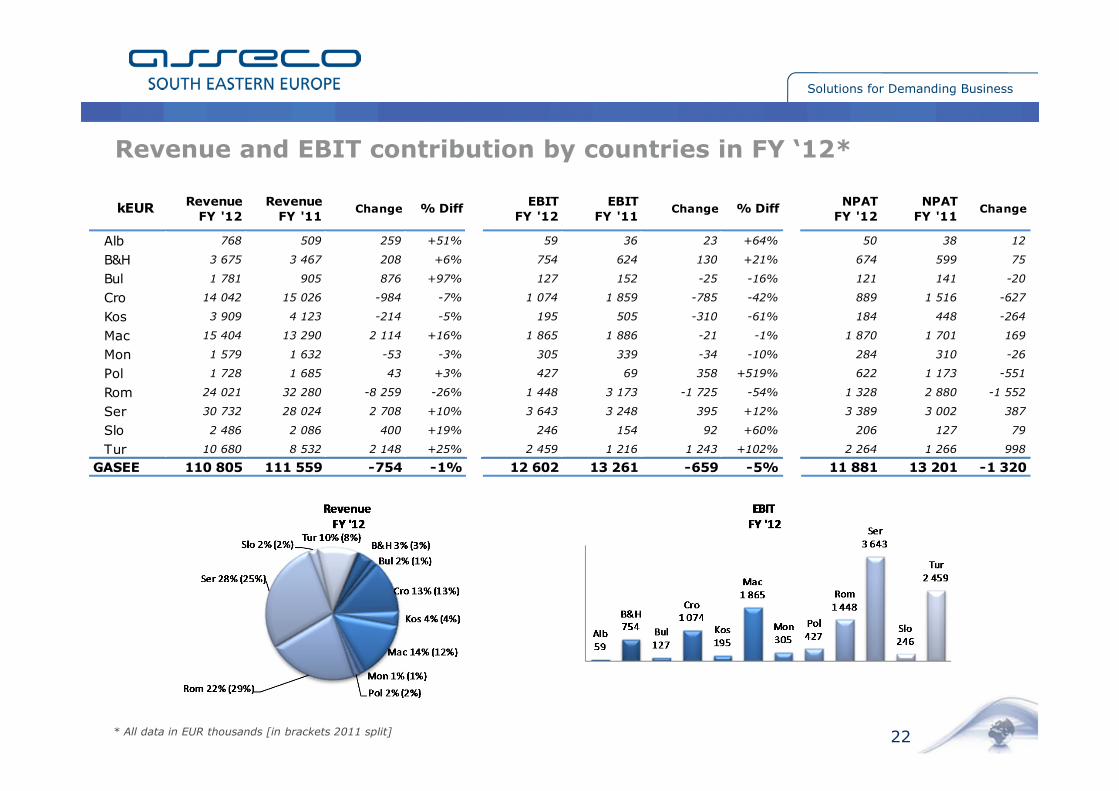
22* All data in EUR thousands [in brackets 2011 split]
Revenue and EBIT contribution by countries in FY ‘12*
kEURRevenue
FY '12
Revenue
FY '11Change % Diff
EBIT
FY '12
EBIT
FY '11Change % Diff
NPAT
FY '12
NPAT
FY '11Change
Alb 768 509 259 +51% 59 36 23 +64% 50 38 12
B&H 3 675 3 467 208 +6% 754 624 130 +21% 674 599 75
Bul 1 781 905 876 +97% 127 152 -25 -16% 121 141 -20
Cro 14 042 15 026 -984 -7% 1 074 1 859 -785 -42% 889 1 516 -627
Kos 3 909 4 123 -214 -5% 195 505 -310 -61% 184 448 -264
Mac 15 404 13 290 2 114 +16% 1 865 1 886 -21 -1% 1 870 1 701 169
Mon 1 579 1 632 -53 -3% 305 339 -34 -10% 284 310 -26
Pol 1 728 1 685 43 +3% 427 69 358 +519% 622 1 173 -551
Rom 24 021 32 280 -8 259 -26% 1 448 3 173 -1 725 -54% 1 328 2 880 -1 552
Ser 30 732 28 024 2 708 +10% 3 643 3 248 395 +12% 3 389 3 002 387
Slo 2 486 2 086 400 +19% 246 154 92 +60% 206 127 79
Tur 10 680 8 532 2 148 +25% 2 459 1 216 1 243 +102% 2 264 1 266 998
GASEE 110 805 111 559 -754 -1% 12 602 13 261 -659 -5% 11 881 13 201 -1 320

Solutions for Demanding Business
23
* All data in EUR thousands; [in brackets 2011 split]
Revenue and EBIT contribution by segments in FY ‘12*
kEURRevenue
FY '12
Revenue
FY '11Change
EBIT
FY '12
EBIT
FY '11Change
Ban /Core+MASS/ 28 064 28 818 -754 4 579 5 492 -913
Payments 26 892 26 142 750 4 676 4 009 667
Integration 55 849 56 599 -750 3 346 3 759 -413
Asseco SEE Group 110 805 111 559 -754 12 602 13 261 -659
Solutions for Demanding Business
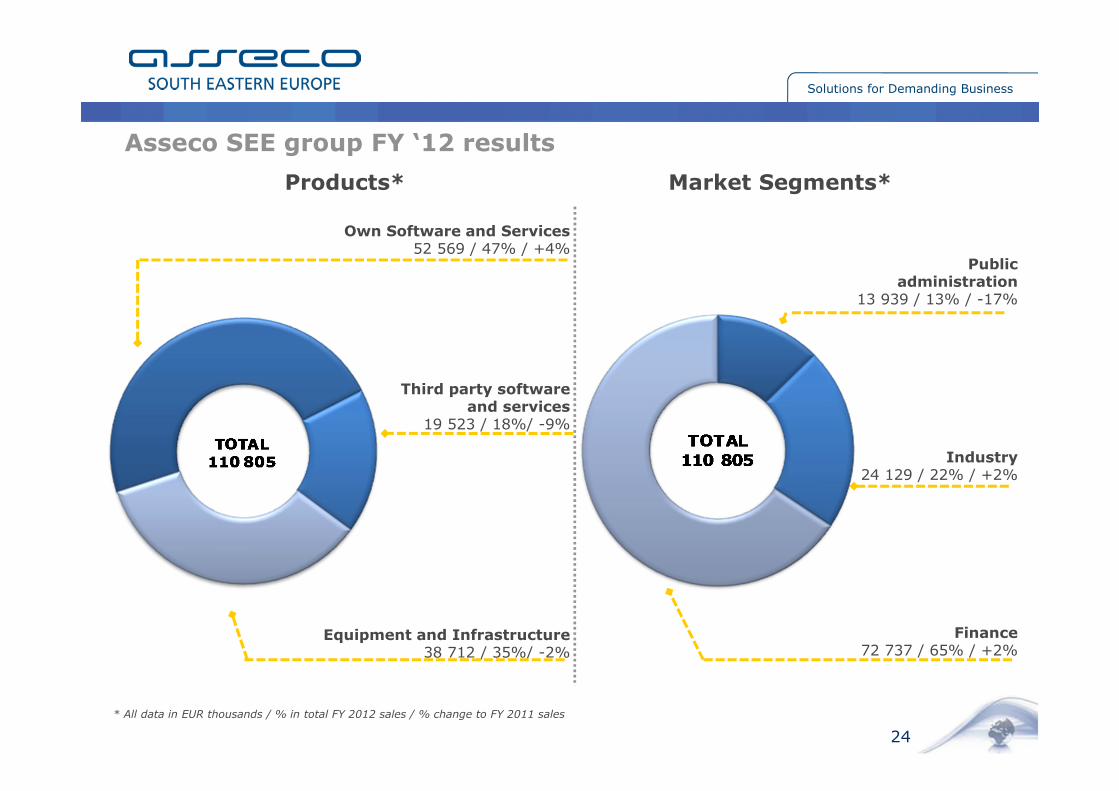
Asseco SEE group FY ‘12 results
24
Own Software and Services52 569 / 47% / +4%
Third party software and services
19 523 / 18%/ -9%
Equipment and Infrastructure38 712 / 35%/ -2%
Public administration
13 939 / 13% / -17%
Industry24 129 / 22% / +2%
Finance72 737 / 65% / +2%
Market Segments*Products*
* All data in EUR thousands / % in total FY 2012 sales / % change to FY 2011 sales

Solutions for Demanding Business
Serbia480 / 36%
Romania186 / 14%
Croatia173 / 13%
Turkey162 / 12%
Macedonia136 / 10%
Kosovo79 / 6%
B&H41 / 3%
Bulgaria26 / 2%
Montenegro16 / 1%
Slovenia15 / 1%
Poland13 / 1%Albania7 / 1%
Ban/Core+MASS/620 / 46%
Payments325/ 24%
Integration394 / 30%
Employment by BU* Employment by Country*
25
* ASEE Holdco divided between countries based on employment key Moldavia5 / 0%
Consolidated employee structure
Solutions for Demanding Business
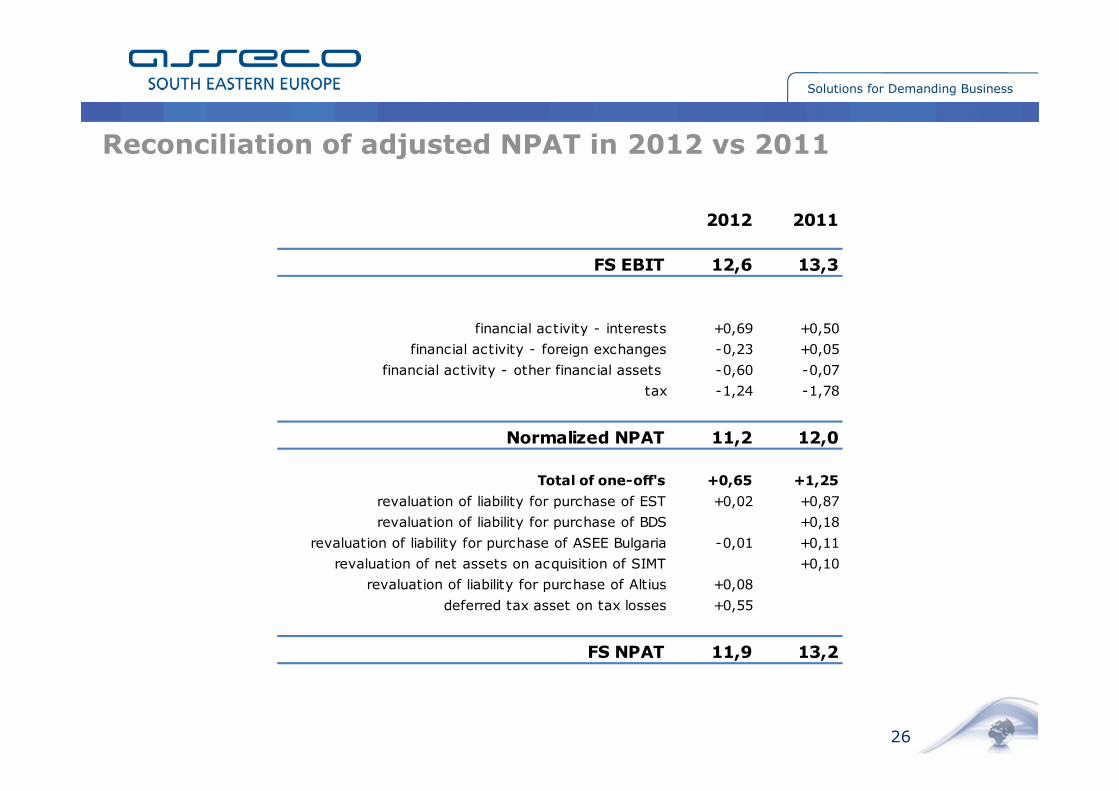
Reconciliation of adjusted NPAT in 2012 vs 2011
26
2012 2011
FS EBIT 12,6 13,3
financial activity - interests +0,69 +0,50
financial activity - foreign exchanges -0,23 +0,05
financial activity - other financial assets -0,60 -0,07
tax -1,24 -1,78
Normalized NPAT 11,2 12,0
Total of one-off's +0,65 +1,25
revaluation of liability for purchase of EST +0,02 +0,87
revaluation of liability for purchase of BDS +0,18
revaluation of liability for purchase of ASEE Bulgaria -0,01 +0,11
revaluation of net assets on acquisition of SIMT +0,10
revaluation of liability for purchase of Altius +0,08
deferred tax asset on tax losses +0,55
FS NPAT 11,9 13,2

Solutions for Demanding Business
FY '12 FY '11 Q4 '12 Q4 '11
mEUR mEUR mEUR mEUR
Revenue 110,8 111,6 -1% 33,3 33,5 -1%
Licence 7,6 6,8 +11% 3,0 2,0 +51%
Maintenance 31,2 28,2 +11% 8,4 7,9 +6%
Services 13,8 15,6 -12% 3,7 4,9 -24%
TP + Eq. + Infr. 58,2 60,9 -4% 18,2 18,7 -3%
M1 61,7 60,4 +2% 17,7 17,9 -2%
Licence 7,5 6,8 +10% 3,0 2,1 +42%
Maintenance 30,7 28,0 +10% 8,1 7,9 +2%
Services 13,7 15,5 -11% 3,7 4,9 -25%
TP + Eq. + Infr. 9,7 10,1 -3% 3,0 3,1 -4%
OC + Oper.
Activities Balance 49,1 47,1 +4% 13,7 13,6 +1%
EBIT 12,6 13,3 -5% 3,9 4,3 -9%
%EBIT 11% 12% -0,51pp 12% 13% -1,08 pp
Financial and other
operations 0,5 1,7 0,1 0,4
Income tax -1,2 -1,8 -0,4 -0,5
Net Profit of Asseco
SEE 11,9 13,2 -10% 3,6 4,2 -14%
∆ % ∆ %
Financial Update [EUR]
27

Solutions for Demanding Business
28
FY '12 FY '11 Q4 '12 Q4 '11
mPLN mPLN mPLN mPLN
Revenue 462,5 461,9 +0% 139,0 138,6 +0%
Licence 31,7 28,2 +12% 12,6 8,3 +52%
Maintenance 130,1 116,7 +12% 35,0 32,6 +7%
Services 57,6 64,6 -11% 15,4 20,3 -24%
TP + Eq. + Infr. 243,1 252,3 -4% 75,9 77,4 -2%
M1 257,5 250,0 +3% 73,7 74,3 -1%
Licence 31,5 28,3 +11% 12,3 8,6 +43%
Maintenance 128,2 115,9 +11% 33,6 32,6 +3%
Services 57,3 64,1 -11% 15,3 20,3 -24%
TP + Eq. + Infr. 40,6 41,7 -3% 12,4 12,8 -3%
OC + Oper.
Activities Balance 204,9 195,1 +5% 57,2 56,4 +2%
EBIT 52,6 54,9 -4% 16,5 17,9 -8%
%EBIT 11% 12% -0,51pp 12% 13% -1,08 pp
Financial and other
operations 2,0 7,2 0,3 1,7
Income tax -5,1 -7,4 -1,7 -2,2
Net Profit of Asseco
SEE 49,6 54,7 -9% 15,2 17,4 -13%
∆ % ∆ %
Financial Update [PLN]