financial results h1 2015 - grupapolsat.pl · prepaid services 24.7% audience share ... the bonds...
TRANSCRIPT

26 August 2015
Financial results H1 2015
Cyfrowy Polsat S.A. Capital Group

Disclaimer
This presentation includes 'forward-looking statements'. All statements other than statements of historical facts included in this presentation, including, without limitation, those regarding our financial position, business strategy, plans and objectives of management for future operations (including development plans and objectives relating to our products and services) are forward-looking statements. Such forward-looking statements involve known and unknown risks, uncertainties and other important factors that could cause the actual results, performance or achievements to be materially different from future results, performance or achievements expressed or implied by such forward-looking statements. Such forward-looking statements are based on numerous assumptions regarding our present and future business strategies and the environment in which we will operate in the future. These forward-looking statements speak only as at the date of this presentation. We expressly disclaim any obligation or undertaking to disseminate any updates or revisions to any forward-looking statements contained herein to reflect any change in our expectations with regard thereto or any change in events, conditions or circumstances on which any such statement is based. We caution you that forward-looking statements are not guarantees of future performance and that our actual financial position, business strategy, plans and objectives of management for future operations may differ materially from those made in or suggested by the forward-looking statements contained in this presentation. In addition, even if our financial position, business strategy, plans and objectives of management for future operations are consistent with the forward-looking statements contained in this presentation, those results or developments may not be indicative of results or developments in future periods. We do not undertake any obligation to review or to confirm or to release publicly any revisions to any forward-looking statements to reflect events that occur or circumstances that arise after the date of this presentation.
As the consolidation of the results of Metelem Holding Company Limited, the company indirectly controlling Polkomtel, started from 7 May 2014, the Company has decided to adjust the method of presentation of its operational data so as to align it with the new structure and mode of operation of our Group. The presentation contains the new set of key performance indicators (KPI’s), covering our operations in the fields of telecommunications and pay TV. The operational indicators from before that period are only of informational nature and they demonstrate the impact that Metelem Group’s operational performance, Polkomtel’s results in particular, would have had on the Group’s operational results, had Metelem Group been part of Polsat Group during these periods. The KPI’s are illustrative only and due to their nature they only present a hypothetical situation, hence they do not present the Group’s actual operational results for specific periods.
.

1. Keystone events
2. Operations Report
3. Financial results
4. Q&A
Contents

1. Keystone events
Tomasz Gillner-Gorywoda President of the Management Board, CEO

5
Key facts in Q2’15(1)
2.07 RGU per customer
PLN 87.0 ARPU per customer
6.0m contract customers
10.3m telephony
4.4m pay TV
1.7m Internet
16.3m RGU
12.4m contract services
4.0m prepaid services
24.7% audience share
25.4% ad market share
Note: (1) rounded figures

6
PLN 2,469m Revenue
3.0x Net debt/EBITDA
PLN 977m EBITDA
39.6% EBITDA margin
Key facts in Q2’15
PLN 680/1,491m FCF (Q2’15/LTM)

Key events
• New release of the smartDOM program. The refreshed offer features the possibility of purchasing even up to 6 services, 5 of which are offered at discounted prices
• Migration of CP TV services to MPEG-4 compression standard (from October 2015)
Products and services
• Issue of unsecured bonds worth PLN 1 billion with interest rate of WIBOR 6M+250bps. The bonds are traded in the Catalyst alternative trading system
• Pre-term repayment of PLN 1 billion under the SFA CP
• Continuation of the refinancing process of SFA CP and SFA PLK facilities
Corporate events
7

2. Operations Report

2.1 Services to individual and business customers
Tomasz Gillner-Gorywoda President of the Management Board, CEO

10
85.3 87.0
1.93
2.07
150%
250%
50
55
60
65
70
75
80
85
90
Q2'14 Q2'15
ARPU RGU/customer
Effective execution of the strategy
• Customer base remains at a level of 6.0m
• Churn ratio of 10.1% as a result of an accumulation of ending contracts for pay TV in H1'15
• Consistent execution of the strategy resulting in an increase in the saturation of the customer base with contract services
• Sharp increase of ARPU per customer by 2.0% YoY
(AR
PU
in P
LN)

6.6m 6.5m
4.3m 4.4m
1.1m 1.5m
Q2'14 Q2'15
Telefonia komórkowa
Płatna telewizja
Internet
11
12.0m 12.4m
• Growth of the total base of contract services by 2.9%
• Number of customers of the contract-based Internet access service approaches 1.5m, due to effective saturation of the customer base with integrated services
• Growth of the number of pay TV RGUs by 2.8% driven by continued demand for the Multiroom service
• Slight decrease of the number of mobile telephony RGUs, as a result of a highly competitive market
Stable growth of contract services
Internet Pay TV Mobile telephony

12
3.9m 3.7m
0.2m 0.2m
0.1m 0.05m
Q2'14 Q2'15
Telefonia komórkowa
Internet
4.2m
17.9 18.3
Q2'14 Q2'15
4.0m
• RGU base of prepaid services mainly affected by the gradual migration of prepaid customers to postpaid contracts, a trend observed throughout the market
• ARPU growth at a pace of 2.6% YoY: in a stable pricing environment in the segment
• Growth of data consumption on smartphones and higher volumes of traffic positively reflected in the level of ARPU
Prepaid services
(AR
PU
in P
LN)
Pay TV Internet Mobile telephony

34
172
382
569
707
791
Q1'14 Q2'14 Q3'14 Q4'14 Q1'15 Q2'15
13
• Stable growth of the saturation of our customer base with integrated services
• 791K customers purchased additional services from our smartDOM offer
• The number of RGUs owned by this group of customers is 2.41 million
Success of our multiplay strategy
(th
ou
. cu
sto
mer
s)
Number of smartDOM customers

14
1 123 1 269
1 368 1 437 1 483
Q2'14 Q3'14 Q4'14 Q1'15 Q2'15
YoY +32% +39% +39% +39% +32%
3 800
4 200
4 600
5 000
Jun'14 Sep'14 Dec'14 Mar'15 Jun'15
23%
• The successive increase of our network coverage combined with an effective multiplay strategy enables us to maintain the rate of acquisition of new mobile Internet RGUs
• Already over 2300 base stations operate in LTE800 data transmission technology thanks to which Plus and Cyfrowy Polsat customers enjoy the largest LTE network coverage footprint
• Continuous growth of the number of smartphone users – in Q2’15 smartphones accounted for around 90% of the total number of handsets sold
• As a result, in June 2015 data transmission services were actively used by 4.9m SIMs logged onto our network
Growth of the base of contract Internet RGUs
(th
ou
.)
Dynamically growing base of mobile broadband and smartphone users
Number of active data users (1)
Note: (1) Includes Internet access contract RGU’s as well as other SIMs with data transfer exceeding 1MB in a given month

2.2 Broadcasting and TV production segment
Maciej Stec Member of the Management Board

• Polsat’s main channel and Polsat Group are the viewership leaders in the commercial group
• Very positive effect of programming investments made in TV4 and TV6 channels
23.6% 21.9%
24.5%
8.4%
21.6% 24.7%
22.1% 23.9%
9.5%
19.9%
PolsatGroup
TVN Group TVP Group OtherCabSat
Other DTT
Q2'14
Q2'15
16
Viewership of our channels in Q2’15
Source: NAM, All 16‐49, all day, SHR%; internal analysis
Thematic channels
Audience shares
Main channels
Dynamics of audience share results
11.3% 9.9%
7.6%
POLSAT TVN TVP
13.4% 12.2%
8.5% 7.8%
POLSAT TVN TVP 1 TVP 2

• Polsat’s main channel and thematic channels are the viewership leaders in the commercial group
• Polsat Group viewership in line with the strategy
23.0% 21.8%
25.2%
7.7%
22.2% 24.3%
21.9% 24.1%
9.5%
20.2%
PolsatGroup
TVN Group TVP Group OtherCabSat
Other DTT
H1'14
H1'15
17
Viewership of our channels in H1’15
Source: NAM, All 16‐49, all day, SHR%; internal analysis
Thematic channels
Audience shares
Main channels
Dynamics of audience share results
10.9% 9.5%
7.3%
POLSAT TVN TVP
13.4% 12.5%
8.7% 8.1%
POLSAT TVN TVP 1 TVP 2

1,078 1,110
Q2'14 Q2'15
• TV advertising and sponsorship market in Q2’15 increased YoY by 3.0%
• Revenue from TV advertising and sponsorship of TV Polsat Group grew faster than the market
• Our share in the TV advertising market increased to 25.4%
267 282
Q2'14 Q2'15
+3.0%
+5.5%
18
Position on the advertising market in Q2’15
mP
LN
mP
LN
Source: Starlink, airtime and sponsorship; TV Polsat; internal analysis Note: (1) Revenue from advertising and sponsorship of TV Polsat Group according to Starlink’s definition
Market expenditures on TV advertising and sponsorship
Revenue from advertising and sponsorship of TV Polsat Group(1)
1,920 1,983
H1'14 H1'15
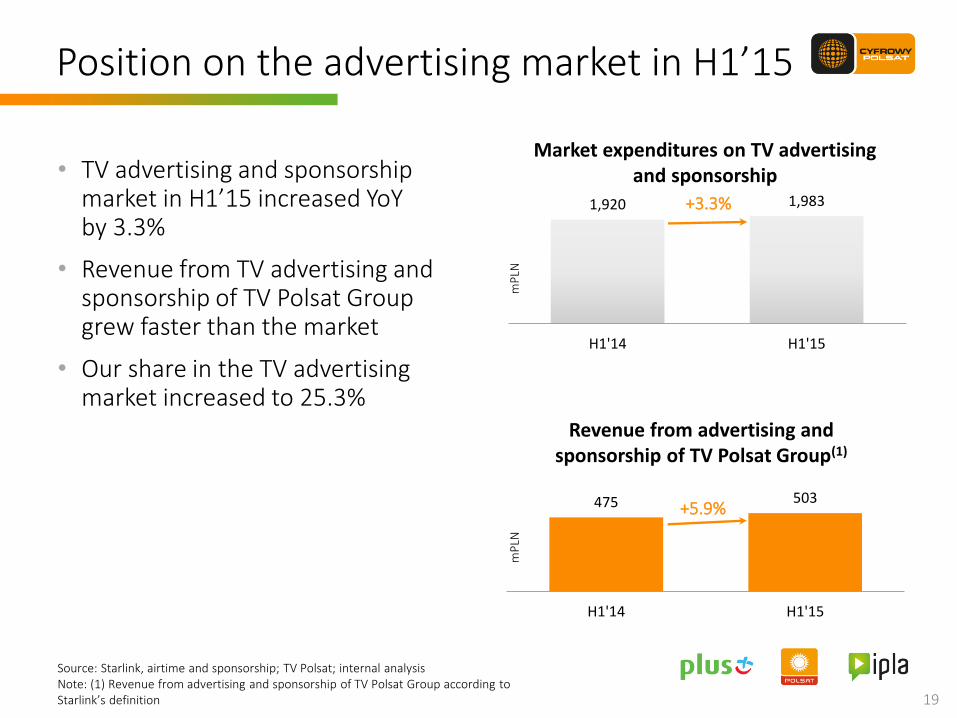
• TV advertising and sponsorship market in H1’15 increased YoY by 3.3%
• Revenue from TV advertising and sponsorship of TV Polsat Group grew faster than the market
• Our share in the TV advertising market increased to 25.3%
475 503
H1'14 H1'15
+3.3%
+5.9%
19
Position on the advertising market in H1’15
mP
LN
mP
LN
Source: Starlink, airtime and sponsorship; TV Polsat; internal analysis Note: (1) Revenue from advertising and sponsorship of TV Polsat Group according to Starlink’s definition
Market expenditures on TV advertising and sponsorship
Revenue from advertising and sponsorship of TV Polsat Group(1)

3. Financial results
Tomasz Szeląg Member of the Management Board, CFO

Source: Interim condensed consolidated financial statements for the 3 and 6 month periods ended 30 June 2015 and internal analysis Note: (1) Costs exclude depreciation, amortization, impairment and liquidation
mPLN Q2’15 YoY change
Revenue 2,469 41%
Operating costs(1) 1,506 45%
EBITDA 977 38%
EBITDA margin 39.6% (1.0pp)
Net profit 305 130%
21
• Increase in major bottom-line items as a result of the consolidation of Metelem Group’s results for the full quarter (the consolidation of the comparative period from 7 May 2014)
• Excluding the effect of consolidation of Metelem, revenue grew YoY at 5.7% and EBITDA increased by 9.7%
• Net profit increased to the level of PLN 305m mainly as a result of ongoing optimization of the financing structure of Polsat Group's activities
Group’s financial results in Q2’15

mPLN Q2’15 YoY change
Revenue 2,171 49%
Operating costs(1) 1,341 54%
EBITDA 844 42%
EBITDA margin 38.9% (1.7pp)
Net profit 211 30%
22
• Excluding the effect of consolidation of Metelem, revenue grew at 4.9%, primarily due to higher sales of telecommunication products
• In spite of growing data transmission costs, due mainly to the growing number of mobile Internet service users, EBITDA for this segment, excluding consolidation of Metelem, grew at the pace of 6.6%, driven by, among others, lower marketing costs as well as lower customer service and retention costs
Source: Interim condensed consolidated financial statements for the 3 and 6 month periods ended 30 June 2015 and internal analysis Note: (1) Costs exclude depreciation, amortization, impairment and liquidation
Results of the segment of services to individual and business customers in Q2’15

23
mPLN Q2’15 YoY change
Revenue 346 6%
Operating costs(1) 213 2%
EBITDA 134 15%
EBITDA margin 38.6% 2.8pp
Net profit 109 3%
• Increase in revenue mainly due to the
monetization of higher audience shares
of TV4 and TV6 channels and the new
Disco Polo Music channel – launched in
May 2014
• Control of operating costs positively
affected the improvement of EBITDA
and EBITDA margin
Source: Interim condensed consolidated financial statements for the 3 and 6 month periods ended 30 June 2015 and internal analysis Note: (1) Costs exclude depreciation, amortization, impairment and liquidation
Results of the broadcasting and TV production segment in Q2’15

24
+41% +548 m
1,746
2,469
24
738 21
-60
RevenueQ2'14
Formersegment of
servicesprovided toresidentialcustomers
MetelemGroup
Broadcastingand TV
productionsegment
Consolidationadjustments
RevenueQ2'15
(mP
LN)
+41% +723 m
1,352
1,899
21
555 5
-34
Operating costsQ2'14
Formersegment of
servicesprovided toresidentialcustomers
Metelem Group Broadcastingand TV
productionsegment
Consolidationadjustments
Operating costsQ2'15
(mP
LN)
Source: Interim condensed consolidated financial statements for the 3 and 6 month periods ended 30 June 2015 and internal analysis
YoY change
Operating costs
YoY change
Revenue
Revenue and costs – change drivers in Q2’15

25
+130% +172 m
709
977
11
246 17
-6
EBITDAQ2'14
Formersegment of
servicesprovided toresidentialcustomers
MetelemGroup
Broadcastingand TV
productionsegment
Consolidationadjustments
EBITDAQ2'15
(mP
LN)
+38% +268 m
EBITDA
41% 40%
132
305
86
87
Net profitQ2'14
Consolidation ofMetelem Group's
results
Other factors Net profitQ2'15
(mP
LN)
Source: Interim condensed consolidated financial statements for the 3 and 6 month periods ended 30 June 2015 and internal analysis
Net profit
EBITDA and net profit – change drivers in Q2’15
EBITDA Margin
YoY change YoY change

1,652
689
107
21
1,204
479
55
7
Retail revenue
Wholesale revenue
Sale of equipment
Other revenue
Q2'15 Q2'14
67%
28%
4% 1%
Retail revenue
Wholesale revenue
Sale of equipment
Other revenue
37%
44%
94%
26
200%
Source: Interim condensed consolidated financial statements for the 3 and 6 month periods ended 30 June 2015 and internal analysis
mPLN
Revenue structure in Q2’15

27.5%
21% 15.5%
14%
10%
7.5%
1.5% 3%
Technical costs and cost of settlements with telecommunication operators
Depreciation, amortization, impairment and liquidation
Cost of equipment sold
Content cost
Distribution, marketing, customer relation management and retentioncostsSalaries and employee-related costs
Cost of debt collection services and bad debt allowance and receivableswritten offOther costs
522
393
292
274
193
141
28
56
288
311
190
261
132
108
18
43
Technical costs and cost of settlementswith telecommunication operators
Depreciation, amortization,impairment and liquidation
Cost of equipment sold
Content cost
Distribution, marketing, customerrelation management and retention
Salaries and employee-related costs
Cost of debt collection services andbad debt allowance
Other costs
Q2'15 Q2'14
costs
and receivables written off
81%
26%
54%
5%
46%
30%
55%
30%
27
Source: Interim condensed consolidated financial statements for the 3 and 6 month periods ended 30 June 2015 and internal analysis
mPLN
Operating costs structure in Q2’15

1,396.6
1,747.9
1,513.6
-209.3
-834.2
-472.3
-29.5 -277.7
0.8 42.7
Net cash fromoperating activities
Return depositpaid in the auctionof 800/2600 MHz
frequencies
Inflows andrepayment
of loans andborrowings
capital
Payment ofinterest
Acquisition ofsubsidiaries, net of
cash acquired
CAPEX Other cash flows
(mP
LN)
(1)
28
1,439.3
Source: Interim condensed consolidated financial statements for the 3 and 6 month periods ended 30 June 2015 and internal analysis Note: (1) Excluding expenditures on set‐top‐boxes leased to customers
Cashflow statement in H1’15
Cash and cash equivalents at the beginning of the period
Cash and cash equivalents at the
end of the period
(incl. short‐term investments)
on loans, borrowings, bonds, Cash Pool, finance
lease and commissions

144
305 311 414
86
680
Q1'14 Q2'14 Q3'14 Q4'14 Q1'15 Q2'15
Lower share of installment
plan sales, advance CIT, lower CAPEX,
lower interest
29
HY PLK coupon,
payments for 2013 CAPEX
last HY CPS
coupon
HY PLK coupon,
annual UMTS fee
Source: Interim condensed consolidated financial statements for the 3 and 6 month periods ended 30 June 2015 and internal analysis Note: (1) Includes impact of hedging instruments, excludes early redemption costs and amounts paid for costs related to acquisition of financing; (2) Adjusted for transitory VAT settlements
mPLN Q2’15
Net cash from operating activities 887
Net cash used in investing activities -139
Payment of interest on loans, bonds, Cash Pool(1) -114
FCF after interest 633
Return deposit paid in the auction of 800/2600 MHz frequencies
22
Acquisition of subsidiaries 25
Adjusted FCF after interest 680
HY PLK coupon,
payments for 2014 CAPEX
higher investment
in customers,
rescheduling of CP’s interest
Reconciliation of FCF after interest
Adjusted FCF after interest (2014 pro forma)(2)

Source: Interim condensed consolidated financial statements for the 3 and 6 month periods ended 30 June 2015 and internal analysis
PLN 66.4%
EUR 18.4%
USD 15.2%
Currency composition of our indebtedness4
228 440 520 640 350
824 594
3.026
1.576
1,264 1,114
3,666
1,926
4,158
2015 2016 2017 2018 2019 2020
Our debt maturing profile4
SFA CP SFA PLK PLK Senior Notes
(mPLN)
1 Nominal value of PLK Senior Notes of EUR 542.5 m, as converted based on the average NBP exchange rate from 30 June 2015 of 4.1944 PLN/EUR. Carrying amount estimated to fair value at the moment of purchase of Metelem. 2 Nominal value of PLK Senior Notes of PLK USD 500 m, as converted based on the average NBP exchange rate from 30 June 2015 of 3.7645 PLN/USD. Carrying amount estimated to fair value at the moment of purchase of Metelem. 3 The item contains cash and cash equivalents, including restricted cash and short-term deposits. 4 Nominal value of debt, excl. RCF
30
mPLN Carrying amount Nominal value
Term Loan (PLN) 2,145 2,178
Revolving Loan 70 70
PLK Loan – Tranche A (PLN) 1,414 1,418
PLK Loan – Tranche B (PLN) 3,010 3,026
PLK Loan – Tranche C (PLN) 1,565 1,576
PLK Revolving Loan 0 0
Senior Notes PLK EUR1 2,778 2,276
Senior Notes PLK USD2 2,284 1,882
Leasing 19 19
Cash and cash equivalents3 1,440 1,440
Net debt 11,846 11,006
EBITDA LTM 3,621 3,621
Net debt / EBITDA LTM 3.3x 3.0x
The Group’s debt as at 30 June 2015

Source: Interim condensed consolidated financial statements for the 3 and 6 month periods ended 30 June 2015 and internal analysis Nota: (1) Nominal value of debt, excl. RCF (2) Equivalent of the nominal value of EUR 542.5m and USD 500m PLK Senior Notes calculated at the average foreign exchange rates of the Polish National Bank as at August 24, 2015 of PLN/EUR 4.2390 and PLN/USD 3.6971, respectively 31
0
188 640
350
594
3,026
1,576 824 782
3,666
1,926
4,1482
1,000
2015 2016 2017 2018 2019 2020 2021
Our debt maturing profile1
SFA CP SFA PLK PLK Senior Notes series A Bonds
(mPLN)
The Group’s debt as at 24 August 2015
• As a result of the issue of Series A Bonds with a nominal value of PLN 1,000 each, which was carried out on 21 July, as well as thanks to the voluntary early repayment of the Term Loan in the amount of PLN 1bn, the structure of maturity of the Group’s debt has changed after the balance sheet date
• The graphs present the structure of maturity of the debt as well as the currency structure of the Group’s financial indebtedness as at 24 August 2015, expressed in nominal values, excluding the Revolving Loan

4. Q&A

Glossary
33
RGU (Revenue Generating Unit)
Single, active service of pay TV, Internet Access or mobile telephony provided in contract or prepaid model.
Customer Natural person, legal entity or an organizational unit without legal personality who has at least one active service provided in a contract model.
Contract ARPU Average monthly revenue per Customer generated in a given settlement period (including interconnect revenue)
Prepaid ARPU Average monthly revenue per prepaid RGU generated in a given settlement period (including interconnect revenue)
Churn Termination of the contract with Customer by means of the termination notice, collections or other activities resulting in the situation that after termination of the contract the Customer does not have any active service provided in the contract model.
Churn rate presents the relation of the number of customers for whom the last service has been deactivated (by means of the termination notice as well as deactivation as a result of collection activities or other reasons) within the last 12 months to the annual average number of customers in this 12-month period.
Usage definition (90-day for prepaid RGU)
Number of reported RGUs of prepaid services under the mobile telephony and Internet Access means the number of SIM cards which received or answered calls, sent or received SMS/MMS or used data transmission services within the last 90 days.
In practice this means that within the last 90 days a given card had to be inserted to a phone or another device which was active and was able to make or receive call, message, data transmission session. 90-day usage definition thus eliminates inactive cards.
Based on the aforementioned definition each year UKE collects data of the mobile operators in Poland in order for the European Commission to prepare a comparison of actual penetration of mobile telecommunication services in the EU countries (the so-called Digital Agenda report).

Contact Olga Zomer Spokesperson Phone: +48 (22) 356 6035 Fax: +48 (22) 356 6003 Email: [email protected] Bartłomiej Drywa Head of Investor Relations Phone: +48 (22) 356 6004 Fax: +48 (22) 356 6003 Email: [email protected]
Or visit our website:
www.grupapolsat.pl