financial results for the fiscal period ended …4: for the period ended september 30, 2018, the...
TRANSCRIPT

JAPAN REAL ESTATE INVESTMENT CORPORATION(8952)
1
FINANCIAL RESULTS FOR THE FISCAL PERIOD ENDED MARCH 2019
(REIT) May 16, 2019Name of Issuer: Japan Real Estate Investment Corporation Stock Exchange Listing: Tokyo Stock Exchange Securities Code: 8952 URL: https://www.j-re.co.jp/en/ Representative: Yutaka Yanagisawa, Executive Director Asset Management Company: Japan Real Estate Asset Management Co., Ltd. Representative: Naoki Umeda, President & CEO Contact: Masaru Motooka, Executive Officer & General Manager, Planning Department
/ TEL +81-3-3211-7951 Scheduled Date of Filling Securities Report: June 25, 2019 Scheduled date of dividend payment: June 14, 2019 Supplementary materials for financial results: Yes Holding of a briefing on financial results: Yes (primarily for institutional investors and analysts)
(Amounts are rounded down to the nearest million yen)
1. Financial Results for the March 2019 period (October 1, 2018 –March 31, 2019) (1) Operating Results (Percentages represent increases/decreases compared with results for the previous fiscal period)
Operating Revenues Operating Profit Ordinary Profit Profit Period ended Millions of yen % Millions of yen % Millions of yen % Millions of yen %
March 31, 2019 33,022 (0.1) 14,548 (0.2) 13,441 0.7 13,431 1.2September 30, 2018 33,066 3.5 14,578 7.2 13,348 8.0 13,273 8.0
Profit per Unit ROE
(Profit to Unitholders’ Equity Ratio)
ROA (Ordinary Profit to Total Assets Ratio)
Ordinary Profit to Operating Revenues Ratio
Period ended Yen % % %March 31, 2019 9,696 2.6 1.4 40.7
September 30, 2018 9,631 2.6 1.4 40.4Notes 1: Profit per unit is calculated as profit divided by the number of the average investment units during the period.
2: Regarding ROE, for the period ended March 31, 2019, the average amount of the unitholders’ equity as of the beginning and the end of the period, and for the period ended September 30, 2018, as new investment units were issued, the average amount of the unitholders’ equity considering the number of days.
(2) Dividends
Dividend per Unit
Excluding Excess of Accounting Profits
Total Cash Dividends Excluding Excess of Accounting Profits
Dividend in Excess of Accounting Profits
per Unit
Total Dividends in Excess of
Accounting Profits Payout Ratio
Ratio of Dividends to Net Assets
Period ended Yen Millions of yen Yen Millions of yen % %
March 31, 2019 9,697 13,432 0 0 100.0 2.6September 30, 2018 9,495 13,152 0 0 99.1 2.6
Notes 1: The payout ratio is rounded off to the first decimal place. 2: The payout ratio for the period ended September 30, 2018, as new investment units were issued, is calculated by the following formula.
The payout ratio = Total dividends / Profit × 100 3: For the period ended March 31, 2019, the total dividends are calculated as profit and adding the reservation for a reduction entry (2
million yen). 4: For the period ended September 30, 2018, the total dividends are calculated as profit, adding the reversal of reserve for special account for
reduction entry (17 million yen) and deducting the reserve for reduction entry (138 million yen).
(3) Financial Standing Total Assets Net Assets Equity Ratio Net Assets per Unit
As of Millions of yen Millions of yen % YenMarch 31, 2019 963,676 511,256 53.1 369,082
September 30, 2018 956,645 510,978 53.4 368,881
Reference: Total unitholders’ equity is 511,256 million yen for the March 2019 period and 510,978 million yen for the September 2018 period.

JAPAN REAL ESTATE INVESTMENT CORPORATION(8952)
2
(4) Cash Flows
Cash Flows from
Operating Activities Cash Flows from
Investing Activities Cash Flows from
Financing Activities Cash and Cash Equivalents
at End of Period Period ended Millions of yen Millions of yen Millions of yen Millions of yen
March 31, 2019 19,665 (12,148) (7,701) 24,382September 30, 2018 20,143 (26,658) 7,440 24,567
2. Performance Forecasts for the September 2019 period (April 1, 2019 to September 30, 2019) and the March 2020 period (October 1, 2019 to March 31, 2020)
(Percentages represent projected increases/decreases compared with the results for the preceding fiscal period)
Operating Revenues Operating Profit Ordinary Profit Profit Dividend per Unit
Excluding Excess of Accounting Profits
Dividend in Excess of Accounting
Profits per Unit Period ending Millions of yen % Millions of yen % Millions of yen % Millions of yen % Yen Yen
September 30, 2019 33,680 2.0 14,740 1.3 13,630 1.4 13,620 1.4 9,830 0March 31, 2020 33,680 (0.0) 14,900 1.1 13,860 1.7 13,850 1.7 10,000 0
Reference: Profit per unit forecast = Profit forecast / Number of total investment units forecast for the end of the period
(the September 2019 period): 9,830 yen; (the March 2020 period): 10,000 yen.
*Other
(1) Changes in Accounting Policy/Changes in Accounting Estimates/Restatements Changes in accounting policy following revisions to accounting standards, etc.: None Other changes in accounting policy: None Changes in accounting estimates: None Restatements: None
(2) Number of Units Outstanding
Number of Units Outstanding at End of Period (Including Treasury Units) As of March 31, 2019 1,385,210 units
As of September 30, 2018 1,385,210 units
Number of Treasury Units at End of Period As of March 31, 2019 0 units
As of September 30, 2018 0 units Note: Please refer to the notes regarding per unit information on page 25 for the number of investment units on which the calculations of
profit per unit are based.
* The Implementation Status of Statutory Audit At the time of disclosure of these financial results, the audit procedures for the financial statements pursuant to the Financial Instruments and Exchange Act have not yet finished.
* Explanation regarding the appropriate use of business operations forecasts, and other special remarks
1. Estimates for the Company’s future operating results contained in the financial results are forward-looking statements and are based on information currently available to the Company and certain assumptions deemed reasonable. Actual results may differ substantially from the projections depending on a number of factors. In addition, these forecasts do not guarantee the stated dividends. As for assumptions underlying performance forecasts, please refer to the table entitled “Assumptions Underlying Performance Forecasts for the September 2019 period (April 1, 2019 to September 30, 2019) and the March 2020 period (October 1, 2019 to March 31, 2020)” on pages 7 and 8.
JAPAN REAL ESTATE INVESTMENT CORPORATION(8952)
3
1. Related Corporations
Due to the fact that there have been no material changes to the “Structure and Formation” section in the most recent securities report
(released on December 25, 2018), information concerning it has been omitted.
2. Business Policy and Operations
(1) Business Policy
Due to the fact that there have been no material changes to “investment policies”, “investment targets”, or “dividend polices”
section in the most recent securities report (released on December 25, 2018), information concerning them has been omitted.
(2) Business Operations
① Results for the Period
Japan Real Estate Investment Corporation (the “Company”) was established on May 11, 2001, following the Act on
Investment Trusts and Investment Corporations of Japan (“ITA”). The Company was listed on the real estate investment
trust market of the Tokyo Stock Exchange (“TSE”) on September 10, 2001 (Securities Code: 8952). Since its IPO, the size
of the Company’s assets (total acquisition price) has grown steadily, expanding from 92.8 billion yen to 1.025 trillion yen*,
as of March 31, 2019. In the same period, the Company continued to grow steadily in the number of properties in its
portfolio, from 20 to 73 properties.
During the March 2019 period (October 1, 2018 to March 31, 2019), the Japanese economy continued to follow a moderate
yet steady recovery, following the previous period, with the upward trend of corporate revenue employment, capital
investments, and income environment.
In the market for leased office space, vacancy rates remained low due to the demand for office space expansion and the
improvement of office environment. The Company steadily accumulated the increasing income and earnings, as a result of
the more proactive rent revisions and the realization of the higher rents upon tenant replacements due to the favorable rent
market.
In the investment market for real estate, favorable conditions for the financing environment continued, and transaction
yields were still at a low level against the backdrop of domestic and overseas investors’ desire to actively invest with the
strict acquisition environment.
Under such market conditions, the Company made sound investments under the Investment Guideline of providing stable
dividends to unitholders, which was set forth at the time of the Company’s listing on the TSE and remains unchanged to this
date. Accordingly, the Company was able to provide a dividend at 9,697 yen, which is an increase by 202 yen compared
with the previous period.
* The acquisition price includes the selling price (614 million yen) of the part of Jingumae Media Square Building disposed on October 30, 2009. The total acquisition price in the subsequent sections follows the same convention.
② Results of Operations
a. Property Management and Acquisition and Disposition
In the market for leased office space in the fiscal period under review, as a result of our efforts to improve occupancy rates
through meticulous property leasing, the Company successfully maintained and achieved an occupancy rate of 99.5% as
of March 31, 2019, higher than the previously record-breaking rate in the September 30, 2018 period.
As for external growth, on January 23, 2019, the Company acquired Front Place Minami-Shinjuku (Shibuya-ku, Tokyo) at
9.25 billion yen. In addition, on March 1, 2019, the Company acquired Daido Seimei Niigata Building (Niigata City,
Niigata) at 1.77 billion yen.
As a result of the above, the Company’s portfolio at the end of the fiscal period under review, March 31, 2019, consisted
of 73 properties, with a total acquisition price of 1.025 trillion yen. Total leasable floor area stood at 855,902 m2 with
1,506 tenants in total.
Note: Shinjuku South Gate Project (tentative name) (land with leasehold interest), whose building ownership was
disposed on August 23, 2013, and Shibuya Cross Tower (land with leasehold interest), whose building ownership was disposed on January 18, 2018, are included in the above number of properties and total acquisition price, but are not included in total leasable floor area or total number of tenants.

JAPAN REAL ESTATE INVESTMENT CORPORATION(8952)
4
b. Finance Activities
According to its financial policy, the Company aims to operate the LTV ratio (ratio of interest-bearing debt to total assets)
at 30% to 40%, and strives to maintain a sound and conservative financial profile by staggering maturities, extension of
durations and diversification of stable lenders among other possibilities, taking into consideration the borrowing costs and
existing relationships with lenders.
Concerning new loans related to property acquisition and the refinancing of existing loans, the Company carries out loans
strategically and flexibly after giving close consideration to the above-mentioned means, as well as the possibility of
repayment with funds procured from issuing new investment units.
During the March 2019 period, the Company issued Japan Real Estate Investment Corporation 12th Unsecured Bonds
(Japan Real Estate Investment Green Bonds) in order to procure the funds to allocate to the following Eligible Green
Projects; the refurbishments of Shiba 2Chome Daimon Building and the repayments of loans for acquiring Akasaka Park
Building and Shijo Karasuma Center Building. In addition, the Company made a loan of 9.0 billion yen to acquire Front
Place Minami-Shinjuku. As a result of the above financing activities, as of March 31, 2019, the Company’s total
interest-bearing debt was 389.9 billion yen, a 5.5 billion yen increase from the end of the previous period. This amount
consists of long-term loans totaling 348.5 billion yen (including the current portion of long-term loans totaling 49.0 billion
yen), short-term loans totaling 8.5 billion yen, and investment corporation bonds totaling 32.9 billion yen. The current
LTV ratio stands at 40.5%.
The Company’s credit ratings as of March 31, 2019 were as follows:
Rating Agency Credit Rating
S&P Global Ratings Japan Inc. Long-term: A+; Short-term: A-1; Outlook: Stable
Moody’s Japan K.K. Rating: A1; Outlook: Stable
Rating and Investment Information, Inc. Rating: AA; Outlook: Stable
c. General Meeting of Unitholders
The Company held the 11th General Meeting of Unitholders on March 20, 2019. The meeting deliberated agenda items
concerning partial amendments to the Articles of Incorporation, appointment of one executive director, appointment of two
substitute executive directors, appointment of two supervisory directors, and appointment of one substitute supervisory
director. All agenda items were approved and resolved in accordance with the original proposals. Following the meeting
resolutions, Mr. Yutaka Yanagisawa (new appointment) was designated as Executive Director, while Mr. Tomohiro Okanoya
(reappointment) and Mr. Hiroaki Takano (reappointment) assumed the office of Supervisory Directors, as of May 11, 2019.
Meanwhile, Mr. Naoki Umeda and Mr. Kazuo Nezu have been designated as Substitute Executive Directors. Likewise, Mr.
Yoshinori Kiya has been designated as Substitute Supervisory Director.
③ Summary of Financial Results and Dividends
As a result of the above operations, in the period under review, the Company’s operating revenues decreased 0.1%
compared with the previous period, to 33.0 billion yen. On the earnings front, operating profit decreased 0.2%, to 14.5
billion yen. After deducting expenses for interest payments on loans and other costs, ordinary profit increased 0.7%, to 13.4
billion yen, and profit increased 1.2%, to 13.4 billion yen.
Turning to dividends, the Company will make cash distributions using accounting profits based on the dividend policy
outlined in Article 32-1(2) of the Company’s Articles of Incorporation, in an amount that exceeds 90% of earnings available
for dividends as required by Article 67-15 of the Special Taxation Measures Act. Based on this policy, the Company decided
that the total amount of dividends, which is set not to exceed the unappropriated retained earnings and also to secure
retained earnings brought forward, is 13,432,381,370 yen for the period under review, which is a multiple of 1,385,210-the
number of units outstanding as of March 31, 2019. Accordingly, the dividend per investment unit is 9,697 yen.
(3) Outlook
① Operating Environment
The Japanese economy in the future is expected to follow a course of moderate recovery as a result of further improving
conditions for employment and income, as well as various financial policies in force. However, due to the influence of the
world economy given by the trend of trade issues, the uncertainty of overseas economies, and the influence of changes in
the financial capital market, the Company considers that it is necessary to give close attention to these downward risks.
In the market for leased office space, especially regarding the increase in office space supply in the Tokyo metropolitan
areas, it is necessary to pay close attention to indirect effects on the surrounding areas in the future. However, the demand

JAPAN REAL ESTATE INVESTMENT CORPORATION(8952)
5
of the new supply properties is still high, and business performance is expected to maintain a high level in the future. The
Company expects that the occupancy rates will maintain a high level for the time being, and the gentle upward trend in
rents will continue.
Regarding the investment market for real estate, continuation of low interest rates and positive investment willingness have
lasted, and transactions carried out at stronger valuation are anticipated to continue. Therefore, it is important to continue to
be proactive in searching for new properties while paying close attention to market trends.
a Property Management
Based on the conditions stated above, the Company will adhere to the following management policies in order to maintain
and improve profitability.
(i) Strengthen relationships of trust with existing tenants
The Company has contracts with numerous property management companies. Each property management company has
developed relationships of trust with their tenants through their daily diligence in managing their respective properties
over the years. The Company will work to further solidify these relationships by anticipating tenants’ needs and
providing tailored services to bolster tenant satisfaction, thereby maintaining and improving occupancy rates and raising
the rent levels.
(ii) Fill vacancies promptly
In cooperation with the property management companies mentioned above and their leasing brokers, the Company will
actively seek the most appropriate tenants for each property, based on location and features, in order to fill current and
anticipated vacancies without delay. Furthermore, the Company will work to identify additional needs for floor area
among the existing tenants.
(iii) Stabilize revenues and earnings
With the aim of stabilizing revenues and earnings, the Company will endeavor to promote fixed lease agreements and
secure long-term leasing with its large-scale tenants.
(iv) Reduce management costs
The Company has introduced sound competitive principles to a number of property management companies so that
they perpetually review and improve their management systems and cost structures. Along with this, the Company
endeavors to ensure and enhance tenant satisfaction.
b Property Acquisitions and Dispositions
The Company has adopted the following policies for acquiring properties.
(i) To access property information quickly, the Company continues to enhance its property information channels while
working to develop new channels.
(ii) In its acquisition activities, the Company continues to meticulously monitor and examine economic, physical, and legal
factors, including rights-related issues, when selecting properties. In particular, with regard to the structure of buildings,
the Company requires buildings to meet or exceed new earthquake-resistant standards, verifies the need for renovations
by capturing current conditions accurately based on engineering reports, and exclusively targets properties capable of
maintaining a competitive edge in terms of the facilities they offer over the medium to long term.
(iii) In accordance with its acquisition policies, the Company shall maintain its portfolio so that 70% or more of the portfolio
properties are located within the Tokyo metropolitan area, with the remaining 30% or fewer located in other major
cities.
Under these policies, the Company will continue to acquire highly competitive properties. At the same time, in order to
further improve the quality of its portfolio, the Company will remain open to the replacement of portfolio properties
with due consideration at the right time.
c Financial Policies
The Company has adopted the following financial policies.

JAPAN REAL ESTATE INVESTMENT CORPORATION(8952)
6
(i) In principle, the Company shall maintain an LTV ratio (including investment corporation bonds) below 65%. To ensure
an even lower interest-bearing debt ratio, the Company adopts the conservative target level of 30% to 40%.
(ii) The Company shall set the ceiling for the combined total of loans and investment corporation bonds at 1 trillion yen.
(iii) When obtaining a loan, the Company shall only negotiate with qualified institutional investors (limited to those defined
under Article 67-15 of the Special Taxation Measures Act) before executing a loan agreement.
(iv) With the purpose of maintaining liquidity at an appropriate level, the Company may establish preliminary borrowing
frameworks such as overdraft agreements and commitment line agreements, or may conclude preliminary contracts for
loans, as needed.
(v) The Company aims for the best possible execution of financial transactions by negotiating with numerous financial
institutions.
② Performance Forecasts
The Company’s forecasts for the September 2019 period (April 1, 2019 to September 30, 2019) are as follows: operating
revenues totaling 33.6 billion yen, operating profit totaling 14.7 billion yen, ordinary profit totaling 13.6 billion yen, and
profit totaling 13.6 billion yen. The Company plans to declare a per-unit cash dividend of 9,830 yen.
The Company’s forecasts for the March 2020 period (October 1, 2019 to March 31, 2020) are as follows: operating
revenues totaling 33.6 billion yen, operating profit totaling 14.9 billion yen, ordinary profit totaling 13.8 billion yen, and
profit totaling 13.8 billion yen. The Company plans to declare a per-unit cash dividend of 10,000 yen.
Regarding the assumptions underlying these forecasts, please see pages 7 and 8 entitled “Assumptions Underlying
Performance Forecasts for the September 2019 period (April 1, 2019 to September 30, 2019) and the March 2020 period
(October 1, 2019 to March 31, 2020).” Operating revenues, operating profit, ordinary profit, profit, and cash dividend per
unit might vary depending on changes that could occur in the market situation.

JAPAN REAL ESTATE INVESTMENT CORPORATION(8952)
7
Assumptions Underlying Performance Forecasts for the September 2019 period (April 1, 2019 to September 30, 2019)and the March 2020 period (October 1, 2019 to March 31, 2020)
Item Assumption
Accounting period ・The September 2019 period: April 1, 2019 to September 30, 2019 (183 days)
・The March 2020 period: October 1, 2019 to March 31, 2020 (183 days)
Number of
properties held by
the Company
・The Company’s property portfolio consists of 73 properties at the end of the March 2019 period. The actual
portfolio might differ from this assumption due to additional property acquisitions and dispositions.
・As of May 16, 2019, the Company does not have any forward or other commitments as set forth in the Financial
Services Agency’s Guidelines for Supervision.
Number of units
outstanding
・The Company assumes that the total number of units outstanding is 1,385,210 at the end of March 31, 2019.
Interest-bearing
debt
・The Company operates an LTV ratio within a range between 30% and 40% as an operational guideline.
・The Company made a short-term loan of 5.5 billion yen on April 3, 2019 due for repayments of the existing
short-term loans. As a result, the balance of interest-bearing debt is 389.9 billion yen as of May 16, 2019.
・In the September 2019 period, as of May 16, 2019, the Company will refinance the long-term loans due for
repayments during the period totaling 15.5 billion yen (repayment dates: May 29, 2019, September 2, 2019, and
September 26, 2019). There are no investment corporation bonds set to mature in the September 2019 period.
・In the March 2020 period, as of May 16, 2019, the Company will refinance the long-term loans due for
repayments during the period totaling 33.5 billion yen (repayment dates: October 1, 2019, November 1, 2019,
November 15, 2019, November 18, 2019, December 16, 2019, January 7, 2020, and January 15, 2020,) and the
short-term loans due for repayments during the period totaling 3.0 billion yen (repayment dates: December 26,
2019, and March 30, 2020). There are no investment corporation bonds set to mature in the March 2020 period.
Operating revenues
・Revenues from portfolio properties held by the Company are calculated by taking into consideration new
contract conclusions and existing contract cancellations fixed as of May 16, 2019, and by factoring in potential
variables that reflect recent market conditions for leased office space, such as rent levels and occupancy rates.

JAPAN REAL ESTATE INVESTMENT CORPORATION(8952)
8
Item Assumption
Operating
expenses
・Of the taxes applicable to the Company, property taxes, city planning taxes and depreciable property taxes
corresponding to the relevant fiscal period have been recorded as property-related expenses. However, when a
property is acquired at a point during the period used for the calculation of property tax, a property tax adjustment is
levied that takes into account the date of the transfer of the new acquisition. The amount of the adjustment is
factored into the acquisition price and therefore not recorded as an expense in the relevant fiscal period. In addition,
the Company assumes the 2020 property taxes, city planning taxes, and depreciable property taxes for properties
acquired in 2019 to be as follows:
50 million yen for Front Place Minami-Shinjuku, and 12 million yen for Daido Seimei Niigata Building
・The property and other taxes will 3,250 million yen in the September 2019 period and 3,250 million yen in the
March 2020 period.
・The depreciation will be 6,430 million yen in the September 2019 period and 6,380 million yen in the March 2020
period.
・Property management expenses are assumed by taking past operational results into consideration.
・Repair expenses may vastly differ from the projected amounts as such costs fluctuate significantly from one fiscal
period to another, and because these costs are not recurring.
Non-operating
expenses
・The non-operating expenses, such as interest expenses on loans and investment corporation bonds, will be 1,120
million yen in the September 2019 period and 1,040 million yen in the March 2020 period.
Dividend
amounts
・The Company assumes that the dividends in the September 2019 period and in the March 2020 period will be
appropriated from a portion of internal reserves (3 million yen in the September 2019 period and 3 million yen in the
March 2020 period).
・The Company shall not distribute dividends in excess of accounting profits. Thus, based on its Articles of
Incorporation, the Company shall make cash distributions of the amount that is higher than 90% of earnings available
for dividends up to the accounting profits.
Other
・No revisions will be made in such areas as laws, tax systems, accounting standards, and listing rules as well as
regulations of the Investment Trusts Association, Japan to the extent that impact the above-mentioned forecasts.
・No unprecedented or significant changes will occur to the general market trends or real estate market conditions or
other factors.
・In addition to the income taxes deferred on the reserves for reduction entry, the corporate and other taxes are
calculated by taking into consideration the taxes in relation to the amortization of term leasehold interest for
buildings and asset retirement obligations.

JAPAN REAL ESTATE INVESTMENT CORPORATION(8952)
9
3. Financial Statements (1) Balance Sheets
Thousands of yen
As of September 30, 2018 As of March 31, 2019
Assets Current assets
Cash and deposits 17,835,899 18,333,626Cash and deposits in trust 6,731,684 6,049,324Operating accounts receivable 369,098 403,661Prepaid expenses 336,007 303,936Other 32,310 27,349
Total current assets 25,304,999 25,117,897
Non-current assets Property, plant and equipment
Buildings 250,703,183 254,165,807Accumulated depreciation (90,392,605) (94,674,805)
Buildings, net 160,310,577 159,491,001
Structures 2,972,255 2,986,067Accumulated depreciation (877,184) (925,182)
Structures, net 2,095,070 2,060,884
Machinery and equipment 3,241,271 3,353,312Accumulated depreciation (2,245,875) (2,342,903)
Machinery and equipment, net 995,395 1,010,408
Tools, furniture and fixtures 446,611 457,745Accumulated depreciation (301,603) (313,936)
Tools, furniture and fixtures, net 145,008 143,808
Land 449,920,389 458,625,391Construction in progress 3,317 3,317Buildings in trust 101,992,788 103,203,658
Accumulated depreciation (26,099,836) (27,987,992)
Buildings in trust, net 75,892,951 75,215,666
Structures in trust 998,400 998,400Accumulated depreciation (272,067) (297,385)
Structures in trust, net 726,333 701,015
Machinery and equipment in trust 1,050,506 1,071,048Accumulated depreciation (763,039) (787,277)
Machinery and equipment in trust, net 287,466 283,770
Tools, furniture and fixtures in trust 69,201 72,883Accumulated depreciation (34,525) (38,496)
Tools, furniture and fixtures in trust, net 34,676 34,386
Land in trust 230,532,021 230,532,021Construction in progress in trust 1,583 7,979
Total property, plant and equipment 920,944,791 928,109,652
Intangible assets Land leasehold interests 5,690,875 5,675,045Land leasehold interests in trust 444,160 444,160Easement 828,095 828,095Other 9,655 7,938
Total intangible assets 6,972,786 6,955,239

JAPAN REAL ESTATE INVESTMENT CORPORATION(8952)
10
Thousands of yen
As of September 30, 2018 As of March 31, 2019
Investments and other assets Investment securities 577,168 577,168Leasehold and guarantee deposits 1,573,847 1,573,847Long-term prepaid expenses 224,778 118,528Other 1,005,707 1,138,615
Total investments and other assets 3,381,501 3,408,160
Total non-current assets 931,299,080 938,473,052
Deferred assets Investment corporation bond issuance costs 41,710 85,568
Total deferred assets 41,710 85,568
Total assets 956,645,790 963,676,518
Liabilities Current liabilities
Operating accounts payable 2,169,097 1,834,640Short-term borrowings 21,500,000 8,500,000Current portion of long-term borrowings 25,000,000 49,000,000Accounts payable - other 1,648,904 1,705,853Accrued expenses 440,744 429,796Income taxes payable 9,159 11,401Accrued consumption taxes 139,791 598,810Advances received 3,200,129 3,338,764Other 78,364 8,920
Total current liabilities 54,186,192 65,428,189
Non-current liabilities Investment corporation bonds 22,993,175 32,993,175Long-term borrowings 315,000,000 299,500,000Deposits received from tenants 52,853,494 53,863,645Deferred tax liabilities 290,234 289,105Asset retirement obligations 342,047 345,493Other 2,226 -
Total non-current liabilities 391,481,177 386,991,419
Total liabilities 445,667,369 452,419,608
Net assets Unitholders' equity
Unitholders' capital 497,241,216 497,241,216Surplus
Voluntary retained earnings Reserve for tax purpose reduction entry 413,528 550,359Reserve for special account for tax purpose reduction entry
16,307 -
Total voluntary retained earnings 429,835 550,359
Unappropriated retained earnings 13,307,368 13,465,334
Total surplus 13,737,204 14,015,693
Total unitholders' equity 510,978,420 511,256,909
Total net assets 510,978,420 511,256,909
Total liabilities and net assets 956,645,790 963,676,518

JAPAN REAL ESTATE INVESTMENT CORPORATION(8952)
11
(2) Statements of Income
Thousands of yen
For the period
from April 1, 2018 to September 30, 2018
For the period from October 1, 2018
to March 31, 2019
Operating revenues Rent revenues 32,676,423 32,783,783Other lease business revenues 119,158 238,662Gain on sales of real estate properties 270,871 -
Total operating revenues 33,066,453 33,022,445
Operating expenses Expenses related to lease business 16,843,215 16,819,683Asset management fee 1,294,322 1,296,545Asset custody fee 61,769 62,191Administrative service fees 131,335 132,759Directors' compensations 7,800 7,800Commission expenses 82,685 90,962Other operating expenses 66,365 64,004
Total operating expenses 18,487,493 18,473,946
Operating profit 14,578,960 14,548,499
Non-operating income Interest income 194 152Dividend income 9,832 -
Reversal of distributions payable 3,002 2,581Other - 2,676
Total non-operating income 13,029 5,410
Non-operating expenses Interest expenses 957,594 906,390Interest expenses on investment corporation bonds 172,816 161,833Amortization of investment corporation bond issuance costs 6,938 6,457
Investment unit issuance expenses 61,685 -
Other 44,471 37,875
Total non-operating expenses 1,243,505 1,112,557
Ordinary profit 13,348,484 13,441,352
Profit before income taxes 13,348,484 13,441,352
Income taxes - current 11,228 11,423Income taxes - deferred 63,781 (1,128)
Total income taxes 75,009 10,294
Profit 13,273,474 13,431,058
Retained earnings brought forward 33,894 34,276Unappropriated retained earnings 13,307,368 13,465,334

JAPAN REAL ESTATE INVESTMENT CORPORATION(8952)
12
(3) Statements of Changes in Unitholders’ Equity
For the period from April 1, 2018 to September 30, 2018
Unitholders' equity
Unitholders' capital
Surplus
Total unitholders'
equity
Voluntary retained earnings
Unappropri- ated retained
earnings
Total surplus
Reserve for tax purpose reduction
entry
Reserve for special
account for tax purpose reduction
entry
Total voluntary retained earnings
Balance at beginning of the period
458,016,096 363,261 - 363,261 12,324,186 12,687,448 470,703,544
Changes in items during the period
Issuance of new investment units
39,225,120 39,225,120
Provision of reserve for tax purpose reduction entry
50,335 50,335 (50,335) - -
Reversal of reserve for tax purpose reduction entry
(69) (69) 69 - -
Provision of reserve for special account for tax purpose reduction entry
16,307 16,307 (16,307) - -
Dividends of surplus (12,223,718) (12,223,718) (12,223,718)
Profit 13,273,474 13,273,474 13,273,474
Total changes in items during the period
39,225,120 50,266 16,307 66,574 983,181 1,049,756 40,274,876
Balance at end of the period 497,241,216 413,528 16,307 429,835 13,307,368 13,737,204 510,978,420
Total net assets
Balance at beginning of the period
470,703,544
Changes in items during the period
Issuance of new investment units
39,225,120
Provision of reserve for tax purpose reduction entry
-
Reversal of reserve for tax purpose reduction entry
-
Provision of reserve for special account for tax purpose reduction entry
-
Dividends of surplus (12,223,718)
Profit 13,273,474
Total changes in items during the period
40,274,876
Balance at end of the period 510,978,420

JAPAN REAL ESTATE INVESTMENT CORPORATION(8952)
13
For the period from October 1, 2018 to March 31, 2019
Thousands of yen Unitholders' equity
Unitholders' capital
Surplus
Total unitholders'
equity
Voluntary retained earnings
Unappropri- ated retained
earnings
Total surplus
Reserve for tax purpose reduction
entry
Reserve for special
account for tax purpose reduction
entry
Total voluntary retained earnings
Balance at beginning of the period
497,241,216 413,528 16,307 429,835 13,307,368 13,737,204 510,978,420
Changes in items during the period
Provision of reserve for tax purpose reduction entry
138,488 138,488 (138,488) - -
Reversal of reserve for tax purpose reduction entry
(1,657) (1,657) 1,657 - -
Reversal of reserve for special account for tax purpose reduction entry
(16,307) (16,307) 16,307 - -
Dividends of surplus (13,152,568) (13,152,568) (13,152,568)
Profit 13,431,058 13,431,058 13,431,058
Total changes in items during the period
- 136,831 (16,307) 120,523 157,965 278,489 278,489
Balance at end of the period 497,241,216 550,359 - 550,359 13,465,334 14,015,693 511,256,909
Total net assets
Balance at beginning of the period
510,978,420
Changes in items during the period
Provision of reserve for tax purpose reduction entry
-
Reversal of reserve for tax purpose reduction entry
-
Reversal of reserve for special account for tax purpose reduction entry
-
Dividends of surplus (13,152,568)
Profit 13,431,058
Total changes in items during the period
278,489
Balance at end of the period 511,256,909

JAPAN REAL ESTATE INVESTMENT CORPORATION(8952)
14
(4) Statements of Cash Distributions
For the period from April 1, 2018
to September 30, 2018
For the period from October 1, 2018
to March 31, 2019
Amount (Yen) Amount (Yen)
I Retained earnings 13,307,368,817 13,465,334,195
II Reversal of voluntary retained earnings
Reversal of reserve for special account for tax purpose reduction entry 16,307,490 -
Reversal of reserve for tax purpose reduction entry 1,657,580 2,100,289
III Cash distribution 13,152,568,950 13,432,381,370
(Dividend per investment unit) (9,495) (9,697)
IV Voluntary retained earnings
Reserve for tax purpose reduction entry 138,488,759 -
V Retained earnings brought forward 34,276,178 35,053,114
Computation Method for Determining
Dividends
The Company will make cash
distributions using accounting profits
based on the cash distribution policy
outlined in Article 32-1(2) of the
Company’s Articles of Incorporation, in
an amount that exceeds 90% of the
“amount of distributable profit” as set
forth in Article 67-15 of the Special
Taxation Measures Act. Based on this
policy, the Company has decided that the
total amount of dividends, under the
application of Article 65-7 “Exceptions of
the Taxation in case of the Replacement
by Purchase of Specific Assets” of the
Special Taxation Measures Act, making
reduction entries, and also which is set not
to exceed the unappropriated retained
earnings and to secure retained earnings
brought forward, is ¥13,152,568,950 for
the period under review, which is a
multiple of 1,385,210 — the number of
units outstanding as of September 30,
2018. Furthermore, the Company does not
pay out dividends that exceed accounting
profits as outlined in Article 32-1(3) of the
Company’s Articles of Incorporation.
The Company will make cash
distributions using accounting profits
based on the cash distribution policy
outlined in Article 32-1(2) of the
Company’s Articles of Incorporation, in
an amount that exceeds 90% of the
“amount of distributable profit” as set
forth in Article 67-15 of the Special
Taxation Measures Act. Based on this
policy, the Company has decided that the
total amount of dividends, which is set not
to exceed the unappropriated retained
earnings and also to secure retained
earnings brought forward, is
¥13,432,381,370 for the period under
review, which is a multiple of 1,385,210
— the number of units outstanding as of
March 31, 2019. Furthermore, the
Company does not pay out dividends that
exceed accounting profits as outlined in
Article 32-1(3) of the Company’s Articles
of Incorporation.

JAPAN REAL ESTATE INVESTMENT CORPORATION(8952)
15
(5) Statements of Cash Flows
Thousands of yen
For the period
from April 1, 2018 to September 30, 2018
For the period from October 1, 2018
to March 31, 2019
Cash flows from operating activities Profit before income taxes 13,348,484 13,441,352Depreciation 6,450,870 6,402,235Amortization of investment corporation bond issuance costs 6,938 6,457
Investment unit issuance expenses 61,685 -
Dividend income (9,832) -
Interest income (194) (152)Interest expenses 1,130,410 1,068,224Decrease (increase) in operating accounts receivable (27,659) (34,563)Decrease (increase) in supplies (544) -
Decrease (increase) in prepaid expenses 16,394 32,071Decrease in property, plant and equipment due to sale 370,182 -
Increase (decrease) in operating accounts payable 578,559 (662,311)Increase (decrease) in accounts payable - other 16,811 (1,778)Increase (decrease) in accrued consumption taxes (568,786) 459,018Increase (decrease) in accrued expenses (197) 131Increase (decrease) in advances received (48,283) 138,635Decrease (increase) in long-term prepaid expenses 125,602 106,250Other, net (133,760) (202,162)
Subtotal 21,316,679 20,753,408
Interest and dividends received 10,228 116Interest paid (1,169,558) (1,079,304)Income taxes paid (13,547) (9,181)
Net cash provided by (used in) operating activities 20,143,802 19,665,038
Cash flows from investing activities Purchase of property, plant and equipment (1,738,652) (12,197,475)Purchase of property, plant and equipment in trust (26,500,164) (961,265)Payments of leasehold and guarantee deposits (42,000) -
Refund of leasehold and guarantee deposits received (863,090) (997,779)Proceeds from leasehold and guarantee deposits received 2,485,440 2,007,931
Net cash provided by (used in) investing activities (26,658,466) (12,148,589)
Cash flows from financing activities Proceeds from short-term borrowings 18,500,000 3,000,000Repayments of short-term borrowings (29,000,000) (16,000,000)Proceeds from long-term borrowings 19,000,000 18,000,000Repayments of long-term borrowings (18,000,000) (9,500,000)Proceeds from issuance of investment corporation bonds - 10,000,000Redemption of investment corporation bonds (10,000,000) -
Payments of investment corporation bond issuance costs - (50,315)Proceeds from issuance of investment units 39,225,120 -
Payments for investment unit issuance expenses (61,685) -
Distributions paid (12,223,082) (13,150,767)
Net cash provided by (used in) financing activities 7,440,352 (7,701,082)
Net increase (decrease) in cash and cash equivalents 925,688 (184,632)
Cash and cash equivalents at beginning of the period 23,641,894 24,567,583
Cash and cash equivalents at end of the period 24,567,583 24,382,950

JAPAN REAL ESTATE INVESTMENT CORPORATION(8952)
16
(6) Notes Concerning Going Concerns Assumption
“Not applicable”
(7) Summary of Significant Accounting Policies Investment securities Non-marketable securities classified as other securities are carried at cost. Cost of securities sold is determined by the moving average method. Property and equipment, depreciation and impairment (except for leased assets) Property and equipment is stated at cost, less accumulated depreciation. The cost of land, buildings and building improvements includes the purchase price of property and acquisition costs. Depreciation is calculated on a straight-line basis over the estimated useful lives of the assets ranging as stated below: Buildings....................................................................... 2-61 years Structures...................................................................... 2-60 years Machinery and equipment............................................ 2-18 years Tools, furniture and fixtures......................................... 2-29 years Expenditures for repairing expenses are charged to income as incurred. Significant renewals and betterments are capitalized.
The Company reviews fixed assets for impairment whenever events or changes in circumstances indicate that the carrying amount of its fixed assets may not be recoverable. According to the standard set by the Accounting Standards Board of Japan, companies are required to recognize an impairment loss in their statement of income if certain indicators of asset impairment exist and the book value of an asset exceeds the undiscounted sum of future cash flows of the asset. The standard states that impairment losses should be measured as the excess of the book value over the higher of (i) the fair market value of the asset, net of disposition costs, and (ii) the present value of future cash flows arising from ongoing utilization of the asset and from disposal after asset use. The standard covers land, factories, buildings and other forms of property, plant and equipment as well as intangible assets. Fixed assets are grouped at the lowest level for which there is identifiable cash flows that are independent of cash flows of other groups of assets.
Intangible assets Intangible assets primarily consist of leasehold rights and easement, which are stated at cost. Amortization of a term leasehold interest for business use is calculated by the straight-line method based on the period of agreement. Leased assets Leased assets under finance lease transactions that do not transfer ownership of the leased assets to the lessees are capitalized and depreciated by the straight-line method over the lease term with no residual value. Deferred charges Investment corporation bond issuance costs are amortized using the straight-line method over the redemption periods.
Investment unit issuance expenses are charged to income as incurred. The underwriters’ economic remunerations for underwriting the offering are not recognized as investment unit issuance expenses in the financial statements since such costs are not paid by the Company as commission under the so-called “spread-method”.
Under the spread-method, the difference between the offer price (the price paid by the unitholder) and the issue price (the price received by the Company) is retained by the underwriters as remuneration. Revenue recognition Revenues from leasing of office space are recognized as rent accrues over the lease period. Taxes on property and equipment Property and equipment is subject to property taxes and city planning taxes on a calendar year basis. These taxes are generally charged to income during the period. The sellers of the properties are liable for property taxes for the calendar year including the period from the date of purchase by the Company through the end of the year since the taxes are imposed on the owner registered on the record as of January 1 based on the assessment made by the local government. The Company pays the amount equivalent to the property taxes to the sellers applicable to the period since acquisition and includes the amount equivalent to the taxes in the purchase price of each property and capitalizes it as a cost of the property. Consumption taxes Consumption taxes withheld and consumption taxes paid are not included in the statements of income. The consumption taxes paid are generally offset against the balance of consumption taxes withheld. As such, the excess of payments over amounts withheld are included in current assets and the excess of amounts withheld over payments are included in current liabilities. Cash and cash equivalents Cash and cash equivalents consist of cash on hand, deposits with banks and short-term investments, which are highly liquid, readily convertible to cash and with insignificant risk of price fluctuation, with original maturity of three months or less. Hedge accounting The Company enters into derivative transactions to hedge against interest-rate risk and other forms of risk based on the risk management policies outlined in the Company’s Articles of Incorporation. The Company uses interest-rate swap transactions for hedging fluctuations in interest rates on floating-rate loans. The Company has also executed currency swap transactions as a method of

JAPAN REAL ESTATE INVESTMENT CORPORATION(8952)
17
hedging against currency exchange fluctuation risks. Deferred hedge accounting is generally used for such interest-rate swaps and currency swap transactions, and the effectiveness of hedging is measured by comparing the total cash flow fluctuation of the hedged item and that of the hedging instrument since the inception of the hedge.
For interest-rate swaps and currency swaps that qualify for hedge accounting and meet certain criteria provided under Japanese GAAP, however, the Company applies special accounting treatment. Under such special accounting treatment, the differentials paid or received under the swap agreements are recognized and included in interest expense of the hedged loans, and the interest-rate swaps and currency swaps are not required to be separately valued. For interest-rate swaps and currency swaps that meet the specific criteria for such special accounting treatment, ongoing assessments of hedge effectiveness are not required and hence not performed.

JAPAN REAL ESTATE INVESTMENT CORPORATION(8952)
18
(8) Notes to Financial Statements
(Notes to Balance Sheets)
a. Commitment line agreement
The Company has signed commitment line agreements with three banks.
Thousands of yen
As of September 30, 2018 As of March 31, 2019
Total amount of commitment line agreement 60,000,000 60,000,000
Debt financing balance - -
Balance 60,000,000 60,000,000
b. Minimum net assets required by Article 67, Paragraph 4 of the ITA
Thousands of yen As of September 30, 2018 As of March 31, 2019
50,000 50,000
(Notes to Statements of Income)
a. Breakdown of property-related revenues and expenses
Thousands of yen
For the period from April 1, 2018 to September 30, 2018
For the period from October 1, 2018 to March 31, 2019
Property-Related Revenues 32,795,582 33,022,445Rent revenues 32,676,423 32,783,783
Rental revenues 26,061,390 26,261,656Common service charges 3,068,163 2,965,802Parking revenues 774,438 768,945Other rental revenues 2,772,431 2,787,379
Other lease business revenues 119,158 238,662Cancellation charges 48,854 159,038Other miscellaneous revenues 70,304 79,623
Property-Related Expenses 16,843,215 16,819,683
Expenses related to lease business 16,843,215 16,819,683Property management expenses 3,518,291 3,691,389Utilities expenses 2,676,997 2,493,875Property and other taxes 3,026,949 3,021,982Casualty insurance 53,645 50,421Repairing expenses 933,693 979,805Depreciation 6,449,268 6,400,633Other rental expenses 184,369 181,576
Property-Related Profits 15,952,366 16,202,762
b. Breakdown of gain on sales of real estate properties
For the period from April 1, 2018 to September 30, 2018
Thousands of yen Lit City Building
Revenue from sale of real estate property 650,000 Cost of real estate property sold 370,182 Other sales expenses 8,945
Gain on sales of real estate properties 270,871
For the period from October 1, 2018 to March 31, 2019
“Not applicable”

JAPAN REAL ESTATE INVESTMENT CORPORATION(8952)
19
(Changes in Unitholders’ Equity)
Total number of investment units issuable
and number of units outstanding As of September 30, 2018 As of March 31, 2019
Total number of investment units issuable 4,000,000 units 4,000,000 units
Number of units outstanding 1,385,210 units 1,385,210 units
(Supplemental Cash Flow Information)
Cash and cash equivalents The following table represents a reconciliation of cash and cash equivalents at September 30, 2018 and March 31, 2019:
Thousands of yen
As of September 30, 2018 As of March 31, 2019
Cash and deposits 17,835,899 18,333,626Cash and deposits in trust 6,731,684 6,049,324Time deposits with maturities of more than three months - -
Cash and cash equivalents 24,567,583 24,382,950
(Financial Instruments) a. Status of financial instruments (i) Policies for dealing financial instruments
Concerning the financing of property acquisitions, the Company shall use several funding sources including bank loans, the issuance of investment corporation bonds and the issuance of investment units. When executing such financing activities, the Company endeavors to retain the ability to secure stable and low-cost financing by maintaining high credit ratings and thereby limiting the financial covenants that may restrict the financial flexibility of the Company. To achieve these goals, the Company intends to further develop and reinforce the confidence of debt holders and rating agencies in the Company by bolstering the capital base and controlling the loan-to-value ratio (“LTV”) at an adequate level.
In order to hedge against future interest-rate fluctuations, the Company may enter into derivative transactions, which shall be executed solely for the purpose of hedging against interest-rate fluctuation and other risks, and not for speculative purposes.
With respect to management of excess funds, as a matter of policy the Company uses time deposits as its main vehicle, while securities and monetary claims are also eligible for such investment.
(ii) Characteristics and risk profile of each financial instrument and risk management system
The Company regularly re-evaluates the appropriateness and effectiveness of its risk management system in order to improve on it. The characteristics and risk profile of financial instruments and the system in place to manage such risks are as follows: The deposits, which are typically large time deposits used to manage excess funds, are exposed to the credit risk of the deposit-taking financial institutions. The Company manages credit risk by restricting the tenor of the deposit to relatively short periods and setting a minimum credit rating requirement for the deposit-taking financial institutions.
The funding proceeds from borrowings and issues of investment corporation bonds are applied mainly to acquire real estate properties and repay outstanding loans and bonds. While floating-rate short-term and long-term loans are exposed to the risk of interest-rate hikes, such risk is mitigated by the Company’s low LTV and relatively high percentage of long-term fixed-rate debts within the total borrowing. The Company may also exercise hedging by means of derivative transactions (interest-rate swap transactions) in order to mitigate the risk of fluctuation concerning the floating-rate long-term loans, thereby effectively stabilizing the overall interest rates on the loans. Foreign currency-denominated loans are also exposed to currency exchange and interest-rate fluctuation risk. However, the Company uses derivative transactions as a method of hedging against these risks (interest-rate and currency swap transactions). Foreign currency investment corporation bonds are also exposed to currency exchange risk. However, the Company uses derivative transactions as a method of hedging against the risks (currency swap transactions). For more detailed information on the hedge accounting method, please refer to the previous section “(7) Summary of Significant Accounting Policies: Hedge accounting”.
Loans and investment corporation bonds involve liquidity risk at the time of maturity. To manage such liquidity risk, the Company implements measures such as ① maintaining and strengthening its ability to access equity markets to secure funds, ② maintaining commitment lines with major financial institutions (There is no amount outstanding under the facility as of September 30, 2018 and March 31, 2019) and ③ preparing monthly financial plans.
(iii) Supplementary note regarding fair value of financial instruments
The fair values of financial instruments presented in this report are based on their market value, and in cases where market values are not available, reasonably calculated values are presented. Since calculation of fair value is based on certain assumptions, the fair value could differ depending on the assumptions used. In addition, the contract value of derivative transactions, which is presented in the following section entitled “Derivative Transactions”, is not an exact representation of market risk attributable to derivative transactions.

JAPAN REAL ESTATE INVESTMENT CORPORATION(8952)
20
b. Fair value of financial instruments Fair value of financial instruments, their values carried on the balance sheets and the differences between them as of September 30, 2018 and March 31, 2019 are as follows.
The financial instruments whose fair values are extremely difficult to estimate are excluded from the following schedule (Note 2):
Thousands of yen
As of September 30, 2018
Book value * Fair value * Difference * (1) Cash and deposits 17,835,899 17,835,899 -
(2) Cash and deposits in trust 6,731,684 6,731,684 -
(3) Short-term loans (21,500,000) (21,500,000) -
(4) Current portion of long-term loans (25,000,000) (25,072,838) (72,838)(5) Investment corporation bonds (22,993,175) (24,282,380) (1,289,205)(6) Long-term loans (315,000,000) (317,364,017) (2,364,017)(7) Derivative transactions - - -
* Liabilities are shown in parentheses. Thousands of yen
As of March 31, 2019
Book value * Fair value * Difference * (1) Cash and deposits 18,333,626 18,333,626 -
(2) Cash and deposits in trust 6,049,324 6,049,324 -
(3) Short-term loans (8,500,000) (8,500,000) -
(4) Current portion of long-term loans (49,000,000) (49,196,138) (196,138)(5) Investment corporation bonds (32,993,175) (34,636,903) (1,643,728)(6) Long-term loans (299,500,000) (303,623,135) (4,123,135)(7) Derivative transactions - - -
* Liabilities are shown in parentheses.
Notes: 1. Measurement of fair value of financial instruments and matters concerning derivative transactions (1) Cash and deposits and (2) Cash and deposits in trust
Due to short tenor, the book values of these assets are reasonable approximations of the present value of these assets and hence used as their fair value.
(3) Short-term loans Since these loans’ tenor is short and rates are reset at a short interval, the book values of these liabilities are reasonable approximations of their present value and hence used as their fair values.
(4) Current portion of long-term loans and (6) Long-term loans For loans with floating interest rates, since the interest rates on such loans reflect market rates reasonably well over the short term and their book values are good approximations of their fair values, the book values are presented as their fair values. (However, the fair values of floating-rate long-term loans (please refer to the following “Derivative Transactions, b. Derivatives designated as hedging instruments”) hedged by an interest-rate and currency swap subject to integrated treatment or by an interest-rate swap subject to special accounting treatment are calculated by discounting the aggregated principal and interest on such loans using reasonable estimates of the rates that would be applicable if the Company were to refinance the existing loans for the remaining period to maturity under the prevailing market condition. ) The fair values of long-term loans with fixed interest rates are calculated by discounting the aggregated amounts of the principal and the interest of the loans by the rates that are reasonably estimated to be applicable if the Company were to refinance the existing loans for the remaining period to maturity.
(5) Investment corporation bonds Their fair values are based on reference prices published by a financial data provider where available. When reference prices are not available, their fair values are calculated by discounting the aggregate of the principal and interest by nominal rates assumed applicable if the loans were refinanced for the duration of the current maturity. (However, the fair values of investment corporation bonds (please refer to the following “Derivative Transactions, b. Derivatives designated as hedging instruments”) hedged by a currency swap subject to allocation treatment are calculated by discounting the aggregate of the principal and interest integrated with the currency swap by nominal rates assumed applicable if the loans were refinanced for the duration of the current maturity.)
(7) Derivative transactions Please refer to the following section entitled “Derivative Transactions”.
2. Financial instruments whose fair values cannot be reliably measured
Thousands of yen As of September 30, 2018 As of March 31, 2019 (1) Non-listed stock *1 577,168 577,168(2) Deposits received from tenants *2 52,853,494 53,863,645
*1.With regard to non-listed stock, which does not have a quoted market price in an active market and whose cash flows are not
reasonably estimated, fair value cannot be reliably measured and it is therefore presented at book value. *2. With regard to deposits received from tenants, which do not have a quoted market price in an active market and reasonably estimated
tenor, their cash flows cannot be reliably measured and they are therefore presented at their book value.

JAPAN REAL ESTATE INVESTMENT CORPORATION(8952)
21
3. Redemption schedule for monetary claims after the closing date
Thousands of yen As of September 30, 2018
1 year or less 1 to 2 years 2 to 3 years 3 to 4 years 4 to 5 years Over 5 years Cash and deposits 17,835,899 — — — — —Cash and deposits in trust 6,731,684 — — — — —Total 24,567,583 — — — — —
Thousands of yen As of March 31, 2019 1 year or less 1 to 2 years 2 to 3 years 3 to 4 years 4 to 5 years Over 5 years
Cash and deposits 18,333,626 — — — — —Cash and deposits in trust 6,049,324 — — — — —Total 24,382,950 — — — — —
4. Repayment schedule for investment corporation bonds, long-term loans and other interest-bearing debt after the closing date
Thousands of yen As of September 30, 2018
1 year or less 1 to 2 years 2 to 3 years 3 to 4 years 4 to 5 years Over 5 years Short-term loans 21,500,000 — — — — —Investment corporation bonds — — — — — 22,993,175Long-term loans 25,000,000 46,500,000 52,200,000 51,000,000 42,500,000 122,800,000Total 46,500,000 46,500,000 52,200,000 51,000,000 42,500,000 145,793,175
Thousands of yen As of March 31, 2019
1 year or less 1 to 2 years 2 to 3 years 3 to 4 years 4 to 5 years Over 5 years Short-term loans 8,500,000 — — — — —Investment corporation bonds — — — — 10,000,000 22,993,175Long-term loans 49,000,000 41,000,000 51,700,000 48,500,000 39,500,000 118,800,000Total 57,500,000 41,000,000 51,700,000 48,500,000 49,500,000 141,793,175

JAPAN REAL ESTATE INVESTMENT CORPORATION(8952)
22
(Derivative Transactions)
a. Derivatives not designated as hedging instruments
As of September 30, 2018
“Not applicable”
As of March 31, 2019
“Not applicable”
b. Derivatives designated as hedging instruments
As of September 30, 2018
The contract amount or the equivalent principal amount set out in the contract as of the closing date for each derivative
designated as a hedging instrument is as follows: (Thousands of yen)
Derivative accounting method
Type of derivative transaction
Hedged item Contract value
Fair value Measurement of fair value Over one year
Special Treatment for interest-rate swap
Receive floating, pay fixed interest-rate swap transactions
Long-term loans 64,300,000 63,300,000 *1 ―
Integrated Treatment (Special Treatment and Allocation Treatment) for interest-rate and currency swap
Receive floating USD, pay fixed JPY, interest-rate and currency swap transactions (with initial and final exchange)
Long-term loans 10,000,000 10,000,000 *1 ―
Allocation Treatment for currency swap
Receive fixed USD, pay fixed JPY, currency swap transactions (with initial and final exchange)
Investment corporation bonds
2,993,175 2,993,175 *2 ―
As of March 31, 2019
The contract amount or the equivalent principal amount set out in the contract as of the closing date for each derivative
designated as a hedging instrument is as follows: (Thousands of yen)
Derivative accounting method
Type of derivative transaction
Hedged item Contract value
Fair value Measurement of fair value Over one year
Special Treatment for interest-rate swap
Receive floating, pay fixed interest-rate swap transactions
Long-term loans 63,300,000 57,300,000 *1 ―
Integrated Treatment (Special Treatment and Allocation Treatment) for interest-rate and currency swap
Receive floating USD, pay fixed JPY, interest-rate and currency swap transactions (with initial and final exchange)
Long-term loans 10,000,000 10,000,000 *1 ―
Allocation Treatment for currency swap
Receive fixed USD, pay fixed JPY, currency swap transactions (with initial and final exchange)
Investment corporation bonds
2,993,175 2,993,175 *2 ―
*1. The derivative transactions eligible for Special Treatment for interest-rate swap and Integrated Treatment (Special Treatment for interest-rate
swap and Allocation Treatment for currency swap) are accounted for as integral parts of the hedged loans, and the fair value of those derivative transactions is included in that of the underlying long-term loans as of September 30, 2018 and March 31, 2019. Please refer to the measurement of fair value of financial instruments in Note 1 of the section entitled “b. Fair value of financial instruments” under “Financial Instruments” as well as subheadings (4) and (6) of Note 1 concerning derivative transactions.
*2. Currency swap transactions eligible for allocation treatment are accounted for as integrated parts of the hedged investment corporation bonds, and the fair value of the currency swap transactions is included in that of the underlying investment bonds as of September 30, 2018 and March 31, 2019. Please refer to the measurement of fair value of financial instruments in Note 1 of the section entitled “b. Fair value of financial instruments” under “Financial Instruments” as well as subheadings (5) of Note 1 concerning derivative transactions.

JAPAN REAL ESTATE INVESTMENT CORPORATION(8952)
23
(Income Taxes) The Company is subject to Japanese corporate income taxes on all of its taxable income. However, under the Special Taxation Measures Act, an investment corporation is allowed to deduct dividends of accounting profits, or dividend distributions, paid to unitholders from its taxable income if certain tax requirements are satisfied. Such tax requirements include dividend distributions in excess of 90% of its earnings available for dividends for the fiscal period as stipulated by Article 67-15 of the Special Taxation Measures Act. The significant components of deferred tax assets and liabilities as of September 30, 2018 and March 31, 2019 were as follows:
Thousands of yen As of September 30, 2018 As of March 31, 2019
Deferred tax assets: Accrued enterprise tax 934 952Amortization of a term leasehold interest 83,983 89,460Asset retirement obligations 118,348 119,540
203,266 209,953Valuation allowance (100,846) (107,516)Total deferred tax assets 102,419 102,437
Deferred tax liabilities: Asset retirement obligations 101,484 101,484Reserve for advanced depreciation of non-current assets 291,168 290,057Total deferred tax liabilities 392,653 391,542
Net deferred tax liabilities 290,234 289,105 The reconciliation of tax rate difference between the adjusted statutory tax rate and the effective tax rate as of September 30, 2018 and March 31, 2019 was as follows:
As of September 30, 2018 As of March 31, 2019
Statutory tax rate 34.59% 34.59% Deductible dividend distribution (34.08%) (34.57%) Change in valuation allowance 0.05% 0.05% Others 0.00% 0.01% Effective tax rate 0.56% 0.08%
(Asset Retirement Obligations)
For the six months ended September 30, 2018 and March 31, 2019 Asset retirement obligations reported on balance sheets The Company acquired Osaki Front Tower on February 1, 2011 under the term leasehold for business use agreement which, at the expiry of the leasehold, obligates the Company to restore the leased land to its original state. At the inception of a lease with such an obligation, the Company recognized an asset retirement obligation and a corresponding capital asset in an amount equal to the present value of the estimated demolition cost required for the removal of the properties located on the leased land. The present value is calculated using 2.015% as the discount rate over 42 years, which is the term of the leasehold. Change in the asset retirement obligations for the six months ended September 30, 2018 and March 31, 2019 consisted of the following: Thousands of yen For the period from April 1, 2018
to September 30, 2018 For the period from October 1, 2018
to March 31, 2019 Balance at the beginning of the period 338,635 342,047Increase in tangible fixed assets - -Accretion expense 3,411 3,446Balance at the end of the period 342,047 345,493

JAPAN REAL ESTATE INVESTMENT CORPORATION(8952)
24
(Investment and Rental Property) For the six months ended September 30, 2018 and March 31, 2019
The Company owns primarily a portfolio of office properties in Tokyo and other prefectures in order to gain rental revenue from them.
The book values on balance sheets as of September 30, 2018 and March 31, 2019 and the fair values as of September 30, 2018 and March 31, 2019 are as follows:
Thousands of yen
Book value Fair value As of March 31, 2018 Change during the period *1 As of September 30, 2018 As of September 30, 2018
907,577,798 20,331,006 927,908,805 1,158,140,000
Thousands of yen Book value Fair value
As of September 30, 2018 Change during the period *2 As of March 31, 2019 As of March 31, 2019 927,908,805 7,148,915 935,057,721 1,178,420,000
Notes: 1. Book value on balance sheets means the acquisition cost less accumulated depreciation. 2. Significant changes
*1. As for the increases/decreases for the period, the major reason for the increase was the acquisition of Shinjuku Front Tower (¥25,270,812 thousand), and the decreases were accounted for by disposition of Lit City Building (retail units) (¥370,182 thousand) and by depreciation.
*2. As for the increases/decreases for the period, the major reason for the increases was the acquisition of Front Place Minami-Shinjuku (¥9,358,058 thousand), and Daido Seimei Niigata Building (¥1,856,065 thousand). The major reason for decreases was by depreciation.
3. Fair values as of September 30, 2018 and March 31, 2019 are defined as the appraised values provided by an external qualified professional appraiser.
Profits and losses related to investment and rental property are listed in the “a. Breakdown of property-related revenues and expenses” under “Notes to Statements of Income”.
(Segment Information)
For the six months ended September 30, 2018 and March 31, 2019 Since the Company has been engaged in the real estate leasing business using a single segment, segment information has been omitted. Information on products and services Since revenues from external customers for a single segment accounted for more than 90% of total operating revenues, segment information on products and services has been omitted. Information on geographic area a. Revenue
Since 100% of total operating revenues was generated from external customers within Japan, a geographical breakdown of revenues has been omitted.
b. Property and equipment Since 100% of total property and equipment on the balance sheets was located within Japan, a geographical breakdown of such property and equipment has been omitted.
Information on major clients Since no single external client represents 10% or more of the Company’s total operating revenues, information on major clients has been omitted.
JAPAN REAL ESTATE INVESTMENT CORPORATION(8952)
25
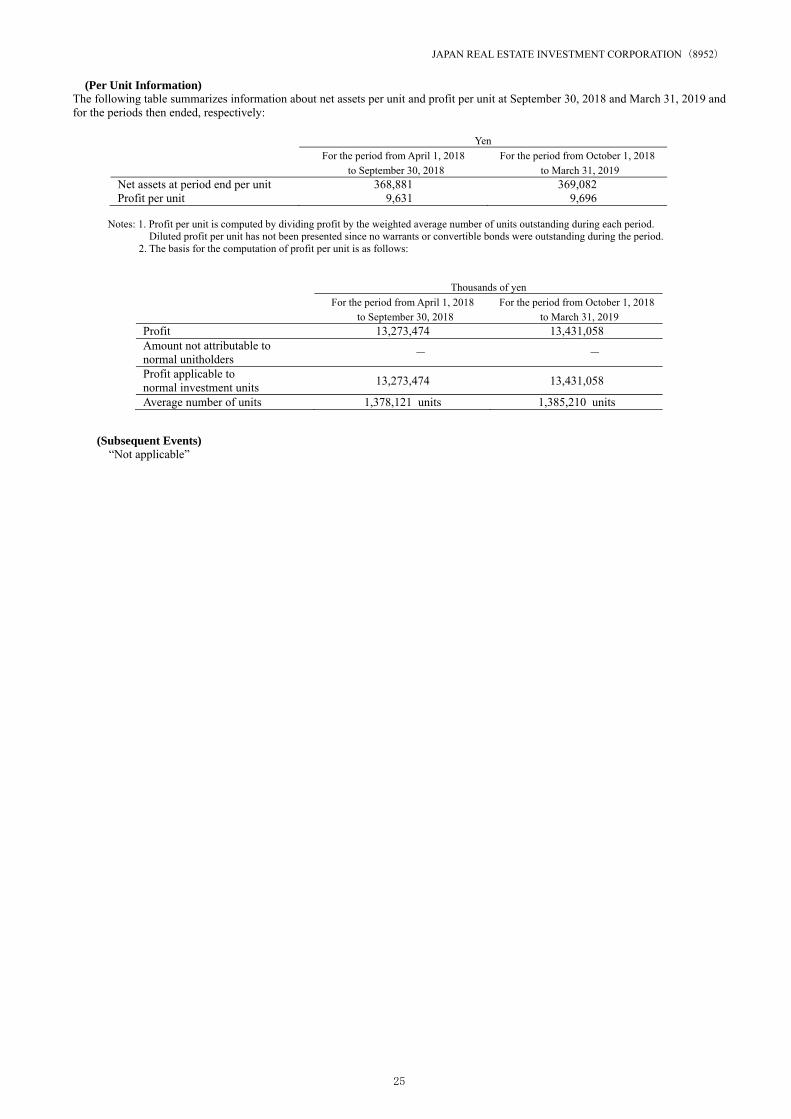
(Per Unit Information) The following table summarizes information about net assets per unit and profit per unit at September 30, 2018 and March 31, 2019 and for the periods then ended, respectively:
Yen For the period from April 1, 2018
to September 30, 2018 For the period from October 1, 2018
to March 31, 2019 Net assets at period end per unit 368,881 369,082 Profit per unit 9,631 9,696
Notes: 1. Profit per unit is computed by dividing profit by the weighted average number of units outstanding during each period.
Diluted profit per unit has not been presented since no warrants or convertible bonds were outstanding during the period. 2. The basis for the computation of profit per unit is as follows:
(Subsequent Events) “Not applicable”
Thousands of yen For the period from April 1, 2018
to September 30, 2018 For the period from October 1, 2018
to March 31, 2019 Profit 13,273,474 13,431,058 Amount not attributable to normal unitholders - -
Profit applicable to normal investment units
13,273,474 13,431,058
Average number of units 1,378,121 units 1,385,210 units

JAPAN REAL ESTATE INVESTMENT CORPORATION(8952)
26
(9) Increase/Decrease in Total Number of Units Outstanding The Company procured the funds of approximately 39.2 billion yen by issuing the new investment units of public offering (69,000
units) and third-party allocation (6,900 units) in April and May 2018. Changes in the past five years are as follows.
Date Remarks Number of Units Outstanding
Total Unitholders’ Capital (Millions of yen)
Notes Increase/Decrease Balance Increase/Decrease Balance
April 15, 2014 Issuance of new investment
units (public offering) 57,500 1,245,780 27,968 423,986 *1
May 14, 2014 Issuance of new investment
units (third-party allocation) 5,750 1,251,530 2,796 426,783 *2
April 6, 2015 Issuance of new investment
units (public offering) 54,000 1,305,530 29,189 455,972 *3
May 11, 2015 Issuance of new investment
units (third-party allocation) 3,780 1,309,310 2,043 458,016 *4
April 16, 2018 Issuance of new investment
units (public offering) 69,000 1,378,310 35,659 493,675 *5
May 9, 2018 Issuance of new investment
units (third-party allocation) 6,900 1,385,210 3,565 497,241 *6
*1. New investment units were issued at 501,760 yen per unit (underwriting price of 486,400 yen), for the purpose of assigning funds to repayment of loans.
*2. New investment units were issued at 486,400 yen per unit, for the purpose of compensating decreases in cash reserves assigned to repayment of loans.
*3. New investment units were issued at 557,620 yen per unit (underwriting price of 540,550 yen) for the purpose of funding the partial repayment of short-term loans, the redemption of investment corporation bonds, the acquisition of specified assets, and, in the event there are any funds remaining, cash reserves.
*4. New investment units were issued at 540,550 yen per unit for the purpose of funding the partial repayment of short-term loans and, in the event there are any funds remaining, cash reserves.
*5. New investment units were issued at 533,120 yen per unit (underwriting price of 516,800 yen) for the purpose of funding the acquisition of specified assets and the partial repayment of short-term loans, and in the event there are any funds remaining, cash reserves.
*6. New investment units were issued at 516,800 yen per unit for the purpose of funding the partial repayment of short-term loans and, in the event there are any funds remaining, cash reserves.

JAPAN REAL ESTATE INVESTMENT CORPORATION(8952)
27
4. Changes in Officers Change in officers shall be disclosed in a timely manner once the decision is made.
5. Reference Data
a. Composition of the Company’s Assets
Asset type Region
As of September 30, 2018 As of March 31, 2019
Total of net book value*1
(¥ million)
Ratio to total assets
(%)
Total of net book value*1
(¥ million)
Ratio to total assets
(%)
Real property
Tokyo 23 wards 496,027 51.9 502,915 52.2
Tokyo metropolitan area
(excluding Tokyo 23 wards)*2 42,584 4.5 42,230 4.4
Other major cities 81,376 8.5 82,691 8.6
Total 619,988 64.8 627,837 65.2
Real property
in trust
Tokyo 23 wards 214,790 22.5 214,117 22.2
Tokyo metropolitan area
(excluding Tokyo 23 wards)*2 19,137 2.0 19,211 2.0
Other major cities 73,992 7.7 73,890 7.7
Total 307,920 32.2 307,219 31.9
Savings and other assets 28,736 3.0 28,618 3.0
(-) (-) (-) (-)
Total amount of assets 956,645 100.0 963,676 100.0
(927,908) (97.0) (935,057) (97.0)
*1. Totals of net book value as of September 30, 2018 and March 31, 2019 are based on the total amounts from the balance sheets as of September 30, 2018 and March 31, 2019, respectively. Real property and real property in trust present the net book values after depreciation and amortization.
*2. Tokyo metropolitan area encompasses the prefectures of Tokyo, Kanagawa, Chiba and Saitama throughout this document. *3. The figures in parentheses indicate the value of real property held. Ratios are rounded to the first decimal place.

JAPAN REAL ESTATE INVESTMENT CORPORATION(8952)
28
b. Real Estate Investment Property and Trust Beneficiary Rights in Trust of Real Estate
i) Outline of real estate and other assets included in the Company's holdings (quick reference guide)
The table below is a quick reference guide outlining the real estate and other assets included in the Company’s holdings as of
March 31, 2019.
Region
Nam
e of
property
Type of
specified asset
Num
ber of
tenants*1
Leasable floor
area (m2)
Occupancy rate*
2
Appraisal value at the end
of period (¥ mil)*
3
Book value at the
end of period (¥ mil)
Acquisition price*4
Ratio by
region*2
(¥ thousand) Ratio
*2
Tokyo m
etropolitan area
Tokyo 23
wards
Kitanomaru
Square
Real
property
5
*5
25,678
*5
100.0%
*5 85,200 71,270 81,555,500 8.0%
76.7%
MD Kanda
Building
Real
property 9 6,269 100.0% 8,420 8,656 9,520,000 0.9%
Kandabashi
Park Building
Real
property 10 3,687 100.0% 4,710 4,445 4,810,000 0.5%
Otemachi
Financial City
North Tower
Real
property 2 5,121 100.0% 20,100 14,850 15,462,900 1.5%
Nibancho
Garden
Real
property
1
*5
9,316
*5
100.0%
*5 19,100 12,238 14,700,000 1.4%
Mitsubishi
UFJ Trust and
Banking
Building
Real
property 10 11,904 100.0% 55,600 28,720 44,700,000 4.4%
Burex
Kojimachi
Building
Real
property 1 4,495 100.0% 7,520 5,457 7,000,000 0.7%
Sanno Grand
Building
Real
property 46 20,535 97.3% 33,200 21,249
10,200,000
10,700,000
Total:
20,900,000
2.0%
Yurakucho
Denki
Building
Real
property 11 4,697 100.0% 8,680 7,677 7,200,000 0.7%
Kodenmacho
Shin
Nihonbashi
Building
Trust 10 3,897 100.0% 2,960 2,734 3,173,000 0.3%
Front Place
Nihonbashi
Real
property 2 8,468 100.0%
19,300
*6 17,702 17,560,000 1.7%
Kyodo
Building
(Kayabacho
2Chome)
Trust 9 4,464 93.2% 5,060 4,152 4,410,000 0.4%
Burex
Kyobashi
Building
Real
property 1 4,279 100.0% 7,740 4,387 5,250,000 0.5%
Ginza
1Chome East
Building
Trust 8 4,513 100.0% 7,790 6,242 6,459,000 0.6%

JAPAN REAL ESTATE INVESTMENT CORPORATION(8952)
29
Region
Nam
e of property
Type of
specified asset
Num
ber of tenants*
1
Leasable floor area (m
2)
Occupancy rate*
2
Appraisal value at the end of
period (¥ mil)*
3
Book value at
the end of period
(¥ mil)
Acquisition price*4 Ratio by
region*2
(¥ thousand) Ratio
*2
Tokyo m
etropolitan area
Tokyo 23 wards
Ginza Sanwa
Building
Real
property 11 4,326 100.0% 18,700 17,161 16,830,000 1.6%
76.7%
Ryoshin Ginza East Mirror
Building
Real property
11 4,255 100.0% 6,550 7,359
5,353,500 2,645,922
*7 Total:
7,999,422
0.8%
Harumi Front Real
property 8 33,369 100.0%
40,700*8 27,377 31,300,000 3.1%
Harumi Center Building
Real property
13 20,812 100.0% 20,400 21,818 26,800,000 2.6%
Akasaka Park Building
Real property
29*5
44,999*5
100.0%*5 76,700 59,154 60,800,000 5.9%
Aoyama Crystal Building
Real property
8 4,898 100.0% 9,240 7,036 7,680,000 0.7%
Clover Shiba-koen
Trust 9 2,550 100.0%4,850
*6 4,491 4,500,000 0.4%
Shiodome Building
Trust 37 44,213 100.0% 122,000 101,678
21,250,000 54,600,000 10,100,000 10,450,000 10,530,000
Total: 106,930,000
10.4%
Shiba 2Chome Daimon Building
Trust 23 9,606 100.0% 7,300 5,311 4,859,000 0.5%
Cosmo Kanasugibashi
Building Trust 8 4,062 100.0% 3,430 2,518 2,808,000 0.3%
Tamachi Front Building
Real property
8 3,792 100.0%6,920
*6 6,178 6,210,000 0.6%
Shinjuku Eastside Square
Trust 40 36,262 94.4%62,500
*6 52,281
23,100,000 6,660,000
25,460,000 Total:
55,220,000
5.4%
Shinjuku Front Tower
Trust 45 15,705 100.0%26,500
*6 24,991 25,025,000 2.4%
Shinwa Building
Real property
13 5,997 100.0% 8,370 7,799 7,830,000 0.8%
Tokyo Opera City Building*9
Real property
99 34,951 99.6% 36,200 27,984
9,350,000 22,426,831
Total: 31,776,831
3.1%
Front Place Minami- Shinjuku
Real property
2 4,095 100.0%9,420
*6 9,342 9,250,000 0.9%
Shinjuku South Gate Project
(tentative name)(Land)
Real property
*10 *10 *10 5,500 5,572
6,670,000 (1,170,000)
*11 Total:
5,500,000
0.5%
Yoyogi 1 Chome Building
Real Property
8 7,745 100.0% 12,600 6,821 8,700,000 0.8%

JAPAN REAL ESTATE INVESTMENT CORPORATION(8952)
30
Region
Nam
e of property
Type of
specified asset
Num
ber of tenants*1
Leasable floor
area (m
2)
Occupancy rate*
2
Appraisal value at the
end of period (¥ m
il)*3
Book value at the
end of period (¥ mil)
Acquisition price*4 Ratio by
region*2
(¥ thousand)
Ratio by Ratio
*2
Tokyo m
etropolitan area
Tokyo 23
wards
Jingumae Terrace
Real property
6 3,147 100.0% 7,300 4,868 4,885,000 0.5%
76.7%
Jingumae Media Square Building
Real property
5 5,558 100.0% 10,700 10,642 12,200,000
*12 1.2%
Shibuya Cross Tower (Land)
Real property
*13 *13 *13 39,200 27,186
34,600,000 (8,076,000)
*14 Total:
26,524,000
2.6%
Ebisu Neonato Real
property 5 8,659 100.0% 18,800 13,973
3,740,000 360,000
10,512,000 Total:
14,612,000
1.4%
TIXTOWER UENO
Real property
17 15,016 100.0% 25,900 19,143 22,000,000 2.1%
Higashi Gotanda 1Chome Building
Real property
5 5,205 100.0% 6,730 4,342 5,500,000 0.5%
Osaki Front Tower*15
Real property
1 16,856 100.0%17,200
*8 8,613 12,300,000 1.2%
Omori-Eki Higashiguchi
Building Trust 26 7,706 100.0% 6,010 4,773 5,123,000 0.5%
Harmony TowerReal
property 22 14,340 100.0% 14,600 9,839
8,500,000 520,000
2,100,000 Total:
11,120,000
1.1%
Otsuka Higashi Ikebukuro Building
Trust 5 7,253 100.0% 4,710 3,388 3,541,000 0.3%
Ikebukuro 2Chome Building
Trust 9 2,186 100.0% 1,830 1,554 1,728,000 0.2%
Ikebukuro YS Building
Real property
9 5,932 100.0% 5,500 4,043 4,500,000 0.4%
Tokyo metro- politan area,
exclud- ing
Tokyo 23
wards
Hachioji First Square
Real property
48 10,068 100.0% 5,060 4,854
3,300,000 2,379,112
Total: 5,679,112
0.6%
6.8%
Saitama Urawa Building
Real property
19 4,510 100.0% 2,640 2,460
1,232,000 1,342,000
Total: 2,574,000
0.3%
MM Park Building
Real property
36 38,426 100.0% 40,400 31,152 37,400,000 3.6%
Queen’s Tower A Trust 50 26,669 99.7%22,100
*6 16,341 17,200,000 1.7%
Kawasaki Isago Building
Trust 14 6,831 100.0% 3,200 2,870 3,375,000 0.3%
Musashi Kosugi STM Building
Real property
27 5,378 100.0% 4,580 3,764 4,000,000 0.4%

JAPAN REAL ESTATE INVESTMENT CORPORATION(8952)
31
Region
Nam
e of property
Type of
specified asset
Num
ber of tenants*
1
Leasable floor area (m
2)
Occupancy rate*
2
Appraisal value at the end of
period (¥ mil)*
3
Book value at
the end of period (¥ m
il)
Acquisition price*4 Ratio by
region*2
(¥ thousand) Ratio
*2
Other m
ajor cities
8・3 Square Kita Building
Real property
8 12,265 100.0% 9,530 5,756 7,100,000 0.7%
16.4%
Jozenji Park Building Real
property 17 2,518 100.0% 1,030 982 1,000,000 0.1%
Higashi Nibancho Square
Real property
21 20,526 97.4%14,100
*8 8,762 9,950,000 1.0%
Sendai Honcho Honma Building
Trust 28 6,234 100.0% 2,640 2,839
2,924,000 250,000
Total: 3,174,000
0.3%
AER Real
property 65 23,612 100.0% 20,200 18,197 18,640,000 1.8%
Daido Seimei Niigata Building
Real property
9 3,928 94.7% 1,860 1,849 1,770,000 0.2%
Kanazawa Park Building Real
property 85 20,942 99.6% 6,040 4,437
2,880,000 1,700,000
Total: 4,580,000
0.4%
Kanazawa Kamitsutsumicho
Building
Real property
27 7,206 96.9% 3,140 2,584 2,780,000 0.3%
Nishiki Park Building*16 Real
property 64*5
10,338*5
100.0%*5 5,190 5,071
3,850,000 1,300,000
650,000 175,000
Total: 5,975,000
0.6%
Nagoya Hirokoji Place Trust 34 13,200 100.0%12,500
*6 7,890 8,567,000 0.8%
Nagoya Hirokoji Building
Real property
38 21,401 99.8% 13,100 15,406 14,533,000 1.4%
Nagoya Misono Building
Real property
17 3,448 100.0% 1,470 1,455 1,865,000 0.2%
Shijo Karasuma Center Building
Real property
13 6,634 100.0%5,980
*6 3,839 4,400,000 0.4%
Umeda Square Building*17
Trust 42 10,374 100.0% 17,000 15,782 15,523,520 1.5%
Shin Fujita Building Trust 50 28,403 100.0% 19,700 21,679 24,000,000 2.3%
Sakaisujihonmachi Building
Real property
23 11,520 98.2% 3,580 3,621
2,264,000 1,900,000
Total: 4,164,000
0.4%

JAPAN REAL ESTATE INVESTMENT CORPORATION(8952)
32
Region
Nam
e of property
Type of
specified asset
Num
ber of tenants*
1
Leasable floor area (m
2)
Occupancy rate*
2
Appraisal value at the end of
period (¥ mil)*
3
Book value at
the end of period (¥ m
il)
Acquisition price*4 Ratio by
region*2
(¥ thousand) Ratio
*2
Other m
ajor cities
Midosuji Daiwa Building
Trust 40 20,450 99.1% 14,900 13,789
6,934,000 7,380,000
Total: 14,314,000
1.4%
16.4%
Amagasaki Front Building
Trust 29 15,500 100.0% 10,100 8,527 9,300,000 0.9%
Lit City Building Real
property 27 8,906 100.0% 4,160 2,591
4,650,000 (555,131)
*18 Total:
4,094,868
0.4%
NHK Hiroshima Broadcasting Center
Building
Real property
12 9,860 100.0% 3,370 2,938
1,320,000 1,450,000
Total: 2,770,000
0.3%
Tosei Tenjin Building Real
property 23 3,995 100.0% 1,560 1,353 1,550,000 0.2%
Tenjin Crystal Building
Real property
31 5,964 100.0% 3,070 3,842 5,000,000 0.5%
Hinode Tenjin Building
Trust 2 5,944 100.0% 4,480 3,380 3,657,000 0.4%
Total 1,506 855,902 99.5% 1,178,420 935,057 1,025,687,154 100.0% *1. The total number of tenants is based on the gross number of tenants in each building. Each instance of occupancy of a single
tenant leasing space is considered separately on a per property basis even if said tenant leases floor area in multiple properties. *2. Occupancy rate, ratio of acquisition price and ratio by region are rounded to the nearest first decimal place. *3. Appraisal value at the end of period is, as a rule, the value assessed by real estate appraisers based on the Company's Articles of
Incorporation and the Cabinet Office Ordinance on Accountings of Investment Corporations. The book closing date is used as the appraisal date and the appraisal value is calculated by Daiwa Real Estate Appraisal Co., Ltd.
*4. Incidental expenses arising from acquisitions are not included in the acquisition price. *5. Residential portions are not included in the total number of tenants, the occupancy rate or the leasable floor area for Kitanomaru
Square, Nibancho Garden, Akasaka Park Building or Nishiki Park Building. The residential portions for these properties are as follows: Kitanomaru Square, leasable floor area: 11,694m2, occupancy rate: 98.8%; Nibancho Garden, leasable floor area: 1,686m2, occupancy rate: 100.0%; Akasaka Park Building, leasable floor area: 10,780m2, occupancy rate: 98.5%; Nishiki Park Building, leasable floor area: 954m2, occupancy rate: 95.1%.
*6. Appraisal values by Japan Real Estate Institute. *7. This includes the acquisition price of the land and building adjacent to Ryoshin Ginza East Mirror Building dated July 4, 2008,
the cost of the adjacent building’s demolition and the total expense of the construction and expansion of the Ryoshin Ginza East Mirror Building (excluding brokerage fees and other acquisition-related expenses) after its completion on May 24, 2010.
*8. Appraisal values by Chuo Real Estate Appraisal Co., Ltd. *9. Accompanying the acquisition of Tokyo Opera City Building on September 13, 2005, the Company acquired 33 shares of Tokyo
Opera City Building Co., Ltd. (the business that maintains, services and operates the building) at a total acquisition price of 2,797 thousand yen and inherited the 874 thousand yen deposit made to Tokyo Opera City Building Co., Ltd. by the seller. In an additional acquisition, on March 24, 2010, the Company acquired 91 shares of Tokyo Opera City Building Co., Ltd. at a total acquisition price of 7,539 thousand yen. Concurrently, the Company acquired 4,931 shares of Tokyo Opera City Heat Supply Co., Ltd. (the supplier of heat to the building) at a total acquisition price of 566,831 thousand yen, inheriting the 2,360 thousand yen deposit made to Tokyo Opera City Building Co., Ltd. by the seller.
Regarding the appraisal value at the end of the fiscal period of the above-mentioned shares, the 124 shares of Tokyo Opera City Building Co., Ltd. are valued at 10,336 thousand yen and the 4,931 shares of Tokyo Opera City Heat Supply Co., Ltd. are valued at 566,831 thousand yen.
*10. Because the building portion of Shinjuku South Gate Project (tentative name) (land with leasehold interest) was disposed on August 23, 2013, no total number of tenants, leasable floor area or occupancy rate are provided. Furthermore, the 1,497m2 portion of land still held is being rented to the transferee of the building, Mitsubishi Estate Co., Ltd.
*11. Because the building was disposed on August 23, 2013, the acquisition price of the building at the time of the land and building purchase dated March 24, 2004, has been deducted.
*12. This is the acquisition price dated October 9, 2003, and includes a portion of the site disposed on October 30, 2009 (cost of

JAPAN REAL ESTATE INVESTMENT CORPORATION(8952)
33
investment sold, 614 million yen). *13. Because the building portion of Shibuya Cross Tower (land with leasehold interest) was disposed on January 18, 2018, no total
number of tenants, leasable floor area or occupancy rate are provided. Furthermore, the 5,153 m2 portion of land still held is being rented to the transferee of the building, Mitsubishi Estate Co., Ltd.
*14. Because the building was disposed on January 18, 2018, the acquisition price of the building at the time of the land and building purchase dated November 30, 2001, has been deducted.
*15. On acquiring Osaki Front Tower, the Company inherited the land renter’s lease deposit of 1,040,000 thousand yen held by the seller of the building. The value of the lease deposit was appraised at the end of the fiscal period and remained unchanged.
*16. On acquiring Nishiki Park Building on October 2, 2006, the Company inherited the 9,000 thousand yen lease deposit made by the land renters held by the seller of the building.
*17. Trust assets of the trust beneficiary right acquired by the Company include a claim for 500,000 thousand yen of deposit for construction to connect to underground shopping centers given to Osaka Shigaichi Kaihatsu Co., Ltd., which was held by the previous owner.
*18. Because the retail units were disposed on September 28, 2018, the acquisition price of the retail units at the time of the land and building purchase dated February 1, 2006, has been deducted.
*19. In the above quick reference guide, if the real estate or other assets are classified as shared ownership or compartmental ownership, only the real estate or other assets owned by the Company are presented and the portions owned by the other shared owners or compartmental owners are excluded.

JAPAN REAL ESTATE INVESTMENT CORPORATION(8952)
34
ii) Breakdown of property-related revenues and expenses for real estate and other assets included in the Company's holdings
The table below is a quick reference guide outlining the revenues and expenses on each real estate and other asset for the
March 2019 period (October 1, 2018 – March 31, 2019). Furthermore, the income summary is presented based on the
previously mentioned “Summary of Significant Accounting Policies.” (Millions of Yen)
Name of property
Revenues / Expenses (October 1, 2018 – March 31, 2019)
Property-related
revenues
Property-related
expenses
Property-related profits ②
NOI ③(①+②)
Capital expend-itures④*2
NCF③-④
Property m
anagement
expenses
Utilities expenses
Property and other
taxes
Casualty insurance
Repairing expenses
Depreciation
①
Other expenses
Kitanomaru Square 1,734 759 137 73 96 1 35 414 - 975 1,389 57 1,332
MD Kanda Building 230 87 15 17 22 0 2 28 - 143 172 3 168
Kandabashi Park Building 120 40 1 - 17 0 2 18 - 79 98 9 88
Otemachi Financial City North Tower 352 183 32 17 47 0 0 85 - 168 254 - 254
Nibancho Garden 481 235 59 24 55 0 10 83 - 246 330 8 321
Mitsubishi UFJ Trust and Banking
Building 992 399 55 54 146 0 53 87 0 593 680 36 644
Burex Kojimachi Building 157 82 - - 14 0 4 62 - 75 138 - 138
Sanno Grand Building 972 442 102 55 114 1 87 81 - 530 611 79 532
Yurakucho Denki Building 264 133 35 20 44 0 7 25 - 131 156 36 120
Kodenmacho Shin Nihonbashi
Building 118 56 16 8 12 0 1 13 3 61 75 7 67
Front Place Nihonbashi 391 116 29 20 - 0 1 64 - 275 339 - 339
Kyodo Building (Kayabacho
2Chome) 133 62 13 10 12 0 4 22 - 70 92 5 86
Burex Kyobashi Building 157 38 - - 12 0 2 23 - 119 143 1 141
Ginza 1Chome East Building 184 96 15 8 11 0 4 56 - 88 145 - 145
Ginza Sanwa Building 401 140 26 17 71 0 1 23 0 260 284 2 282
Ryoshin Ginza East Mirror Building 160 85 15 12 15 0 1 39 - 75 114 13 101
Harumi Front 1,222 672 125 98 77 1 11 357 - 550 908 10 897
Harumi Center Building 586 375 69 41 48 0 3 210 - 211 421 9 412
Akasaka Park Building 2,377 1,220 223 249 275 3 58 409 - 1,156 1,566 70 1,495
Aoyama Crystal Building 204 91 19 11 31 0 7 20 0 112 133 0 132
Clover Shiba-koen 114 56 9 7 6 0 11 22 - 57 80 - 80
Shiodome Building 2,385 965 180 132 181 1 58 406 4 1,419 1,826 47 1,778
Shiba 2Chome Daimon Building 280 174 37 25 40 0 30 39 0 106 146 188 -42

JAPAN REAL ESTATE INVESTMENT CORPORATION(8952)
35
(Millions of Yen)
(Millions of Yen)
Name of property
Revenues / Expenses (October 1, 2018 – March 31, 2019)
Property-related
revenues
Property-related
expenses
Property-related profits ②
NOI ③(①+②)
Capital expend-itures④*2
NCF③-④
Property m
anagement
expenses
Utilities expenses
Property and other
taxes
Casualty insurance
Repairing expenses
Depreciation
①
Other expenses
Cosmo Kanasugibashi
Building 117 49 10 8 13 0 2 14 - 67 81 - 81
Tamachi Front Building 157 66 11 8 14 0 0 31 - 90 122 - 122
Shinjuku Eastside Square 1,360 553 101 99 62 2 2 284 0 806 1,091 21 1,070
Shinjuku Front Tower 632 252 59 38 - 0 8 144 - 380 524 3 521
Shinwa Building 227 93 18 15 20 0 2 35 - 134 170 63 106
Tokyo Opera City Building*1 1,605 1,117 *1 *1 *1 *1 *1 *1 *1 488 *1 222 *1
Front Place Minami- Shinjuku 73 22 4 2 0 0 - 15 - 51 66 - 66
Shinjuku South Gate Project
(tentative name) (land)
111 21 - - 21 - - - - 89 89 - 89
Yoyogi 1Chome Building 309 124 26 20 24 0 7 45 - 185 230 10 219
Jingumae Terrace 185 57 10 9 17 0 2 16 - 128 145 2 142
Jingumae Media Square Building 295 147 21 23 50 0 9 40 - 148 189 4 185
Shibuya Cross Tower(land) 540 81 - - 81 - - - - 458 458 - 458
Ebisu Neonato 482 217 49 25 37 1 10 91 - 264 356 21 335
TIXTOWER UENO 675 355 57 36 38 1 19 201 - 320 521 1 520
Higashi Gotanda 1Chome Building 191 80 16 17 14 0 4 27 - 110 138 0 138
Osaki Front Tower 709 495 69 44 26 0 5 255 93 214 469 - 469
Omori-Eki Higashiguchi
Building 231 116 29 17 25 0 4 37 0 115 153 73 79
Harmony Tower 485 266 145 - 56 0 12 50 - 219 269 - 269
Otsuka Higashi Ikebukuro Building 197 113 24 23 12 0 10 41 - 84 126 56 70
Ikebukuro 2Chome Building 69 35 8 5 5 0 8 8 - 33 41 8 33
Ikebukuro YS Building 194 82 17 17 15 0 0 30 - 112 143 9 133
Hachioji First Square 241 123 51 2 26 0 8 33 - 117 151 6 145
Saitama Urawa Building 114 57 16 8 9 0 5 17 - 57 74 3 71
MM Park Building 1,232 698 139 158 79 1 24 294 0 534 828 9 819
Queen’s Tower A 1,019 661 203 106 112 3 15 213 6 358 571 303 267
Kawasaki Isago Building 156 80 23 15 13 0 4 23 0 75 99 7 91

JAPAN REAL ESTATE INVESTMENT CORPORATION(8952)
36
Name of property
Revenues / Expenses (October 1, 2018 – March 31, 2019)
Property-related
revenues
Property-related
expenses
Property-related profits ②
NOI ③(①+②)
Capital expend-itures④*2
NCF③-④
Property m
anagement
expenses
Utilities expenses
Property and other
taxes
Casualty insurance
Repairing expenses
Depreciation
①
Other expenses
Musashi Kosugi STM Building 165 82 21 2 12 0 19 27 - 83 110 0 109
8・3 Square Kita Building
327 208 29 54 22 0 31 70 - 119 189 0 189
Jozenji Park Building 65 44 9 7 6 0 7 11 - 21 33 2 30
Higashi Nibancho Square 560 284 77 52 40 0 10 103 - 275 378 2 376
Sendai Honcho Honma Building 132 80 18 14 16 0 13 18 - 51 69 2 67
AER 662 323 88 57 63 0 1 111 0 339 450 - 450
Daido Seimei Niigata Building 12 8 2 - - 0 - 6 - 4 10 - 10
Kanazawa Park Building 499 318 99 57 65 1 19 75 0 180 255 190 65
Kanazawa Kamitsutsumicho
Building 130 89 17 13 10 0 1 45 - 40 86 0 85
Nishiki Park Building 286 185 54 22 24 0 19 55 6 101 156 52 104
Nagoya Hirokoji Place 387 176 37 30 34 0 0 73 - 211 284 2 281
Nagoya Hirokoji Building 566 386 87 44 62 1 24 166 0 179 345 39 305
Nagoya Misono Building 71 57 12 5 6 0 3 30 - 13 44 9 34
Shijo Karasuma Center Building 209 106 28 13 11 0 2 50 - 103 154 6 148
Umeda Square Building 424 241 62 26 48 0 34 67 0 183 250 171 78
Shin Fujita Building 716 508 96 69 75 1 24 240 0 207 448 106 341
Sakaisujihonmachi Building 233 134 41 26 35 0 3 26 0 98 125 1 123
Midosuji Daiwa Building 545 294 64 41 76 1 21 89 0 251 341 185 155
Amagasaki Front Building 455 228 67 23 26 0 7 102 - 226 329 16 313
Lit City Building 230 123 26 16 16 1 4 58 - 106 164 - 164
NHK Hiroshima Broadcasting
Center Building 262 195 50 24 23 0 21 50 24 67 117 87 29
Tosei Tenjin Building 85 40 13 7 7 0 1 11 - 44 55 3 52
Tenjin Crystal Building 158 130 23 17 19 0 6 63 - 28 92 - 92
Hinode Tenjin Building 184 82 21 17 14 0 7 21 - 101 123 25 97
Total 33,022 16,819 3,691 2,493 3,021 50 979 6,400 181 16,202 22,603 2,325 20,278
*1. Disclosure of NOI and NCF in the breakdown of the expenses of the property leasing business for Tokyo Opera City Building has been withheld at the request of the joint owners of the relevant real estate.
*2. Construction expenses that correspond to capital expenditures incurred during the period under review are listed under capital expenditures. This does not include expenses capitalized as construction in progress, expenses capitalized as furniture, etc., or such expenses included in the book value as brokerage fees for acquiring real estate or other assets, real estate acquisition taxes or other

JAPAN REAL ESTATE INVESTMENT CORPORATION(8952)
37
acquisition-related expenses. c. Condition of Other Assets (i) Shares/Investment Securities
Securities Number of
shares
Acquisition price (¥ thousand)
Appraisal value (¥ thousand)
Valuation gain/loss
(¥ thousand) Notes
Unit price Amount Unit price Amount
Tokyo Opera City Building Co., Ltd.
124 83 10,336 83 10,336 - *
Tokyo Opera City Heat Supply Co., Ltd.
4,931 114 566,831 114 566,831 - *
Total - - 577,168 - 577,168 - -
* Appraisal value for relevant non-listed stock are defined as acquisition costs. (ii) Marketable Securities Other Than Shares
Asset type Quantity Book value (¥ thousand)
Appraisal value (¥ thousand)
Valuation gain/loss
(¥ thousand) Notes
Unit price Amount Unit price Amount
Trust beneficiary rights in deposits
1 229,086 229,086 229,086 229,086 - -
Total - - 229,086 - 229,086 - -
(iii) Other Specified Assets
Asset type Quantity Book value (¥ thousand)
Appraisal value (¥ thousand)
Valuation gain/loss
(¥ thousand) Notes
Unit price Amount Unit price Amount
Monetary claim 1 1,040,000 1,040,000 1,040,000 1,040,000 - -
Total - - 1,040,000 - 1,040,000 - -
* Trust beneficiary rights, mainly consisted of the trust asset of real estate, are included in the previous section b. “Real Estate
Investment Property and Trust Beneficiary Rights in Trust of Real Estate”.

JAPAN REAL ESTATE INVESTMENT CORPORATION(8952)
38
d. Capital Expenditures (i) Schedule for Capital Expenditures
The significant scheduled capital expenditures, such as current plans for repair, maintenance and renovation work on existing properties, are listed below.
The following scheduled capital expenditures include those accounted for as expenses.
Name of property (Location)
Purpose Scheduled period
Estimated cost (¥ million)
Total amount
Payment amount for the fiscal under
review period
Total amountalready paid
Shiba 2Chome Daimon Building (Minato-ku, Tokyo)
Upgrade of air conditioning
facilities
From October 2019 To March 2020
213 - -
Shiba 2Chome Daimon Building (Minato-ku, Tokyo)
Upgrade of air conditioning
facilities
From April 2019 To September 2019
171 - -
Shiba 2Chome Daimon Building (Minato-ku, Tokyo)
Sanitary facility renewalconstruction
From May 2019 To September 2019
131 - -
Shiba 2Chome Daimon Building (Minato-ku, Tokyo)
Sanitary facility renewalconstruction
From October 2019 To March 2020
131 - -
Shiba 2Chome Daimon Building (Minato-ku, Tokyo)
Construction work From April 2019
To September 2019 90 - -
Shiba 2Chome Daimon Building (Minato-ku, Tokyo)
Construction work From October 2019
To March 2020 90 - -
Otsuka Higashi Ikebukuro Building
(Toshima-ku, Tokyo)
Sanitary facility renewalconstruction
From April 2019 To August 2019
68 - -
NHK Hiroshima Broadcasting Center Building
(Hiroshima, Hiroshima Prefecture)
Upgrade of disaster prevention
facilities
From September 2019To December 2019
41 - -
Hinode Tenjin Building (Fukuoka, Fukuoka Prefecture)
Sanitary facility renewalconstruction
From April 2019 To September 2019
40 - -
Cosmo Kanasugibashi Building (Minato-ku, Tokyo)
Upgrade of electrical equipment
From October 2019 To March 2020
37 - -
Ikebukuro 2Chome Building (Toshima-ku, Tokyo)
Elevator renewal construction
From October 2019 To February 2020
18 - -

JAPAN REAL ESTATE INVESTMENT CORPORATION(8952)
39
(ii) Capital expenditures during the period under review For acquired real estate and other assets, capital expenditures incurred in the period under review totaled ¥2,325 million and repair, maintenance and renovation expenses classified as expenses in the period under review totaled ¥979 million, for a total of ¥3,304 million worth of construction that has been carried out.
The major item in the capital expenditure was the upgrade of air conditioning facilities of Shiba 2Chome Daimon Building.
Name of property (Location)
Purpose Period Expenditures for
construction (¥ million)
Shiba 2Chome Daimon Building (Minato-ku, Tokyo)
Upgrade of air conditioning facilities
From October 2018 To March 2019 148
Omori-Eki Higashiguchi Building
(Ota-ku, Tokyo) Elevator renewal construction From October 2018
To January 2019 63
Kanazawa Park Building (Kanazawa, Ishikawa Prefecture)
Upgrade of electrical equipment From July 2018 To March 2019 56
NHK Hiroshima Broadcasting Center Building
(Hiroshima, Hiroshima Prefecture)
Parking facility renewal construction
From July 2018 To December 2018 33
NHK Hiroshima Broadcasting Center Building
(Hiroshima, Hiroshima Prefecture)Upgrade of electrical equipment From July 2018
To January 2019 32
Other real estate
1,990
Total
2,325
(iii) Money Saved for Long-term Repair Plans “Not applicable” e. Expenses and Liabilities (i) Details on Operation-related Expenses
Item For the period
from April 1, 2018 to September 30, 2018
For the period from October 1, 2018
to March 31, 2019
(a) Asset management fee * ¥1,294,322 thousand ¥1,296,545 thousand
(breakdown) NOI-linked fee ¥896,065 thousand ¥904,135 thousand
Distribution-linked fee ¥398,257 thousand ¥392,409 thousand
(b) Asset custody fee ¥61,769 thousand ¥62,191 thousand
(c) Administrative service fees ¥131,335 thousand ¥132,759 thousand
(d) Directors’ compensations ¥7,800 thousand ¥7,800 thousand
(e) Commission expenses ¥82,685 thousand ¥90,962 thousand
(f) Other operating expenses ¥66,365 thousand ¥64,004 thousand
Total ¥1,644,278 thousand ¥1,654,263 thousand
* In addition to the asset management fee listed above, in the case that a property is acquired, an “acquisition fee” is included in the
acquisition cost of the property and paid to the asset management company. In the case that a property is sold, a “disposition fee” is included in the loss on sale and paid to the asset management company. These fees are calculated by multiplying the buying/selling price of the property by a fee rate. In the period ended September 30, 2018, the acquisition fee amounted to ¥125,125 thousand and the disposition fee amounted to ¥3,250 thousand, and in the period ended March 31, 2019, the acquisition fee amounted to ¥55,100 thousand.

JAPAN REAL ESTATE INVESTMENT CORPORATION(8952)
40
(ii) Loans The condition of loans by financial institutions as of March 31, 2019, is as follows.
Classification Drawdown
date
Balance at beginning of
current period (¥thousand )
Balance at end of
current period (¥thousand )
Average interest rate *1
(%)
Repayment date
Repayment method
Use of proceeds
Notes
Lender
Short-term
loans
Sumitomo Mitsui Trust Bank, Limited
December 26, 2017
1,300,000 ― 0.10348 December 26,
2018
Bullet *2 Unsecured
Unguaranteed Unsubordinated
Resona Bank, Limited
March 26, 2018
3,000,000 ― 0.1025 March 26,
2019
Sumitomo Mitsui Trust Bank, Limited
March 30, 2018
1,700,000 ― 0.10255 March 29,
2019
Mizuho Bank, Ltd. April 3,
2018 5,500,000 5,500,000 0.10277
April 3, 2019
Mizuho Bank, Ltd. August 29,
2018 7,000,000 ― 0.10398
August 29, 2019 *3
Sumitomo Mitsui Trust Bank, Limited
August 29, 2018
3,000,000 ― 0.10506 August 29,
2019 *4
Sumitomo Mitsui Trust Bank, Limited
December 26, 2018
― 1,300,000 0.10163 December 26,
2019
Sumitomo Mitsui Trust Bank, Limited
March 29, 2019 ― 1,700,000 0.1027
March 30, 2020
Subtotal
21,500,000 8,500,000
Long-term
loans
Sumitomo Mitsui Trust Bank, Limited
November 15, 2011
3,000,000 ― 0.98375 November 15,
2018
Bullet *2 Unsecured
Unguaranteed Unsubordinated
Sumitomo Mitsui Banking Corporation
November 15, 2011
3,000,000 ― 0.98375 November 15,
2018
Mizuho Bank, Ltd. September 1,
2015 2,500,000 ― 0.17
March 1, 2019
The Gunma Bank, Ltd.
March 24, 2014
1,000,000 ― 0.4105 March 25,
2019
Sumitomo Mitsui Trust Bank, Limited
May 29, 2015
5,000,000 5,000,000 0.2075 May 29,
2019 *5
MUFG Bank, Ltd. September 1,
2015 5,000,000 5,000,000 0.2
September 2, 2019 *5
Sumitomo Mitsui Trust Bank, Limited
September 26, 2011
5,500,000 5,500,000 1.16 September 26,
2019 *5
The Hiroshima Bank, Ltd.
October 1, 2014
3,000,000 3,000,000 0.31575 October 1,
2019 *5
Mizuho Bank, Ltd. November 1,
2011 6,000,000 6,000,000 1.2075
November 1, 2019 *5
Mizuho Bank, Ltd. November 15,
2011 3,000,000 3,000,000 1.13875
November 15, 2019 *5
MUFG Bank, Ltd. November 15,
2011 3,000,000 3,000,000 1.13875
November 15, 2019 *5
MUFG Bank, Ltd. November 15,
2011 3,000,000 3,000,000 1.13875
November 15, 2019 *5
The Gunma Bank, Ltd.
November 17, 2014
1,000,000 1,000,000 0.316 November 18,
2019 *5
The Yamanashi Chuo Bank, Ltd.
December 15, 2014
2,000,000 2,000,000 0.266 December 16,
2019 *5

JAPAN REAL ESTATE INVESTMENT CORPORATION(8952)
41
Classification Drawdown
date
Balance at beginning of
current period (¥thousand )
Balance at end of
current period (¥thousand )
Average interest rate *1
(%)
Repayment date
Repayment method
Use of proceeds
Notes
Lender
Long-term
loans
Shinkin Central Bank January 7,
2013 2,000,000 2,000,000 0.71375
January 7, 2020 *5
Bullet *2 Unsecured
Unguaranteed Unsubordinated
MUFG Bank, Ltd. January 15,
2013 5,500,000 5,500,000 0.71
January 15, 2020 *5
Shinkin Central Bank January 15,
2013 5,000,000 5,000,000 0.71
January 15, 2020 *5
MUFG Bank, Ltd. June 15,
2012 4,000,000 4,000,000 0.9525
June 15, 2020
Sumitomo Mitsui Trust Bank, Limited
June 15, 2012
4,000,000 4,000,000 0.9525 June 15,
2020
Sumitomo Mitsui Trust Bank, Limited
June 15, 2015
3,000,000 3,000,000 0.3425 June 15,
2020
Tokio Marine & Nichido Fire
Insurance Co., Ltd.
July 3, 2017
2,000,000 2,000,000 0.1 July 3, 2020
The Yamaguchi Bank, Ltd.
October 29, 2012
2,000,000 2,000,000 0.8 October 29,
2020
MUFG Bank, Ltd. December 21,
2012 5,000,000 5,000,000 0.80125
December 21, 2020
MUFG Bank, Ltd. December 21,
2012 5,000,000 5,000,000 0.80125
December 21, 2020
MUFG Bank, Ltd. January 15,
2013 5,500,000 5,500,000 0.83625
January 15, 2021
MUFG Bank, Ltd. January 31,
2014 4,000,000 4,000,000 0.64225
January 29, 2021
The Bank of Fukuoka, Ltd.
January 31, 2014
2,500,000 2,500,000 0.63849 January 29,
2021
Sumitomo Mitsui Trust Bank, Limited
January 31, 2014
2,000,000 2,000,000 0.62575 January 29,
2021
The Iyo Bank, Ltd. March 24,
2014 2,000,000 2,000,000 0.6035
March 24, 2021
MUFG Bank, Ltd. April 4,
2017 5,000,000 5,000,000 0.00665
April 5, 2021
MUFG Bank, Ltd. April 24,
2013 5,000,000 5,000,000 0.775
April 26, 2021
Mizuho Bank, Ltd. June 15,
2012 4,000,000 4,000,000 1.07375
June 15, 2021
Sumitomo Mitsui Trust Bank, Limited
December 26, 2016
3,700,000 3,700,000 0.1913 June 28,
2021
Sumitomo Mitsui Banking Corporation
January 19, 2018
5,000,000 5,000,000 0.16255 July 20,
2021
The Bank of Fukuoka, Ltd.
August 31, 2017
1,500,000 1,500,000 0.1325 August 31,
2021
The Iyo Bank, Ltd. October 1,
2014 1,000,000 1,000,000 0.46525
October 1, 2021

JAPAN REAL ESTATE INVESTMENT CORPORATION(8952)
42
Classification Drawdown
date
Balance at beginning of
current period (¥thousand )
Balance at end of
current period (¥thousand )
Average interest rate *1
(%)
Repayment date
Repayment method
Use of proceeds
Notes
Lender
Long-term
loans
The Chugoku Bank, Limited
October 1, 2014
1,000,000 1,000,000 0.4725 October 1,
2021
Bullet *2 Unsecured
Unguaranteed Unsubordinated
The Daishi Bank, Ltd.
November 14, 2014
1,800,000 1,800,000
0.463
November 15, 2021
Sony Bank Incorporated
1,400,000 1,400,000
The Toho Bank, Ltd. 1,400,000 1,400,000
The Hokuetsu Bank, Ltd.
1,400,000 1,400,000
The Shinkumi Federation Bank
1,000,000 1,000,000
The Akita Bank, Ltd. 900,000 900,000
The Gunma Bank, Ltd.
900,000 900,000
The 77 Bank, Ltd. 900,000 900,000
The Tochigi Bank, Ltd.
900,000 900,000
The Fukui Bank, Ltd. 900,000 900,000
The Bank of Iwate, Ltd.
500,000 500,000
The Higo Bank, Ltd. 500,000 500,000
The Yamagata Bank, Ltd.
500,000 500,000
The Nishi-Nippon City Bank, Ltd.
June 17, 2014
2,000,000 2,000,000 0.621 December 17,
2021
Sumitomo Mitsui Banking Corporation
January 7, 2013
2,000,000 2,000,000 0.98 January 7,
2022
Mizuho Bank, Ltd. January 15,
2013 5,000,000 5,000,000 0.96625
January 17, 2022
The Norinchukin Bank
January 31, 2014
3,500,000 3,500,000 0.757 January 31,
2022
Mizuho Bank, Ltd. April 24,
2013 3,000,000 3,000,000 0.87375
April 25, 2022
MUFG Bank, Ltd. June 15,
2012 4,000,000 4,000,000 1.1975
June 15, 2022
MUFG Bank, Ltd. June 15,
2012 2,500,000 2,500,000 1.2725
June 15, 2022
Shinsei Bank, Limited
June 15, 2012
2,500,000 2,500,000 1.2725 June 15,
2022

JAPAN REAL ESTATE INVESTMENT CORPORATION(8952)
43
Classification
Drawdown date
Balance at beginning of
current period (¥thousand )
Balance at end of
current period (¥thousand )
Average interest rate *1
(%)
Repayment date
Repayment method
Use of proceeds
Notes
Lender
Long-term
loans
The Norinchukin Bank
June 17, 2014
3,000,000 3,000,000 0.6785 June 17,
2022
Bullet *2 Unsecured
Unguaranteed Unsubordinated
The Gunma Bank, Ltd.
August 10, 2015
1,000,000 1,000,000
0.3925 August 10,
2022
The Shinkumi Federation Bank
1,000,000 1,000,000
The Daishi Bank, Ltd. 1,000,000 1,000,000
The Chugoku Bank, Limited
1,000,000 1,000,000
The Toho Bank, Ltd. 1,000,000 1,000,000
The Fukui Bank, Ltd. 1,000,000 1,000,000
The Tochigi Bank, Ltd.
500,000 500,000
MUFG Bank, Ltd. September 1,
2015 2,000,000 2,000,000 0.47125
September 1, 2022
The Hachijuni Bank, Ltd.
December 20, 2017
1,000,000 1,000,000 0.1863 December 20,
2022
Development Bank of Japan Inc.
January 7, 2013
3,000,000 3,000,000 1.115 January 6,
2023
The Daishi Bank, Ltd. January 7,
2016 1,500,000 1,500,000 0.2802
January 10, 2023
The 77 Bank, Ltd. January 10,
2018 1,000,000 1,000,000 0.205
January 10, 2023
The Hachijuni Bank, Ltd.
January 15, 2016
1,000,000 1,000,000 0.265 January 16,
2023
The Iyo Bank, Ltd. January 15,
2016 1,000,000 1,000,000 0.265
January 16, 2023
Sumitomo Mitsui Trust Bank, Limited
January 17, 2018
3,000,000 3,000,000 0.21 January 17,
2023
Development Bank of Japan Inc.
January 31, 2014
5,000,000 5,000,000 0.9325 January 31,
2023
The Yamaguchi Bank, Ltd.
March 25, 2013
1,000,000 1,000,000 0.945 March 24,
2023
The Bank of Fukuoka, Ltd.
March 24, 2015
2,000,000 2,000,000 0.5125 March 24,
2023
The Norinchukin Bank
March 25, 2015
3,500,000 3,500,000 0.46825 March 27,
2023
The Chugoku Bank, Limited
March 26, 2018
2,000,000 2,000,000 0.1988 March 27,
2023
Sumitomo Mitsui Banking Corporation
November 29, 2018 ― 3,000,000 0.1694
May 29, 2023

JAPAN REAL ESTATE INVESTMENT CORPORATION(8952)
44
Classification
Drawdown date
Balance at beginning of
current period (¥thousand )
Balance at end of
current period (¥thousand )
Average interest rate *1
(%)
Repayment date
Repayment method
Use of proceeds
Notes
Lender
Long-term
loans
Sumitomo Mitsui Trust Bank, Limited
November 29, 2018 ― 3,000,000 0.1694
May 29, 2023
Bullet *2 Unsecured
Unguaranteed Unsubordinated
MUFG Bank, Ltd. June 1, 2017
12,000,000 12,000,000 0.00235 June 1, 2023
The Chugoku Bank, Limited
June 15, 2015
3,000,000 3,000,000 0.61175 June 15,
2023
The Bank of Fukuoka, Ltd.
June 15, 2017
2,500,000 2,500,000 0.2388 June 15,
2023
MUFG Bank, Ltd. December 19,
2014 10,000,000 10,000,000
0.42375 *6
December 19, 2023
MUFG Bank, Ltd. March 26,
2018 5,000,000 5,000,000 0.03255
March 26, 2024
The Hachijuni Bank, Ltd.
March 26, 2018
1,000,000 1,000,000 0.2338 March 26,
2024
The Iyo Bank, Ltd. June 15,
2017 2,500,000 2,500,000 0.275
June 17, 2024
The Hachijuni Bank, Ltd.
June 15, 2017
1,000,000 1,000,000 0.275 June 17,
2024
MUFG Bank, Ltd. September 1,
2015 3,500,000 3,500,000 0.63
September 2, 2024
Sumitomo Mitsui Trust Bank, Limited
September 2, 2015
3,800,000 3,800,000 0.536 September 2,
2024
The Norinchukin Bank
September 1, 2017
5,000,000 5,000,000 0.24 September 2,
2024
Taiyo Life Insurance Company
October 1, 2014
2,000,000 2,000,000 0.7825 October 1,
2024
Mizuho Bank, Ltd. October 1,
2015 2,500,000 2,500,000 0.5575
October 1, 2024
MUFG Bank, Ltd. June 1, 2018
10,000,000 10,000,000 0.2544 December 2,
2024
The Ashikaga Bank, Ltd.
January 9, 2018
1,000,000 1,000,000 0.285 January 9,
2025
Mizuho Trust & Banking Co., Ltd.
March 2, 2015
3,000,000 3,000,000 0.5585 March 3,
2025
MUFG Bank, Ltd. March 26,
2018 2,000,000 2,000,000 0.2725
March 26, 2025
Development Bank of Japan Inc.
March 30, 2017
5,000,000 5,000,000 0.315 March 31,
2025
Taiyo Life Insurance Company
May 29, 2015
1,500,000 1,500,000 0.7375 May 29,
2025
Sumitomo Mitsui Trust Bank, Limited
August 31, 2018
3,000,000 3,000,000 0.32 August 29,
2025
Development Bank of Japan Inc.
September 1, 2015
7,000,000 7,000,000 0.7175 September 1,
2025
Mizuho Bank, Ltd. December 26,
2016 5,000,000 5,000,000 0.3625
December 26,2025

JAPAN REAL ESTATE INVESTMENT CORPORATION(8952)
45
Classification
Drawdown date
Balance at beginning of
current period (¥thousand )
Balance at end of
current period (¥thousand )
Average interest rate *1
(%)
Repayment date
Repayment method
Use of proceeds
Notes
Lender
Long-term
loans
MUFG Bank, Ltd. February 26,
2018 6,500,000 6,500,000 0.3413
February 26, 2026
Bullet *2 Unsecured
Unguaranteed Unsubordinated
Mizuho Bank, Ltd. March 27,
2018 5,500,000 5,500,000 0.3
March 27, 2026
Shinkin Central Bank March 30,
2017 5,000,000 5,000,000 0.36
March 30, 2026
The Norinchukin Bank
January 23, 2019 ― 4,000,000 0.1988
July 23, 2026
Shinkin Central Bank September 1,
2017 5,000,000 5,000,000 0.3188
September 1, 2026
MUFG Bank, Ltd. October 31,
2016 3,000,000 3,000,000 0.24
October 30, 2026
Mizuho Bank, Ltd. December 21,
2016 5,000,000 5,000,000 0.415
December 21, 2026
Shinkin Central Bank January 23,
2019 ― 5,000,000 0.2213 January 25,
2027
Shinkin Central Bank April 24,
2018 6,000,000 6,000,000 0.3675
April 26, 2027
The Joyo Bank, Ltd. January 9,
2018 1,000,000 1,000,000 0.4188
January 11, 2028
Sumitomo Mitsui Banking Corporation
January 19, 2018
3,000,000 3,000,000 0.4338 January 19,
2028
Mizuho Bank, Ltd. March 30,
2018 4,000,000 4,000,000 0.3963
March 30, 2028
MUFG Bank, Ltd. March 30,
2018 4,000,000 4,000,000 0.3963
March 30, 2028
Taiyo Life Insurance Company
March 30, 2018
1,000,000 1,000,000 0.3963 March 30,
2028
The Yamanashi Chuo Bank, Ltd.
March 26, 2019 ― 2,000,000 0.3688
March 26, 2031
Sumitomo Life Insurance Company
March 26, 2019 ― 1,000,000 0.505
March 27, 2034
Subtotal 340,000,000 348,500,000
Total 361,500,000 357,000,000
*1. The average for floating interest rates is recorded as the weighted average during the period. The average is rounded off to the fifth
decimal place. The weighted average for interest rates of loans for which floating interest rates were swapped to fixed rates in order to hedge the risk of interest rate fluctuations is calculated taking the effect of this swap into consideration.
*2. The purposes of executing these loans are to purchase real properties or beneficiary right of real estate in trust, to repay existing loans, and to fund the redemption of investment corporation bonds.
*3. The Company made a full repayment (¥7,000 million) before maturity on November 29, 2018. *4. The Company made a full repayment (¥3,000 million) before maturity on November 2, 2018. *5. At the end of the period under review, these loans are accounted for under current liabilities on the balance sheets as the current
portion of long-term borrowings. *6. In order to hedge the risk of exchange rate and interest rate fluctuations related to foreign currency-denominated loans, the
Company conducted an interest-rate and currency swap transaction, which substantially secured exchange and interest rates. Accordingly, the balance and the weighted average for interest rates during the period are calculated taking the effect of this interest-rate and currency swap into consideration.

JAPAN REAL ESTATE INVESTMENT CORPORATION(8952)
46
(iii) Investment Corporation Bonds Outstanding investment corporation bonds as of March 31, 2019, are as follows.
Securities Date of issue
Balance at beginning of
current period (¥ thousand)
Balance at end of
current period (¥ thousand)
Interest rate (%)
Repayment period
Repayment method
Use of proceeds Notes
4th unsecured investment corporation bond
September 29, 2005 10,000,000 10,000,000 2.56
September 29, 2025 Bullet *1 *2
10th unsecured investment corporation bond
March 30, 2017 10,000,000 10,000,000 0.3975
March 30, 2027 Bullet *1 *2 *3
11th unsecured investment corporation bond
October 26, 2017 2,993,175 2,993,175 0.2788
October 26, 2027
Bullet *1 *2 *3 *4
12th unsecured investment corporation bond (Japan Real Estate
Investment Green Bonds)
November 1, 2018 ― 10,000,000 0.23
November 1, 2023
Bullet *1 *2
Total 22,993,175 32,993,175
*1. The investment corporation bonds are primarily used to fund the acquisition of real properties or beneficiary right of real estate in trust, and to repay existing loans.
*2. Financial covenants, such as a negative pledge, are not included in these bonds. *3. Bond issuance was limited to qualified institutional investors by a private placement. *4. For the purpose of avoiding foreign currency risk with respect to foreign currency investment corporation bonds, the Company
engages in currency swap transactions to fix the exchange rates. Considering the effects of the currency swap transactions, the balances and interest rates are reflected in the schedule.
(iv) New Unit Acquisition Rights “Not applicable” f. Examination of the Value of Specified Assets (i) Real Estate, etc.
Acquisition or
Disposition Property name
Date of transaction
Acquisition/ disposition
cost*1 (¥ million)
Real estate appraisal
value (¥ million)
Appraising institution
Date of appraisal
Acquisition Front Place
Minami- Shinjuku January 23,
2019 9,250 9,400
Japan Real Estate Institute
January 1, 2019
Acquisition Daido Seimei
Niigata Building March 1,
2019 1,770 1,850
Daiwa Real Estate Appraisal
Co., Ltd.
January 1, 2019
*1. The “acquisition/disposition cost” refers to the amount listed in the sale and purchase contract, and does not include various expenses necessary in the acquisition or disposition of the property such as trading intermediate fees.
*2. The appraisal value listed above is decided in accordance with the 3rd chapter of the Japanese Real Estate Appraisal Act and Real Estate Appraisal Standards.
(ii) Other Value inspections on transactions by the Company that are deemed necessary under Article 201 of the ITA, are entrusted to Yoshihiro Tanaka CPA Office, excluding ones described in (i) Real Estate, etc. above. During the period from October 1, 2018 to March 31, 2019, there was no transaction that was subject to such inspections.

JAPAN REAL ESTATE INVESTMENT CORPORATION(8952)
47
g. Transactions with Interested Parties (from October 1, 2018 to March 31, 2019) (i) Transactions
Segment Buying and selling amounts
Buying amounts Selling amounts
Total Amount ¥ 11,020,000 thousand
¥ - thousand
Breakdown of Transactions with Interested Parties
Sendagaya 5 Chome Tokutei Mokuteki Kaisha ¥ 9,250,000 thousand (83.9 %) ¥ - thousand (-%)
Total
¥ 9,250,000 thousand (83.9 %)
¥ - thousand (-%)
* The numerical values within the ( ) represent a percentage of the total buying/selling amounts. (ii) Amount of Commission Fees and Other Expenses
Segment Total amount of
commission fees and other expenses A
Breakdown of transactions with interested parties Percentage of total amount
Payment recipient Amount paid B B/A
Property management
expenses ¥3,691,389 thousand
Mitsubishi Jisho Property Management Co., Ltd.
¥2,277,094 thousand 61.7 %
Mitsubishi Estate Co., Ltd. ¥173,332 thousand 4.7 %
Mitsubishi Real Estate Services Co., Ltd.
¥42,782 thousand 1.2 %
Yuden Building Kanri Co., Ltd. ¥35,099 thousand 1.0 %
Utilities expenses
¥2,493,875 thousand Minato Mirai 21 District Heating and Cooling Co., Ltd.
¥75,013 thousand 3.0 %
Other operating expenses
¥165,272 thousand
Mitsubishi Jisho Property Management Co., Ltd.
¥12,382 thousand 7.5 %
Mitsubishi Estate Co., Ltd. ¥129 thousand 0.1 %
Mitsubishi Jisho Sekkei Inc. ¥8,620 thousand 5.2 %
*1. Interested parties refers to interested parties of the asset management company who has concluded consignment agreements with
the Company, as stipulated in Article 123 of the enforcement order of the ITA, and Section 26, Paragraph 1, Item 27 of the Regulations for Management Reports Concerning Investment Trusts and Investment Corporations of the Investment Trusts Association, Japan.
*2. In addition to the transactions and commission fees listed above, other amounts paid to interested parties, such as orders placed for repair work, are listed below.
Mitsubishi Jisho Property Management Co., Ltd. ¥1,080,223 thousand Mitsubishi Estate Co., Ltd. ¥220,100 thousand Yuden Building Kanri Co., Ltd. ¥43,493 thousand Mitsubishi Jisho Sekkei Inc. ¥7,020 thousand Mitsubishi Real Estate Services Co., Ltd. ¥11,943 thousand Izumi Park Town Service Co., Ltd. ¥50 thousand

JAPAN REAL ESTATE INVESTMENT CORPORATION(8952)
48
h. Other Announcements (i) General Meeting of Unitholders The Company’s 11th General Meeting of Unitholders was held on March 20, 2019. The major items deliberated and results thereof are as follows:
Agenda Overview
Item 1: Partial amendment to the Articles of Incorporation
As per the original proposal, the amendments were made to the Articles of Incorporation concerning the following points: - The simplification on the provision in relation to the application of the hedge accounting - The necessary changes accompanied by the change of the address of the asset management company, and the simplification on the provision; and- The other necessary changes and the clarification on the expressions.
Item 2: Appointment of one executive director Mr. Yutaka Yanagisawa was appointed as Executive Director as originally proposed. He assumes the position for the duration of 2 years starting from May 11, 2019.
Item 3: Appointment of two substitute executive directors
Mr. Naoki Umeda and Mr. Kazuo Nezu were appointed as Substitute Executive Directors as originally proposed.
Item 4: Appointment of two supervisory directors Mr. Tomohiro Okanoya and Mr. Hiroaki Takano were appointed as Supervisory Directors as originally proposed. They assume the position for the duration of 2 years starting from May 11, 2019.
Item 5: Appointment of one substitute supervisory director
Mr. Yoshinori Kiya was appointed as Substitute Supervisory Director as originally proposed.
(ii)Board of Directors Below is an overview of the important change and the conclusion of major contracts that were accepted by the Company’s Board of Directors during the period. Date of acceptance Accepted item Overview
November 15, 2018
Consignment of a general administrative work concerning the issuance of investment corporation bonds
In connection with the comprehensive resolution adopted on the same date on the issuance of investment corporate bonds, the approval was given to the candidate agents to whom an administrative work for the said bonds was consigned. Other items necessary for its operation are entrusted to the executive directors to decide.

JAPAN REAL ESTATE INVESTMENT CORPORATION(8952)
49
Selected Financial Data
Millions of yen
For the period from For the period from For the period from For the period from For the period from
October 1, 2018 to March 31, 2019
April 1, 2018 to September 30, 2018
October 1, 2017 to March 31, 2018
April 1, 2017 to September 30, 2017
October 1, 2016 to March 31, 2017
Operating revenues 33,022 33,066 31,955 31,718 30,818
Operating expenses 18,473 18,487 18,358 18,539 18,251
Operating profit 14,548 14,578 13,596 13,178 12,567
Ordinary profit 13,441 13,348 12,362 11,921 11,197
Profit before income taxes
13,441 13,348 12,362 11,921 11,197
Profit 13,431 13,273 12,291 11,909 11,186
Total assets 963,676 956,645 935,560 906,507 898,306
Interest-bearing debt 389,993 384,493 403,993 375,500 369,000
Net assets 511,256 510,978 470,703 470,321 469,598
Unitholders’ capital 497,241 497,241 458,016 458,016 458,016
Number of units 1,385,210 1,385,210 1,309,310 1,309,310 1,309,310
Net assets per unit (Yen) 369,082 368,881 359,505 359,213 358,661
Cash distribution 13,432 13,152 12,223 11,909 11,186
Dividend payout ratio (Note 1)
100.0% 99.1% 99.5% 100.0% 100.0%
Dividend per unit (Yen) 9,697 9,495 9,336 9,096 8,544
Net operating income (NOI)
22,603 22,401 21,566 21,275 20,372
Funds from operations (FFO)
19,831 19,451 18,652 18,466 17,679
Return on assets (ROA) (Note 2)
1.4% 1.4% 1.3% 1.3% 1.3%
(2.8% annualized) (2.8% annualized) (2.7% annualized) (2.6% annualized) (2.5% annualized)
Return on equity (ROE) (Note 3)
2.6% 2.6% 2.6% 2.5% 2.4%
(5.3% annualized) (5.2% annualized) (5.2% annualized) (5.1% annualized) (4.8% annualized)
EOP equity ratio (Note 4)
53.1% 53.4% 50.3% 51.9% 52.3%
EOP interest-bearing debt ratio on total assets (Note 5)
40.5%
40.2% 43.2%
41.4%
41.1%
FFO multiple (Times) 22.7 21.3 19.3 19.2 21.8
Debt service coverage ratio (Times) (Note 6)
19.6 18.5 16.9 16.1 14.3
Notes:1. Dividend payout ratio = Dividend per unit / Profit per unit × 100 For the period ended September 30, 2018, as new investment units were issued, the ratio was calculated as follows: Cash distribution / Profit × 100
2. ROA = Ordinary profit / Average of Total assets during the period × 1003. ROE = Profit / Average of Net assets during the period × 100
(Annualized portion of the calculation given in Note 2 and Note 3 assumes a fiscal period of 182 days for the period ended March 31, 2017, 183 days for the period ended September 30, 2017, 182 days for the period ended March 31, 2018, 183 days for the period ended September 30, 2018 and 182 days for the period ended March 31, 2019.)
4. EOP equity ratio = (Net assets at the end of period / Total assets at the end of period) × 1005. EOP interest-bearing debt ratio on total assets = (Interest-bearing debt at the end of period / Total assets at the end of period) × 1006. Debt service coverage ratio = Profit before Interest, Taxes, Depreciation and Amortization / Interest expenses 7. The Company has applied “Partial Amendments to Accounting Standard for Tax Effect Accounting” (ASBJ Statement No. 28 on
February 16, 2018) from the period ended September 30, 2018, and the reclassified amount due to the change was reflected to the total assets for the period ended March 31, 2018.