financial report of the united states government 1999 · the report includes audited financial...
TRANSCRIPT

Financial Reportof the
United StatesGovernment
1999

A Mes sage from the Sec re tary of the Treasury . . . . . . . . . . . . . . . . . . . . . . . . . . . . . . . . . . . . 1Man age ment’s Dis cus sion and Anal y sis . . . . . . . . . . . . . . . . . . . . . . . . . . . . . . . . . . . . . . . . . . 3
General Accounting Office ReportComp trol ler Gen eral’s State ment . . . . . . . . . . . . . . . . . . . . . . . . . . . . . . . . . . . . . . . . . . . . . . . 15Au di tor’s Re port . . . . . . . . . . . . . . . . . . . . . . . . . . . . . . . . . . . . . . . . . . . . . . . . . . . . . . . . . . . . 19
Financial StatementsState ment of Op er a tions and Changes in Net Po si tion. . . . . . . . . . . . . . . . . . . . . . . . . . . . . . . 46State ment of Net Cost. . . . . . . . . . . . . . . . . . . . . . . . . . . . . . . . . . . . . . . . . . . . . . . . . . . . . . . . 47Bal ance Sheet . . . . . . . . . . . . . . . . . . . . . . . . . . . . . . . . . . . . . . . . . . . . . . . . . . . . . . . . . . . . . . 49
Stewardship Information (Unaudited)Stew ard ship As sets:
Na tional De fense As sets . . . . . . . . . . . . . . . . . . . . . . . . . . . . . . . . . . . . . . . . . . . . . . . . . . . . . 51Stew ard ship Land . . . . . . . . . . . . . . . . . . . . . . . . . . . . . . . . . . . . . . . . . . . . . . . . . . . . . . . . . . 54Her i tage As sets. . . . . . . . . . . . . . . . . . . . . . . . . . . . . . . . . . . . . . . . . . . . . . . . . . . . . . . . . . . . 56
Stew ard ship Re spon si bil ities:So cial Se cu rity . . . . . . . . . . . . . . . . . . . . . . . . . . . . . . . . . . . . . . . . . . . . . . . . . . . . . . . . . . . . 58Medicare . . . . . . . . . . . . . . . . . . . . . . . . . . . . . . . . . . . . . . . . . . . . . . . . . . . . . . . . . . . . . . . . . 59Rail road Re tire ment . . . . . . . . . . . . . . . . . . . . . . . . . . . . . . . . . . . . . . . . . . . . . . . . . . . . . . . . 60Black Lung Ben e fits . . . . . . . . . . . . . . . . . . . . . . . . . . . . . . . . . . . . . . . . . . . . . . . . . . . . . . . . 62Un em ploy ment In sur ance . . . . . . . . . . . . . . . . . . . . . . . . . . . . . . . . . . . . . . . . . . . . . . . . . . . 63
Stew ard ship In vest ments:Non-Federal Phys i cal Prop erty . . . . . . . . . . . . . . . . . . . . . . . . . . . . . . . . . . . . . . . . . . . . . . . 64Hu man Cap i tal . . . . . . . . . . . . . . . . . . . . . . . . . . . . . . . . . . . . . . . . . . . . . . . . . . . . . . . . . . . . 65Re search and De vel op ment . . . . . . . . . . . . . . . . . . . . . . . . . . . . . . . . . . . . . . . . . . . . . . . . . . 65
Cur rent Ser vices As sess ment . . . . . . . . . . . . . . . . . . . . . . . . . . . . . . . . . . . . . . . . . . . . . . . . . . 67
Notes to the Financial StatementsNote 1 - Sum mary of Sig nif i cant Ac count ing Pol icies. . . . . . . . . . . . . . . . . . . . . . . . . . . . . . . 69Note 2 - Cash and Other Mon e tary As sets . . . . . . . . . . . . . . . . . . . . . . . . . . . . . . . . . . . . . . . . 72Note 3 - Ac counts Receivable. . . . . . . . . . . . . . . . . . . . . . . . . . . . . . . . . . . . . . . . . . . . . . . . . . 73Note 4 - Loan and Loan Guar an tee Pro grams. . . . . . . . . . . . . . . . . . . . . . . . . . . . . . . . . . . . . . 74Note 5 - Taxes Re ceiv able . . . . . . . . . . . . . . . . . . . . . . . . . . . . . . . . . . . . . . . . . . . . . . . . . . . . 76Note 6 - In ven tories and Re lated Property . . . . . . . . . . . . . . . . . . . . . . . . . . . . . . . . . . . . . . . . 76Note 7 - Prop erty, Plant and Equip ment . . . . . . . . . . . . . . . . . . . . . . . . . . . . . . . . . . . . . . . . . . 7 7Note 8 - Other As sets . . . . . . . . . . . . . . . . . . . . . . . . . . . . . . . . . . . . . . . . . . . . . . . . . . . . . . . . 77Note 9 - Ac counts Pay able . . . . . . . . . . . . . . . . . . . . . . . . . . . . . . . . . . . . . . . . . . . . . . . . . . . . 78Note 10 - Fed eral Debt Se cu ri ties Held by the Public . . . . . . . . . . . . . . . . . . . . . . . . . . . . . . . 78Note 11 - Fed eral Em ployee and Vet eran Ben e fits Pay able . . . . . . . . . . . . . . . . . . . . . . . . . . . 81Note 12 - En vi ron men tal and Dis posal Li a bil i ties . . . . . . . . . . . . . . . . . . . . . . . . . . . . . . . . . . 84Note 13 - Ben e fits Due and Pay able . . . . . . . . . . . . . . . . . . . . . . . . . . . . . . . . . . . . . . . . . . . . . 85Note 14 - Other Liabilities . . . . . . . . . . . . . . . . . . . . . . . . . . . . . . . . . . . . . . . . . . . . . . . . . . . . 85Note 15 - Col lec tions and Re funds of Fed eral Revenue . . . . . . . . . . . . . . . . . . . . . . . . . . . . . 86Note 16 - Un rec on ciled Trans ac tions Af fecting the Change in Net Position . . . . . . . . . . . . . . 87Note 17 - Prior Pe riod Adjustments . . . . . . . . . . . . . . . . . . . . . . . . . . . . . . . . . . . . . . . . . . . . . 88Note 18 - Com mit ments and Contingencies . . . . . . . . . . . . . . . . . . . . . . . . . . . . . . . . . . . . . . . 88Note 19 - Ded i cated Col lec tions . . . . . . . . . . . . . . . . . . . . . . . . . . . . . . . . . . . . . . . . . . . . . . . . 91Note 20 - In dian Trust Funds . . . . . . . . . . . . . . . . . . . . . . . . . . . . . . . . . . . . . . . . . . . . . . . . . . 94
Contents

Supplemental Information (Unaudited)Net Cost De tail . . . . . . . . . . . . . . . . . . . . . . . . . . . . . . . . . . . . . . . . . . . . . . . 95De ferred Main te nance . . . . . . . . . . . . . . . . . . . . . . . . . . . . . . . . . . . . . . . . . 101Rec on cil i a tion of the Ex cess of Rev e nue Over Net Cost. . . . . . . . . . . . . . . . 102Un ex pended Bud get Au thor ity. . . . . . . . . . . . . . . . . . . . . . . . . . . . . . . . . . . 104Tax Bur den . . . . . . . . . . . . . . . . . . . . . . . . . . . . . . . . . . . . . . . . . . . . . . . . . 105
Other Information (Unaudited)Other Claims for Re fund . . . . . . . . . . . . . . . . . . . . . . . . . . . . . . . . . . . . . . . 107Fed eral Taxes Re ceiv able Net . . . . . . . . . . . . . . . . . . . . . . . . . . . . . . . . . . . 107
AppendixList of Sig nif i cant Gov ern ment En tities In cluded
and En tities Ex cluded from these Fi nan cial State ments . . . . . . . . . . . . . . 109

A MES SAGE FROM THE SEC RE TARY OF THE TREA SURY
I am pleased to present the fiscal year 1999 Financial Report of the United StatesGovernment. The Report includes audited financial statements that cover theExecutive Branch, as well as parts of the Legislative and Judicial branches of U.S.Government. The Administration initiated the development of this financial report inorder to create what we believe is a practical management tool for policy-makers anda source of useful information for the public about the assets, liabilities, andoperations of the government.
This report is another significant milestone in our efforts, begun in 1994, to accountfor the financial activities of the U.S. Government in a timely and professional manner.Developing the capability for the government to produce financial reports inaccordance with generally accepted accounting principles is an enormous task.
I am also pleased to report that the standards developed by the Federal AccountingStandards Advisory Board (FASAB) are now recognized by the American Institute ofCertified Public Accountants as being generally accepted accounting principles(GAAP) for the Federal Government. This is a major accomplishment. It will enhance the acceptability of our reports and will add to the level of financial professionalismthroughout the U.S. Government.
Significant progress continues to be made in the area of financial management. Moreagencies are completing their financial statements on time and the quality of the datacontinues to improve. The successful Year 2000 remediation process has resulted inbetter systems and we have established, through the Joint Financial ManagementImprovement Program, a government-wide financial software certification processthat is beginning to ensure that commercial systems meet the government’s needs.
Despite this progress, we have much yet to achieve. A great deal of additional effortwill be necessary to fully implement an entirely new and reliable system of reportingon the operations of the U.S. Government. The audit report from the GeneralAccounting Office (GAO) discusses many significant areas in which the reliability ofthe current financial statements need to be improved before the GAO will be able torender an opinion on these statements.
We are committed to producing and reporting financial information that meets thehighest standards of integrity, and to provide to the American people theaccountability and professionalism they expect from their government.
Law rence H. Sum mers

DIS CUS SION AND ANAL Y SIS 3
No other en tity in the worldcom pares in size, scope andcom plex ity to the U.S. Gov ern -ment . A c i vil ian Fed e r a lworkforce of nearly two mil lionin di vid u als serves a di verse Na -tion of more than 270 mil lionAmer i cans. The Fed eral Gov -ern ment is the larg est land owner in the world. Its bud geted spend -ing for fis cal 1999 was $1.7 tril -lion.
To ful fill its con sti tu tionalman dates, the U.S. Gov ern mentun der takes a wide va ri ety of pro -grams to:
• Main tain strong, readyand mod ern mil i taryforces.• Pro vide crit i cal in ter na -tional lead er ship.• Con trib ute to en ergy se -cu rity.• Pro tect the en vi ron ment.• Boost ag ri cul tural pro -duc tiv ity.• Fa cil i tate com merce and sup port hous ing.
• Sup port the trans por ta tionsys tem.• Help eco nom i cally dis -tressed ur ban and ru ral com -mu ni ties.• As sist States and lo cal i tiesin pro vid ing es sen tial ed u ca -tion and train ing.• Pro mote health care.• Fos ter in come se cu rity.• Pro vide ben e fits and ser -vices to vet er ans.• Ad min is ter jus tice.
Introduction“No other entity
in the world compares in size, scope and complexity to the U.S. Government . . .”
Man age ment’s Dis cus sion and Anal y sis
Fis cal 1999 Fi nan cial Re port of the United States Gov ern ment
Through the bud get pro cess, the Pres i dent and Con gress de -cide how much to spend and tax in any one fis cal year. The Fed -eral bud get, of course, is not the only bud get that af fects theecon omy or the Amer i can peo ple. The bud gets of State and lo calgov ern ments have an im pact as well. Fed eral Gov ern mentspend ing was a lit tle less than 19 per cent of the gross do mes ticprod uct (or GDP, which mea sures the size of the econ omy) in1999, the low est since 1966.
The Budgetand Economy

4 DIS CUS SION AND ANAL Y SIS
Continued Improvement in Fiscal Performance
Seven years ago, the Fed eral bud -get def i cit had ex ploded. It dom i nated the Gov ern ment’s abil ity to make pol -icy and im posed an in sid i ous bur denon our econ omy. In 1992, the $290bil lion def i cit was the larg est inAmer i can his tory and was pro jectedto con tinue spi ral ing up ward with outre straint. The econ omy suf fered, in -ter est rates were high and job cre ation stalled. Cap i tal that should have beenused for pro duc tive in vest ments tocre ate new jobs was used to fi nancethe Gov ern ment’s mas sive def i -cit-driven bor row ing.
In 1993, the Om ni bus Bud get Rec -on cil i a tion Act was signed. Its def i citre duc tion plan was to cut the def i cit in half as a per cent age of the econ omyin 5 years. That goal was met in only 3 years. The 1997 Bal anced Bud get Act pro posed to elim i nate the Fed eral def -i cit by fis cal 2002. In fact, it reachedits goal 4 years ahead of sched ule,pro duc ing the first bud get sur plus($69 bil lion) in a gen er a tion in 1998.
We can now look back with pride at our prog ress and ahead with con fi -dence as we con sider the suc cess ofour fis cal dis ci pline and the op por tu -nity to build upon it. To day we havelower in ter est rates, a higher level ofin vest ment and un prec e dented pros -per ity. Our econ omy has added morethan 20 mil lion new jobs. The un em -ploy ment rate is the low est in 30years; the wel fare rolls are down bymore than 50 per cent since 1993; thecore in fla tion rate is the low est in 35years; and more Amer i cans own theirhomes than at any time in our his tory.Strong eco nomic growth and pas sageof def i cit re duc tion pro grams placedthe bud get on its path to ward sur plus.
The fis cal dis ci pline we have dem -on s t ra ted , c o m bined with afast-growing econ omy and ris ingstock mar ket, con trib uted to an otheruni fied Fed eral bud get sur plus in fis -cal 1999 of $124 bil lion. That was$55 bil lion above the sur plus in fis cal1998. The sur plus rel a tive to GDPamounted to 1.4 per cent in 1999, thehigh est such ra tio in al most 50 years.Fed eral debt held by the pub lic wasre duced by more than $85 bil lion infis cal 1999 and by a to tal of al most$140 bil lion over the last 2 years.
These were the first re duc tions inpub licly held debt since 1969 and thelarg est debt re duc tions in his tory.
Re ceipts in creased by about 6 per -cent in fis cal 1999 to $1,827 bil lion.This was slower growth than the 9per cent in crease in fis cal 1998. Theslow down mainly re flected a de clinein net cor po rate tax re ceipts, the firstsince 1990, due in part to weak ness inover seas econ o mies, which damp -ened prof its of U.S. ex port ers. In di -vid ual in come and pay roll tax re -ceipts also grew more slowly in 1999but still posted a siz able 6.5 per centin crease.
Growth of out lays was held to justover 3 per cent in fis cal 1999, ris ing to$1,703 bil lion. The in crease was inline with the gain in 1998. Out lays inre la tion to GDP were the small estsince 1974, dip ping to an 18.7 per cent share from 19.1 per cent in fis cal1998.
Pushing out lays down was a dropof $13 bil lion in net in ter est pay -ments, re flect ing the shrink ing size of the Fed eral debt and the re place mentof older debt with new debt at lower
in ter est rates. Medicare pay mentsalso fell mod estly over the fis cal year.
Spending in creased for most otherma jor Fed eral Gov ern ment func tions, in clud ing de fense (up 2.4 per cent af -ter a small de cline in 1998) and So cial Se cu rity (up about 3 per cent in fis cal1999). The larg est per cent age gain byfar among the ma jor spend ing cat e go -ries was for farm price sup ports, re -flect ing large out lays of the Com mod -ity Credit Cor po ra tion in the wake ofde pressed ag ri cul tural prices.
Ac cord ing to the Fis cal Year 2001Bud get, the to tal uni fied bud get sur -pluses are pro jected to in crease eachyear through out the fore cast ho ri zonto 2010. The Ad min is tra tion is com -mit ted to us ing the bulk of the sur -pluses to strengthen and mod ern izethe So cial Se cu rity and Medicare pro -grams; in vest in key pri or i ties thatwill ex tend the eco nomic ex pan sion,such as ed u ca tion; and pay down thepub licly held debt. Un der Ad min is -tra tion pro pos als, the cur rent $3.6 tril -lion of debt held by the pub lic is pro -jected to be com pletely elim i nated ona net ba sis by 2013.
-400
-300
-200
-100
0
100
200
300
400
7 5 78 8 1 84 87 90 93 96 99 02 05 08
(In b il lions of dolla rs)
Fiscal years
“Today we have lower interest rates, ahigher level of investment and
unprecedented prosperity. ”
Fig ures for fis cal 2000-2010 are pro jected. (Fis cal 2001 Bud get)
Unified Federal Budget Surpluses and Deficits
Ac tualPro jected

DIS CUS SION AND ANAL Y SIS 5
Continued Strong Economic Performance
Fis cal 1999 was one of ac cel er at -ing eco nomic growth. The ex pan -s ion en tered i t s n in th year andmoved closer to a new re cord length. Real GDP grew by 4 .3 per centacross the four quar ters of fis cal1999, which en com passes the fourth quar ter of cal en dar 1998 through the third quar ter of cal en dar 1999. Thiswas faster than growth over the pre -vi ous fis cal year and higher than theav er age through out the ex pan sion -ary pe riod.
Growth was led by strong gains inpro duc tiv ity. Af ter trending up at anav er age an nual rate of about 1.5 per -cent from 1974 to 1995, av er age in -creases in la bor pro duc tiv ity ac cel -er a ted by more than a ful lper cent age point to 2.7 per cent overthe past 4 fis cal years. In 1999, pro -duc tiv ity growth picked up evenmore, to 3.1 per cent over the fourquar ters of the fis cal year. This is anun usu ally fa vor able per for mance atthis stage of an ex pan sion when pro -duc tiv ity growth typ i cally slowsdown from its ear lier pace. Partly, it re flects the cap i tal deep en ing that hasoc curred in re cent years due to rapidgains in busi ness in vest ment, andpartly, it may re flect im prove mentsin pro duc tion de riv ing from in for ma -tion tech nol ogy. The faster rate ofgrowth of pro duc tiv ity has in creasedover all eco nomic growth and stan -dards of liv ing, al low ing the un em -ploy ment ra te to fa l l wi th out abuildup of in fla tion ary pres sures.
Growth in con sumer spend ing andbusi ness in vest ment in cap i tal equip -ment and soft ware was very rapid infis cal 1999. Real con sumer pur chases ac cel er ated to more than 5 per centover the year to post the fast est rate ofin crease in 14 years. Higher spend ingwas fu eled by ris ing em ploy ment andin comes and higher net worths pri -mar ily due to the ris ing stock mar ket.Pri vate in vest ment in equip ment andsoft ware, which in creased at dou -ble-digit rates over the past 7 years,also ac cel er ated in fis cal 1999 and re -corded its best year of the ex pan sion,ris ing by 14.5 percent. Falling pricesfor com put ers and other high-tech
goods due to im prove ments in qual ity and pro cess ing ca pac ity con trib utedto the rapid growth in real in vest ment. A wid en ing for eign trade def i cit con -tin ued to off set strength in other sec -tors of the econ omy in fis cal 1999, al -though the drag on real GDPdi min ished over the year as ex portspicked up due to some firm ing inover seas econ o mies.
La bor mar kets re mained strong infis cal 1999. The un em ploy ment ratedrifted down from 4.5 per cent at thestart of the year to 4.2 per cent by theend of fis cal 1999, and dipped evenlower in the first quar ter of fis cal2000. These read ings were the low estin al most three de cades. The share ofthe work ing-age pop u la tion with jobsreached a re cord high, and long-termun em ploy ment fell. The econ omyadded 2.7 mil lion jobs in the fis calyear, just a bit less than an nual gainsin the prior 2 fis cal years.
The rate of in fla tion in creased infis cal 1999 due to higher oil prices,but un der ly ing in fla tion ary pres suresre mained in check even with strong
eco nomic growth and low un em ploy -ment. The ac cel er a tion in pro duc tiv -ity growth to more than 3 per centhelped to hold down costs. The Con -sumer Price In dex (CPI) rose by 2.6per cent over the fis cal year com paredwith only 1.4 per cent in fis cal 1998when oil prices fell. Ex clud ing en ergy and food, how ever, growth in con -sumer prices slowed to 2.1 per cent infis cal 1999 from 2.4 per cent in fis cal1998.
T h e F e d eral R e serve r a i s e dshort-term in ter est rates in the sec ondhalf of the fis cal year and again in fis -cal 2000. These ac tions more than re -versed ear lier eas ing moves that hadbeen un der taken in 1998 to deal withtem po rary fi nan cial tur moil both here and abroad. In rais ing rates, the Fed -eral Re serve cited con cerns that con -tin ued faster growth in eco nomic de -mand than in po ten tial sup ply couldfos ter in f la t ion ary im bal ances .Long-term in ter est rates movedhigher over the course of the fis calyear, damp en ing some what the verystrong growth in hous ing.
-1
0
1
2
3
4
5
90 91 92 93 94 95 96 97 98 99
Growth of Real GDP
Fisc al Ye ars
“The ex pan sion en tered its ninth year and moved closer to a new
re cord length.”
Per cent age change of the four quar ters of each fis cal year.

6 DIS CUS SION AND ANAL Y SIS
Improving Financial Management of the Federal Government
For the first 200 years of the U.S.Gov ern ment’s ex is tence, it did notpub lish con sol i dated fi nan cial re ports other than on a bud get ary ba sis. Much prog ress has been made in the area offi nan cial man age ment over the 3years since the ini tial au dited Con sol -i dated Fi nan cial Re port of the UnitedStates Gov ern ment. Agencies are pro -duc ing better re cords and better fi -nan cial state ments. The Year 2000(Y2K) pro cess has re sulted in bettersys tems, and the Joint Fi nan cial Man -age ment Im prove ment Pro gram( JFMIP ) cer tif i ca tion pro cess hasforced many ven dors to pro duce sys -tems that more di rectly meet Gov ern -ment re quire ments. None the less, wehave more to achieve.
His torically, ef fec tive man age ment of the U.S. Gov ern ment has beenham pered by a lack of re li able fi nan -cial in for ma tion. To help im prove thein teg rity of fi nan cial in for ma tion, in1990 the Of fice of Man age ment andBud get (OMB), the De part ment ofthe Trea sury (Trea sury) and the Gen -eral Ac count ing Of fice (GAO) es tab -lished the Fed eral Ac count ing Stan -dards Ad vi sory Board (FASAB) tode velop ac count ing stan dards for theU.S. Gov ern ment . The work of
F ASAB aug ments the ef forts of theJFMIP to strengthen over all Fed eralfi nan cial man age ment.
The stan dards de vel oped by theFASAB are now rec og nized by theAmer i can In sti tute of Cer tified Pub lic Ac coun tants (AICPA) as be ing gen -er ally ac cepted ac count ing prin ci ples(GAAP) for the Fed eral Gov ern ment. This is a ma jor ac com plish ment. Itwill en hance the ac cept abil ity of ourre ports and will add to the level of fi -nan cial pro fes sion al ism through outthe U.S. Gov ern ment.
Working to is sue agency fi nan cialre ports con sis tent with GAAP and toob tain clean au dit opin ions, the Ad -min is tra tion is com mit ted to im prov -
ing the re li abil ity of Fed eral fi nan cial in for ma tion. Achieving an un qual i -fied opin ion on the fi nan cial state -ments of Fed eral agen cies and theU.S. Gov ern ment is a first step. Un -qual i fied opin ions lead to the de vel -op ment of better fi nan cial in for ma -t ion which, when pro v ided toman age ment, will pro vide the ba sisfor pro duc ing bet ter de ci s ions.Agencies and the Gov ern ment as awhole must con tinue to work to im -ple ment sys tems that re port fi nan cialand pro gram in for ma tion quickly and re li ably, and then must use that in for -ma tion in the stew ard ship of the Na -tion’s re sources.
The ac com pa ny ing Fi nan cial Re -port is re quired by 31 U.S.C.331(e)(1) and con sists of the Man -age ment’s Dis cus sion and Anal y sis(MD&A), State ment of Op er a tionsand Changes in Net Po si tion, State -ment of Net Cost, Bal ance Sheet,Stew ard ship In for ma tion, Notes tothe Fi nan cial State ments and Sup ple -men tal In for ma tion. Each sec tion ispre ceded by a de scrip tion of its con -tents.
Basis of Accounting and Reporting Entity
The ac com pa ny ing fi nan cial state -ments gen er a l ly were pre pared based on GAAP stan dards de vel oped by FASAB. The re cent rec og ni tionof Fed eral ac count ing stan dards bythe AICPA as GAAP en hances theirac cept abil ity. These stan dards formthe foun da tion for pre par ing con sis -tent and mean ing ful fi nan cial state -ments both for in di vid ual Fed eralagen cies and the Gov ern ment as awhole.
GAAP for the Fed eral Gov ern -ment is tai lored to the U.S. Gov ern -ment’s unique char ac ter is tics andspe cial needs. For ex am ple, land notused in U.S. Gov ern ment op er a tions(stew ard ship land), weapon sys temsand sup port prop erty used in the per -for mance of mil i tary mis sions, andves sels held as part of the Na tionalDe fense Re serve Fleet (na tional de -
fense as sets) are re ported in theStew ard ship In for ma tion sec tionrather than val ued on the Bal anceSheet. The Gov ern ment’s re spon si -bil i ties and pol icy com mit ments aremuch broader than the re ported Bal -ance Sheet li a bil i ties. They in cludethe so cial in sur ance pro grams dis -closed in the Stew ard ship In for ma -tion sec tion, as well as a wide range
AccountingStandards
“Much progress
has been made
in the area of financial
management . . . ”
“The recent recognition of Federalaccounting standards by the AICPA asGAAP enhances their acceptability...”

DIS CUS SION AND ANAL Y SIS 7
The fi nan cial state ments cover the ex ec u tive branch, as well as parts ofthe leg is la tive and ju di cial branches of the U.S. Gov ern ment. A list of thesig nif i cant en ti ties in cluded in these fi nan cial state ments is in the Ap pen -dix. In for ma tion from the leg is la tive and ju di cial branches is lim ited be -cause those en ti ties are not re quired by law to sub mit com pre hen sive fi nan -cial state ment in for ma tion to Trea sury. Due to its in de pend ence, the Fed eral Re serve Sys tem is ex cluded. In ad di tion, Gov ern ment-sponsored but pri -vately owned en ter prises (such as Fed eral Home Loan Banks and the Fed -eral Na tional Mort gage As so ci a tion) are ex cluded.
Cov er age
of other pro grams un der which theGov ern ment pro vides ben e fits andser vices to the peo ple of this Nation.
Stan dards that were implementedin fis cal 1999 at the Governmentwidelevel re quire re port ing of an nual Fed -eral ex penses for stew ard ship in vest -ments. These also are ex am ples ofstan dards tai lored to the spe cial char -
ac ter is tics of the U.S. Gov ern ment.Such in vest ments in clude:
• Non-Federal phys i cal prop -erty; the Fed eral in vest ment inprop er ties owned by State andlo cal gov ern ments (e.g., high -ways and air ports).• Hu man cap i tal; in vest mentsin ed u ca tion and train ing pro -grams fi nanced by the U.S.Gov ern ment for the ben e fit ofthe pub lic.
• Re search and de vel op ment;the U.S. Gov ern ment’s in vest -
ments in ba sic and ap pliedre search and de vel op ment.
The an nual ex pense re lated to these in vest ments in cluded in the State -ment of Net Cost is sep a rately re -ported in the Stew ard ship In for ma -tion sec tion.
A new ac count ing stan dard, whichbe came ef fec tive for fis cal 1999, re -quires that de ferred main te nance bepre sented as re quired sup ple men taryin for ma tion. Re porting de ferredmain te nance high lights the re al itythat it is an ex pected cost, which hasnot been paid.
The ex cess of rev e nue over netcost fig ure (ac crual ba sis) con tainedin these fi nan cial state ments for fis -cal 1999 is $76.9 bil lion. In fis cal
1999, there was a uni fied bud get sur -plus (pri mar ily on the cash ba sis) of$124.4 bil lion. The pri mary com po -nents of the dif fer ence that have been iden ti fied are prin ci pal pay ments ofpre-credit re form loans, $32.4 bil -lion; de creases in the li a bil ity forvet eran com pen sa tion and burialben e fits, $94.9 bil lion; de creases inthe li a bil ity for mil i tary em ployeeben e fits, $31.1 bil lion; in creases in
the li a bil ity for ci vil ian em ployeeben e fits, $41.6 bil lion; in creases inen vi ron men tal li a bil i ties, $88.7 bil -lion; and, in creases in cap i tal izedfixed as sets, $41.5 bil lion. For morein for ma tion on the de tailed rec on cil -i a tion, see the Rec on cil i a tion of theEx cess of Rev e nue Over Net Cost tothe Unified Bud get Sur plus in theSup ple men tal In for ma tion sec tion.
Fi nan cialRe sults
These fi nan cial state ments ofthe U.S. Gov ern ment are pre -pared based on GAAP that re -quires us ing the ac crual ba sis of ac count ing. Un der the ac crualba sis, trans ac tions are re portedwhen the events giv ing rise tothe trans ac tions oc cur, rather
than when cash is re ceived orpaid (cash ba sis). In con trast,Fed eral bud get ary re port ing isgen er ally on the cash ba sis inac cor dance with ac cepted bud -get con cepts.
The most sig nif i cant dif fer -ence be tween these two basesin volves the tim ing of rec og ni -tion and mea sure ment of rev e -nues and costs. For ex am ple,GAAP re quires rec og ni tion of
li a bil i ties for costs re lated to en -vi ron men tal cleanup when theevents re quir ing such costs oc -cur. By con trast, cur rent bud getcon cepts rec og nize such costslater, at the time pay ment ismade. The ef fects of these dif -fer ences are re flected in theRec on cil i a tion of the Ex cess ofRev e nue Over Net Cost to theUnified Bud get Sur plus, in theSup ple men tal In for ma tion sec -tion of this Fi nan cial Re port.
Ac crual Ba sis
Ac count ingStandards, cont.

8 DIS CUS SION AND ANAL Y SIS
Revenue and Expense Summary
Rev e nue
Non-exchange rev e nue is an in flow of re sources to the Gov ern ment thatthe Gov ern ment de mands or re ceivesby do na tions. The in flows that it de -mands in clude taxes, du ties, fines and pen al ties. Non-exchange rev e nue isthe U.S. Gov ern ment’s pri marysou rce o f r ev e nue and to taled$1,822.4 bil lion in 1999. More than95 per cent of this to tal came from taxre ceipts, with the re main der com ingfrom cus toms du ties and other mis -cel la neous re ceipts.
Earned rev e nues are in flows of re -sources that arise from ex changetrans ac tions; for ex am ple, when theU.S. Gov ern ment sells goods or ser -vices to the pub lic. Dur ing 1999, theU.S. Gov ern ment earned $192.6 bil -lion in ex change rev e nue. Of theserev e nues, $182.1 bil lion is off setagainst the gross cost of the re latedfunc tions to ar rive at the func tion’snet cost. The U.S. Gov ern ment alsoearned $10.5 bil lion that was not off -set against the cost of any func tion(e.g., roy al ties on the Outer Con ti nen -tal Shelf lands).
0.9%1.3%1.4%
2.1%
3.5%72.3%
9.6%
9.0%
Corporateincome taxExcise tax
Individual incometax and tax withholdings
Unemploymenttax
MiscellaneousEstate andgift tax
Customs duties
Exchangerevenue
72.3%
0.9%
1.3%
1.4%2.1%3.5%
9.0%
9.6%
Components of Revenue by Major Source
De tail may not addto to tals due to round ing.
Expenses by Function
The net cost of U.S. Gov ern mentop er a tions was $1,756.0 bil lion for1999. Net cost rep re sents the grosscost of op er a tions less at trib ut ableearned rev e nues. The State ment ofNet Cost re flects the cost in curredto carry out the na tional pri or i tiesiden ti fied by the Pres i dent and theCon gress . T h e f u n c t i ons andsubfunctions used to ac cu mu latecosts as so ci ated with the na tionalpri or i ties are iden ti fied in the Pres i -dent’s bud get and de scribed in de -tail in the Sup ple men tal In for ma -t ion sec t ion o f th i s F i nan c ia lRe port. The ac com pa ny ing chartpres ents the per cent age of the netcost of U.S. Gov ern ment op er a tions rep re sented by each of the U.S.Gov ern ment’s ma jor func tions.
51.6%
23.5% 13.1%
6.4%
5.4%
National defense
23.5%
Interest13.1%
Human resources
51.6%
Physical resources
Other functions
5.4%
6.4%
De tail may not add to to tals due to round ing.
Net Cost by Major Function
DIS CUS SION AND ANAL Y SIS 9
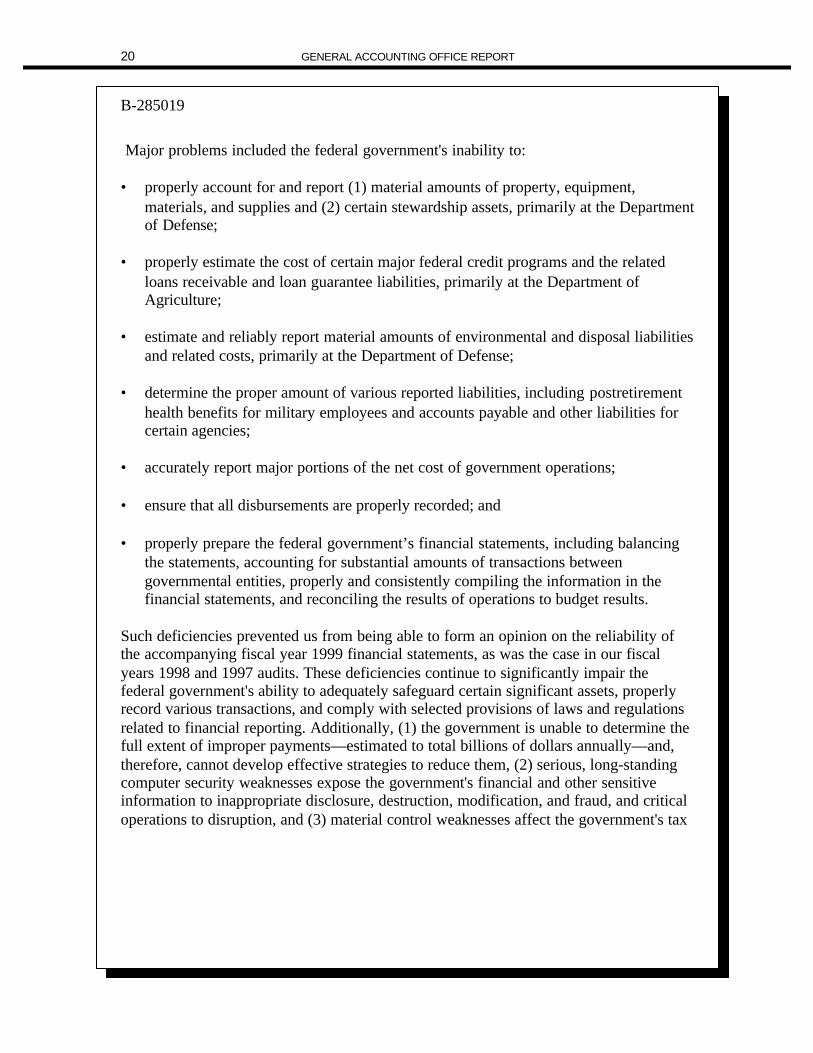
37.6%
2.4%
4.5%
0.5%1.1%1.2%
52.6%
Other liabilities
Environmental anddisposal liabilities
Accounts payable
Federal employee andveterans benefits
Benefits due and payableLoan guarantee liabilities
Federal debt heldby the public
1.1%
2.4%
4.5%
1.2%
37.6%
0.5%
52.6%
Major Categories of Liabilities
De tail may not add to to tals due to round ing.
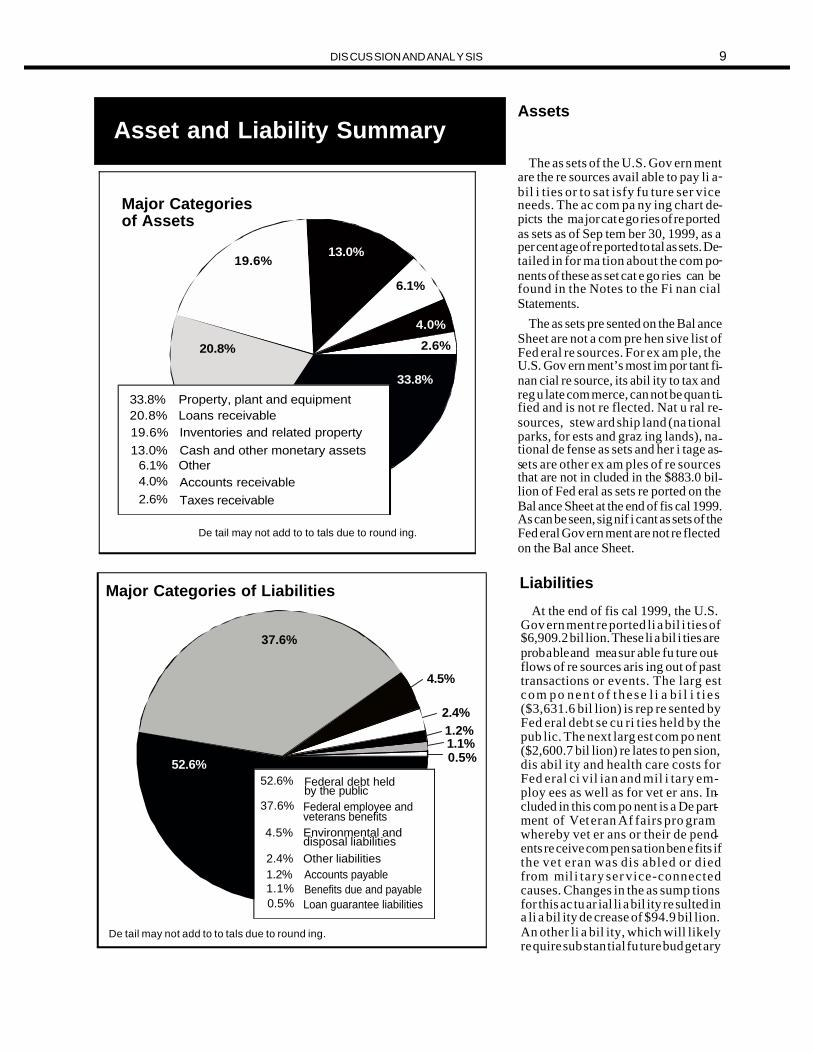
Asset and Liability SummaryAssets
The as sets of the U.S. Gov ern mentare the re sources avail able to pay li a -bil i ties or to sat isfy fu ture ser viceneeds. The ac com pa ny ing chart de -picts the ma jor cat e go ries of re portedas sets as of Sep tem ber 30, 1999, as aper cent age of re ported to tal as sets. De -tailed in for ma tion about the com po -nents of these as set cat e go ries can befound in the Notes to the Fi nan cialState ments.
The as sets pre sented on the Bal anceSheet are not a com pre hen sive list ofFed eral re sources. For ex am ple, theU.S. Gov ern ment’s most im por tant fi -nan cial re source, its abil ity to tax andreg u late com merce, can not be quan ti -fied and is not re flected. Nat u ral re -sources, stew ard ship land (na tionalparks, for ests and graz ing lands), na -tional de fense as sets and her i tage as -sets are other ex am ples of re sourcesthat are not in cluded in the $883.0 bil -lion of Fed eral as sets re ported on theBal ance Sheet at the end of fis cal 1999. As can be seen, sig nif i cant as sets of the Fed eral Gov ern ment are not re flectedon the Bal ance Sheet.
33.8%
4.0%
13.0%
6.1%
20.8%
19.6%
Loans receivableInventories and related propertyCash and other monetary assets
Property, plant and equipment
Accounts receivableTaxes receivable
19.6%20.8%
13.0%
33.8%
2.6%
6.1% Other4.0%
2.6%
Major Categoriesof Assets
De tail may not add to to tals due to round ing.
Liabilities
At the end of fis cal 1999, the U.S.Gov ern ment re ported li a bil i ties of$6,909.2 bil lion. These li a bil i ties are prob a ble and mea sur able fu ture out -flows of re sources aris ing out of pasttrans ac tions or events. The larg estcom po nen t o f these l i a b i l i t i e s($3,631.6 bil lion) is rep re sented byFed eral debt se cu ri ties held by thepub lic. The next larg est com po nent($2,600.7 bil lion) re lates to pen sion,dis abil ity and health care costs forFed eral ci vil ian and mil i tary em -ploy ees as well as for vet er ans. In -cluded in this com po nent is a De part -ment of Vet eran Af fairs pro gramwhereby vet er ans or their de pend -ents re ceive com pen sa tion ben e fits if the vet eran was dis abled or diedfrom mil i tary ser vice-connectedcauses. Changes in the as sump tionsfor this ac tu ar ial li a bil ity re sulted ina li a bil ity de crease of $94.9 bil lion.An other li a bil ity, which will likelyre quire sub stan tial fu ture bud get ary

10 DIS CUS SION AND ANAL Y SIS
re sources to liq ui date, is re lated to en vi ron men talcleanup costs as so ci ated with en vi ron men tal dam -age/con tam i na tion. As of Sep tem ber 30, 1999, the cost of clean ing up en vi ron men tal dam age/con tam i na tionacross Gov ern ment pro grams was es ti mated to be $313.2 bil lion, an in crease of $88.7 bil lion from 1998.
The ac com pa ny ing chart pres ents the per cent age of to -tal Fed eral li a bil i ties rep re sented by each of the cat e go -ries of li a bil i ties re ported on the Bal ance Sheet. Ad di -tional de tails about the U.S. Gov ern ment’s re portedli a bil i ties can be found in the Notes to the Fi nan cialState ments.
The lon ger term eco nomic andbud get out look is fa vor able—evenmore so than only a few years ago.With pru dent fis cal pol icy, the bud -get could re main in sur plus for many de cades. The Ad min is tra tion pro -jects bud get sur pluses in 2000 andthrough out the cus tom ary 10-yearbud get win dow. How ever, such pro -jec tions are in her ently un cer tain,be cause, while pru dent fis cal pol icycan safe guard our hard-earned pros -per ity, so too can reck less choices
dis si pate the ben e fits of the bud getdis ci pline that is re spon si ble for ouron go ing suc cess.
There are fore see able chal lengesthat will threaten bud get ary sta bil ity in the 21st cen tury. In less than 10years, the “baby-boomers”—thelarge gen er a tion born be tween 1946and 1964—will be come el i gi ble forearly re tire ment un der So cial Se cu -rity. In the space of two de cades, theel derly’s share of the U.S. pop u la -tion will jump from around 13 per -
cen t t o 21 pe r cen t . Th i s de mo -graphic bulge will put pres sure ont h e F e d eral b u d ge t th roughMedicare and So cial Se cu rity. Fis -cal dis ci pline—pay ing down thedebt and re duc ing or elim i nat ing in -ter es t pay ments—im proves thelong-run bud get bal ance. Ad di tional re forms such as the Ad min is tra tionpro pos als de scribed be low, will beneeded to strengthen So cial Se cu -rity and Medicare. Ad di tional in for -ma tion on re ceipt and out lay es ti -mates can be found in the Cur rentSer vices As sess ment in the Stew -ard ship In for ma tion sec tion of thisFi nan cial Re port.
Long-term Bud get ary Out look
Two trust funds have been es tab lished to fi nance theMedicare pro gram. The Medicare Part A Hos pi tal In sur -ance Trust Fund is fi nanced by a 2.9 per cent tax on wagesand sal a ries re quired to be paid equally by em ploy ees andem ploy ers. The Medicare Part B Sup ple men tary Med i calIn sur ance Trust Fund re ceives pre mium pay ments on be -half of Medicare ben e fi cia ries who have elected cov er age. The Bal anced Bud get Act of 1997 pro vides that theMedicare Part B pre mium is set at a level that will cover25 per cent of pro gram costs. The re main der of the pro -gram cost is funded by con gres sio nal ap pro pri a tions.
The 1999 Trustees’ An nual Re port pro jects that theMedicare Part A Trust Fund’s as sets will be de pleted by2015 us ing in ter me di ate or “best es ti mate” as sump tions.The Ad min is tra tion has pro posed changes that will ex tend that date by at least a de cade to at least 2025. Ad di tionalin for ma tion about the Medicare pro gram can be found inthe Stew ard ship In for ma tion sec tion of this Fi nan cial Re -port. At the time this re port was pre pared, the 2000Trustees’ An nual re port was sched uled to be re leased onMarch 30, 2000. It’s re vised es ti mates will dif fer fromthose re ported the pre vi ous year, which have been in -cluded in this Fi nan cial Re port.
Fi nan cial Con di tion of the Medicare Trust Funds
Fi nan cial Con di tion of the So cial Se cu rity Trust Funds
Two trust funds have been es tab -lished by law to fi nance the So cialSe cu rity pro gram (OASDI): Fed eralOld-Age and Sur vi vors In sur ance(OASI) and Fed eral Dis abil ity In sur -ance (DI). OASI pays re tire ment andsur vi vors ben e fits and DI pays ben e -fits af ter a worker be comes dis abled.OASDI rev e nues con sist pri mar ily
of taxes on earn ings that are paid byem ploy ees, their em ploy ers and theself-employed. OASDI also re ceives rev e nue from tax a tion of some So -cial Se cu rity ben e fits. Rev e nues thatare not needed to pay cur rent ben e -fits or ad min is tra tive ex penses arein vested in Trea sury se cu ri ties toearn in ter est for the trust funds. The
Board of Trustees of the OASI andDI Trust Funds pro vides the Pres i -dent and the Con g r e s s w i t hshor t - range (10 years ) andlong-range (75 years) ac tu ar ial es ti -mates of each trust fund. Be cause ofthe in her ent un cer tainty in es ti matesfor as long as 75 years into the fu -ture, the So cial Se cu rity Trustees

DIS CUS SION AND ANAL Y SIS 11
use three al ter na tive sets of eco -nomic and de mo graphic as sump tionsto show a range of pos si bil i ties. Mostan a lysts use the Trustees’ in ter me di -ate or “best es ti mate” set of as sump -tions to eval u ate the fi nan cial con di -tion of the So cial Se cu rity pro gram.
Un der cur rent leg is la tion and us ing in ter me di a te a s sump tions, theTrustees es ti mated in their 1999 re -port, re leased on March 30, 1999, that by 2014 cash dis burse ments for thepro grams will ex ceed cash re ceiptsand by 2034 the com bined trust fundas sets, pri mar ily in vest ments in Trea -sury se cu ri ties, will be ex hausted.With no change in the pro gram, in2014 the trust funds are ex pected tobe gin us ing in ter est on their in vest -ments to cover the cash short fall andto pay ben e fits. Starting in 2022, they
would be gin re deem ing their in vest -ments in Trea sury se cu r i t ies topro vide the needed fund ing. In 2034,trust fund as sets would be ex hausted;at that time, ded i cated tax rev e nueswould be suf fi cient to pay only ap -prox i mately 71 per cent of the ben e fits due. At the time this re port was pre -pared, the Trustees’ An nual Re portwas sched uled to be re leased on
March 30, 2000. Its re vised es ti mates will dif fer from those re ported thepre vi ous year, which have been in -cluded in this Fi nan cial Re port.
The Ad min is tra tion has pro posedplans that would ex tend the life of the trust funds to at least 2050, and in -tends to work with Con gress on a bi -par ti san ba sis to en act long-term So -cial Se cu rity sol vency and re form.Acting sooner rather than later to ad -dress the long-term fi nanc ing needsof the pro gram will make the re -quired changes less se vere and dis -rup tive and en sure that So cial Se cu -ri ty works as well for fu t u r egen er a tions as it has for past gen er a -tions. Ad di tional in for ma tion aboutthe So cial Se cu rity pro gram can befound in the Stew ard ship In for ma tion sec tion of this Fi nan cial Re port.
Im proving Gov ern ment Man age ment Over all
In ad di tion to im prov ing fi nan cialman age ment, the Fed eral Gov ern -ment has in re cent years de votedsub stan tial ef forts to im prov ingother ar eas of man age ment. Theseef forts are es tab lished and re portedan nu ally by OMB as Pri or ity Man -age ment Ob jec tives (PMOs). Co or -di nated, sus tained and in ten siveman age ment ini tia tives have beende signed to ad dress the is sues in theac com pa ny ing text.
Real prog ress has been made toim prove pro gram im ple men ta tionand ex e cu tion through out the Gov -ern ment, on both a Governmentwideand agency-specific ba sis. For ex am -ple:
Man aging the Year 2000 (Y2K)com puter prob lem . The Ad min is tra -tion’s first and fore most man age -ment ob jec tive was to re solve theY2K com puter prob lem. Y2K posedthe sin gle larg est tech nol ogy man -age ment chal lenge in his tory. TheFed eral Gov ern ment’s tran si tionthrough the date change was, be yond all ex pec ta tions, re mark ably trou blefree.
Mod ern izing stu dent aid de liv ery.Sig nif i cant prog ress was made mod -ern iz ing stu dent aid ben e fit de liv ery
by ex pand ing elec tronic ac cess toben e fits and ser vices and re form ingcon tract ing, sys tems de vel op ment,and pro gram over sight prac tices.The new per for mance-based or ga ni -za tion, cre ated in 1998, hired a chiefop er at ing of fi cer, as sessed cus tomerneeds, de vel oped a sys tems mod ern -iza tion blue print, is sued a 5-yearper for mance plan and re or ga nizedthe staff into three ser vice-orientedchan nels for stu dents, schools and fi -nan cial in sti tu tions.
Reengineering the nat u ral iza tionpro cess and re duc ing the cit i zen shipap pli ca tion back log. The De part -ment of Jus tice’s Im mi gra tion andNat u ral iza tion Ser vice (INS) re de -signed its nat u ral iza tion pro cess tostream line and au to mate op er a tions,and si mul ta neously re duced a back -log of more than 1.8 mil lion ap pli ca -tions for cit i zen ship. In 1999, INS re -
duced the back log by more than500,000 ap pli ca tions, and the av er -age pro cess ing time be tween ap pli -ca tion and nat u ral iza tion of qual i -fied can di dates has been re ducedf rom 27 months in 1998 to 12months in 1999. INS ex pects per for -mance to im prove fur ther.
Im proving man age ment of the de -cen nial cen sus. The Bu reau of theCen sus in the De part ment of Com -merce en sured that the nec es sarysup port struc ture—which in cludesopen ing data cap ture cen ters, re -gional cen sus of fices and lo cal cen -sus of fices; print ing forms; es tab -lish ing a tele phone ques tion naireas sis tance pro gram; print ing lan -guage as sis tance guides; and re cruit -ing and train ing tem po rary cen suswork e rs—was es t ab l i shed andtested and ready for op er a tion.
“Co or di nated, sus tained and in ten siveman age ment ini tia tives have been de signed
to address the issues . . . ”
“The Ad min is tra tion
has pro posed plans
that would ex tend the
life of the trust funds
to at least 2050 . . .”

12 DIS CUS SION AND ANAL Y SIS
Strengthening Governmentwide Man age ment
1. Use per for mance in for ma tion to im prove pro gram man age ment and make better bud get de ci sions.
2. Im prove fi nan cial man age ment in for ma tion.
3. Use cap i tal plan ning and in vest ment con trol to better man agein for ma tion tech nol ogy.
4. Pro vide for com puter se cu rity and pro tect crit i cal in for ma tionin fra struc ture.
5. Strengthen sta tis ti cal pro grams.
6. Im ple ment ac qui si tion re forms.7. Im ple ment elec tronic Gov ern ment ini tia tives.
8. Better man age Fed eral fi nan cial port fo lios.
9. Align Fed eral hu man re sources to sup port agency goals.
10 . Ver ify that the right per son is get ting the right ben e fit.11 . Stream line and sim plify Fed eral grant man age ment.12 . Cap i tal ize on Fed eral en ergy ef fi ciency.
Im proving Pro gram Im ple men ta tion
13. Mod ern ize stu dent aid de liv ery.
14 . Im prove the De part ment of En ergy’s (DOE’s) pro gram and con tract man age ment.
15 . Strengthen the Health Care Fi nancing Ad min is tra tion’s(HCFA’s) man age ment ca pac ity.
16 . Im ple ment Housing and Hu man De vel op ment (HUD) re form.
17. Re form man age ment of In dian Trust Funds.
18 . Im ple ment Fed eral Avi a tion Ad min is tra tion (FAA) man age ment re forms.
19 . Im ple ment In ter nal Rev e nue Ser vice (IRS) re forms.20 . Stream line the So cial Se cu rity Ad min is tra tion’s (SSA’s)
dis abil ity claims pro cess.21 . Rev o lu tion ize De part ment of De fense (DOD) busi ness af fairs.22 . Man age risks in build ing the In ter na tional Space Sta tion.
23 . Im prove se cu rity at dip lo matic fa cil i ties around the world.
24 . Reengineer the nat u ral iza tion pro cess and re ducethe cit i zen ship ap pli ca tion back log.
Sys tems,Con trolsand Le galCom pli ance
The Fed eral Gov ern mentfaces daunt ing prob lems inmod ern iz ing its fi nan cial man -age ment sys tems. Changingtech nol ogy, as well as chang -ing in for ma tion needs, are oc -cur ring so rap idly that tech nol -ogy ad vances in to day’ssys tems be come ob so lete withiden ti fi ca tion of new data andsys tems re quire ments. Thecor ner stone of sound fi nan cialman age ment , as well asperformance mea sure ment, isac cu rate, timely and use ful in -for ma tion. Many Fed eral fi -nan cial sys tems are sim plyun able to pro vide the dataneeded to man age pro gramsand make good de ci sions. TheGov ern ment needs to up gradeand re place many of its fi nan -cial man age ment sys tems.
The Fed eral Fi nan cial Man -age ment Im prove ment Act(FFMIA) pointed out that thede vel op ment of fi nan cial man -age ment sys tems that sup portGAAP will im prove Fed eralfi nan cial man age ment. Im -prove ment in fi nan cial sys -tems de pends upon: (1) an en -vi ron ment in which fi nan cialman age ment sys tems can besuc cess fully planned, de vel -oped, op er a ted and main -tained; (2) Governmentwidesys tems re quire ments that sup -port in for ma tion stan dards;and (3) the avail abil ity of sys -tems that meet the Gov ern-mentwide sys tems re quire -ments ar tic u lated in FFMIA.FFMIA sup ports and com ple -ments the Chief Fi nan cial Of -fi cers (CFO) Act, the Gov ern -ment Per fo r mance a n dRe sults Act, and the Gov ern -ment Man age ment Re formAct. It es tab lishes in stat utecer tain fi nan cial man age mentsys tem re quire ments that are
Pri or ity Man age ment Objectives

DIS CUS SION AND ANAL Y SIS 13
al ready es tab lished by the ex ec u tive branch. Spe cifically, Fed eral sys -tems must com ply with Fed eral Fi -nan cial Man age ment Sys tems re -quire ments, Fed eral Ac count ingStan dards and the Stan dard Gen eralLed ger, at the trans ac tion level.
The CFO Coun cil, OMB, Trea -sury, the Joint Fi nan cial Man age -men t Im prove ment P r o gram(JFMIP) and Fed eral agen cies areall work ing to im ple ment crit i calim prove ments to Fed eral fi nan cialman age ment sys tems in six ar eas:(1) plan ning and in vest ment; (2)Governmentwide and agency fi nan -
cial man age ment sys tems in fra -struc tures; (3) com pre hen sive datare quire ments; (4) com pre hen sivefunc tional re quire ments; (5) in dus -try part ner ships; and (6) sys tems de -ploy ment.
This past year, JFMIP im ple -mented a pro gram of com pre hen -sive test ing of ven dor core sys temsto de t e r mine com p l i ance wi thJFMIP stan dards. Nine sys tems in -volv ing seven ven dors have passedthe rig or ous tests. Only those sys -tems cer ti fied by JFMIP as com pli -ant may be pur chased by pro gramagen cies as of Oc to ber 1, 1999.
Nu mer ous strong in ter nal con -trols ex ist over Fed eral as sets.These con trols in clude the ex is -tence of a stat u tory bud get and cen -tral ized cash man age ment, debt and dis burse ment func tions. In ad di -tion, Trea sury’s Fi nan cial Man age -ment Ser vice (FMS) pub lishes the“Monthly Trea sury State ment ofRe ceipts and Out lays of the UnitedStates Gov ern ment” (MTS), a sum -mary s ta te ment pre pared f romagency ac count ing re ports. TheMTS pres ents the re ceipts, out lays,re sult ing bud get sur plus or def i cit,and Fed eral debt for the month andthe fis cal year-to-date and com -pares those fig ures to the same pe -riod in the pre vi ous year.
Fi nan cial Man age ment Chal lenges
GAO has re ported that se ri ous fi -nan cial man age ment im prove mentchal lenges face the U.S. Gov ern ment. The cen tral chal lenge to pro duc ingre l i able, use ful and t imely datathrough out the year and at yearend isover haul ing fi nan cial and re latedman age ment in for ma tion sys tems.Agencies also must ad dress prob lemswith fun da men tal recordkeeping, in -com plete doc u men ta tion and weakin ter nal con trols be fore their sys temscan pro duce re li able in for ma tion onan on go ing ba sis.
Au dits of agency fi nan cial state -ments dis close de fi cien cies that im -pede com pli ance with GAAP and, ac -cord ingly, im proved f i nan cialman age ment. As a re sult, de spiteprog ress over the past year, GAOagain was un able to ren der an opin ion on the re l i abi l i ty o f t h eGovernmentwide fi nan cial state -ments. The fol low ing ex hibit il lus -trates agency prog ress to ward un -qual i fied au dit opin ions on theirfi nan cial state ments. (Au dits for all of the 24 ma jor agen cies were not re -quired un til fis cal 1996.)
In 1996, only six agen cies wereable to ob tain clean opin ions. In 1999, 13 (and ul ti mately per haps as many as 15) agen cies re ceived clean opin ions
and 4 oth ers re ceived qual i fied opin -ions. This leaves only five agen cieswith dis claimed opin ions, a con di tion where the au di tors are un able to ren -der an opin ion, gen er ally be cause ofde fi cien cies in the ac count ing re -cords. How ever, in a few cases, agen -cies could not pre pare their fi nan cialstate ments in time for the au dits to becom pleted within the March 1timeframe. A to tal of seven agen ciesmade some im prove ment in their au -dit opin ions and four more than lastyear sub mit ted their state ments by the due date. While ef forts have beensub stan tial and there has been realprog ress, the task is ex tremely largeand has been ham pered by Y2K work
re ceiv ing the bulk of sys tems re -sources in 1999. Ad di tional prog ressis ex pected in 2000.
While prog ress has been made, re -cent au dits dis closed that ma jor agen -cies con tinue to have se ri ous short -com ings in fi nan cial man age mentre port ing and sys tems that pre cludetheir fi nan cial re ports from be ing au -dited and re ceiv ing un qual i fied opin -ions. These agen cies must sat is fac to -rily ad dress these prob lems in or derto re ceive an un qual i fied opin ion ontheir fi nan cial state ments and for theU.S. Gov ern ment to re ceive an un -qual i fied opin ion on its fi nan cialstate ments.
With re spect to intragovernmentaltrans ac tions, the chal lenge per tains to iden ti fy ing and elim i nat ing trans ac -tions be tween agen cies. The au dits ofthe U.S. Gov ern ment’s fi nan cialstate ments for fis cal 1997 through1999 dis closed that agen cies couldnot ef fec tively iden tify trans ac tionswith other agen cies so they could beelim i nated for Governmentwide re -port ing. If these trans ac tions are notprop erly elim i nated, to tal U.S. Gov -ern ment as sets, li a bil i ties, rev e nuesand ex penses will be mis stated by theamount of these trans ac tions.
“While ef fortshave been
sub stan tial andthere has beenreal prog ress,
the task is ex tremelylarge . . .”
Con trols and Com pli ance, cont.

14 DIS CUS SION AND ANAL Y SIS
CFO Act Agency Audit Opinions on Financial Statements
Agency 1996 1997 1998 1999
USDA
Com merceDOD
Ed u ca tion
DOEHHS
HUDDOI ?DOJ
DOL
State ?DOT
Trea suryVA
AID
EPAFEMA
GSANASA
NRC
NSF
OPM
SBA
SSATo tal
un qual i fied 6 11 12 13
Un qual i fied opin ions
Qual ifiedopin ions
Opin ion dis claim ers
? Agencies that havenot yet filed.
Dur ing fis cal 1999, Trea sury con -t in ued to fo c u s o n r e solv ingintragovernmental trans ac tion is -sues. For fi du ciary bal ances to tal ingover $2 tril lion in volv ing the Bu reauof the Pub lic Debt and the Fed eralFi nancing Bank, vir tu ally all of theac count ing dif fer ences have beenex plained so that these trans ac tionscan be elim i nated. Prog ress also hasbeen made re gard ing intragovern-men tal buy ing and sell ing trans ac -tions by us ing a re vised elim i na tionmeth od ol ogy, but work re mains tobe done in this area.
Trea sury con tin ues to as sist agen -cies in rec on cil ing their fund bal ance amount with the amount re ported byTrea sury. Dur ing this past year, Trea -sury is sued pol icy state ments andguide lines for ac com plish ing therec on cil i a tion. Rec on cil i a tion is anon go ing ac count ing func tion, andagen cies have made sig nif i cantstrides to in sti tu tion al ize the pro cess.
Ad di tionalInformation
Ad di tional de tails about the in for ma tion con tained in these fi nan cialstate ments can be found in the fi nan cial state ments of the in di vid ualagen cies listed in the Ap pen dix. In ad di tion, re lated U.S. Gov ern mentpub li ca tions such as the “Bud get of the United States Gov ern ment,” the“Trea sury Bul le tin,” the “Monthly Trea sury State ment of Re ceipts andOut lays of the United States Gov ern ment,” the “Monthly State ment ofthe Pub lic Debt of the United States,” and the Trustee’s re ports for the So -cial Se cu rity and Medicare pro grams may be of in ter est.
Chal lenges,cont.

GENERAL ACCOUNTING OFFICE REPORT 15
B-285019
March 28, 2000
The PresidentThe President of the SenateThe Speaker of the House of Representatives
Implementation of important legislative reforms remains underway to promote greateraccountability in managing the finances of our national government. These reformsinclude requirements for annual audited financial statements for 24 major departmentsand agencies as well as preparation of the financial statements of the U.S. government,which GAO is required to audit. The report on our audit of these financial statements forfiscal year 1999 is enclosed.
These financial reporting requirements are prompting steady improvements in federalfinancial accountability, and there has been progress toward meeting the relatedlegislative objectives. The President has designated financial management improvementas a priority management objective and efforts are underway across government toaddress the pervasive, generally long-standing financial management problems discussedin our accompanying report. Thus far, 13 of 24 major agencies have received unqualifiedopinions on their fiscal year 1999 financial statements and others have resolved certainpreviously reported financial statement deficiencies. For example, the Department ofEnergy resolved its previously reported deficiency related to its environmental anddisposal liability associated with nuclear weapons. Also, in October 1999, the AmericanInstitute of Certified Public Accountants recognized federal accounting standards as agenerally accepted basis of accounting, which represents a major milestone for thefederal government.
At the same time, several major departments are not yet able to produce auditablefinancial statements on a consistent basis. There are several major obstacles toovercome, both at the agency level and in preparing reliable financial statements for theU.S. government. The deficiencies discussed in our accompanying report prevented usfrom being able to form an opinion on the reliability of the accompanying fiscal year1999 financial statements, as was the case in our fiscal years 1998 and 1997 audits.These deficiencies continue to significantly impair the federal government's ability to

GENERAL ACCOUNTING OFFICE REPORT16
B-285019
adequately safeguard certain significant assets, properly record various transactions, andcomply with selected provisions of laws and regulations related to financial reporting.Additionally, (1) the government is unable to determine the full extent of improperpayments—estimated to total billions of dollars annually—and therefore cannot developeffective strategies to reduce them, (2) serious, long-standing computer securityweaknesses expose the government's financial and other sensitive information toinappropriate disclosure, destruction, modification, and fraud, and critical operations todisruption, and (3) material control weaknesses affect the government's tax collectionactivities.
The executive branch recognizes that, because of the extent and severity of the financialmanagement deficiencies, addressing them will require concerted improvement effortsacross government. With a concerted effort, the federal government, as a whole, cancontinue to make progress toward achieving accountability and generating reliablefinancial and management information on a timely basis and in an ongoing manner.Annual financial audits represent an important means to assure continued progress inconnection with improving federal financial management.
While obtaining unqualified “clean” audit opinions on federal financial statements is animportant objective, it is not an end in and of itself. The key is to take steps tocontinuously improve internal control and underlying financial and managementinformation systems as a means to assure accountability, increase the economy, improvethe efficiency, and enhance the effectiveness of government. These systems mustgenerate timely, accurate, and useful information on an ongoing basis, not just as of theend of the fiscal year. Unfortunately, for fiscal year 1999, the financial managementsystems of almost all agencies were again found not to be in substantial compliance withthe requirements of the Federal Financial Management Improvement Act of 1996. Inaddition, while some attention to delineating core competencies and training hasoccurred, a great deal more needs to be done to improve financial management humancapital.
Reliable financial information is essential for analyzing the government’s financialcondition and helping inform budget deliberations by providing additional informationbeyond that provided in the budget. The budget of the federal government is primarilyformulated on a cash basis, which also is generally the basis for calculating the annualbudget surplus or deficit. The financial statements are prepared generally on the accrualbasis of accounting. The most significant difference between the budget and accrualbasis of accounting is the timing of recognition and measurement of revenues and costs.

GENERAL ACCOUNTING OFFICE REPORT 17
B-285019
Accrual information can be used with budgetary information to provide a valuableperspective on the costs of agency programs and the government’s assets and long-termcommitments. This is especially important given current demographic trends and thefiscal challenges that will result.
Last year we discussed the Year 2000 challenge in our report. The federal governmenthas met the “date change” challenge. The leadership exhibited by the legislative andexecutive branches and the partnerships formed by a myriad of public, private, andinternational organizations were critical factors behind this success.
The accompanying Financial Report and our report include certain informationconcerning the Social Security and Medicare (Part A) trust funds, such as projectedcontributions and expenditures, dates when expenditures are expected to exceedcontributions, and dates when such funds are expected to be exhausted. Such informationis as of January 1, 1999 for Social Security and as of September 30, 1999 for Medicare(Part A), the most recent information publicly reported by the government. Thegovernment plans to issue, on March 30, 2000, updated information as of January 1,2000. The government’s issuance of dated information in this Financial Report at aboutthe same time that it issues more current information may cause confusion to theCongress and the public. Steps should be taken, in future years, to ensure that thegovernment’s Financial Report contains up-to-date information as of no earlier than theend of the most recent fiscal year. Because current information on the solvency of theSocial Security and Medicare programs is critical to assessing the financial condition ofthe federal government, aiding in budget deliberations, and fostering public debate, wewill include the updated information on these two important federal programs in a reportthat will also contain the Fiscal Year 1999 Financial Report of the United StatesGovernment.
We appreciate the cooperation and assistance we received from the Chief FinancialOfficers and Inspectors General throughout government, as well as Department of theTreasury and Office of Management and Budget officials, in carrying out ourresponsibility to audit the government’s financial statements. We look forward tocontinuing to work with these officials and the Congress to achieve the goals andobjectives associated with financial management reform.

GENERAL ACCOUNTING OFFICE REPORT18
B-285019
Our report was prepared under the direction of Jeffrey C. Steinhoff, Acting AssistantComptroller General for Accounting and Information Management, and Robert F. Dacey,Director, Consolidated Audit and Computer Security Issues. If you have any questions,please contact me on (202) 512-5500 or them on (202) 512-3317.
David M. WalkerComptroller Generalof the United States

GENERAL ACCOUNTING OFFICE REPORT 19
B-285019
The PresidentThe President of the SenateThe Speaker of the House of Representatives
The Secretary of the Treasury, in coordination with the Director of the Office ofManagement and Budget (OMB), is required to annually submit financial statements forthe U.S. Government to the President and the Congress.1 GAO is required to audit thesestatements. This is our report on our audit of the financial statements of the U.S.government for fiscal year 1999.2
In summary, certain significant financial systems weaknesses, problems withfundamental recordkeeping and financial reporting, incomplete documentation, and weakinternal control, including computer controls, continue to prevent the government fromaccurately reporting a significant portion of its assets, liabilities, and costs. Some ofthese deficiencies primarily relate to specific major agencies; others, such asintragovernmental transactions, affect the entire government. These deficiencies affectthe reliability of the accompanying financial statements and much of the relatedinformation in the Fiscal Year 1999 Financial Report of the United States Government, aswell as the underlying financial information. They also affect the government's ability toaccurately measure the full cost and financial performance of certain programs andeffectively manage related operations.
1The Government Management Reform Act of 1994 requires such reporting beginning with financialstatements prepared for fiscal year 1997.
2Our report on the fiscal year 1998 financial statements is entitled Financial Audit: 1998 Financial Reportof the United States Government (GAO/AIMD-99-130, March 31, 1999).
20 GENERAL ACCOUNTING OFFICE REPORT
B-285019
Major problems included the federal government's inability to:
• properly account for and report (1) material amounts of property, equipment,materials, and supplies and (2) certain stewardship assets, primarily at the Departmentof Defense;
• properly estimate the cost of certain major federal credit programs and the relatedloans receivable and loan guarantee liabilities, primarily at the Department ofAgriculture;
• estimate and reliably report material amounts of environmental and disposal liabilitiesand related costs, primarily at the Department of Defense;
• determine the proper amount of various reported liabilities, including postretirementhealth benefits for military employees and accounts payable and other liabilities forcertain agencies;
• accurately report major portions of the net cost of government operations;
• ensure that all disbursements are properly recorded; and
• properly prepare the federal government’s financial statements, including balancingthe statements, accounting for substantial amounts of transactions betweengovernmental entities, properly and consistently compiling the information in thefinancial statements, and reconciling the results of operations to budget results.
Such deficiencies prevented us from being able to form an opinion on the reliability ofthe accompanying fiscal year 1999 financial statements, as was the case in our fiscalyears 1998 and 1997 audits. These deficiencies continue to significantly impair thefederal government's ability to adequately safeguard certain significant assets, properlyrecord various transactions, and comply with selected provisions of laws and regulationsrelated to financial reporting. Additionally, (1) the government is unable to determine thefull extent of improper payments—estimated to total billions of dollars annually—and,therefore, cannot develop effective strategies to reduce them, (2) serious, long-standingcomputer security weaknesses expose the government's financial and other sensitiveinformation to inappropriate disclosure, destruction, modification, and fraud, and criticaloperations to disruption, and (3) material control weaknesses affect the government's tax

GENERAL ACCOUNTING OFFICE REPORT 21
B-285019
collection activities. Further, the financial management systems of almost all agencieswere again found not to be in substantial compliance with the requirements of the FederalFinancial Management Improvement Act of 1996.
Our audit and the Inspectors General (IG) audits of major component agencies' financialstatements for fiscal year 1999 continue to result in (1) an identification and analysis ofdeficiencies in the government's recordkeeping, financial reporting, and control systemsand (2) recommendations to correct them. Fixing these problems represents a significantchallenge because of the size and complexity of the government and the discipline andhuman capital needed to follow sound financial management and reporting practices.
This report provides our (1) disclaimer of opinion on the government's fiscal year 1999financial statements, (2) report on internal control, and (3) report on compliance withselected provisions of laws and regulations related to financial reporting. It also providesillustrations of the identified material deficiencies. A more complete discussion of theseissues may be found in individual agency reports. Additionally, the report highlightscertain long-term financing issues facing government. The objectives, scope, andmethodology of our work are discussed in the appendix to this report. We provided adraft of this report to Department of the Treasury and OMB officials, who expressed theircommitment to address the deficiencies this report outlines. We did our work inaccordance with generally accepted government auditing standards.
DISCLAIMER OF OPINION
Because we were unable to determine the reliability of significant portions of theaccompanying financial statements for the reasons outlined above and described in moredetail below, we are unable to, and we do not, express an opinion on the accompanyingfiscal year 1999 financial statements.
Because of the serious deficiencies in the government’s systems, recordkeeping,documentation, financial reporting, and controls, readers are cautioned that amountsreported in the financial statements and related notes may not be a reliable source ofinformation for decision-making by the government or the public. These deficienciesalso affect the reliability of information contained in the accompanying Management'sDiscussion and Analysis and any other financial management information--includinginformation used to manage the government day-to-day and certain budget informationreported by agencies--which is taken from the same data sources as the financialstatements.

22 GENERAL ACCOUNTING OFFICE REPORT
B-285019
Further, while we have not audited and do not express an opinion on the StewardshipInformation, Supplemental, or Other Information included in the accompanying FinancialReport, we noted certain material omissions related to the presentation of nationaldefense assets and issues related to the reconciliation of the results of operations tobudget results, which are discussed below.
The accompanying Financial Report and our report include certain informationconcerning the Social Security and Medicare (Part A) trust funds, such as projectedcontributions and expenditures, dates when expenditures are expected to exceedcontributions, and dates when such funds are expected to be exhausted. Such informationis as of January 1, 1999 for Social Security and as of September 30, 1999 for Medicare(Part A), the most recent information publicly reported by the government. Thegovernment plans to issue, on March 30, 2000, updated information as of January 1,2000. The government’s issuance of dated information in this Financial Report at aboutthe same time that it issues more current information may cause confusion to theCongress and the public. Steps should be taken, in future years, to ensure that thegovernment’s Financial Report contains up-to-date information as of no earlier than theend of the most recent fiscal year. Because current information on the solvency of theSocial Security and Medicare programs is critical to assessing the financial condition ofthe federal government, aiding in budget deliberations, and fostering public debate, wewill include the updated information on these two important programs in a report that willalso contain the Fiscal Year 1999 Financial Report of the United States Government.
Material Deficiencies
The following sections describe material deficiencies that contribute to our disclaimer ofopinion, discuss their effects on the financial statements and the management ofgovernment operations, and highlight certain corrective actions. Although the federalgovernment has made steady progress, the fundamental nature of these deficienciesremains unchanged from our fiscal year 1998 and 1997 financial statement reports. Eachof these deficiencies also constitutes a material weakness in internal control.3
3 A material weakness is a condition in which the design or operation of one or more of theinternal control components does not reduce to a relatively low level the risk that errors, fraud, ornoncompliance in amounts that would be material to the financial statements may occur and notbe detected on a timely basis by employees in the normal course of performing their duties.

GENERAL ACCOUNTING OFFICE REPORT 23
B-285019
Property, Plant, and Equipment and Inventories and Related Property
The federal government--one of the world's largest holders of physical assets—does nothave adequate systems and controls to ensure the accuracy of information about theamount of assets held to support its domestic and global operations. A majority of the$472 billion of these reported assets is not adequately supported by financial and/orlogistical records. Assets that are not adequately supported include: (1) buildings,structures, facilities, and equipment, (2) various government-owned assets that are in thehands of private sector contractors, and (3) operating materials and supplies comprisedlargely of ammunition, defense repairable items, and other military supplies. Also, thegovernment cannot ensure that all assets are reported. For example, no Department ofDefense (DOD) contractor-held personal property was reported. Further, nationaldefense asset unit information reported as Stewardship Information was incompletebecause (1) it did not include major national defense support equipment, such asuninstalled engines and communications equipment, and (2) amounts were reported inunits, rather than in dollars as required by current generally accepted accountingprinciples. DOD, the largest holder of these assets, has acknowledged the challenges itfaces to implement effective systems and accurately record data to properly account forand report its physical assets and has a number of initiatives underway that are intendedto address this problem. These initiatives are expected to span several years.
Because the government lacks complete and reliable information to support its assetholdings, it could not satisfactorily determine that all assets were included in the financialstatements, verify that reported assets actually exist, or substantiate the amounts at whichthey were valued. For example, periodic physical counts have shown that inventoryrecords contain significant error rates. Further, weak controls significantly impair thegovernment’s ability to detect and investigate fraud or theft of assets.
Accurate asset information is necessary for the government to (1) know the assets it ownsand their location and condition, (2) safeguard its assets from physical deterioration,theft, or loss, (3) account for acquisitions and disposals of such assets, (4) preventunnecessary storage and maintenance costs or purchase of assets already on hand, and (5)determine the full costs of government programs that use these assets.

24 GENERAL ACCOUNTING OFFICE REPORT
B-285019
Loans Receivable and Loan Guarantee Liabilities
As of the end of fiscal year 1999, the government reported $184 billion of loansreceivable and $35 billion of liabilities for estimated losses related to estimated futuredefaults of guaranteed loans. Certain federal credit agencies, responsible for significantportions of the government’s lending programs, were unable to properly estimate the costof these programs in accordance with generally accepted accounting principles andbudgeting requirements. As an example, the Department of Agriculture, whichrepresents a significant portion of loans receivable, could not estimate the net loanamounts expected to be collected because it does not maintain some of the key historicaldata needed to predict borrower behavior, such as the amount and timing of futuredefaults and prepayments. Agriculture’s lack of historical data is largely the result ofsystem inadequacies. Certain affected agencies are in the process of implementing actionplans intended to develop reliable loan and loan guarantee information. Reliableinformation about the cost of credit programs is important in supporting annual budgetrequests for these programs, making future budgetary decisions, managing program costs,and measuring the performance of credit activities. Federal credit programs includedirect loans and loan guarantees for farms, rural utilities, low and moderate incomehousing, small businesses, veterans’ mortgages, and student loans.
Environmental and Disposal Liabilities
Significant portions of the liability for remediation of environmental contamination anddisposal of hazardous waste, reported at $313 billion, lacked adequate support and maynot be complete. For example, the estimated cost to remove unexploded ordnance andresidual contaminants from training ranges, amounting to over 40 percent of DOD’srecorded liability, is not adequately supported. Also, the cost of significant estimatedliabilities associated with certain major weapons systems and training ranges, initiallyrecorded in fiscal year 1999, was reported as a current year cost, rather than as a priorperiod adjustment as required by generally accepted accounting principles.
Properly stating environmental and disposal liabilities and improving internal controlsupporting the process for their estimation could assist in determining priorities forcleanup and disposal activities and allow for appropriate consideration of futurebudgetary resources needed to carry out these activities. DOD, which has significantexposure for environmental and disposal liabilities, improved its initial estimate in fiscal

GENERAL ACCOUNTING OFFICE REPORT 25
B-285019
year 1999 by including additional categories of liabilities, such as nuclear weaponssystems. Also, DOD has a project in progress that is intended to better identify anddocument all additional environmental and disposal liabilities.
Liabilities
Adequate systems and cost data were not available to accurately estimate the reported$196 billion military postretirement health benefits liability included in federal employeeand veteran benefits payable. Information used to develop such estimates did not includethe full cost of providing health care benefits. In addition, some of the underlying patientworkload data were not reliable. DOD is evaluating methods to develop a reliableestimate of this liability. Also, some agencies do not maintain adequate records or havesystems to ensure that accurate and complete data were used to estimate a reported $86billion of accounts payable and a reported $169 billion in other liabilities. For example, aliability was not reported for certain amounts owed to contractors that, under the terms ofthe contracts, were held by the government pending the acceptance of goods or services.Further, the government was unable to provide adequate information to determinewhether commitments and contingencies were complete and properly reported. Theseproblems significantly affect the determination of the full cost of the government’scurrent operations, the value of its assets, and the extent of its liabilities.
Cost of Government Operations
The government was unable to support significant portions of the $1.76 trillion reportedas the total net cost of government operations. The previously discussed materialdeficiencies in reporting assets and liabilities and the lack of effective cash disbursementreconciliations and deficiencies in financial statement preparation, as discussed below,affect reported net costs. Further, we were unable to determine whether the amountsreported in the individual net cost categories on the Statement of Net Cost and in thesubfunction detail in Supplemental Information were properly classified. Accurate costinformation is important to the federal government’s ability to control and reduce costs,assess performance, evaluate programs, and set fees to recover costs where required.
Cash Disbursement Activity
Several major agencies are not effectively reconciling cash disbursements. Thesereconciliations are intended to be a key control to detect and correct errors and other

26 GENERAL ACCOUNTING OFFICE REPORT
B-285019
misstatements in financial records in a timely manner--similar in concept to individualsreconciling personal checkbooks with a bank's records each month. Althoughimprovements in some agency reconciliation processes have been noted, there continuedto be billions of dollars of unreconciled differences between agencies' and Treasuryrecords of cash disbursements as of the end of fiscal year 1999. As a result, thegovernment is unable to ensure that all disbursements are properly recorded. Improperlyrecorded disbursements could result in misstatements in the financial statements and incertain data provided by agencies for inclusion in the President's budget concerning fiscalyear 1999 obligations and outlays.
Preparation of Financial Statements
The government does not have sufficient systems, controls, or procedures to properlyprepare financial statements for the U.S. government. Such deficiencies, describedbelow, impair the government’s ability to (1) properly balance the government’s financialstatements and account for billions of dollars of transactions between governmentalentities, (2) properly and consistently compile the information in the financial statements,and (3) effectively reconcile the results of operations reported in the financial statementswith budget results. Also, certain financial information required by generally acceptedaccounting principles was omitted from the financial statements.
Unreconciled Transactions. To make the financial statements balance, Treasuryrecorded a net $24 billion item on the Statement of Operations and Changes in NetPosition, which it labeled unreconciled transactions. Treasury attributes this net out-of-balance amount to the government’s inability to properly identify and eliminatetransactions between federal government entities, to agency adjustments that affected netposition, and to errors. An additional net $12 billion of unreconciled transactions wasimproperly recorded in net cost. These unreconciled transactions result in materialmisstatements of assets, liabilities, revenues, and/or costs.
Agencies’ accounts can be out of balance with each other, for example, when one or theother of the affected agencies does not properly record a transaction with another agencyor the agencies record the transactions in different accounting periods. These out-of-balance conditions can be detected and corrected by instituting procedures for reconcilingtransactions between agencies on a regular basis and in a timely manner.
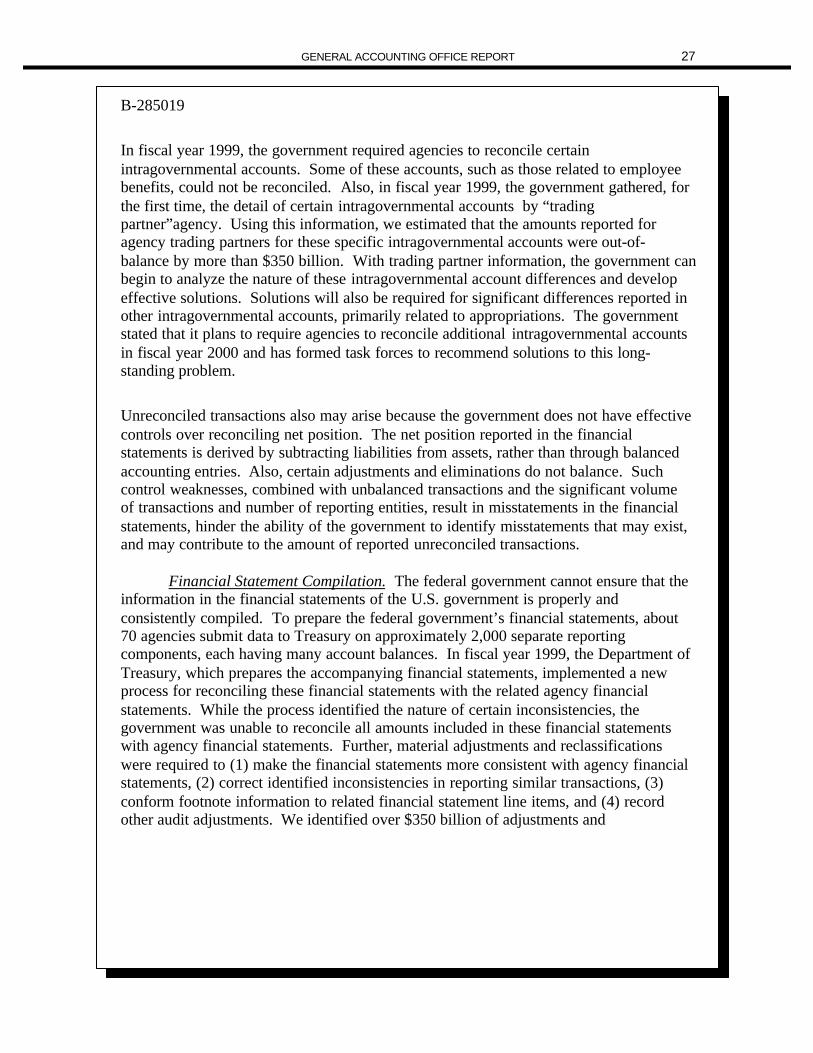
GENERAL ACCOUNTING OFFICE REPORT 27
B-285019
In fiscal year 1999, the government required agencies to reconcile certainintragovernmental accounts. Some of these accounts, such as those related to employeebenefits, could not be reconciled. Also, in fiscal year 1999, the government gathered, forthe first time, the detail of certain intragovernmental accounts by “tradingpartner”agency. Using this information, we estimated that the amounts reported foragency trading partners for these specific intragovernmental accounts were out-of-balance by more than $350 billion. With trading partner information, the government canbegin to analyze the nature of these intragovernmental account differences and developeffective solutions. Solutions will also be required for significant differences reported inother intragovernmental accounts, primarily related to appropriations. The governmentstated that it plans to require agencies to reconcile additional intragovernmental accountsin fiscal year 2000 and has formed task forces to recommend solutions to this long-standing problem.
Unreconciled transactions also may arise because the government does not have effectivecontrols over reconciling net position. The net position reported in the financialstatements is derived by subtracting liabilities from assets, rather than through balancedaccounting entries. Also, certain adjustments and eliminations do not balance. Suchcontrol weaknesses, combined with unbalanced transactions and the significant volumeof transactions and number of reporting entities, result in misstatements in the financialstatements, hinder the ability of the government to identify misstatements that may exist,and may contribute to the amount of reported unreconciled transactions.
Financial Statement Compilation. The federal government cannot ensure that theinformation in the financial statements of the U.S. government is properly andconsistently compiled. To prepare the federal government’s financial statements, about70 agencies submit data to Treasury on approximately 2,000 separate reportingcomponents, each having many account balances. In fiscal year 1999, the Department ofTreasury, which prepares the accompanying financial statements, implemented a newprocess for reconciling these financial statements with the related agency financialstatements. While the process identified the nature of certain inconsistencies, thegovernment was unable to reconcile all amounts included in these financial statementswith agency financial statements. Further, material adjustments and reclassificationswere required to (1) make the financial statements more consistent with agency financialstatements, (2) correct identified inconsistencies in reporting similar transactions, (3)conform footnote information to related financial statement line items, and (4) recordother audit adjustments. We identified over $350 billion of adjustments and
28 GENERAL ACCOUNTING OFFICE REPORT
B-285019
reclassifications which the government subsequently recorded, such as financialstatement compilation errors that had resulted in a $66 billion overstatement of interestcost and a $70 billion overstatement of Medicare costs.
These problems are compounded by the substantial volume of information submitted andlimitations in the federal government’s general ledger (SGL) account structure. Forexample, some SGL accounts must be split between different financial statement lineitems. As a result, additional misclassifications and misstatements in the government’sfinancial statements could exist. Also, the extensive manual intervention required tocompile the federal government’s financial statements requires significant resourceswhich lessens the government’s ability to perform effective financial analysis of theinformation. For example, because of SGL limitations, the government separatelycollects additional information needed to compile the financial statements. However,such additional information, historically, is initially inconsistent with the related SGLaccount balances by hundreds of billions of dollars. After substantial effort, suchinconsistencies were reduced to an immaterial amount.
Reconciling the Results of Operations With Budget Results. The federalgovernment does not yet have a process to obtain information to effectively reconcile thereported $77 billion excess of revenue over net cost and a reported unified budget surplusof $124 billion. Consequently, it could not identify all of the items needed to reconcilethese amounts. Certain differences are expected to occur because the financial statementsof the U.S. government are to be prepared on the accrual basis in accordance withgenerally accepted accounting principles, which is a different basis than the budget.Under accrual accounting, transactions are reported when the events giving rise to thetransactions occur, rather than when cash is received or paid. By contrast, federalbudgetary reporting is generally on the cash basis in accordance with accepted budgetconcepts and policies.
Beginning in fiscal year 1998, 24 major agencies were required to reconcile their reportednet costs to budget information, which could provide a basis for preparing thereconciliation. However, significant amounts reported in certain agency reconciliations,including unliquidated obligations and certain other budget information, lacked adequatesupporting information and may be unreliable. For example, significant amounts of DODtransactions were not applied or were incorrectly applied to specific budgetappropriations, which could misstate certain reported budget information. Once thefederal government produces reliable financial statements, an effective reconciliationcould help provide additional assurance of the reliability of budget results.

GENERAL ACCOUNTING OFFICE REPORT 29
B-285019
INEFFECTIVE INTERNAL CONTROL
Because of the effects of the material weaknesses discussed below, the federalgovernment has not maintained effective internal control to ensure that (1) transactionsare properly recorded, processed, and summarized to permit the preparation of financialstatements and stewardship information in accordance with generally acceptedaccounting principles, and assets are safeguarded against loss from unauthorizedacquisition, use, or disposition and (2) transactions are executed in accordance with lawsgoverning the use of budget authority and with other laws and regulations that could havea direct and material effect on the financial statements. Individual agency financialstatement audit reports describe the effects of such weaknesses on specific agencies andidentify additional internal control weaknesses, some of which are material to individualagencies.
In addition to the material weaknesses related to the deficiencies discussed in ourdisclaimer on the financial statements, we found that (1) the government’s inability todetermine the full extent of improper payments impairs the effective reduction of suchimproper payments, (2) widespread and serious computer control weaknesses affectvirtually all federal agencies and significantly contribute to many of the materialdeficiencies discussed above, and (3) material control weaknesses affect the government'stax collection activities. Due to the deficiencies noted throughout this report, additionalmaterial weaknesses may exist that have not been reported.
Improper Payments
The government is unable to determine the full extent of improper or erroneouspayments, which include payments made for unauthorized purposes, for excessiveamounts, such as overpayments to program recipients or contractors and vendors, and/ornot in accordance with applicable laws and regulations. Across government, improperpayments occur in a variety of programs and activities, including those related to contractmanagement, federal financial assistance, and tax refunds. Reported estimates ofimproper payments total billions of dollars annually.
The Department of Health and Human Services (HHS) has been reporting a nationalestimate of improper Medicare Fee-for-Service payments since fiscal year 1996. In fiscalyear 1999, HHS reported estimated improper Medicare Fee-for-Service payments of$13.5 billion, or about 8 percent of such benefits—down from $23.2 billion or 14 percentfor fiscal year 1996. HHS’ reporting and analysis of improper Medicare payments has

30 GENERAL ACCOUNTING OFFICE REPORT
B-285019
helped lead to the implementation of several initiatives to identify and reduce suchpayments. Annual estimates of improper payments in future audited financial statementswill provide information on the progress of these initiatives.
However, most agencies have not estimated the magnitude of improper payments in theirprograms, nor have they considered this issue in their annual performance plans. Forexample, the Earned Income Tax Credit (EITC) program—a refundable tax creditavailable to low income, working taxpayers—has historically been vulnerable to highrates of invalid claims. During fiscal year 1999, IRS examined about 573,000 suspicioustax returns claiming $1.25 billion in EITCs and found that $1.08 billion (86 percent) wereinvalid. Although the full extent of refunds resulting from invalid EITCs is unknown, theIRS has not disclosed any improper payment estimates in its financial statement reports.In another example, HHS has not reported an estimate of improper payments in its $109billion state-administered Medicaid program, but is currently studying methodologies fordeveloping an estimate and has formed partnerships with various state auditors to shareinformation on improper payments.
Improper payments can result from incomplete or inaccurate data used to make paymentdecisions, insufficient monitoring and oversight, or other deficiencies in agencyinformation systems and weaknesses in internal control. The risk of improper paymentsis increased in programs involving (1) complex criteria for computing payments, (2) asignificant volume of transactions, or (3) an emphasis on expediting payments. Thereasons for improper payments range from inadvertent errors to fraud and abuse.
Without a systematic measurement of the extent of the problem, agency managementcannot determine (1) if the problem is significant enough to require corrective action, (2)how much to invest in internal control, or (3) the success of efforts implemented toreduce improper payments. Developing mechanisms to identify, estimate, and report thenature and extent of improper payments in annual financial statements is only a first stepfor agencies. Without this fundamental knowledge, agencies cannot be fully informedabout the magnitude or trends of improper payments, nor can they pinpoint or targetmitigation strategies.4
4Financial Management: Increased Attention Needed to Prevent Billions in Improper Payments(GAO/AIMD-00-10, October 29, 1999).

GENERAL ACCOUNTING OFFICE REPORT 31
B-285019
In October 1999, we recommended that OMB develop and implement a methodology forannually estimating and reporting improper payments and for addressing improperpayments in agencies’ annual performance and strategic plans and performance reports.OMB agrees with this recommendation. In this regard, the President has made estimatingand preventing improper payments a priority management objective and OMB plans torequire agencies to develop and implement procedures to estimate and report the natureand extent of material improper payments in annual financial statements and have suchinformation audited.
Computer Security Weaknesses
Continuing serious and widespread computer security weaknesses are placing enormousamounts of federal assets at risk of inadvertent or deliberate misuse, financial informationat risk of unauthorized modification or destruction, sensitive information at risk ofinappropriate disclosure, and critical operations at risk of disruption. Significantcomputer security weaknesses in systems that handle the government's unclassifiedinformation have been reported in each of the major federal agencies. The most seriousreported problem is inadequately restricted access to sensitive data. Other types ofweaknesses pertain to not adequately segregating duties to help ensure that people do notconduct unauthorized actions without detection, preventing unauthorized software frombeing implemented, and mitigating and recovering from unplanned interruptions incomputer service. In today's highly computerized and interconnected environment, suchweaknesses are vulnerable to exploitation by outside intruders as well as authorized userswith malicious intent. Recent media reports highlight the potential damage that can resultfrom computer security breaches.
The government cannot estimate the full magnitude of actual damage and loss resultingfrom federal computer security weaknesses because it is likely that many such incidentsare either not detected or not reported. GAO and agency reviews illustrate the potentialfor negative impacts. For instance, weaknesses in DOD information security continue toprovide hackers and hundreds of thousands of authorized users the opportunity to modify,steal, and destroy DOD data including financial, procurement, logistics and othersensitive information. Also, identified weaknesses at HCFA, SSA, IRS, and VA placetax, medical and other sensitive records at risk of unauthorized disclosure, modification,and destruction. Unauthorized disclosure of sensitive information has led to instances ofidentity theft, in which individuals use such information to commit financial crimes, suchas fraudulently establishing credit and running up debts. Likewise, serious and pervasivecomputer security problems at EPA increase the risk that mission-related systems and

32 GENERAL ACCOUNTING OFFICE REPORT
B-285019
financial operations are vulnerable to tampering, disruption, and misuse. Further,pervasive weaknesses at the Department of the Treasury, which collects virtually all ofthe government’s revenues and makes most of its disbursements, expose such collectionsand disbursements to significant risk of loss or fraud.
GAO and the IGs have issued numerous reports that identify information securityweaknesses in the federal government and made recommendations to address them.5
Also, GAO has reported information security as a high-risk area across government sinceFebruary 1997.6
Information security problems continue to persist, in large part, because agency managershave not fully established comprehensive security management programs. An effectiveprogram would include a central security function and effective procedures for assessingrisks, establishing appropriate policies and related controls, raising employee awarenessof prevailing risks and mitigating controls, and monitoring and evaluating theeffectiveness of established controls. Such programs, if properly implemented, wouldprovide the government with a solid foundation for resolving computer security problemsand managing computer security risks on an ongoing basis.
The Congress continues to express concern about the significant risks to federalgovernment systems and information that result from computer security weaknesses.Congressional hearings have focused on specific agency deficiencies and have clarifiedthe problem across government. Further, S. 1993, the Government Information SecurityAct of 1999, recently introduced in Congress, seeks to strengthen information securitypractices throughout the federal government.
The Administration has recognized the importance of computer security and has takensome steps to prompt improvement from a governmentwide perspective. In January
5 See, for example, Critical Infrastructure Protection: Comprehensive Strategy Can Draw on Year2000 Experiences (GAO/AIMD-00-1, October 1, 1999) and Information Security: SeriousWeaknesses Place Critical Federal Operations at Risk (GAO/AIMD-98-92, September 23, 1998).
6High-Risk Series: An Update (GAO/HR-99-1, January 1999), High-Risk Series: An Overview(GAO/HR-97-1, February 1997), and High-Risk Series: Information Management andTechnology (GAO/HR-97-9, February 1997).

GENERAL ACCOUNTING OFFICE REPORT 33
B-285019
2000, the President released the National Plan for Information Systems Protection,7
which calls for new initiatives to strengthen the nation’s defenses against threats to publicand private sector information systems that are critical to the country’s economic andsocial welfare. In addition, the President designated computer security as a prioritymanagement objective.
Tax Collection Activities
The federal government continues to have material weaknesses in controls related to itstax collection activities, which affect its ability to efficiently and effectively account forand collect the government's revenue. This situation results in the need for extensive,costly, and time-consuming ad hoc programming and analysis, as well as material auditadjustments, to prepare basic financial information—an approach that cannot be used toprepare such information on a timely, routine basis to assist in ongoing decision-making.Additionally, the severity of the system deficiencies that give rise to the need to resort tosuch procedures for financial reporting purposes, as well as deficient physical safeguards,result in burden to taxpayers and lost revenue.
Serious financial management system deficiencies continue to affect the federalgovernment's ability to effectively manage its taxes receivable and other unpaidassessments.8 The lack of appropriate subsidiary systems to track the status of taxpayeraccounts affects the government's ability to make informed decisions about collectionefforts. This weakness has resulted in the government pursuing collection efforts againstindividual taxpayers who had already paid their taxes in full. In addition, the governmentdoes not always pursue collection efforts against taxpayers owing taxes to the federalgovernment. This could result in billions of dollars not being collected and adverselyaffect future compliance.
7 Defending America’s Cyberspace: National Plan for Information Systems Protection: Version1.0: An Invitation to a Dialogue. Released January 7, 2000. The White House.
8Other unpaid assessments consist of amounts for which (1) neither the taxpayer nor a court hasaffirmed are owed or (2) the government does not expect further collections due to factors such asthe taxpayer's death, bankruptcy, or insolvency.

34 GENERAL ACCOUNTING OFFICE REPORT
B-285019
The federal government also continues to be vulnerable to loss of tax revenue due toweaknesses in preventive and detective controls over disbursements for tax refunds.Although the government does have detective controls in place, they are not applied tomillions of tax returns estimated to have billions of dollars in underreported tax liabilities.These conditions expose the government to potentially billions of dollars in losses due toinappropriate refund disbursements.
Also, the government does not perform sufficient up-front verification procedures toensure the validity of amounts claimed by taxpayers as overpayments prior to makingdisbursements for refunds. Additionally, delays in recording tax amounts owed result inlost opportunities to retain or offset overpayments made by a taxpayer for one period tocollect on outstanding amounts owed for another period, resulting in lost revenue.Finally, serious deficiencies in physical controls over cash, checks, and sensitive datareceived from taxpayers increase both the government's and the taxpayers' exposure tolosses and increases the risk of taxpayers becoming victims of crimes committed throughidentity fraud.
IRS senior management has expressed a commitment to address many of theseoperational and financial management issues and has made a number of improvements toaddress some of these weaknesses. Successful implementation of long-term efforts toresolve these serious problems will require the continued commitment of IRSmanagement as well as substantial resources and expertise.
NONCOMPLIANCE WITHCERTAIN LAWS AND REGULATIONS
Tests for compliance with selected provisions of laws and regulations related to financialreporting disclosed no instances of material noncompliance. However, other instances ofnoncompliance, some of which are material to individual federal agencies, are reported inthe individual agency financial statement audit reports. Additionally, as described below,we noted that federal systems do not substantially comply with federal financialmanagement systems requirements. We caution that noncompliance other than thatdiscussed in our report may occur and not be detected by these tests and that our limitedtesting may not be sufficient for other purposes. Further, the scope of our tests waslimited by the material deficiencies discussed above. Our objective was not to, and wedo not, express an opinion on overall compliance with laws and regulations.

GENERAL ACCOUNTING OFFICE REPORT 35
B-285019
Noncompliance With the Federal Financial Management Improvement Act of 1996
The Federal Financial Management Improvement Act (FFMIA) of 1996 requiresauditors, as part of financial audits of certain major agencies, to report whether agencies'financial management systems comply substantially with federal accounting standards,financial systems requirements, and the government's standard general ledger at thetransaction level. Thus far, for fiscal year 1999, agency financial auditors have reportedthat 19 of 22 major agencies' financial systems did not comply with the act'srequirements. Systems of the remaining two major agencies that have not yet issuedaudited fiscal year 1999 financial statements did not comply with the act’s requirementsfor fiscal years 1998 and 1997. Noncompliance with FFMIA, which we further discussin our report, Financial Management: Federal Financial Management Improvement ActResults for Fiscal Year 1998 (GAO/AIMD-00-3, October 1, 1999), is indicative of theoverall continuing poor condition of agency financial systems. Also, as we reported,agency remediation plans, required by FFMIA, may not adequately address the systemdeficiencies. Significant time and investment are needed for agencies to address andcorrect these long-standing financial management systems problems.
The majority of federal agencies' financial management systems do not meet systemsrequirements and cannot provide reliable financial information for managing day-to-daygovernment operations and holding managers accountable. For many agencies, thepreparation of financial statements requires considerable reliance on ad hoc programmingand analysis of data produced by inadequate financial systems that are not integrated,reconciled, and often require significant adjustments. As a result, reliable financialinformation on a day-to-day basis is not available for effective financial management.For example, as discussed above, the IRS relies on extensive, costly, and time-consumingad hoc programming and analysis, as well as material audit adjustments, to prepare basicfinancial information. The significant financial management deficiencies discussedthroughout this report underscore the challenge.
FINANCIAL STATEMENTS AND BUDGET DECISIONS:ADDING THE LONG-TERM PERSPECTIVE
A view of the long-term sustainability of fiscal policies can assist decisionmakers inconsidering the government’s financial position and making decisions about resource

36 GENERAL ACCOUNTING OFFICE REPORT
B-285019
allocation. Such a view requires projections of spending and revenues into the future. Inthis context, the sovereign power to tax and the commitments of social insuranceprograms—such as Social Security and Medicare—must be considered.
The accompanying Financial Report and our report include certain informationconcerning the Social Security and Medicare (Part A) trust funds, such as projectedcontributions and expenditures, dates when expenditures are expected to exceedcontributions, and dates when such funds are expected to be exhausted. Such informationis as of January 1, 1999 for Social Security and as of September 30, 1999 for Medicare(Part A), the most recent information publicly reported by the government. Thegovernment plans to issue, on March 30, 2000, updated information as of January 1,2000. The government’s issuance of dated information in this Financial Report at aboutthe same time that it issues more current information may cause confusion to theCongress and the public. Steps should be taken, in future years, to ensure that thegovernment’s Financial Report contains up-to-date information as of no earlier than theend of the most recent fiscal year. Because current information on the solvency of theSocial Security and Medicare programs is critical to assessing the financial condition ofthe federal government, aiding in budget deliberations, and fostering public debate, wewill include the updated information on these two important federal programs in a reportthat will also contain the Fiscal Year 1999 Financial Report of the United StatesGovernment.
Commitments for the Social Security and Medicare programs are included in theStewardship Information accompanying the financial statements. The government’s 75year estimates of the present value of expenditures in excess of contributions for theSocial Security (Old Age Survivors and Disability Insurance (OASDI)) programsamounted to $ 3.7 trillion, as of January 1, 1999, and for the Medicare (Part A) programamounted to $3.1 trillion, as of September 30, 1999. The government’s projections alsoindicate that Social Security and health care costs will absorb an increasing share of thefederal budget.
In fiscal year 1999, Social Security trust funds reported surpluses of $124.7 billion andMedicare (Part A) reported surpluses of $21.5 billion, which included non-cashintragovernmental interest income of $52.1 billion and $9.3 billion, respectively. Thesesurpluses contributed to the $124.4 billion unified budget surplus. However, forexample, as discussed in the accompanying Stewardship Information, using thegovernment’s best estimates as of January 1, 1999, cash disbursements of the Social
GENERAL ACCOUNTING OFFICE REPORT 37
B-285019
Security trust funds (OASDI) are expected to exceed cash receipts beginning in fiscalyear 2014.
When trust funds’ receipts exceed disbursements, they are invested in Treasury securitiesand used to meet current cash needs of the government. These securities are assets to thetrust funds and liabilities to the Treasury. In effect, one part of the government is lendingto another. As disclosed in notes 10 and 19, both the investments and liabilities, whichamounted to $2 trillion at September 30, 1999, are netted out in the accompanyingfinancial statements. Such investments are expected to increase to over $4 trillion in thenext 20 years.
Expected cash shortfalls in the trust funds will require them to redeem their investmentsin Treasury securities. When this occurs, the government must fund these redemptionsthrough some combination of future surpluses, if available, lower relative spending forother federal programs, higher relative taxes, and/or greater relative borrowing from thepublic. Further, under the government’s projections, absent any program or financingchange, the Social Security trust funds and Medicare (Part A) Trust Fund will exhausttheir Treasury security holdings in 2034 and 2015, respectively.
There is general recognition that the Social Security and Medicare (Part A) programsrequire major reforms to deal with the long-term solvency and sustainability of these twoprograms. The fact that Social Security is expected to draw down its Treasury securitiesholdings in less than 15 years, and that it is expected that Medicare will need to do so inless time, highlights the importance of acting soon in order to avoid more dramaticchanges in the future.
- - - - -
We are working with OMB, the Treasury, and other agencies across government toprovide recommendations for fixing the major deficiencies cited in our audit.Considerable effort is now being exerted to address the problems, and several agencies,such as SSA, have made good progress toward achieving financial management reformgoals. We have designated the most serious situations as high risk, including financialmanagement at DOD, IRS, the Forest Service, and the Federal Aviation Administration,as well as information security.

38 GENERAL ACCOUNTING OFFICE REPORT
B-285019
In addition, the continued coordinated efforts of the Treasury and OMB will be requiredto provide solutions for certain governmentwide deficiencies, such as the inability toproperly identify and eliminate transactions between federal entities and the compilationof the financial statements. We will continue to provide suggestions for resolvinggovernmentwide problems and to evaluate progress in overcoming them.
David M. WalkerComptroller Generalof the United States
March 20, 2000

GENERAL ACCOUNTING OFFICE REPORT 39
APPENDIX
OBJECTIVES, SCOPE, AND METHODOLOGY
The federal government is responsible for
• preparing the annual financial statements in conformity with generally acceptedaccounting principles;
• establishing, maintaining, and assessing internal control to provide reasonableassurance that the broad control objectives of the Federal Managers' FinancialIntegrity Act (FMFIA) are met9; and
• complying with applicable laws and regulations and FFMIA requirements.
Our objective was to audit the fiscal year 1999 financial statements.
The Government Management Reform Act expanded on the requirements of the CFO Actby requiring that the IGs of 24 major federal agencies annually audit agencywidefinancial statements prepared by these agencies.10 Our work was performed in closecoordination and cooperation with the IGs to achieve our joint audit objectives. Thiswork included separate GAO audits of certain material agency components, as discussedbelow. Our audit approach focused on the Departments of the Treasury, Defense, andHealth and Human Services and the Social Security Administration. These agenciescomprise a major portion of the amounts reported in the federal government's financialstatements. At other federal agencies, we focused largely on accounts that are material tothe financial statements. Additionally, for two agencies, information has been includedin these financial statements but the agencies have not, at this date, finalized theirindividual financial statements for fiscal year 1999. Therefore, we were unable todetermine the reliability of the amounts included in the accompanying financialstatements for these agencies. We performed sufficient audit work to provide our reporton the financial statements, internal control, and compliance with laws and regulations.
9The FMFIA requires agency managers to evaluate and report annually to the President on theadequacy of their internal controls and accounting systems and what is being done to correct theproblems.
10GMRA authorized OMB to designate agency components that also would receive a financialstatement audit.

40 GENERAL ACCOUNTING OFFICE REPORT
APPENDIX
We separately audited the following material agency components.
• We audited and expressed an unqualified opinion on the IRS statement of custodialactivity for fiscal year 1999. IRS was able to reliably report on the results of itscustodial activities, including nearly $1.9 trillion of tax revenue, $185 billion of taxrefunds, and $21 billion of net federal taxes receivable. However, we issued anopinion on the IRS balance sheet that was qualified for the components of netposition, disclaimed an opinion on its statements of net cost, changes in net position,budgetary resources, and financing, and reported numerous material internal controlweaknesses.11
• We audited and expressed an unqualified opinion on the Schedule of Federal DebtManaged by Treasury's Bureau of the Public Debt for the fiscal year ended September30, 1999.12 This schedule reported (1) over $3.6 trillion of federal debt held by thepublic comprising individuals, corporations, state or local governments, the FederalReserve System, and foreign governments and central banks, (2) $2 trillion of federaldebt held by federal entities, such as the Social Security trust funds, and (3) $230billion of interest on federal debt held by the public.
• We performed audit procedures on cash balances maintained and internal controlsover the cash receipts and disbursements processed by Treasury on behalf of thefederal government. We provided the results of our work to the Treasury Office ofInspector General for consideration in its audit of the Treasury's fiscal year 1999departmentwide financial statements.
11Financial Audit: IRS' Fiscal Year 1999 Financial Statements (GAO/AIMD-00-76, February29, 2000).
12Financial Audit: Bureau of the Public Debt's Fiscal Years 1999 and 1998 Schedules of FederalDebt (GAO/AIMD-00-79, March 1, 2000).

GENERAL ACCOUNTING OFFICE REPORT 41
APPENDIX
• We audited and expressed unqualified opinions on the December 31, 1998, financialstatements for the funds administered by the Federal Deposit Insurance Corporation(FDIC), including the Bank Insurance Fund, the Savings Association Insurance Fund,and the FSLIC Resolution Fund.13 In addition, we performed audit procedures andtests of internal controls for cash, investments, and other material balances of thefunds administered by FDIC as of September 30, 1999.
At CFO Act agencies and other agencies, we reviewed the fiscal year 1999 financialstatement audits performed by the IGs or their contractors and, for certain agencies,assisted in the development of audit plans for fiscal year 1999 audits. Financialstatements and audit reports for these agencies provide additional information about theoperations of each of these entities. For example, these audits have identified numerousinternal control and accounting systems weaknesses and noncompliance with laws andregulations, some of which are material to the respective agencies or components.Further, as of the completion of our field work on March 20, 2000, 22 of the 24 CFO Actagencies had received audit opinions or disclaimers on their fiscal year 1999 financialstatements. Of the 22 agencies, 13 received unqualified opinions. These agencies are the
Social Security Administration,National Science Foundation,General Services Administration,Department of EnergyNational Aeronautics and Space Administration,Nuclear Regulatory Commission,Department of Labor,Small Business Administration,Federal Emergency Management Agency,Department of Commerce,Department of Health and Human Services,Department of Transportation, andDepartment of Veterans Affairs.
13Financial Audit: Federal Deposit Insurance Corporation's 1998 and 1997 Financial Statements(GAO/AIMD-99-202, June 30, 1999).

42
Intentional Blank Page

FI NAN CIAL STATE MENTS 43
Fi nan cial State ments of the United States Gov ern mentfor the Year Ended Sep tem ber 30, 1999
This State ment re ports the re sults of Gov ern -ment op er a tions. This in cludes rev e nues prin ci -pally gen er ated by the Gov ern ment’s sov er eignpower to tax, levy du ties, and as sess fines andpen al ties. This state ment cov ers the cost of Gov -ern ment op er a tions, net of rev e nue earned fromthe sale of goods and ser vices to the pub lic. Italso in cludes any ad just ments and un rec on ciledtrans ac tions that af fect the net po si tion.
Statement of Operations and Changes
RevenueThe main source of rev e nue
for Gov ern ment op er a tionscon sists of taxes and other rev -e nue the Fed eral Gov ern mentgen er ates un der its sov er eignpow ers.
“In di vid ual In come Tax andTax With hold ings” con sist ofFed eral in di vid ual in cometaxes, So cial Se cu rity taxes,Medicare taxes and rail road re -tire ment taxes, net of re lated re -funds .
“Mis cel la neous earned rev e -nue” con sists of earned rev e -nues re ceived from the pub licwith vir tu ally no as so ci atedcost. This cat e gory in cludes
rev e nues gen er ated from spec -trum auc tions and rents androy al ties on the Outer Con ti -nen tal Shelf Lands.
Net Cost of GovernmentOperations
The State ment of Net Costsum ma rizes the “Net cost ofGov ern ment o p er a t ions,”which is gross cost mi nusearned rev e nue.
UnreconciledTransactions
“Un rec on ciled trans ac tions”are ad just ments made to bal -ance the change in net po si tion.
Net Position,Beginning of Period
The “Net po si tion, be gin ningof pe riod” re flects the net po si -tion re ported on the prior year’sBal ance Sheet.
Prior PeriodAdjustments
“Prior pe riod ad just ments”are re vi sions to cor rect the be -gin ning net po si tion.
Net Position, End of Period
This amount re flects the netpo si tion on the cur rent year’sBal ance Sheet.

44 FI NAN CIAL STATE MENTS
As sets in cluded on the Bal anceSheet are re sources of the Fed eralGov ern ment that re main avail able tomeet fu ture needs. The most sig nif i -cant as sets that are re ported in theBal ance Sheet are loans re ceiv ableand in ven to ries, as well as prop erty,plant and equip ment. There are,how ever, other sig nif i cant re sourcesavail able to the Gov ern ment that ex -tend be yond the as sets pre sented inthis Fi nan cial State ment. Those as -sets in clude Stew ard ship As sets andthe Gov ern ment’s sov er eign pow ersto tax, reg u late com merce and set
mon e tary pol icy. They also in cludenat u ral re sources .
Se lected as sets are high lighted inthe Stew ard ship In for ma tion sec tionof this re port to dem on strate the Fed -eral Gov ern ment’s ac count abil ity for these as sets. Stew ard ship as sets in -clude na tional de fense as sets, stew -ard ship land and her i tage as sets.
National defense assets “Na tional de fense as sets” are
weapon sys tems and sup port ing as -sets used by the mil i tary for the Na -tion’s com mon de fense and gen eralwel fare.
Stewardship land“Stew ard ship land” is land that the
Fed eral Gov ern ment does not ex pectto use to meet its ob li ga tions, un like
the as sets l is ted in the Bal anceSheet. This land in cludes land setaside for the use and en joy ment ofpres ent and fu ture gen er a tions andland on which mil i tary bases are lo -cated. Stew ard ship land is mea sured in non-financial units such as acresof land and lakes, miles of park -ways, and miles of wild and sce nicrivers. Ex am ples of stew ard shipland in clude na tional parks, na tional for ests, wil der ness ar eas, and landused to en hance eco sys tems to en -cour age an i mal and plant spe ciesand to con serve na ture.
Heritage assets“Her i tage as sets” are Gov ern -
ment-owned as sets that have one ormore of the fol low ing char ac ter is -tics: his tor i cal or nat u ral sig nif i -
This State ment pres ents the netcost of fis cal 1999 Gov ern ment op -er a tions. It also shows the cost tocarry out na tional pri or i ties as de -ter mined by law.
It also cat e go rizes costs by ma jor func tion. It pres ents costs in muchthe same way as does the bud get,ex cept that costs are al lo cated tofunc tions based on ac count ingstan dards. Thus, this Statement re -ports costs on an ac crual ba sis andin some cases al lo cates them dif fer -ently than the bud get. For ex am ple, this State ment al lo cates the cost of
pen sions and re tiree health ben e fits among all the func tions that em -ploy work ers. The bud get cat e go -rizes pen sion pay ments to ci vil ianre tir ees as a subfunction, found un -der “In come se cu rity.” The bud getcat e go rizes agency con tri bu tions to re tire ment funds as intragovern-men tal out lays dis trib uted amongall the func tions that em ploy work -ers. A de scrip tion of each of thefunc tions and the com po nents ofnet cost for the ac tiv i ties in cludedin each func tion is pre sented inSup ple men tal In for ma tion as “Netcost de tail.”
This State ment con tains the fol -low ing three com po nents for eachfunc tion:
• The gross cost of Gov ern -ment op er a tions.• The rev e nues earned fromthe sale of goods and pro vi -sion of ser vices to the pub lic.
• The net cost of Gov ern -ment op er a tions, which isgross cost less rev e nueearned.
Gross Cost“Gross cost” in cludes the full
cost of all func tions. These costsmay be di rectly traced, as signed ona cause and ef fect ba sis, or rea son -ably al lo cated to the func tion.
Earned RevenueThis is rev e nue the Gov ern ment
earned by pro vid ing goods and ser -vices to the pub lic at a price.
Net CostThe “Net cost” of Gov ern ment
op er a tions is com puted by sub -tract ing “Earned rev e nues” from“Gross cost.”
Statement of Net Cost
The Bal ance Sheet shows the Gov ern ment’s as sets and li a bil i ties.When com bined with Stew ard ship In for ma tion, this in for ma tion pres ents a more com pre hen sive un der stand ing of the Gov ern ment’s fi nan cial po -si tion. Most line items on the Bal ance Sheet are de scribed in the Notes tothe Fi nan cial State ments. The first note, for ex am ple, pro vides in for ma -tion on the ac count ing pol i cies for as sets and li a bil i ties.
Balance Sheet
Assets

FI NAN CIAL STATE MENTS 45
cance; cul tural, ed u ca tional, or ar tis -t i c im por t ance ; o r s ig n i f i can tar chi tec tural fea tures. The cost ofher i tage as sets of ten is not de ter mi -na ble or rel e vant to their sig nif i -cance. Like stew ard ship land, theGov ern ment does not ex pect to usethese as sets to meet its ob li ga tions.The most rel e vant in for ma tion about her i tage as sets is non-financial. Ex -am ples of her i tage as sets in clude:the Dec la ra tion of In de pend ence,the Con st i tu t ion and the Bil l of
Rights pre served by the Na tionalAr chives. Also in cluded are na -t ional mon u ments such as theViet nam Vet erans Me mo rial, Jef -fer son Me mo rial and the Wash -ing ton Mon u ment as well as artand cul tura l t rea sures a t theSmith so nian In sti tu tion and theLi brary of Con gress.
Many other sites such as the bat -tle fields, his toric struc tures andna tional his toric land marks alsoare placed in this cat e gory.
Assets, cont.
Li a bil i ties are ob li ga tions of the Fed eral Gov -ern ment re sult ing from prior ac tions that will re -quire fi nan cial re sources. The most sig nif i cantli a bil i ties re ported on the Bal ance Sheet are Fed -eral debt se cu ri ties held by the pub lic and ac -crued pen sion li a bil i ties for cur rent and re tiredFed eral ci vil ian and mil i tary per son nel. Li a bil i -ties also in clude so cial in sur ance ben e fits dueand pay able as of the re port ing date.
As with re ported as sets, the Gov ern ment’s re -spon si bil i ties and pol icy com mit ments are much broader than these re ported Bal ance Sheet li a bil -i ties. They in clude the so cial in sur ance pro grams dis closed in Stew ard ship In for ma tion, a widerange of other pro grams un der which the Gov -ern ment pro vides ben e fits and ser vices to thepeo ple of this Na tion, and cer tain fu ture losscon tin gen cies.
The mag ni tude and com plex ity of so cial in -sur ance pro grams, cou pled with the ex tremesen si tiv ity of pro jec tions re lat ing to the many as -sump tions of the pro grams, pro duce a largerange of pos si ble re sults. The Stew ard ship Re -spon si bil ities sec tion de scribes the so cial in sur -ance pro grams, re ports long-range estimates that can be used to as sess the fi nan cial con di tion ofthe pro grams, and ex plains some of the fac torsthat im pact the var i ous pro grams. Using this in -for ma tion, read ers can ap ply their own judg ment as to the sol vency and sustainability of the in di -vid ual pro grams.
Each of the so cial in sur ance pro grams has anas so ci ated trust fund to ac count for its ac tiv ity.A n ex pla na tion of the trust funds for so cial in -
sur ance and many of the other large trust funds is in cluded in Note 19—Ded i cated Col lec tions.That note also con tains in for ma tion about trustfund re ceipts, dis burse ments and as sets.
A broad per spec tive on the Fed eral Gov ern -ment’s re spon si bil i ties is pro vided by the Cur -rent Ser vices As sess ment, which also can befound un der Stew ard ship In for ma tion. Pres -ented in ac cor dance with the Pres i dent’s bud get,this in for ma tion es ti mates Fed eral ex pen di turesand re ceipts for fis cal 2000 to 2005, pro videdthere are no changes to cur rent law.
The Gov ern ment has en tered into con trac tualcom mit ments re quir ing the fu ture use of fi nan -cial re sources and also has un re solved con tin -gen cies where ex ist ing con di tions, sit u a tions orcir cum stances cre ate un cer tainty about fu turelosses. Com mit ments as well as con tin gen ciesthat do not meet the cri te ria for rec og ni tion as ali a bil ity on the Bal ance Sheet, but for whichthere is at least a rea son able pos si bil ity that aloss has been in curred, are dis closed in Note18—Com mit ments and Con tin gencies.
“Net po si tion” is pre sented as the sum of Bal -ance Sheet as sets less Bal ance Sheet li a bil i ties.
The large neg a tive net po si tion amount doesnot im ply that the Gov ern ment is in sol vent. Be -cause of its sov er eign power to tax, and thecoun try’s wide eco nomic base, the Gov ern menthas unique ac cess to fi nan cial re sources to fi -nance its debts. This pro vides the Fed eral Gov -ern ment the abil ity to meet pres ent ob li ga tionsand those that are an tic i pated from fu ture op er a -tions.
Liabilities and Net Position

46 FI NAN CIAL STATE MENTS
United States Government Statement of Operations and Changes in Net Position for the Year Ended September 30, 1999
(In bil lions of dol lars)
Revenue:
Individual income tax and tax withholdings . . . . . . . . . . . . . . . . . . . . . . . . . . . . . . . 1,456.0
Corporation income taxes. . . . . . . . . . . . . . . . . . . . . . . . . . . . . . . . . . . . . . . . . . . . 182.2
Unemployment taxes . . . . . . . . . . . . . . . . . . . . . . . . . . . . . . . . . . . . . . . . . . . . . . . 25.6
Excise taxes . . . . . . . . . . . . . . . . . . . . . . . . . . . . . . . . . . . . . . . . . . . . . . . . . . . . . 70.5
Estate and gift taxes . . . . . . . . . . . . . . . . . . . . . . . . . . . . . . . . . . . . . . . . . . . . . . . 27.7
Customs duties . . . . . . . . . . . . . . . . . . . . . . . . . . . . . . . . . . . . . . . . . . . . . . . . . . . 18.4
Other taxes and receipts . . . . . . . . . . . . . . . . . . . . . . . . . . . . . . . . . . . . . . . . . . . . 42.0
Miscellaneous earned revenues . . . . . . . . . . . . . . . . . . . . . . . . . . . . . . . . . . . . . . . 10.5
Total revenue . . . . . . . . . . . . . . . . . . . . . . . . . . . . . . . . . . . . . . . . . . . . . . . . . . . 1,832.9
Net Cost of Government Operations:
National defense . . . . . . . . . . . . . . . . . . . . . . . . . . . . . . . . . . . . . . . . . . . . . . . . . . 413.2
Human resources . . . . . . . . . . . . . . . . . . . . . . . . . . . . . . . . . . . . . . . . . . . . . . . . . 905.3
Physical resources . . . . . . . . . . . . . . . . . . . . . . . . . . . . . . . . . . . . . . . . . . . . . . . . . 95.1
Interest . . . . . . . . . . . . . . . . . . . . . . . . . . . . . . . . . . . . . . . . . . . . . . . . . . . . . . . . . 230.1
Other functions . . . . . . . . . . . . . . . . . . . . . . . . . . . . . . . . . . . . . . . . . . . . . . . . . . . 112.3
Total net cost of Government operations. . . . . . . . . . . . . . . . . . . . . . . . . . . . . . . 1,756.0
Excess of revenue over net cost . . . . . . . . . . . . . . . . . . . . . . . . . . . . . . . . . . . . . . 76.9
Unreconciled transactions affecting the change in net position (Note 16) . . . . . . . . . . . . . . . . . . . . . . . . . . . . . . . . . . . . . . . . . . .
24.4
Increase in net position . . . . . . . . . . . . . . . . . . . . . . . . . . . . . . . . . . . . . . . . . . . . . 101.3
Net position, beginning of period . . . . . . . . . . . . . . . . . . . . . . . . . . . . . . . . . . . . . . (6,134.4)
Prior Period Adjustments (Note 17) . . . . . . . . . . . . . . . . . . . . . . . . . . . . . . . . . . . . . . 6.9
Net position, end of period . . . . . . . . . . . . . . . . . . . . . . . . . . . . . . . . . . . . . . . . . . .(6,026.2)
The ac com pa ny ing notes are an in te gral part of these fi nan cial state ments.

FI NAN CIAL STATE MENTS 47
United States Government Statement of Net Cost for the Year Ended September 30, 1999
(In bil lions of dol lars) Gross
CostEarned
Rev e nue Net Cost
National defense. . . . . . . . . . . . . . . . . . . . . . . . . . . . . . . . . 451.2 38.0 413.2
Hu man Re sources:Education, training , employment
and social services . . . . . . . . . . . . . . . . . . . . . . . . . . . . . 57.9 1.4 56.5
Health. . . . . . . . . . . . . . . . . . . . . . . . . . . . . . . . . . . . . . . . 140.6 0.7 139.9
Medicare . . . . . . . . . . . . . . . . . . . . . . . . . . . . . . . . . . . . . . 207.0 21.7 185.3
Income security . . . . . . . . . . . . . . . . . . . . . . . . . . . . . . . . . 188.0 6.2 181.8
Social Security. . . . . . . . . . . . . . . . . . . . . . . . . . . . . . . . . . 387.7 - 387.7
Veterans benefits and services (Note 11) . . . . . . . . . . . . . . (43.2) 2.7 (45.9)
Total human resources . . . . . . . . . . . . . . . . . . . . . . . . . . 938.0 32.7 905.3
Physical Resources:
Energy . . . . . . . . . . . . . . . . . . . . . . . . . . . . . . . . . . . . . . . 12.9 12.4 0.5 Natural resources and environment . . . . . . . . . . . . . . . . . . 27.1 2.9 24.2
Commerce and housing credit . . . . . . . . . . . . . . . . . . . . . . 89.2 73.9 15.3 Transportation . . . . . . . . . . . . . . . . . . . . . . . . . . . . . . . . . . 44.1 1.1 43.0
Community and regional development . . . . . . . . . . . . . . . . 14.9 2.8 12.1
Total physical resources . . . . . . . . . . . . . . . . . . . . . . . . . 188.2 93.1 95.1
Interest . . . . . . . . . . . . . . . . . . . . . . . . . . . . . . . . . . . . . . . . 230.1 - 230.1
Other Functions:
International affairs . . . . . . . . . . . . . . . . . . . . . . . . . . . . . . 29.6 9.6 20.0 General science, space and technology . . . . . . . . . . . . . . . 17.5 0.1 17.4
Agriculture . . . . . . . . . . . . . . . . . . . . . . . . . . . . . . . . . . . . . 27.2 2.4 24.8 Administration of justice . . . . . . . . . . . . . . . . . . . . . . . . . . . 31.2 1.6 29.6
General government . . . . . . . . . . . . . . . . . . . . . . . . . . . . . 25.1 4.6 20.5
Total other functions . . . . . . . . . . . . . . . . . . . . . . . . . . . . 130.6 18.3 112.3
Total . . . . . . . . . . . . . . . . . . . . . . . . . . . . . . . . . . . . . .1,938.1 182.1 1,756.0
The ac com pa ny ing notes are an in te gral part of these fi nan cial state ments.

48 FI NAN CIAL STATE MENTS
Intentional Blank Page

FI NAN CIAL STATE MENTS 49
United States Government Balance Sheet as of September 30, 1999
(In bil lions of dol lars)
Assets:
Cash and other monetary assets (Note 2). . . . . . . . . . . . . . . . . . . . . . . . . . . . . . . . 115.2
Accounts receivable (Note 3) . . . . . . . . . . . . . . . . . . . . . . . . . . . . . . . . . . . . . . . . . 35.0
Loans receivable (Note 4) . . . . . . . . . . . . . . . . . . . . . . . . . . . . . . . . . . . . . . . . . . . 183.7
Taxes receivable (Note 5) . . . . . . . . . . . . . . . . . . . . . . . . . . . . . . . . . . . . . . . . . . . 22.7
Inventories and related property (Note 6) . . . . . . . . . . . . . . . . . . . . . . . . . . . . . . . . 173.3
Property, plant and equipment (Note 7) . . . . . . . . . . . . . . . . . . . . . . . . . . . . . . . . . 298.8
Other assets (Note 8) . . . . . . . . . . . . . . . . . . . . . . . . . . . . . . . . . . . . . . . . . . . . . . 54.3
Total assets . . . . . . . . . . . . . . . . . . . . . . . . . . . . . . . . . . . . . . . . . . . . . . . . . . . .883.0
Liabilities :
Accounts payable (Note 9). . . . . . . . . . . . . . . . . . . . . . . . . . . . . . . . . . . . . . . . . . . 85.8
Federal debt securities held by the public (Note 10) . . . . . . . . . . . . . . . . . . . . . . . . 3,631 .6
Federal employee and veteran benefits payable (Note 11) . . . . . . . . . . . . . . . . . . . 2,600 .7
Environmental and disposal liabilities (Note 12). . . . . . . . . . . . . . . . . . . . . . . . . . . . 313.2
Benefits due and payable (Note 13) . . . . . . . . . . . . . . . . . . . . . . . . . . . . . . . . . . . . 73.8
Loan guarantee liabilities (Note 4) . . . . . . . . . . . . . . . . . . . . . . . . . . . . . . . . . . . . . 35.1
Other liabilities (Note 14) . . . . . . . . . . . . . . . . . . . . . . . . . . . . . . . . . . . . . . . . . . . . 169.0
Total liabilities. . . . . . . . . . . . . . . . . . . . . . . . . . . . . . . . . . . . . . . . . . . . . . . . . . . 6,909 .2
Commitments and Contingencies (Note 18)
Net Position . . . . . . . . . . . . . . . . . . . . . . . . . . . . . . . . . . . . . . . . . . . . . . . . . . . . . . (6,026 .2)
Total liabilities and net position . . . . . . . . . . . . . . . . . . . . . . . . . . . . . . . . . . . . . . 883.0
The ac com pa ny ing notes are an in te gral part of these fi nan cial state ments.

50 FI NAN CIAL STATE MENTS
Intentional Blank Page

STEW ARD SHIP IN FOR MA TION 51
United States Gov ern mentStew ard ship In for ma tion for the Year EndedSep tem ber 30, 1999 (Un au dited)
The Fed eral Gov ern ment holds “Stew ard ship as sets” for the ben e -fit of the Na tion. Be cause the Gov ern ment has been en trusted with,and made ac count able for, these re sources and re spon si bil i ties, theyare rec og nized in the Fi nan cial Re port of the United States Gov ern -ment.
When ac quired, “Stew ard ship as sets” are treated as ex penses in the fi nan cial state ments. This sec tion pro vides more de tailed stew ard -ship in for ma tion on these re sources to high light their long-term ben -e fit and to dem on strate ac count abil ity. This in for ma tion fa cil i tatesthe un der stand ing of the op er a tions and fi nan cial con di tion of theGov ern ment.
Na tional de fense prop erty,plant and equip ment con sist of:(1) as sets owned by the De part -ment of De fense in the per for -mance of mil i tary mis sions, suchas com bat op er a tions, peace -keep ing and sup port of ci vil ianau thor i ties dur ing civil emer gen -cies; and (2) ves sels held in apres er va tion sta tus by the Mari-time Ad min is tra tion’s Na tionalDe fense Re serve Fleet.
“Na tional de fense as sets” arede fined in terms of four cat e go -ries:
Weapons sys tems— equip -ment that launches, re leases, car -ries, or fires a par tic u lar piece of
ord nance and/or car ries weap onssys tems-related prop erty, equip -ment, ma te ri als, or per son nel.Ex am ples in clude air craft, ships,tracked com bat ve hi cles and mis -siles.
• Weapons sys tems sup port prin ci pal end items —items that are ac quired to sup port weap ons sys tems and mayul ti mately be in cor po ratedin weap ons sys tems. Ex am -ples in clude air craft en -gines, tank en gines, air craft ra dars, ship so nar,uninstalled mis sile mo tors,gun mounts and guid ancesys tems.
• Mis sion sup port equip -ment—de ploy able equip -ment that: (1) is es sen tialto the ef fec tive op er a tionof a weap ons sys tem or isused by the mil i tary de -part ments to ef fec tivelyper form their mil i tary mis -sions; (2) has an in de ter mi -nate or un pre dict ableuse ful life due to the man -ner in which it is used; and (3) is at a very high risk of be ing de stroyed dur ing use or of pre ma ture ob so les -cence.
National Defense Assets
StewardshipAssets

52 STEW ARD SHIP IN FOR MA TION
National Defense Assets
(In number of systems or items)
Restated*Balance as ofSeptember 30,
1998 Additions Deletions
Balance as ofSeptember 30,
1999
Aircraft: Combat . . . . . . . . . . . . . . . . . . . . . . . 8,660 52 351 8,361 Airlift . . . . . . . . . . . . . . . . . . . . . . . . . 6,059 23 148 5,934 Other aircraft . . . . . . . . . . . . . . . . . . . 3,740 67 247 3,560 Ships: Submarines . . . . . . . . . . . . . . . . . . . . 123 1 7 117 Aircraft carriers . . . . . . . . . . . . . . . . . 18 - - 18 Surface combatants . . . . . . . . . . . . . . 269 26 13 282 Amphibious warfare ships . . . . . . . . . . 83 - 7 76 Mine warfare ships . . . . . . . . . . . . . . . 38 1 - 39 Support ships . . . . . . . . . . . . . . . . . . . 241 6 33 214 Other ships . . . . . . . . . . . . . . . . . . . . 3,921 55 229 3,747 Combat Vehicles: Tracked . . . . . . . . . . . . . . . . . . . . . . . 44,522 328 684 44,166 Wheeled . . . . . . . . . . . . . . . . . . . . . . 140,376 1,596 - 141,972 Towed . . . . . . . . . . . . . . . . . . . . . . . . 7,044 - 78 6,966 Other combat vehicles . . . . . . . . . . . . 12,744 829 19 13,554 Guided, Self-propelled Ordnance: Missiles . . . . . . . . . . . . . . . . . . . . . . . 453,056 18,094 6,832 464,318 Torpedoes . . . . . . . . . . . . . . . . . . . . . 8,486 216 29 8,673
Space Systems: Satellites . . . . . . . . . . . . . . . . . . . . . . 78 8 1 85 Weapons Systems Support Real Property: Active ammunition bunkers . . . . . . . . 23,468 398 756 23,110 Active missile silos. . . . . . . . . . . . . . . 993 1 158 836
Active satellite ground stations . . . . . . 81 - - 81
Reserve Fleet Vessels n.a. n .a. n .a. 144
*The bal ances as of Sep tem ber 30, 1998, have been re stated to re flect changes from pre vi ous year’s re port ing.
National Defense Assets, cont.Ex am ples i nclude: sur veil lance
unmanned air ve hi cles, non-tacticalve hi cles (e.g., fuel tank ers, com batop er a tions cen ters, mess ve hi cles),field me te o ro log i cal sys tems, cryp -tog ra phy sys tems, and field se cu ritysys tems.
Weapons sys tems sup port realprop erty—fa cil i ties and struc turesaf fixed to the land that are in te gral toa weap ons sys tem. Ex am ples in clude
am mu ni tion bunk ers in ac tive useand mis sile si los in ac tive use.
The ac com pa ny ing “National de -fense as set” in for ma tion does not re -port quan ti ties of mis sion sup portequip ment al though the an nual in -vest ments in these items are re -ported.
The in vest ment amounts in“National de fense as sets” pre sentedin this re port re flect the sum of an -nual in vest ment amounts re ported by
each mil i tary de part ment. DOD does not cur rently have cost ac count ingsys tems that cap ture the full costs, asde scribed in State ment of Fed eral Fi -nan c ia l Ac count ing Stan dards(SFFAS) No. 4 as so ci ated with“National de fense as sets.” There -fore, the an nual in vest ments shownin this re port rep re sent an nual dis -burse ments for each cat e gory of“National de fense as sets.”
n.a. = Not available

STEW ARD SHIP IN FOR MA TION 53
Investments in National Defense Assets for the Period Ended September 30, 1999
(In millions of dollars)
Aircraft:Combat . . . . . . . . . . . . . . . . . . . . . . . . . . . . . . . . . . . . . . . . . . . . . . . . . . . . 6,901
Airlift . . . . . . . . . . . . . . . . . . . . . . . . . . . . . . . . . . . . . . . . . . . . . . . . . . . . . . 4,354 Other aircraft . . . . . . . . . . . . . . . . . . . . . . . . . . . . . . . . . . . . . . . . . . . . . . . . 2,662 Aircraft support principal end items . . . . . . . . . . . . . . . . . . . . . . . . . . . . . . . . 1,387 Other aircraft support property, plant and equipment . . . . . . . . . . . . . . . . . . . 1,418
Ships: Surface combatants . . . . . . . . . . . . . . . . . . . . . . . . . . . . . . . . . . . . . . . . . . . 3,591 Submarines . . . . . . . . . . . . . . . . . . . . . . . . . . . . . . . . . . . . . . . . . . . . . . . . . 1,409 Ship support principal end items . . . . . . . . . . . . . . . . . . . . . . . . . . . . . . . . . . 852 Aircraft carriers . . . . . . . . . . . . . . . . . . . . . . . . . . . . . . . . . . . . . . . . . . . . . . . 823 Amphibious warfare ships . . . . . . . . . . . . . . . . . . . . . . . . . . . . . . . . . . . . . . . 581 Support ships . . . . . . . . . . . . . . . . . . . . . . . . . . . . . . . . . . . . . . . . . . . . . . . . 371 Mine warfare ships . . . . . . . . . . . . . . . . . . . . . . . . . . . . . . . . . . . . . . . . . . . . 73 Other ships . . . . . . . . . . . . . . . . . . . . . . . . . . . . . . . . . . . . . . . . . . . . . . . . . . 30 Other ship support property, plant and equipment . . . . . . . . . . . . . . . . . . . . . 6
Combat Vehicles: Combat vehicle support principal end items . . . . . . . . . . . . . . . . . . . . . . . . . 1,199 Tracked . . . . . . . . . . . . . . . . . . . . . . . . . . . . . . . . . . . . . . . . . . . . . . . . . . . . 354 Wheeled. . . . . . . . . . . . . . . . . . . . . . . . . . . . . . . . . . . . . . . . . . . . . . . . . . . . 261 Other combat vehicles support property, plant and equipment . . . . . . . . . . . . 1
Guided, Self-propelled Ordnance: Missiles . . . . . . . . . . . . . . . . . . . . . . . . . . . . . . . . . . . . . . . . . . . . . . . . . . . . 1,299 Guided, self-propelled support principal end items . . . . . . . . . . . . . . . . . . . . . 815 Guided, self-propelled ordnance support property, plant and equipment . . . . . 245 Guided, self-propelled ordnance support . . . . . . . . . . . . . . . . . . . . . . . . . . . . 34 Torpedoes . . . . . . . . . . . . . . . . . . . . . . . . . . . . . . . . . . . . . . . . . . . . . . . . . . 70
Space Systems: Satellites . . . . . . . . . . . . . . . . . . . . . . . . . . . . . . . . . . . . . . . . . . . . . . . . . . . 1,438 Space systems support principal end items . . . . . . . . . . . . . . . . . . . . . . . . . . 558
Weapons systems support real property: Active ammunition bunkers . . . . . . . . . . . . . . . . . . . . . . . . . . . . . . . . . . . . . 19
General mission support property, plant and equipment . . . . . . . . . . . . . . . . . 5,274
Other: Other weapons systems . . . . . . . . . . . . . . . . . . . . . . . . . . . . . . . . . . . . . . . . 115 Other weapons systems support principal end items . . . . . . . . . . . . . . . . . . . 37 Other weapons support property, plant and equipment . . . . . . . . . . . . . . . . . . 62
Reserve fleet vessels . . . . . . . . . . . . . . . . . . . . . . . . . . . . . . . . . . . . . . . . . . . 1,905
Total investments in national defense assets for fiscal year ended September 30, 1999 . . . . . . . . . . . . . . . . . . . . . . . 38,144

54 STEW ARD SHIP IN FOR MA TION
StewardshipLand
United States Government Stewardship Land as of September 30
(In millions of acres) Predominate Use AcresPercent-
age
Agency:Bureau of Land Management . . . . Public land 264.2 40. 9U.S. Forest Service . . . . . . . . . . . National Forest system 192.0 29. 8U.S. Fish and Wildlife Service . . . . National Wildlife Refuge system 88.6 13. 7National Park Service . . . . . . . . . . National Park system 77.9 12. 1Department of Defense. . . . . . . . . Defense facilities 16.7 2. 6
Bureau of Reclamation . . . . . . . . . Water, power and recreation 5 .8 0. 9
Total acres . . . . . . . . . . . . . . . .645.2 100. 0
The De part ment of the In te rior’s Bu reau of Land Man age ment (BLM) man ages 264.2 mil lion acres of fed er ally owned land. Con gress has charged the Bu reauwith main tain ing this land and its re sources to best serve the pres ent and fu tureneeds of the Amer i can peo ple. To ward this end, BLM man ages these lands to al -low for a com bi na tion of uses in clud ing min eral de vel op ment, out door rec re ationand nat u ral hab i tat. Some BLM lands are pro tected and used for their sce nic,scientific or his tor i cal value. The fol low ing ta ble de scribes those hold ings.
Bureau of Land Management
Bureau of Land Management Public Lands as of September 30
NumberAcreage
(in thousands) MilesNational wild and scenic river segments . . . . . 34 998 2,038National wilderness areas . . . . . . . . . . . . . . . 136 5,243 -Wilderness study areas . . . . . . . . . . . . . . . . . 622 17,298 -National conservation areas . . . . . . . . . . . . . . 8 11,692 -National scenic areas. . . . . . . . . . . . . . . . . . . 1 101 -National recreation areas . . . . . . . . . . . . . . . . 1 1,000 -National historic trails. . . . . . . . . . . . . . . . . . . 8 - 3,533National scenic trails . . . . . . . . . . . . . . . . . . . 2 - 568National recreation trails . . . . . . . . . . . . . . . . 26 - 429Outstanding natural areas . . . . . . . . . . . . . . . 1 - -Herd management areas . . . . . . . . . . . . . . . . 200 36,070 -National monuments . . . . . . . . . . . . . . . . . . . 1 1,880 -Areas of critical environmental concern. . . . . . 740 13,112 -Research natural areas . . . . . . . . . . . . . . . . . 152 347 -National natural landmarks . . . . . . . . . . . . . . . 43 599 -National back country byways . . . . . . . . . . . . 64 - 3,518Globally important bird areas . . . . . . . . . . . . . 2 57 -National "multiple use" lands . . . . . . . . . . . . . - 175,775 -
BLM total . . . . . . . . . . . . . . . . . . . . . . . . . . 2,041 264,172 10,086
“Stew ard ship Land” re fers to fed er ally owned land that is not used, orheld for use, in “Gen eral Gov ern ment” op er a tions. This cat e gory in cludesland on which mil i tary bases are lo cated. This cat e gory ex cludes lands ad -min is tered by the Bu reau of In dian Af fairs and held in trust.
Most Stew ard ship land is “pub lic do main.” Be tween 1781 and 1867, the Gov ern ment ac quired acres of land equal to 79.4 per cent of the cur rentacre age of the United States, spend ing a to tal of $85.1 mil lion.

STEW ARD SHIP IN FOR MA TION 55
The U.S. For est Ser vice man ages 192.0 mil lion acres of fed er ally owned lands for the sus tained use of out doorrec re ation, range, tim ber, wa ter shed, wild life and fish.
For est land con tains 155 named Na tional For ests to tal -ing 153.0 mil lion acres.
The For est Ser vice re for ested 267,013 acres pri -mar ily with ge net i cally im proved seed lings in fis -cal 1999.
Wil der ness land con tains 34.8 mil lion acres in38 states and is served by 133,087 miles of trails.
The U.S. For est Ser vice also man ages 20 namedgrass lands on 3.8 mil lion acres and about 4,348miles of the wild and sce nic river sys tem.
The U.S. Fish and Wild life Ser -vice man ages 88.6 mil lion acres offed er ally owned lands held pri mar -ily for wild life con ser va tion. It hasfive goals:
• Pre serve, re store and en -hance in their nat u ral eco sys -tems, all spe cies of an i malsand plants en dan gered orthreat ened.
• Per pet u ate the mi gra torybird re source.
• Pre serve a nat u ral di ver sity and abun dance of fauna andflora.• Pro vide an un der stand ingand ap pre ci a tion of fish andwild life ecol ogy.• Pro vide ref uge vis i tors asafe, whole some and en joy -able rec re ational ex pe ri enceori ented to ward wild life.
The U.S. Fish and Wild life Ser -vice sub di vides its man age ment re -
spon si bil ity into the fol low ingcat e go ries:
• “Na tional Wild life Ref -uges” (521 sites on 87.6 mil -lion acres).• “Ref uge Co or di na tion ar -eas” (50 sites on 197,049acres).• “Wa ter fowl Pro duc tion ar -eas” (200 sites on 715,200acres).• “Fish eries Re search Cen -ters” (83 sites on 16,083acres).• “Wild and Sce nic Rivers”(8 rivers to tal ing 1,258 milesin length).
U.S. Forest Service
National ParkService
The Na tional Park Ser vice man ages77.9 mil lion acres of fed er ally ownedlands. These lands are set aside to con -serve scen ery, na ture, his toric ob jects and wild life so that cur rent and fu ture gen er a -tions of Amer i cans can en joy them.
Other types of park ar eas in clude: na -tional rivers, park ways, na tional lakeshores, his toric parks, sce nic trails, wildand sce nic rivers, mil i tary parks, re -serves, and bat tle fields.
Summary of Acreage
(In millions of acres) Acreage
Type of Park Area:National parks . . . . . . . . . . . . . . . . . . . . . . 49.6National preserves . . . . . . . . . . . . . . . . . . . 21.4National recreation areas . . . . . . . . . . . . . . 3.4National monuments . . . . . . . . . . . . . . . . . . 1.9National seashores. . . . . . . . . . . . . . . . . . . 0.5
Other park areas . . . . . . . . . . . . . . . . . . . . 1.1
Total acres . . . . . . . . . . . . . . . . . . . . . . . 77.9
U.S. Fish and Wildlife Service
The De part ment of De fense uses 16.7mil lion acres of fed er ally owned land formis sion es sen tial pur poses in clud ing:
• Mil i tary bases
• In stal la tions
• Training ranges
Department of Defense

56 STEW ARD SHIP IN FOR MA TION
The Fed eral Gov ern -ment in ven to r ies , p re -serves and in ter prets vastnum bers of her i tage as -sets for the ben e fit of theAmer i can pub lic. Theseas sets en com pass manyof the Na tion’s most pre -cious his toric, nat u ral and cul tural re sources. Her i -t age a s s e t s a r e un iqueprop erty, plant and equip -ment with:
• His toric or nat u ral sig nif i cance.• Cul tural, ed u ca -tional or ar tis tic im -por tance.• Sig nif i cant ar chi -tec tural char ac ter is -tics.
The pub lic en trusts theGov ern ment with theseas sets and holds it ac count able fortheir pres er va tion. Ex am ples of her -i tage as sets in clude the Wash ing tonMon u ment, Dec la ra tion of In de -pend ence, Yo sem ite Na tional Parkand mu seum ob jects on dis play atthe Smith so nian In sti tu tion.
The fol low ing dis cus sion of theGov ern ment’s her i tage as sets is notall-inclusive. Rather, it high lights
sig nif i cant her i tage as sets re ported by Fed eral agen cies.
The Gov ern ment clas si fies her i -tage as sets into three broad cat e go -ries:
• Col lec tion-type• Nat u ral• Cul tural
Col lec tion-type her i tage as setsin clude ob jects gath ered and main -tained for mu seum and li brary col -lec tions. Nat u ral her i tage as sets in -
clude na tional wil der ness ar eas,wild and sce nic rivers, nat u ral land -marks, for ests and grass lands. Cul -tural her i tage as sets in clude his toric places and struc tures, me mo ri alsand mon u ments, na tional cem e ter -ies, and ar che o log i cal sites.
See the Stew ard ship Land sec tionfor the to tal acre age of some nat u ralher i tage as sets such as Na tionalFor ests.
HeritageAssets
Federal Stewardship Land
Source: Na tional At las of the United States of Amer ica, U.S. Geo log i cal Sur vey
The De part ment of In te rior’s Bu reau of Rec la ma tion (BOR )man ages 5.8 mil lion acres of Stew ard ship land. These landswere with drawn from the pub lic do main in sup port of BOR’sman date to pro vide ir ri ga tion wa ter, in dus trial wa ter, flood con -trol and power. How ever, if it does not in ter fere with pro jectpur poses, ac tiv i ties such as boat ing and camp ing, fish and wild -life man age ment or the graz ing of live stock may be au tho rized.
Bureau of
Reclamation

STEW ARD SHIP IN FOR MA TION 57
Con gress has des ig natedsev eral “wil der ness ar eas” topre serve their nat u ral con di -tions. The De part ment of theIn te rior man ages 255 of thesewil der ness ar eas com pris ing66.5 per cent of the Na tion’s103.7 mi l l ion wi l der nessacres. The Cebolla Wil der ness in New Mex ico is one sucharea.
The “Na tional wild and sce -nic rivers sys tem” in cludespro tected free-flowing rivers.The Gov ern ment pro tectsthese ar eas be cause of theirfish and wild life, or for theirsce nic, rec re ational, geo logic,his toric or cul tural value. TheDe part ment of the In te riorman ages 54 per cent of these
10,947 river miles, in clud ingthe Bluestone Na tional Sce nicRiver in West Vir ginia.
The Gov ern ment also setsaside nat u ral land marks thatex em plify a re gion’s nat u ralchar ac ter is tics. The Na tionalPark Ser vice iden ti fies 587 na -tional nat u ral land marks, suchas the Gar den of the Gods inCol o rado.
The U.S. For est Ser viceman ages 155 Na tional For estsand 20 na tional grass lands onover 192.0 mil l ion acres.These ar eas en com pass sig nif -i cant her i tage re sources. Ex -am ples in clude the WhiteMoun tain Na tional For est inNew Hamp shire and theThun der Ba s in N a tionalGrass land in Wy o ming.
Natural Heritage Assets
The Na tional Reg is ter of His toricPlaces lists his toric places and struc -tures. This is Amer ica’s of fi cial list of cul tural re sources wor thy of pres er -va tion. Of fi cial prop er ties in cludedis tricts, sites, build ings, struc turesand ob jects sig nif i cant to Amer i canhis tory. It also in cludes sig nif i cant ar -chi tec tural, ar chae o log i cal en gi neer -ing and cul tural prop er ties. For estSer vice land en com passes 887 suchprop er ties.
The Na tion’s mon u ments and me -mo ri als in clude the Wash ing tonMon u ment, the Viet nam Vet eransMe mo rial and the Jef fer son Me mo -rial in Wash ing ton, D.C. The Na -tional Park Ser vice man ages these.Also, the Amer i can Bat tle Mon u -ments Com mis sion man ages 27 me -
mo ri als, mon u ments and mark ersaround the world. This in cludes theBelleau Wood Ma rine Mon u ment inFrance.
Ar che o log i cal sites con tain the re -mains of hu man ac tiv ity. The De part -ment of the In te rior man ages over290,000 ar che o log i cal sites. The an -cient earthen mounds at the Hopewell Cul ture Na tional His toric Site inOhio are no ta ble ex am ples.
Na tional cem e ter ies in clude theArlington Na tional Cem e tery in Vir -ginia and the Fort Lo gan Na tionalCem e tery in Col o rado. The De part -ment of the Army man ages theArlington Na tional Cem e tery. TheDe part ment of Vet erans Af fairs man -ages Fort Lo gan Na tional Cem e teryand 118 other cem e ter ies.
The Smith so nian In sti tu tionholds some of the most prom i nent Fed eral mu seum col lec tions. The Smith so nian ac quires, pro tectsand pre serves ap prox i mately 140mil lion in di vid ual ob jects forpub lic ex hi bi tion, ed u ca tion andre search.
Sim i larly, the Li brary of Con -gress holds the world’s larg est li -brary col lec tion. That col lec tioncom prises more than 115 mil lionitems. The Li brary re ceives twocop ies of ev ery book, pam phlet,map, print, pho to graph and pieceof mu sic reg is tered for copy rightin the United States.
The Na tional Ar chives holdsmore than 2 mil lion cu bic feet ofre cords. These re cords en sureready ac cess to es sen tial in for ma -tion doc u ment ing the rights of cit -i zens, ac tions of Fed eral of fi cialsand the ef fects of those ac tions onthe na tional ex pe ri ence. These re -cords in clude text and leg is la tivere cords; car to graphic and ar chi -tec tural re cords; mo tion pic ture,sound and video re cords; and stillpic tures and graph ics. The Na -tional Ar chives also main tainshis tor i cally im por tant doc u mentssuch as the U. S. Con sti tu tion andthe Lou i si ana Pur chase Treaty.
Collection-type HeritageAssets
Cultural Heritage Assets

58 STEW ARD SHIP IN FOR MA TION
Con gress passed the So cial Se cu -rity Act in 1935. The Act, as sub se -quently amended, in cludes pro gramsthat pro vide re tire ment and dis abil ityben e fits.
Con gress es tab lished two trustfunds for So cial Se cu rity: The Fed -eral Old-Age and Sur vi vors In sur -ance ( OASI) and the Fed eral Dis abil -i ty In sur ance (DI) Trus t Funds(OASDI). OASI pays re tire ment andsur vi vors ben e fits and DI pays ben e -fits to dis abled work ers.
Rev e nue to OASDI con sists pri -mar ily of taxes on earn ings paid byem ploy ees, their em ploy ers and theself-employed. OASDI also re ceivesrev e nue from the in come taxes onsome So cial Se cu rity and in ter est onits in vest ments in Federal debt se cu ri -ties. So cial Se cu rity rev e nues notneeded to pay cur rent ben e fits or ad -min is tra tive ex penses are in vested inspe cial-issue Federal debt se cu ri ties.Those se cu ri ties are guar an teed as toboth prin ci pal and in ter est and backed by the full faith and credit of the Gov -ern ment.
The Board of Trustees of the OASIand DI Trust Funds pro vides in its
An nual Re port to the Pres i dent andCon gress short-range (10 year) andlong-range (75 year) ac tu ar ial es ti -mates of each trust fund. Be cause ofthe in her ent un cer tainty in es ti matesfor 75 years into the fu ture, the Boardof Trustees uses three al ter na tive setsof eco nomic and de mo graphic as -sump tions to show the range of pos si -bil i ties. As sump tions are made aboutmany eco nomic, and de mo graphicfac tors, in clud ing gross do mes ticprod uct, earn ings, the Con sumerPrice In dex (CPI), the un em ploy ment rate, the fer til ity rate, im mi gra tion,mor tal ity, and dis abil ity in ci denceand ter mi na tions. The as sump tionsused in the ac com pa ny ing ta bles gen -er ally re ferred to as the “in ter me di ateas sump tion,” re flect the best es ti mateof ex pected fu ture ex pe ri ence, un dercur rent law.
The pres ent val ues of ac tu ar ial es ti -mates were com puted as of Jan u ary 1, 1999, the be gin ning of the val u a tionpe riod. The ac tu ar ial es ti mated con -tri bu tions equal the sum of the pres ent value of all es ti mated non-interest in -come dur ing the pe riod. The ac tu ar iales ti mated ex pen di tures equal the sum
of the pres ent value of all es ti matedpay ments dur ing the val u a tion pe riod. These es ti mates were pre pared us ingthe fi nanc ing method deemed themost ap pro pri ate by both Con gressand the Board of Trustees. Es ti matesas sume the pro gram will cover fu turework ers as they en ter the la bor force.
Un der cur rent leg is la tion and us ingin ter me di ate as sump tions, the DI andOASI Trust Funds are pro jected to beex hausted in 2020 and 2036 re spec -tively. Com bined OASDI ex pen di -tures will ex ceed cur rent tax in comebe gin ning in 2014 and will ex ceed to -tal cur rent in come (in clud ing cur rentin ter est in come) for cal en dar years2022 and later. Thus, cur rent tax in -come plus a por tion of an nual in ter estin come will be needed to meet ex pen -di tures for the years 2014 through2021. There af ter, in ad di tion to cur -rent tax in come and cur rent in ter estin come, a por tion of the prin ci pal(com bined OASDI as sets) will beneeded each year un til the trust fundas sets are to tally ex hausted in 2034.At that point, cur rent tax in come willbe suf fi cient to pay only ap prox i -mately 71 per cent of the ben e fits due.
Social
Security
Stewardship Responsibilities
-20,0 00
-15,0 00
-10,0 00
-5,0 00
0
5,0 00
2001 20 13 2 025 2037 20 49 2 061 2073
(Inb illions ofd o lla rs )
F ederal Old-Age and S urvivorsInsu ran ce Tru st Fund Net Ass ets
Fe deralDisab ility Ins uranc eTrust Fu nd Net As sets
Fisc alyear s
Social Security Estimated Trust Fund BalancesStew ard ship Responsibilities pro -
vides in for ma tion on the larg estSocial Insurance pro grams: So cialSe cu rity, Medicare, Rail road Re tire -ment, Black Lung and Un em ploy -ment In sur ance. Its pur pose is to as -s i s t the Amer i can peo ple inevaluating the fi nan cial con di tionand sustainability of these pro grams.

STEW ARD SHIP IN FOR MA TION 59
Social Security Present Value Estimates for the Period of 75 Years into the Future, as of January 1, 1999(In billions of dollars) OASI DI O ASDI
Present value of contributions to December 31, 2074 . . . . . . . . . . . . . . . . . . . . . . . . . . 16,830 2,763 19,593
Present value of expendituresto December 31, 2074 . . . . . . . . . . . . . . . . . . . . . . . . . . 19,925 3,366 23,291
Present value of future resources needed . . . . . . . . . . . . . 3,095 603 3,698
Less: Net assets of Social Security as of January 1, 1999 . 682 81 763
Present value of additional resources needed . . . . . . . . . . 2,413 522 2,935
Social Security, cont.
Fed eral Hos pi tal In sur ance TrustFund rev e nue con sists pri mar ily oftaxes on earn ings paid by em ploy ees,the i r em ploy ers and the sel f -e m ployed. The fund also re ceivesrev e nue from part of the tax a tion ofSo cial Se cu rity ben e fits and from in -ter est on its in vest ments in Fed eraldebt se cu ri ties. Rev e nues not neededto pay cur rent ben e fits of the Fed eralHos pi tal In sur ance pro gram(Medicare Part A) or ad min is tra tiveex penses are in vested in spe cial is sueFed eral debt se cu ri ties. These se cu ri -ties bear a mar ket rate of in ter est andare guar an teed both as to prin ci paland in ter est. In ad di tion, the se cu ri ties are backed by the full faith and creditof the U.S. Gov ern ment.
The pres ent val ues of ac tu ar ial es -ti mates were com puted as of the be -gin ning of the val u a tion pe riod,Sep tem ber 30, 1999. The con tri bu -tions con sist of the sum of the pres entvalue of var i ous pro gram in comeitems ex pected to be re ceived through fis cal 2074. The ex pen di ture con sistsof the sum of the pres ent value of es -ti mated payments through fis cal2074, claims in curred through Sep -tem ber 30, 1999, that were un paid asof that date, and ad min is tra tive ex -penses re lated to those claims. Un derin ter me di ate as sump tions from the
1999 Trustees Re port, and leg is la tion in place at the time, the fund is pro -jected to be ex hausted in the cal en daryear 2015.
Ap pro pri a tions as well as pre mi -ums paid by med i cal ben e fi cia ries fi -nance the ben e fits and ad min is tra tiveex penses of the Fed eral Sup ple men -tary Med i cal In sur ance (SMI) pro -gram (Medicare Part B). The Bal -anced Bud get Act of 1997 pro videsthat the monthly pre mium be set tocover 25 per cent of the Medicare Part
B pro gram’s es ti mated cost of eachcal en dar year’s es ti mated Fed eralSup ple men tary Med i cal In sur ance pro gram costs.
Medicare Part B has a sur plus of$35.2 bil lion. This rep re sents the es ti -mated book value amount of the Fed -eral Sup ple men tary Med i cal In sur anceTrust Fund as sets as of Sep tem ber 30,1999, less un paid ben e fits and re latedad min is tra tive ex penses in curredthrough Sep tem ber 30, 1999.
Medicare
10
30
50
70
90
1 10
1 30
1 50
20 00 2003 20 06 2009 2012 2 01 5
Ca lend a r y ea rs
( In billio ns of dolla rs )
Estimated Balances of Federal HospitalInsurance Trust Fund (Medicare Part A) Under Intermediate Assumptions

60 STEW ARD SHIP IN FOR MA TION
Medicare Part A (Hospital Insurance)Present Value Estimates for the Period of 75 Years into the Future, Beginning September 30, 1999
(In billions of dollars)Present value of contributions
to the year 2074 . . . . . . . . . . . . . . . . . . . . . . . . . . . . . . . . . . . . . . . . . 6,538.6Present value of expenditures
to the year 2074 . . . . . . . . . . . . . . . . . . . . . . . . . . . . . . . . . . . . . . . . . 9,615.2Present value of future resources needed . . . . . . . . . . . . . . . . . . . . . . 3,076.6Less: Net assets in Federal Hospital Insurance
Trust Fund as of September 30 (Note 19) . . . . . . . . . . . . . . . . . . . . . 141.4
Present value of additional resources needed. . . . . . . . . . . . . . . . . . . . 2,935.2
Medicare Part B (Supplementary MedicalInsurance) Balancesas of September 30, 1999
(In billions of dollars)
Total Federal Supplementary Medical Insurance Trust Fund assets (Note 19) . . . . . . . . . . . . . . . 45.6
Total unpaid benefits . . . . . . . . . . . . . . . . . . . . . . . 10.4
Excess of trust fund assets over unpaid benefits . . . . . . . . . . . . . . . . . . . 35.2
Rail road re tire ment pays full an nu -ities when el i gi ble per sons reach age65 with 10 years of ser vice or age 62with 30 years of ser vice. It pays re -duced an nu ities to el i gi ble ben e fi cia -ries who are age 62 with 10 to 29years of ser vice, or age 60 with 30years of ser vice. The Rail road Re tire -ment pro gram pays dis abil ity an nu -ities based on to tal or oc cu pa tionaldis abil ity. It also pays an nu ities to di -vorced spouses, re mar riedwidow(er)s, sur viv ing di vorcedspouses, chil dren and par ents of de -ceased rail road work ers. Medicarecov ers qual i fied rail road re tire ment
ben e fi cia ries in the same way as So -cial Se cu rity ben e fi cia ries.
The Rail road Re tire ment Board(RRB) and So cial Se cu rity Ad min is -tra tion (SSA) share ju ris dic tion overthe pay ment of re tire ment and sur vi -vors ben e fits. RRB has ju ris dic tionover the pay ment of re tire ment ben e -fits if the em ployee had at least 10years of rail road ser vice. Ad di -tionally, for sur vi vor ben e fits, RRBre quires that the em ployee’s last reg -u lar em ploy ment be fore re tire ment or death was in the rail road in dus try. If arail road em ployee or his or her sur vi -vors do not qual ify for rail road re tire -
ment ben e fits, the RRB trans fers theem ployee’s rail road re tire ment cred -its to SSA. SSA treats them as So cialSe cu rity cred its.
Pay roll taxes paid by rail road em -ploy ers and their em ploy ees pro videthe pri mary source of in come for theRail road Re tire ment-Survivor Ben e -fit pro gram. By law, rail road re tire -ment taxes are co or di nated with So -cial Se cu rity taxes. Em ployees andem ploy ers pay tier I taxes at the samerate as So cial Se cu rity taxes. Tier IItaxes fi nance rail road re tire ment ben -e fit pay ments that are higher than So -cial Se cu rity lev els.
Railroad Retirement

STEW ARD SHIP IN FOR MA TION 61
Railroad Retirement Account Present Value Estimates for the Period of 75 Years into the Future,Beginning September 30, 1999*
(In billions of dollars)
Present value of contributions to December 31, 2074 . . . . . . . . . . . . . . . . . . . . . . . . . . 66.5
Present value of expenditures to December 31, 2074 . . . . . . . . . . . . . . . . . . . . . . . . . . 75.5
Present value of excess estimated expenditures overestimated contributions . . . . . . . . . . . . . . . . . . . . . . . . . . . . . . . . . . . . . . . . . . . . . . . 9.0
Assets in the Railroad Retirement Account as of September 30, 1999. . . . . . . . . . . . . 21.9
*These fig ures take into ac count fu ture en trants as well as for mer and pres ent em ploy ees.
0
10
20
30
40
50
60
70
2000 2012 2024 20 36 2048 2060 2 072
Annual co ntributions
An nual e xpen diture s
Fis c al ye ars
(In billions o fdollars )
Railroad Retirement Account Estimated ActivityRailroadRetirement,cont.
Other sources of pro gram in comein clude:
• Fi nan cial in ter changes withthe So cial Se cu rity trust funds.• In ter est on in vest ments.• Rev e nue re sult ing from Fed -eral in come taxes on rail roadre tire ment ben e fits.• Ap pro pri a tions (pro vided af -ter 1974 as part of a phase-outof cer tain vested dual ben e fits).
The net book value of as sets in theRail road Re tire ment Ac count at Sep -tem ber 30, 1999, was $21.9 bil lion.

62 STEW ARD SHIP IN FOR MA TION
The Black Lung Dis -abil ity Ben e fits pro gram com pen sates el i gi blecoal min ers who are dis -abled be cause of em -ploy ment-related pneu -mo co ni o sis (black lungdis ease). The pro grampro vides both med i caland sur vi vor ben e fits.Un der Part C, the BlackLung Dis abil ity TrustFund (BLDTF) pro videsben e fit pay ments to el i -gi ble dis abled min erswhen no re spon si blemine op er a tor can be as -signed the li a bil ity. TheDe par t ment of La bor(La bor) op er ates Part Cof the Black Lung Dis -abil ity Ben e fits pro gram.
Ex cise taxes on coal mine op er a -tors, based on the sale of coal, par -tially fund the black lung dis abil itypay ments and the re lated ad min is tra -tive and in ter est costs. Intragovern-men tal ad vances to the Black LungDis abil ity Trust Fund, which must bere paid with in ter est, fund the short -fall.
Un der cur rent con di tions, an a lystspro ject that sched uled re duc tion intaxes on coal sales will de crease cash
in flows for the year 2014 and be yond. Be tween the years 2013 and 2015,pro jec tions es ti mate a 49-percent de -crease in ex cise tax col lec tions. Bythe year 2040, the rate re duc tion is ex -pected to de crease cash in flows by ato tal of more than $12.6 bil lion.
To ad dress the Black Lung Dis abil -ity Trust Fund’s grow ing def i citprob lem, the fis cal 2001 bud get statesthat the Ad min is tra tion will pro poseleg is la tion that will re struc ture the
BLDTF debt and ex tend ex cise taxesat cur rent rates.
The to tal li a bil i ties (net borrowings from Trea sury to cover ben e fit pay -ments) of the Black Lung Dis abil ityTrust Fund ex ceed as sets by $6.3 bil -lion. This def i cit rep re sents the ac cu -mu lated short fall of ex cise taxes nec -es sary to meet ben e fit pay ments andin ter est ex penses. Intragovernmentalad vances, which the Trust Fund mustre pay with in ter est, fi nance the short -fall.
Black Lung Benefits
Black Lung Disability Trust Fund Present Value Estimatesfor the Period of 41 Years into the Future, Beginning September 30, 1999
(In billions of dollars)
Present value of contributions to September 30, 2040 . . . . . . . . . . . . . . . . . . . . . . . . . . 9 .4
Present value of expenditures to September 30, 2040 . . . . . . . . . . . . . . . . . . . . . . . . . . 16.7
Present value of excess estimated expenditures overestimated contributions . . . . . . . . . . . . . . . . . . . . . . . . . . . . . . . . . . . . . . . . . . . . . . . 7 .3
Excess of liabilities over assets in the Black Lung Disability Trust Fund . . . . . . . . . . . . .as of September 30, 1999 . . . . . . . . . . . . . . . . . . . . . . . . . . . . . . . . . . . . . . . . . . . . . (6.3)
Black Lung Fund Estimated Activity
0
50 0
1, 00 0
1, 50 0
2, 00 0
2, 50 0
20 00 20 10 2020 2030 20 40Fis cal ye ar s
Annua le xpenditures
Annual con tributions
(In millions o fdollars )

STEW ARD SHIP IN FOR MA TION 63
Con gress cre ated the Un em -ploy ment Trust Fund in 1935.The Fund pro vides in come as sis -tance to un em ployed work erswho have lost their jobs throughno fault of their own. A uniquesys tem of Fed eral and State part -ner ships ad min is ters the Un em -ploy ment In sur ance pro gram.Al though es tab lished by Fed erallaw, State of fi cials ex e cute thepro gram. La bor pro vides broadpol icy guid ance and pro gram di -rec tion. State unemployment in -sur ance stat utes es tab lish lo calpro gram de tails, which they ad -min is ter.
Fed eral and State un em ploy -ment taxes paid by em ploy ers fi -nance the Un em ploy ment TrustFund. The Gov ern ment de pos itsthose funds in the Un em ploy -ment Trust Fund and re ports thein come as Fed eral tax rev e nue.
To tal Un em ploy ment TrustFund as sets ex ceeded li a bil i tiesby $78.9 bil lion. This bal anceap prox i mates the ac cu mu latedsur plus of tax rev e nues and theearn ing on these rev e nues. Thissur plus re mains avail able to sup -ple ment fu ture ben e fit pay mentsif and when an nual rev e nues be -come in suf fi cient. Trea sury in -vests the sur plus in Fed eral debtse cu ri ties.
Unemployment Insurance
Unemployment Trust Fund Present ValueEstimates in Nominal Dollars for the Periodof 9 Years into the Future, Beginning September 30, 1999
(In billions of dollars)
Present value of contributionsto September 30, 2008 . . . . . . . . . . . . . . 296.1
Present value of expenditures to September 30, 2008 . . . . . . . . . . . . . . 262.3
Present value of excess estimated contributions over estimated expenditures . . . . . . . . . . .
33.8
Excess of assets over liabilities in the Unemployment Trust Fund as of September 30, 1999 (Note 19). . . . . 78.9
Unemployment Fund Estimated Activity
0
10
20
30
40
50
60
1 999 2 001 2003 2005 20 07Fisca l ye ars
Annual co ntribu tions
Annual e xpenditure s
(In b illions o f dolla rs)

64 STEW ARD SHIP IN FOR MA TION
StewardshipInvestments
The Fed eral Gov ern ment makesgrants and pro vides funds for thepur chase, con struc tion and/or ma -jor ren o va tion of State and lo calgov ern ment phys i cal prop er ties.
The Fed eral High way Ad min is -tra tion re im burses States for con -struc tion costs on pro jects re latedto the Fed eral High way sys tem.Im prove ments to na tional high -ways, in ter state sys tems, sur face
trans por ta tion as well as con ges -tion mit i ga tion and air qual ityim prove ment are backed by theseef forts. States con trib ute 10 per -cent of the cost for in ter state sys -tem im prove ments and 20 per centof costs for other con struc tion.
The En vi ron men tal Pro tec tionAgency (EPA) pro vides in fra struc -ture as sis tance to State and tribalgov ern ments. This as sis tance is inthe form of grants for the con struc -tion of wastewater and drink ingwa ter treat ment fa cil i ties andground wa ter pro tec tion.
Mean while, for mula grants as -sist ur ban and non-urban ar eas.States and lo cal i ties use thesegrants for a va ri ety of mass tran sitpur poses in clud ing plan ning, con -
struc tion of fa cil i ties, and pur -chases of rai lcars and buses.Funding also pays for trans por ta -tion for the el derly and dis abled.
The Fed eral Avi a tion Ad min is -tra tion’s (FAA’s) Air Trans por ta -tion pro gram pro vides fund ing tosus tain the cur rent in fra struc tureand ad vances mod ern iza tion andim prove ment of the Na tional Air -space sys tem.
Gen eral Tran sit Ad min is tra tiondiscretionary grants pro vide cap i -tal as sis tance to fi nance ac qui si -tion, con struc tion, re con struc tionand im prove ment of fa cil i ties andequip ment. Dis cre tion ary grantsfund the cat e go ries of new starts,fixed guid ance mod ern iza tion andbus and bus-related ac tiv i ties.
Investments in Non-Federal Physical Property for the Period EndedSeptember 30
(In billions of dollars)
Highway program . . . . . . . . . . . . . . . . . . . . . . . . . . . . . . . . . . . . . . . . . . . . . . . . . . 22.9
Water infrastructure grants, Environmental Protection Agency . . . . . . . . . . . . . . . . . 2.2
Formula grants . . . . . . . . . . . . . . . . . . . . . . . . . . . . . . . . . . . . . . . . . . . . . . . . . . . . 2.1
Air transportation . . . . . . . . . . . . . . . . . . . . . . . . . . . . . . . . . . . . . . . . . . . . . . . . . . 1.6
General Transit Administration . . . . . . . . . . . . . . . . . . . . . . . . . . . . . . . . . . . . . . . . 1.5
Economic Development Administration . . . . . . . . . . . . . . . . . . . . . . . . . . . . . . . . . . 0.4
Washington Metro . . . . . . . . . . . . . . . . . . . . . . . . . . . . . . . . . . . . . . . . . . . . . . . . . 0.2
Investments from all other programs . . . . . . . . . . . . . . . . . . . . . . . . . . . . . . . . . . . . 0.3
Fiscal 1999 investments in non-Federal physical property . . . . . . . . . . . . . . . . . . 31.2
Non-FederalPhysicalProperty
Stew ard ship Investments fo cus onG ov ern ment pro grams aimed at pro -vid ing long-term ben e fits by im prov -ing the Nation’s pro duc tiv ity and en -hanc ing eco nomic growth. Theseinvestments can be pro vided throughdi rect Fed eral spend ing or grants toState and lo cal gov ern ments for cer -
tain ed u ca tion and train ing pro grams,re search and de vel op ment, and fed er -ally fi nanced but not fed er ally owned prop erty, such as bridges and roads.When in curred, these in vest ments are in cluded as expenses in de ter min ingthe net cost of op er a tions.

STEW ARD SHIP IN FOR MA TION 65
The Fed eral Gov ern ment runs sev -eral pro grams that in vest in hu man cap -i tal. Those in vest ments go to ward in -creas ing and main tain ing a healthyecon omy by ed u cat ing and train ing thegen eral pub lic. Costs do not in cludetrain ing ex penses for Fed eral work ers.
Ed u ca tion Grants andAd min is tra tive Pro grams
Ed u ca tion grant ac tiv i ties cover im -prove ments of both pub lic and pri vatepre school and sec ond ary ed u ca tion; as -sis tance to post-secondary ed u ca tionalin sti tu tions and stu dents pur su ing apost-sec ond ary ed u ca tion; pro gramsthat as sist in ed u cat ing chil dren andadults with spe cial needs and dis abil i -ties; bi lin gual ed u ca tion; and vo ca -tional-technical ed u ca tion.
Em ploy ment and TrainingAd min is tra tion
The De part ment of La bor pro videsjob train ing for the gen eral pub lic to in -crease and main tain na tional eco nomicpro duc tive ca pac ity. Pro grams in clude: adult em ploy ment and train ing; dis lo -cated worker em ploy ment and train ing; youth train ing; school-to-work op por -tu ni ties; Job Corps; train ing pro gramsfor Na tive Amer i cans and mi grant andsea sonal farm work ers.
Fed eral Fam ily Ed u ca tionLoan Pro gram
The Fed eral Fam ily Ed u ca tion Loanpro gram op er ates with State and pri vate non profit guar anty agen cies to pro videloan guar an tees and in ter est sup ple -ments on loans by pri vate lend ers to el i -gi ble stu dents at tend ing par tic i pat ingpost-secondary schools.
Vet erans Ben e fitsAd min is tra tion
This agency pro vides train ing to as -sist dis abled vet er ans to be come em -
ploy able. Ed u ca tional as sis tance also is pro vided to vet er ans un der the GIbill.
Na tional In sti tute of Health (NIH)
The NIH Re search and Training andCa reer De vel op ment pro gram ad -dresses the need for trained per son nelto con duct med i cal re search. The pri -mary goal is to pro duce highly trainedin ves ti ga tors who are likely to per formre search that will ben e fit the Na tion’shealth.
Vet erans HealthAd min is tra tion
This agency pro vides ed u ca tion andtrain ing ef forts for health pro fes sionstu dents and res i dents through part ner -ships with af fil i ated ac a demic in sti tu -tions.
Bu reau of In dian Af fairsThis agency pro vides ed u ca tion and
Job Corps pro grams.
Investments in Human Capital for the Period Ended September 30(In billions of dollars)
Education grants and administrative programs . . . . . . . . . . . . . . . . . . . . . . . . . . . . . 31.5 Employment and training administration . . . . . . . . . . . . . . . . . . . . . . . . . . . . . . . . . . 5.5 Federal family education loans program . . . . . . . . . . . . . . . . . . . . . . . . . . . . . . . . . . 3.1 Veterans Benefits Administration . . . . . . . . . . . . . . . . . . . . . . . . . . . . . . . . . . . . . . . 1.6 National Institutes of Health . . . . . . . . . . . . . . . . . . . . . . . . . . . . . . . . . . . . . . . . . . . 0.8 Veterans Health Administration. . . . . . . . . . . . . . . . . . . . . . . . . . . . . . . . . . . . . . . . . 0.7 Bureau of Indian Affairs. . . . . . . . . . . . . . . . . . . . . . . . . . . . . . . . . . . . . . . . . . . . . . 0.5
Investments from all other programs. . . . . . . . . . . . . . . . . . . . . . . . . . . . . . . . . . . . . 1.3
Fiscal 1999 investments in human capital . . . . . . . . . . . . . . . . . . . . . . . . . . . . . . . 45.0
Fed eral in vest ments in re searchand de vel op ment com prise those ex -penses for ba sic re search, ap plied re -search and de vel op ment that are in -tended to in crease or main tainna tional eco nomic pro duc tive ca pac -ity or yield other fu ture ben e fits.
In vest ments in ba sic re search are asys tem atic study to gain knowl edge
or un der stand ing of the fun da men talas pects of phe nom ena and of ob serv -able facts with out spe cific ap pli ca -tions to ward pro cesses or prod ucts inmind.
In vest ments in ap plied re search area sys tem atic study to gain knowl edgeor un der stand ing nec es sary for de ter -
min ing the means by which a rec og -nized and spe cific need may be met.
In vest ments in de vel op ment aresys tem atic use of the knowl edge andun der stand ing gained from re searchfor the pro duc tion of use ful ma te ri als, devices, sys tems, or meth ods, in clud -ing the de sign and de vel op ment ofpro to types and pro cesses.
Human Capital
Research and Development

66 STEW ARD SHIP IN FOR MA TION
Investments in Development for the Period Ended September 30(In billions of dollars)
Department of Defense. . . . . . . . . . . . . . . . . . . . . . . . . . . . . . . . . . . . . . . . . . . . . . 31.9Science, Aeronautics and Technology . . . . . . . . . . . . . . . . . . . . . . . . . . . . . . . . . . . 2.7Human Space Flight . . . . . . . . . . . . . . . . . . . . . . . . . . . . . . . . . . . . . . . . . . . . . . . . 2.5Department of Energy . . . . . . . . . . . . . . . . . . . . . . . . . . . . . . . . . . . . . . . . . . . . . . . 2.2National Institutes of Health . . . . . . . . . . . . . . . . . . . . . . . . . . . . . . . . . . . . . . . . . . 1.7
Investments from all other programs . . . . . . . . . . . . . . . . . . . . . . . . . . . . . . . . . . . . 0.4
Fiscal 1999 investments in development. . . . . . . . . . . . . . . . . . . . . . . . . . . . . . . .41.4
Investments in Basic Research for the Period Ended September 30(In billions of dollars)
National Institutes of Health . . . . . . . . . . . . . . . . . . . . . . . . . . . . . . . . . . . . . . . . . . 7 .9Department of Energy. . . . . . . . . . . . . . . . . . . . . . . . . . . . . . . . . . . . . . . . . . . . . . . 2 .5Science, Aeronautics and Technology . . . . . . . . . . . . . . . . . . . . . . . . . . . . . . . . . . . 1 .8Department of Defense. . . . . . . . . . . . . . . . . . . . . . . . . . . . . . . . . . . . . . . . . . . . . . 1 .1Environmental Protection Agency . . . . . . . . . . . . . . . . . . . . . . . . . . . . . . . . . . . . . . 0 .6Agricultural Research. . . . . . . . . . . . . . . . . . . . . . . . . . . . . . . . . . . . . . . . . . . . . . . 0 .4Cooperative State Research, Education and Extension Service . . . . . . . . . . . . . . . . 0 .2
Investments from all other programs . . . . . . . . . . . . . . . . . . . . . . . . . . . . . . . . . . . . 1 .1
Fiscal 1999 investments in basic research . . . . . . . . . . . . . . . . . . . . . . . . . . . . . . 15 .6
Investments in Applied Research for the Period Ended September 30(In billions of dollars)
National Institute of Health . . . . . . . . . . . . . . . . . . . . . . . . . . . . . . . . . . . . . . . . . . . 3 .9Department of Defense. . . . . . . . . . . . . . . . . . . . . . . . . . . . . . . . . . . . . . . . . . . . . . 3 .0Science, Aeronautics and Technology . . . . . . . . . . . . . . . . . . . . . . . . . . . . . . . . . . . 2 .6Department of Energy . . . . . . . . . . . . . . . . . . . . . . . . . . . . . . . . . . . . . . . . . . . . . . . 2 .0National Oceanic and Atmospheric Administration . . . . . . . . . . . . . . . . . . . . . . . . . . 1 .0U.S. Geological Survey. . . . . . . . . . . . . . . . . . . . . . . . . . . . . . . . . . . . . . . . . . . . . . 0 .7
Investments from all other programs . . . . . . . . . . . . . . . . . . . . . . . . . . . . . . . . . . . . 3 .0
Fiscal 1999 investments in applied research. . . . . . . . . . . . . . . . . . . . . . . . . . . . . 16 .2
Research and Development, cont.

STEW ARD SHIP IN FOR MA TION 67
The Cur rent Ser vices As sess mentta ble shows the Of fice of Man age ment and Bud get’s (OMB’s) es ti mated re -ceipts, out lays, and sur plus or def i cit in the bud get if no changes are made tolaws that are al ready en acted. Re ceipts and man da tory out lays, such as So cialSe cu rity ben e fits and net in ter est, in -volve on go ing ac tiv i ties that gen er allyop er ate un der per ma nent le gal au thor -ity au tho rized by leg is la tion. The cur -rent ser vices es ti mates of re ceipts andman da tory spend ing as sume that re -ceipts and man da tory spend ing con -tinue in the fu ture as spec i fied by cur -rent laws. The cur rent ser viceses ti mates for dis cre tion ary spend ingas sume dis cre tion ary fund ing for fis -
cal 2000 equals ap pro pri a tions en acted by Con gress. It also as sumes that dis -cre tion ary fund ing for sub se quentyears holds con stant in real terms. Be -cause laws al ready en acted pro vide the bases for cur rent ser vices es ti mates,they do not con sti tute a pro posed bud -get, nor do they pre dict the most likelybud get out comes.
The cur rent ser vices es ti mates maybe used to as sess the sustainability ofpro grams un der cur rent law. That is,they may be used to pro ject if fu turere sources can sus tain pub lic ser vicesand meet ob li ga tions as they comedue. In this way, they can warn of fu -ture prob lems in her ent in cur rent law.
They also can pro vide a bench markagainst which tax and spend ing pro -pos als can be com pared. Cur rent ser -vices es ti mates are use ful in as sess ingthe mag ni tude of pro posed changes.Also, they can pro vide an an a lyt i calper spec tive of Gov ern ment by show -ing the short- and me dium- term di rec -tion of cur rent pro grams.
The fol low ing sched ule pres ents theac tual bud get re sults for fis cal 1999and the cur rent ser vices es ti mates forall Fed eral taxes and spend ing pro -grams for the sub se quent 6 years. Itshows re ceipts by source and out laysby func tion. The es ti mates for theseyears are iden ti cal to the cur rent ser -vices es ti mates in the Pres i dent’s bud -get for fis cal 2001. The fol low ing es ti -mates are based on the sameeco nomic, pro gram matic and othertech ni cal as sump tions as the cur rentser vices es ti mates doc u ment.
Current Services Assessment
Current Services Assessment Receipt and Outlay Estimatesas Presented in the President's Budget
(In billions of dollars)
BaseFiscalYear1999 2000 2001 2002 2003 2004 2005
Receipts: Individual income
taxes . . . . . . . . . . . 879 952 978 1,006 1,040 1,086 1,143 Corporate income
taxes . . . . . . . . . . . 185 192 190 190 192 196 205Social Insurance and
retirement receipts . 612 650 683 713 742 771 814 Excise taxes . . . . . . . 70 68 69 71 72 74 76 Other receipts . . . . . . 81 94 90 100 105 111 11 2
Total receipts . . . . . 1,827 1,956 2,010 2,080 2,151 2,238 2,350
Outlays:National defense . . . . 275 284 295 300 309 318 326Social Security. . . . . . 390 407 426 446 469 493 520Medicare . . . . . . . . . . 190 203 221 227 245 259 281Income Security . . . . . 238 249 261 274 286 297 310Health . . . . . . . . . . . . 141 154 166 179 191 205 220Veteran benefits and
services . . . . . . . . . 43 45 48 49 52 54 58Education, training,
employment and social services . . . . 56 63 69 70 72 74 76
Transportation. . . . . . 43 47 48 50 51 53 55Other programmatic
functions . . . . . . . . . 137 148 143 139 141 143 145Net interest . . . . . . . . 230 220 208 198 189 176 161Undistributed offsetting
receipts . . . . . . . . . (40) (43) (46) (49) (47) (47) (4 9)
Total outlays. . . . . . 1,703 1,777 1,839 1,883 1,958 2,025 2,103
Unified surplus. . . 124 179 171 197 193 213 247

68 STEW ARD SHIP IN FOR MA TION
Intentional Blank Page

NOTES TO THE FI NAN CIAL STATEMENTS 69
United States Gov ern ment Notes to the Fi nan cial State ments for the Year Ended Sep tem ber 30, 1999
Note 1. Sum mary of Sig nif i cant Ac count ing Pol icies
A. ReportingEntity
This Fi nan cial Re port in cludes thefi nan cial sta tus and ac tiv i ties of theex ec u tive branch and por tions of theleg is la tive and ju di cial branches ofthe Gov ern ment. This in cludes thoseGov ern ment cor po ra tions that arepart of the Fed eral Gov ern ment. TheAp pen dix con tains a list of sig nif i -cant Gov ern ment en ti ties in cluded inthese fi nan cial state ments and alsocon tains a par tial list of en ti ties ex -
cluded. For the pur poses of this doc u -ment, “Gov ern ment” re fers to theU.S. Gov ern ment. The fi nan cial re -port ing pe riod is the same used forthe an nual bud get. It is based on theGov ern ment’s fis cal year, whichends Sep tem ber 30.
Ma te rial intragovernmental trans -ac tions were elim i nated in con sol i da -tion, ex cept as de scribed in Note 16.
The Fi nan cial Re port was gen er ally based on gen er ally ac cepted ac count ing prin ci ples. Theseprin ci ples typ i cally rec og nize:
• Ex penses when in curred.
• Non-exchange rev e nues on a mod i fiedcash ba sis of ac count ing.• Ex change (earned) rev e nues when earned.
This ba sis of ac count ing dif fers from that usedfor bud get ary re port ing.
This fis cal year, new ac count ing stan dards be -came ef fec tive per tain ing to de ferred main te nance.
B. Basis of Accounting
C. RevenueRecognition
Gov ern ment rev e nue co mes from twosources: non-exchange trans ac tions andex change trans ac tions. Non-exchangerev e nues arise pri mar ily from ex er cise ofthe Gov ern ment’s power to tax and levydu ties, fines and pen al ties. Ex change(earned) rev e nues arise when a Gov ern -ment en tity pro vides goods and ser vicesto the pub lic for a price.
Re mit tances of non-exchange rev e nueare rec og nized when re ceived. Re latedre ceiv ables are rec og nized when mea sur -
able and le gally col lect ible. Re fundsand other off sets are rec og nized whenmea sur able and le gally pay able and net -ted against non-exchange rev e nue.
Earned rev e nue rep re sents rev e nueearned from user charges such as ad mis -sion fees to Fed eral parks, in sur ancepre mi ums, and fees on Fed eral hous ingand loan pro grams. It is rec og nizedwhen the Gov ern ment pro vides thegoods or ser vices.

70 NOTES TO THE FI NAN CIAL STATE MENTS
Di rect loans ob li gated and loanguar an tees com mit ted af ter fis cal1991 are re ported based on the pres -ent value of the net cash-flows es ti -mated over the life of the loan orguar an tee. The dif fer ence be tweenthe out stand ing prin ci pal of the loansand the pres ent value of their net cashinflows is rec og nized as a sub sidycost al low ance; the pres ent value ofes ti mated net cash out flows of theloan guar an tees is rec og nized as a li a -bil ity for loan guar an tees. The sub -sidy ex pense for di rect or guar an teedloans dis bursed dur ing a year is thepres ent value of es ti mated net cash
out flows for those loans or guar an -tees. A sub sidy ex pense also isrec og nized for mod i fi ca tions madedur ing the year to loans and guar an -tees out stand ing and for reestimatesmade as of the end of the year to thesub sidy al low ances or loan guar an teeli a bil ity for loans and guar an tees out -stand ing.
Di rect loans ob li gated and loanguar an tees com mit ted be fore fis cal1992 may be re ported un der the al -low ance-for-loss method or the pres -ent-value method. Un der the al low -ance-for-loss method, the out stand ing prin ci pal of di rect loans is re duced by
an al low ance for uncollect ibleamounts; and the li a bil ity for loanguar an tees is the amount the agencyes ti mates would more likely than notre quire a fu ture cash out flow to payde fault claims.
Un der the pres ent-value method,the out stand ing prin ci pal of di rectloans is re duced by an al low anceequal to the dif fer ence be tween theout stand ing prin ci pal and the pres entvalue of the ex pected net cash-flows;and the li a bil ity for loan guar an tees is the pres ent value of ex pected netcash out flows due to the loan guar an -tees.
“Taxes re ceiv able” pri mar ilycon sist of un col lected tax as sess -ments, pen al t ies and in ter estwhen tax pay ers have agreed theamounts are owed, or a court hasde ter mined the as sess ments areowed. The Bal ance Sheet does not in clude un paid as sess ments whennei ther tax pay ers nor a court hasagreed that the amounts are owed
(com pli ance as sess ments) or theGov ern ment does not ex pect fur -ther col lec tions due to fac torssuch as the tax payer’s death,bank ruptcy or in so l vency(writeoffs). Taxes re ceiv able arere ported net of an al low ance forthe es ti mated por tion deemed tobe uncollectible.
E. Taxes Receivable
“Prop erty, plant and equip ment” used in Gov ern ment op er a tions arecar ried at cost. De pre ci a tion and am or ti za tion ex pense ap plies to prop -erty, plant and equip ment re ported in the Bal ance Sheet ex cept land, un -lim ited du ra tion land rights, and con struc tion in prog ress. De pre ci a tionis rec og nized us ing the straight-line method over the as sets es ti mateduse ful lives.
“Pen sion and post-retirement health ben e fit ex penses” are re corded dur -ing the time em ployee ser vices are ren dered. The re lated li a bil i ties for de -fined ben e fit pen sion plans and post-retirement health ben e fits are re -corded at es ti mated pres ent value of fu ture ben e fits, less the es ti matedpres ent value of fu ture nor mal cost con tri bu tions.
“Nor mal cost” is the por tion of the ac tu ar ial pres ent value of pro jectedben e fits al lo cated as ex pense for em ployee ser vices ren dered in the cur rent year. Ac tu ar ial gains and losses (and prior and past ser vice cost, if any) arerec og nized im me di ately in the year they oc cur, with out am or ti za tion.
H. Pension andPost-RetirementHealth BenefitsPrograms
F. Inventoriesand RelatedProperty
“In ven tories” are val ued at his tor -i cal cost. His tor i cal cost meth ods in -clude first-in-first-out, weighted av -er age and mov ing av er age.Es ti mated re pair costs re duce thevalue of in ven tory held for re pair.Ex cess, ob so lete and un ser vice ablein ven to ries are val ued at es ti matednet re al iz able val ues.
D. Direct Loansand Loan Guarantees
G. Property, Plantand Equipment

NOTES TO THE FI NAN CIAL STATEMENTS 71
“En vi ron men tal li a bil i ties” are re -corded at the es ti mated cur rent costto remediate haz ard ous waste and en -vi ron men tal con tam i na tion, as sum -ing the use of cur rent tech nol ogy.Remediation con sists of re moval,treat ment and/or safe con tain ment.Where tech nol ogy does not ex ist tocleanup haz ard ous waste, only thees ti ma ble por tion of the li a bil ity, typ -i cally safe con tain ment, is re corded.
I. EnvironmentalLiabilities
“De ferred main te nance” is main te nance that was not per formedwhen it should have been or was sched uled to be per formed and, there -fore, is put off or de layed for a fu ture pe riod. Main te nance is the act ofkeep ing fixed as sets in ac cept able con di tion in clud ing pre ven ta tivemain te nance, nor mal re pairs, and other ac tiv i ties needed to pre servethe as set so that it con tin ues to pro vide ac cept able ser vices andachieves its ex pected life. Main te nance ex cludes ac tiv i ties aimed atex pand ing the ca pac ity of an as set or oth er wise up grad ing it to serveneeds dif fer ent from those orig i nally in tended. “De ferred main te -nance” in for ma tion is dis closed in the Sup ple men tal In for ma tion to the Fi nan cial State ments.
De ferred main te nance ex penses are not ac crued in the State ment ofNet Cost, or rec og nized as li a bil i ties on the Bal ance Sheet.
Li a bil i ties for con tin gen ciesare rec og nized on the Bal anceSheet when both:
• A past trans ac tion orevent has oc curred.• A fu ture out flow orother sac ri fice of re -sources is prob a ble andmea sur able.
The es ti mated con tin gent li a -bil ity may be a spe cific amountor a range of amounts. If someamount within the range is abetter es ti mate than any other
amount within the range, thenthat amount is rec og nized. If noa mount within the range is abetter es ti mate than any otheramount, then the min i mumamount in the range is rec og -nized.
Con tin gent li a bil i ties that donot meet the above cri te ria forrec og ni tion, but for which thereis at least a rea son able pos si bil -ity that a loss has been in curredare d i s c losed in Note18—Com mit ments and Con tin -gencies.
K. Contingencies
A li a bil ity for so cial in sur -ance pro grams (So cial Se cu -rity, Medicare, rail road re tire -ment , b lack lung andun em ploy ment) is rec og nizedfor any un paid amounts due as of the re port ing date. No li a -bil ity is rec og nized for fu tureben e fit pay ments not yet due.For fur ther in for ma tion, seethe Stew ard ship In for ma tionsec tion on Stew ard ship Re -spon si bil ities and Note 19 onDedicated Collections.
L. SocialInsurance
Fed eral Re serve Banks (FRBs), which are not part ofthe re port ing en tity, serve as the Gov ern ment’s de pos i taryand fis cal agent. They pro cess Fed eral pay ments and de -pos its to Trea sury’s ac count and ser vice Fed eral debt se -cu ri ties. FRBs owned $488.9 bil lion of Fed eral debt se cu -ri ties held by the pub lic as of Sep tem ber 30, 1999. FRBearn ings that ex ceed stat u tory amounts of sur plus es tab -lished for FRBs are paid to the Gov ern ment and are rec og -nized as non-exchange rev e nue. Those earn ings to taled$26.0 bil lion for the year ended Sep tem ber 30, 1999. The
pri mary source of these earn ings is from in ter est earnedon Fed eral debt se cu ri ties held by the FRBs.
FRBs is sue Fed eral Re serve notes, the cir cu lat ing cur -rency of the United States. These notes are col lat er al izedby spe cific as sets owned by FRBs, typ i cally Fed eral debtse cu ri ties. Fed eral Re serve notes are backed by the fullfaith and credit of the U.S. Gov ern ment.
The Gov ern ment does not guar an tee pay ment of Gov -ern ment-sponsored en ter prises li a bil i ties such as the Fed -eral Na tional Mort gage As so ci a tion or the Fed eral HomeLoan Mort gage Cor po ra tion, which are pri vately owned.These en ter prises also are ex cluded from the re port ing en -tity.
M. Related Party Transactions
J. Deferred Maintenance

72 NOTES TO THE FI NAN CIAL STATE MENTS
Note 2. Cash and Other Mon e tary As sets
“Cash,” in the amount of $60.4 bil -lion, con sists of:
• Trea sury bal ances held at the FRBs, net of out stand ingchecks.• Trea sury bal ances in spe cialdepositaries , known as the U.S.
Trea sury Tax and Loan Noteac counts.
• Funds held out side of Trea -sury and the FRBs by au tho -rized fis cal of fi cers or agents.
• Mon ies held by Gov ern mentcol lec tion and dis burs ing of fi -cers, agen cies’ undeposited col -lec tions, un con firmed de pos its,and cash trans fers.
• Time de pos its at fi nan cial in -sti tu tions.
The Gov ern ment main tains for malar range ments with nu mer ous banksto main tain time de pos its known as“com pen sat ing bal ances.” These bal -ances com pen sate the banks for ser -vices pro vided to the Gov ern ment,such as main tain ing zero-balance ac -counts for the col lec tion of pub licmon ies.
Cash
“Gold” is val ued at the stat u toryprice of $42.2222 per fine troyounce. As of Sep tem ber 30, 1999,the num ber of fine troy ounces was261,571,005. The mar ket value ofgold on the Lon don Fixing as of there port ing date was $299.00 per finetroy ounce. Gold was pledged ascol lat eral for gold cer tif i cates is sued to the FRBs to tal ing $11.0 bil lion.See Note 14—Other Li a bil i ties.
GoldCash and Other Monetary Assetsas of September 30
(In billions of dollars)
Cash . . . . . . . . . . . . . . . . . . . . . . . . . . . . . . . 60.4Gold . . . . . . . . . . . . . . . . . . . . . . . . . . . . . . . . 11.0Domestic monetary assets . . . . . . . . . . . . . . . . 1.7
International monetary assets . . . . . . . . . . . . . . 42.1
Total cash and other monetary assets . . . . . 115.2
Domestic Monetary Assets “Do mes tic mon e tary as sets” con sist of liq uid as sets,
other than cash that are based on the U.S. dol lar, in -clud ing coins, sil ver bul lion and other coin age met als.These items to taled $1.7 bil lion.
International Monetary Assets
As sets val ued on a ba sis other thanthe U.S. dol lar com prise “In ter na -tional mon e tary as sets.”
The U.S. re serve po si tion in the In -ter na tional Mon e tary Fund (IMF)rep re sents an in vest ment in the IMF.The IMF pro vides fi nan cial as sis -tance to about 180 coun tries. It seeksto pro mote cur rency ex change sta bil -ity.
Only a por tion of the re quired pay -ment to the IMF was paid in cash,with the re main der treated as a sub -
scrip tion. The re corded bal ance isshown net of the sub scrip tion por tion, which rep re sents a let ter of credit pay -able to the IMF.
As of Sep tem ber 30, 1999, the re -main ing avail able bal ance un der thelet ter of credit to taled $31.4 bil lion.The U.S. re serve po si tion in the IMFhas a U.S. dol lar equiv a lent of $19.2bil lion as of that date.
Spe cial Draw ing Rights (SDRs) are in ter est-bearing as sets ob tainedthrough ei ther IMF al lo ca tions, trans -
ac tions with IMF mem ber coun triesor in ter est earn ings on SDR hold ings.Trea sury’s Ex change Sta bi li za tionFund held SDRs to tal ing $10.3 bil lion at the end of fis cal 1999. Those hold -ings are sim i lar to an in vest ment inthe IMF.
On Sep tem ber 30, 1999, “Other li a -bil i ties” in cluded an $6.8 bil lion in -ter est-bearing li a bil ity to the IMF.This li a bil ity con sisted of SDRs ob -tained through IMF al lo ca tions.

NOTES TO THE FI NAN CIAL STATEMENTS 73
“Ac counts re ceiv able” in clud ing re lated in ter est re -ceiv able, rep re sent claims to cash or other as sets fromen ti ties out side the Fed eral Gov ern ment that arisefrom the sale of goods or ser vices, du ties, fines, cer tain li cense fees, re cov er ies, or other pro vi sions of the law.
An al low ance for es ti mated losses due to uncollectible amounts is es tab lished when it is more likely than notthat the receivables will not be to tally col lected. Ac -counts re ceiv able are net of an al low ance foruncollectible amounts of $12.5 bil lion as of Sep tem -ber 30, 1999.
The SDR Act of 1968 au tho rizedthe Sec re tary of the Trea sury to is sue SDR cer tif i cates to FRBs in ex -change for cash. The value of thesecertificates can not ex ceed the valueof the SDR hold ings. The Sec re taryof the Trea sury de ter mines when theFRBs can re deem the SDR cer tif i -cates. The li a bil ity for such re demp -
tions, which to taled $7.2 bil lion at the end of the fis cal year, is in cluded inNote 14—Other Li a bil i ties. EachSDR was val ued at $1.38769 as ofSep tem ber 30, 1999.
“In ter na tional mon e tary as sets”also in clude for eign cur rency andother mon e tary as sets de nom i natedin for eign cur rency.
Note 3. Ac counts Receivable
InternationalMonetaryAssets, cont.
Accounts Receivable as of September 30
(In billions of dollars)
Agency or Program Name: Department of Energy . . . . . . . . . . . . . . . . . . . . . . . . . . . . . . . . . . . . . . . . 4.1Bureau of Reclamation . . . . . . . . . . . . . . . . . . . . . . . . . . . . . . . . . . . . . . . . 3.5
Foreign military sales . . . . . . . . . . . . . . . . . . . . . . . . . . . . . . . . . . . . . . . . . 2.4Federal family education loan program . . . . . . . . . . . . . . . . . . . . . . . . . . . . 1.8Operations and maintenance . . . . . . . . . . . . . . . . . . . . . . . . . . . . . . . . . . . 1.6Multi-Peril Crop Insurance Fund . . . . . . . . . . . . . . . . . . . . . . . . . . . . . . . . . 0.8Tennessee Valley Authority power program . . . . . . . . . . . . . . . . . . . . . . . . . 0.7Hazardous Substance Superfund . . . . . . . . . . . . . . . . . . . . . . . . . . . . . . . . 0.6
Minerals Management Service . . . . . . . . . . . . . . . . . . . . . . . . . . . . . . . . . . 0.5Mail delivery service . . . . . . . . . . . . . . . . . . . . . . . . . . . . . . . . . . . . . . . . . . 0.5Veterans Health Administration . . . . . . . . . . . . . . . . . . . . . . . . . . . . . . . . . . 0.4Veterans Benefits Administration. . . . . . . . . . . . . . . . . . . . . . . . . . . . . . . . . 0.2
All other programs . . . . . . . . . . . . . . . . . . . . . . . . . . . . . . . . . . . . . . . . . . . 17.9
Total accounts receivable, net . . . . . . . . . . . . . . . . . . . . . . . . . . . . . . . .35.0

74 NOTES TO THE FI NAN CIAL STATE MENTS
Note 4. Loan and Loan Guar an tee Programs
The Fed eral Gov ern ment uses twometh ods, di rect loans and loan guar -an tee pro grams, to ac com plish thesame goals. These goals are to pro -mote the Na tion’s wel fare by mak ingdi rect loans and guar an tee ingnon-Federal loans to seg ments of thepop u la tion not ad e quately served bynon-Federal in sti tu tions. For thoseun able to af ford credit at the mar ketrate, Fed eral credit pro grams pro videsub si dies in the form of di rect loansof fered at an in ter est rate lower thanthe mar ket rate. For those to whomnon-Federal fi nan cial in sti tu tions arere luc tant to grant credit be cause ofthe high risk in volved, Fed eral creditpro grams guar an tee the pay ment ofthese non-Federal loans and ab sorbthe cost of de faults.
The long-term cost of loans andguar an tees out stand ing for loans ob li -gated or guar an tees com mit ted af terfis cal 1991 is the sub sidy cost al low -ance for di rect loans out stand ing andthe li a bil ity for loan guar an tees out -stand ing as of the end of fis cal 1999.The long-term cost for loans ob li -gated or guar an tees com mit ted be fore fis cal 1992 is the al low ance foruncollectible amounts (or pres entvalue al low ance) for di rect loans out -stand ing and the li a bil ity for loanguar an tees out s tand ing. Thelong-term cost is based on all di rectloans and guar an teed loans dis bursedin fis cal 1999 and pre vi ous years thatare out stand ing as of the end of fis cal1999. It in cludes the sub sidy cost ofthese loans and guar an tees es ti matedas of the time of loan dis burse mentand sub se quent ad just ments such asmod i fi ca tions, reestimates, am or ti za -tion and write-offs.
“Net Loans Re ceiv able” in clude re -lated in ter est and fore closed prop erty. They are in cluded in the as sets sec -tion of the Bal ance Sheet.
The to tal sub sidy ex pense is thecost of di rect loans and loan guar an -tees rec og nized dur ing fis cal 1999. Itcon sists of the sub sidy ex pense in -curred for di rect and guar an teed loans dis bursed dur ing fis cal 1999, for
mod i fi ca tions made dur ing fis cal1999 of loans and guar an tees out -stand ing, and for reestimates as of theend of fis cal 1999 of the cost of loansand guar an tees out stand ing. This ex -pense is in cluded in the State ment ofNet Cost.
The Di rect Stu dent Loan pro gram,es tab lished in fis cal 1994, of fers fourtypes of ed u ca tion loans: Stafford,Unsubsidized Stafford, PLUS for par -ents and con sol i da tion loans. Ev i -dence of fi nan cial need is re quired for a stu dent to re ceive a sub si dizedStafford loan. The other three loanpro grams are avail able to bor row ersat all in come lev els. These loans usu -ally ma ture 9 to13 years af ter the stu -dent is no lon ger en rolled. They areun se cured.
Ru ral Elec tri fi ca tion and Tele com -mu ni ca tions loans are for the con -struc tion and op er a tion of gen er at ingplants, elec tric trans mis sion, and dis -tri bu tion lines or sys tems. Theseloans carry an av er age ma tu rity ofgreater than 20 years and are usu allyse cured.
The ma jor ru ral pro grams arefunded through the Ru ral Housing In -sur ance Fund pro gram ac count,which includes:
• Very low and low-to-mod er -ate in come home own er shiploans and guar an tees.• Very low-income hous ing re -pair loans.• Mul ti fam ily hous ing loansand guar an tees.• Do mes tic farm la bor hous ingloans.• Housing site loans.• Credit sales of ac quired prop -erty.
Loan pro grams are lim ited to ru ralar eas that in clude towns, vil lages andother places not part of an ur ban area.The ma jor ity of these loans ma ture inex cess of 25 years and are se cured bythe prop erty of the bor rower.
The Fed eral Fam ily Ed u ca tionLoan pro gram, for merly known as the Guar an teed Stu dent Loan pro gram,was es tab lished in fis cal 1965. Like
the Di rect Stu dent Loan pro gram, itof fers four types of loans: Stafford,Unsubsidized Stafford, PLUS forpar ents and con sol i da tion loans.
The Agency for In ter na tional De -vel op ment pro vides eco nomic as sis -tance to se lected coun tries in sup portof U.S. ef forts to pro mote sta bil ityand se cu rity in ter ests in stra te gic re -gions of the world.
Ex port-Import Bank aids in fi nanc -ing and pro mot ing U.S. ex ports. Toac com plish its ob jec tives, the bank’sau thor ity and re sources are used to:
• As sume com mer cial and po -lit i cal risk that ex port ers or pri -vate in sti tu tions are un will ingor are un able to un der take.• Over come ma tu rity and other lim i ta tions in pri vate sec tor fi -nanc ing.• As sist U.S. ex ports to meetfor eign of fi cially spon sored ex -port credit com pe ti tion.• Pro vide lead er ship and guid -ance in ex port fi nanc ing to theU.S. ex port ing and bank ingcom mu ni ties and to for eign bor -row ers.
Re pay ment terms for these loansare usu ally 1 to 7 years.
The Fed eral Housing Ad min is tra -tion (FHA) pro vides mort gage in sur -ance en cour ag ing lend ers to makecredit avail able to ex pand home own -er ship. FHA pre dom i nately servesbor row ers that the con ven tional mar -ket does not ad e quately serve such asfirst-time home buy ers, mi nor i ties,lower-income fam i lies and res i dentsof un der served ar eas.
Vet eran Housing Ben e fits pro videpar tial guar anty of res i den tial mort -gage loans is sued to el i gi ble vet er ansre serv ists and ser vice mem bers bypri vate lend ers. This guar an tee al -lows vet er ans, re serv ists and ser vicemem bers to pur chase a home with outa sub stan tial down pay ment.
Other loan guar an tees in clude:Small Busi ness Ad min is tra tion loansto mi nor ity busi nesses; and the FarmSer vice Agency for farm own er ship,emer gency and di sas ter loans.

NOTES TO THE FI NAN CIAL STATEMENTS 75
Loan and Loan Guarantee Programs as of September 30
(In billions of dollars)
Loans and Loan
GuaranteesOutstanding
Long-termCost of
Loans andLoan
GuaranteesOutstanding
NetLoans
Receiv-able
AmountGuaranteed
by theFederal
Government
Subsidy Expense
for the Fiscal Year ended
September 30,1999
Di rect Loans:
Federal directstudent loans . . . . . . . . 46 .5 0.4 46.1 0.4
Rural development . . . . . . 68 .9 13.1 55.8
Federal family education loan programs. . . . . . . . 23 .7 14.5 9.2
Assistance for statesof the formerSoviet Union . . . . . . . . . 11 .0 4.4 6.6
Food for progresscredits . . . . . . . . . . . . . 10 .6 7.2 3.4 0.5
HUD, all other . . . . . . . . . 10 .3 0.6 9.7
Direct loansfor spectrumauction sales . . . . . . . . . 8.3 (0.4) 8.7 1.2
Export creditguarantees. . . . . . . . . . 6.9 3.9 3.0
All other direct loanprograms . . . . . . . . . . . 49 .9 8.7 41.2 1.7
Total . . . . . . . . . . . . . .236.1 52.4 183.7 3.8
Guar an teed Loans:
Federal HousingAdministration. . . . . . . . 551.4 5.9 508.1 (5.2)
Veterans housingbenefit program. . . . . . . 213.5 5.8 84 .0 1.1
Federal familyeducationloan programs. . . . . . . . 127.6 12.2 121.2 3.1
Small business loans . . . . 39 .6 1.4 31 .9 (0.1)
Financing accountguarantees andinsurance . . . . . . . . . . . 24 .2 5.6 24 .2 1.9
Rural Housing Service. . . . . 10 .0 0.2 9.0
All other guaranteedloan programs. . . . . . . . 38 .6 4.0 36 .9 1.0
Total. . . . . . . . . . . . . . .1,004.9 35.1 815.3 1.8

76 NOTES TO THE FI NAN CIAL STATE MENTS
Note 6. In ven tories and Re lated Property
“In ven tories and re lated prop erty”con sist of the cat e go ries listed be low,net of al low ance for ob so lete and un -ser vice able in ven tory, as of Sep tem -ber 30, 1999.
“In ven tory held for sale” in cludestan gi ble per sonal prop erty held forsale, net of al low ances.
“Op er ating Ma te rials and Sup -plies” are com prised of tan gi ble per -sonal prop erty pur chased for use innor mal op er a tions.
“Ma te rials and sup plies held for fu -ture use” in clude tan gi ble per sonalprop erty not readily avail able in themar ket or held be cause there is more
than a re mote chance that they willeven tu ally be needed.
“Stock pile ma te ri als” are stra te gicand crit i cal ma te ri als held for use inna tional de fense, con ser va tion or na -tional emer gen cies due to stat u toryre quire ments; for ex am ple, co balt, tin and nickel.
“Com mod i ties” in clude items ofcom merce or trade that have an ex -change value used to sta bi lize or sup -port mar ket prices.
“Seized mon e tary in stru ments”com prise only mon e tary in stru ments.These mon e tary in stru ments areawait ing judge ment to de ter mine
own er ship. The re lated li a bil ity is in -cluded in “Other li a bil i ties.” Otherprop erty seized by the Gov ern ment,such as real prop erty and tan gi bleper sonal prop erty, is not in cluded as a Gov ern ment as set. It is ac counted forin agency prop erty-management re -cords un til the prop erty is for feited,re turned or oth er wise liq ui dated.
“For feited prop erty” is com prisedof mon e tary in stru ments, in tan gi bleprop erty, real prop erty and tan gi bleper sonal prop erty ac quired throughfor fei ture pro ceed ings; prop erty ac -quired by the Gov ern ment to sat isfy atax li a bil ity; and un claimed and aban -doned mer chan dise.
Inventories and Related Property as of September 30
(In bil lions of dol lars) De fense All Oth ers Total
Inventory held for sale . . . . . . . . . . . . . . . . . 67.0 1.1 68.1 Operating materials and supplies . . . . . . . . . 40.9 5.5 46.4
Materials and supplies held for future use. . . 17.8 0.1 17.9
Stockpile materials . . . . . . . . . . . . . . . . . . . 2 .8 37.5 40.3 Commodities . . . . . . . . . . . . . . . . . . . . . . . . - 0.4 0.4
Seized monetary instruments . . . . . . . . . . . . - 0.1 0.1
Forfeited property . . . . . . . . . . . . . . . . . . . . - 0.1 0.1
Total inventories and related property . . . 128.5 44.8 173.3
Taxes Receivable as of September 30
(In billions of dollars)
Gross taxes receivable . . . . . . . . . . . . . . 79.2
Allowance for doubtful accounts . . . . . . . (56.5)
Taxes receivable, net . . . . . . . . . . . . . 22.7
Note 5. TaxesRe ceiv able
Taxes re ceiv able are the grosstax re ceiv ables net of al low ancefor doubt ful ac counts.

NOTES TO THE FI NAN CIAL STATEMENTS 77
Note 7.Property, Plantand Equipment
“Prop erty, plant and equip ment” con sist of tan gi ble as sets, in clud -ing land, build ings, struc tures and other as sets used to pro vide goodsand ser vices. Cer tain types of tan gi ble as sets, col lec tively re ferred toas “Stew ard ship As sets,” are not re ported as prop erty, plant andequip ment or else where on the Bal ance Sheet. This is based on ac -count ing stan dards that be came ef fec tive for fis cal 1998. “Stew ard -ship as sets” in clude “Na tional de fense as sets,” “Her i tage as sets” and“Stew ard ship land.” These as sets are pre sented in the Stew ard ship In -for ma tion sec tion.
Property, Plant and Equipment as of September 30
(In bil lions of dol lars) Cost
Ac cu mu lated De pre ci a tion/ Am or ti za tion Net
Buildings, structures and facilities . . . . . . . . . . 284.8 135.3 149.5
Furniture, fixtures and equipment . . . . . . . . . . 151.0 75.0 76.0
Construction in progress. . . . . . . . . . . . . . . . . 49.3 - 49.3
Land and land improvements . . . . . . . . . . . . . 25.4 5.5 19.9
Automated data processing software. . . . . . . . 3.8 2.0 1.8
Assets under capital lease . . . . . . . . . . . . . . . 1.5 0.5 1.0
Leasehold improvements . . . . . . . . . . . . . . . . 2.0 0.7 1.3
Total property, plant and equipment . . . . . . 517.8 219.0 298.8
Note 8. Other As sets
The cat e gory of “Other as sets” con sists of ad -vances and pre pay ments, se cu ri ties and in vest ments,and other Gov ern ment as sets not oth er wise clas si fied. This fig ure pres ents se cu ri ties at cost, net of un am or -tized pre mi ums and dis counts.
Other Assets as of September 30
(In billions of dollars)
Securities and investments . . . . . . . 17.2Advances and prepayments. . . . . . . 13.0
Other . . . . . . . . . . . . . . . . . . . . . . . 24.1
Total other assets . . . . . . . . . . . . 54.3

78 NOTES TO THE FI NAN CIAL STATE MENTS
Note 9.Ac countsPay able
Accounts Payable as of September 30
(In billions of dollars)
Agency:Interest on Federal debt securities
held by the public . . . . . . . . . . . . . . . . . . . . . . . 42 .6DOD . . . . . . . . . . . . . . . . . . . . . . . . . . . . . . . . . . 16 .7OPM . . . . . . . . . . . . . . . . . . . . . . . . . . . . . . . . . . 1 .2U.S. Postal Service . . . . . . . . . . . . . . . . . . . . . . . 4 .0NASA . . . . . . . . . . . . . . . . . . . . . . . . . . . . . . . . . 2 .9Agriculture. . . . . . . . . . . . . . . . . . . . . . . . . . . . . . 2 .7VA . . . . . . . . . . . . . . . . . . . . . . . . . . . . . . . . . . . . 2 .3HUD . . . . . . . . . . . . . . . . . . . . . . . . . . . . . . . . . . 1 .8Justice . . . . . . . . . . . . . . . . . . . . . . . . . . . . . . . . . 1 .6AID . . . . . . . . . . . . . . . . . . . . . . . . . . . . . . . . . . . 1 .4General Services Administration . . . . . . . . . . . . . . 1 .2Transportation . . . . . . . . . . . . . . . . . . . . . . . . . . . 1 .0Energy . . . . . . . . . . . . . . . . . . . . . . . . . . . . . . . . . 1 .0Executive Office of the President . . . . . . . . . . . . . 1 .0
All other departments . . . . . . . . . . . . . . . . . . . . . . 4 .4
Total accounts payable. . . . . . . . . . . . . . . . . . 85 .8
The fig ure un der “Ac counts pay -able” in cludes “In ter est on Fed eraldebt se cu ri ties held by the pub lic.”This re flects un paid in ter est ac cruedon Federal debt se cu ri ties held by thepub lic (see Note 10) as of Sep tem ber30, 1999. Other ac counts pay able arefor goods and prop erty or dered andre ceived, and for ser vices ren deredby other than em ploy ees.
“Fed eral debt held by the pub lic”to taled $3,631.6 bil lion at the endof fis cal 1999. The ac com pa ny ingFed eral Debt Se cu ri ties ta ble de -tails Gov ern ment bor row ing to fi -nance op er a tions. This ta ble showsdebt at face value. Un am or tized pre -mi ums are added and un am or tizeddis counts sub tracted.
“ Intragovernmental hold ings”rep re sent the por tion of the grossFed eral debt held as in vest ments byGov ern ment en ti ties.
This in cludes ma jor trust funds.Fo r more i n fo r ma t i on on t ru s tfunds, see Note 19—Ded i cated Col -lec t ions. This re port elim i nates
intragovernmental hold ings in con -sol i da tion.
Se cu ri ties that rep re sent debt held by the pub lic are pri mar ily is sued by the Trea sury and in clude:
• In ter est-bearing mar ket ablese cu ri ties (bills, notes andbonds).• In ter est-bearing non mar ket -able se cu ri ties (for eign se ries,State and lo cal gov ern ment se -
ries, do mes tic se ries, andsav ings bonds).• Non-interest bear ing debt(ma tured and other).
As of Sep tem ber 30, 1999, $5,568 bil lion of Fed eral debt was sub jectto a s t a t u to ry l imi t (31 U .S .C .3101). That limit was $5,950 bil -lion. The debt sub ject to the limit in -cludes:
• Debt held by the pub lic andintragovernmental hold ings,
Definitions of Debt• Gross Fed eral Debt - All Gov ern ment debt, whether is -sued by Trea sury (Trea sury se cu ri ties) or by other agen -cies (agency se cu ri ties). “Gross Fed eral debt” is ei ther held by the pub lic or by Fed eral Gov ern ment en ti ties.• Debt Held by the Pub lic - Fed eral debt held out side the Gov ern ment by in di vid u als, cor po ra tions, State or lo calgov ern ments, the Fed eral Re serve Sys tem, and for eigngov ern ments and cen tral banks.• Intragovernmental hold ings - Fed eral debt held byGov ern ment trust funds, re volv ing funds and spe cial funds.
Note 10.Fed eral DebtSe cu ri tiesHeld bythe Pub lic

NOTES TO THE FI NAN CIAL STATEMENTS 79
Federal Debt Securities Held by the Public as of September 30
(In bil lions of dol lars)
Be gin ning Bal anceSept. 30,
1998
NetChangeDur ingFis cal1999
End ingBal anceSept. 30,
1999
Av er ageIn ter est
RateDur ing
Fis cal 1999
Treasury Securities:Marketable securities . . . . . . . . . . . . . . . . . . . 3,331.0 (98.0) 3,233.0 6.341% Non-marketable securities . . . . . . . . . . . . . . . . 2,187.7 226.6 2,414.3 6.674%
Non-interest bearing debt . . . . . . . . . . . . . . . . 7.5 1 .5 9.0
Total Treasury securities . . . . . . . . . . . . . . . 5,526.2 130.1 5,656.3
Plus: Unamortized premium on Treasury securities. . . . . . . . . . . . . . . . 16.9 (0.9) 16.0
Less: Unamortized discount on Treasury securities. . . . . . . . . . . . . . . . 78.9 1 .5 80.4
Total Treasury securities, net of unamortized premiums and discounts. . . . . . . . . . . . . . . . . . . . 5,464.2 127.7 5,591.9
Agency Securities:Tennessee Valley Authority . . . . . . . . . . . . . . . 26.7 (0.8) 25.9
All other agencies . . . . . . . . . . . . . . . . . . . . . . 2.3 (0.2) 2.1
Total agency securities, net of unamortized premiums and discounts . . . . . . . . . . . . 29.0 (1.0) 28.0
Total Federal debt . . . . . . . . . . . . . . . . 5,493.2 126.7 5,619.9
Less: Intragovernmental holdings, net of unamortized premiums and discounts . . . . . . . . . . . . . . . . . . 1,775.5 212.8 1,988.3
Total Federal debt securities held by the public . . . . . . . . . . . . . .
3,717.7 (86.1) 3,631.6
Types of mar ket able se cu ri ties:Bills—Short-term ob li ga tions is sued with a term of 1 year or less.Notes—Me dium-term ob li ga tions is sued with a term of at least 1 year, but not more than 10 years.Bonds—Long-term ob li ga tions of more than 10 years.
less most agency securities, Fed eral Fi nancing Bank debt,mis cel la neous debt, and un re al ized dis count on Gov ern mentac count se ries se cu ri ties.
• Un am or tized net dis counts on pub lic is sues of Trea surynotes and bonds (other than zero-coupon bonds).
Note 10. FederalDebt, cont.

80 NOTES TO THE FI NAN CIAL STATE MENTS
Intragovernmental Holdings: Federal Debt SecuritiesHeld as Investments by Government Accounts as of September 30
(In billions of dollars)
Be gin ningBal anceSept. 30,
1998
NetChangeDur ingFis cal1999
End ingBal anceSept. 30,
1999
SSA, Old-Age and Survivors Insurance . . . . . . . . . . . . . . 653.3 108.9 762.2
OPM, civil service retirement and disability . . . . . . . . . . . . 451.3 30.0 481.3
DOD, military retirement . . . . . . . . . . . . . . . . . . . . . . . . . 133.8 7.5 141.3
HHS, Hospital Insurance Fund. . . . . . . . . . . . . . . . . . . . . 118.3 35.4 153.7
SSA, disability insurance. . . . . . . . . . . . . . . . . . . . . . . . . 77.0 15.7 92.7
Labor, unemployment. . . . . . . . . . . . . . . . . . . . . . . . . . . . 70.6 6.8 77.4
HHS, supplementary medical insurance . . . . . . . . . . . . . . 39.5 (13.0) 26.5
FDIC funds . . . . . . . . . . . . . . . . . . . . . . . . . . . . . . . . . . . 39.1 1.7 40.8
Railroad Retirement Board. . . . . . . . . . . . . . . . . . . . . . . . 21.8 2.6 24.4
OPM, Employees Life Insurance . . . . . . . . . . . . . . . . . . . 19.4 1.3 20.7
Transportation, Highway Trust Fund . . . . . . . . . . . . . . . . . 17.9 10.2 28.1
Energy, nuclear waste disposal . . . . . . . . . . . . . . . . . . . . 11.2 4.0 15.2
All other programs and funds . . . . . . . . . . . . . . . . . . . . . . 117.6 8.0 125.6
Subtotal . . . . . . . . . . . . . . . . . . . . . . . . . . . . . . . . . . . 1,770.8 219.1 1,989.9
Plus: Unamortized net premiums (discounts) . . . . . . . . . . 4.7 (6.3) (1.6)
Total intragovernmental holdings, net . . . . . . . . . . . . .1,775.5 212.8 1,988.3

NOTES TO THE FI NAN CIAL STATE MENTS 81
The Gov ern ment of fers its em ploy ees life and health in sur ance, aswell as re tire ment and other ben e fits. These ben e fits ap ply to ci vil ianand mil i tary em ploy ees.
The Fed eral Gov ern ment ad min is ters more than 40 pen sion plans.The Of fice of Per son nel Man age ment (OPM) ad min is ters the larg estci vil ian plan. De part ment of De fense (DOD), mean while, ad min is tersthe larg est mil i tary plan. The Gov ern ment of fers both de fined ben e fitand de fined con tri bu tion pen sion plans. The larg est are de fined ben e fitplans. The change in ac tu ar ial ac crued post-retirement health ben e fitsli a bil ity and com po nents of re lated ex pense for fis cal 1999 are pre -sented be low.
Federal Employee and Veteran Benefits Payable as of September 30
(In billions of dollars) Civilian Military Total
Pensions. . . . . . . . . . . . . . . . . . . . . . . . . . . . . . . . . . 1,025. 2 661.8 1,687.0 Post-retirement health benefits . . . . . . . . . . . . . . . . . 179.7 196.2 375.9Veterans compensation
and burial benefits . . . . . . . . . . . . . . . . . . . . . . . . . - 483.2 483.2 Liability for other benefits. . . . . . . . . . . . . . . . . . . . . . 49.0 5.6 54.6
Total Federal employee and veteran benefits payable . . . . . . . . . . . . . . . . . . . 1,253.9 1,346.8 2,600.7
Note 11.Fed eral Em ployeeand Vet eran Ben e fits Payable
Change in Actuarial Accrued Pension Liability and Components of Related Expenses(In billions of dollars) Civilian1 Military To talActuarial accrued pension liability,
as of September 30, 1998. . . . . . . . . . . . . . . . . . . . 990.3 650.5 1,640.8Pen sion ex pense:
Normal costs . . . . . . . . . . . . . . . . . . . . . . . . . . . . . 22.2 10.4 32.6Interest on liability . . . . . . . . . . . . . . . . . . . . . . . . . . 72.0 33.7 105.7Plan amendments and assumption changes . . . . . . - 5.7 5 .7Actuarial (gains)/losses . . . . . . . . . . . . . . . . . . . . . . (13.2) (6.5) (19.7)
Total pension expense . . . . . . . . . . . . . . . . . . . . . 81.0 43.3 124.3Benefits paid . . . . . . . . . . . . . . . . . . . . . . . . . . . . . (46.1) (32.0) (78.1)
Actuarial accrued pension liability,as of September 30, 1999 . . . . . . . . . . . . . . . . 1,025.2 661.8 1,687.0
1 Does not in clude U.S. Tax Court and ju di cial branch
Significant Assumptions Used in DeterminingPension Liability and the Related Expense
(In percentages)
Civilian Military
Rate of interest . . . . . . . . . . . . . . . . . . . . . . . . . . . . . 7.00% 6.25%Rate of inflation . . . . . . . . . . . . . . . . . . . . . . . . . . . . . 4.00% 3.00%Projected salary increases . . . . . . . . . . . . . . . . . . . . . 4.25% 3.50%

82 NOTES TO THE FI NAN CIAL STATE MENTS
Pensions
The larg est ci vil ian pen sion plan isad min is tered by OPM and cov ers ap -prox i mately 90 per cent of all Fed eralci vil ian em ploy ees. This plan in -cludes two com po nents of de finedben e fits. Those are the Civil Ser viceRe tire ment Sys tem (CSRS) and theFed eral Em ployees’ Re tire ment Sys -tem (FERS ). The ba sic ben e fit com -po nents of the CSRS and the FERSare fi nanced and op er ated through the Civil Ser vice Re tire ment and Dis abil -ity Fund (CSRDF).
CSRDF mon eys are gen er ated pri -mar ily from em ploy ees, agency con -tri bu tions, pay ments from the gen eral fund and in ter est on in vest ments in
Fed eral debt se cu ri ties. See Note19—Ded i cated Col lec tions, CivilSer vice Re tire ment and Dis abil ityFund.
The Fed eral Re tire ment Thrift In -vest ment Board, an in de pend entGov ern ment agency, op er ates theThrift Sav ings Plan. Fed eral em ploy -ees and re tir ees cov ered by CSRS and FERS own the fund’s as sets. This Fi -nan cial Re port ex cludes this fund be -cause the em ploy ees own its as sets.
Fed eral debt held by the fund is in -cluded and clas si fied as Fed eral debtheld by the pub lic. FERS em ploy eesmay con trib ute up to 10 per cent ofbase pay to the plan, which the Gov -ern ment matches up to 5 per cent.CSRS em ploy ees may con trib ute upto 5 per cent of base pay with no Gov -ern ment match.
The Thrift Sav ings Plan held $29.4bil lion in non mar ket able Trea sury se -
cu ri ties as of Sep tem ber 30, 1999.The Fed eral Gov ern ment’s re lated li -a bil ity is in cluded in “To tal Fed eraldebt se cu ri ties held by the pub lic” inthe Bal ance Sheet.
Health Benefits Ci vil ian re tir ees pay the same in -
sur ance pre mium as ac tive em ploy -ees un der the Fed eral Em ployeeHealth Ben e fits Pro gram (FEHBP).These pre mi ums cover only a por tionof the costs.
Other BenefitsEm ployee and an nu itant con tri bu -
tions and in ter est on in vest mentsfund a por tion of the Fed eral Em -ployees Group Life In sur ance pro -gram. This in sur ance pro gram payspri vate in sur ance com pa nies for Fed -eral em ploy ees’ group life in sur ance.The Of fice of Per son nel Man age -ment ad min is ters this pro gram.
Civilian Employees
Significant Assumptions Used in Determining Post-Retirement Health Benefits and the Related Expense(In percentages) Ci vil ian Mil i taryRate of interest . . . . . . . . . . . . . . . . . . . . . . . . . . . . . . 7.0% 6.5%Rate of health care cost inflation . . . . . . . . . . . . . . . . . 7.0% 4.5-10.4%
Change in Actuarial Accrued Post-Retirement Health Benefits Liability and Components of Related Expenses(In billions of dollars) Civilian Military To talActuarial accrued post-retirement
health benefits liability, as of September 30, 1998 . . . . . . . . . . . . . . . . . . . . . . . . 181.8 223.4 405.2
Prior period adjustments . . . . . . . . . . . . . . . . . . . . . . . . . . . - (37.5) (37.5)Corrected beginning post-retirement health
benefits liability . . . . . . . . . . . . . . . . . . . . . . . . . . . . . . . . 181.8 185.9 367.7
Post-retirement health ben e fits ex pense:Normal costs . . . . . . . . . . . . . . . . . . . . . . . . . . . . . . . . . 6.0 4.7 10.7Interest on liability . . . . . . . . . . . . . . . . . . . . . . . . . . . . . . 11.8 12.0 23.8Actuarial (gains)/losses . . . . . . . . . . . . . . . . . . . . . . . . . . (13.5) - (13.5)
Total post-retirement health benefits expense . . . . . . . . . . . . . . . . . . . . . . 4.3 16.7 21.0
Claims paid . . . . . . . . . . . . . . . . . . . . . . . . . . . . . . . . . . . . (6.4) (6.4) (12.8)
Actuarial accrued post-retirement health benefits liability, as of September 30, 1999 . . .
179.7 196.2 375.9

NOTES TO THE FI NAN CIAL STATE MENTS 83
Pensions
The De pa r t men t o f De fense(DOD) Mil i tary Re tire ment Fund fi -nances mil i tary re tire ment and sur -vi vor ben e fit pro grams.
The mil i tary re tire ment sys temc o n s i s t s o f a f u n d e d , noncon-tributory, de fined ben e fit plan. It ap -plies to the Army, Navy, Ma rineCorps and Air Force. This sys temin cludes non-disability re tire mentpay, dis abil ity re tire ment pay andre tire ment pay for re serve ser viceand sur vi vor an nu ity pro grams.
Health Benefits
Mil i tary ben e fits en ti tle re tir eesand their de pend ents to health carein mil i tary med i cal fa cil i ties if a fa -cil ity can pro vide the needed care.Un til they reach age 65, mil i tary re -tir ees and their de pend ents also areen ti tled to be re im bursed for thecost of health care from ci vil ian pro -vid ers. A pre mium is charged to en -roll in DOD’s ci vil ian care pro gram. In ad di tion, there are de duct ible andcopayment re quire ments for ci vil -ian care. Af ter they reach 65 yearsof age, Medicare cov ers mil i tary re -tir ees.
Mil i tary re tiree health care fig -ures in clude the cost of ed u ca tionand train ing, staff ing, build ings andequip ment, as well as the op er a tions and main te nance of med i cal fa cil i -ties. They also in clude claims paidto ci vil ian pro vid ers and the cost ofad min is ter ing the pro gram.
Compensation and Burial Benefits
The Gov ern ment com pen satesdis abled vet er ans and their sur vi -vors. Vet erans com pen sa tion is pay -able as a dis abil ity ben e fit or a sur -v i vor’s ben e f i t . En t i t le ment tocom pen sa tion de pends on: the vet -eran’s dis abil i ties hav ing been in -curred in, or ag gra vated dur ing, ac -tive mil i tary ser vice; death while onduty, or death re sult ing from ser -vice-connected dis abil i ties, if not inac tive duty.
Burial ben e fits in clude a burialand plot or in ter ment al low ancepay able for a vet eran, who at thetime of death, qual i fied to re ceivecom pen sa t i on o r a pen s ion , o rwhose death oc curred in a VA fa cil -ity.
The li a bil ity for vet er ans com pen -sa tion and burial ben e fits pay ablede creased in fis cal 1999 by $97.8
bil lion. The pri mary fac tor con trib -ut ing to this de crease was a changein in ter est rate as sump tions. Due tothis change, the State ment of NetCost item ti tled “Vet erans ben e fitsand ser vices” de creased by $204.8bil lion. Other Benefits
Vet erans in sur ance in cludes thefol low ing pro grams:
• United States Gov ern mentLife In sur ance es tab lished in1919 to han dle new is sues andthe con ver sion of World War IRisk Term In sur ance.• Na tional Ser vice Life In sur -ance es tab lished in 1940 tomeet the needs of World War II ser vice per son nel.• Vet erans Spe cial Life In sur -ance es tab lished in 1951 forKo rean vet er ans who did nothave ser vice-connected dis abil -i ties.• Ser vice-Disabled Vet eransIn sur ance es tab lished in 1951for vet er ans with ser -vice-connected dis abil i ties.• Vet erans Re opened In sur ance es tab lished a 1-year re open ingin 1965 of Na tional Ser viceLife In sur ance for cer tain dis -abled World War II and Ko rean vet er ans.
Military Employees (Including Veterans)
Veterans Compensation and Burial BenefitsPayable as of September 30
(In billions of dollars)
Veterans . . . . . . . . . . . . . . . . . . . . . . . . . . . . . . . . . . . . . . . . . . . . . . . . . . . 397.5
Survivors . . . . . . . . . . . . . . . . . . . . . . . . . . . . . . . . . . . . . . . . . . . . . . . . . . . 82 .8
Burial benefits . . . . . . . . . . . . . . . . . . . . . . . . . . . . . . . . . . . . . . . . . . . . . . . 2.9
Total compensation and burial benefits payable . . . . . . . . . . . . . . . . . . . . .483.2

84 NOTES TO THE FI NAN CIAL STATE MENTS
Dur ing World War II and the ColdWar, the United States de vel oped amas sive in dus trial com plex to re -search, pro duce and test nu clearweap ons. This in cluded nu clear re -ac tors, chem i cal pro cess ing build -ings, metal ma chin ing plants, lab o -ra to ries and main te nance fa cil i ties.
These ac tiv i ties left an en vi ron -men tal leg acy of con tam i nated ar easand build ings. Vol umes of waste and spe cial nu clear ma te ri als re quiretreat ment, sta bi li za tion and dis posal. The re sult ing en vi ron men tal li a bil i -ties con sist of the costs as so ci atedwith re mov ing, con tain ing and/ordis pos ing of this haz ard ous waste.
Of those en vi ron men tal li a bil i ties, this re port pres ents only cleanupcos t s f rom Fed e ra l op e r a t ionsknown to re sult in haz ard ous wastethat the Fed eral Gov ern ment is re -quired to clean up by Fed eral, State,or lo cal stat utes and/or reg u la tions.
The De part ment of En ergy in -curred op er at ing and cap i tal ex pen -di tures to tal ing $5.8 bil lion in fis cal
1999. I t used these funds toremediate leg acy waste. This in -cludes nu clear ma te ri als and fa cil i -ties sta bi li za tion, and waste treat -ment, stor age and dis posal ac tiv i tiesat each in stal la tion.
“En vi ron men tal man age ment fa -cil i ties and sites” in clude costs foren vi ron men tal res to ra tion; nu clearma te rial and fa cil ity sta bi li za tion;and waste treat ment, stor age and dis -posal ac tiv i ties at each in stal la tion.It also in cludes cost for re lated ac tiv -i ties such as land lord re spon si bil i -ties, pro gram man age ment and le -gally pre scr ibed grants forpar tic i pa tion and over sight by Na -tive Amer i can tribes and reg u la toryagen cies.
“Ac tive and sur plus fa cil i ties”rep re sent an tic i pated remediationcost for those fa cil i ties that are con -duct ing on go ing op er a tions but ul ti -mately will re quire sta bi li za tion, de -ac ti va tion and de com mis sion ing.
“High-level waste and spent nu -clear fuel” in clude the full cost topro vide for per ma nent dis posal of
the Na tion’s high-level ra dio ac tivewaste and spent nu clear fuel.
Pro jects with no cur rent fea si bil ity remediation ap proach are ex cludedfrom the es ti mate. Sig nif i cant pro -jects not in cluded are:
• Nu clear ex plo sion test ar eas(e.g., Ne vada test site).• Large sur face wa ter bod ies(e.g., Clinch and Co lum biaRivers).• Most ground wa ter (evenwith treat ment, fu ture use willbe re stricted).• Some spe cial nu clear ma te -rial (e.g., ura niumhexafluoride).
T h e D e pa r t men t of De fense(DOD) is re spon si ble for the cleanupof fa cil i ties it op er ates or has op er -ated, in clud ing res to ra tion of ac tiveand Base Re align ment and Clo surein stal la tions and for merly used de -fense sites; dis posal of chem i calweap ons; en vi ron men tal costs as so -ci ated with the dis posal of weap onssys tems (pri mar ily nu clear pow eredair craft car ri ers and sub ma rines); and for train ing range cleanup.
Environmental and Disposal Liabilities as of September 30(In billions of dollars)
Department of Energy:Environmental management facilities and sites . . . . . . . . . . . . . . . . . . . . 183.7Active and surplus facilities . . . . . . . . . . . . . . . . . . . . . . . . . . . . . . . . . . . 25.4High-level waste and spent nuclear fuel . . . . . . . . . . . . . . . . . . . . . . . . . . 14.9
Other . . . . . . . . . . . . . . . . . . . . . . . . . . . . . . . . . . . . . . . . . . . . . . . . . . . 6.7
Total Energy . . . . . . . . . . . . . . . . . . . . . . . . . . . . . . . . . . . . . . . . . . . . 230.7DOD:
Training ranges. . . . . . . . . . . . . . . . . . . . . . . . . . . . . . . . . . . . . . . . . . . . 34.0Active installations . . . . . . . . . . . . . . . . . . . . . . . . . . . . . . . . . . . . . . . . . 15.4Nuclear powered aircraft carriers and submarines . . . . . . . . . . . . . . . . . . 10.8Chemical weapons disposal . . . . . . . . . . . . . . . . . . . . . . . . . . . . . . . . . . 8.9
Other . . . . . . . . . . . . . . . . . . . . . . . . . . . . . . . . . . . . . . . . . . . . . . . . . . . 10.6Total DOD. . . . . . . . . . . . . . . . . . . . . . . . . . . . . . . . . . . . . . . . . . . . . . 79.7
All other agencies . . . . . . . . . . . . . . . . . . . . . . . . . . . . . . . . . . . . . . . . 2.8
Total environmental and disposal liabilities. . . . . . . . . . . . . . . . . . . . . 313.2
Note 12. En vi ron men tal and Dis posal Li a bil i ties

NOTES TO THE FI NAN CIAL STATE MENTS 85
Benefits Due and Payable as of September 30(In billions of dollars)
Federal Old-Age and Survivors Insurance. . . . 29.0Federal Hospital Insurance (Medicare Part A) . 13.3Grants to States for Medicaid . . . . . . . . . . . . . 11.6Federal Supplemental Medical Insurance
(Medicare Part B) . . . . . . . . . . . . . . . . . . . . 10.4Federal Disability Insurance . . . . . . . . . . . . . . 6.8Supplemental security income . . . . . . . . . . . . 1.0Railroad retirement. . . . . . . . . . . . . . . . . . . . . 0.7Unemployment insurance . . . . . . . . . . . . . . . . 0.4Other benefits . . . . . . . . . . . . . . . . . . . . . . . . 0.6
Total benefits due and payable . . . . . . . . . .73.8
Note 13.
Ben e fits Due
These amounts are the ben e fitsowed to pro gram re cip i ents or med i -cal ser vice pro vid ers as of the fis calyear end that have not yet been paid.For a de scrip tion of the pro grams, see the Stew ard ship Re spon si bil ities sec -tion un der Stew ard ship In for ma tion.
Note 14. Other Li a bil i ties
“In sur ance pro grams” in cludebank de posit in sur ance, guar an teesof pen sion ben e fits, life and med i calin sur ance. They also in clude in sur -ance against dam age to prop erty(home, crops and air planes) causedby per ils such as flood ing and othernat u ral di sas ters, risk of war, and in -sol vency.
“Ac crued wages and ben e fits”con sist of the es ti mated li a bil ity forci vil ian and com mis sioned of fi cers’sal a ries and wages earned but un -
paid. They also in clude fundedan nual leave and other em ployeeben e fits that have been earned butare un paid.
Amounts re ceived for goods andser vices to be pro vided com prise“Ad vances from oth ers”.
“Ex change Sta bi li za tion Fund”in cludes Spe cial Draw ing Rights(SDRs ) cer tif i cates is sued to theFed eral Re serve Banks and al lo ca -tions from the In ter na tional Mon e -tary Fund.
“Other debt” in cludes Gov ern ment ob li ga tions, whether se cured or un se -cured, not in cluded in pub lic debt.
“Gold cer tif i cates” are mone-tarized por tions of gold and the cer tif -i cates are de pos ited in the Fed eral Re -serve Bank.
“De ferred rev e nue” re fers to rev e -nue re ceived but not yet earned.
“Other mis cel la neous li a bil i ties”in clude amounts ac crued for con tin -gent liabilities.
Other Liabilities as of September 30
(In billions of dollars)
Insurance programs . . . . . . . . . . . . . . . . . . . . . . . . . . . . . . . . . . . . . . . . 21.2Accrued wages and benefits . . . . . . . . . . . . . . . . . . . . . . . . . . . . . . . . . 18.5Advances from others . . . . . . . . . . . . . . . . . . . . . . . . . . . . . . . . . . . . . . 16.0Exchange Stabilization Fund . . . . . . . . . . . . . . . . . . . . . . . . . . . . . . . . . 14.0Other debt. . . . . . . . . . . . . . . . . . . . . . . . . . . . . . . . . . . . . . . . . . . . . . . 11.3Gold certificates . . . . . . . . . . . . . . . . . . . . . . . . . . . . . . . . . . . . . . . . . . 11.0Deferred revenue . . . . . . . . . . . . . . . . . . . . . . . . . . . . . . . . . . . . . . . . . 9.5Unclassified deposited funds . . . . . . . . . . . . . . . . . . . . . . . . . . . . . . . . . 7.1Other miscellaneous liabilities . . . . . . . . . . . . . . . . . . . . . . . . . . . . . . . . 60.4
Total other liabilities . . . . . . . . . . . . . . . . . . . . . . . . . . . . . . . . . . . . . . 169.0

86 NOTES TO THE FI NAN CIAL STATE MENTS
Note 15. Col lec tions and Re funds of Fed eral Revenue
Trea sury is the Fed eral Gov ern ment’s prin ci pal rev e -nue-collecting agency.
Col lec tions of “In di vid ual income and tax with hold -ings” in clude es ti mated in come tax pay ments by in di vid -u als, So cial Se cu rity and Medicare taxes, rail road re tire -ment taxes and in di vid ual in come tax with hold ings.
Re funds of “In di vid ual in come and tax with hold ings”in clude re funds from the Earned In come Tax Credit(EITC). The EITC is a re fund able credit for tax pay erswho work and whose earn ings fall be low the es tab lished
ceil ing. A re fund able credit is first used to off set any in di -vid ual taxes owed; any re main ing amounts are is sued tothe tax payer. Amounts re ported for cor po rate in cometaxes in tax year 1999 in clude cor po rate taxes of $8 bil -lion for tax year 2000. In fis cal 1999, the IRS is sued $25.6 bil lion in EITC re funds. An ad di tional $4.9 bil lion of theEITC cred its were ap plied to re duce tax payer li a bil ity.These EITC amounts are in cluded in “Gross Cost” in theState ment of Net Costs as a com po nent of the in come se -cu rity func tion.
Collections of Federal Revenue for the Fiscal Year Ended September 30
Tax year to which collections relate
(In billions of dollars)
FederalRevenue
Collections 1999 1998 1997 Prioryears
Individual income and tax withholdings . . . 1,588.2 1,020.4 547.4 11.4 9.0
Corporate income taxes . . . . . . . . . . . . . . 216.0 142.8 62.5 1.1 9.6
Unemployment taxes . . . . . . . . . . . . . . . . . 26.5 24.6 1.9 - -
Excise taxes . . . . . . . . . . . . . . . . . . . . . . . 72.0 48.4 23.5 - 0.1
Estate and gift taxes . . . . . . . . . . . . . . . . . 28.4 - 25.0 1.0 2.4
Customs duties. . . . . . . . . . . . . . . . . . . . . 19.1 19.1 - - -
Federal Reserve Bank earnings. . . . . . . . . 26.0 18.6 7.4 - -
Fees and licenses. . . . . . . . . . . . . . . . . . . 1.6 1 .6 - - -
Fines, penalties, interest and other taxes. . 6.7 4 .4 2.3 - -
Total . . . . . . . . . . . . . . . . . . . . . . . . . . .1,984.5 1,279.9 670.0 13.5 21.1

NOTES TO THE FI NAN CIAL STATE MENTS 87
Federal Tax Refunds Disbursed for the Fiscal Year Ended September 30
Tax year to which the refunds relate
(In billions of dollars)Refunds
Dispersed 1999 1998 1997 Prioryears
Individual income and tax withholdings . . . . . . . . . . . . . . 149.2 0.6 138.9 7.2 2.5
Corporate income taxes . . . . . . . . . . . . . 33 .8 1.5 14.2 6.3 11.8
Unemployment taxes . . . . . . . . . . . . . . . 0.1 - 0.1 - -
Excise taxes . . . . . . . . . . . . . . . . . . . . . 1.3 0.2 0.4 - 0 .7
Customs duties . . . . . . . . . . . . . . . . . . . 1.2 0.4 0.3 0.1 0.4
Estate and gift taxes . . . . . . . . . . . . . . . 0.7 - 0.2 0.3 0.2
Total . . . . . . . . . . . . . . . . . . . . . . . . . 186.3 2.7 154.1 13.9 15.6
Note 16. Un rec on ciled Trans ac tions
Af fecting the Change in Net Po si tion
The rec on cil i a tion of the “Change in Net Po si tion” re -quires that the dif fer ence be tween end ing and be gin ningnet po si tion equals the ex cess of rev e nues over cost, plusor mi nus prior pe riod ad just ments.
The un rec on ciled trans ac tions needed to bring thechange in net po si tion into bal ance net to $24.4 bil lion.
The three pri mary fac tors af fect ing this out-of-balancesit u a tion are:
• Im proper re cord ing of intragovernmental trans -ac tions by agen cies.• Trans ac tions af fect ing Bal ance Sheet as sets andli a bil i ties not prop erly iden ti fied by agen cies asprior pe riod ad just ments.• Tim ing dif fer ences and er rors in the re port ing oftrans ac tions.
The Fed eral fi nan cial com mu nity con sid ers the iden ti fi -ca tion and re port ing of these un rec on ciled trans ac tions apri or ity.

88 NOTES TO THE FI NAN CIAL STATE MENTS
The Gov ern ment has en teredinto con trac tual com mit mentsthat re quire fu ture use of fi nan -cial re sources. It has sig nif i cantamounts of long-term lease ob li -ga tions as shown in the ta ble be -low. “Un de liv ered or ders” rep re -sen t the va lue of goods andser vices or dered that have not yetbeen re ceived.
Con tin gent li a bil i ties re lated to the loan guar an tee pro grams arede scribed in Note 4.
A con tin gency is an ex ist ingcon di tion or sit u a tion in volv ingun cer tainty as to a pos si ble loss.A loss is con sid ered rea son ably
pos si ble if the fu ture con firm ingevent or events are more than re -mote, but less than prob a ble.These con tin gen cies do not in -clude ex ist ing con di tions or sit u -a tions where the fu ture oc cur ringevent is only con sid ered re mote,nor do they in clude con tin gen cies that would re sult in a gain.
The Gov ern ment also is sub -ject to con tin gen cies, in clud inglit i ga tion, that arise in the nor malcourse of op er a tions. The ul ti -mate dis po si tion of these mat tersis un known. Based on in for ma -tion cur rently avail able, how ever, it is man age ment’s opin ion thatthe ex pected out come of these
mat ters, in di vid u ally or in the ag gre -gate, will not have a ma te rial ad verseef fect on the fi nan cial state ments, ex -cept for lit i ga tion de scribed in thenext para graph.
Nu mer ous cases are pend ing in -volv ing su per vi sory good will at sav -ings and loan in sti tu tions, Medicarecost re port set tle ments, har bor main -te nance fees and cer tain other mat -ters. While it is likely that the UnitedStates will have to pay some amountof dam ages on the claims, the ul ti -mate costs can not be rea son ably es ti -mated at this time.
The Gov ern ment also has un usedstat u tory lines of credit to Gov ern -ment spon sored en ter prises to tal ing$10 bil lion.
Financial Treatment of Loss Contingencies
Probability of Loss ProbableReasonably Possible, morethan remote but less thanprobable
Remote, chance ofoccurrence slight
Financial Treatment Balance Sheet Footnote Disclosure No disclosure
“Prior pe riod ad just ments”con sist of a net $6.9 bil lion ad -just ment to the open ing net po si -tion, to cor rect er rors in prior pe -ri ods.
Sig nif i cant com po nents of thisnet ad just ment in clude:
• A $37.5 bil lion de creaseof the be gin ning post-re tire -ment health ben e fits li a bil -ity for mil i tary per son nel(see Note 11— Fed eral Em -ployee and Vet eran Ben e fits Pay able), and
• A $28.5 bil lion in crease ofthe en vi ron men tal li a bil i tiesfor long-term sur veil lance andmain te nance, and de con tam i -na tion and de com mis sion ingcosts.
Note 17. Prior Pe riod Ad just ments
Note 18. Com mit ments and Con tin gencies

NOTES TO THE FI NAN CIAL STATE MENTS 89
Commitments as of September 30
(In billions of dollars)
CapitalLeases
OperatingLeases
Long-term Leases:
General Services Administration (GSA) . . . . . . . . . . . . . . . . 0.3 15.7
U.S. Postal Service . . . . . . . . . . . . . . . . . . . . . . . . . . . . . . . 0.6 8.5
Department of Justice . . . . . . . . . . . . . . . . . . . . . . . . . . . . . - 3.9
National Institutes of Health. . . . . . . . . . . . . . . . . . . . . . . . . - 0.6
Other long-term leases . . . . . . . . . . . . . . . . . . . . . . . . . . . . 0.9 2.3
Total long-term leases . . . . . . . . . . . . . . . . . . . . . . . . . . .1.8 31.0
Undelivered Orders:
HUD . . . . . . . . . . . . . . . . . . . . . . . . . . . . . . . . . . . . . . . . . . 104.3
Navy . . . . . . . . . . . . . . . . . . . . . . . . . . . . . . . . . . . . . . . . . . 28 .0
Education . . . . . . . . . . . . . . . . . . . . . . . . . . . . . . . . . . . . . . 21 .5
HHS . . . . . . . . . . . . . . . . . . . . . . . . . . . . . . . . . . . . . . . . . . 19 .7
Executive Office of the President . . . . . . . . . . . . . . . . . . . . . 16 .4
Defense agencies . . . . . . . . . . . . . . . . . . . . . . . . . . . . . . . . 14 .1
Rural development . . . . . . . . . . . . . . . . . . . . . . . . . . . . . . . 13 .9
Other undelivered orders. . . . . . . . . . . . . . . . . . . . . . . . . . . 187.1
Total undelivered orders . . . . . . . . . . . . . . . . . . . . . . . . . . 405.0
Other Commitments:
National Oceanic and Atmospheric Administrationsatellites and weather systems . . . . . . . . . . . . . . . . . . . . . 5.6
Transportation . . . . . . . . . . . . . . . . . . . . . . . . . . . . . . . . . . . 3.0
GSA . . . . . . . . . . . . . . . . . . . . . . . . . . . . . . . . . . . . . . . . . . 1.5
Navy . . . . . . . . . . . . . . . . . . . . . . . . . . . . . . . . . . . . . . . . . . 0.4
Commodity Credit Corporation . . . . . . . . . . . . . . . . . . . . . . . 0.3
Total other commitments . . . . . . . . . . . . . . . . . . . . . . . . . 10 .8

90 NOTES TO THE FI NAN CIAL STATE MENTS
Contingencies as of September 30
(In billions of dollars)
Insurance:
Export-Import Bank. . . . . . . . . . . . . . . . . . . . . . . . . . . . . . . . 40.9
Pension Benefit Guaranty Corporation . . . . . . . . . . . . . . . . . . 19.0
Overseas Private Investment Corporation . . . . . . . . . . . . . . . 0.2
Bank Insurance Fund . . . . . . . . . . . . . . . . . . . . . . . . . . . . . . 0.2
Other insurance programs. . . . . . . . . . . . . . . . . . . . . . . . . . . 0.2
Total insurance programs . . . . . . . . . . . . . . . . . . . . . . . . . . 60.5
Unadjudicated Claims:
Air Force . . . . . . . . . . . . . . . . . . . . . . . . . . . . . . . . . . . . . . . 0.8
Interior . . . . . . . . . . . . . . . . . . . . . . . . . . . . . . . . . . . . . . . . . 0.4
GSA . . . . . . . . . . . . . . . . . . . . . . . . . . . . . . . . . . . . . . . . . . . 0.2
Federal Savings and Loan Insurance CorporationResolution Fund . . . . . . . . . . . . . . . . . . . . . . . . . . . . . . . . 0.1
Bank Insurance Fund . . . . . . . . . . . . . . . . . . . . . . . . . . . . . . 0.1
Army . . . . . . . . . . . . . . . . . . . . . . . . . . . . . . . . . . . . . . . . . . 0.1
Other unadjudicated claims . . . . . . . . . . . . . . . . . . . . . . . . . . 0.6
Total unadjudicated claims . . . . . . . . . . . . . . . . . . . . . . . . . 2.3
Other Contingencies:
Multi-lateral development banks. . . . . . . . . . . . . . . . . . . . . . . 67.4
Production flexibility program. . . . . . . . . . . . . . . . . . . . . . . . . 5.1
Conservation reserve program . . . . . . . . . . . . . . . . . . . . . . . . 1.3
Environmental cleanup . . . . . . . . . . . . . . . . . . . . . . . . . . . . . 1.1
Contingent liabilities . . . . . . . . . . . . . . . . . . . . . . . . . . . . . . . 0.5
Nuclear waste fund. . . . . . . . . . . . . . . . . . . . . . . . . . . . . . . . 0.5
Real property activities . . . . . . . . . . . . . . . . . . . . . . . . . . . . . 0.4
Other contingencies . . . . . . . . . . . . . . . . . . . . . . . . . . . . . . . 1.4
Total other contingencies. . . . . . . . . . . . . . . . . . . . . . . . . . . 77.7

NOTES TO THE FI NAN CIAL STATE MENTS 91
The term “trust fund,” as used inthis re port and in Fed eral bud get ac -count ing, is fre quently mis un der -stood. In the pri vate sec tor, “trustfund” re fers to funds of one party held by a sec ond party (the trustee) in a fi -du ciary ca pac ity. In the Fed eral bud -get, the term “trust fund” means onlythat the law re quires the funds be ac -counted for sep a rately, used only forspec i fied pur poses and des ig nated asa “trust fund.” A change in law maychange the fu ture re ceipts and theterms un der which the fund’s re -sources are spent.
“Trust fund as sets” rep re sent theun ex pended bal ance from all sources
of re ceipts and amounts due the trustfund, re gard less of source. This in -cludes re lated gov ern men tal trans ac -tions. These are trans ac tions be tweentwo dif fer ent en ti ties within the Fed -eral Gov ern ment (for ex am ple, mon -ies re ceived by one en tity of the Gov -ern ment from an other en tity of theGov ern ment).
“Intragovernmental net as sets” arecom prised of in vest ments in Fed eraldebt se cu ri ties, re lated ac crued in ter -est and fund bal ance with Trea sury.These amounts were elim i nated inpre par ing this Fi nan cial Re port.
“Consolidated as sets” rep re sentonly the amounts due from in di vid u -
als and other en ti ties out side the Gov -ern ment. This means that all re latedgov ern men tal trans ac tions are re -moved to pres ent the Gov ern ment’spo si tion as a whole.
The ma jor ity of trust fund as sets isin vested in intragovernmental Fed eraldebt se cu ri ties. These se cu ri ties re -quire re demp tion if a fund’s dis burse -ments ex ceed its re ceipts. Re deemingthese se cu ri ties will in crease the Gov -ern ment’s fi nanc ing needs and re quiremore bor row ing from the pub lic (orless re pay ment of debt prior to ma tu -rity) or will re sult in higher taxes thanoth er wise would have been needed.
Note 19. Ded i cated Col lec tions
Dedicated Collections as of September 30*As sets
(In billions of dollars) ReceiptsDisburse-
ments
TrustFundNet
Assets
LessIntragovern- mental Net
Assets
Consoli-dated
Assets
Fund NameFederal Old-Age and
Survivors Insurance Trust Fund . . . . . . . . . . 444.7 334.4 745.9 745.9 -
Federal Disability Insurance Trust Fund . . 67.9 52.0 87.1 87.1 -
Medicare Part A. . . . . . . . 150.5 132.4 141.4 141.4 -Medicare Part B . . . . . . . 85.1 79.6 45.6 45.6 -Unemployment
Trust Fund . . . . . . . . . . 31.8 25.0 78.9 78.9 -Hazardous Substance
Superfund . . . . . . . . . . 0.9 1 .5 4 .4 4.4 -Highway Trust Fund. . . . . 39.3 29.3 28.0 28.0 -Airport and Airway
Trust Fund . . . . . . . . . . 11.1 7 .7 12.7 12.7 -Civil Service Retirement
and Disability Fund . . . . 73.9 43.9 490.4 490.1 0.3 Military Retirement Fund . 38.0 32.0 156.0 156.0 - Railroad Retirement Board
Trust Fund . . . . . . . . . . 5.1 8 .2 21.9 21.9 -
*By law, cer tain ex penses (costs) re lated to the ad min is tra tion of the above funds are not c harged to the funds and are fi nanced by other sources.

92 NOTES TO THE FI NAN CIAL STATE MENTS
The Fed eral Hos pi tal In sur ance Trust Fund fi nances theHos pi tal In sur ance pro gram (Medicare Part A). This pro -gram funds the cost of hos pi tal and re lated care for in di vid -u als age 65 or older, who meet cer tain in sured sta tus re -quire ments, and for el i gi ble dis ab led peo p le . TheDe part ment of Health and Hu man Ser vices (HHS) ad min is -ters the pro gram.
The Fed eral Hos pi tal In sur ance Trust Fund is fi nancedpri mar ily by pay roll taxes, in clud ing those paid by Fed eralagen cies. It also re ceives in come from in ter est earn ings onFed eral debt se cu ri ties and a por tion of in come taxes paidon So cial Se cu rity ben e fits.
This trust fund pro vides as sis -tance and pro tec tion against theloss of earn ings due to re tire mentor death. The as sis tance is in theform of money pay ments. TheFed eral Old-Age and Sur vi vorsIn sur ance Trust Fund is ad min is -
tered by the So cial Se cu rity Ad -min is tra tion (SSA).
Pay roll and self-employmenttaxes pri mar ily fund the Fed eralOld-Age and Sur vi vors In sur anceTrust Fund. In ter est earn ings onFed eral debt se cu ri ties, Fed eral
agen cies’ pay ments for the So cial Se -cu rity ben e fits earned by mil i tary and Fed eral ci vil ian em ploy ees, andTrea sury pay ments for a por tion ofin come taxes paid on So cial Se cu rityben e fits pro vide the fund with ad di -tional in come.
Federal DisabilityInsurance Trust Fund
The Fed e ra l Sup p le men t a ryMed i cal In sur ance Trust Fund fi -nances the Sup ple men tal Med i calIn sur ance pro gram (Medicare PartB), which pro vides sup ple men tarymed i cal in sur ance for el i gi ble par -
tic i pants to cover med i cal ex penses not cov ered by Medicare Part A.The De part ment of Health and Hu -man Ser vices ad min is ters the pro -gram.
A p p r o p r i a t i o n s , p r e m i u m scharged to en rollees and in ter estearned on in vest ments in Fed eraldebt se cu ri t ies fund the Fed eralSup ple men tary Med i cal In sur anceTrust Fund.
Federal Hospital Insurance Trust Fund
Federal Supplementary Medical Insurance Trust Fund (Medicare Part B)
The Fed eral Dis abil ity In sur ance TrustFund pro vides as sis tance and pro tec tionagainst the loss of earn ings due to a wageearner’s dis abil ity. The as sis tance is in the form of money pay ments. SSA ad min is -ters the Fed eral Dis abil ity In sur anceTrust Fund.
Like the Fed eral Old-Age and Sur vi -vors In sur ance Trust Fund, pay roll taxespri mar ily fund the Fed eral Dis abil ity In -sur ance Trust Fund. The Fund also re -ceives in come from in ter est earn ings onFed eral debt se cu ri ties, Fed eral agen cies’pay ments for the So cial Se cu rity ben e fitsearned by mil i tary and Fed eral ci vil ianem ploy ees, and a por tion of in come taxespaid on So cial Se cu rity ben e fits.
Federal Old-Age and Survivors Insurance Trust Fund
The Un em ploy ment Trust Fund pro tects work ers who lose their jobs throughno fault of their own. The Un em ploy ment In sur ance pro gram is a unique Fed eraland State part ner ship based on Fed eral law, but ex e cuted through State law byState of fi cials. The De part ment of La bor ad min is ters the Fed eral op er a tions ofthe pro gram.
Taxes on em ploy ers pri mar ily fund the Un em ploy ment Trust Fund. How ever,in ter est earned on in vest ments in Fed eral debt se cu ri ties also pro vides in come tothe fund. Ap pro pri a tions have sup ple mented its in come dur ing pe ri ods of highand ex tended un em ploy ment.
Unemployment
Trust Fund

NOTES TO THE FI NAN CIAL STATE MENTS 93
The Haz ard ous Sub stance Super-fund was au tho rized to ad dress pub -lic health and en vi ron men tal threats
from spills of haz ard ous ma te ri alsand from sites con tam i nated withhaz ard ous sub stances. The En vi ron -men tal Pro tec tion Agency (EPA)ad min is ters the fund.
The fol low ing fi nance the Haz -ard ous Sub stance Superfund:
• Ex cise taxes col lected onpe tro leum, chem i cals and im -ported sub stances (ex pired in1995).
• En vi ron men tal taxes fromcor po ra tions with al ter na tivemin i mum tax able in come inex cess of $2 mil lion (ex piredin 1995).• Fi nes and pen al ties and cost re cov er ies from re spon si blepar ties.• Ap pro pri a tions.• In ter est earned on in vest -ments in Fed eral debt se cu ri -t ies.
HazardousSubstanceSuperfund
Highway Trust Fund
The Air port and Air way Trust Fund pro vides for air portim prove ment, main te nance of air port fa cil i ties and equip -ment, re search, and a por tion of op er a tions. Trans por ta -tion ad min is ters the Air port and Air way Trust Fund.
The fol low ing pro vide fund ing for the Air port and Air -way Trust Fund:
• Taxes re ceived from trans por ta tion of per sonsand prop erty in the air and fuel used innon-commercial air craft. • In ter na tional de par ture taxes.• In ter est earned on in vest ments in Fed eral debtse cu ri ties.
Airport and Airway Trust Fund
Military Retirement Fund
The Mil i tary Re tire ment Fund pro vides re tire ment ben e fits forArmy, Navy, Ma rine Corps and Air Force per son nel and their sur -vi vors. The fund is fi nanced by DOD con tri bu tions, ap pro pri a tions and in ter est earned on in vest ments in Fed eral debt se cu ri ties.
The High way Trust Fund was es tab lished to pro mote do mes tic in ter -state trans por ta tion, and mov ing peo ple and goods. The fund pro videsFed eral grants to States for high way con struc tion and re lated trans por ta -tion pur poses. Trans por ta tion ad min is ters the High way Trust Fund.
The fol low ing pro vide all fi nanc ing for the High way Trust Fund:• Ear marked taxes on gas o line and other fu els, cer tain tires, ve -hi cle and truck use.• In ter est earned on in vest ments in Fed eral debt se cu ri ties.
The Civil Ser vice Re tire mentand Dis abil ity Fund cov ers twoFed eral ci vil ian re tire ment sys -tems: the Civil Ser vice Re tire -ment Sys tem (CSRS) for em ploy -ees hired be fore 1984 and theFed eral Em ployee Re tire mentSys tem (FERS), for em ploy eeshired af ter 1983.
The CSRS is fi nanced by:• Fed eral ci vil ian em ploy ees’con tri bu tions. • Agencies’ con tri bu tions onbe half of the em ploy ees.• Ap pro pri a tions.• In ter est earned on in vest -ments in Fed eral debt se cu ri -ties.
Civil Service
Retirement and Disability Fund
Railroad Retirement Trust Fund
The Rail road Re tire ment TrustFund pro vides an nu ities and sur vi -vor ben e fits to el i gi ble rail road em -ploy ees and their sur vi vors. Thefund also pays dis abil ity an nu itiesbased on to tal or oc cu pa tional dis -abil ity.
Pay roll taxes paid by rail roadem ploy ers and their em ploy eespro vide the pri mary source of in -come for the Rail road Re tire mentSur vi vor Ben e fit pro gram. By law,rail road taxes are co or di nated withSo cial Se cu rity taxes.

94 NOTES TO THE FI NAN CIAL STATE MENTS
Note 20. In dian Trust Funds
The In dian Trust Funds dif fer fromother ded i cated col lec tions re ported inNote 19. The De part ment of the In te rior(In te rior) has re spon si bil ity for the as -sets held in trust on be half of Amer i canIn dian tribes and in di vid u als. The trustfunds are held in ac counts for ap prox i -mately 315 tribes, 317,000 in di vid ualIn dian ac counts and other funds, in clud -ing the Alaska Na tive Es crow Fund.
The as sets held in trust for Na tiveAmer i cans are owned by the trust ben e -fi cia ries and are not the Fed eral Gov ern -ment’s as sets. There fore, these amountsare not re flected in the Bal ance Sheet orState ment of Op er a tions and Changes in Net Po si tion ex cept for their hold ings ofnon mar ket able Trea sury se cu ri ties, forwhich the Gov ern ment’s li a bil ity is in -cluded in Fed eral debt se cu ri ties held bythe pub lic.
U.S. Government as Trustee for Indian Trust Funds Held for Indian Tribes and Other Special Trust Funds Statement of Changes in Trust Fund Balances as of September 30 (Unaudited)
(In millions of dollars)Receipts . . . . . . . . . . . . . . . . . . . . . . . . . . . . . . . . . . . . . . . . . . . . . . . 873. 0
Disbursements . . . . . . . . . . . . . . . . . . . . . . . . . . . . . . . . . . . . . . . . . . (736.7)Receipts in excess of disbursements . . . . . . . . . . . . . . . . . . . . . . . . . . 136. 3Trust fund balances, beginning of year . . . . . . . . . . . . . . . . . . . . . . . . 2,460. 0
Adjustment . . . . . . . . . . . . . . . . . . . . . . . . . . . . . . . . . . . . . . . . . . . . . (0.5)
Trust fund balances, end of year . . . . . . . . . . . . . . . . . . . . . . . . . . . 2,595. 8
U.S. Government as Trustee for Indian Trust Funds Held for Individual Indian Monies Trust Funds Statement of Changes in Trust Fund Balances as of September 30 (Unaudited)
(In millions of dollars)
Receipts . . . . . . . . . . . . . . . . . . . . . . . . . . . . . . . . . . . . . . . . . . . . . . . 306.7
Disbursements . . . . . . . . . . . . . . . . . . . . . . . . . . . . . . . . . . . . . . . . . . (336.6)Receipts in excess of disbursements . . . . . . . . . . . . . . . . . . . . . . . . . . (29.9)
Trust fund balances, beginning of year . . . . . . . . . . . . . . . . . . . . . . . . . 479.2
Trust fund balances, end of year. . . . . . . . . . . . . . . . . . . . . . . . . . . . 449.3

SUP PLE MEN TAL IN FOR MA TION 95
Education, Training, Employment and Social Services
(In bil lions of dol lars) Gross CostEarned
Rev e nue Net Cost
Subfunctions :Elementary, secondary and vocational education. . . . . 17.6 - 17 .6 Higher education . . . . . . . . 14.5 1.4 13 .1 Research and general education aids. . . . . . . . . 2.5 - 2 .5 Training and employment . . 5.7 - 5 .7 Other labor services . . . . . . 1.0 - 1 .0 Social services. . . . . . . . . . 16.6 - 16 .6 Total education, training, employment and social services . . .
57.9 1.4 56 .5
HumanResources
United States Gov ern mentSup ple men tal In for ma tion for the Year Ended Sep tem ber 30, 1999(Un au dited)
Education, Training,Employment andSocial Services
The “Ed u ca tion, train ing,em ploy ment and so cial ser -vices” func tion serves to ex -tend knowl edge and skills, en -hance em p loy men t andem ploy ment op por tu ni ties,pro tect work place stan dardsand pro vide ser vices to theneedy.
The State ment of Net Cost pres ents the cost of the Gov ern -ment’s ma jor func tions. The ob jec tives of each of the func tionsare de scribed be low. Also, the state ment con tains the def i ni tionsof “Gross cost,” “Earned rev e nue” and “Net cost.”
Amounts listed un der this func -tion in clude the cost to pro vide mil i -tary forces to de ter war; to be pre -pared to en gage in war; and topre serve the peace and se cu rity ofthe United States, the Ter ri tories,Com mon wealth, its pos ses sions and any area oc cu pied by the UnitedStates. Na tional de fense also in -cludes the cost to train, equip, com -
pen sate and pro vide re tire ment ben -e fits for the armed forces; de velop,ac quire, ut i l ize and dis pose ofweapon sys tems; con duct re searchand de vel op ment to main tain tech -no log i cal su pe ri or ity, cut costs andim prove per for mance of weaponsys tems; and carry out other de fense re lated ac tiv i ties.
Net Cost Detail
NationalDefense

96 SUP PLE MEN TAL IN FOR MA TION
Human Resources,cont.
Health
(In bil lions of dol lars)GrossCost
EarnedRev e nue Net Cost
Subfunctions:Health care services . . . . . . . . 123.4 0.5 122.9 Health research
and training. . . . . . . . . . . . . 14.7 0.1 14 .6 Consumer and occupational
health and safety . . . . . . . . . 2.5 0.1 2.4
Total health . . . . . . . . . . .140.6 0.7 139.9
Income SecurityThe cost of pro vid ing pay -
ments to per sons un re lated toany cur rent ser vice com prisesthe “In come se cu rity” func tion.In cluded are dis abil ity, rail roadre tire ment ben e fits, tem po raryas sis tance to needy fam i lies andsim i lar pro grams, other thanamounts re lated to So cial Se cu -rity and vet er ans. Also in cludedare food stamps, spe cial milkand child nu tri tion pro grams;
un em ploy ment com pen sa tion;and work ers’ com pen sa t ionearned in come tax credit re -funds and re duc tion of tax payerliabilities; pub lic as sis tance cash pay ments; ben e fits paid to theel derly and coal min ers; andlow- and mod er ate-incomehous ing as sis tance. The cost ofFed eral pen sions and re tireehealth ben e fits are al lo cated toother func tions.
Income Security
(In bil lions of dol lars)GrossCost
EarnedRev e nue Net Cost
Subfunctions:
Unemploymentcompensation. . . . . . . . . 24 .5 0.7 23.8
Housing assistance. . . . . . 27 .8 - 27.8 Food and
nutritional assistance . . . 34 .1 0.1 34.0 Other income security . . . . 89 .8 3.7 86.1 Cost not allocated
to subfunctions. . . . . . . . 11 .8 1.7 10.1
Total incomesecurity . . . . . . . . . . . .
188.0 6.2 181.8
HealthListed un der the “Health”
func tion are the costs to pro -mote phys i cal and men talhealth, in clud ing the pre ven -tion of ill ness and ac ci dentsand the Medicaid pro gram. Al -though the Medicare pro gramis the larg est Fed eral healthpro gram, by law it is in a sep a -rate func tion for bud get pur -poses. Also ex cluded from the“Health” subfunction is Fed -eral health care for mil i taryper son nel and vet er ans.
MedicareFed eral Hos pi tal In sur ance
(Medicare Part A) and Fed eralSup ple men tary Med i cal In sur -ance (Medicare Part B) pro -grams make up Medicare. This func tion is not fur ther sub di -vided. For more in for ma tionon Medicare, see the note inthe Stew ard ship Re spon si bil -ities sec tion of Stew ard ship In -for ma tion, and Note 19—Ded -i cated Col lec tions.
Social Security“So cial Se cu rity” costs in -
clude pay ments to el i gi ble ben -e fi cia ries of the Old-Age andSur vi vors In sur ance (OASI )and Dis abil ity In sur ance (DI)pro grams. These are col lec -tively re ferred to as “So cial Se -cu rity.” The So cial Se cu ritypro gram is the sin gle larg estFed eral pro gram and is fundedpri mar ily by pay roll taxes. Formore in for ma tion on So cialSe cu rity, re fer to the Stew ard -ship In for ma tion sec tion onStew ard ship Re spon si bil itiesand Note 19—Ded i cated Col -lec tions.

SUP PLE MEN TAL IN FOR MA TION 97
Human Resources, cont.
Veterans Benefits and ServicesThe amounts listed un der this func tion in clude spe cific ben e fits and ser vices paid to
those with prior mil i tary ser vice or their spouse, de pend ents and sur vi vors. In cluded arevet er ans com pen sa tion, life in sur ance, pen sions, burial ben e fits, ed u ca tion, train ing,med i cal care, vet er ans hous ing and ad min is tra tive ex penses of the De part ment of Vet -erans Af fairs. The net cost line ti tled “Veterans ben e fits and ser vice” de creased this fis calyear by $204.8 bil lion pri mar ily due to a change in in ter est rate as sump tions in the cal cu -la tion of the re lated li a bil ity for vet er ans com pen sa tion.
Veterans Benefits and Services
(In bil lions of dol lars) Gross CostEarned
Rev e nue Net Cost
Subfunctions:Income security for veterans . . . . . . . . . . . . . . (65 .5) - (65.5)Veterans education,
training and rehabilitation . . . . . . . . . . . . . . . 1.7 0 .2 1.5 Hospital and medical care for veterans . . . . . . . 18.2 1 .8 16.4 Veterans housing. . . . . . . . . . . . . . . . . . . . . . . 1.3 0 .5 0.8 Other veterans benefits and services . . . . . . . . 1.1 0 .2 0.9
Total veterans benefits and services . . . . . . .(43 .2) 2 .7 (45.9)
PhysicalResources
EnergyThe “En ergy” function in cludes the cost of pro mot ing an ad e quate sup ply and
ap pro pri ate use of en ergy to serve the needs of the Na tion.
Energy
(In bil lions of dol lars) Gross Cost Earned
Rev e nue Net Cost
Subfunctions:Energy supply. . . . . . . . . . . 11.3 11.9 (0.6)Energy conservation . . . . . . 0.6 - 0.6 Emergency energy
preparedness . . . . . . . . . 0.2 - 0.2 Energy information,
policy and regulation. . . 0.8 0.5 0.3
Total energy . . . . . . . . . .12.9 12.4 0.5
Natural Resources and Environment
This func tion is com prised of costsin curred to de velop, man age andmain tain the Na tion’s nat u ral re -sources and en vi ron ment. Ex cludedare fund ing for com mu nity wa ter sup -ply pro grams, ba sic sewer sys temsand waste treat ment plants that arepart of com mu nity or re gional de vel -op ment pro grams.
Natural Resources and Environment
(In bil lions of dol lars) Gross Cost Earned Rev e nue Net Cost
Subfunctions:Water resources. . . . . . . . . . . . . . . . . . . . . . . . . . . . . . . . 5 .5 0 .5 5.0 Conservation and land management . . . . . . . . . . . . . . . . . 6 .2 0 .9 5.3 Recreational resources. . . . . . . . . . . . . . . . . . . . . . . . . . . 3 .0 0 .3 2.7 Pollution control and abatement . . . . . . . . . . . . . . . . . . . . 8 .6 0 .6 8.0 Other natural resources . . . . . . . . . . . . . . . . . . . . . . . . . . 3 .8 0 .6 3.2
Total natural resources and environment . . . . . . . . . . . .27 .1 2 .9 24.2

98 SUP PLE MEN TAL IN FOR MA TION
PhysicalResources, cont.
Commerce and Housing Credit
(In bil lions of dol lars) Gross Cost Earned Rev e nue Net Cost
Subfunctions:
Mortgage credit . . . . . . . . . . (3.4) 3.7 (7.1)
Postal Service . . . . . . . . . . . 80.0 61.9 18.1 Deposit insurance . . . . . . . . 4.3 1.4 2.9 Other advancement
of commerce . . . . . . . . . . 8.3 6.9 1.4
Total commerce and housing credit. . . . . 89.2 73.9 15.3
Commerce and Housing Credit
This func tion en com passes thepro mo tion and reg u la tion of thecom merce, hous ing and de posit in -sur ance in dus tries. In cluded un der“Com merce and hous ing credit” arecosts to col lect and dis sem i nate so -cial and eco nomic data; pro vide gen -eral pur pose sub si dies to busi nessand in di vid u als, in clud ing creditsub si dies for hous ing; and sup portthe Postal Ser vice fund.
Transportation
(In bil lions of dol lars) Gross Cost Earned
Rev e nue Net Cost
Subfunctions:Ground transportation . . . . 29 .2 - 29.2 Air transportation . . . . . . . . 9.6 0.4 9.2 Water transportation . . . . . 5.1 0.7 4.4 Other transportation. . . . . . 0.2 - 0.2
Total transportation. . . . .44 .1 1.1 43.0
Transportation
Grants to States and oth ers for lo -cal or na tional trans por ta tion of pas -sen gers and prop erty make up thebulk of the cost as so ci ated with thisfunc tion. In cluded are costs to con -struct fa cil i ties; pur chase equip ment;do re search, test ing and eval u a tion;and pro vide op er at ing sub si dies totrans por ta tion fa cil i ties (such as air -ports and rail roads).
The costs of pro mot ing vi a blecom mu nity econ o mies by de vel op -ing phys i cal fa cil i ties or fi nan cialin fra struc tures com prise this func -tion. Also in cluded are the costs of
de vel op ing trans por ta tion fa cil i ties that are in te gral parts of com mu -nity de vel op ment pro grams. Aidsto busi nesses is usu ally ex cludedfrom this func tion un less it pro -
motes the eco nomic de vel op ment ofde pressed ar eas and is not de signedto pro mote par tic u lar lines of busi -ness for their own sake.
Community and Regional Development
Community and Regional Development
(In bil lions of dol lars) Gross Cost Earned
Rev e nue Net Cost
Subfunctions:Community development . . . . . . . . . . . . . . . . . . . . 5.1 - 5.1 Area and regional development . . . . . . . . . . . . . . . 4.2 1.1 3.1 Disaster relief and insurance . . . . . . . . . . . . . . . . . 5.6 1.7 3.9 Total community
and regional development . . . . . . . . . . . . . . . .14.9 2.8 12.1

SUP PLE MEN TAL IN FOR MA TION 99
International Affairs
(In bil lions of dol lars) Gross CostEarned
Rev e nue Net Cost
Subfunctions:International development
and humanitarian assistance . . . . . . . . . . . . . . . . . . . . 9 .8 0 .4 9.4 International security assistance . . . . . . . . . . . . . . . . . . . . . 5 .8 0 .8 5.0 Conduct of foreign affairs . . . . . . . . . . . . . . . . . . . . . . . . . . 6 .1 1 .0 5.1 Foreign information and exchange activities . . . . . . . . . . . . 1 .2 - 1.2 International financial programs . . . . . . . . . . . . . . . . . . . . . 6 .7 7 .4 (0.7)
Total international affairs. . . . . . . . . . . . . . . . . . . . . . . . .29.6 9 .6 20.0
In ter est costs are pri mar ily amounts on Fed eral debt se -cu ri ties held by the pub lic. In ter est pay ments on these se cu -ri ties are made by Trea sury’s Bu reau of the Pub lic Debt.
Interest
International AffairsThis func tion in cludes the cost of
main tain ing peace ful re la tions, sup -port ing com merce and travel be tween
the United States and the rest of theworld, and pro mot ing in ter na tionalse cu rity and eco nomic de vel op mentabroad.
General Science, Spaceand Technology
This func tion cov ers the cost of Na -tional Sci ence Foun da tion re search,NASA space pro grams and De part -
ment of En ergy gen eral sci ence re -search.
Agriculture
Costs as so ci ated with pro mot ingag ri cul tural eco nomic sta bil ity andmain tain ing and in creas ing ag ri cul -tural pro duc tion are found un der the“Ag ri cul ture” func tion.
Other Functions
General Science, Space and Technology
(In bil lions of dol lars) Gross Cost Earned
Rev e nue Net Cost
Subfunctions:General science and basic research . . . . . . . . . . . . . . . . . 5.6 - 5.6 Space flight, research and supporting activities . . . . . . . . . 11.9 0.1 11.8
Total general science, space and technology . . . . . . . . .17.5 0.1 17.4
Agriculture
(In bil lions of dol lars) Gross Cost EarnedRev e nue Net Cost
Subfunctions:Farm income stabilization . . . . . . . . . . . . . . . . . . . . . . . . . 23.7 1.9 21.8 Agriculture research and service . . . . . . . . . . . . . . . . . . . . 3.5 0.5 3.0
Total agriculture. . . . . . . . . . . . . . . . . . . . . . . . . . . . . . .27.2 2.4 24.8

100 SUP PLE MEN TAL IN FOR MA TION
Administration of JusticeThe cost of ju di cial ser vices in cludes po lice pro tec tion,
law en force ment (in clud ing civil rights), re ha bil i ta tion andin car cer a tion of crim i nals, and the gen eral main te nance ofdo mes tic or der. It also in cludes the cost of pro vid ingcourt-appointed coun sel or other le gal ser vices for in di vid -u als. Not found un der “Ad min is tra tion of jus tice” are thecosts of the leg is la tive branch and po lice and guard ac tiv i -ties that pro tect Fed eral prop erty. Also, the cost of Na tionalGuard per son nel and mil i tary per son nel who are called
upon oc ca sion ally to main tain pub lic safety and the cost ofmil i tary po lice are in cluded un der the na tional de fensefunc tion.
General Government“Gen eral Gov ern ment” cov ers gen eral over head costs of
the Fed eral Gov ern ment. This in cludes leg is la tive and ex -ec u tive ac tiv i ties as well as cen tral fis cal, per son nel andprop erty ac tiv i ties. All ac tiv i ties rea son ably or closely as -so ci ated with other func tions are in cluded in those func -tions rather than “Gen eral Gov ern ment.”
General Government
(In bil lions of dol lars) Gross CostEarned
Rev e nue Net Cost
Subfunctions:
Legislative functions . . . . . . . . . . . . . . . . . . . . . . . . . . . 1.9 - 1.9
Executive direction and management . . . . . . . . . . . . . . . 0.7 - 0.7 Central fiscal operations . . . . . . . . . . . . . . . . . . . . . . . . 13 .1 0.5 12.6 General property and records management . . . . . . . . . . 0.1 0.1 - Central personnel management. . . . . . . . . . . . . . . . . . . 0.3 - 0.3 General purpose fiscal assistance . . . . . . . . . . . . . . . . . 1.1 - 1.1
Other general Government . . . . . . . . . . . . . . . . . . . . . . 7.9 4.0 3.9
Total general Government . . . . . . . . . . . . . . . . . . . .25 .1 4.6 20.5
Administration of Justice
(In bil lions of dol lars) Gross CostEarned
Rev e nue Net Cost
Subfunctions:
Federal law enforcement activities . . . . . . . . . . . . . . . . . 14.8 0.8 14.0
Federal litigative and judicial activities . . . . . . . . . . . . . . . 7.8 0.3 7.5
Federal correctional activities . . . . . . . . . . . . . . . . . . . . . 3.6 0.1 3.5
Criminal justice activities . . . . . . . . . . . . . . . . . . . . . . . . 5.0 0.4 4.6
Total administration of justice. . . . . . . . . . . . . . . . . .31.2 1.6 29.6
Other Functions, cont.

SUP PLE MEN TAL IN FOR MA TION 101
De ferred main te nance is the es ti -mated cost to bring Gov ern mentowned prop erty to an ac cept ablecon di tion. This re sults from notper form ing main te nance on atimely ba sis. De ferred main te -nance ex cludes the cost of ex pand -ing the ca pac ity of as sets or up -grad ing them to serve needsdif fer ent from those orig i nally in -tended. The con se quences of notper form ing reg u lar main te nancecould in clude in creased safety haz -ards, poor ser vice to the pub lic,higher cost in the fu ture and in ef fi -
cient op er a tions. Es ti mated de -ferred main te nance costs are notac crued in the State ment of NetCost or rec og nized as a li a bil ity onthe Bal ance Sheet.
The amounts dis closed for de -ferred main te nance have beenmea sured us ing the fol low ing twometh ods:
• Con di tion as sess ment sur -veys are pe ri odic in spec tionsof the Gov ern ment ownedprop erty to de ter mine the cur -rent con di tion and es ti mated
cost to bring the prop erty to an ac cept able con di tion.
• Life-cycle cost fore cast is an ac qui si tion or pro cure menttech nique that con sid ers op er -at ing, main te nance and othercosts in ad di tion to the ac qui -si tion cost of as sets.
Some de ferred main te nance hasbeen deemed to be crit i cal. Suchamounts and con di tions are de finedby the in di vid ual agen cies with re -spon si bil ity for the safe keep ing forthese as sets.
Deferred Maintenance
Deferred Maintenance as of September 30
Deferred Maintenance Cost Range
(In bil lions of dol lars) Low EstimateHigh
EstimateCrit i cal
Maintenance
Asset Category:
Buildings, structures and facilities . . . . . . . . . . . . . . . . . 44.3 52. 5 43.8
Furniture, fixtures and equipment. . . . . . . . . . . . . . . . . . .4 . 8 -
Other general property, plant and equipment . . . . . . . . . .2 . 3 -
Total general property, plant and equipment . . . . . . . . . . 44.9 53. 6 43.8
Heritage assets . . . . . . . . . . . . . . . . . . . . . . . . . . . . . . . .3 1. 0 1.0
National defense assets . . . . . . . . . . . . . . . . . . . . . . . . 2.7 2. 7 -
Total stewardship assets . . . . . . . . . . . . . . . . . . . . . . . . 3.0 3. 7 1.0
Total deferred maintenance . . . . . . . . . . . . . . . . . . .47.9 57. 3 44.8

102 SUP PLE MEN TAL IN FOR MA TION
For fis cal 1999, the uni fiedbud get re ported a sur plus of$124.4 bil lion. For the same pe -riod, the Fi nan cial Re port re -ports an ex cess of rev e nue overcost of $76.9 bil lion. The dif fer -ence be tween these two amounts oc curs be cause they are pre -pared pri mar ily on dif fer entmea sure ment bases to carry outtheir dif fer ent ob jec tives.
The Fi nan cial Re port gen er -ally is based on gen er ally ac -cepted ac count ing prin ci ples.Thus, ex penses and ex changerev e nue are gen er ally rec og -nized when the events giv ingrise to the trans ac tions oc currather than when the cash is re -ceived or paid.
Non-exchange rev e nues arerec og nized on a mod i fied cashba sis of ac count ing. By con trast, the uni fied bud get is com putedpri mar ily on the cash ba sis, ac -cord ing to ac cepted bud get con -cepts and pol i cies. The most sig -nif i cant dif fer ences be tweenthese two bases in volve the tim -ing of rec og ni tion and mea sure -ment of rev e nue and costs.
The dif fer ences be tween these two bases of ac count ing can be
di vided into four pri mary cat e -go ries.
1. Re ceipts rec og nized in thebud get that are not rec og nized as rev e nue in the Fi nan cial Re port,such as:
• Col lec tions of pre-creditre form loans.• Col lec tions of taxes re -ceiv able.• Col lec tions of ac counts re ceiv able.• Pro ceeds from the saleof cap i tal as sets rep re sent -ing “book value.”
2. Rev e nues rec og nized in theFi nan cial Re port that are not rec -og nized as re ceipts in the bud -get, such as:
• In creases in taxes re ceiv -able.• In creases in ac counts re ceiv able.
3. Out lays rec og nized in thebud get that are not rec og nized as costs in the Fi nan cial Re port,such as:
• Pur chases of in ven toryand gen eral prop erty, plantand equip ment.• Pay ments of ac countspay able.
• Pay ments of em ployeepen sions and other ben e fits that re duce prior re lated li -a bil i ties.• Pay ments of en vi ron -men tal cleanup and dis -posal costs that re duceprior re lated li a bil i ties.
4. Costs rec og nized in the Fi -nan cial Re port that are not rec -og nized as out lays in the bud get,such as:
• De pre ci a tion on gen eralprop erty, plant and equip -ment.• In creases in li a bil i tiesfor em ployee pen sions andother ben e fits.• In creases in es ti mateden vi ron men tal li a bil i ties.• De faults on pre-creditre form loans.• De creases in in ven tory.• In creases in ac countspay able.
The re main ing un iden ti fieddif fer ence is a net of $30.5 bil -lion. Since some of the dif fer -ences may be off set ting, thegross dif fer ence is larger thanthe $30.5 bil lion and may in -clude trans ac tions in all four cat -e go ries listed above. It also in -cludes the ef fect ofmisclassifying intragov ern men -tal trans ac tions and rel a tivelysmall dif fer ences in en tity cov er -age.
Reconciliation of Excessof Revenue over Net Cost

SUP PLE MEN TAL IN FOR MA TION 103
Reconciliation of the Excess of Revenue over Net Cost to the UnifiedBudget Surplus for the Year Ended September 30 (Unaudited)
(In billions of dollars)
Excess of revenue over net cost. . . . . . . . . . . . . . . . . . . . . . . . . . . 76.9
Decrease in veteran compensation and burial benefits:Decrease in liability for veterans . . . . . . . . . . . . . . . . . . . . . . . . . . . (64 .8)Decrease in liability for survivors. . . . . . . . . . . . . . . . . . . . . . . . . . . (29 .3)Decrease in liability for burial benefits . . . . . . . . . . . . . . . . . . . . . . . (0.8)
Decrease in liability for veterans . . . . . . . . . . . . . . . . . . . . . . . . . (94 .9)
Increase in environmental liabilities:Increase in Energy’s environmental liabilities . . . . . . . . . . . . . . . . . . 44.3Increase in Defense’s environmental liabilities . . . . . . . . . . . . . . . . . 45.7Decrease in all others environmental liabilities . . . . . . . . . . . . . . . . . (1.3)
Increase in environmental liabilities . . . . . . . . . . . . . . . . . . . . . . . 88.7
Capitalized fixed assets:Department of Defense. . . . . . . . . . . . . . . . . . . . . . . . . . . . . . . . . . (23 .5)Civilian agencies . . . . . . . . . . . . . . . . . . . . . . . . . . . . . . . . . . . . . . (18 .0)
Total capitalized fixed assets . . . . . . . . . . . . . . . . . . . . . . . . . . . . (41 .5)
Increase in liability for civilian employee benefits:Increase in civilian pension liabilities. . . . . . . . . . . . . . . . . . . . . . . . 28.8Decrease in civilian health liabilities . . . . . . . . . . . . . . . . . . . . . . . . (2.1)Increase in other civilian benefits liabilities . . . . . . . . . . . . . . . . . . . 14.9
Increase in liability for civilian employee benefits liabilities . . . . . . 41.6
Decrease in liability for military employee benefits:Increase in military pension liabilities. . . . . . . . . . . . . . . . . . . . . . . . 11.3Decrease in military health liabilities . . . . . . . . . . . . . . . . . . . . . . . . (27 .2)
Decrease in other military benefits . . . . . . . . . . . . . . . . . . . . . . . . . (15 .2)
Decrease in liability for military employee benefits . . . . . . . . . . . . (31 .1)
Depreciation expense 1999 . . . . . . . . . . . . . . . . . . . . . . . . . . . . . . . . 17.3Decrease in benefits due and payable . . . . . . . . . . . . . . . . . . . . . . . . (3.8)Increase in inventory . . . . . . . . . . . . . . . . . . . . . . . . . . . . . . . . . . . . . (6.5)Decrease in taxes receivable . . . . . . . . . . . . . . . . . . . . . . . . . . . . . . . 4.4Increase in other liabilities . . . . . . . . . . . . . . . . . . . . . . . . . . . . . . . . . 14.4Seigniorage and sale of gold . . . . . . . . . . . . . . . . . . . . . . . . . . . . . . . (1.0)Decrease in accounts payable . . . . . . . . . . . . . . . . . . . . . . . . . . . . . . (4.2)Decrease in accounts receivable . . . . . . . . . . . . . . . . . . . . . . . . . . . . 1.2Principal repayments of pre-credit reform loans . . . . . . . . . . . . . . . . . 32.4
Net amount of all other differences. . . . . . . . . . . . . . . . . . . . . . . . . 30.5
Unified budget surplus . . . . . . . . . . . . . . . . . . . . . . . . . . . . . . .124.4

104 SUP PLE MEN TAL IN FOR MA TION
Unexpended Budget Authority as of September 30, 1999 (Unaudited)
(In bil lions of dol lars)
UnobligatedBud get
Au thor ity
Ob li gatedBud get
Au thor ity
Social Security Administration. . . . . . . . . . . . . . . . . . . . . . 819.6 36.1Office of Personnel Management . . . . . . . . . . . . . . . . . . . 502.8 5.9Department of Health and Human Services . . . . . . . . . . . . 198.8 55.8Department of Defense-Military . . . . . . . . . . . . . . . . . . . . . 60.6 152.7Other Defense Civil Programs . . . . . . . . . . . . . . . . . . . . . . 149.9 2.8Department of Housing and Urban Development . . . . . . . . 36.8 107.0Department of Transportation . . . . . . . . . . . . . . . . . . . . . . 58.9 52.5Department of the Treasury. . . . . . . . . . . . . . . . . . . . . . . . 21.6 18.4International Assistance Program . . . . . . . . . . . . . . . . . . . 36.0 65.2Department of Labor . . . . . . . . . . . . . . . . . . . . . . . . . . . . . 90.4 8.4Independent agencies . . . . . . . . . . . . . . . . . . . . . . . . . . . . 74.1 5.9Department of Agriculture . . . . . . . . . . . . . . . . . . . . . . . . . 23.2 15.1Department of Education . . . . . . . . . . . . . . . . . . . . . . . . . 10.2 24.4Department of Veterans Affairs . . . . . . . . . . . . . . . . . . . . . 16.1 7.1Department of Energy . . . . . . . . . . . . . . . . . . . . . . . . . . . 12.5 7.8Department of Justice. . . . . . . . . . . . . . . . . . . . . . . . . . . . 4.7 13.8Environmental Protection Agency . . . . . . . . . . . . . . . . . . . 8.0 8.5Department of State . . . . . . . . . . . . . . . . . . . . . . . . . . . . . 12.7 3.0Federal Emergency Management Agency . . . . . . . . . . . . . 0.8 8.3Department of the Interior . . . . . . . . . . . . . . . . . . . . . . . . . 5.3 2.9National Aeronautics and Space Administration . . . . . . . . . 0.9 5.3Department of Commerce . . . . . . . . . . . . . . . . . . . . . . . . . 0.8 3.7Corps of Engineers . . . . . . . . . . . . . . . . . . . . . . . . . . . . . . 4.0 0.4National Science Foundation . . . . . . . . . . . . . . . . . . . . . . . 0.2 4.2General Services Administration . . . . . . . . . . . . . . . . . . . . 3.8 0.5Legislative Branch . . . . . . . . . . . . . . . . . . . . . . . . . . . . . . 1.7 0.4Small Business Administration . . . . . . . . . . . . . . . . . . . . . 0.7 1.0Judicial Branch . . . . . . . . . . . . . . . . . . . . . . . . . . . . . . . . . 0.7 0.5Executive Office of the President. . . . . . . . . . . . . . . . . . . . 0.3 0.1
Total . . . . . . . . . . . . . . . . . . . . . . . . . . . . . . . . . . . . . . . 2,156.1 617.7
Un ex pended Bud get Au thor ityis the sum of the ob li gated, but un -liq ui dated, and unobligated bud getau thor ity.
Unobligated bud get au thor ity,in clud ing trust fund bal ances, isthe cu mu la tive amount of bud getau thor ity that is not ob li gated andthat re mains avail able for ob li ga -t ion. In 1-year ac counts the
unobligated bal ance is not avail -able af ter the end of the fis cal year.In multi-year ac counts the ob li -gated bal ance may be car ried for -ward and re mains avail able for ob -li ga tion for the pe riod spec i fied. Inno year ac counts the unobligatedbal ance is car ried for ward un tilspe cif i cally re scinded by law, or
un til the pur poses for which it waspro vided have been ac com plished.
Ob li gated bud get au thor ity is the cu mu la tive amount of bud get au -thor ity that has been ob li gated butnot yet liquidated. This bal ancecan be car ried for ward for a max i -mum of 5 years af ter the ap pro pri a -tion has ex pired.
Unexpended Budget Authority

SUP PLE MEN TAL IN FOR MA TION 105
The In ter nal Rev e nue Code pro vides for pro gres sive rates of tax,whereby higher in comes are gen er ally sub ject to higher rates of tax. Theta bles pres ent the lat est avail able in for ma tion on in come tax and on re -lated in come, de duc tions and credit for in di vid u als by in come level andfor cor po ra tions by size of as sets.
Tax Burden
Individual Income Tax Returns for Tax Year 1997
Size of Adjusted Gross Income
(In mil lions of dol larsun less oth er wise noted)
Un der $15,000
$15,000un der
$30,000
$30,000un der
$50,000
$50,000un der
$100,000
$100,000un der
$200,000
Greaterthan
$200,000
Total number ofreturns . . . . . . . . . . 41.4 29.4 22.8 21.6 5.4 1.8
Gross income . . . . . . 251.9 649.1 895.2 1,490.0 717.3 1,013.4Adjusted gross income . . . . . . . . . . 247.9 642.9 887.9 1,478.9 707.8 1,004.5Tax . . . . . . . . . . . . . . 9.1 47.4 90.6 191.6 126.7 274.0Tax burden,
percentage of gross total
receipts . . . . . . . . . 3.60% 7.30% 10.13% 12.86% 17.67% 27.04%
Average tax dollarsper return. . . . . . . . 219 1,612 3,983 8,858 23,562 151,565
Deductions on taxable income:Standard deduction . . 175. 4 137.2 82.6 42.1 3. 6 0.9Medical and dental expense. . . . . . . . . 5. 2 8.6 6.6 6.2 2. 0 0.6Interest . . . . . . . . . . . 5. 3 18.4 45.5 100.0 46. 5 34.9Charitable contributions . . . . . 1. 2 5.5 12.3 29.9 16. 9 33.4Other itemized deductions. . . . . . . 3. 5 14.0 35.9 91.1 50. 5 46.7
Total itemized deductions . . . . . 15. 2 46.5 100.3 227.2 115. 9 115.6
Total deductions . . . 190. 6 183.7 182.9 269.3 119. 5 116.5Total expenditures, deductions. . . . . . . 6. 9 13.4 18.5 34.6 21. 1 31.5
Credit against tax liability:Child care credit . . . . - 0.6 0.7 0 .9 0. 2 -Credit for elderly and disabled . . . . . . . . . - - - - - -Foreign tax credit. . . . - - 0.1 0 .3 0. 6 3.0EITC, offset
tax liability. . . . . . . 0. 4 3.5 - - - -Other credits. . . . . . . - - 0.1 0 .3 0. 3 1.0Total credits. . . . . . . 0. 4 4.1 0.9 1.5 1. 1 4.2
Total expendituresand credits, individual . . . . . . .
7. 3 17.5 19.4 36.1 22. 2 35.7

106 SUP PLE MEN TAL IN FOR MA TION
Corporate Income Tax Returns for Tax Year 1996
Size of Total Assets (in thousands)
(In mil lions of dol larsun less oth er wise noted)
Un der$1,000
$1,000un der
$10,000
$10,000un der
$50,000
$50,000un der
$100,000
$100,000un der
$250,000
Greaterthan
$250,000
Total returns (in thousands) . . . . . . . 4,193.3 370. 9 42.9 8.5 7.6 8.2
Total receipts . . . . . . . . . . 2,103.7 2,204. 3 1,357.3 505.4 741.0 8,614.1
Taxable income . . . . . . . . 24 .0 26. 2 25.8 16.3 28.9 518.6
Total tax . . . . . . . . . . . . . . 5 .6 8. 1 8.4 5.2 9.0 134.2
Tax burden, percentof gross total receipts . . 0.27% 0.37% 0.62% 1.04% 1.22% 1.56%
Average tax per return(in thousands) . . . . . . 1 .3 21. 8 196.1 618.5 1,187.2 16,346 .4
Deductions on taxable income:
Net operating loss . . . . . 10 .2 5. 6 4.4 2.5 4.2 28.2
Dividends received . . . . 0 .4 0. 5 0.6 0.4 0.9 16.9
Public utility dividends paid . . . . . . - - - - - 0 .1
Total deductions . . . . . . . . 2,064.5 2,163. 3 1,326.2 486.7 703.4 7,984.1
Total expenditures,deductions . . . . . . . . . . 5 .5 7. 9 8.2 5.0 8.6 124.4
Credits against tax liability:
Foreign tax credit . . . . . 0 .1 - 0.1 0.2 0.6 39.2
U.S. Possessions tax credit . . . . . . . . . . - - 0.2 0.2 0.3 2.4
Nonconventional source fuel credit . . . . - - - - - 0 .8
General business credit . . . . . . 0 .2 0. 1 0.1 0.1 0.1 3.6
Other credits. . . . . . . . . 0 .1 0. 2 0.2 0.1 0.1 4.1
Total credits. . . . . . . . . 0 .4 0. 3 0.6 0.6 1.1 50.1
Total expenditures, corporation . . . . . . . .
5 .9 8. 2 8.8 5.6 9.7 174.5

OTHER IN FOR MA TION 107
Federal Taxes Receivable Net
Man age ment has es t i matedamounts that may be paid out asother claims for tax re funds. Thises ti mate rep re sents an amount(prin ci pal and in ter est) that maybe paid for claims pend ing ju di -cial re view by the Fed eral courtsor, in ter nally, by Ap peals. The to -tal es ti mated pay out (in clud ingprin ci pal and in ter est) for claimspend ing ju di cial re view by the
Fed eral courts is $7.6 bil lion andby Ap peals is $11.4 bil lion. Al -though these re fund claims havebeen deemed to be prob a ble, theydo not meet the cri te ria in SFFASNo. 5 for re port ing the amounts inthe bal ance sheet or for dis clo surein the notes to the fi nan cial state -ments. How ever, they meet the cri -te ria in SFFAS No. 7 for in clu sionas sup ple men tal in for ma tion.
In ac cor dance with SFFAS No. 7, someun paid as sess ments do not meet the cri te riafor fi nan cial state ment rec og ni tion as dis -cussed in Note 1 to the fi nan cial state ments. Al though com pli ance as sess ments andwrite-offs are not con sid ered re ceiv ablesun der Fed eral ac count ing stan dards, theyrep re sent le gally en force able claims of the
IRS—act ing on be half of the Fed eral Gov -ern ment. There is, how ever, a sig nif i cantdif fer ence in the col lec tion po ten tial ofthese cat e go ries.
The com po nents of the to tal un paid as -sess ments and der i va tion of net Fed eraltaxes re ceiv able at Sep tem ber 30, 1999,were as fol lows:
Federal Taxes Receivable as of September 30
(In billions of dollars)
Total unpaid assessments . . . . . . . . . . . . . . . . . $233.2Less: Compliance assessments. . . . . . . . . . . . . (27.0)
Write-Offs . . . . . . . . . . . . . . . . . . . . . . . . (127.0)Gross Federal Taxes Receivable . . . . . . . . . . . . 79.2Less: Allowance for doubtful accounts . . . . . . . . (56.5)
Federal Taxes Receivable, Net . . . . . . . . . . . . .22.7
Other Information (Unaudited)
The Gov ern ment can not rea son -ably es ti mate the amount of al low -ance for doubt ful ac counts per tain ingto its com pli ance as sess ments, andthus can not de ter mine their net re al iz -able value or the value of the pre-as -sess ment work-in-prog ress.
To elim i nate dou ble-count ing, thecom pli ance as sess ments re portedabove ex clude trust fund re cov ery
pen al ties, to tal ing $15 bil lion, as sessed against of -fi cers and di rec tors of busi nesses who werein volved in the non re mit tance of Fed eral taxeswith held from their em ploy ees. The re lated un paid as sess ments of those busi nesses are re ported astaxes re ceiv able or write-offs, but the Gov ern ment also may re cover por tions of those busi nesses’ un -paid as sess ments from any and all in di vid ual of fi -cers and di rec tors against whom a trust fund re -cov ery pen alty is as sessed.
Other Claimsfor Refund

108 AP PEN DIX
This Fi nan cial Re port in cludes the ex ec u tive, leg is la tive and ju di cial branches of the Gov ern ment. Ex cluded arepri vately owned Gov ern ment-sponsored en ter prises suchas the Fed eral Home Loan Banks and the Fed eral Na tionalMort gage As so ci a tion. The Fed eral Re serve Sys tem also
is ex cluded be cause or ga ni za tions and func tions per tain -ing to mon e tary pol icy are tra di tion ally sep a rate from, andin de pend ent of, other cen tral Gov ern ment or ga ni za tionsand func tions.
Significant Entities Included in these Statements:
Appendix: List of Significant Government Entities Included and Excluded
De part ment of Ag ri cul ture (Ag ri cul ture)www.usda.gov
De part ment of Com merce (Com merce)www.doc.gov
De part ment of De fense (DOD)www.defenselink.mil
De part ment of Ed u ca tion (Ed u ca tion)www.ed.gov
De part ment of En ergy (En ergy)www.doe.gov
De part ment of Health and Hu man Ser vices (HHS)www.hhs.gov
De part ment of Housing and Ur ban De vel op ment (HUD)www.hud.gov
De part ment of In te rior (In te rior)www.doi.gov
De part ment of Jus tice (Jus tice)www.usdoj.gov
De part ment of La bor (La bor)www.dol.gov
De part ment of State (State)www.state.gov
De part ment of the Air Force (Air Force)www.af.mil
De part ment of the Army (Army)www.army.mil
Army Corps of En gi neerswww.usace.gov
De part ment of the Navy (Navy)www.navy.mil
De part ment of Trans por ta tion (Trans por ta tion)www.dot.gov
De part ment of the Trea sury (Trea sury)www.ustreas .gov
De part ment of Vet erans Af fairs (VA)www.va.gov
Agency for In ter na tional De vel op ment (AID)www.info.usaid.gov
Cen tral In tel li gence Agency (CIA)www.odci.gov/cia/ciahome.html
Con gres sio nal Bud get Of fice (CBO )www.cbo.gov
Com mod ity Credit Cor po ra tion
Com mod ity Fu tures Trading Com mis sionEn vi ron men tal Pro tec tion Agency (EPA)
www.epa .govEx ec u tive Of fice of the Pres i dentEx port-Import Bank of the United States
www.exim.govFarm Credit Ad min is tra tion (FCA)
www.fca.govFed eral Com mu ni ca tions Com mis sion (FCC)
www.fcc.govFed eral De posit In sur ance Cor po ra tion (FDIC)
www.fdic.govFed eral Emer gency Man age ment Agency (FEMA)
www.fema.govFed eral Trade Com mis sion (FTC)
www.ftc.govGen eral Ac count ing Of fice (GAO)
www.gao.govGen eral Ser vices Ad min is tra tion (GSA)
www.gsa .govGov ern ment Print ing Of fice (GPO)
www.gpo.govLi brary of Con gress (LOC)
www.loc.govNa tional Aero nau tics and Space Ad min is tra tion (NASA)
www.nasa.gov Na tional Ar chives and Re cords Ad min is tra tion
www.nara.govNa tional Credit Un ion Ad min is tra tion (NCUA)
www.ncua.govNa tional Sci ence Foun da tion (NSF)
www.nsf .govNa tional Trans por ta tion Safety Board ( NTSB)
www.ntsb.govNu clear Reg u la tory Com mis sion (NRC)
www.nrc .govOf fice of Man age ment and Bud get (OMB)
www.whitehouse.gov/wh/eop/omb/html/omb home.html
Of fice of Per son nel Man age ment (OPM)www.opm.gov

AP PEN DIX 109
Army and Air Force Ex change Ser viceBoard of Gov er nors of the Fed eral Re serve Sys temFan nie MaeFarm Credit Sys temFed eral Home Loan BanksFed eral Re serve Banks (FRBs)Fed eral Re tire ment Thrift In vest ment Board
Significant Entities Excluded from these Statements:
Entities Included, cont.
Fi nancing Cor po ra tionFreddie MacMa rine Corps Ex changeNavy Ex change Ser vice Com mandRes o lu tion Funding Cor po ra tionSal lie MaeThrift Sav ings Fund
Other boards and commissionsOther leg is la tive and ju di cialPen sion Ben e fit Guar anty Cor po ra tion
www.pbgc.govRail road Re tire ment Board (RRB)
www.rrb.govSe cu ri ties and Ex change Com mis sion (SEC)
www.sec.govSmall Busi ness Ad min is tra tion (SBA)
www.sba.gov
Smith so nian In sti tu tionwww.si.edu
So cial Se cu rity Ad min is tra tion (SSA)www.ssa. gov
Ten nes see Val ley Au thor ity (TVA)www.tva. gov
U.S. In for ma tion Agencywww.usia.gov
U.S. Postal Ser vicewww.usps.gov