financial report for the second quarter and the first six ... · financial report for the second...
TRANSCRIPT

Financial Report for the Second Quarter and the First Six Months 2019Net asset value (NAV) and financial results for the six month period• Vostok New Ventures’ net asset value was USD 697.74 million (mln) on June 30, 2019 (December 31, 2018: 876.71),
corresponding to USD 8.94 per share (December 31, 2018: 10.37). Given a SEK/USD exchange rate of 9.2713 the NAV was SEK 6,468.90 mln (December 31, 2018: 7,864.96) and SEK 82.85 per share (December 31, 2018: 93.01), respectively.
• The group’s NAV per share in USD, adjusted for the SEK 25 distribution concluded on March 14, 2019, increased by 17.9%, mainly driven by the revaluation of Babylon (USD 102.8 mln), VOI (USD 5.8 mln), Hemnet (USD 4.1 mln) and Booksy (USD 3.4 mln).
• Net result for the period was USD 85.90 mln (January 1, 2018–June 30, 2018: 12.17). Earnings per share were USD 1.08 (0.14).
Financial results for the second quarter• Net result for the quarter was USD 112.48 mln (-14.07). Earnings per share were USD 1.44 (-0.17).
Key events during the quarter April 1, 2019–June 30, 2019• In April 2019, Vostok New Ventures invested an additional USD 16.3 mln in Gett as part of an extension of the previous round,
and invested an additional USD 7.7 mln (GBP 6.0 mln) in Babylon through a convertible note.• On April 10, 2019, Vostok New Ventures announced that the Company’s Board of Directors had resolved to award Per
Brilioth, Managing Director of Vostok New Ventures, an extraordinary bonus in the gross amount of USD 15 mln following the successful exit of Avito during January 2019.
• In May 2019, Vostok New Ventures invested an additional USD 1.8 mln in DOC+ and USD 1.0 mln (SEK 10.0 mln) in Grace Health, an OB Gyn healthcare service for women in emerging markets.
• In June 2019, Vostok New Ventures invested USD 16 mln in SWVL, a Cairo-based, emerging markets focused intra-city bus operator; advanced an amount of USD 11.7 mln out of a total commitment of USD 17.5 mln in VOI through a convertible note in anticipation of final allocation; invested USD 2.5 mln in Booksy, a booking platform for beauty salons; and USD 11.6 mln in Dostavista, a Moscow-based last mile logistics company operating in Russia and several other markets. In June 2019, Vostok New Ventures invested USD 3.3 mln (EUR 3.0 mln) in JamesEdition, a classifieds platform focused on luxury categories including high-end cars and real estate.
• Vostok New Ventures revalues its holding in Babylon based on the funding round, concluded on August 2, 2019.
Share (SDR) info• On January 29, 2019, Vostok New Ventures announced that the Company’s Board of Directors had resolved on a renewed
mandate to repurchase SDRs. During the quarter no SDRs were repurchased. • At the end of the period, the number of outstanding shares (SDRs), excluding 7,608,103 repurchased SDRs, was 78,080,206.
Key events after the end of the period• After the end of the period, Vostok New Ventures invested an additional USD 7.5 mln (GBP 6.0 mln) in Babylon through a
convertible note.• After the end of the period, following final allocation, Vostok New Ventures invested the remaining USD 5.8 mln of its
commitment in VOI through a convertible note for a total investment of USD 17.5 mln.• During July 2019, Vostok New Ventures issued 147,000 new shares and corresponding SDRs in connection with the option
program issued 2016 under its 2010 incentive program. Following the option exercise of 100,000 options, the number of outstanding shares (SDRs), excluding 7,608,103 repurchased SDRs, was 78,227,206.
• On August 2, 2019, Vostok New Ventures participated in the closing of a funding raise in Babylon with a total of USD 71 mln, including previously extended convertible loans. The USD 500 mln round, with an option to raise a further USD 50 mln, values the company at USD 2 billion (bln) post money.
The Company will hold a telephone conference with an interactive presentation at 15:00 CEST (09:00 a.m. EDT) Wednesday, August 14. For call-in details, see separate press release issued Thursday, August 8, at www.vostoknewventures.com.

Management report
Current portfolioBabylonAs it has been separately disclosed a couple of weeks ago, Babylon has announced a large round of a total of USD 500 mln, with an option to raise a further USD 50 mln, at a post money valuation of USD 2 bln. We have participated to maintain our 10% holding on a fully diluted basis, investing a further USD 71 mln.
The company has over the past two years continuously developed a unique, end-to-end platform, which has the capability to provide AI-driven health services and virtual medical consultations, complemented by traditional face to face consultations, and has been able to demonstrate its commercial viability with global counterparties including Prudential, Samsung, Telus, Bupa and NHS.
This funding round, led by the sovereign wealth fund PIF and including Kinnevik, MunichRe amongst others, allows it to accelerate the development of product and to expand to new markets notably the US.
I believe it cements Babylon’s position as the world leader in digital healthcare. Despite a significant revalua-tion from our initial investment I can see Babylon in a five or so year time frame reaching a USD 20 bln plus price tag, either as a private or public company.
OtherOutside of Babylon we have been active during the past quarter investing into a series of new opportunities with in our view excellent risk reward characteristics. A short description on each follows below.
We are also very engaged in the funding rounds of VOI, providing it with bridge funding during the past quarter. We hope to be able to share final deal terms if not before then at least in our next quarterly report.
In terms of updates on both VOI and Babylon, but importantly also BlaBlaCar and Gett, I would encourage you to watch each of the founders of these companies present their companies in a recording from our Capital Markets Day in London in mid-June. You will find it on www.vostoknewventures.com.
New dealsSWVLWe have invested USD 16 mln in return for a 10% stake in SWVL.
SWVL is a premium alternative to city transportation that connects commuters to a bus line through an app. The company started in Cairo and has grown massively in this very difficult city, whilst also expanding to Alexandria and now also Nairobi, with Lahore and Karachi in Pakistan next on the roadmap. The public transportation system in each of these cities lacks efficiency, security and reliability and the taxi alternatives are too expensive for the middle class. The supply of buses is very poor, leading to very overcrowded buses as the only source of intra-city trans-portation for the middle class. SWVL offers a premium on demand bus service with third party supply. The algorithm plans the most efficient routes and the most efficient bus stops for peak hours, and more flexibility is possible during off peak hours. Network effects arise through the snowball of the more users that are attracted to the service, the more bus owners will want to offer their supply, the more bus supply the more routes etc., the more customers etc., etc. The technological heart is through the user experi-ence (UX) in the app, the routing of buses in real time and perhaps most importantly the aggregation of data to plan future bus lines more efficiently. The overall technological complexity is higher than in ride hailing where a car is ‘sim-ply’ dispatched to a certain place.
We have studied this opportunity for a few years but only invested now as SWVL has proven that there is real demand and that the economics work. The overall total addressable market in emerging markets is estimated at some USD 150 bln.
Looking at SWVL’s cohorts and bus lines in Cairo where bus utilization is 60%+ you see a clear path to gross margins close to 30% over time, higher than taxi hailing at roughly 20%, likely warranting also higher multiples for this type of business.
The entrepreneur here is of very high quality. Previously at Rocket and Careem, Mostafa Kandil has built a team that executes well and at high speed. In fact, I believe that Mostafa may be the first Arab tech entrepreneur that builds
: : 2 : :

a global product. All the other successes coming out of the Arab world have been either built by foreigners and/or have been solely focused on the local region. SWVL’s ambitions are first pan-African but also to quickly take the product to South East Asia. Its latest international city, Nairobi, has grown to the same size that Cairo achieved after 10 months in merely six weeks.
SWVL has been funded by, among others, our friends at Beco Capital whom we know from both Property Finder and Vezeeta. Beco recently made a massive exit in the sale of Careem to Uber for USD 3 bln.
We believe the overall target of USD 1 bln in GMV by 2023 is achievable and that Egypt alone could become worth at least USD 500 mln and, if successful in Lahore, Karachi, Nairobi, Lagos and Johannesburg, this upside obviously multiplies.
DostavistaWe have invested USD 12 mln in return for a significant minority stake in Dostavista.
Dostavista targets the first and last mile delivery mar-ket. The solution of the delivery infrastructure of shopping on the internet is deliveries within the hour. Long distance delivery works well but first mile (out of the merchants’ inventory) and last mile (into the hands of the receiver) is inefficient, fragmented, inconvenient and expensive. The product that Dostavista sells is essentially on demand logis-tics for SMEs where there is a delivery within 90 minutes or exactly on time. No more going to the local tobacco store after work to pick up what you ordered on the net or stay-ing home the whole day to wait for a delivery.
Dostavista handles quality control through a system of scoring and rating. Clients rate couriers in a similar way to taxi services. The company also runs a system which scores couriers using many parameters, in a way similar to banks scoring of their customers. There are also customer service centers in every country that handle whatever problems or queries may arise.
There are clear network effects. The more couriers you attract, the more senders you attract, the more senders the more couriers and you’re off. The focus is B2B between a sender (typically a small to medium sized ecommerce
business) and a courier. The presence of businesses on both sides of this market reduces the risk of hugely capital intensive game of subsidies of the ride hailing industry, so if you already own a market barriers to entry will likely be high.
They started in Russia in 2012, made this market profit-able and has invested profits to become the market leader also in India and Turkey and have launched in 13 markets so far including Mexico, Indonesia and South Korea. One million couriers are registered on Dostavista globally. Unit economics are good, cohorts are good, diverse clients base, courier acquisition is virtually organic. Also, the mar-ket is huge! USD 400 bln globally and USD 30 bln in the markets where Dostavista is currently active.
Importantly, at the heart of this business model is a very sophisticated algorithm which can plan the route of a courier in real time so as to maximize the number of deliveries per hour. This tech is more complicated than the routing systems for ride hailing. Longer term deliveries will arguably become a commodity and it is the player with the largest networks and the most sophisticated tech product who will win. Dostavista has developed and improved their algorithm over the past 6 years. Their tech and knowledge are arguably their top competitive advantage.
The founder, Mike Alexandrovskiy is a serial entrepre-neur whose previous activity (pre 2012) was focused on building one of Russia’s top five largest ad agencies. He was joined in 2014 by Dimitry Zubkov who has 17 years of experience from IT-consulting and ecommerce. Their Head of Growth is Aleks Shamis with whom we have interacted before when he was fund raising for his previous venture Printio.ru (on demand print business).
JamesEditionWe have invested EUR 3 mln in return for a 28% stake in JamesEdition.
JamesEdition is an online classifieds platform for high ticket luxury goods, predominately real estate and cars. The logic on the high end real estate vertical is especially clear given that both buyers and sellers for real estate in e.g. Southern France, Spain, Miami etc. are not exclusive for the population in those countries but are to be found at
: : 3 : :

a truly international level. The space is highly fragmented today and lacking a solution that can aggregate listings, reach buyers and bring trust to transactions on a truly global scale.
JamesEdition is all trusted partners as well. It is owned by Piton and Marco and run by Eric Finnås whom we know well from when he ran the general segment at Avito.
Grace HealthWe have invested USD 1 mln in return for 14.3%.
Grace Health is pioneering the health sector by building the first ever digital women’s health clinic designed for the next billion users. The ambition is to become a Maven Clinic but specially designed for emerging markets, allow-ing women all over the world to get access to care, services and products within women’s health in a scalable way. The market is of course enormous and my sense is that the timing is right. The spread of cheap smartphones and cheap data packages in emerging markets has been very strong during the past years, providing large populations sets with internet access for the first time. Companies like South Africa-based JUMO, part of Vostok Emerging Finance’s portfolio, have also proven that it is possible to run businesses with a high volume of small transactions.
Grace Health’s initial offering is focused on sexual and reproductive health and is initially released in Ghana. Grace Health builds on Natural Language Processing and Machine Learning making the service widely scalable. The two founding entrepreneurs are strong with relevant back-grounds. Estelle Westling is a proven business builder in emerging markets, having founded and managed tonaton.com, Saltside Technologies (Kinnevik’s online classifieds platform) in Ghana. Therese Mannheimer has over 10 years of experience within product and service design from positions such as a Head of RD at Lifesum (market leading health app in Europe) and partner and strategist at the global design firm Doberman.
Per BriliothManaging Director
: : 4 : :
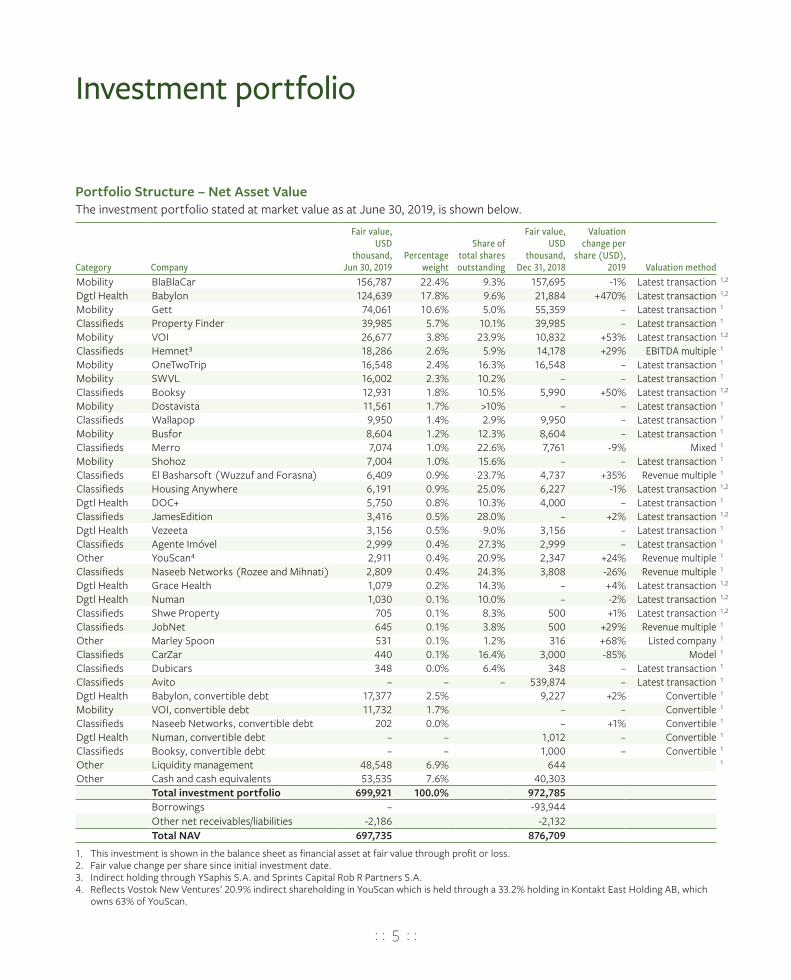
Portfolio Structure – Net Asset ValueThe investment portfolio stated at market value as at June 30, 2019, is shown below.
Category Company
Fair value, USD
thousand,Jun 30, 2019
Percentage weight
Share of total shares outstanding
Fair value, USD
thousand,Dec 31, 2018
Valuation change per
share (USD), 2019 Valuation method
Mobility BlaBlaCar 156,787 22.4% 9.3% 157,695 -1% Latest transaction 1,2
Dgtl Health Babylon 124,639 17.8% 9.6% 21,884 +470% Latest transaction 1,2
Mobility Gett 74,061 10.6% 5.0% 55,359 – Latest transaction 1
Classifieds Property Finder 39,985 5.7% 10.1% 39,985 – Latest transaction 1
Mobility VOI 26,677 3.8% 23.9% 10,832 +53% Latest transaction 1,2
Classifieds Hemnet³ 18,286 2.6% 5.9% 14,178 +29% EBITDA multiple 1
Mobility OneTwoTrip 16,548 2.4% 16.3% 16,548 – Latest transaction 1
Mobility SWVL 16,002 2.3% 10.2% – – Latest transaction 1
Classifieds Booksy 12,931 1.8% 10.5% 5,990 +50% Latest transaction 1,2
Mobility Dostavista 11,561 1.7% >10% – – Latest transaction 1
Classifieds Wallapop 9,950 1.4% 2.9% 9,950 – Latest transaction 1
Mobility Busfor 8,604 1.2% 12.3% 8,604 – Latest transaction 1
Classifieds Merro 7,074 1.0% 22.6% 7,761 -9% Mixed 1
Mobility Shohoz 7,004 1.0% 15.6% – – Latest transaction 1
Classifieds El Basharsoft (Wuzzuf and Forasna) 6,409 0.9% 23.7% 4,737 +35% Revenue multiple 1
Classifieds Housing Anywhere 6,191 0.9% 25.0% 6,227 -1% Latest transaction 1,2
Dgtl Health DOC+ 5,750 0.8% 10.3% 4,000 – Latest transaction 1
Classifieds JamesEdition 3,416 0.5% 28.0% – +2% Latest transaction 1,2
Dgtl Health Vezeeta 3,156 0.5% 9.0% 3,156 – Latest transaction 1
Classifieds Agente Imóvel 2,999 0.4% 27.3% 2,999 – Latest transaction 1
Other YouScan⁴ 2,911 0.4% 20.9% 2,347 +24% Revenue multiple 1
Classifieds Naseeb Networks (Rozee and Mihnati) 2,809 0.4% 24.3% 3,808 -26% Revenue multiple 1
Dgtl Health Grace Health 1,079 0.2% 14.3% – +4% Latest transaction 1,2
Dgtl Health Numan 1,030 0.1% 10.0% – -2% Latest transaction 1,2
Classifieds Shwe Property 705 0.1% 8.3% 500 +1% Latest transaction 1,2
Classifieds JobNet 645 0.1% 3.8% 500 +29% Revenue multiple 1
Other Marley Spoon 531 0.1% 1.2% 316 +68% Listed company 1
Classifieds CarZar 440 0.1% 16.4% 3,000 -85% Model 1
Classifieds Dubicars 348 0.0% 6.4% 348 – Latest transaction 1
Classifieds Avito – – – 539,874 – Latest transaction 1
Dgtl Health Babylon, convertible debt 17,377 2.5% 9,227 +2% Convertible 1
Mobility VOI, convertible debt 11,732 1.7% – – Convertible 1
Classifieds Naseeb Networks, convertible debt 202 0.0% – +1% Convertible 1
Dgtl Health Numan, convertible debt – – 1,012 – Convertible 1
Classifieds Booksy, convertible debt – – 1,000 – Convertible 1
Other Liquidity management 48,548 6.9% 644 1
Other Cash and cash equivalents 53,535 7.6% 40,303Total investment portfolio 699,921 100.0% 972,785Borrowings – -93,944Other net receivables/liabilities -2,186 -2,132Total NAV 697,735 876,709
1. This investment is shown in the balance sheet as financial asset at fair value through profit or loss. 2. Fair value change per share since initial investment date. 3. Indirect holding through YSaphis S.A. and Sprints Capital Rob R Partners S.A.4. Reflects Vostok New Ventures’ 20.9% indirect shareholding in YouScan which is held through a 33.2% holding in Kontakt East Holding AB, which
owns 63% of YouScan.
Investment portfolio
: : 5 : :

: : 6 : :
The Vostok New Ventures investment portfolio (June 30, 2019)
Cash 7.6%
Liquidity management 6.9%
YouScan 0.4%Marley Spoon 0.1%
Mobility 47.0%
Digital Health 21.9%
Classifieds 16.1%
Other 15.1%
BlaBlaCar 22.4%
Gett 10.6%
OneTwoTrip 2.4%
VOI 5.5%
Busfor 1.2%
SWVL 2.3%
Dostavista 1.7%
Shohoz 1.0%
Wallapop 1.4%Merro 1.0%
El Basharsoft 0.9%Housing Anywhere 0.9%
JamesEdition 0.5%Agente Imóvel 0.4%
Naseeb Networks 0.4%Shwe Property 0.1%
JobNet 0.1%CarZar 0.1%
Dubicars 0.0%
Property Finder 5.7%
Hemnet 2.6%
Booksy 1.8%
Babylon 20.3%DOC+ 0.8%
Vezeeta 0.5%Grace Health 0.2%
Numan 0.1%

Financial information
Group – results for the six month period and net asset valueDuring the period, the result from financial assets at fair value through profit or loss amounted to USD 114.65 mln (2018: -0.28), mainly coming from revaluations of Babylon, VOI, Hemnet and Booksy. Dividend and coupon income was USD 2.22 mln related to Merro dividends (2018: 17.77 sourced by Avito dividends).
Net operating expenses (defined as operating expenses less other operating income) amounted to USD -22.78 mln (2018: -8.35). The increase in net operating expenses is mainly related to bonus to CEO and other employees.
Net financial items were USD -8.19 mln (2018: 3.03), mainly related to SEK/USD depreciation and early redemp-tion of all outstanding bonds of series 2017/2020 and series 2018/2022.
Net result for the period was USD 85.90 mln (2018: 12.17).
Total shareholders’ equity amounted to USD 697.74 mln on June 30, 2019 (December 31, 2018: 876.71).
Liquid assetsThe liquid assets of the group amounted to USD 53.54 mln (December 31, 2018: 40.30).
Group – results for the second quarterDuring the second quarter, the result from financial assets at fair value through profit or loss amounted to USD 114.44 mln (2018: -17.76), mainly coming from revaluations of Babylon, Hemnet and Booksy. Dividend and coupon income was USD 0.00 mln (2018: 7.53 sourced by Avito dividends).
Net operating expenses (defined as operating expenses less other operating income) amounted to USD -1.95 mln (2018: -5.88). Higher level of net operating expenses 2018 compared to 2019 is mainly related to the Group’s VAT claim from the Swedish Tax Agency expensed during 2018 (For more details see note 4).
Net financial items were USD -0.15 mln (2018: 2.03).Net result for the period was USD 112.48 mln (2018:
-14.07).
Other eventsVostok New Ventures hosted a Capital Market Day (CMD) in London, June 13, 2019. The event was live streamed and is available at www.vostoknewventures.com. During the CMD 2019, Gett, BlaBlaCar, Babylon and VOI presented.
: : 7 : :

Portfolio events
Investment activities during the six month periodDuring the six month period 2019, gross investments in financial assets were USD 91.83 mln (2018: 39.76) and proceeds from sales were USD 539.87 mln (2018: 1.09). Investments concern cash investment mainly in Babylon, Gett, VOI, SWVL, Booksy, Dostavista, Shohoz, DOC+, JamesEdition, Naseeb Networks, Grace Health and Shwe Property, and proceeds concern exit of Avito.
Investment activities during the second quarterDuring the second quarter 2019, gross investments in finan-cial assets were USD 72.18 mln (2018: 21.43) and proceeds from sales were USD 0.00 mln (2018: 1.09). Investments concern cash investment mainly in Babylon, Gett, VOI, SWVL, Booksy, Dostavista, DOC+, JamesEdition, Naseeb Networks and Grace Health.
New investmentsSWVLDuring the second quarter 2019, Vostok New Ventures invested USD 16.0 mln in SWVL, a premium alternative to city transportation that connects commuters to a bus line through an app in populous cities in a number of emerging markets. SWVL offers a premium on demand bus service with third party supply and started in Cairo, Egypt. The company is run by the founder Mostafa Kandil who previ-ously has worked at Rocket Internet and later Careem.
DostavistaDuring the second quarter 2019, Vostok New Ventures invested USD 11.6 mln in Dostavista, a Moscow-based last mile logistics operator for e-commerce. The company is present in 11 countries and has over 1 million registered couriers and offers delivery services within 90 minutes or precisely on time. Dostavista was founded by Mike Alexandrovskiy in 2012.
JamesEditionDuring the second quarter 2019, Vostok New Ventures invested USD 3.3 mln (EUR 3.0 mln) in JamesEdition. The company was founded in 2008 and features the largest collection of luxury goods worldwide. The platform has over 100,000 exquisite items ranging from rare supercars to celebrity-owned luxury real estate. An affluent audience of 25,000 per day is browsing for cars, real estate, watches, helicopters and jets for sale.
With more than 10 million monthly page views from around the world, JamesEdition.com is the unique mar-ketplace for High and Super-High Net-Worth Individuals (HNWI’s and SHNI’s). With products as well as users evenly spread throughout the Americas, EMEA and Asia, JamesEdition.com is the leading global site to market luxury.
Grace HealthDuring the second quarter 2019, Vostok New Ventures invested USD 1.0 mln (SEK 10.0 mln) in Grace Health. Grace Health is a Stockholm-based femtech company focusing on developing scalable and user-friendly health services to women in emerging markets.
Combining business potential with smart products and services the company aims to give millions of women the feeling of being what they are, normal. The company’s first product, Grace Health Period Tracker is a medical device that meets the high standards set by the Swedish Medical Products Agency.
For further information about the portfolio companies please see Vostok New Ventures’ Annual Report 2018 Vostok New Ventures’ website
: : 8 : :
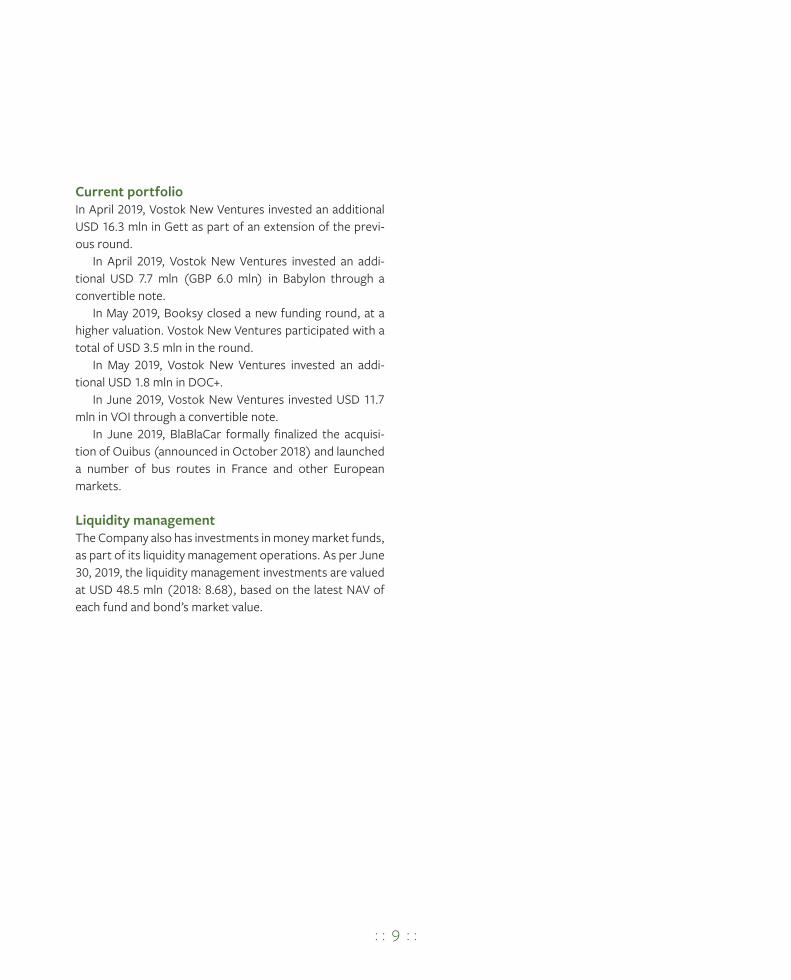
Current portfolioIn April 2019, Vostok New Ventures invested an additional USD 16.3 mln in Gett as part of an extension of the previ-ous round.
In April 2019, Vostok New Ventures invested an addi-tional USD 7.7 mln (GBP 6.0 mln) in Babylon through a convertible note.
In May 2019, Booksy closed a new funding round, at a higher valuation. Vostok New Ventures participated with a total of USD 3.5 mln in the round.
In May 2019, Vostok New Ventures invested an addi-tional USD 1.8 mln in DOC+.
In June 2019, Vostok New Ventures invested USD 11.7 mln in VOI through a convertible note.
In June 2019, BlaBlaCar formally finalized the acquisi-tion of Ouibus (announced in October 2018) and launched a number of bus routes in France and other European markets.
Liquidity managementThe Company also has investments in money market funds, as part of its liquidity management operations. As per June 30, 2019, the liquidity management investments are valued at USD 48.5 mln (2018: 8.68), based on the latest NAV of each fund and bond’s market value.
: : 9 : :

Income statements – Group
(Expressed in USD thousands) Jan 1, 2019–Jun 30, 2019
Jan 1, 2018–Jun 30, 2018
Apr 1, 2019–Jun 30, 2019
Apr 1, 2018–Jun 30, 2018
Result from financial assets at fair value through profit or loss¹ 114,647 -275 114,443 -17,758Dividend and coupon income 2,221 17,765 – 7,529Other operating income 150 126 73 91Operating expenses -22,926 -8,475 -2,024 -5,968Operating result 94,092 9,141 112,492 -16,106
Financial income and expensesInterest income 74 1,924 52 1,475Interest expense -4,021 -3,011 -35 -1,904Currency exchange gains/losses, net -4,244 4,116 -32 2,462Net financial items -8,191 3,029 -15 2,033
Result before tax 85,901 12,170 112,477 -14,072
Taxation – – – –Net result for the financial period 85,901 12,170 112,477 -14,072
Earnings per share (in USD) 1.08 0.14 1.44 -0.17Diluted earnings per share (in USD) 1.08 0.14 1.44 -0.17
1. Financial assets at fair value through profit or loss (including listed bonds) are carried at fair value. Gains or losses arising from changes in the fair value of the ‘financial assets at fair value through profit or loss’ category are presented in the income statement within ‘Result from financial assets at fair value through profit or loss’ in the period in which they arise.
Statement of comprehensive income(Expressed in USD thousands) Jan 1, 2019–
Jun 30, 2019Jan 1, 2018–Jun 30, 2018
Apr 1, 2019–Jun 30, 2019
Apr 1, 2018–Jun 30, 2018
Net result for the financial period 85,901 12,170 112,477 -14,072
Other comprehensive income for the periodItems that may be classified subsequently to profit or loss:Currency translation differences -37 -282 4 -228Total other comprehensive income for the period -37 -282 4 -228
Total comprehensive income for the period 85,864 11,888 112,481 -14,300
Total comprehensive income for the periods above is entirely attributable to the equity holders of the parent company.
: : 10 : :

Balance sheet – Group
(Expressed in USD thousands) Jun 30, 2019 Dec 31, 2018
NON-CURRENT ASSETSTangible non-current assetsProperty, plant and equipment 1,257 203Total tangible non-current assets 1,257 203
Financial non-current assetsFinancial assets at fair value through profit or loss 646,386 932,482Total financial non-current assets 646,386 932,482
CURRENT ASSETSCash and cash equivalents 53,535 40,303Tax receivables 567 556Other current receivables 234 399Total current assets 54,336 41,259
TOTAL ASSETS 701,979 973,943
SHAREHOLDERS’ EQUITY (including net result for the financial period) 697,735 876,709
NON-CURRENT LIABILITIESInterest bearing liabilitiesLong-term debts and financial leases 805 93,944Total non-current liabilities 805 93,944
CURRENT LIABILITIESNon-interest bearing current liabilitiesTax payables 397 402Other current liabilities 1,777 1,161Accrued expenses 1,265 1,727Total current liabilities 3,439 3,290
TOTAL SHAREHOLDERS’ EQUITY AND LIABILITIES 701,979 973,943
: : 11 : :

Statement of Changes in Equity – Group
(Expressed in USD thousands) Note Share capital
Additional paid in capital
Other reserves
Retained earnings
Total
Balance at January 1, 2018 27,066 119,073 -8 733,858 879,990Net result for the period January 1, 2018 to June 30, 2018 – – – 12,170 12,170Other comprehensive income for the periodCurrency translation differences – – -282 – -282Total comprehensive income for the period January 1, 2018 to June 30, 2018 – – -282 12,170 11,888Transactions with owners:
Value of employee services:- Share-based long-term incentive program – 805 – – 805Buy-back of own shares -6 -171 – – -178Total transactions with owners -6 634 – – 628Balance at June 30, 2018 27,060 119,707 -290 746,028 892,505
Balance at January 1, 2019 27,060 120,829 -173 728,994 876,709Net result for the period January 1, 2019 to June 30, 2019 – – – 85,901 85,901Other comprehensive income for the periodCurrency translation differences – – -37 – -37Total comprehensive income for the period January 1, 2019 to June 30, 2019 – – -37 85,901 85,864Transactions with owners:Redemption program -6,479 – – -208,831 -215,310Value of employee services:- Share-based remuneration 124 3,076 – – 3,200- Share-based long-term incentive program 76 688 – – 764Buy-back of own shares 7 -2,042 -51,450 – – -53,491Total transactions with owners -8,321 -47,686 – -208,831 -264,838Balance at June 30, 2019 18,739 73,143 -210 606,064 697,735
: : 12 : :
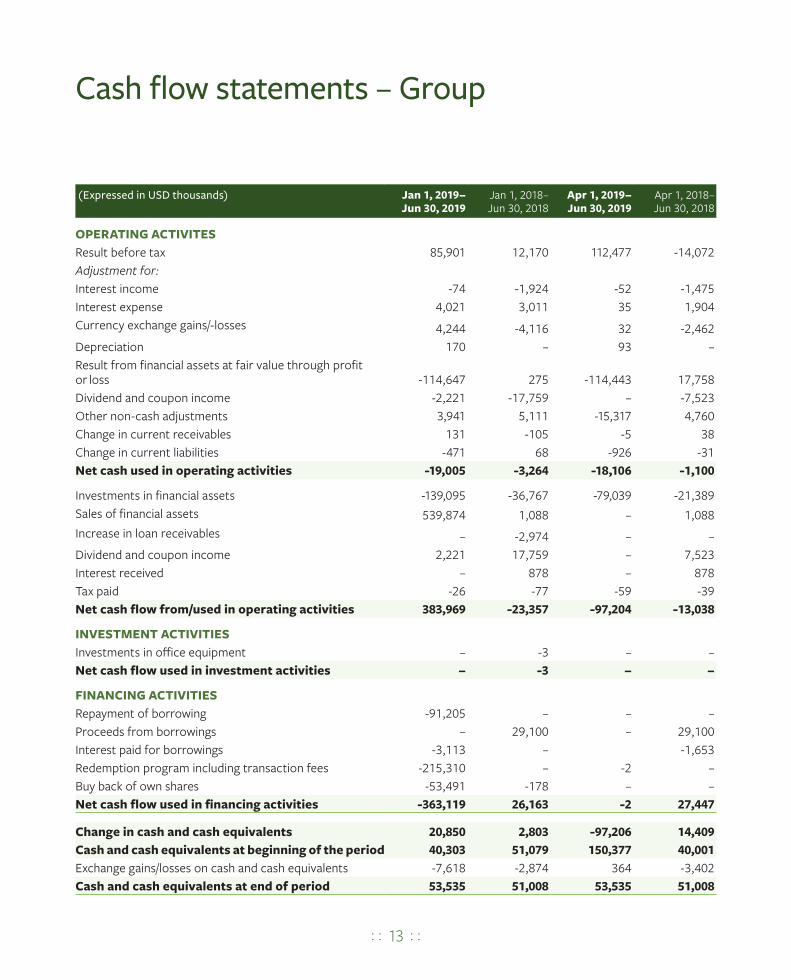
Cash flow statements – Group
(Expressed in USD thousands) Jan 1, 2019–Jun 30, 2019
Jan 1, 2018–Jun 30, 2018
Apr 1, 2019–Jun 30, 2019
Apr 1, 2018–Jun 30, 2018
OPERATING ACTIVITESResult before tax 85,901 12,170 112,477 -14,072Adjustment for:Interest income -74 -1,924 -52 -1,475Interest expense 4,021 3,011 35 1,904Currency exchange gains/-losses 4,244 -4,116 32 -2,462Depreciation 170 – 93 –Result from financial assets at fair value through profit or loss -114,647 275 -114,443 17,758Dividend and coupon income -2,221 -17,759 – -7,523Other non-cash adjustments 3,941 5,111 -15,317 4,760Change in current receivables 131 -105 -5 38Change in current liabilities -471 68 -926 -31Net cash used in operating activities -19,005 -3,264 -18,106 -1,100
Investments in financial assets -139,095 -36,767 -79,039 -21,389Sales of financial assets 539,874 1,088 – 1,088Increase in loan receivables – -2,974 – –Dividend and coupon income 2,221 17,759 – 7,523Interest received – 878 – 878Tax paid -26 -77 -59 -39Net cash flow from/used in operating activities 383,969 -23,357 -97,204 -13,038
INVESTMENT ACTIVITIESInvestments in office equipment – -3 – –Net cash flow used in investment activities – -3 – –
FINANCING ACTIVITIESRepayment of borrowing -91,205 – – –Proceeds from borrowings – 29,100 – 29,100Interest paid for borrowings -3,113 – -1,653Redemption program including transaction fees -215,310 – -2 –Buy back of own shares -53,491 -178 – –Net cash flow used in financing activities -363,119 26,163 -2 27,447
Change in cash and cash equivalents 20,850 2,803 -97,206 14,409Cash and cash equivalents at beginning of the period 40,303 51,079 150,377 40,001Exchange gains/losses on cash and cash equivalents -7,618 -2,874 364 -3,402Cash and cash equivalents at end of period 53,535 51,008 53,535 51,008
: : 13 : :

Alternative Performance Measures – Group
6m 2019 6m 2018
Return on capital employed, %¹ 9.81 0.95Equity ratio, %² 99.40 90.06
Shareholders’ equity/share, USD³ 8.94 10.55Earnings/share, USD⁴ 1.08 0.14Diluted earnings/share, USD⁵ 1.08 0.14Net asset value/share, USD⁶ 8.94 10.55Net asset value/share adjusted for redemption program, USD⁷ 12.23 10.55Weighted average number of shares for the financial period⁸ 79,434,729 84,567,939Weighted average number of shares for the financial period (fully diluted)⁸ 79,682,609 84,760,498Number of shares at balance sheet date⁸,⁹ 78,080,206 84,562,357
1. Return on capital employed is defined as the Group’s result for the period plus interest expenses plus/less exchange differences on financial loans divided by the average capital employed (the average total assets less non-interest bearing liabilities over the period). Return on capital employed is not annualised.
2. Equity ratio is defined as shareholders’ equity in relation to total assets.3. Shareholders’ equity/share is defined as shareholders’ equity divided by total number of shares.4. Earnings/share is defined as result for the period divided by average weighted number of shares for the period.5. Diluted earnings/share is defined as result for the period divided by average weighted number of shares for the period calculated on a fully diluted basis.6. Net asset value/share is defined as shareholders’ equity divided by total number of shares.7. Net asset value/share adjusted for redemption program is defined as equity increased by an amount corresponding to the redemption amount
increased by the development in equity since the redemption date, divided by total number of shares.8. Refers only to ordinary shares and excludes redemption shares.9. Number of shares at balance sheet date as per June 30, 2019, excludes 7,608,103 repurchased SDRs.
As of July 3, 2016, new guidelines on APMs (Alternative Performance Measures) are issued by ESMA (the European Securities and Markets Authority). APMs are financial mea-sures other than financial measures defined or specified by International Financial Reporting Standards (IFRS).
Vostok New Ventures regularly uses alternative perfor-mance measures to enhance comparability from period to period and to give deeper information and provide mean-ingful supplemental information to analysts, investors and other parties.
It is important to know that not all companies calculate alternative performance measures identically, therefore these measurements have limitations and should not be used as a substitute for measures of performance in accor-dance with IFRS.
Below you find our presentation of the APMs and how we calculate these measures.
: : 14 : :

Income statement – Parent
(Expressed in USD thousands) Jan 1, 2019–Jun 30, 2019
Jan 1, 2018–Jun 30, 2018
Apr 1, 2019–Jun 30, 2019
Apr 1, 2018–Jun 30, 2018
Result from financial assets at fair value through profit or loss 599 -989 525 -1,047Dividend income 100,000 6 – 6Operating expenses -22,701 -4,195 -2,038 -1,615Operating result 77,898 -5,178 -1,513 -2,655
Financial income and expensesInterest income 1,396 8,324 1,390 4,763Interest expense -3,985 -3,010 -18 -1,904Currency exchange gains/losses, net -4,074 4,190 159 2,541Net financial items -6,663 9,504 1,531 5,400
Net result for the financial period 71,235 4,326 18 2,745
Statement of comprehensive income(Expressed in USD thousands) Jan 1, 2019–
Jun 30, 2019Jan 1, 2018–Jun 30, 2018
Apr 1, 2019–Jun 30, 2019
Apr 1, 2018–Jun 30, 2018
Net result for the financial period 71,235 4,326 18 2,745
Other comprehensive income for the periodItems that may be classified subsequently to profit or loss:Currency translation differences – – – –Total other comprehensive income for the period – – – –
Total comprehensive income for the period 71,235 4,326 18 2,745
: : 15 : :

Balance sheet – Parent
(Expressed in USD thousands) Jun 30, 2019 Dec 31, 2018
NON-CURRENT ASSETSFinancial non-current assetsShares in subsidiaries 185 84,389
Financial assets at fair value through profit or loss 48,548 644Receivables from Group companies 3,006 256,965Total financial non-current assets 51,739 341,998
CURRENT ASSETSCash and cash equivalents 38,424 35,505Other current receivables 60 138Total current assets 38,484 35,644
TOTAL ASSETS 90,223 377,642
SHAREHOLDERS’ EQUITY (including net result for the financial period) 87,804 281,406
NON-CURRENT LIABILITIESInterest bearing liabilitiesLong-term debts – 93,944Total non-current liabilities – 93,944
CURRENT LIABILITIESNon-interest bearing current liabilitiesLiabilities to Group companies 1,407 719Other current liabilities 53 81Accrued expenses 959 1,490Total current liabilities 2,419 2,292
TOTAL SHAREHOLDERS’ EQUITY AND LIABILITIES 90,223 377,642
: : 16 : :

Statement of Changes in Equity – Parent
(Expressed in USD thousands) Note Share capital
Additional paid in capital
Retained earnings
Total
Balance at January 1, 2018 27,066 119,073 126,988 273,128Net result for the period January 1, 2018 to June 30, 2018 – – 4,326 4,326Other comprehensive income for the periodCurrency translation differences – – – –Total comprehensive income for the period January 1, 2018 to June 30, 2018 – – 4,326 4,326Transactions with owners:Value of employee services:- Share-based long-term incentive program – 805 – 805Buy-back of own shares -6 -171 – -178Total transactions with owners -6 634 – 628Balance at June 30, 2018 27,060 119,707 131,315 278,082
Balance at January 1, 2019 27,060 120,829 133,518 281,406Net result for the period January 1, 2019 to June 30, 2019 – – 71,235 71,235Other comprehensive income for the periodCurrency translation differences – – – –Total comprehensive income for the period January 1, 2019 to June 30, 2019 – – 71,235 71,235Transactions with owners:Redemption program -6,479 – -208,831 -215,310Value of employee services:- Share-based remuneration 124 3,076 – 3,200- Share-based long-term incentive program 76 688 – 764Buy-back of own shares 7 -2,042 -51,450 – -53,491Total transactions with owners -8,321 -47,686 -208,831 -264,838Balance at June 30, 2019 18,739 73,143 -4,078 87,804
: : 17 : :

Notes to the financial statements(Expressed in USD thousand unless indicated otherwise)
Note 1 Accounting principlesThis consolidated interim report is prepared in accordance with IAS 34 Interim Financial Reporting. Except where stated below, the accounting policies that have been applied for the Group and Parent Company, are in agreement with the accounting policies used in preparation of the Company’s 2018 annual report. The Company’s 2018 annual report is available at the Company’s website: www.vostoknewventures.com/investor-relations/financial-reports/
IFRS 16, Leases, is effective from January 1, 2019. IFRS 16 affects pri-marily the accounting by leases and the recognition of almost all leases on balance sheet. Vostok New Ventures applies the simplified transition approach. Comparative information are therefore not restated. The Company’s leasing commitments consist only of lease agreements for premises, therefore the new standard has not a significant impact on the Company’s financial reports. The effect on tangible assets is USD 1.1 mln, long-term debts USD 0.8 mln and current liabilities USD 0.3 mln.
Note 2 Related-party transactionsDuring the period, the Group has recognized the following related party transactions:
Operating expenses Current liabilities6m 2019 6m 2018 6m 2019 6m 2018
Key management and Board of Directors1 -16,915 -3,206 -88 -64
1. Compensation paid or payable includes salary and bonus to the management and remuneration to the Board members.
The Company has entered into a consultancy agreement with Keith Richman, Director of Vostok New Ventures, for consultancy services above and beyond his duties as Director in the Company in relation to current or prospective investments. The gross annual cost of this con-tract is USD 0.1 mln.
The Board of Directors of Vostok New Ventures Ltd has resolved to award Per Brilioth, Managing Director of Vostok New Ventures, an extraordinary bonus in the gross amount of USD 15 mln following the successful exit of Avito during January 2019.
The costs for the long-term incentive programs (LTIP 2016, LTIP 2017 and LTIP 2018) for the management amounted to USD 0.76 mln, exclud-ing social taxes during the six-month period 2019. See details of the LTIP 2016, LTIP 2017 and LTIP 2018 in Note 6.
Note 3 Fair value estimationThe numbers below are based on the same accounting and valuation policies as used in the Company’s most recent Annual Report. For more information regarding financial instruments in level 2 and 3 see note 3 in the Company’s Annual Report 2018. The fair value of financial instru-ments is measured by level of the following fair value measurement hierarchy: – Quoted prices (unadjusted) in active markets for identical assets or
liabilities (level 1).– Inputs other than quoted prices included within level 1 that are observ-
able for the asset or liability, either directly (that is, as prices) or indi-rectly (that is, derived from prices) (level 2).
– Inputs for the asset or liability that are not based on observable market data (that is, unobservable inputs) (level 3).
The following table presents the group’s assets that are measured at fair value at June 30, 2019.
Level 1 Level 2 Level 3 Total balance
Financial assets at fair value through profit or loss 49,079 421,145 176,162 646,386Total assets 49,079 421,145 176,162 646,386
The following table presents the group’s assets that are measured at fair value at December 31, 2018.
Level 1 Level 2 Level 3 Total balance
Financial assets at fair value through profit or loss 960 707,899 223,623 932,482Total assets 960 707,899 223,623 932,482
The following table presents the group’s changes of financial assets in level 3.
Level 3
Opening balance January 1, 2019 223,623Transfers from level 3 -157,695Transfers to level 3 5,254Change in fair value and other 104,980Closing balance June 30, 2019 176,162
During the second quarter 2019, BlaBlaCar has been transferred from level 3 to level 2 and El Basharsoft and JobNet have been transferred from level 2 to level 3. The investments in BlaBlaCar, Gett, Property Finder, VOI, OneTwoTrip, SWVL, Booksy, Dostavista, Busfor, Shohoz, Housing Anywhere, DOC+, JamesEdition, Vezeeta, Grace Health, Numan, Shwe Property and Dubicars are classified as level 2 as the valuations are based on the price paid in each respective transaction.
Babylon, Hemnet, Wallapop, Merro, El Basharsoft, Agente Imóvel, YouScan, Naseeb Networks, JobNet and CarZar are classified as level 3 investments. The level 3 investments are either based on valuation models, usually using EBITDA and revenue multiples of comparable list-ed peers or transactions that include more uncertainty given the time elapsed since it closed or structure of the transactions.
: : 18 : :

The fair value of financial instruments traded in active markets is based on quoted market prices at the balance sheet date. A market is regarded as active if quoted prices are readily and regularly available from an exchange, dealer, broker, industry group, pricing service, or reg-ulatory agency, and those prices represent actual and regularly occur-ring market transactions on an arm’s length basis. The quoted market price used for financial assets held by the Group is the current bid price. These instruments are included in level 1.
The fair value of financial instruments that are not traded in an active market is determined by using valuation techniques. These valuation tech-niques maximize the use of observable market data where it is available and rely as little as possible on entity specific estimates. If all significant inputs required to fair value an instrument are observable, the instrument is included in level 2. If one or more of the significant inputs is not based on observable market data, the instrument is included in level 3.
Investments in assets that are not traded on any market will be held at fair value determined by recent transactions made at prevailing mar-ket conditions or different valuation models depending on the charac-teristics of the company as well as the nature and risks of the invest-ment. These different techniques may include discounted cash flow valuation (DCF), exit-multiple valuation also referred to as Leveraged Buyout (LBO) valuation, asset-based valuation as well as forward-look-ing multiples valuation based on comparable traded companies. Usually, transaction-based valuations are kept unchanged for a period of 12 months unless there is cause for a significant change in valuation. After 12 months, the Group usually derives fair value for non-traded assets through any of the models described above.
The validity of valuations based on a transaction is inevitably eroded over time, since the price at which the investment was made reflects the conditions that existed on the transaction date. At each reporting date, possible changes or events subsequent to the relevant transaction are assessed and if this assessment implies a change in the investment’s fair value, the valuation is adjusted accordingly. No significant events in the portfolio companies, which have had an impact on the valuations, has occurred since the latest transactions except as described below. The transaction-based valuations are also frequently assessed using multi-ples of comparable traded companies for each unlisted investment or other valuation models when warranted.
Vostok New Ventures follows a structured process in assessing the valuation of its unlisted investments. Vostok New Ventures evaluate company specific and external data relating to each specific investment on a monthly basis. The data is then assessed at monthly and quarterly valuation meetings by senior management. If internal or external fac-tors are deemed to be significant further assessment is undertaken and the specific investment is revalued to the best fair value estimate. Revaluations are approved by the Board of Directors in connection with the Company’s financial reports.
BlaBlaCarAs per June 30, 2019, the BlaBlaCar investment is classified as a level 2 investment, valued on a transaction in BlaBlaCar where SNCF and other existing BlaBlaCar investors participated. Vostok New Ventures has invested EUR 110 mln in the company. The transaction was announced in October 2018 and formally closed in June 2019. The transaction values Vostok’s 9.3% ownership to USD 156.8 mln as per June 30, 2019.
BabylonAs per June 30, 2019, Babylon is classified as a level 3 investment as it is valued to USD 124.6 mln based on the funding round, concluded on August 2, 2019. The valuation is approximately 470% higher than the val-uation as per December 31, 2018.
Sensitivity in Babylon valuationas per June 30, 2019
-15% -10%Babylon
valuation +10% +15%Valuation of Vostok New Ventures’ Babylon investment, USD mln 105.9 112.2 124.6 137.1 143.3
GettAs per June 30, 2019, the Gett investment is classified as a level 2 invest-ment as it is valued on the basis of a transaction that closed in 1Q 2019 where Vostok New Ventures participated. The company valuation in the transaction is in line with the last model-based valuation of the company as per December 31, 2018.
Property FinderAs per June 30, 2019, the Property Finder investment is classified as a level 2 investment as it is valued at USD 40.0 mln on the basis of the latest transaction in the company that closed in December 2018. Vostok invested USD 3.9 mln in that round which was led by General Atlantic.
VOIAs per June 30, 2019, VOI is classified as a level 2 investment as it is val-ued on the basis of the latest transaction in the company, which closed in the first quarter of 2019. Vostok New Ventures has invested a total of USD 12.8 mln in the company as per June 2019, which is valued at USD 26.7 mln as per June 30, 2019.
Hemnet (through YSaphis S.A. and Sprints Capital Rob R Partners S.A.)As per June 30, 2019, Hemnet is classified as a level 3 investment as it is valued to USD 18.3 mln on the basis of an EV/EBITDA valuation model as the latest significant transaction now is more than 12 months old. The company has been performing well since Vostok’s investment in December 2016. As per June 30, 2019, the model is deemed the best fair value estimate of the company. The median multiple of the peer group is 21.4x and consists of a number of listed real estate verticals includ-ing, but not limited to, Scout24, Rightmove and REA Group. The mod-el-based valuation is approximately 29% higher than the valuation as per December 31, 2018, primarily driven by higher peer multiples.
Sensitivity in model-based Hemnet valuationas per June 30, 2019
-15% -10%EV/EBITDA
multiple +10% +15%Valuation of Vostok New Ventures’ Hemnet investment, USD mln 15.5 16.5 18.3 20.1 21.0
OneTwoTripAs per June 30, 2019, OneTwoTrip is classified as a level 2 investment as it is valued at USD 16.5 mln on the basis of the latest transaction in the company that closed in the third quarter 2018. Vostok New Ventures owns 16.3% of the company on a fully diluted basis as per June 30, 2019.
SWVLAs per June 30, 2019, SWVL is classified as a level 2 investment as it is valued at USD 16.0 mln on the basis of a recent transaction in the com-pany that closed in the second quarter 2019. Vostok New Ventures owns 10.2% of the company on a fully diluted basis as per June 30, 2019.
: : 19 : :

BooksyAs per June 30, 2019, Booksy is classified as a level 2 investment as it is valued on the basis of the latest transaction in the company, which closed in the second quarter of 2019. Vostok New Ventures invested a total of USD 9.5 mln in the company. Vostok New Ventures owns 10.5% of the company on a fully diluted basis as per June 30, 2019.
DostavistaAs per June 30, 2019, Dostavista is classified as a level 2 investment as it is valued on the basis of the latest transaction in the company, which closed in the second quarter of 2019. Vostok New Ventures invested a total of USD 11.6 mln in the company.
WallapopAs per June 30, 2019, Wallapop is classified as a level 3 investment. Vostok New Ventures’ indirect stake in the company is valued at USD 10.0 mln. As per June 30, 2019, the latest transaction – which was con-cluded in August 2018 is deemed to generate the best fair value estimate for the company as the company is performing in line with plan and no significant internal or external factors have been deemed to warrant a revaluation of the company since the transactions.
Sensitivity in Wallapop valuationas per June 30, 2018
-15% -10%Wallapop valuation +10% +15%
Valuation of Vostok New Ventures’ Wallapop investment, USD mln 8.5 9.0 10.0 11.0 11.5
BusforVostok New Ventures invested a total of USD 8.5 mln in Busfor during 2018. As per June 30, 2019, Busfor is classified as a level 2 investment based on latest transaction in December 2018, valued at USD 8.6 mln as per June 30, 2019.
MerroAs per June 30, 2019, Merro is classified as a level 3 investment and is valued on the basis of a Sum of the Parts valuation model. As per June 30, 2019, Vostok New Ventures stake in the company is valued to USD 7.1 mln, which is 9% lower than the valuation as per December 31, 2018. The main drivers of the revaluation are a USD 2.2 mln dividend distribu-tion following Merro’s sale of Property Finder and a revised valuation of Opensooq, which is attributable to the majority of the fair value of Merro. As per June 30, 2019, Opensooq accounts for 71.7% of the fair value estimate of Merro.
Sensitivity in Sum of the parts-based Merro valuation as per June 30, 2019
-15% -10%Merro
valuation +10% +15%Valuation of Vostok New Ventures’ Merro investment, USD mln 6.0 6.4 7.1 7.8 8.1
Sensitivity in Sum of the parts-based Merro valuation as per June 30, 2019
-15% -10%Opensooq
valuation +10% +15%Valuation of Vostok New Ventures’ Merro investment, USD mln 6.3 6.5 7.1 7.6 7.9
ShohozDuring the first quarter 2019, Vostok New Ventures invested USD 7 mln in Shohoz. As per June 30, 2019, Shohoz is classified as a level 2 invest-ment based on latest transaction, valued at USD 7.0 mln as per June 30, 2019.
El Basharsoft As per June 30, 2019, El Basharsoft is classified as a level 3 investment as it is valued to USD 6.4 mln on the basis of an EV/Sales valuation model as the latest significant transaction now is more than 12 months old. The company has been performing well. As per June 30, 2019, the model is deemed the best fair value estimate of the company. The mod-el-based valuation is approximately 35% higher than the valuation as per December 31, 2018.
Sensitivity in El Basharsoft valuationas per June 30, 2019
-15% -10%EV/Sales multiple +10% +15%
Valuation of Vostok New Ventures’ El Basharsoft investment, USD mln 5.4 5.8 6.4 7.0 7.4
Housing AnywhereAs per June 30, 2019, Housing Anywhere is classified as a level 2 invest-ment as it is valued on the basis of the latest transaction in the compa-ny, which closed in the fourth quarter of 2018. Vostok New Ventures invested a total of USD 4.1 mln (EUR 3.3 mln) in the company in the first quarter 2018 and an additional EUR 1.6 mln in December 2018.
DOC+As per June 30, 2019, DOC+ is classified as a level 2 investment as it is val-ued on the basis of the latest transaction in the company, which closed in the second quarter of 2019. Vostok New Ventures invested a total of USD 5.7 mln in the company.
JamesEditionAs per June 30, 2019, JamesEdition is classified as a level 2 investment as it is valued on the basis of the latest transaction in the company, which closed in the second quarter of 2019. Vostok New Ventures invested a total of USD 3.3 mln (EUR 3.0 mln) in the company.
Vezeeta As per June 30, 2019, Vezeeta is classified as a level 2 investment as it is valued on the basis of the latest transaction in the company which closed during the third quarter 2018. Vostok New Ventures participated with USD 0.8 mln in the financing round. As per June 30, 2019, Vostok New Ventures values its investment in Vezeeta to USD 3.2 mln.
Agente ImóvelAs per June 30, 2019, Agente Imóvel is classified as a level 3 investment and is valued on the basis of the latest transaction in the company, which closed in the second quarter of 2018. Vostok New Ventures has invested a total of USD 2.0 mln in the company, which as per June 30, 2019 is valued at USD 3.0 mln based on the 2Q18 transaction.
Sensitivity in Agente Imóvel valuationas per June 30, 2019
-15% -10%
Agente Imóvel
valuation +10% +15%Valuation of Vostok New Ventures’ Agente Imóvel investment, USD mln 2.5 2.7 3.0 3.3 3.4
: : 20 : :

YouScanVostok New Ventures owns 20.9% of YouScan fully diluted (YouScan is held through a 33.2% holding in Kontakt East Holding AB, which owns 63% of YouScan). As per June 30, 2019, YouScan is valued based on a sales-multiple based valuation. This model-approach is deemed the best fair value estimate of YouScan as per June 30, 2019.
Sensitivity in model-based YouScan-valuationas per June 30, 2019
-15% -10%EV-Sales multiple +10% +15%
Valuation of Vostok New Ventures’ YouScan investment, USD million 2.5 2.6 2.9 3.2 3.3
Naseeb NetworksAs per June 30, 2019, Naseeb Networks is classified as a level 3 invest-ment as it is valued on the basis of a future looking EV/Sales peer mul-tiples valuation model. The model values Vostok’s stake in Naseeb Networks to USD 2.8 mln compared to USD 3.8 mln as per December 31, 2018.
The peer group includes four online classifieds/jobs portal peers including SEEK, Infoedge, and 51job. The average multiple of the peer group is 8.8x and the median multiple is 6.3x.
Sensitivity in model-based Naseeb valuationas per June 30, 2019
-15% -10%EV-Sales multiple +10% +15%
Valuation of Vostok New Ventures’ Naseeb investment, USD mln 2.4 2.5 2.8 3.1 3.2
Grace HealthDuring the second quarter 2019, Vostok New Ventures invested USD 1.0 mln (SEK 10.0 mln) in Grace Health. As per June 30, 2019, Grace Health is classified as a level 2 investment based on latest transaction, valued at USD 1.1 mln as per June 30, 2019.
NumanAs per June 30, 2019, Numan is classified as a level 2 investment based on a convertible investment in the company which closed in December 2018 and converted into equity during the first quarter 2019.
Shwe PropertyAs per June 30, 2019, Shwe Property is classified as a level 2 investment as it is valued on the basis of the latest transaction in the company, which closed in the first quarter of 2019. Vostok New Ventures initially invested a total of USD 0.5 mln in the company and another USD 0.2 mln in the first quarter of 2019.
JobNetAs per June 30, 2019, JobNet is classified as a level 3 investment as it is valued on the basis of a future looking EV/Sales peer multiples valuation model. The model values Vostok’s stake in JobNet to USD 0.6 mln com-pared to USD 0.5 mln as per December 31, 2018.
The peer group includes four online classifieds/jobs portal peers including SEEK, Infoedge, and 51job. The average multiple of the peer group is 8.8x and the median multiple is 6.3x.
Sensitivity in model-based JobNet valuationas per June 30, 2019
-15% -10%EV-Sales multiple +10% +15%
Valuation of Vostok New Ventures’ JobNet investment, USD mln 0.5 0.6 0.6 0.7 0.7
Marley Spoon (equity, Level 1)As per June 30, 2019, the equity in Marley Spoon is valued at USD 0.5 mln on the basis of the closing price on the last trading day of Marley Spoon in 2Q19. Marley Spoon equity is classified as a level 1 investment.
CarZarAs per June 30, 2019, CarZar is classified as a level 3 investment as it is valued on the basis of Vostok New Ventures’ assessment of the intrin-sic fair value of the company. Vostok New Ventures’ valuation as per June 30, 2019, is significantly lower compared with the valuation as per December 31, 2018, following continued unfavorable performance and overall market dynamics.
Sensitivity in CarZar valuationas per June 30, 2019
-15% -10%CarZar
valuation +10% +15%Valuation of Vostok New Ventures’ CarZar investment, USD mln 0.4 0.4 0.4 0.5 0.5
DubicarsAs per June 30, 2019, Dubicars is classified as a level 2 investment based on a transaction in the company which closed in the fourth quarter 2018.
Liquidity management (Level 1)As per June 30, 2019, Vostok New Ventures owns USD 48.5 mln in money market funds and bonds as part of the Company’s liquidity management operations. The funds and bonds are quoted on a daily basis and the fair value as per June 30, 2019, is the last published NAV as per end of June 2019.
Current liabilitiesThe book value for interest-bearing loans, accounts payable and other financial liabilities are deemed to correspond to the fair values.
: : 21 : :

Note 4 VAT claimVostok New Ventures AB has during 2019 paid an additional VAT for 2013–2018 of USD 4.6 mln, converted to SEK 40.3 mln, together with tax penalties of USD 0.3 mln, converted to SEK 2.6 mln, according to The Swedish Tax Agency’s claim and appealed the ruling to the Court of Appeal. The Court of Appeal issued a negative ruling on June 28, 2018 which the Company appealed to the Supreme Administrative Court during August, 2018. The Supreme Administrative Court did not give leave to appeal on the matter (ruling came 2019). VAT expenses are pro-vided in full in the Group’s financial statements, ie. from period 2013 to second quarter 2019.
Note 5 Long-term debtsAs per June 30, 2019, financial leases are recognized with a provision of future long-term lease payments amounting to USD 0.8 mln.
Change in financial assets at fair value through profit or loss
(Expressed in USD)Company
Opening balance Jan 1, 2019
Investments/ (disposals), net
FV change Closing balanceJun 30, 2019
Percentage weight
BlaBlaCar 157,695,271 – -908,669 156,786,602 24.3%Babylon 21,884,394 – 102,754,938 124,639,332 19.3%Gett 55,358,979 18,620,324 81,425 74,060,728 11.5%Property Finder 39,985,331 – – 39,985,331 6.2%VOI 10,831,921 10,076,628 5,768,701 26,677,250 4.1%Hemnet¹ 14,178,027 – 4,107,558 18,285,585 2.8%OneTwoTrip 16,548,231 – – 16,548,231 2.6%SWVL – 16,001,533 – 16,001,533 2.5%Booksy 5,989,711 3,499,650 3,441,767 12,931,128 2.0%Dostavista – 11,561,199 – 11,561,199 1.8%Wallapop 9,950,485 – – 9,950,485 1.5%Busfor 8,604,151 – – 8,604,151 1.3%Merro 7,761,119 – -686,728 7,074,391 1.1%Shohoz – 7,003,759 – 7,003,759 1.1%El Basharsoft (Wuzzuf and Forasna) 4,736,758 17,067 1,654,686 6,408,511 1.0%Housing Anywhere 6,226,535 – -35,879 6,190,656 1.0%DOC+ 4,000,000 1,750,000 -11 5,749,989 0.9%JamesEdition – 3,341,400 75,067 3,416,467 0.5%Vezeeta 3,155,946 – – 3,155,946 0.5%Agente Imóvel 2,999,443 – – 2,999,443 0.5%YouScan² 2,346,512 – 564,151 2,910,663 0.5%Naseeb Networks (Rozee and Mihnati) 3,807,560 – -998,840 2,808,720 0.4%Grace Health – 1,041,951 36,595 1,078,546 0.2%Numan³ 1,012,000 36,208 -18,473 1,029,735 0.2%Shwe Property 500,000 200,000 5,151 705,151 0.1%JobNet 500,000 – 145,106 645,106 0.1%Marley Spoon 315,981 – 214,951 530,932 0.1%CarZar 3,000,000 – -2,560,317 439,683 0.1%Dubicars 348,325 – – 348,325 0.1%Avito 539,874,449 -539,874,449 – – –Babylon, convertible debt 9,226,610 7,745,400 404,592 17,376,602 2.7%VOI, convertible debt – 11,731,665 – 11,731,665 1.8%Naseeb Networks, convertible debt – 200,000 1,611 201,611 0.0%Booksy, convertible debt 999,900 -999,900 – – –Liquidity management 644,274 47,304,624 599,370 48,548,268 7.5%Total 932,481,913 -400,742,941 114,646,752 646,385,724 100.0%
1. Indirect holding through YSaphis S.A. and Sprints Capital Rob R Partners S.A.2. Reflects Vostok New Ventures’ 20.9% indirect shareholding in YouScan which is held through a 33.2% holding in Kontakt East Holding AB, which owns 63% of
YouScan.3. Convertible note conversions into shares generates capitalized interest and currency effects which are excluded in investments of financial assets in the cash flow
statement.
: : 22 : :
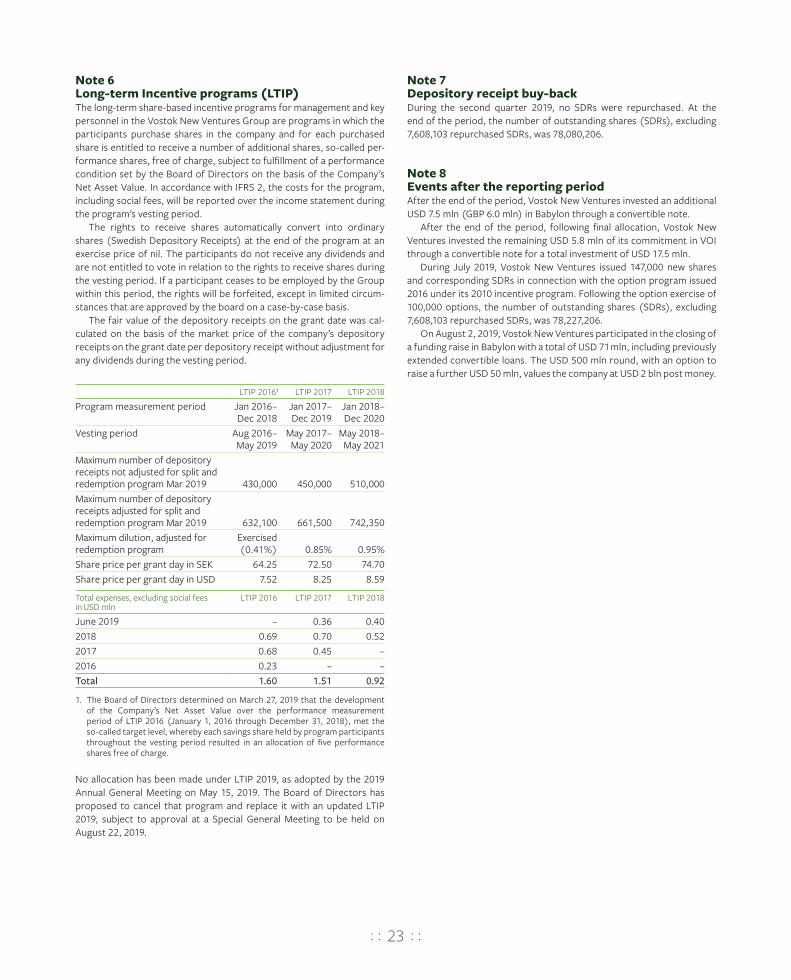
Note 6 Long-term Incentive programs (LTIP)The long-term share-based incentive programs for management and key personnel in the Vostok New Ventures Group are programs in which the participants purchase shares in the company and for each purchased share is entitled to receive a number of additional shares, so-called per-formance shares, free of charge, subject to fulfillment of a performance condition set by the Board of Directors on the basis of the Company’s Net Asset Value. In accordance with IFRS 2, the costs for the program, including social fees, will be reported over the income statement during the program’s vesting period.
The rights to receive shares automatically convert into ordinary shares (Swedish Depository Receipts) at the end of the program at an exercise price of nil. The participants do not receive any dividends and are not entitled to vote in relation to the rights to receive shares during the vesting period. If a participant ceases to be employed by the Group within this period, the rights will be forfeited, except in limited circum-stances that are approved by the board on a case-by-case basis.
The fair value of the depository receipts on the grant date was cal-culated on the basis of the market price of the company’s depository receipts on the grant date per depository receipt without adjustment for any dividends during the vesting period.
LTIP 2016¹ LTIP 2017 LTIP 2018
Program measurement period Jan 2016–Dec 2018
Jan 2017–Dec 2019
Jan 2018–Dec 2020
Vesting period Aug 2016–May 2019
May 2017–May 2020
May 2018–May 2021
Maximum number of depository receipts not adjusted for split and redemption program Mar 2019 430,000 450,000 510,000Maximum number of depository receipts adjusted for split and redemption program Mar 2019 632,100 661,500 742,350Maximum dilution, adjusted for redemption program
Exercised (0.41%) 0.85% 0.95%
Share price per grant day in SEK 64.25 72.50 74.70Share price per grant day in USD 7.52 8.25 8.59
Total expenses, excluding social fees in USD mln
LTIP 2016 LTIP 2017 LTIP 2018
June 2019 – 0.36 0.402018 0.69 0.70 0.522017 0.68 0.45 –2016 0.23 – –Total 1.60 1.51 0.92
1. The Board of Directors determined on March 27, 2019 that the development of the Company’s Net Asset Value over the performance measurement period of LTIP 2016 (January 1, 2016 through December 31, 2018), met the so-called target level, whereby each savings share held by program participants throughout the vesting period resulted in an allocation of five performance shares free of charge.
No allocation has been made under LTIP 2019, as adopted by the 2019 Annual General Meeting on May 15, 2019. The Board of Directors has proposed to cancel that program and replace it with an updated LTIP 2019, subject to approval at a Special General Meeting to be held on August 22, 2019.
Note 7 Depository receipt buy-backDuring the second quarter 2019, no SDRs were repurchased. At the end of the period, the number of outstanding shares (SDRs), excluding 7,608,103 repurchased SDRs, was 78,080,206.
Note 8 Events after the reporting periodAfter the end of the period, Vostok New Ventures invested an additional USD 7.5 mln (GBP 6.0 mln) in Babylon through a convertible note.
After the end of the period, following final allocation, Vostok New Ventures invested the remaining USD 5.8 mln of its commitment in VOI through a convertible note for a total investment of USD 17.5 mln.
During July 2019, Vostok New Ventures issued 147,000 new shares and corresponding SDRs in connection with the option program issued 2016 under its 2010 incentive program. Following the option exercise of 100,000 options, the number of outstanding shares (SDRs), excluding 7,608,103 repurchased SDRs, was 78,227,206.
On August 2, 2019, Vostok New Ventures participated in the closing of a funding raise in Babylon with a total of USD 71 mln, including previously extended convertible loans. The USD 500 mln round, with an option to raise a further USD 50 mln, values the company at USD 2 bln post money.
: : 23 : :

Information
BackgroundVostok New Ventures Ltd was incorporated in Bermuda on April 5, 2007 with corporate identity number 39861. The Swedish Depository Receipts of Vostok New Ventures (SDB) are listed on Nasdaq Stockholm, Mid Cap segment, with the ticker VNV SDB.
As of June 30, 2019, the Vostok New Ventures Ltd Group consists of the Bermudian parent company Vostok New Ventures Ltd; one wholly-owned Cypriot subsidiary, Vostok New Ventures (Cyprus) Limited; one controlled Dutch cooperative, Vostok Co-Investment Coöperatief B.A.; and one wholly-owned Swedish subsidiary, Vostok New Ventures AB.
The financial year is January 1–December 31.
Parent companyThe parent company finances the Cypriot subsidiary’s operations on market terms. The net result for the period was USD 71.24 mln (2018: 4.33). Financial assets at fair value through profit or loss refers to liquidity management investments.
Financial and Operating risksThe Company’s risks and risk management are described in detail in note 3 of the Company’s Annual Report 2018.
Upcoming Reporting DatesVostok New Ventures’ nine months report for the period January 1, 2019–September 30, 2019 will be published on November 13, 2019.
The Board of Directors and the CEO certify that the half-year financial report gives a fair view of the performance of the business, position and profit or loss of the Company and the Group and that it describes the principal risks and uncertainties that the Company and the companies in the Group face.
Bermuda, August 14, 2019
Lars O GrönstedtJosh Blachman
Per BriliothVictoria GraceYlva LindquistKeith Richman
For further information contact Per Brilioth or Björn von Sivers: tel: +46 8 545 015 50.www.vostoknewventures.com
This report has not been subject to review by the Company’s auditors.
: : 24 : :