financial report - cajamar
TRANSCRIPT

FINANCIAL REPORT First quarter 2020 6 May 2020

1
Quarterly financial report First quarter 2020
Contents
Most significant figures...................................................................................................................... 2
Highlights .......................................................................................................................................... 3
Financial performance ...................................................................................................................... 8
Funds under management ............................................................................................................ 8
Loans and advances to customers ................................................................................................ 8
Asset quality.................................................................................................................................. 9
Results ........................................................................................................................................ 11
Solvency ..................................................................................................................................... 12
Liquidity ....................................................................................................................................... 12
Glossary of terms on alternative performance measures ................................................................ 13
Disclaimer ....................................................................................................................................... 15

2
Quarterly financial report First quarter 2020
Most significant figures
31/03/2020 31/12/2019 31/03/2019 y-o-y q-o-q
Abs. % Abs. %
Profit and Loss Account Net interest income 147,656 589,796 148,118 (462) (0.3%)
Gross Income 231,102 1,147,654 236,894 (5,792) (2.4%)
Recurring Gross Income 254,683 935,222 235,795 18,888 8.0%
Net Income before provisions 87,625 573,542 94,567 (6,942) (7.3%)
Recurring Net Income before provisions 111,205 361,109 93,468 17,737 19.0%
Profit before tax 18,624 113,412 23,279 (4,655) (20.0%)
Consolidated Net profit 17,261 92,495 24,632 (7,371) (29.9%)
Attributable Net profit 17,261 92,495 24,632 (7,371) (29.9%)
Business
Total Assets 48,183,200 47,406,455 44,358,209 3,824,991 8.6% 776,745 1.6% Equity 3,338,257 3,304,672 3,138,457 199,800 6.4% 33,585 1.0% On-balance sheet retail funds 31,643,164 30,561,447 29,183,829 2,459,335 8.4% 1,081,717 3.5% Off-balance sheet funds 4,498,734 4,850,569 4,413,163 85,571 1.9% (351,835) (7.3%) Performing Loans 30,013,962 29,574,566 29,362,305 651,657 2.2% 439,396 1.5% Risk management
Non-performing assets 4,588,208 4,657,612 5,225,065 (636,857) (12.2%) (69,404) (1.5%) Non-performing assets (net) 2,353,850 2,408,222 2,831,349 (477,499) (16.9%) (54,372) (2.3%) NPA coverage (%) 48.70% 48.29% 45.81% 2.89 0.41 Non-performing loans 1,892,853 1,948,076 2,365,311 (472,458) (20.0%) (55,223) (2.8%) NPL ratio (%) 5.82% 6.07% 7.31% (1.49) (0.25) NPL coverage ratio (%) 49.80% 49.10% 44.01% 5.79 0.70 Foreclosed assets (gross) 2,695,355 2,709,536 2,859,754 (164,399) (5.7%) (14,181) (0.5%) Foreclosed assets (net) 1,403,550 1,416,670 1,507,048 (103,498) (6.9%) (13,120) (0.9%) Foreclosed assets Coverage ratio (%) 47.93% 47.72% 47.30% 0.63 0.21 Texas ratio 86.35% 86.71% 98.28% (11.93) (0.36) Cost of risk 0.65% 1.03% 0.65% - (0.38) Liquidity
LTD (%) 93.11% 95.05% 99.93% (6.82) (1.94) LCR (%) 242.21% 212.33% 211.06% 31.15 29.88 NSFR (%) 132.68% 124.03% 120.64% 12.04 8.65 Business gap 2,263,654 1,569,744 19,971 2,243,683 11234% 693,910 44.2% Solvency phased in
CET1 ratio (%) 12.75% 13.03% 12.60% 0.14 (0.29) Tier 2 ratio (%) 1.66% 1.66% 1.73% (0.07) (0.00) Capital ratio (%) 14.40% 14.69% 14.33% 0.07 (0.29) Leverage ratio (%) 6.02% 6.25% 6.44% (0.42) (0.23) Solvency fully loaded
CET1 ratio (%) 12.16% 12.32% 11.88% 0.27 (0.16) Tier 2 ratio (%) 1.66% 1.67% 1.74% (0.07) (0.00) Capital ratio (%) 13.82% 13.98% 13.62% 0.20 (0.16) Levarage ratio (%) 5.74% 5.91% 6.08% (0.34) (0.17) Profitability and efficiency
ROA (%) 0.15% 0.20% 0.23% (0.08) (0.06) RORWA (%) 0.30% 0.40% 0.43% (0.13) (0.10) ROE (%) 2.10% 2.89% 3.22% (1.12) (0.79) Cost-income ratio (%) 62.08% 50.02% 60.08% 2.00 12.06 Recurring cost-income ratio (%) 56.34% 61.39% 60.36% (4.02) (5.05) Other data
Cooperative members 1,434,758 1,430,086 1,428,057 6,701 0.5% 4,672 0.3% Employees 5,450 5,483 5,492 (42) (0.8%) (33) (0.6%) Branches 933 956 975 (42) (4.3%) (23) (2.4%)

3
Quarterly financial report First quarter 2020
Highlights
Response to the COVID-19 crisis
The COVID-19 crisis is negatively affecting the
global economy and our country’s in particular. The
latest GDP data for the first quarter of the year,
published on April 30, showed the following figures:
-3.8% quarterly reduction in the Euro area and -
5.2% in Spain. Overall, all sectors of the Spanish
economy have been adversely affected in the
quarter with diverse impacts, according to the data
published by the INE1:
- The most affected sectors are: artistic,
recreational and other services activities (-11.2%);
trade, transport and hospitality (-10.9%); and
professional, scientific and other activities (-8.0%).
- The least affected sectors are: financial and
insurance activities (+1.0%); public administration,
education and health (+0.8%); agriculture,
livestock, forestry and fisheries (-1.4%).
As a result, Grupo Cooperativo Cajamar is
reviewing its projections and objectives to adapt
them to this scenario with a still very uncertain
future.
The Group has many competitive advantages that
improve its relative position to face this difficult
situation. Although it has a 2.9% market share in
terms of loans in Spain, it has a leading and
differentiated position in the agri-food sector, with a
15% market share. The agrobusiness segment is
more stable and countercyclical than other sectors
1 INE: https://ine.es/daco/daco42/daco4214/cntr0120a.pdf
that are being more impacted by this crisis. The
Group has also presence in certain geographical
areas of Spain that have been less affected by the
pandemic (Andalusia, Mediterranean Arch and the
islands). Its presence in the most affected areas,
such as Madrid or Barcelona, is very small (3.8%
and 2.9%, respectively, of the total number of
branches as of December 2019).
Based on the classification of its credit portfolio,
Grupo Cajamar estimates that approximately 7% of
it is exposed to a high risk arising from this crisis
(loss of non-recoverable income: hospitality, leisure,
textile, passenger transport, aesthetic centers, etc.),
17% exposed to an medium risk (income that can
be recovered at least in part after the alarm period :
residential construction, non-textile or agro-related
retail, maintenance, etc.), and 76% of the portfolio
could deal with the crisis with zero or low impact
(agro, healthcare and pharmaceutical business,
public sector, energy, water and waste
management, etc.)
To face this crisis, Grupo Cooperativo Cajamar has
launched a COVID19 response plan, providing
families and businesses with all the necessary
measures to protect them and mitigate the
economic impact of this exceptional situation. This
Plan has put in value the technological and human
capabilities of Grupo Cooperativo Cajamar, where
its digital banking and remote banking solutions

4
Quarterly financial report First quarter 2020
have been ideal to maintain the relationship with our
customers.
The following measures can be highlighted:
For private customers:
✓ Advance payment of pensions and
unemployment benefits
✓ Access to mortgage and non-mortgage
moratorium
✓ Ability to make liquid consolidated fees for
pension plans for vulnerable clients
✓ Financing benefits under special
conditions: E.R.T.E (temporary layoffs)
advance payment at no cost, technological
equipment for remote working, tax
payments (Credirenta) or tax returns
(Credianticipo), deferral of up to three
payments of rented foreclosed assets at no
cost.
✓ Impulse of online banking
For Corporates, SMEs and Self-employed
individuals:
✓ Special financing conditions to provide
liquidity to businesses and self-employed
individuals which consist on deferring
capital payments (up to 12 months) and
Term (up to 5 years).
✓ Flexibilization of deadlines and conditions
on certain products.
✓ Supporting businesses in their remote
management
✓ Availability of the personal assistance
through electronic banking
✓ Special financing for the different agro
sectors affected by the crisis and extension
of the deadline to request CAP aid in the
agro sector.
✓ Extension of deadlines for international
businesses.
✓ Advancement of pension payments and
unemployment benefits
Regarding social initiatives:
✓ Collaboration with the SICNOVA platform
through which 105,000 face visors have
been donated to healthcare personnel.
✓ Collaboration in manufacturing and
distributing waterproof robes for healthcare
personnel (3,000 robes per week).
✓ Economic contributions to the Spanish Red
Cross Institution focused on attending
vulnerable groups that suffer from
coronavirus.
✓ Internal campaign to finance projects
related to COVID19 emergency.
✓ HAZLOPOSIBLE Foundation with the
Forgood.es initiative.
Operational adaptation:
✓ Employee protection: cancellation of
ordinary activity (displacements, meetings,
events and training activities), personnel
protection measures (use of gloves,
hydroalcoholic gel, masks, visors),
reinforcement of cleaning services.
✓ Implementation of telework: 85% in Central
Services, 50% in the Commercial Network,
grant acquisition of computer equipment
and measures to reconcile work-life
balance.
✓ Guarantee of business continuity: essential
services in the branch network, reductions
of opening hours, concentration of

5
Quarterly financial report First quarter 2020
branches in locations with several seats
with additional protection measures and
limitation regarding distance for employees
and customers.
✓ Job maintenance commitment
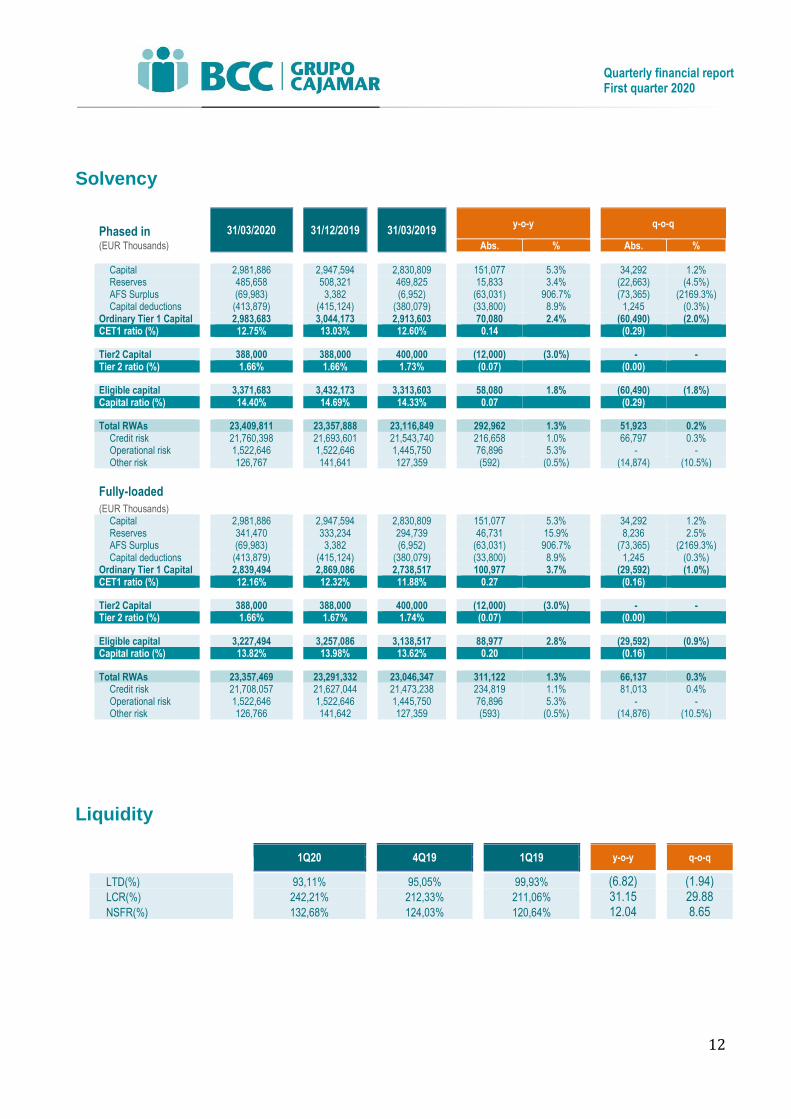
Solvency
At the end of the first quarter 2020, Grupo
Cooperativo Cajamar has a CET1 phased in ratio of
12.75% (12.16% fully loaded) , improving 14 bps
compared to the same quarter last year: +65 bps
coming from an increase in capital, +20 pbs from
reserves, -13 bps from the calendar effect of IFRS9,
-16 bps coming from the increase of RWAs and -42
bps from the rest of the effects (specially from latent
losses of assets valued at fair value, due to the
market deterioration in March as a consequence of
COVID-19). The phased in solvency ratio stands at
14.40% (+0.07% y-o-y and -0.29% in the quarter),
equivalent to 13.82% fully loaded (+0.20% y-o-y, -
0.16% q-o-q). This valuation effect on portfolios at
fair value has been the main driver for the q-o-q
decrease in solvency ratios.
BCC received authorization from the ECB to be able
to buy back up to a maximum of 3% of the T2 bonds
issued for market making purposes. BCC has
issued 400 million euros in two subordinated debt
issuances. That authorization implies that the
maximum amount of the buyback allowance
deducts entirely from the eligible capital, with an
additional impact of 5 bps y-o-y.
In any case, solvency ratio stood 140 bps above
SREP requirement for 2020, which increases to 390
bps in case ECB’s extraordinary measures for the
financial sector are considered, such as the waiver
to comply with the 250 bps of capital conservation
buffer. These measures are introduced as a
consequence of the COVID-19 crisis in order to
provide with liquidity and financing options to the
real economy.
Liquidity
Customer deposits continue improving (8.4% y-o-y),
tendency that accelerates in the first quarter of the
year, with an increase of €1,082Mn (+3.5%
compared to the last quarter 2019). This tendency
allows the LTD ratio to stand at 93.1% (improving
from the 95.1% of the previous quarter and from the
99.3% in the first quarter 2019) and the business
gap to reach €2,264 million in the quarter (+2.244 y-
o-y). In this way, the Group maintains a sound
liquidity position with a y-o-y improvement, based
on a granular and solid customer base, with liquidity
ratios well above requirements (LCR 242.21%, -
31.15 pp y-o-y, NSFR 132.68%, + 12.04 pp y-o-y).
Up to quarter end, the Group has early amortized
€3.073Mn of the TLTRO2 (which had an initial
maturity in June 2020), having refinanced it through
two dispositions of the new series of the TLTRO3
maturing in three years, for a total amount of
€3,666Mn. The outstanding amount of the TLTRO2
(€2,014Mn), as well as the €750Mn Covered Bond
maturing in October 2020, are expected to be
refinanced by additional dispositions of the
TLTRO3. Due to the new improved conditions of the
TLTRO3 (expected to be -100 bps from June 2020
to June 2021 and limit increased to 50% of eligible
loans), BCC would have the capability to take
additional €4,395Mn compared to the amount
disposed of the TLTRO2. The usage of ECB’s
facilities will be with the aim of optimizing resources
and maximizing financial margins.

6
Quarterly financial report First quarter 2020
The Group has €6,307Mn eligible unencumbered
high quality liquidity assets (HQLAs) in its ALCO
portfolio and € 3,640 million of additional capacity to
issue covered bonds.
Under these circumstances, BCC does not
contemplate to do any issuance in the wholesale
market in 2020.
Asset Quality
GCC has been able to continue improving its asset
quality, reducing non-performing risks by 19,9% y-
o-y (-2.8% in the quarter), reducing the NPL ratio to
5.82% compared to the 6.07% last quarter (1.49 pp
y-o-y improvement), and reducing the gap with the
sector average. The NPL coverage ratio also
improves in the first quarter, standing at 49.8%
(49.1% in December 2019, increasing 5.79 pp in the
last 12 months). This improvement allows Grupo
Cooperativo Cajamar to be in a much strengthen
position to face this COVID-19 crisis (in comparison
with the previous crisis).
Sales of foreclosed assets, despite having reduced
in the first quarter 2020 in comparison with previous
quarters, have allowed the Group to absorb the
inflows of new assets, reducing the net figure of
foreclosed assets in €13Mn in the quarter and
€103Mn in the last 12 months (-6.9%), coming to a
net amount of €1,404Mn by the end of the quarter.
In March, the reduction tendency has significantly
slowed down as of the new economic environment
and the lockdown situation. This slowdown in the
sale of foreclosed assets will, with a high probability,
continue in the following quarters.
Coverage of foreclosed assets slightly increases
compared to the previous quarter, standing at
47.9% (53.4% factoring in write offs in the
foreclosure procedure).
Profit for the quarter
Net interest income, as of the first quarter 2020,
stands at €148Mn, which means a decrease of
0.3% compared to the first quarter last year. Net
fees and commissions income grow 3.7% y-o-y,
standing at €63Mn. Meanwhile, results on financial
transactions have reached €17 million accumulated
in the year, 37.6% less than the first quarter last
year, because of the market conditions due to
COVID-19 crisis. Therefore, gross margin stands at
€231Mn at the end of the quarter (-2.4% y-o- y).
Nevertheless, recurring gross margin stands at
€255Mn (+8% y-o-y).
Operating expenses (personnel expenses and other
general administration expenses) grow slightly by
1% y-o-y, while amortization and depreciation
reduce by 1.2% y-o-y. Cost income ratio stands at
62.1% (60.1% in March 2019), while recurring cost-
income ratio improves to 56.4% (60.4% in March
2019).
Pre-provision profit amounts to €88 Mn at the end of
March (-7.3 % y-o-y) and the recurring pre-provision
profit at €111Mn (+19% y-o-y), allowing the Group
to allocate 5% more funds on loan loss provisions,
which has implied an improvement of non-
performing assets coverage and the cost of risk
stand at 65 bps.
Profit before taxes at the end of March totals €19
million (- 20% y-o-y) and net profit amounts 17
million euro (-30% y-o-y).

7
Quarterly financial report First quarter 2020
Streamlining
Grupo Cooperativo Cajamar ends the quarter with a
network of 933 branches, 42 less than the first
quarter 2019. The workforce stands at 5,450
employees, 42 less than the first quarter of the
previous year.
Sustainability
Grupo Cooperativo Cajamar is known for its social
cooperative-based nature, its mission and vision, its
ethical management system and its conviction
around the promotion of the social economy as a
socio-economic model that aims to put the financial
resources at the service of society. The Group offers
a wide range of products and services aimed at
supporting families and local production systems.
Grupo Cajamar carries out I+D+I projects in agro-
sustainability, food and health, bio-economy and
greenhouse technology and transfers knowledge to
companies, farmers, professionals and
researchers, through its experimental centers in
Almería and Valencia. The Group is committed to
socially responsible investment through the
establishment of exclusion criteria or unwanted
linkages, while having also positive criteria.
Funds already comply with the Socially Responsible
Investment requirements in a 98% of the total funds
managed.
Regarding the environmental commitment of the
Group (included in its Environmental Policy), 100%
of the energy used by the Group comes from green
energy and 100% of the CO2 tons calculated and
emitted have already been compensated.
The Group has a supplier approval process and
100% of the approved suppliers have already
committed to comply with the Principles of the
Global Compact.
Grupo Cooperativo Cajamar has attached to a
significant number of initiatives and protocols, which
include:
• Principles for Responsible Banking of the
United Nations
• Carbon Disclosure Project
• Climate Change Cluster
• Transparency, Governance and Integrity
Cluster
• Social Impact Cluster of Forética
• Global Reporting Initiative of Forética
• United Nations Global Compact of Forética
• Women’s Empowerment Principles
• Charter Diversity
• European Association of Co-operative
Banks
• SpainSIF
The Group is also following the instructions of Task
Force on Climate-related Financial Disclosures.
Grupo Cajamar has launched different green
product lines and collaboration and financing lines
to support its customers´ energy efficiency.

8
Quarterly financial report First quarter 2020
Financial performance
Funds under management
(EUR Thousands) 31/03/2020 31/12/2019 31/03/2019 y-o-y q-o-q
Abs. % Abs. %
Sight deposits 25,169,550 23,777,663 21,980,451 3,189,099 14.5% 1,391,887 5.9% Term deposits 6,473,614 6,783,784 7,203,378 (729,764) (10.1%) (310,170) (4.6%)
Customer deposits 31,643,164 30,561,447 29,183,829 2,459,335 8.4% 1,081,717 3.5% On-balance sheet retail funds 31,643,164 30,561,447 29,183,829 2,459,335 8.4% 1,081,717 3.5%
Bonds and other securities * 2,748,806 2,800,004 2,940,237 (191,431) (6.5%) (51,199) (1.8%) Subordinated liabilities 410,702 402,547 420,406 (9,704) (2.3%) 8,155 2.0% Central counterparty deposits 2,821,114 3,714,853 2,072,522 748,592 36.1% (893,739) (24.1%) Financial institutions 746,445 631,400 537,178 209,267 39.0% 115,045 18.2% ECB 5,646,412 5,040,280 5,029,995 616,417 12.3% 606,132 12.0%
Wholesale funds 12,373,479 12,589,084 11,000,338 1,373,141 12.5% (215,606) (1.7%) Total balance sheet funds 44,016,643 43,150,531 40,184,167 3,832,476 9.5% 866,111 2.0%
Mutual funds 2,602,384 2,893,771 2,466,437 135,947 5.5% (291,387) (10.1%) Pension plans 857,221 832,230 806,087 51,134 6.3% 24,991 3.0% Savings insurances 660,922 671,219 674,134 (13,212) (2.0%) (10,297) (1.5%) Fixed-equity income 378,207 453,348 466,506 (88,299) (18.9%) (75,141) (16.6%)
Off-balance sheet funds 4,498,734 4,850,569 4,413,163 85,571 1.9% (351,835) (7.3%)
Customer funds under mgment 36,141,898 35,412,016 33,596,992 2,544,906 7.6% 729,882 2.1%
Funds under management 48,515,377 48,001,100 44,597,330 3,918,047 8.8% 514,276 1.1% * Covered bonds, territorial bonds and securitization.
Loans and advances to customers
31/03/2020 31/12/2019 31/03/2019 y-o-y q-o-q
(EUR Thousands) Abs. % Abs. %
General governments 598,579 469,030 754,508 (155,929) (20.7%) 129,550 27.6% Other financial corporations 1,259,375 1,157,366 1,200,747 58,628 4.9% 102,009 8.8% Non-financial corporations 11,982,748 11,838,270 11,536,683 446,065 3.9% 144,476 1.2% Households 17,678,853 17,657,434 17,895,094 (216,241) (1.2%) 21,420 0.1% Loans to customers (gross) 31,519,555 31,122,100 31,387,032 132,523 0.4% 397,455 1.3% Of which: Real estate developers 832,509 852,469 1,043,445 (210,936) (20.2%) (19,960) (2.3%) Performing loans to customers 29,626,702 29,174,024 29,021,721 604,981 2.1% 452,678 1.6% Non-performing loans 1,892,853 1,948,076 2,365,311 (472,458) (20.0%) (55,223) (2.8%) Other loans * - - - - - - - Debt securities from customers 387,260 400,542 340,584 46,676 13.7% (13,282) (3.3%) Gross Loans 31,906,815 31,522,642 31,727,616 179,199 0.6% 384,173 1.2% Performing Loans 30,013,962 29,574,566 29,362,305 651,657 2.2% 439,396 1.5% Credit losses and impairment (942,553) (956,524) (1,041,010) 98,457 (9.5%) 13,971 (1.5%) Total lending 30,964,263 30,566,117 30,686,605 277,658 0.9% 398,145 1.3% Off-balance sheet risks Contingent risks 740,107 706,355 734,122 5,985 0.8% 33,752 4.8% of which: non-performing contingent risks 7,785 7,862 7,253 532 7.3% (77) (1.0%) Total risks 32,646,922 32,228,997 32,461,738 185,184 0.6% 417,925 1.3% Non-performing total risks 1,900,638 1,955,938 2,372,564 (471,926) (19.9%) (55,300) (2.8%) * Mainly reverse repurchase agreements

9
Asset quality
Foreclosed assets (*) 31/03/2020 31/12/2019 31/03/2019 y-o-y q-o-q
(Thousand €) Abs. % Abs. % Non-performing total risks 1,900,638 1,955,938 2,372,564 (471,926) (19.9%) (55,300) (2.8%) Total risks 32,646,922 32,228,997 32,461,738 185,184 0.6% 417,925 1.3% NPL ratio (%) 5.82% 6.07% 7.31% (1.49) (0.25) Gross loans coverage 942,553 956,524 1,041,010 (98,457) (9.5%) (13,971) (1.5%) NPL coverage ratio (%) 49.80% 49.10% 44.01% 5.79 0.70 Foreclosed Assets (gross) 2,695,355 2,709,536 2,859,754 (164,399) (5.7%) (14,181) (0.5%) Foreclosed Assets Coverage 1,291,805 1,292,866 1,352,705 (60,900) (4.5%) (1,061) (0.1%) Foreclosed assets coverage ratio (%) 47.93% 47.72% 47.30% 0.63 0.21 Foreclosed assets coverage with w/o 53.42% 53.08% 52.14% 1.28 0.34 NPA ratio (%) 13.26% 13.61% 15.11% (1.85) (0.35) NPA coverage (%) 48.70% 48.29% 45.81% 2.89 0.41 NPA coverage with w/o (%) 52.02% 51.52% 48.65% 3.37 0.50 Foreclosed assets (gross) 2,695,355 2,709,536 2,859,754 (164,399) (5.7%) (14,181) (0.5%) Foreclosed assets coverage (1,291,805) (1,292,866) (1,352,705) 60,900 (4.5%) 1,061 (0.1%) Foreclosed assets (net) 1,403,550 1,416,670 1,507,048 (103,498) (6.9%) (13,120) (0.9%) Coverage ratio (%) 47.93% 47.72% 47.30% 0.63 0.21 Coverage ratio with w/o (%) 53.42% 53.08% 52.14% 1.27 0.33 Foreclosed assets (gross) 2,695,355 2,709,536 2,859,754 (164,399) (5.7%) (14,181) (0.5%)
Residentail properties 1,281,170 1,289,997 1,435,510 (154,340) (10.8%) (8,827) (0.7%) Of which: under construction 225,228 218,587 176,825 48,403 27.4% 6,641 3.0%
Commercial properties 1,405,684 1,389,947 1,411,686 (6,002) (0.4%) 15,738 1.1% Of which: countryside land 59,081 58,310 55,658 3,423 6.2% 770 1.3% Of which: under construction 2,168 2,168 2,168 - - - - Of which: urban land 1,026,765 1,009,264 1,036,159 (9,394) (0.9%) 17,500 1.7% Of which: developable land 9,893 9,833 8,947 946 10.6% 60 0.6% Of which: warehouses/premises 317,671 320,204 317,702 (31) (0.0%) (2,533) (0.8%)
Other 8,501 29,593 12,558 (4,057) (32.3%) (21,092) (71.3%) Foreclosed assets (net) 1,403,550 1,416,670 1,507,048 (103,498) (6.9%) (13,120) (0.9%)
Residentail properties 771,001 773,983 861,652 (90,650) (10.5%) (2,982) (0.4%) Of which: under construction 110,407 107,183 82,218 28,189 34.3% 3,225 3.0%
Commercial properties 627,708 621,169 638,019 (10,312) (1.6%) 6,538 1.1% Of which: countryside land 23,947 22,773 21,501 2,446 11.4% 1,175 5.2% Of which: under construction 953 953 938 15 1.6% - - Of which: urban land 417,446 410,242 430,658 (13,212) (3.1%) 7,204 1.8% Of which: developable land 2,241 2,175 2,794 (553) (19.8%) 66 3.0% Of which: warehouses/premises 183,120 187,202 184,922 (1,802) (1.0%) (4,082) (2.2%)
Other 4,841 21,518 7,377 (2,536) (34.4%) (16,677) (77.5%) Coverage (%) 47.93% 47.72% 47.30% 0.63 0.21
Residentail properties 39.82% 40.00% 39.98% (0.16) (0.18) Of which: under construction 50.98% 50.97% 53.50% (2.52) 0.01
Commercial properties 55.35% 55.31% 54.80% 0.54 0.04 Of which: countryside land 59.47% 60.95% 61.37% (1.90) (1.48) Of which: under construction 56.03% 56.03% 56.72% (0.69) - Of which: urban land 59.34% 59.35% 58.44% 0.91 (0.01) Of which: developable land 77.34% 77.88% 68.77% 8.57 (0.53) Of which: warehouses/premises 42.36% 41.54% 41.79% 0.56 0.82
Other 43.05% 27.29% 41.25% 1.80 15.77 Coverage with write offs (%) 53.42% 53.08% 52.14% 1.27 0.33
Residentail properties 46.66% 46.60% 45.65% 1.01 0.06 Of which: under construction 108.42% 108.11% 116.62% (8.20) 0.32
Commercial properties 59.74% 59.67% 58.86% 0.87 0.06 Of which: countryside land 65.05% 66.75% 65.65% (0.60) (1.70) Of which: under construction 56.41% 56.41% 57.10% (0.68) - Of which: urban land 63.29% 63.22% 62.20% 1.09 0.06 Of which: developable land 82.22% 82.66% 75.89% 6.33 (0.44) Of which: warehouses/premises 45.92% 45.84% 45.69% 0.23 0.08
Other 43.05% 27.29% 41.25% 1.80 15.77 (*) RE investments not included

10
Quarterly financial report First quarter 2020
REOs breakdown 31/03/2020 31/12/2019 31/03/2019 y- o -y q-o-q
Abs. % Abs. %
REOs (gross) 2,994,466 2,991,714 3,241,708 (247,242) (7.6%) 2,751 0.1%
Foreclosed assets 2,695,355 2,709,536 2,859,754 (164,399) (5.7%) (14,181) (0.5%) Non-current assets held for sale 536,704 549,671 629,077 (92,373) (14.7%) (12,967) (2.4%) Inventories 2,158,651 2,159,865 2,230,677 (72,025) (3.2%) (1,214) (0.1%)
RE Investments 299,111 282,178 381,954 (82,844) (21.7%) 16,932 6.0%
REOs (coverage) 1,415,806 1,410,768 1,517,729 (101,924) (6.7%) 5,037 0.4%
Foreclosed assets 1,291,805 1,292,866 1,352,705 (60,900) (4.5%) (1,061) (0.1%) Non-current assets held for sale 236,564 239,906 276,368 (39,803) (14.4%) (3,341) (1.4%) Inventories 1,055,240 1,052,960 1,076,338 (21,097) (2.0%) 2,281 0.2%
RE Investments 124,001 117,903 165,024 (41,023) (24.9%) 6,098 5.2%
REOs (% coverage) 47.28% 47.16% 46.82% 0.46 0.12
Foreclosed assets 47.93% 47.72% 47.30% 0.63 0.21 Non-current assets held for sale 44.08% 43.65% 43.93% 0.15 0.43 Inventories 48.88% 48.75% 48.25% 0.63 0.13
RE Investments 41.46% 41.78% 43.21% (1.75) (0.33)
REOs 1Q19 2Q19 3Q19 4Q19 1Q20
Last 4 quarters
Inflow 71 96 78 114 75 364
Sales -117 -141 -150 -247 -72 -611
Variation -46 -45 -72 -133 3 -247
NPL evolution 1Q19 2Q19 3Q19 4Q19 1Q20
Last 4 quarters
NPL inflow 101 87 93 100 80 361
NPL outflow -195 -246 -189 -263 -136 -833
Variation -94 -159 -95 -163 -55 -472

11
Quarterly financial report First quarter 2020
Results
Consolidated P&L at quarter end
31/03/2020 %ATM 31/03/2019 %ATM
y-o-y
(EUR Thousands) Abs. % Interest income 172,376 1.45% 176,289 1.62% (3,913) (2.2%) Interest expenses (24,720) (0.21%) (28,171) (0.26%) 3,451 (12.3%) NET INTEREST INCOME 147,656 1.24% 148,118 1.36% (462) (0.3%) Dividend income 855 0.01% 500 0.00% 355 71.0% Income from equity-accounted method 6,937 0.06% 8,804 0.08% (1,867) (21.2%) Net fees and commissions 63,322 0.53% 61,051 0.56% 2,271 3.7% Gains (losses) on financial transactions 16,669 0.14% 26,712 0.24% (10,043) (37.6%) Exchange differences [gain or (-) loss], net (243) - 959 0.01% (1,202) (125.3%) Other operating incomes/expenses (4,094) (0.03%) (9,250) (0.08%) 5,156 (55.7%)
of which: Transfer to Education/Devpment Fund (621) (0.01%) (1,363) (0.01%) 742 (54.4%) GROSS INCOME 231,102 1.94% 236,894 2.17% (5,792) (2.4%) Administrative expenses (128,892) (1.08%) (127,572) (1.17%) (1,320) 1.0%
Personnel expenses (82,857) (0.70%) (81,046) (0.74%) (1,811) 2.2% Other administrative expenses (46,036) (0.39%) (46,526) (0.43%) 490 (1.1%)
Depreciation and amortisation (14,585) (0.12%) (14,755) (0.14%) 170 (1.2%) NET INCOME BEFORE PROVISIONS 87,625 0.74% 94,567 0.87% (6,942) (7.3%) Provisions or (-) reversal of provisions (1,658) (0.01%) (6,174) (0.06%) 4,516 (73.1%) Impairment losses on financial assets (57,003) (0.48%) (54,224) (0.50%) (2,779) 5.1% OPERATING INCOME 28,964 0.24% 34,169 0.31% (5,205) (15.2%) Impairment or reversal of investments in associates (net) - - - - - - Impairment losses on non financial assets (1,002) (0.01%) (3,997) (0.04%) 2,995 (74.9%) Gains or (-) losses on derecognition of non financial assets (6,407) (0.05%) (4,461) (0.04%) (1,946) 43.6% Profit or (-) loss from non-current assets (2,931) (0.02%) (2,431) (0.02%) (500) 20.6% PROFIT BEFORE TAX 18,624 0.16% 23,279 0.21% (4,655) (20.0%) Tax (1,363) (0.01%) 1,353 0.01% (2,716) (200.7%) CONSOLIDATED NET PROFIT 17,261 0.15% 24,632 0.23% (7,371) (29.9%)
Quarterly results
1T19
2T19 3T19 4T19 1T20
q-o-q
(EUR Thousands) Abs. % Interest income 176,289 174,268 172,134 181,602 172,376 (9,226) (5.1%) Interest expenses (28,171) (28,469) (28,949) (28,908) (24,720) 4,188 (14.5%) NET INTEREST INCOME 148,118 145,799 143,185 152,694 147,656 (5,038) (3.3%) Dividend income 500 2,639 2,958 2,608 855 (1,753) (67.2%) Income from equity-accounted method 8,804 8,562 6,556 14,513 6,937 (7,576) (52.2%) Net fees and commissions 61,051 61,097 60,876 62,236 63,322 1,086 1.7% Gains (losses) on financial transactions 26,712 216,009 53,541 (585) 16,669 17,254 (2,949.4%) Exchange differences [gain or (-) loss], net 959 185 654 1,362 (243) (1,605) (117.8%) Other operating incomes/expenses (9,250) (7,716) (9,845) (6,568) (4,094) 2,474 (37.7%)
of which: Mandatory transfer to Education and Devlp. Fund (1,363) (1,188) (1,263) 11 (621) (632) (5,745.5%) GROSS INCOME 236,894 426,575 257,925 226,260 231,102 4,842 2.1% Administrative expenses (127,572) (131,303) (129,261) (129,136) (128,892) 244 (0.2%)
Personnel expenses (81,046) (84,426) (83,230) (83,004) (82,857) 147 (0.2%) Other administrative expenses (46,526) (46,877) (46,031) (46,132) (46,036) 96 (0.2%)
Depreciation and amortisation (14,755) (14,237) (13,180) (14,668) (14,585) 83 (0.6%) NET INCOME BEFORE PROVISIONS 94,567 281,035 115,484 82,456 87,625 5,169 6.3% Provisions or (-) reversal of provisions (6,174) (55,198) 329 7,681 (1,658) (9,339) (121.6%) Impairment losses on financial assets (54,224) (131,413) (69,436) (78,560) (57,003) 21,557 (27.4%) OPERATING INCOME 34,169 94,424 46,377 11,577 28,964 17,387 150.2% Impairment or reversal of investments in or associates (net) - - - - - - - Impairment losses on non financial assets (3,997) (26,860) 649 (2,739) (1,002) 1,737 (63.4%) Gains or (-) losses on derecognition of non financial assets (4,461) (12,215) (6,390) (4,272) (6,407) (2,135) 50.0% Profit or (-) loss from non-current assets (2,431) (6,524) (824) (3,071) (2,931) 140 (4.6%) PROFIT BEFORE TAX 23,279 48,827 39,812 1,494 18,624 17,130 1,146.6% Tax 1,353 (26,449) (4,766) 8,945 (1,363) (10,308) (115.2%) CONSOLIDATED NET PROFIT 24,632 22,378 35,046 10,439 17,261 6,822 65.4%
12
Quarterly financial report First quarter 2020
Solvency
Phased in
31/03/2020 31/12/2019 31/03/2019
y-o-y q-o-q
(EUR Thousands) Abs. % Abs. %
Capital 2,981,886 2,947,594 2,830,809 151,077 5.3% 34,292 1.2% Reserves 485,658 508,321 469,825 15,833 3.4% (22,663) (4.5%) AFS Surplus (69,983) 3,382 (6,952) (63,031) 906.7% (73,365) (2169.3%) Capital deductions (413,879) (415,124) (380,079) (33,800) 8.9% 1,245 (0.3%)
Ordinary Tier 1 Capital 2,983,683 3,044,173 2,913,603 70,080 2.4% (60,490) (2.0%) CET1 ratio (%) 12.75% 13.03% 12.60% 0.14 (0.29)
Tier2 Capital 388,000 388,000 400,000 (12,000) (3.0%) - - Tier 2 ratio (%) 1.66% 1.66% 1.73% (0.07) (0.00)
Eligible capital 3,371,683 3,432,173 3,313,603 58,080 1.8% (60,490) (1.8%) Capital ratio (%) 14.40% 14.69% 14.33% 0.07 (0.29)
Total RWAs 23,409,811 23,357,888 23,116,849 292,962 1.3% 51,923 0.2%
Credit risk 21,760,398 21,693,601 21,543,740 216,658 1.0% 66,797 0.3% Operational risk 1,522,646 1,522,646 1,445,750 76,896 5.3% - - Other risk 126,767 141,641 127,359 (592) (0.5%) (14,874) (10.5%)
Fully-loaded
(EUR Thousands)
Capital 2,981,886 2,947,594 2,830,809 151,077 5.3% 34,292 1.2% Reserves 341,470 333,234 294,739 46,731 15.9% 8,236 2.5% AFS Surplus (69,983) 3,382 (6,952) (63,031) 906.7% (73,365) (2169.3%) Capital deductions (413,879) (415,124) (380,079) (33,800) 8.9% 1,245 (0.3%)
Ordinary Tier 1 Capital 2,839,494 2,869,086 2,738,517 100,977 3.7% (29,592) (1.0%) CET1 ratio (%) 12.16% 12.32% 11.88% 0.27 (0.16)
Tier2 Capital 388,000 388,000 400,000 (12,000) (3.0%) - - Tier 2 ratio (%) 1.66% 1.67% 1.74% (0.07) (0.00)
Eligible capital 3,227,494 3,257,086 3,138,517 88,977 2.8% (29,592) (0.9%) Capital ratio (%) 13.82% 13.98% 13.62% 0.20 (0.16)
Total RWAs 23,357,469 23,291,332 23,046,347 311,122 1.3% 66,137 0.3%
Credit risk 21,708,057 21,627,044 21,473,238 234,819 1.1% 81,013 0.4% Operational risk 1,522,646 1,522,646 1,445,750 76,896 5.3% - - Other risk 126,766 141,642 127,359 (593) (0.5%) (14,876) (10.5%)
Liquidity
1Q20 4Q19 1Q19 y-o-y q-o-q
LTD(%) 93,11% 95,05% 99,93% (6.82) (1.94) LCR(%) 242,21% 212,33% 211,06% 31.15 29.88
NSFR(%) 132,68% 124,03% 120,64% 12.04 8.65

13
Quarterly financial report First quarter 2020
Glossary of terms on alternative performance measures
Grupo Cooperativo Cajamar uses in its quarterly results presentations published on its website, issue prospectuses,
presentations to investors and internally in its business monitoring reports, business indicators as per the applicable
accounting standards (IFRS), although it also uses additional, unaudited measures commonly used in the banking
sector (Alternative Performance Measures or APMs), as indicators about the business and the economic-financial
position of Grupo Cooperativo Cajamar, which allows for comparison with other entities.
These measures (APMs) are calculated in accordance with the European Securities and Markets Authority
Guidelines (ESMA/2015/1415es, of 5 October 2015), to facilitate the reporting transparency for the protection of
investors in the European Union. The measures used by Grupo Cooperativo Cajamar and their definitions are given
below:
(IN ALPHABETICAL ORDER)
Measure Definition and calculation
1 Average Total Assets (ATA) Average of the end-of-quarter figures since the previous December, inclusive.
2 Branches Total branches reported to Bank of Spain (includes part-time branches, or “ventanillas”, and excludes financial agencies).
3 Business gap Difference between the numerator and the denominator of the Loan To Deposits ratio.
4 Cooperative members Owners of at least one contribution to the equity capital of the credit cooperatives (both companies and individuals).
5 Cost of Risk (%) Annualised total impairment losses/ Average Gross Loans and REOs.
6 Cost-income ratio (%) (Administrative expenses + Depreciation and amortisation) / Gross income.
7 Customer funds under management On-Balance sheet retail funds + Off-balance sheet funds
8 Customers’ deposits Sight deposits + Term deposits
9 Customers’ spread (%) Calculated as the difference between the Average revenue of loans to customers gross and the Average cost of customer deposits (sight deposits and term deposits)
10 Debt securities from customers Portfolio of Senior debt securities of big enterprises.
11 Employees SIP’s total employees, excluding temporary and pre-retired employees
12 Foreclosed assets (gross) REOs excluding RE investments.
13 Foreclosed assets (net) Foreclosed assets (gross) – Total foreclosed assets coverage
14 Foreclosed assets coverage ratio (%) Foreclosed assets coverage / Foreclosed assets (gross)
15 Foreclosed assets coverage ratio with debt forgiveness (%)
Foreclosed assets coverage (including debt forgiveness in the foreclosure procedure)/ Foreclosed assets (gross) (including debt forgiveness in the foreclosure procedure)
16 Funds under management Total balance sheet funds + Off-balance-sheet funds
17 Gross Loans Loans to customers (gross) + Other loans (reverse repurchase agreements) + Debt securities from customers
18 Impairment losses Impairment or (-) reversal of impairment on financial assets not measured at fair value through profit or loss + Impairment or (-) reversal of impairment on non-financial assets + Impairment or reversal of impairment of investments in joint ventures or associates (net)
19 Loan to deposits ratio (%) Net loans to customers / (Customer’s deposits + Net issued securitisations + Brokered loans)
20 Net Interest Income o/ATA (%) Net interest income / Average total assets
21 Non-performing assets (NPA) Non-performing loans + Foreclosed assets (gross)
22 Non-performing Total risks Non-performing loans + non-performing contingent risks
23 NPA coverage ratio (%) (Gross loans coverage + Foreclosed assets coverage) / (Non-performing loans + Foreclosed assets (gross))
24 NPA coverage with debt forgiveness (%) (Gross loans coverage + Foreclosed assets coverage + debt forgiveness) / (Non-performing loans + Foreclosed assets (gross) + debt forgiveness)
26 NPL coverage ratio (%) Gross loans coverage / Non-performing loans
25 NPA ratio (%) (Non-performing loans + Foreclosed assets (gross)) / (Gross loans+ Foreclosed assets (gross))

14
Quarterly financial report First quarter 2020
Measure Definition and calculation
27 NPL ratio (%) (Non-performing loans +non-performing contingent risks) / (Gross loans + contingent risks)
28 Off-balance sheet funds Mutual funds + Pension plans + Saving insurance + Fixed-equity income
29 On-Balance sheet retail funds Sight deposits + Term deposits + Other funds (repurchase agreements)
30 Operating expenses Personnel expenses + Other administrative expenses + Depreciation and amortisation
31 Performing Loans Gross loans – Non-performing loans
32 Performing Loans to customers Loans to customers (gross) – Non-performing loans
33 Recurring cost-income ratio (%) Operating expenses / Recurring gross income
34 Recurring Gross Income Gross income without extraordinary results included in Gains (losses) on financial transactions and without mandatory transfers to the Education and Development Fund included in Other operating income/expenses
35 Recurring Net Income before provisions Recurring gross income – Operating expenses
36 RED Loans Real estate development loans
37 REOs Foreclosed assets + Real Estate investments
38 ROA (%) Annualisation of the following quotient: Consolidated net profit / Average total assets (average of the end-of-quarter figures since the previous December, inclusive)
39 ROE (%) Annualisation of the following quotient: Consolidated net profit / Average total equity (average of the end-of-quarter figures since the previous December, inclusive)
40 RORWA (%) Annualisation of the following quotient: Consolidated net profit / Average risk-weighted assets (average of the end-of-quarter figures since the previous December, inclusive)
41 Texas ratio (%) (Non performing total risks + gross REOs) / (Gross loans coverage + REOs coverage + Total equity)
42 Total balance sheet funds Customers’ retail funds + Wholesale funding
43 Total lending Gross Loans - Credit losses and impairment
44 Total risks Gross loans + Contingent risks
45 Wholesale funds Bonds and other securities + Subordinated liabilities + Monetary market operations + Deposits from credit institutions + ECB
46 REOs Sum of Foreclosed Assets and Real Estate Investments

15
Quarterly financial report First quarter 2020
Disclaimer
This report (the “Report”) has been prepared by and is the responsibility of Grupo Cooperativo Cajamar.
The information contained in this Report has not been independently verified and some of it is in summary form. No representation or warranty, express or implied, is
made by Banco de Crédito Cooperativo (BCC) or any of its affiliates (Grupo Cooperativo Cajamar), nor by their directors, officers, employees, representatives or
agents as to, and no reliance should be placed on, the fairness, accuracy, completeness or correctness of the information or opinions expressed herein. Neither BCC
nor any of its affiliates, nor their respective directors, officers, employees, representatives or agents shall have any liability whatsoever (in negligence or otherwise) for
any direct or consequential loss, damages, costs or prejudices whatsoever arising from the use of the Report or its contents or otherwise arising in connection with the
Report, save with respect to any liability for fraud, and expressly disclaim any and all liability whether direct or indirect, express or implied, contractual, tortious, statutory
or otherwise, in connection with the accuracy or completeness of the information or for any of the opinions contained herein or for any errors, omissions or misstatements
contained in the Report.
BCC cautions that this Report may contain forward-looking statements with respect the macroeconomic and financial sector outlook. While these forward-looking
statements represent Grupo Cooperativo Cajamar’s judgment and future expectations, nevertheless certain risks, uncertainties and other important factors could cause
actual developments and results to differ materially from the expectations.
The information contained in the Report, including but not limited to forward-looking statements, is provided as of the date hereof and is not intended to give any
assurances as to future results. No person is under any obligation to update, complete, revise or keep current the information contained in the Report, whether as a
result of new information, future events or results or otherwise. The information contained in the Report may be subject to change without notice and must not be relied
upon for any purpose.
This Report contains financial information derived from Grupo Cooperativo Cajamar’s unaudited financial statements for the first quarter 2020 and the first, second,
third and fourth quarters 2019.. None of this financial information has been audited by the external auditors. The financial information has been prepared in accordance
with International Financial Reporting Standards (IFRS) and Grupo Cooperativo Cajamar’s internal accounting criteria so as to present fairly the nature of its business.
Those criteria are not subject to any regulation and may include estimates and subjective valuations which, if a different methodology were used, could result in
significant differences in the information presented.
In addition to the financial information prepared in accordance with International Financial Reporting Standards (IFRS), this Report includes Alternative Performance
Measures (APMs), as defined in the Guidelines on Alternative Performance Measures published on 5 October 2015 by the European Securities and Markets Authority
(ESMA/2015/1415es). These APMs are based on Grupo Cooperativo Cajamar’s financial statements but are not defined or specified within the applicable financial
reporting framework and so have not been audited and are not fully auditable. APMs are used to provide a better understanding of Grupo Cooperativo Cajamar’s
financial performance but must be regarded as additional information. On no account are they a substitute for the financial statements prepared in accordance with
IFRS. Moreover, the way in which Grupo Cooperativo Cajamar defines and calculates its APMs may differ from the way they are defined and calculated by other
entities that use similar measures, so these APMs may not be comparable between entities. For a fuller understanding of the APMs used in this Report, see the
previous section, “Alternative Performance Measures Glossary”.
Market and competitive position data in the Report has generally been obtained from industry publications and surveys or studies conducted by third-party sources.
Peer firm information presented herein has been taken from peer firm public reports, though none of them is referred to by name. There are limitations with respect to
the availability, accuracy, completeness and comparability of such data. Grupo Cooperativo Cajamar has not independently verified such data and can provide no
assurance as to its accuracy or completeness. Certain statements in the Report regarding the market and competitive position data are based on internal analyses by
the Group, which involve certain assumptions and estimates. These internal analyses have not been verified by any independent source and there can be no assurance
that the assumptions or estimates are accurate. Accordingly, undue reliance should not be placed on any of the industry, market or Grupo Cooperativo Cajamar
competitive position data contained in the Report.
The distribution of this Report in certain jurisdictions may be restricted by law. Recipients of this Report should inform themselves about and observe such restrictions.
Grupo Cooperativo Cajamar disclaims any liability for the distribution of this Report by any of its recipients. Grupo Cooperativo Cajamar cannot be held responsible for
the use, valuations, opinions, expectations or decisions which might be adopted by third parties following the publication of this Report. This Report does not constitute
or form part of, and should not be construed as, (i) an offer, solicitation or invitation to subscribe for, sell or issue, underwrite or otherwise acquire any securities, nor
shall it, or the fact of its communication, form the basis of, or be relied upon in connection with, or act as any inducement to enter into any contract or commitment
whatsoever with respect to any securities; or (ii) any form of financial opinion, recommendation or investment advice with respect to any securities.
By receiving or accessing this Report you accept and agree to be bound by the foregoing terms, conditions and restrictions.