financial report - euronext.com · as a % of revenue 8.1% 6.6% 1.4 pt recurring operating profit...
TRANSCRIPT

Financial Report
Year ended December 2015
CONTENT
1. Annual Activity Report 2. Consolidated Statement of Financial Position
3. Consolidated Income Statement
4. Consolidated Statement of Comprehensive Income
5. Consolidated Statement of Changes in Equity
6. Consolidated Statement of Cash Flow
Page 1 of 4
Paris – March 10, 2016
Net profit up 42% to €15.3 million
Recommended dividend up 50% at €0.30 per share
Successful implementation of profitable growth strategy
Once again exceeding its performance targets, Chargeurs has confirmed the strength of its fundamentals:
- Excellent operating momentum, driving a robust 34% increase in recurring operating profit
- A balanced geographic footprint and positive earnings contributions by all of the Group's businesses
- A stronger financial position, representing a solid base for significant future growth.
In 2015, Chargeurs successfully transitioned to new ownership and governance structures. The Group intends to
hold firm to its profitable growth strategy in 2016 in order to consolidate its global leadership positions.
The Board of Directors of Chargeurs met on March 9, 2016 under the chairmanship of Michaël Fribourg to approve the
2015 consolidated financial statements.
"2015 was a year of consolidation and successful transition for Chargeurs. The Group gained new stature, thanks to sharply
improved manufacturing and financial performance and the long-term engagement of its new reference shareholder.
Driven by a three-pronged commitment to performance, discipline and ambition, Chargeurs is now in good shape to
deploy its strategy of operational excellence, succeed in what promises to be a challenging year and, in this way, consolidate
its global leadership positions over the longer term," said Michaël Fribourg, Chairman and Chief Executive Officer.
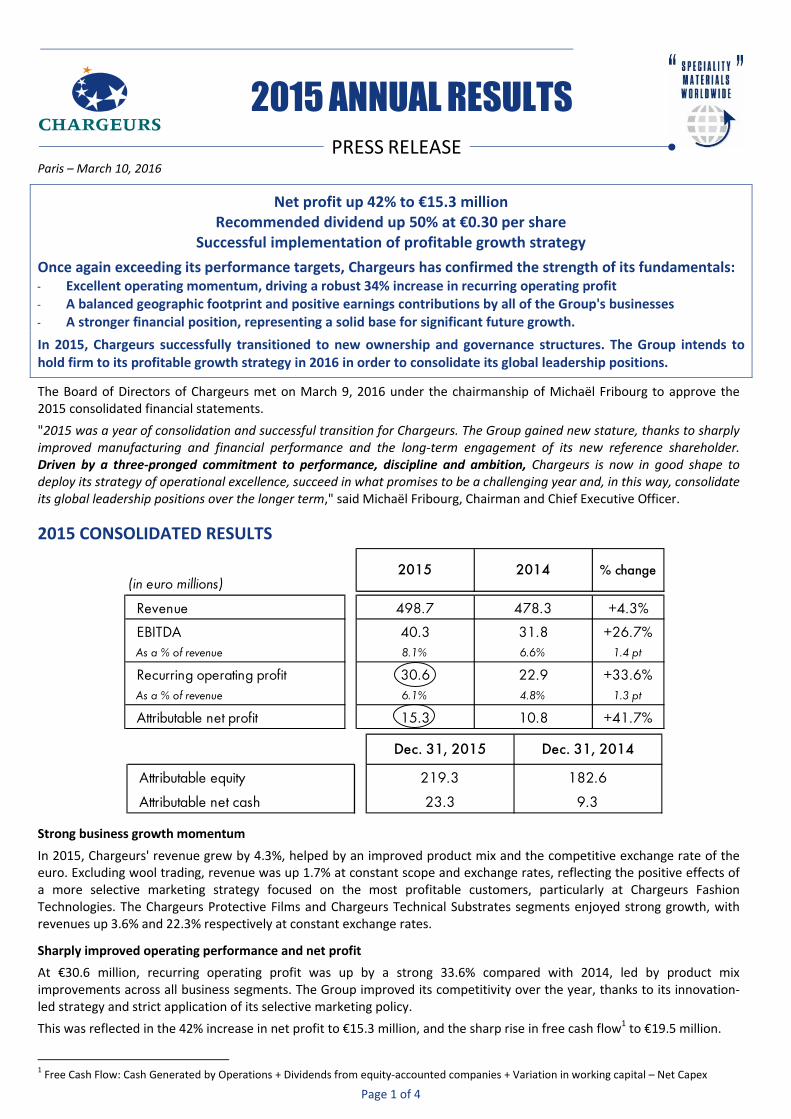
2015 CONSOLIDATED RESULTS
Strong business growth momentum
In 2015, Chargeurs' revenue grew by 4.3%, helped by an improved product mix and the competitive exchange rate of the
euro. Excluding wool trading, revenue was up 1.7% at constant scope and exchange rates, reflecting the positive effects of
a more selective marketing strategy focused on the most profitable customers, particularly at Chargeurs Fashion
Technologies. The Chargeurs Protective Films and Chargeurs Technical Substrates segments enjoyed strong growth, with
revenues up 3.6% and 22.3% respectively at constant exchange rates.
Sharply improved operating performance and net profit
At €30.6 million, recurring operating profit was up by a strong 33.6% compared with 2014, led by product mix
improvements across all business segments. The Group improved its competitivity over the year, thanks to its innovation-
led strategy and strict application of its selective marketing policy.
This was reflected in the 42% increase in net profit to €15.3 million, and the sharp rise in free cash flow1 to €19.5 million.
1 Free Cash Flow: Cash Generated by Operations + Dividends from equity-accounted companies + Variation in working capital – Net Capex
(in euro millions)
Revenue 498.7 478.3 +4.3%
EBITDA 40.3 31.8 +26.7%
As a % of revenue 8.1% 6.6% 1.4 pt
Recurring operating profit 30.6 22.9 +33.6%
As a % of revenue 6.1% 4.8% 1.3 pt
Attributable net profit 15.3 10.8 +41.7%
2015 2014 % change
Attributable equity 219.3 182.6
Attributable net cash 23.3 9.3
Dec. 31, 2015 Dec. 31, 2014
**
2015 ANNUAL RESULTS
PRESS RELEASE
Page 2 of 4
A PERFORMANCE DRIVEN BY ALL SEGMENTS
Chargeurs Protective Films: a record high performance
Chargeurs Protective Films' innovation-led strategy, underpinned by its technological differentiation and service-minded
expertise, helped to drive a 10% increase in revenue to €227.2 million in 2015. This represented a record high performance
for the segment, sustained by effective management of the product mix and a global footprint that enabled the segment to
benefit from favorable exchange rates.
Revenue growth contributed to an even faster increase in recurring operating profit, which rose by 30% to €21.8 million in
2015 from €16.8 million the previous year.
Chargeurs Fashion Technologies: a promising strategic focus on selective marketing
Chargeurs Interlining has been renamed Chargeurs Fashion Technologies to underscore the Group's experience and
technical expertise in global manufacturing of high value-added interlinings
In 2015, Chargeurs Fashion Technologies reported revenue up 4% at €157.5 million. The increase was attributable to an
assertive marketing focus on the most profitable business, which drove an improvement in the product mix, and to the
favorable overall currency effect resulting from its global presence.
Selective marketing combined with a strategy to reduce fixed costs led to a sharp 38% rise in the segment's recurring
operating profit to €5.5 million.
(in euro millions) 2015 2014 % change
Revenue 227.2 206.6 +10%
At constant scope and exchange rates +3.6%
EBITDA 26.8 21.4 +25.2%
As a % of revenue 11.8% 10.4%
Recurring operating profit 21.8 16.8 +29.8%
As a % of revenue 9.6% 8.1%
(in euro millions) 2015 2014 * % change
Revenue 157.5 150.9 4.4%
At constant scope and exchange rates (3,5)%
EBITDA 9.6 7.7 24.7%
As a % of revenue 6.1% 5.1%
Recurring operating profit 5.5 4.0 37.5%
As a % of revenue 3.5% 2.7%
* Restated to reflect separation out of Chargeurs Technical Substrates
Page 3 of 4
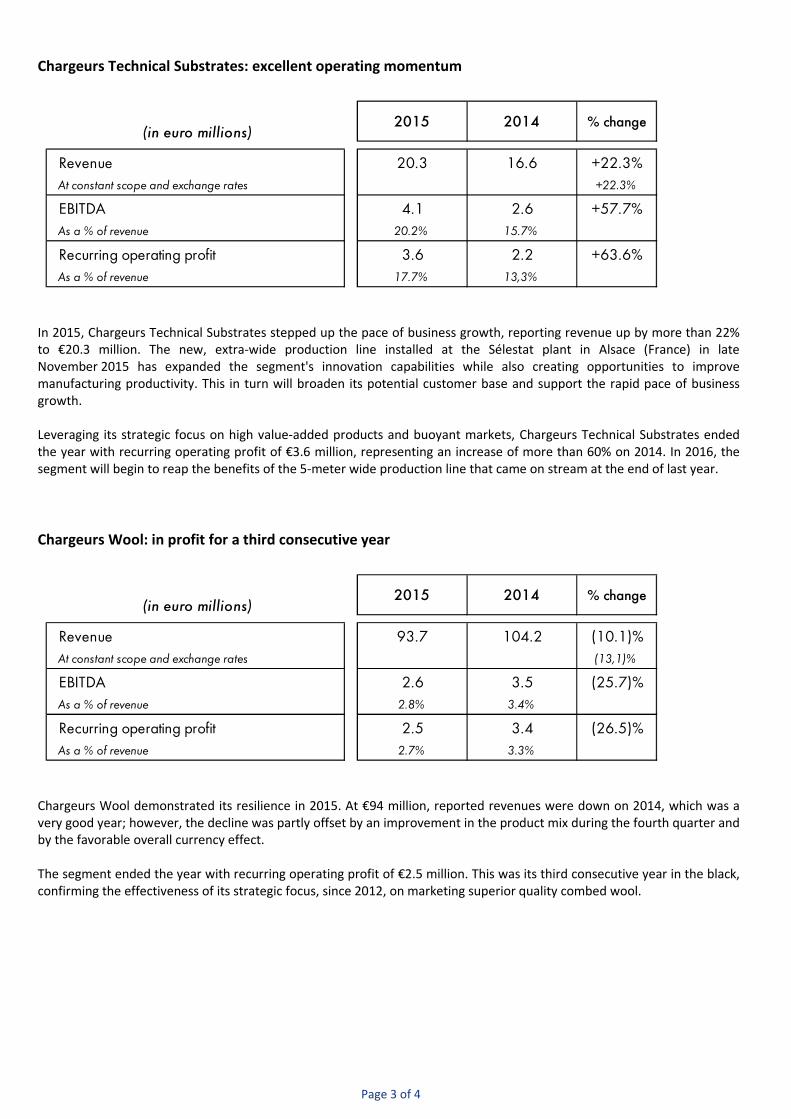
Chargeurs Technical Substrates: excellent operating momentum
In 2015, Chargeurs Technical Substrates stepped up the pace of business growth, reporting revenue up by more than 22%
to €20.3 million. The new, extra-wide production line installed at the Sélestat plant in Alsace (France) in late
November 2015 has expanded the segment's innovation capabilities while also creating opportunities to improve
manufacturing productivity. This in turn will broaden its potential customer base and support the rapid pace of business
growth.
Leveraging its strategic focus on high value-added products and buoyant markets, Chargeurs Technical Substrates ended
the year with recurring operating profit of €3.6 million, representing an increase of more than 60% on 2014. In 2016, the
segment will begin to reap the benefits of the 5-meter wide production line that came on stream at the end of last year.
Chargeurs Wool: in profit for a third consecutive year
Chargeurs Wool demonstrated its resilience in 2015. At €94 million, reported revenues were down on 2014, which was a
very good year; however, the decline was partly offset by an improvement in the product mix during the fourth quarter and
by the favorable overall currency effect.
The segment ended the year with recurring operating profit of €2.5 million. This was its third consecutive year in the black,
confirming the effectiveness of its strategic focus, since 2012, on marketing superior quality combed wool.
(in euro millions) 2015 2014 % change
Revenue 20.3 16.6 +22.3%
At constant scope and exchange rates +22.3%
EBITDA 4.1 2.6 +57.7%
As a % of revenue 20.2% 15.7%
Recurring operating profit 3.6 2.2 +63.6%
As a % of revenue 17.7% 13,3%
(in euro millions) 2015 2014 % change
Revenue 93.7 104.2 (10.1)%
At constant scope and exchange rates (13,1)%
EBITDA 2.6 3.5 (25.7)%
As a % of revenue 2.8% 3.4%
Recurring operating profit 2.5 3.4 (26.5)%
As a % of revenue 2.7% 3.3%
Page 4 of 4
AN EVEN STRONGER FINANCIAL POSITION
Chargeurs' robust financial position was further strengthened during the year, with consolidated equity (excluding minority
interests) rising by 20.1% to €219.3 million at December 31, 2015 from €182.6 million at the previous year-end.
The convertible bonds issued in April 2010 matured on January 1, 2016. Of the 415,083 convertible bonds included in the
original issue, 99.7% (413,798 bonds) were converted, leading to the issue of 12,589,047 Chargeurs shares and raising the
total number of shares outstanding to 22,966,144 as of January 11, 2016.
DIVIDEND
In recognition of the Group's sharply improved operating performance and stronger fundamentals, the Board of Directors
has decided to recommend paying a 2015 dividend of €0.30 per share to the Annual General Meeting on May 4, 2016. The
substantial 50% increase compared to the 2014 dividend gives a +4.2% yield based on the 2015 average share price.
The dividend timeline will be as follows:
- Ex-dividend date: May 17, 2016
- Dividend payment date: May 19, 2016
OUTLOOK
The 74% gain in the Chargeurs share price during 2015 and the shares' transfer from compartment C to compartment B of
Euronext Paris in January 2016 recognize the Group's solid performance in 2015.
With its robust business model, outstanding operating momentum and solid financial position at December 31, 2015,
Chargeurs is well placed to remain during 2016 on a profitable growth trajectory despite the volatile macro-economic
environment. Recurring operating profit is set to grow and free cash flow should remain high, allowing the Group to
consolidate its leadership positions in specialty materials.
2016 Financial Calendar
Ordinary and Extraordinary General Meeting Monday, March 14
First-quarter 2016 financial information Wednesday, May 4
Annual General Meeting Wednesday, May 4
2016 interim results Friday, September 9
Third-quarter 2016 financial information Thursday, November 10
CONTACT
Financial Communications
Tel: +33 (0)1 47 04 13 40
E-mail: [email protected]
Website: www.chargeurs.fr
ABOUT CHARGEURS
Chargeurs is a global manufacturing and services group with leading positions in four segments:
temporary surface protection, technical substrates, garment interlinings, and combed wool.
It has over 1,500 employees based in 32 countries on five continents, who serve a diversified customer
base spanning more than 45 countries.
In 2015, consolidated revenue totaled almost €500 million, of which nearly 93% was generated outside
France.

Consolidated Statement of Financial Position
(in euro millions)
Assets
12/31/2015
12/31/2014
Non-current assets Intangible assets
78.5
72.6
Property, plant and equipment
55.9
50.3
Investments in associates and joint ventures
18.1
27.1
Deferred tax assets
27.1
13.5
Non-current financial assets - Investments in non-consolidated companies
0.4
0.8
- Long-term loans and receivables
1.7
2.2
Derivative financial instruments
-
-
Other non-current assets
0.5 0.6
182.2
167.1
Current assets Inventories and work-in-progress
101.0
98.2
Trade receivables
44.6
44.2
Factored receivables (*)
48.9
43.9
Derivative financial instruments
1.1
0.6
Other receivables
24.9
24.7
Cash and cash equivalents
97.7
72.7
318.2
284.3
Assets held for sale
-
0.2
Total assets
500.4
451.6
Equity and Liabilities
12/31/2015
12/31/2014
Equity Attributable to owners of the parent Share capital
3.7
2.6
Share premium account
53.0
42.2
Other reserves and retained earnings
126.1
115.8
Profit for the period
15.3
10.8
Treasury stock
(0.2)
(0.2)
Translation reserve
21.4
11.4
219.3
182.6
Non-controlling interests
3.1
3.8
Total equity
222.4
186.4
Non-current liabilities Convertible bonds
-
11.2
Long-term borrowings
49.1
42.0
Deferred tax liabilities
-
-
Pension and other post-employment benefit obligations
14.6
15.5
Provisions
0.7
0.4
Other non-current liabilities
8.1
10.3
72.5
79.4
Current liabilities Trade payables
90.6
88.6
Other payables
38.9
30.6
Factoring liabilities (*)
48.9
43.9
Current income tax liability
1.5
0.6
Derivative financial instruments
0.3
0.7
Short-term portion of long-term borrowings
8.6
6.7
Short-term bank loans and overdrafts
16.7
14.7
205.5
185.8
Liabilities related to assets held for sale
-
-
Total equity and liabilities
500.4
451.6
* Related to receivables for which title has been transferred.

Consolidated Income Statement (in euro millions)
Year ended December 31
2015
2014
Revenue
498.7
478.3
Cost of sales
(378.2)
(370.9)
Gross profit
120.5
107.4
Distribution costs
(53.9)
(49.7)
Administrative expenses
(32.1)
(30.9)
Research and development costs
(3.9)
(3.9)
Recurring operating profit
30.6
22.9
Other operating income
0.2
0.2
Other operating expense
(6.8)
(1.7)
Operating profit
24.0
21.4
Finance costs, net
(3.5)
(3.7)
Other financial expense
(2.3)
(2.9)
Other financial income
0.5
0.3
Net financial expense
(5.3)
(6.3)
Share of profit/(loss) of associates
(10.7)
(0.3)
Pre-tax profit for the period
8.0
14.8
Income tax expense
7.5
(4.1)
Profit from continuing operations
15.5
10.7
Profit/(loss) from discontinued operations
-
0.2
Profit for the period
15.5
10.9
Attributable to: Owners of the parent
15.3
10.8
Non-controlling interests
0.2
0.1
Earnings per share (in euros)
Basic earnings per share From continuing operations
0.78
0.67
From discontinued operations
-
0.01
From continuing and discontinued operations
0.78
0.68
Diluted earnings per share From continuing operations
0.78
0.51
From discontinued operations
-
0.01
From continuing and discontinued operations
0.78
0.52
Weighted average number of shares outstanding
19,615,969
15,659,563

Consolidated Statement of Comprehensive Income (in euro millions)
Year ended December 31
2015
2014
Profit for the period
15.5 10.9
Exchange differences on translating foreign operations
10.2 14.8
Cash flow hedges
0.7 (0.4)
Total items that may be reclassified subsequently to profit or loss
10.9
14.4
Other components of other comprehensive income
0.8 (0.1)
Actuarial gains and losses on post-employment benefit obligations
0.8 (3.0)
Income tax on items that will not be reclassified to profit or loss
(0.1) -
Total items that will not be reclassified to profit or loss
1.5
(3.1)
Other comprehensive income for the period, net of tax
12.4
11.3
Total comprehensive income for the period
27.9
22.2
Attributable to:
Owners of the parent 27.5 21.7
Non-controlling interests 0.4 0.5

Consolidated Statement of Changes in Equity (in euro millions)
Share
capital
Share premium account
Other reserves
and retained earnings
Translation reserve
Cash flow
hedges
Actuarial gains and losses on
post-employment
benefit obligations
Treasury stock
Total equity attributable
to owners of the parent
Non-controlling
interests
Total equity
At December 31, 2013 2.3 39.5 122.1 (3.0) 0.0 (2.8) (0.2) 157.9 3.3 161.2
Issue of share capital 0.3 2.7
3.0
3.0
Profit for the period
10.8
10.8 0.1 10.9
Other comprehensive income for the period
(0.1) 14.4 (0.4) (3.0)
10.9 0.4 11.3
At December 31, 2014 2.6 42.2 132.8 11.4 (0.4) (5.8) (0.2) 182.6 3.8 186.4
Issue of share capital 1.1 10.8
11.9
11.9
Payment of dividends
(3.2)
(3.2)
(3.2)
Profit for the period
15.3
15.3 0.2 15.5
Effect of changes in scope of consolidation (*)
0.5
0.5 (1.1) (0.6)
Other comprehensive income for the period
0.8 10.0 0.7 0.7
12.2 0.2 12.4
At December 31, 2015 3.7 53.0 146.2 21.4 0.3 (5.1) (0.2) 219.3 3.1 222.4
* Corresponding to the first-time consolidation of LP Romania, which was previously included in “Investments in non-consolidated companies”.
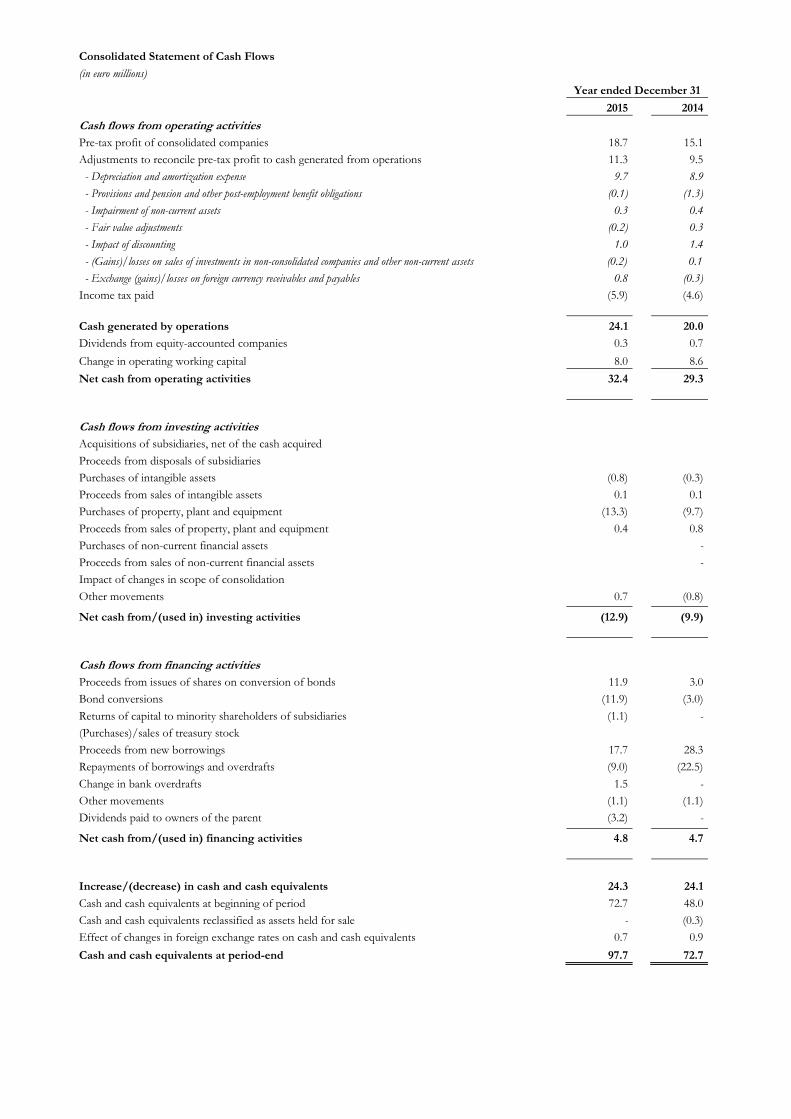
Consolidated Statement of Cash Flows
(in euro millions)
Year ended December 31
2015
2014
Cash flows from operating activities Pre-tax profit of consolidated companies
18.7
15.1
Adjustments to reconcile pre-tax profit to cash generated from operations
11.3 9.5
- Depreciation and amortization expense
9.7
8.9
- Provisions and pension and other post-employment benefit obligations
(0.1)
(1.3)
- Impairment of non-current assets
0.3
0.4
- Fair value adjustments
(0.2)
0.3
- Impact of discounting
1.0
1.4
- (Gains)/losses on sales of investments in non-consolidated companies and other non-current assets
(0.2)
0.1
- Exchange (gains)/losses on foreign currency receivables and payables
0.8
(0.3)
Income tax paid
(5.9)
(4.6)
Cash generated by operations
24.1 20.0
Dividends from equity-accounted companies
0.3
0.7
Change in operating working capital
8.0
8.6
Net cash from operating activities
32.4 29.3
Cash flows from investing activities Acquisitions of subsidiaries, net of the cash acquired Proceeds from disposals of subsidiaries Purchases of intangible assets
(0.8)
(0.3)
Proceeds from sales of intangible assets
0.1
0.1
Purchases of property, plant and equipment
(13.3)
(9.7)
Proceeds from sales of property, plant and equipment
0.4
0.8
Purchases of non-current financial assets
-
Proceeds from sales of non-current financial assets
-
Impact of changes in scope of consolidation Other movements
0.7
(0.8)
Net cash from/(used in) investing activities
(12.9) (9.9)
Cash flows from financing activities Proceeds from issues of shares on conversion of bonds
11.9
3.0
Bond conversions
(11.9)
(3.0)
Returns of capital to minority shareholders of subsidiaries
(1.1)
-
(Purchases)/sales of treasury stock Proceeds from new borrowings
17.7
28.3
Repayments of borrowings and overdrafts
(9.0)
(22.5)
Change in bank overdrafts
1.5
-
Other movements
(1.1)
(1.1)
Dividends paid to owners of the parent
(3.2)
-
Net cash from/(used in) financing activities
4.8 4.7
Increase/(decrease) in cash and cash equivalents
24.3 24.1
Cash and cash equivalents at beginning of period
72.7
48.0
Cash and cash equivalents reclassified as assets held for sale
-
(0.3)
Effect of changes in foreign exchange rates on cash and cash equivalents
0.7
0.9
Cash and cash equivalents at period-end
97.7 72.7