financial performance of sugar companies in kenya
TRANSCRIPT

THE EFFECT OF OWNERSHIP STRUCTURE ON THE FINANCIAL PERFORMANCE OF SUGAR COMPANIES IN
KENYA
BY
KIVINDU ZACHEUS MBATHA
A MANAGEMENT RESEARCH PROJECT SUBMITTED IN PARTIAL FULFILMENT OF THE REQUIREMENTS FOR THE
DEGREE OF MASTER OF BUSINESS ADMINISTRATION, UNIVERSITY OF NAIROBI
OCTOBER 2012

DECLARATION
This management research project is my original work and has not been presented for examination to any other University.
Signed: .Zacheus M. Kivindu D61/P/8374/03
JbJ Date: /7. /<-' / (Z.
This management research project has been submitted for examination with my approval as the University Supervisor.
Lecturer,Department of Finance and Accounting, School of Business,University of Nairobi
Date: (2,) n 1 12̂

DEDICATION
To
My dear wife Roselyne Kamonya
Your unwavering support, continued encouragement and spirited motivation makes mecomplete
My lovely children Reginald and Daishah
That this may greatly inspire you to surpass my achievements
My great mother Loise Mbeneka
That this be a gift to you for your relentless care and the long distances you walked tovisit me in school
My best Kaumoni Primary School classmate Mualuko Nzioki
Who provided healthy competition that kept me on my toes in laying a firm academicfoundation
My Tala High School teachersWho always cheered me to lighten brighter the academic flame.

ACKNOWLEDGEMENTS
Although this MBA project forms part of my own academic work, I wish to extend my heartfelt gratitude to the following whom I am particularly indebted to:
The Most High God for His sufficient grace, wisdom and strength in undertaking this study. He will always remain my firm rock of refuge.My inimitable supervisor Mr. Joseph Barasa for his profound perceptions, creative ideas and extreme patience that guided, corrected and advised me throughout the research project. May he continue to be a supervisor of the happiest magnitude.Roselyne Kamonya, my wife who made sure I attended all classes, did assignments on time and read enough for examinations. I owe her the gift of love.My son Reginald and daughter Daishah who offered to keep me company at night while studying and always promised gifts if I did well in examinations. I owe them revenge gifts every time they excel in their examinations.All my colleagues at Kenya Sugar Board especially Silas Nyaga who gave me psyche to work on the project and stood in for me in office while I was away in pursuit this noble course. Not forgetting Josephine Ogutu who selflessly ransacked the archives to ensure that I got all the data I needed. I owe them an abiding debt.The accountants of various sugar companies for their cooperation and assistance during data collection. They are an indispensable source.All the lecturers and staff of the school of Business for ensuring that I got all the assistance and attention I needed. May God bless them to help many others.The late Reginald Bower of London for generously sponsoring my High School education without which I would not have come this far. May his soul rest in peace.And all who contributed in one way or another towards the realization o f this noble work. God bless all.
iv

ABSTRACTThe objective of this study was to analyze and evaluate whether the form of business ownership has any significant effect on the financial performance of sugar companies in the Kenyan sugar industry.
The study was driven by the fact that the history of the Kenyan sugar industry has been revolving around sugar shortages, inefficiencies, inability to compete with imported sugar, perennial losses and political interferences. Despite the challenges facing the industry, more new private companies are being registered and are yet to start milling operations. Of the nine (9) sugar mills that operated within the study period, five (5) are state-owned and four (4) are private. Despite these continued investments, self- sufficiency in sugar has remained elusive over the years as consumption continues to outstrip supply.
The study analyzed data obtained from the Annual Financial Statements of the sugar companies for the years 1993 to 2010 using multivariate regression analysis.
The findings of the study showed that ownership structure by shareholding did not seem to influence performance. Thus the controlling shareholding held by the government in the public companies and that held by investors in private companies equally were found to be insignificant in influencing performance. Additionally, where there were foreign investors, the variable showed no material relationship to performance. Instead, internal factors of the companies which included the ability to generate income, the efficiency of assets, liquidity, leverage, workforce level and overall efficiency were key to realizing impressive performances especially for the private companies than the state-owned entities.
The study concludes that internal factors of the companies may be held accountable for differences in performance as the independent variables proved to be more reliable in measuring financial performance for private companies than for the public ones.
v

TABLE OF CONTENTSCHAPTER......................................................................................................................PAGEDeclaration..............................................................................................................................iiDedication...............................................................................................................................iiiAcknowledgements................................................................................................................ivAbstract................................................................................................................................... vTable of contents................................................................................................................... viList of tables........................................................................................................................... ixList of graphs...........................................................................................................................xList of abbreviations and acronyms...................................................................................xiCHAPTER ONE: INTRODUCTION.................................................................................11.1 Background.........................................................................................................................11.1.1 Financial performance evaluation............................................................................. 21.1.2 Ownership structure.....................................................................................................31.1.3 Relationship between ownership structure and financial performance...................41.1.4 Kenyan sugar industry................................................................................................ 61.2 Statement of the problem...................................................................................................71.3 Objective of the study........................................................................................................91.4 Value of the study.............................................................................................................. 9CHAPTER TWO: LITERATURE REVIEW..................................................................112.1 Introduction.......................................................................................................................H2.2 Theoretical framework..................................................................................................... 112.2.1 Ownership structure theories....................................................................................... 112.2.2 Performance management theories.............................................................................. 142.3 Empirical literature review............................................................................................16
vi
2.3.1 Global studies 162.3.2 Local studies................................................................................................................ 192.4 Financial performance measures.................................................................................... 202.4.1 Types of financial performance measures.................................................................. 202.4.2 Limitations of financial performance measures.........................................................212.5 Forms o f business ownership...........................................................................................222.5.1 Sole proprietorship........................................................................................................222.5.2 Partnership.....................................................................................................................222.5.3 Company........................................................................................................................ 222.5.4 State-owned entities......................................................................................................232.5.5 “Other organizations”...................................................................................................232.6 Conclusion........................................................................................................................24CHAPTER THREE: RESEARCH METHODOLOGY............................................... 253.1 Research design................................................................................................................253.2 Hypothesis......................................................................................................................... 253.3 Population.........................................................................................................................253.4 Data collection..................................................................................................................253.5 Data analysis.....................................................................................................................263.6 Diagnostic tests.................................................................................................................283.6.1 T-tests.............................................................................................................................283.6.2 Multiple coefficient of Determination, R2.................................................................. 28CHAPTER FOUR: RESEARCH FINDINGS AND INTERPRETATION........... 294.1 Introduction................................................................................................................... 294.2 Correlation coefficients results...................................................................................... 294.3 Regression results........................................................................................................... 39
vii
CHAPTER FIVE: SUMMARY AND CONCLUSIONS............................................475.1 Introduction.....................................................................................................................475.2 Summary findings........................................................................................................... 475.3 Conclusion.......................................................................................................................485.4 Recommendations........................................................................................................... 495.5 Limitation of the study................................................................................................... 505.6 Suggestion for further research.......................................................................................51REFERENCES....................................................................................................................53APENDIXES (1-15).............................................................................................................59
viii
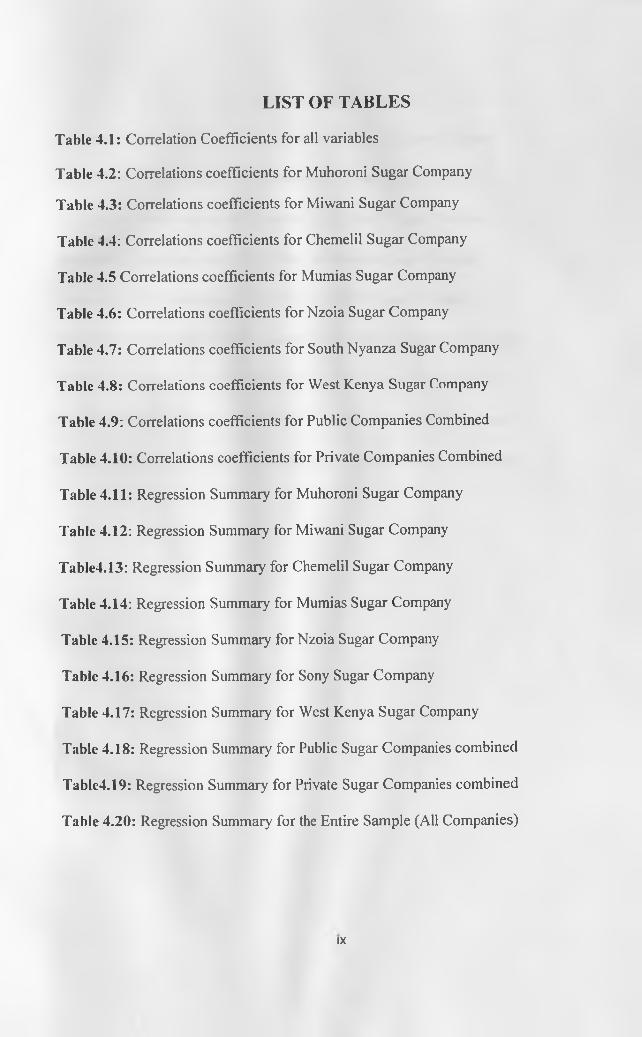
LIST OF TABLESTable 4.1: Correlation Coefficients for all variablesTable 4.2: Correlations coefficients for Muhoroni Sugar CompanyTable 4.3: Correlations coefficients for Miwani Sugar CompanyTable 4.4: Correlations coefficients for Chemelil Sugar Company Table 4.5 Correlations coefficients for Mumias Sugar Company Table 4.6: Correlations coefficients for Nzoia Sugar Company Table 4.7: Correlations coefficients for South Nyanza Sugar Company Table 4.8: Correlations coefficients for West Kenya Sugar Company Table 4.9: Correlations coefficients for Public Companies Combined Table 4.10: Correlations coefficients for Private Companies Combined Table 4.11: Regression Summary for Muhoroni Sugar Company Table 4.12: Regression Summary for Miwani Sugar Company Table4.13: Regression Summary for Chemelil Sugar Company Table 4.14: Regression Summary for Mumias Sugar Company Table 4.15: Regression Summary for Nzoia Sugar Company Table 4.16: Regression Summary for Sony Sugar Company Table 4.17: Regression Summary for West Kenya Sugar Company Table 4.18: Regression Summary for Public Sugar Companies combined Table4.19: Regression Summary for Private Sugar Companies combined Table 4.20: Regression Summary for the Entire Sample (All Companies)
IX

LIST OF GRAPHSGraph 4.1: Trend analysis of Variables for Muhoroni Sugar Company
Graph 4.2: Trend analysis of Variables for Miwani Sugar Company
Graph 4.3: Trend analysis of Variables for Chemelil Sugar Company
Graph 4.4: Trend analysis of Variables for Mumias Sugar Company
Graph 4.5: Trend analysis of Variables for Nzoia Sugar Company
Graph 4.6: Trend analysis of Variables for South Nyanza Sugar Company
Graph 4.7: Trend analysis of Variables for West Kenya Sugar Company
Graph 4.8: Trend analysis of Variables for Public Companies Combined
Graph 4.9: Trend analysis of Variables for Private Companies Combined

LIST OF ABBREVIATIONS AND ACRONYMSATR : Acid Test RatioBET : Beta CoefficientCAPM : Capital Asset Pricing ModelCR : Current RatioCSH : Controlling ShareholderDAR : Debt to Assets RatioEPS : Earnings per ShareFI : Foreign InvestorsITAR : Inventory to Total Assets RatioKSB : Kenya Sugar BoardM & M : Modigiliani and MillerNPM : Net Profit MarginNSE : Nairobi Securities ExchangeLLC : Limited Liability CompanyLSER : Logarithm o f Sales to Employees RatioLTA : Logarithm of Total AssetsLTS : Logarithm o f Total SalesP/E : Price Earnings RatioROA : Return on AssetsROCE : Return on Capital EmployedROE : Return on EquitySCP : Structural Conduct PerformanceSDF : Sugar Development Fund
XI

CHAPTER ONEINTRODUCTION
1.1 BACKGROUND OF THE STUDYThe form of business ownership describes how a business is legally set up. In other words, the form of business ownership is the business’ legal structure. Norman (2010) quote from John D. Rockfeller states that “A friendship founded on business is a good deal better than a business founded on friendship”. According to Madura (2007), entrepreneurs must decide on the type of ownership that will offer the greatest benefits as the form chosen can affect the profitability, risk or value of the firm. Basically, the structure o f ownership will have influence on the decision making, control, sourcing of funds and the risk acceptance levels of the business entity.
Carysforth (1995) classifies business organizations into three broad categories based on ownership to include private enterprises, state-owned enterprises and “other organizations”. Private enterprises are the privately owned businesses whose activities are unregulated by state ownership or control. Further classification of the private enterprises includes sole proprietorships, partnerships, private limited companies and public limited companies.
State-owned enterprises which form the second category according to Carysforth (1995), can be described as those legal entities created by a government to undertake commercial activities on behalf of an owner government. Entities in this category can also be referred to as government-owned corporations, state enterprises, publicly-owned corporations or parastatals. Mainly, these organizations are meant to provide essential goods or services which may not be availed to all the citizens if left on the hands o f private businesses. In this category of state-owned enterprises are the local authorities, central government departments and public corporations.
The third category of business ownership, classified as “other organizations” include clubs, charitable organizations and co-operatives. These are a formation by a group of
1

members with a common goal. The objective of this category is not to pursue profits but rather meet the interests of the members.
1.1.1 Financial Performance EvaluationFinancial performance can be described as the measurement of the results of a firm’s policies and operations in monetary terms. This term is also used as a general measure of a firm’s overall financial health over a given period o f time, and can be used to compare similar firms across the same industry or to compare industries or sectors in aggregation.
Financial performance evaluation represents one o f the key functions o f any business owner or manager. The most valuable information to most users of financial statements, however, concerns what probably will happen in the future. The purpose of financial statements analysis is to assist statement users in predicting the future by means of comparison, evaluation and trend analysis.
The concept of evaluation of financial performance has become a great concern to the shareholders, managers, potential investors, creditors and other stakeholders. This explains why auditors are hired by companies to give an independent opinion on their performance and financial status. The government has also taken a step towards monitoring financial performance of its ministries and state corporations by having financial targets as part of the performance contracts introduced in the recent reforms. The timely preparation and availability of financial statements assists top management in the process of examining the condition and performance of a company. This process, known as Financial Performance Evaluation, serves to identify the company’s strengths and weaknesses in terms of shillings and percentages.
The financial performance evaluation is designed to provide answers to a broad range of important questions, some of which include whether the company has enough cash to meet all its obligations; is it generating sufficient volume of sales to justify recent investment; does the company collect outstanding accounts from customers without creating burden on its cash flow; does the company make timely payments to suppliers to take advantage of discounts; does the company utilize the inventory in an efficient
2

manner; does the company have sufficient working capital; does the company maintain an adequate profit margin; and does the company produce sufficient return on investment? An effective financial performance evaluation system should be able to attain the goals of promoting goal congruence and coordination, communicating expectations, motivating, providing feedback and benchmarking (Horgren, Harrison & Oliver, 2009). In summary, every business, just like human beings, needs an annual “physical” check-up.
1.1.2 Ow nership structure
The ownership structure is defined by the distribution of equity with regard to votes and capital but also by the identity of the equity owners. These structures are of major importance in corporate governance because they determine the incentives of managers and thereby the economic efficiency of the corporations they manage (Jensen & Meckling, 1976). Ownership structure has influence on the entity’s expected financial returns and participation in decision making. A business ownership should be structured according to the needs of the owners and potentially liability that the business could incur. Business owners have to pick the structure that best meets their needs.
Most of the important factors to consider while deciding on the ownership structure are the potential risks, liabilities of the business, the formalities and expenses involved in establishing and maintaining the various business structures, income tax situation, and investment needs. In large part, the best ownership structure for a business depends on the type of services or products it will provide. If a business will engage in risky activities, it will almost surely want to form a business entity that provides personal liability protection ("limited liability"), which shields the personal assets from business debts and claims. A corporation or a limited liability company (LLC) is probably the best choice for this. Where the owner(s) don’t want to go through many formation formalities and incur high expenses, then the choice would be a sole proprietorship or partnership. Unlike other business forms, the corporate structure allows a business to sell ownership shares in the company through its stock offerings. This makes it easier to attract
3

investment capital and to hire and retain key employees by issuing employee stock options.
Various ideologies have been fronted with regards to the determinants of ownership structure. Although researchers conventionally treated ownership structure as an exogenous variable in explaining firm performance, Demsetz (1983) pointed out that the ownership structure might be an outcome influenced by the equilibrium of various cost advantages and disadvantages. Demsetz and Lehn (1985) found that ownership concentration is determined by a firm's risk level, regulations, and industry-specific factors, and that the hypothesized relationship from ownership concentration to firm performance became insignificant after controlling for these factors. Kole (1996) provided related evidence for this conjecture by showing that managers prefer equity compensation only when they expect their firms to perform well, suggesting that managerial ownership might be endogenous to compensation contracting practices. Similarly, Rajagopalan (1996) showed the relationship between executive compensation and performance is contingent upon the firm’s strategic context. Cho (1998) used the simultaneous equations estimation technique to show, for his sample, that corporate value affected ownership structure, while the reverse relationship did not hold. Loderer and Martin (1997) found that acquisition performance and firm value affected the size of managers’ stockholdings but not vice versa in their sample of acquisitions.
1.1.3 Relationship between ownership structure and financial performanceFirms are defined by a network of relationships representing contractual arrangements for financing, capital structure, managerial ownership and compensation. While it has been observed from the earliest of business history that these relationships have conflicts but virtually every party has professed to the overall objective, namely good performance of the business. The most prominent and crucial issue in discussion has been the ownership structure which became more sensitive when the concept of companies became popular. The intention behind every business is earning profit. Individuals invest in the businesses for earning profit. Businesses around the world need to be able to attract funding from
4

investors in order to expand and grow. Before investors decide to invest their funds in a particular business, they try to be as certain as they can be about the firm’s financial soundness and prospects.
Firms are likely to gravitate to ownership structures that yield the best performance. Those structures are likely to differ across industries or even across different firms in the same industry, so that one might expect little relationship between measures of ownership structure, such as concentration levels, and relative performance. Numerous empirical studies have tried to highlight the relationship between ownership structure and corporate performance. The results are sometimes contradictory. Some works showed a linear relation (Cole & Mehran, 1998) whereas other studies highlighted a non-linear relation (Morck, Shleifer & Vishny, 1988; McConnell & Servaes, 1990; Short & Keasey, 1999). From the studies done, three basic assumptions on ownership structure and performance of firms have emerged.
Under the first assumption, the greater the managerial ownership, the less inclined the managers are to divert resources away from value maximization. In other words, higher ownership by managers aligns the interest of the managers with that of the company. In other words, the greater the managerial ownership (i.e. larger the percentage of shares held by the directors o f the company), the better will be the company’s performance. This assumption is referred to as convergence of interest or incentive alignment (Jensen & Meckling, 1976).
In the second one according to Demsetz (1983), corporate performance depends on environmental constraints; it has nothing to do with the ownership structure and all structures are equal. So, performance has no relationship with the ownership structure and it is dependent on internal and external environment. This assumption that ownership structure has no influence over a firm’s performance is referred to as the '‘neutrality assumption”.
5

The last assumption, referred to as entrenchment, is that, the greater the percentage of shares held by the managers, the lesser the other shareholders can compel them to manage the firm in their (other stakeholders) interests. More equity ownership by the manager may decrease financial performance because managers with large ownership stakes may be so powerful that they do not have to consider other stakeholders interest. They may also be so wealthy that they no longer intend to maximize profit but get more utility from maximizing market share or technological leadership etc (Morck, Shleifer & Vishny, 1988).
1.1.4 Kenyan sugar IndustryThe development of the sugar industry in Kenya started with private investment at Miwani in 1922, followed by Ramisi Sugar Company in 1927. After independence, the government started playing a central role in the ownership, management and control of the industry. This led to the establishment of five state-owned sugar factories namely: Muhoroni (1966), Chemelil (1968), Mumias (1973), Nzoia (1978) and South Nyanza (1979). Three more private factories which include West Kenya (1981), Soin (2006) and Kibos Sugar and Allied industries (2004) joined later with Mumias Sugar Company being privatized in the year 2001. Another factory, Butali Sugar Company was registered in the year 2005 and started producing sugar in 2011. Other private mills which include Transmara Sugar Company (2006), Kwale International Sugar Company (2007) and Sukari Industries (2007) have been registered (Kenya Sugar Board Investment Guide).
The establishment of the state-owned mills was driven by a national desire to (i) accelerate social-economic development; (ii) address regional economic imbalances; (iii) increase Kenyan citizen’s participation in the economy; (iv) promote indigenous entrepreneurship; and (v) promote foreign investment through joint ventures. This desire was expressed in the Sessional Paper No. 10 of 1965 on African Socialism and its Application to Planning in Kenya (Kenya Sugar Industry Strategic Plan, 2010-2014).
Despite these investments, self-sufficiency in sugar has remained elusive over the years as consumption continues to outstrip supply. Total sugar production grew from 368,970
6

tonnes in 1981 to 523,652 tonnes in 2010. Domestic sugar consumption increased even faster, rising from 324,054 tonnes in 1981 to 772, 731 tonnes in 2007. Consequently, Kenya has remained a net importer of sugar with imports rising from 4,000 tonnes in 1984 to 258,578 tonnes in 2010. There however exists potential for Kenya to become and retain self-sufficiency in production and also produce surplus for export (Kenya Sugar Board Year Book of Sugar Statistics, 2010). The state-owned millers have publicly been seen as a burden and loss making with the inability to meet their financial obligations. Interestingly, more private firms have continued to join the sugar sector.
1.2 STATEMENT OF THE PROBLEMThere is no one “best” form of ownership. Choosing the “right” form of ownership means that one must understand the characteristics of each form and how well those characteristics match the business and personal circumstances (Norman, 2010). Most businesses, be it state-owned, private or individual, are started with a goal, which generally is considered to be revenue generation and growth. Following continuous performance measurements and monitoring, the owner may decide to change the form of ownership so as to match the demands or challenges thereof. For instance, the private companies will convert into public to be able to raise more capital; the loss-making government owned firms will be sold-off through privatization to offload the financial burdens and so on.
Kinandu (1995) notes that privatization of parastatals is one of the major elements in the economic reform programs being undertaken by African governments. He cites the objectives of privatization as: Raising revenues from sale of state-owned assets, deepening of financial markets, dispersing widely the ownership of assets previously held by the government and reducing the financial and administrative burdens that these enterprises impose on the government.
Several studies have been carried out locally on the link between ownership structure, financial performance and privatization in a number of organizations and sectors of the
7

economy. Angeline (2006) suggests that further research on privatization be carried out on specific sectors of the economy while Mwanthi (2004) concludes that the study proved there was some improvement in the financial position of Kenya Airways following privatization. Ng’ang’a (2003) analyzed financial performance of state-owned enterprises against that of privatized enterprises from different industries and concludes by suggesting that there is need for a further study comparing perfonnance of private and state-owned firms within the same industry especially in the agriculture sector. On a related study, Olteita (2002) concentrated on ownership structure and financial perfonnance of listed companies in Kenya. The researcher concluded that the influence o f the state together with institutions and individual as shareholders to listed firms’ profitability was insignificant, if not completely irrelevant.
Previous studies done in the sugar industry seem to indicate a possibility of poor performance by the state-owned millers. Murgor (2008) recommends a complete restructuring of all non-performing sugar companies to enable them effectively fulfill their obligations to cane farmers and other stakeholders. Further, he recommends that the government should review a number of its policies, like is rationalization of the sugar industry through off loading part of its shares to the public, which will bring in the culture o f private sector management style in the industry. Wasilwa (2008) alludes that the firms need to put certain measures in place to address internal factors that affected the sugar sector cost of effectiveness and included in these measures is privatization of state- owned companies. Does this mean the private sugar companies are performing better than the state-owned ones? In his conclusions, Obado (2005) identifies high indebtedness as a challenge and constraint that inhibit the competitiveness of the Kenyan sugar industry and recommends the restructuring of the balance sheets of all state-owned sugar firms to attract new investment.
None of these studies attempted to compare the form of ownership against the financial performance for the sugar companies. Publicly, performance of most of sugar companies especially the state-owned ones, has been considered to be poor with huge accumulated debts and cash flow problems. The sugar factories as at end of 30,h June, 2010 owed farmers, Levy Fund and KSB-SDF loans an estimated Kenya Shillings 12 billion
8

excluding other trade creditors and statutory deductions (KSB Annual Statements, 30th June 2010). Kidero (2004) outlines the challenges facing the sugar industry as high production costs, management inefficiencies, poor debt management, poor road infrastructure for cane transportation and lack of product-diversification.
The choice o f sugar companies for this study was driven by the fact that the history of the Kenyan sugar industry has been revolving around sugar shortages, inefficiencies, inability to compete with imported sugar, perennial losses and political interferences. Despite the challenges facing the industry, three (3) new companies have been registered and are yet to start milling operations after construction. Of the nine (9) sugar mills that operated within the study period, five (5) are state-owned and four (4) are private. Among the private firms, only Mumias started as a public entity then turned private through public offer. So, is there any significant difference between the financial performance of the state-owned and the private sugar companies in Kenya?
1.3 OBJECTIVE OF THE STUDYThis study aims to analyze and evaluate whether the form of business ownership has any significant effect on the financial performance of sugar companies in the Kenyan sugar industry.
The specific objectives to this study were analysis of the relationship between the identified variables and financial performance; and determination of whether these variables account for any differences in performance among the private and public sugar companies.
1.4 VALUE OF THE STUDYThis study will be of significant use in assisting the current and potential investors to get an understanding of the viability of the sugar industry. It will provide information on
9

whether the private sugar companies can perform better than the state-owned counter parts.
Moreover, this study will be helpful to the government and the public in judging the performance of the state-owned companies and deciding on whether they are fulfilling their responsibility to the country. It will also help the management of institutions within the sugar industry in identifying and addressing any significant performances differences that may exist.
Finally, it will also serve as a future reference for researchers on the subject ownership structure and performance.
10

CHAPTER TWOLITERATURE REVIEW
2.1 INTRODUCTIONThis chapter presents a review of the related literature on ownership structure and financial performance. The chapter is structured as follows: Section 2.2 briefly explores the literature on theoretical framework about ownership structure theories and performance theories. Section 2.3 provides empirical literature review from both global and local studies while section 2.4 describes the financial performance measures. Section2.5 gives an exploration of the various forms of business ownership. Finally, Section 2.6 provides the conclusions of the chapter.
2.2 THEORETICAL FRAMEWORK
2.2.1 Ownership Structure TheoriesSeveral theories and studies have been developed around the topic of ownership structure. Among the noticeable theories are the Theory of Irrelevance, the pecking order theory, the Agency Theory, Optimal Capital Structure debates and others.
It was in 1958, when Modigiliani and Miller (M&M) wrote a paper on the irrelevance of capital structure that inspired researchers to debate on this subject. This debate is still continuing. However, with the passage of time, new dimensions have been added to the question of relevance or irrelevance of capital structure. M&M declared that in a world of frictionless capital markets, there w'ould be no optimal financial structure (Schwartz & Aronson, 1979). The theory later became to be known as the “Theory of Irrelevance”. In M & M’s over-simplified world, no capital structure mix is better than another. M & M’s Proposition-II attempted to answer the question of why there was an increased rate of return when the debt ratio increased. It stated that the value of the firm depends on three things:

1. Required rate of return on the firm’s assets2. Cost o f debt of the firm3. Debt/Equity ratio of the firm
The expected rate of return on a single asset is equal to the sum of each possible rate of return, multiplied by the respective probability of earning on each return generated by debt financing.
When a firm raises money for working capital or capital expenditures by selling bonds, bills or notes to individual and /or institutional investors, in return for lending the money, the individuals or institutions become creditors and receive a promise to repay which is exactly offset by the risk incurred, regardless of the financing mix chosen.
Miller (1977) wrote a paper which took into account not only the corporate taxes but personal taxes as well. In the theory of firm’s capital structure and financing decisions, the Pecking Order Theory or Pecking Order Model was developed (Myers, 1984). It states that companies prioritize their sources of financing (from internal financing to equity) according to the Principle of least effort, or o f least resistance, preferring to raise equity as financing means of last resort. Hence, internal funds are used first, and when that is depleted, debt is issued, and when it is not sensible to issue any more debt, equity is issued. Unlike M&M’s over simplified Irrelevance theory, Pecking order theory considers the consequences of debt and equity issues for a firm. It basically states that firms will consider all methods of financing available and use the least expensive source first (Myers, 1984; Brealey & Myers, 2000). It further suggests that firms should consider financing new projects in the following manner: first use internal equity, next use debt and last use external equity (Titman & Wessels, 1988). The important difference is that the equity is divided into two parts, namely internal equity and external equity. Internal equity is that which is readily available for investment, whereas external equity is that which must be obtained from outside sources.
Pecking Order theory suggests that firms issuing debt send a positive signal about their future prospects. This also shows that the company has more investment opportunities and growth prospects than it can handle with the internally generated funds. The
12

reasoning behind this is that managers who are unsure of future profitability will not subject the firm to bankruptcy risks. Therefore, only those firms that are confident of their ability to repay obligations will issue debt. In summary, the pecking order theory has two prepositions:
1. The signaling theory in finance: equity is issued to spread risk amongst equity holders, while debt is issued to avoid sharing wealth. This aspect of signaling theory is consistent with shareholder wealth maximization, and therefore has wide support.
2. The Trade-off theory: suggests that firms with substantial amount of intangible assets should rely on Equity Financing.
The act of raising money for company activities by selling common or preferred stock to individual or institutional investors in return for the money paid, shareholders receive ownership interests in the corporation, whereas those firms having tangible assets should rely more heavily on debt financing (Harries & Raviv, 1990). However, it is evident that the advantages and disadvantages of offering excessive debt are significant. Trade-off theory acknowledges the tax advantages of debt, while considering the threat of bankruptcy associated with it. According to Myers (1984) Trade-off theory is easily accepted because it explains why firms do not use excessive debt.
The other theory of ownership structure is the agency theory. It is argued that the separation of ownership from control for a corporate firm creates an agency problem that results in conflicts between shareholders and managers (Jensen & Meckling, 1976; Shleifer & Vishny, 1997). The interests of other investors can generally be protected through contractual arrangements between the company and concerned stakeholders,, leaving shareholders as the residual claimants whose interests can adequately be protected only through institutions of corporate governance (Shleifer & Vishny, 1997). Since ownership structure remains the basis for exercising power and control over corporate entities under conditions of market imperfections and/or incomplete nature of
13

contracts, the problem of agency costs needs to be addressed according to the ownership structure o f the firm to ensure efficient financial performance.
For a publicly traded firm with widely dispersed shareholdings, the challenge for shareholders is to control the behavior of dominating managers and/or of the board. The challenge for a closely held firm with a controlling shareholder and a small number of outside minority shareholders or a widely held firm dominated by a controlling shareholder is how outside shareholders can prevent the controlling shareholder from extracting excess benefits to the detriment of minority shareholders (World Bank, 1999). Therefore, to ensure optimum performance and minimize agency costs, ownership structure is considered to be one of the core governance mechanisms along with others such as, debt structure, board structure, incentive-based compensation structure, dividend structure and external auditing.
2.2.2 Performance Management TheoriesIn determining factors influencing performance diversity, literature dealing with such work suggests that industrial performance and performance differences among firms can be explained as arising from various characteristics: those which are firm-specific and those which are industry specific (Capon, Farley & Hoenig, 1990).
Industrial organization economists point to industry effects (i.e. concentration levels, industry growth) using the structure-conduct-performance model (SCP) as the main factor determining firm profitability (Scherer, 1980; Porter, 1981). On the other hand, the resource-based view (Wemerfelt, 1984; Barney, 1991; Peteraf, 1993) suggests that the explanation for the existence of more or less profitable firms within the same industry must be found in the internal factors of each company (for example, market share, firm size, skill level, etc.). These firm-effect factors favour the achievement and maintenance of competitive advantages of each firm, which eventually lead to different profitability levels among firms belonging to the same industry (Amato & Wilder, 1990).
Sarkaria and Shergill (2000) suggest that firms seeking to improve financial performance must shift from labour intensive to capital intensive methodologies. This would lead to
14

process modernization, improved product quality, wastage reduction and better cost of production. Based on this argument, it is hypothesized that capital intensity associates positively with performance.
It should be noted however that large investments made in fixed assets or for building plants may bind a firm to a certain business even if the business is declining. Moreover, whether capital intensity increases profitability would also depend on the cost of input (Sidhu & Bhatia, 1993).
Skill has been employed into some models to measure the impact of human capital on performance. Studies carried out by Siddharthan and Dasgupta (1983) and Kumar (1985) have suggested a positive relationship between the skill of employees and financial performance. Based on this argument, it is expected that the expenditure on employees will lead to an increase in their satisfaction as well as efficiency. Therefore, a positive relationship can be hypothesized between the expenditure on employees and financial performance of the firm. In line with Kumar (1985), the skill variable was computed by dividing the staff costs o f employees and workers by total related sales.
According to Penrose (1959), firm size may play a role towards performance. Larger firms can enjoy economies of scale and these can favorably impact on profitability. Larger firms may also be able to leverage their market power (Shepherd, 1986). Thus, size is expected to have a positive relationship with profitability.
Like the firm size-profitability relationship, the association between firm age and financial performance has been widely studied. On the one hand, Sidhu and Bhatia (1993) argue that younger firms will be outperformed by older ones. Older firms have the early mover advantage and may possess specific competencies and skills which younger firms may not have developed as yet. In doing so, they are able to grow faster to achieve higher profitability. However, Hannah and Freeman (1989) suggest that older firms are more resistant to changes in a competitive environment and newer technologies which may, as a result of the need to operate in an age-old standardized manner, leave older firms progressively outdated and lead to organization failure.
15

Leverage has been employed widely as a measure of risk in previous studies of financial performance reflecting a trade-off between shareholders’ returns and risk (Hall & Weiss, 1967; Scott & Pascoe, 1986; Pant, 1991). The usual supposition is that a leveraged firm with relatively more borrowed capital represents a greater financial risk to equity holders than a firm with relatively low debt (Bothwell, Cooley & Hall, 1984). Depending on the cost of debt, the effect o f leverage may be favourable or unfavourable. When the cost of debt is lower than the company’s rate of return, shareholders’ earnings will be magnified. However, when the rate of return on the company’s assets is lower than the cost of debt capital, then the leverage effect will be unfavourable. In line with Sarkaria and Shergill (2000), leverage in this analysis is assumed to arise as firms venture to borrow capital when they expect to earn more than the cost of debt capital, and hence, a positive relationship between leverage and performance is expected.
2.3 EMPIRICAL LITERATURE REVIEW
2.3.1 Global StudiesThe nature o f the relationship between ownership and financial performance is a key issue for governance. Some corporate governance studies support the existence of a linear or monotonic relationship between ownership and performance (Berle & Means, 1932; Jensen & Meckling; 1976; Lichtenberg & Pushner, 1944; Mehran, 1995), while others support a non-linear or non-monotonic relationship between them (Morck et al, 1988; McConnell & Servaes, 1990 and 1995, Chen et al, 1993; Short & Keasey, 1999). Both sets of studies assume a uni-directional relationship, based on the assumption that ownership is exogenous. This notion was questioned by Demsetz (1983) and Demsetz and Lehn (1985), who argue that ownership structure is endogenously related to firm performance with no direct relationship expected between the two.
The debate, however, has been broadened by some of the more recent empirical studies. These studies present evidence o f either a reverse-way or a bi-directional relationship between them using a simultaneous equations approach to model endogeneity (Chung &
16

Pruitt, 1996; Loderer& Martin, 1997; Cho, 1998; Bohren & Odegaard, 2001; Demsetz & Villalonga, 2001).
Studies that were cross-industry but country specific in nature (for example Sun & Tong, 2002 on Malaysia; LaPorte & Lopez-de Silanes , 1998 on Mexico; Smith et al,1996 on Slovenia) all concluded that privately owned firms improved their performance when there were management changes. They also find that the improvements in the profitability of businesses were largely explained by improvements in productivity rather than through higher prices or reduction in the labor force.
In particular, Sun and Tong (2002) comprehensive study on the privatization of 24 state- owned firms in Malaysia during the period 1983- 1997 concludes that the Malaysian privatization program had been successful, albeit not as successful as that achieved in other countries. Privatized firm have observed a three -fold increase in absolute levels in total profit, doubled real sales, increased dividend payouts and significantly reduced leverage. In addition, these results were robust across various specifications. Sun and Tong’s findings are similar to the results obtained by other multi-country studies like D’Souza and Megginson (1999) and Boubakri and Cosset (1998). Boubakri and Cosset’s (1998) study o f 79 newly privatized firms in 21 developing countries that experienced full or partial privatization between 1980 and 1992 found significant increases in profitability, operating efficiency, capital investment spending , employment and dividends.
Evidence from China, however, does not seem to corroborate the findings in other developing countries. Sun, Tong and Tong (2002) found that state ownership and firm performance was positively related, irrespective o f the type of state ownership, i.e. whether proxies by state share ownership or legal person share ownership. However, the relationship between ownership and performance was non linear. In other words, firm performance increases at the initial stage of privatization, but beyond a certain level, divesting ownership to the private sector results in poorer firm performance. Thus, they suggest that a certain optimal level of state ownership may actually be conducive to firm performance. Still, there is an overwhelming evidence to suggest that private ownership
17

improves the financial and operating performance of firms. Ramasamy, Ong and Yeung (2005) in their study found empirical evidence that firm size and the firm ownership are important determinants of financial performance in the Malaysian palm oil sector. Particularly, their findings showed that privately-owned firms performed better than state-owned firms for reasons based around the inefficiencies that are created from the incentive and contracting problems due to public ownership. They recommended complete privatization of the palm oil sector.
Most research on the relationship between ownership and financial performance is rooted in and agency framework. The Agency view prescribes that incentive and contracting problems create inefficiencies due to public ownership. This is because managers of state-owned enterprises may pursue objectives that differ from those of private firms and face less monitoring. As a result, this has given rise to the claim that private ownership has advantages over public ownership in terms of being inherently more efficient and profitable. There is an abundance of literature to support this claim (LaPorta & Lopez- De-Silanes. 1998; Megginson, Nash & Van Randenborgh, 1994; Boubakri & Cosset, 1998: Sun &Tong, 2002).
The results o f the study on “The effect of ownership structure on performance of hospitals from the state o f Washington” by Alam, Elshafie and Jarjoura (2008) indicated that not- for profit hospitals were more profitable relative to for- profit and government hospitals even after controlling for other factors reflecting other financial and non- financial measures. Gupta (2001), using firm level data of government owned firms in India from 1993-98, document that even the sale of minority stakes has a positive impact on firm performance and productivity. She finds that privatization and competition have a complementary impact on firm performance. Further in relation to the performance of partially privatized firms, Sheshinski and Lopez-Calva (1998) and Boubakri and Cosset (1998) both deduce that partially privatized firms have a lower effect on profitability when compared with full privatization.
However, Hubbard, Himmelberg and Palia (1999) US study and Kumar (2003) India study found performance and ownership to be unrelated, hence suggesting ownership is
18

optimally chosen over the long run. In the empirical literature, Loderer and Martin (1997) consider Tobin’s Q and managerial ownership as endogenous in a simultaneous equations framework and use data on acquisitions to investigate whether executive stock ownership boosts the performance o f the bidding firms. Using 2-SLS regression, they find no evidence that larger managerial ownership boosts performance. Demesetz and Villalonga (2001) also address endogeneity concerns about the performance-ownership relationship by using a simultaneous equations model. Their 2-SLS estimates show no statistical relationship between managerial ownership or top 5 shareholders’ ownership and performance.
Bohren and Odegaard (2001) conducted a similar study using simultaneous equation on Norwegian data. Consistent with the findings of several prior studies, they present evidence that performance drives insider ownership but not vice versa. Fernandez and Gomez (2002) also estimate simultaneous equations using a pooled sample of Spanish firms. Their findings show that managerial ownership does not appear to influence firm performance (either as market-to- book value ratio or ROA). Similarly, Agrawal and Knoeber (1996) and Firth, Fung and Rui (2002) construct a complex system of simultaneous equations for US and Chinese firms respectively. Both studies find no evidence of ownership influencing firm performance.
2.3.2 Local Studies
Kenya is an emerging economy. Corporate governance systems here are arguably less evolved than those in developed countries such as the Anglo-American countries, Germany, or Japan. Emerging markets as a whole differ substantially from developed countries in their institutional, regulatory and legal environments. The emerging market model is typically characterized by the control model o f having concentrated ownership, insider boards, limited disclosure, inadequate minority shareholder protection and a limited takeover market. In contrast, the typical features of the developed markets model include dispersed ownership, non-executive majority boards, high disclosure, shareholder equality, institutional investment and an active takeover market (The Mckinsey Emerging Market Investor Opinion Survey, 2001).
19

Locally, studies have been done with regard to ownership structure and performance and more specifically comparing performance of state-owned firms with the private ones. Ongore (2008) found that ownership concentration and government ownership have significant negative relationships with firm performance while foreign ownership, diffuse ownership, corporation ownership and manager ownership had significant positive relationships with firm performance. Mwanthi (2004) proved there was some improvement in the financial position of Kenya Airways following privatization. Ng’ang’a (2003) concluded that privatized enterprises have a higher return on shareholders’ wealth than the state-owned enterprises by more than 80%. In a related study that looked more into the shareholders’ influence on performance, Oltetia (2002) suggested that the influence of the state as a shareholder, institutions and individual shareholders to firm’s profitability was insignificant if not irrelevant. However, the study went further to suggest that foreign investors had significant impact on firm profitability but only when taken as a group.
2.4 FINANCIAL PERFORMANCE MEASURES
2.4.1 Types of Financial Performance MeasuresThe commonly used tool for measurement of financial performance is the ratio analysis. Norman (2010) explains ratio analysis as a method of expressing the relationship between any two accounting elements that allows business owners to analyze their companies’ financial performance. The ratios serve as a company’s barometers of financial health. Mclaney (2009) classifies ratios into five groups as follows:
i) Profitability Ratios which are concerned with the effectiveness of the business in generating profit. Among the ratios in this class are Return on Capital Employed (ROCE), Return on Equity (ROE), Gross Profit Margin and Net Profit Margin.
ii) Activity of Efficiency Ratios that indicate how effectively a firm is using its resources. Included in this class of ratios are the Inventory Turnover Period.
20

Accounts Receivable Collection Period, Accounts Payable Payment Period, Net Asset Turnover and Sales to Employees ratio.
iii) Liquidity Ratios which give reflection of the ability of a company to meet short term obligation using assets that are most readily convertible into cash. These ratios include Current Ratio (CR), Quick Ratio or Acid Test Ratio (ATR) and Sales to Net Working Capital Ratio.
iv) Gearing or Leverage Ratios which are used to assess how much financial risk the company has taken on while seeking financing. The ratios are Total Debt to Assets Ratio, Debt to Equity Ratio, Gearing and Interest Cover Ratio.
v) Investors Ratios are the ratios commonly used by investors to assess the performance o f a business as an investment. They include Earnings Per Share (EPS), Price- Earnings Ratio (P/E), Dividend Yield or Payout Ratio and Dividend Cover.
2.4.2 Limitations of Financial Performance MeasuresAccording to Homgren, Harrison and Oliver (2009), financial measures tend to be lag indicators (after the fact), rather than lead indicators (future predictors) and focus on the company’s short-term achievements, rather than on long-term performance. Additionally, other limitations are posed by the choice of accounting policies, summarization of information and differences in accounting periods.
Ratios need to be interpreted carefully. They can provide clues to the company’s performance or financial situation. But on their own, they cannot show whether performance is good or bad. Ratios require some quantitative information for an informed analysis to be made.
21

2.5 FORMS OF BUSINESS OWNERSHIP2.5.1 Sole ProprietorshipThere are several forms of business ownership based on the number of owners, formation legalities, ways of raising capital and management methods among other factors. Carysforth (1995) defines Sole proprietorship as a business owned by a single person with the advantages being less legal requirements to start, lower amount of capital, enjoyment o f all the profits earned, the benefit of low taxes as the earnings are considered as personal income, quick decision-making process and reduced chances of conflicts. However, the disadvantages are unlimited liability, limited access to sourcing of funds, limited skills and risk of ending with the death of the owner.
2.5.2 PartnershipPartnership is defined by The Partnership Act Chapter 29 of the laws of Kenya as the relationship which subsists between persons carrying on a business in common with a view of profit. However, this definition excludes any company registered under the Companies Act or any other Act for the time being in force. A partnership can be either general where by the liability of the partners is unlimited or limited partnership in which extend of liability is limited to the shares (Madura, 2007). In partnership, the business gets additional funding from the partners, losses are shared and there are more specializations as each partner comes in with his skills. Among the disadvantages of a partnership is sharing o f control which slows down he decision-making processes as there has to be consultations and consensus, formation process may not be easy due to legalities required and the profits are reduced by sharing.
2.5.3 CompanyA company can be described as a legal entity, allowed by legislation, which permits a group of people, as shareholders, to apply to the government for an independent organization to be created, which can then focus on pursuing set objectives, and empowered with legal rights which are usually only reserved for individuals, such as to sue and be sued, own property, hire employees or loan and borrow money. A company
22

can be either Private or Public. Private limited company as described in The Kenyan Companies Act Chapter 486 is owned by few owners o f not more than fifty, the shares are not quoted and they are not freely transferable. For the public company, the shares of are quoted on the stock exchange and can be easily purchased or sold by investors, shareholders enjoy limited liability and the companies have a wide access to funds. Among the challenges of a company are the agency problem, high formation costs, more financial disclosure requirements and high taxes.
2.5.4 State-owned entitiesThese are legal entities created by the government to undertake commercial activities. They include Local Authorities, Central Government Departments and Public Corporations. Local Authorities are enterprises organized and operated through the local town or council offices while Central Government Departments are public enterprises run by the government and administered by government departments. On the other hand, a “State Corporation” is defined in The Kenyan State Corporation Act, Chapter 446 to mean a body corporate established by order of the President to perfonn the functions specified in the order; a body corporate established by after the commencement of the Act by or under an Act o f Parliament or other written law but not any other body under other Acts o f the laws o f Kenya to include Local Government Act, Co-operative Societies Act, Building Societies Act, Companies Act and Central Bank of Kenya Act; a bank or a financial institution licensed under the Banking Act or other company incorporated under the Companies Act, the whole or the controlling majority of the shares or stock of which is owned by the Government or by another state corporation and finally a subsidiary of a state corporation.
2.5.5 “Other Organizations”These are a formation by a group of members to meet their interest other than pursue profits. They include clubs, Charitable Organizations and Co-operatives. Clubs are business entities that are run by volunteers for the benefit of members whereas in Charitable Organizations, money is raised less the administration costs and balance spent on a particular cause. Co-operatives are enterprises organized for the benefit of members
23

who share a common goal for example workers, consumers, producers etc with any surpluses arising thereof being shared.
2.6 CONCLUSIONFrom the foregoing literature review, a lot has been done on the subject o f ownership structure and performance, yet no eminent conclusion has been arrived at. Researchers have come up with contradictory findings for different countries and industries. For comparability o f findings, then the assumptions made in various studies might have to be leveled. This paper aims at extending the existing literature on the relationship between ownership structure and firm financial performance to an emerging market economy setting, Kenya. It will emphasize the firm effects on performance as a focus on a single industry, the Kenyan sugar industry. In particular, it will highlight the role o f ownership structure as a determinant o f firm's performance, in the context of it being owned either by the state or privately owned.
24

CHAPTER THREERESEARCH METHODOLOGY
3.1 Research DesignThe study is a descriptive research design as it investigated whether ownership structure had significant effects on the performance of the sugar companies in Kenya. It involved comprehensive multivariate regression, ratio and descriptive analysis.
3.2 HypothesisThis study sought to determine whether ownership structure affected firm performance in the sugar industry of Kenya. Ownership structure was analyzed in terms of ownership concentration and ownership identity. The hypothesis tested was as follows:H I: Ownership concentration is positively associated with firm financial performance.3.3 PopulationThe population for this study comprised of all the 9 Sugar milling companies that were in operation in the period 1993-2010 (Appendix 1).
3.4 Data CollectionThe study used secondary data obtained from the Annual Financial Statements of the sugar companies for the years 1993 to 2010 and the Kenya Sugar Board Year Books of Statistics for the same period. The Financial statements were obtained from the data bank o f Kenya Sugar Board or from the respective companies were none existed in the data bank. Specifically, the data extracted from the financial statements was that of the total income, total operational costs, earnings before interest & tax, net finance costs, taxation, net profits, noncurrent assets, current assets, inventories, equity, noncurrent liabilities, current liabilities and number o f employees and shareholding distribution. The data collected for each of the sugar companies namely: Muhoroni, Miwani, Chemelil, Mumias, Nzoia, South Nyanza and West Kenya was presented in appendixes 7 to 13. Miwani and West Kenya companies had some parts of the data missing, though they
25

were still included in the study. Soin Sugar Company and Kibos Sugar & Allied Industries were eliminated for lack of sufficient data as they were in operation for less than two years of the study period. Further, the following ratios were computed from the data for analysis: Return on Assets, Net profit Margin, Current Ratio, Loganthm of Total Assets, Logarithm of Total Sales, Total Debt to Total Assets Ratio, Inventory to Total Assets Ratio and Loganthm of Total Sales to Employees Ratio.
3.5 Data AnalysisThe model used in this study was multivariate regression analysis on ownership and financial data of the sugar companies in Kenya for eighteen years (1993-2010). Two ownership structure vanables were used in the study; Controlling Shareholder (CSH) and Foreign Investors (FI). As a proxy for ownership concentration, the percentage of shares held by a controlling shareholder was used and referred to a group of shareholders who control the company, such as shareholders owning substantial equity stake, their family members and affiliated entities or the government where shareholding is above 51%. Foreign ownership was measured by the percentage of shares held by foreign investors.
Two variables were selected as a proxy for company financial performance: Return on Assets (ROA) and Net Profit Margin (NPM). ROA indicates how profitable a company is relative to its total assets while NPM is an indication of how effective the company is at cost control. The accounting-based measures were preferred to market-based measures like Tobin’s Q as it was only one out of the nine companies which was listed in the NSE.
Besides ownership structure, other factors can cause the variation in company financial performance. Thus, several control variables were introduced in the study: firm size, liquidity, leverage, business cycle and employee efficiency. Natural loganthm of total assets (LTA) and natural logarithm of total sales (LTS) were included to control for firm size while for liquidity, current ratio (CR) was used. As for leverage, total debt to total assets ratio (DAR) was employed to control for capital structure effects. The company’s inventory to total assets ratio (1TAR) was introduced to control for effect of business cycle, while logarithm of sales to employee ratio (LSER) was used to contrpl for
26

workforce efficiency. Using the combination of variables, two linear regression equations were used to empirically test the hypothesis: one, measuring financial performance using ROA and the other measurement being NPM as follows:
1) . ROA = B„ + B tCSH +B :FI + B ,L T A +B4LTS+ B<CR+ B«,DAR+ B7ITAR+ B8LSER
2) NPM = B 0 + B jC SH + B?FI + B :,LTA + B4LTS+ B SCR+ B6DAR+ B7ITAR+ BgLSER
Where:
Bo. ...8 = Coefficients,
CR = Current Ratio,
CSH = Controlling Shareholder,
DAR = Debt to Assets Ratio,
FI = Foreign Investors,
ITAR = Inventory to Total Assets Ratio,
LSER = Logarithm of Sales to Employees Ratio,
LTA = Logarithm of Total Assets,
LTS = Logarithm of Total Sales,
NPM = Net Profit Margin and
ROA = Return on Assets.
The study made use o f ratios, graphs and tables and where appropriate to present and analyze data. The financial performance of each company was analyzed separately, followed by computation of an average performance for each category i.e. public and the private companies. Coefficient of variation was calculated and tested to determine whether there was any significant difference in the performance of the two categories.
27

3.6 Diagnostic Tests3.6.1 T-TestsThe t-test was performed to test the coefficients at both the 1% and 5% levels of significance on whether the independent variables are significant in predicting Return on Assets and Net Profit Margin. If the calculated value o f t is less than the critical value, then the inference is that the regression equation do not tell much.
3.6.2 Multiple Coefficient of Determination, R"To test the overall utility of the model, the multiple coefficient ol determination, R was used. The higher the R2, the better the model fits the data.
28

RESEARCH FINDINGS AND INTERPRETATIONCHAPTER FOUR
4.1 Introduction
The study’s aim was to analyze and evaluate whether the form of business ownership has any significant effect on the financial performance o f sugar companies in the Kenyan sugar industry. The regression analysis was done in four levels: first for each company; secondly on average data for public companies, then on average data for the private companies and lastly for the combined data o f all companies. The results of the data analysis have been presented in two levels; first the correlation results and then the regression results.
4.2 Correlation Coefficients resultsThe study determined the correlation coefficients between the variables in the regression models as shown in Tables 4.1 to 4.10. Table 4.1 presents correlation coefficients for all variables while Table 4.2 to 4.10 contains correlation results for each company and the two categories o f ownership under the study.
Table 4.1: Correlation Coefficients for all variablesR O A NPM LTA LTS CR DAR ITAR LSER CSH FI
ROA 1 .724** -.013 -.0 7 5 -.122 .885** -.084 .060 -.378** .463**
NPM 1 -.011 -.1 4 2 -.146 .6 6 3 " -.22 2" -.021 -.5 0 1 " .6 0 6 "
LTA 1 .9 0 4 " .116 -.003 .339” 00 "si• •
.2 3 3 " -.3 6 1 "
LTS 1 .142 -.05 4• •
.373 .9 5 1 " .3 1 1 " -.4 6 1 "
CR 1 -.171* -.080 .142 .132 -.2 3 3 "
DAR 1 -.011 .093 -.3 7 8 " .481”
ITAR 1 .2 9 7 " .113 -.096
LSER 1 .2 3 8 " -.3 8 4 "
CSH 1 -.8 5 7 "
FI 1
** Correlation is significant at the O.Ol level (2-tailed).
* Correlation is significant at the 0.05 level (2-tailed).
29

Table 4.1 above shows that there was a significant positive relationship between total debt to total assets ratio (DAR) and return on assets (.885**) and between foreign investments and return on assets (.463**). This means that an increase in debt to total assets ratio and foreign investments causes an increase to return on assets. However, controlling shareholding (-.378**) had a significant negative relationship with return on assets indicating that when the former increases, the later decreseases. Further, DAR (.663**) and foreign investment (.606**) had a significant positive relationship on net profit margin unlike ITAR (-.222**) and controlling shareholdings (-.501 **) which had a negative significant relationship with net profit margin.
Table4.2: Correlations coefficients for Muhoroni Sugar CompanyROA NPM L T A LTS CR DAR I T A R LSER CSH FI
Muhoroni
ROA 1 .917" -.382 -.286 -.414 .391 -.033 .111 a .022
NPM 1 -.285 -.543 -.232 .143 -.250 -.1 4 6 a .066
L T A 1 -.168 .708" -.778" -.474' -.4 6 3 a .010
ITS 1 -.455 .564' .690" .834" a -.345
CR 1 -.910" -.702" - .7 8 6 ' a 181
DAR 1 .6 9 4 ' .861" a -.180
ITAR 1 .789" a -.284
tSER 1a -.367
CSH a a
FI 1
* * . Correlation is significant at the 0.01 level (2-tailed). *. Correlation is significant at the 0.05 level (2-tailed), a -Cannot be computed because at least one of the variables is constant.
In Muhoroni Company as in Table 4.2, return on asset is positively correlated to net profit margin. However, the predictor variables cannot be used to explain the financial performance measures of the Company as they showed no strong relationship except for net profit margin which showed a significant negative correlation to logarithm of total assets. The trend analysis is as in Graph 4.1 below.
30

Table4.3: Correlations coefficients for Miwani Sugar CompanyROA NPM LTA LTS CR DAR ITAR LSER CSH FI
ROA 1 .6 0 0 " .487' .515' - .1 0 3 .988" -.0 9 3 .621 a a
NPM 1 .761" .684 - .1 9 0 .615 -.1 9 5 .7 1 4 a a
LTA 1 .988" .2 8 5 .467 .2 3 4 .9 6 0 " a a
LTS 1 .3 8 2 .488 .3 2 9 .9 6 7 "a a
CR 1 -.137 .991'' .2 7 9a a
DAR 1 -.1 1 3 .6 1 3 "a a
(TAR 1 .2 4 3 a a
ISER 1a a
CSH 1 .a
FI 1
* * . Correlation is significant at the 0.01 level (2-tailed). *. Correlation is significant at the 0.05 level (2-tailed). A -Cannot be computed because at least one of the variables is constant.
According to Table 4.3, in Miwani Sugar Company, both return on asset and net profit margin had a significant positive correlation with LTS, LTA, DAR and LSER. This implies that return on assets and net profit margin increases for every additional unit increase in LTS, LTA, DAR and LSER. Correlation for controlling shareholdings and foreign investment could not be computed because at least one of the variables was constant. The trend analysis is as in Graph 4.2 below.
31

G r a p h 4 .2 : T r e n d a n a ly s is o f V a r ia b le s fo r M iw an i S u g a r C o m p an y
— ROA (EBIT/TOTAL ASSETS)
■ NPM (MET PROF IT/TOTAL INCOMC)
---* -- LOGARITHM OF TOTALASSETS
■ ■ LOGARITHM OF TOTALSALES
— — CURRENT RATIO (CA/CL)
• TOTAL DEBT TO TOTAL ASSETS RATIO
» INVENTORY TO TOTAL ASSETS RATIO
--------LOGARITHM OF SALES TOEMPLOYEES RATIO
--------LOGARITHM OF SALES TOEMPLOYEES RATIO
Source: Author
Table4.4: Correlations coef icients for Cheme il Sugar CompanyROA NPM LTA LTS CR DAR it a r LSER CSH FI
Chem eil
ROA 1 .885" -.025 -.106 -.053 .415 .223 .006 -.210 1
NPM 1 .248 -.032 -.339 .531' -.076 .145 -.195 .885"
LTA 1 .785" -.827" .352 -.892" .866" .128 -.025
LTS 1 -.525' .141 -.711" .946" -.062 -.106
CR 1 -.514' .860" -.655" -.102 -.053
DAR 1 -.246 .426 -.052 .415
ITAR 1 -.757" -.120 .223
LSER 1 -.021 .006
CSH 1 -.210
FI a
* * . Correlation is significant at the 0.01 level (2-tailed). *. Correlation is significant at the 0.05 level (2-tailed), a -Cannot be computed because at least one of the variables is constant.
The results for Chemelil Sugar Company as in Table 4.4 showed a significant positive correlation between net profit margin and foreign investments and also with total debt to total assets ratio while predictor variables had no impact on return on assets. This means that return on assets is less responsive if any at all to changes in the predictor variables. The trend analysis is as in Graph 4.3 below.
32

Source: AuthorTable4.5; Correlations coefficients for Mumias Sugar Company
R O A NPM L T A L T S C R D A R ITA R L S E R C S H FI
Mumias
ROA 1 .431 .006 .412 .573' -.310 -.030 .346 .014 -.093
NPM 1 .048 .238 .753" -.655" -.318 .381 .193 -.305
LTA 1 .826" -.0 8 6 .451 -.442 .821" .228 -.625"
LTS 1 .252 .297 -.522' .964" .040 -.698"
CR 1 -6 4 5 " -.306 .360 -.146 -.407
DAR 1 .190 .187 -.216 -.155
ITAR 1 -.592" -.051 .542'
LSER 1 .025 -.814"
CSH 1 .389
FI 1
**. Correlation is significant at the 0.01 level (2-tailed). *. Correlation is significant at the 0.05 level (2-tailed), a -Cannot be computed because at least one of the variables is constant.
The case for Mumias Sugar Company as in Table 4.5 indicated that Current ratio had a positive significant impact on return on assets. There was also a positive significant correlation between current ratio, total debt to total assets ratio and net profit margin. This means that the performance of the company can be greatly influenced by controlling the current and debt to assets ratios. Controlling shareholding and foreign investments had no significant impact on return on asset and net profit margin. The trend analysis is as in Graph 4.4 below.
33

G ra p h 4 .4 : T r e n d a n a ly s is o f V a r ia b le s fo r M u m ia s S u g a r C o m p an y
■KOACtBIT/TOTAL ASSETS)
■NPM (NET PROFIT/TOTAL INCOME)
- LOGARITHM OF TOTAL ASSETS
•LOGARITHM OF TOTAL SALES
•CU RRCNT RATIO (CA/CL)
-TOTAL DEBT TO TOTAL ASSETS RATIO
- INVENTORY TO TOTAL ASSETS RATIO
-LOGARITHM OF SALES TO EMPLOYEES RATIO
Source: Author
Table4.6: Correlations coefficients for Nzoia Sugar CompanyROA NPM LTA LTS CR DAR ITAR LSER CSH FI
Nzoia
ROA 1 .881" .260 -.789" .534' -.034 .113 -.7 8 9 " -.197 •
NPM 1 .184 -.865' .380 -.095 -.111 -.8 6 3 -.112 a
LTA 1 -.347 .442 .888" .181 -.3 8 8 -.036 a
LTS 1 -.551' .043 .031 .993" .184 a
CR 1 .105 .260 -.534' -.373 8DAR 1 .091 .007 .119 a
fTAR 1 .010 .107 a
USER 1 .203 a
CSH 1 a
FIa
**. Correlation is significant at the 0.01 level (2-tailed). *. Correlation is significant at the 0.05 level (2-tailed), a -Cannot be computed because at least one of the variables is constant.
Table 4.6 showed that logarithm of total sales and logarithm of sales to employees’ ratio in Nzoia Sugar Company had a significant negative impact on return on assets and net profit margin. This means the costs of the company were increasing at a high rate for every additional unit of sales. Further, the workforce could be less efficient or over employed. However, Current ratio had significant positive correlation with return on assets. Controlling shareholding had no significant impact in financial performance. The trend analysis is as in Graph 4.5 below.
34

Source: Author
Table4.7: Correlations coefficients for South Nyanza Sugar CompanyROA NPM LTA LTS CR OAR ITAR LSER CSH FI
So n y
ROA 1 .4 8 3 ' -.3 0 7 -.2 7 6 .4 5 6 -.038 .071 - .3 2 3 • a
NPM 1 -.0 9 9 -.625 '' - .0 1 4 .157 .1 2 3 -.5 0 0 ' a a
LTA 1 .670'' - .8 3 5 " -.695" - .7 9 3 " .8 0 9 " a a
IT S 1 -.5 3 9 ' -.4 2 8 -.5 0 1 ' .9 6 5 " a a
CR 1 .345 .540' - .6 8 1 " a a
DAR 1 .8 2 6 " -.4 9 3 ' a a
ITAR 1 - .6 4 0 "a a
LSER 1 9 a
CSH a a
FI a
* * . Correlation is significant at the 0.01 level (2-tailed). *. Correlation is significant at the 0.05 level (2-tailed), a -Cannot be computed because at least one of the variables is constant.
In Sony Sugar Company per Table 4.7 above, the predictor variables had no significant impact on return on assets. This means that there could be other factors contributing to the company’s performance. However, there was a negative significant correlation between Logarithm of total sales and logarithm of sales to employees’ ratio and net profit margin implying that the rate of increase in costs could be higher than that of sales. The trend analysis is as in Graph 4.6 below.
35

G r a p h 4 .6 : T r e n d a n a ly s is o f V a r ia b le s fo r S o u th N y a n z a S u g a r C o m p a n y7.00 6005.004.003.002.00
1.00
(1.00) o?>
-ROA (EBIT/TOTAL ASSETS)
-NRIV1 (IMET PROFIT/TOTAL INCOME)
-LOGARITHM OF TOTAL ASSETS
-LOGARITHM OF TOTAL SALES
-CURRENT RATIO (CA/CL)
-TOTAL DEBT TO TOTAL ASSETS RATIO
-INVENTORY TO TOTAL ASSETS RATIO
- LOGARITHM OF SALES TO EMPLOYEES RATIO
Source: Author
Table4.8: Correlations coefficients for West Kenya Sugar CompanyROA NPM LTA LTS CR DAR ITAR LSER CSH FI
W est Kenya
ROA 1 .905' .738" .754" .197 .531" .615" .808" * a
NPM 1 .780" .782" .051 .417 .752" .849" a a
LTA 1 .999" .208 .707" .562" .990" a a
LTS 1 .218 .706" .559" .991" a a
CR 1 .490" -.008 .157 a a
DAR 1 .253 .671" a a
ITAR 1 .609" a a
LSER 1a a
CSH a a
FIa
* * . Correlation is significant at the 0.01 level (2-tailed). *. Correlation is significant at the 0.05 level (2-tailed), a -Cannot be computed because at least one of the variables is constant.
As in Table 4.8 above, for West Kenya Sugar Company, the predictor variables apart from current ratio had a significant positive impact on return on assets and net profit margin. This means that return on assets and net profit margin increases for every additional unit increase on LTS, LTA, LSER, DAR and ITAR. Correlation for controlling shareholding and foreign investments could not be computed as they were constant. The trend analysis is as in Graph 4.7 below.
36

G ra p h 4 .7 : T r e n d a n a ly s is o f V a r ia b le s fo r W e s t K e n y a S u g a r C o m p a n y
•ROA (EBIT/TOTAL ASSETS)
* N PM (NET PROFIT/TOTAL INCOME)
- LOGARITHM OF TOTAL ASSETS
- LOGARITHM OF TOTAL SALES
-CURRENT RATIO (CA/CL)
-TOTAL DEBT TO TOTAL ASSETS RATIO
- INVENTORY TO TOTAL ASSETS RATIO
- LOGARITHM OF SALES TO EMPLOYEES RATIO
Source: Author
Table4.9: Correlations coefficients for Public Companies CombinedROA NPM LTA LT S C R DAR ITAR L S E R C SH FI
P u b lic Com panies Com bined
ROA 1 .941" .113 -.420 -.293 366 -.035 -.089 .345
NPM 1 .032 -.551' -.149 .125 -.170 -.274 .153
LTA 1 -.253 .395 .351 .830" -.321 -.195
LTS 1 -.323 .156 -.319 .884" .324
CR 1 -.662” .374 -.708" -.961"
DAR 1 .316 .488' .790"
ITAR 1 -.366 -.200
LSER 1 .709"
CSH 1 a
FIa
**. Correlation is significant at the 0.01 level (2-tailed). *. Correlation is significant at the 0.05 level (2-tailed), a -Cannot be computed because at least one of the variables is constant.
For the public companies combined as in Table 4 9, the results show that there is no strong relationship between the predictor variables and the measures o f performance except for logarithm of total assets which has a negative relationship to net profit margin. The trend analysis is as in Graph 4.8 below.
37

Source: AuthorTable4.10: Correlations coefficients for Private Companies Combiner
ROA NPM LTA LT S C R DAR ITAR L S E R CSH FI
Private Com panies Com bined
ROA 1 .905” .779" .794” .272 .507 .392 .828" -.324 .454
NPM 1 .768" .771“ .081 .286 .368 .820" -.397 .566'
LTA 1 .999” .206 .634” .629" .994" -.285 .391
LTS 1 .212 .636” .631" .995" -.287 .389
CR 1 .587' -.083 .171 210 -.238
DAR 1 .210 .590" .098 -.025
ITAR 1 .625" -.559' .546'
LSER 1 -.313 .437
CSH 1 -.935“
FI 1
* * . Correlation is significant at the 0.01 level (2-tailed). *. Correlation is significant at the 0.05 level (2-tailed), a -Cannot be computed because at least one of the variables is constant.
Table 4.10 indicated that return on assets and net profit margin were positively related to LTA, LTS, DAR, LSER and F I The trend analysis is as in Graph 4.9 below.
38

Source: Author
4 3 Regression resultsRegression analysis was done for each company using the two regression equations to measure financial performance using Return on Assets and Net Profit Margin. Each company was analyzed on its own after which a regression analysis was carried for all companies. The statistical terms are as explained below:
- Beta- Coefficient for the modelR“- Measures the strength of the relationship. Shows Percentages that explains the explanatory variable.
- F- F Statistics (tests the significant of the model)- T-T statsistics (tests)
39

Table4.11: Regression Summary for Muhoroni Sugar CompanyROA NPM
Beta t Sign Beta t Sign.Intercept (Constant) 1.455 0.046 0.964 104.952 1.028 .328
Logarithm o f total assets 0.346 0.788 0.449 .038 .095 .926Logarithm o f total sales -0.846 -1.786 0.104 -1.034 -2.422 .036Current ratio -0.134 -0.247 0.810 -.364 -.746 .473Total debt to total assets ratio 1.082 1.174 0.268 .225 .271 .792Inventory to total assets ratio -.218 -.593 0.566 -.345 -1.043 .322Logarithm of sa les to em ployees ratio 0.080 0.091 0.929 .488 .611 .555
Foreign investors shareholding -0087 -0.386 0.708F 2.157 0.131 2.981 0.58R 0.776 .822R2 0.602 .676
From Table 4.11:ROA= 1.45+0.346LTA -0.846LTS -O.134CR+1.082DAR - 0.21 SITAR+0.08LSER-0.0087FI N PM = 104.95+0.038LTA -1.034LTS -0.364CR +0.225DAR - 0.3451TAR+0.488LSER
The F statistics (ROA: F=2.157, p=0.131; NPM: F=2.981, p=0.58) for Muhoroni Sugar Company are not significant, hence the model can not be used to test the hypothesis.
Table4.12: Regression Summary for Miwani Sugar CompanyROA NPM
Beta t Sign Beta t Sign.
Intercept (Constant) -.009 -.107 .916 .130 .081 .937
Logarithm o f total assets .890 2.997 .012 5.566 6.154 .000Logarithm of total sales -1.139 -2.949 .013 -4.802 -4.081 .002C urrent ratio 2.111 5.894 .000 1.003 .919 .378T o ta l debt to total assets ratio 1.207 24.338 .000 .769 5.086 .000
Inventory to total assets ratio -1.882 -6.075 .000 -.688 -.728 .482Logarithm of sales to em ployees ratio
-.002 -.016 .987-.566 -1.692 .119
F 460.959 0.000 48.013 0.000R 0.998 .981R2 0.996 .676
From Table 4.12:ROA= -0.009+0.89LTA -1 14LTS +2.1 ICR +1.21DAR - 1.88ITAR-0.008LSER NPM = 0.13+5.57LTA -4.8LTS +1.003CR +0.769DAR - 0.688ITAR-0.566LSER
The F statistics are statistically significant indicating the model’s goodness of fit. The results indicate that ROA increases by 0.890, 2.111 and 1.207 for every additional
40

increase in LTA, CR and DAR respectively. However the relationship was negative for LTS (p=-1.139) (P=.013) and ITAR (p=-l.882) (P=.000). The R-squares imply that LTA, LTS, CR, DAR and ITAR explain 99.6% of return on assets. Further, the findings revealed that there was no significant relationship between logarithm of sales to employees and return on assets for the Company as indicated by (P=-0.002) (P=.987).
It was observed that net profit margin had a positive significant relationship with logarithm of total assets (p=5.566) (P=.000) and total debt to total assets ratio (P=.769) (P=.000). Logarithm of total sales had a negative significant relationship to net profit margin (p=-4.082) (P=.002). The R- squares (.676) implies that 67.6% of net profit margin can be explained by the independents variables.
Table4.13: Regression Summary for Chemelii Sugar CompanyROA NPM
Beta t Sign Beta t Sign.
Intercept (Constant) 4.501 .318 .757 21.496 1.017 .333
Logarithm of total assets .792 .833 .424 .916 1.042 .322
Logarithm of total sales .799 .332 .746 -.749 -.338 .743
Current ratio -.404 -.540 .601 -.430 -.621 .548
Total debt to total assets ratio .545 .565 .585 .134 .150 .884
Inventory to total assets ratio 1.158 1.606 .139 .848 1.272 .232
Logarithm of sales to employees ratio -1.059 -.344 .738 .358 .126 .902
Controlling shareholdings -.158 -.603 .560 -.286 -1.180 .265
F 1.067 0.447 1.493 2.73
R .654 .715
R2 .428 .511
From Table 4.13:ROA= 4.501 +0.79LTA+0.799LTS -0.404CR+0.545DAR+1 158ITAR-1.059LSER-0.158CSH NPM = 21 .5-KI.916LTA -0.75LTS -0.43CR +0.134DAR +0.848ITAR+0.36LSER-0.29CSH
The F statistics and R" (0.428) for Chemelii are statistically insignificant indicating that the model can not be used. T is less than the critical value.
41

Table4.14: Regression Summary for Mumias Sugar CompanyROA NPM
Beta t Sign Beta t Sign
Intercept (Constant) -2.838 -1.474 .175 1.962 1.409 .192
Logarithm of total assets -.322 -.597 .565 -.012 -.025 981
Logarithm o f total sales 1.635 1.499 .168 -1.467 -1.465 .177Current ratio .217 .556 .592 .257 .718 491
Tota l debt to total assets ratio -.485 -1.214 .256 -.440 -1.200 .261
Inventory to total assets ratio .378 1.559 .153 .159 .713 .494
Logarithm o f sa les to em ployees ratio -.404 -.283 .784 2.308 1.761 .112
Foreign Investors Shareholdings .394 .547 .598 .514 .778 457
Controlling shareholdings -.174 -.426 .680 -.053 -.142 .890
F 3.477 0.041 4.340 0.021
R .869 .891
R2 .756 .794
From Table 4.14:ROA= -2.84-0 32LTA +1.64LTS -K).22CR -0.49DAR +0.38ITAR-0.404LSER+0.39FI-0.17CSH N PM = 1.96-0.012LTA -1.47LTS 40.26CR -0.44DAR +0.16ITAR+2.3LSER-H).51FI-0.053CSH
For both ROA and NPM equations, the F statistics are statistically significant indicating that the models can be used to measure financial performance in Mumias Sugar Company. However, the relationship between LTS, LTA, CR, DAR, 1TAR, LSER CSH, FI to ROA and NPM was statistically insignificant.
Table 4.1S: Regression Summary for Nzoia Sugar CompanyROA NPM
Nzoia Beta t Sign Beta t Sign
Intercept (Constant) -.402 -.397 .700 -10.314 -.869 .405
Logarithm o f total assets -2.415 -2.113 .061 -2.637 -3.574 .005
Logarithm o f total sales 1.688 .919 .379 1.922 1.622 .136
Current ratio .636 1.837 .096 .524 2.342 .041
Tota l debt to total assets ratio 1.974 2.043 .068 2.121 3.401 .007
Inventory to total assets ratio .180 .985 .348 .000 .000 .999
Logarithm of sales to em ployees ratio -3.079 -1.551 .152 -3.549 -2.770 .020
Controlling shareholdings .013 .070 .946 .103 .837 .422
F 4.487 0.017 12.765 000
R .871 .948
R2 .759 .899
From Table 4.15:ROA= -0.402-2.42LTA +1.69LTS +0.64CR +1.97DAR +0.18ITAR-3.088LSER+0.013CSH NPM = -1 0 .3 1-2.64LTA +1.92LTS -K).52CR +2.12DAR -3.55LSER+0.103CSH
42

The results indicate that both return on assets and net profit margin are influenced by loganthm of total sales, current ratio, total debt to total assets ratio, Inventory to total asset ratio, controlling shareholding, loganthm of total assets and loganthm of sales to employees ratio. The F statistics are statistically significant indicating the models’ goodness of fit.
Table 4.16: Regression Summary for Sony Sugar CompanyROA NPM—
Beta t Sign Beta t Sign
Intercept (Constant) -.375 -.111 .914 .897 .177 .863
Logarithm o f total assets .089 .081 .937 .703 .872 .402
Logarithm of total sales .432 .214 .835 -.929 -.627 .543
Current ratio .453 .772 .457 -.089 -.207 .840
T o ta l debt to total assets ratio -.049 -.069 .946 .209 .405 .693
Inventory to total assets ratio -.310 -.424 .680 .010 .019 .985
Logarithm of sales to em ployees ratio -.725 -.279 .786 -.125 -.066 .949
F 0.690 0.663 2.853 0.063
R .523 .780
R2 .273 .609
From Table 4.16:ROA= -0.375+0.089LTA +0.432LTS +0.45CR -0.049DAR - 0.31ITAR4).725LSER NPM= 0.897+0.703LTA -0.93LTS -0.089CR -K).209DAR +0.011TAR-0.125LSERIn both cases of ROA and NPM, the F statistic is statistically insignificant, indicating that the model can not be used for financial performance in Sony Sugar Company.
Table 4.17: Regression Summary for West Kenya Sugar CompanyROA NPM
Beta t Sign Beta t Sign
Intercept (Constant) .000 -.057 .955 .000 -.027 .979
Logarithm of total assets -7.500 -4.461 .001 -.191 -.121 .906
Logarithm of total sales 4.084 2.215 .049 -3.027 -1.756 .107
Current ratio .155 1.613 .135 .185 2.056 .064
Total debt to total assets ratio .166 1.365 .200 -.122 -1.071 .307
Inventory to total assets ratio .057 .558 .588 .150 1.568 .145
Logarithm o f sales to em ployees ratio 4.016 5.909 .000 3.998 6.292 .000
F 29.942 0.000 34.515 0.000R .971 .974
R2 .942 .950
From Table 4.17:
43

ROA= 0-7.5LTA +4.08LTS -KU6CR -KU7DAR +0.0571TAR+4.02LSER NPM = 0-0.19LTA -3.03LTS +0.19CR -0.122DAR +O.15ITAR-+4.0LSER
The F statistics are statistically significant indicating the models’ goodness of fit thus the models can be used to measure financial performance using the return on assets and net profit margin for the Company. The R-squares implied that LTA, LTS, CR, DAR, and ITAR explain the return on assets and net profit margin. Logarithm of sales to employees showed a positive significant relationship to the measures of financial performance. However there was no significant relationship between net profit margin and the rest of the independent variables.
Table 4.18: Regression Summary for Public Sugar Companies combinedROA NPM
Public Sugar Com panies Beta t Sign Beta t Sign
Intercept (Constant) 38.341 3.387 .007 147.690 4.074 .002
Logarithm o f total assets .576 1.737 .113 .730 2 5 3 1 .030
Logarithm o f total sales -4.314 -5.018 .001 -4.035 -5.395 .000
Cu rren t ratio 1.963 2.587 .027 1.544 2.339 .041
T o ta l debt to total assets ratio -.609 -1.272 .232 -.633 -1.521 .159
Inventory to total assets ratio -.483 -1.939 .081 -.755 -3.488 .006
Logarithm o f sales to em ployees ratio 5.011 4.263 .002 4.453 4.354 .001
Controlling shareholdings .573 .827 .428 .279 .462 .654
F 8.138 0.002 11.211 0.001
R .922 .942
R2 .851 .887
The regression analysis results in the table above indicates that public sugar companies return on assets had a positive significant relationship to current ratio and loganthm of total sales to employees ratio. However, public sugar companies had a negative significant relationship between logarithm of total sales and return on assets. Further there was no significant relationship between loganthm of total Assets, total debt to total assets ratio, inventory to total assets ratio, controlling Shareholding and change on return on assets. The F statistic (8.138) was statistically significant implying model goodness of fit.
44

For NPM, there was a significant positive relationship in public sugar companies between logarithm to total assets, Current ratio and net profit. In additional, there was a significant negative relationship between logarithm to total sales, inventory to total assets ratio and net profit margin.
Table4.19: Regression Summary for Private Sugar Companies combinedROA NPM
Beta t Sign Beta t Sign
Intercept (Constant) .262 .862 .411 .140 .387 .707
Logarithm of total assets -7.431* -2.802 .021 -.132 -.034 .973
Logarithm of total sales 2.878 .664 .523 -3.679 -.586 .573
C urrent ratio .141 1.549 .156 .153 1.164 .274
T o ta l debt to total assets ratio .236 1.331 .216 -.133 -.517 .617
Inventory to total assets ratio -.138 -1.170 .272 -.268 -1.565 .152
Logarithm of sales to employees ratio 5.291* 2.629 .027 4.798 1.645 .134
Foreign Investors Shareholdings -.331 -.621 .550 -.119 -.153 .881
Controlling shareholdings -.399 -.881 .401 -.267 -.407 .694
F 26.300 .000 11.211 .001
R .979 .956
R2 .959 .914
The regression analysis on private companies revealed that like in public companies there was a positive significant relationship between logarithm of sales to employee ratio and return on assets. However, there was a negative relationship between logarithm of total assets and return on assets in private companies unlike in public companies where a negative relationship was revealed between logarithm of total sale and return on assets. The F statistics were statistically significant implying the model goodness of fit in private companies. Although the model was fit to test the hypothesis measunng the performance of private sugar companies, the relationship between the independent variables and the dependent variables was statistically insignificant.
45

Table 4.20: Regression Summary for the Entire Sample (All Companies)ROA NPM
private Beta t Sign Beta t Sign
Intercept (Constant) -.067 -.086 .931 -12.840 -1.900 .060
Logarithm of total assets .086 .758 .450 .567 3.845 .000
Logarithm o f total sales -.048 -.233 .816 -.634 -2.364 .020
C urrent ratio .035 .786 .434 .003 .054 .957
T o ta l debt to total assets ratio .868* 15.457 .000 .371 5.056 .000
Inventory to total assets ratio -.066 -1.425 .157 -.213 -3.512 .001
Logarithm o f sales to em ployees ratio -.013 -.084 .933 .335 1.706 .091
Foreign Investors Shareholdings -.004 -.047 .963 .137 1.154 .251
Controlling shareholdings .049 .450 .654 .573 4.003 .000
F 58.120 .000 27.985 .000
R .894 .810
R2 .799 .657
The results indicate that both return on assets and net profit margin are depended on totaldebt to total assets ratio, logarithm of the total assets and controlling shareholdings for all companies combined. The R-squares imply that the financial performance measures can be explained by CSH, FI, LTS, LTA, CR, DAR, LSER and ITAR, while the F statistics are statistically significant indicating the model’s goodness o f fit.
46

CHAPTER FIVESUMMARY FINDINGS, CONCLUSIONS AND RECOMENDATIONS5.1 IntroductionIndustrial organization economists theories point to industry effects (i.e. concentration levels, industry growth) using the structure-conduct-performance model (SCP) as the main factor determining firm profitability. On the other hand, the resource-based view theorists suggest that the explanation for the existence of more or less profitable firms within the same industry must be found in the internal factors of each company (for example, market share, firm size, skill level, etc.). To achieve the study objective, a regression analysis was set out between return on assets and net profit margin as the dependent variables and eight independent variables.
5.2 Summary findingsRegarding the objective of the study and the variables used therein, the study made the following observations:
The findings o f the study showed that ownership structure by shareholding did not seem to influence performance. Thus the controlling shareholding held by the government in the public companies and that held by investors in private companies equally were found to be insignificant in influencing performance. Additionally, where there were foreign investors, the variable showed no material relationship to performance. Instead, internal factors of the companies which included the ability to generate income, the efficiency of assets, liquidity, leverage, workforce level and overall efficiency were key to realizing impressive performances especially for the private companies than the state-owned entities. LTS, LTA, CR, DAR and LSER had a significant positive correlation on net profit margin in private sugar Companies unlike in public sugar companies where only LTS and DAR had a significant negative correlation on net profit margin.
47

Secondly, out the seven companies studied, three showed that there was no strong relationship between the predictor variables and the performance measures o f return on assets and net profit margin. Of the remaining companies, two showed a positive relationship between the dependent and independent variables especially logarithm for total assets, logarithm for total sales, debt to assets ratio and logarithm of sales to employee ratio. For the last two companies, performance was only related to two out of the eight independent variables.
Thirdly, from the eight independent variables used, logarithm of total assets had influence on performance for three companies while logarithm of total sales, debt to assets ratio and logarithm of sales to employee ratio showed that each had effect on four companies. Current ratio and foreign investments were related to performances of two and one companies respectively. Both controlling shareholding and inventory to total assets ratio didn’t have strong relationship to performance of any company.
Fourthly, with regards to the nature of relationship, logarithm of total assets was positively related to two companies and negatively related to one. Both logarithm of total sales and logarithm of sales to employee ratio had positive relations to two companies and same for negative. Debt to assets ratio appeared to be a key factor by being positively related to three companies and negatively influencing performance of one company. The two relations noted for current ratio were positive while the only relation for foreign investment was also positive.
Finally, in some cases, the independent variables showed a strong relation to the return on assets with no relation to net profit margin and vice versa. This observation is attributed to the introduction of finance costs in working out net profit margin whereas for return on assets, earning before interest and tax was used.
5.3 ConclusionsThe empirical findings in this study shed light on the role the selected variables play in financial performance of sugar companies in Kenya, and thus offering insights to policy makers interested in reforming the industry’s performance.
48

This study showed that the factors that greatly influence on performance are total sales, total assets, current ratio, debt to assets ratio and sales to employee ratio. Therefore, the ability to generate income, the efficiency of assets, liquidity, leverage and workforce level and efficiency are key to realizing impressive performances. The ownership structure by shareholding did not seem to influence performance. This may be attributed to the fact there were no changes in shareholdings for the public companies and West Kenya Sugar Company, whereas in Mumias where there was changes, it was not in every year. Thus, internal factors o f the companies may be held accountable for differences in performance.
Secondly, companies which were highly geared were incurring heavy financial costs, hence the variations in the determination of return on assets and net profit margin. Thus, debt financing, which was rampant among the public companies need to be controlled and more equity introduced.
The weak relations among the dependent and independent variables, especially for the public sugar companies can be concluded to mean that there could be other internal or external factors that influence performance.
The study can conclude that the independent variables could be more reliable in measuring financial performance for private companies than for the public sugar companies. From the population of two private companies, the variables proved usable while out of five public companies, the variables showed relations with performance for only one company. The study findings seem to agree with the resource-based view in that most o f the independent variables proved to be related to the dependent variables for the private sugar companies, which was not the case for most of the public sugar companies.
5.4 RecommendationsIn the light of the findings o f the study, the study recommends the following:
First, there is need to look into the other factors that could be held accountable for the performance in the Kenyan sugar industry. This is from the fact that out of the eight
49

variables studied, none which came out strongly as being major to influencingperformance.
Secondly, the study identifies total sales, total assets, current ratio, debt to assets ratio and sales to employee ratio as significant predictors of financial performance in the sugar industry. To improve the performance, this study recommends improvements on workforce efficiency, liquidity, leverage and asset utilization.
Thirdly, there is a cause for alarm on the high costs within the sugar industry which reduces the profit margins. The costs, especially financial costs need to be put under control if the profitability o f the industry is to be improved.
Fourthly, there is need for bench marking among the sugar companies to help improve on the weaker factors and strengthen the variables that showed strong relationships in order to booster performance.
Further, the study recommends that while Kenya as a country continues to pursue competitiveness of a liberalized sugar industry in the face of removal of COMESA safeguards, it should vigorously implement the measures recommended in previous studies like: privatization of the public sugar companies, replacements with new technology machines, cost reductions through reduced taxation and incentives to the players to encompass product diversifications.
Finally, the sugar companies should be encouraged to store data in electronic form. This would make it easy for retrieval and even attract more researchers into the sugar sector.
5.5 Limitation of the studyThis study is not without limitations and those limitations should be taken into account when interpreting the results.
The study covered only 7 out the 9 sugar companies that operated during the selected study period. The 2 companies (Soin and Kibos) left out lacked sufficient data as they started operations in 2008 and 2009 respectively. Miwani Sugar Company was put under receivership in 2001 and the only activities since then is sugar cane farming on the
50

nucleus estate, and data for 1993 to 2000 could not be obtained. This additional data could have contributed to the study.
Most of the data was obtained from financial statements prepared under different accounting policies and procedures. For example, the study noted that there was no uniformity of treatment of items in the financial statements especially biological assets and classification of loans as to whether long-term or short-term. Thus the study was constrained by limitations arising from such financial statements preparation.
The study relied on only figures from financial statements without consideration of any events that could have also contributed to the performance of the companies. May be when taken together the interpretations and conclusions could have been different.
In the study, only current ratio, total assets, total income, debt to assets ratio, inventory to assets ratio, number of employees and proportions of shareholdings were considered as determinants o f Return on Assets and Net Profit Margin for the sugar companies in Kenya. Other internal and external factors not included as variables in this study could also influence the financial performance.
The study used multiple regression analysis to analyze the data. One needs to be conversant with the technical statistical terms to be able to better understand theregression results.
Finally, except for Mumias Sugar Company, the rest o f the companies are not listed in the Nairobi Securities Exchange. They had no electronic way of storing data, hence it took a lot of time to retrieve data from the archives.
5.6 Suggestions for further researchSeveral recommendations for future research can be fonnulated.
First, this study concentrated on ownership structure and financial performance of the sugar companies in Kenya using the annual financial statements. A further study to determine the effect of management and board changes on the performance of the sugar industry could be beneficial.
51

Second, the study noted wide variations in the production, operational and financial costs among the sugar companies in Kenya. It would be desirable to carry out further research into the factors influencing these costs.
Third, the study found that the Kenya Sugar Board was heavily financing the sugar industry7 through the Sugar Development Fund since 1992. A study to determine the impact of this funding is recommended.
Fourth. Mumias Sugar Company started as state-owned mill in 197j then was privatized in 2001. It would be interesting to carry out a study on the impact of this privatization with a view of informing the policy makers.
Finally, it would be interesting to analyze extend of the owner-agency problem within the sugar companies in Kenya.
52

REFERENCEAgrawal, A., & Knoeber, C.R. (1996): Firm Performance and M echanism to control
A gency Problem between M anagers and Shareholders, Journal of financial and Quantitative Analysis 31, 377-397.
Alam, P., Eishafie, E., & Jaijoura, D. (2008): The effect o f ownership structure on perform ance o f hospital. The DreamCatchers group, LLC, Gale, Cengage learning.
Amato, L., & Wilder, R.P. (1990): Firm and industry effects in industrial economics, Southern Economic Journal 50,93,105.
Angeline, A. (2006): Gradual vis avis Rapid Privatization & Financial Performance o f P riva tised Companies Q uoted in NSE, an unpublished MBA Research Project, University of Nairobi.
Barney, J. (1991): Firm resources and sustained competitive advantage, Journal of Management, 17, 99-120.
Berle, A., & Means, G. (1932): M o d em Corporation a nd Private Property, Macmillan, New York, World INC.
Bohren, O., & Odegaard, B.A. (2001): Corporate Governance and EconomicPerform ance in Norwegian listed Firms, Research Report 11, Norwegian School of Management.
Bothwell, J.L., Cooley, T. F. & Hall, T. E. (1984): A new view o f the market Structure- Performance debat, Journal o f Industrial Economic 32(4), 397-417.
Boubakri, N., & Cosset, J. C. (1998): The financial a n d operating performance o f newly- p riva tized firm s: Evidence fro m developing countries, journal of Finance, 53, 1081 - 1110.
Brealey, R.A., & Myers, S.C. (2000): Principle ofCorjrorate Finance, sixth edition, McGraw- Hill Inc., New York.
Butler, K.C. (2004): M ultinational Finance, 3rd edition, Thomson South-WesternCapon, N., Farley, J., & Hoenig, S. (1991): D eterminants o f Financial Perform ance. A
M eta Analysis, Management Science, 1143-1159.Carysforth, C. (1195): Intermediate Business, 2nd edition, Heinemann Educational, Halley
Court.
53

Chen, H., Hexter, J.L., & Hu, M.Y. (1993): M anagem ent O wnership and C orporate Value, M a na geria l and Decision Econom ics 14, 335-346.
Cho, M.H. (1998): O wnership Structure, Investm ent a n d the Corporate Value: anEmpirical A n a lysis , Journal of Financial Economics 47, 103-121.
Chung, K., & Pruitt, S. (1996): Executive Ownership, C orporate Value, a n d Executive C om pensation: A U nifying Fram ew ork, Journal of Banking and Finance 20, 1135-1159.
Clark, E. (2002): International Finance, 2nd edition, South-Western Cengage Learning.Demsetz, H. (1983): The structure o f O wnership and the Theory o f the Firm , Journal of
Law and Economics 26, 375-390.Demsetz, H., & Lehn, K. (1985): The Structure o f C orporate Ownership: C auses and
C onsequences, Journal of Political Economy 93 1155-1177.Demsetz, H., & Villalonga, B. (2001): O wnership Structure and Corporate Perform ance,
Journal of Corporate Finance 7, 209-233.D‘Souza, J., & Megginson, W.L. (1999): The F inancial a n d Operating Perform ance o f
new ly p r iv a tize d firm s in the 1990s, Journal of Finance, 54, 1397-1438.Fabozzi, F.J., & Modigliani, F. (2009): Capital M arkets Institutions and Instruments, 4th
edition, Prentice Hall.Fernandez, C., & Gomez, S. (2002): Does O wnership Structure A ffect Firm
P erform ance? Evidence from a Continental-type Governance System, Working paper.Firth, M., Fung, P.M.Y., & Rui, O.M. (2002): Sim ultaneous Relationship A m ong
Ow nership, Corporate G overnance and F inancial Performance, Working paper.Gupta, N. (2001): Partial Privatization and F irm Perform ance, William Davidson
Working paper: 426.Hall, M., & Weiss, L. (1967): Firm Size and P rofitability, Review of Economics and
Statistics, 49, 319-331.Hannan, M., & Freeman, J. (1989): O rganizational Ecology, Cambridge, MA, Harvard
University Press.Harris, M., & Raviv, A. (1990): C apita l Structure a n d The Information R ole o f Debt,
Journal o f Finance, 45 321-349.Horngren, Harrison & Oliver (2009): Financial and M anagem ent Accounting, 2nd
54

edition, Pearson Prenctice HallHubbard, R.G., Himmelberg, C.P., & Darius, P.D. (1999): Understanding the
determ inants o f managerial ownership and the Jink between ownership and p erfo rm an ce , The Journal of Financial Economics, 53, 353-384.
Jensen, M., & Meckling, W. (1976): Theory o f the Firm: M anagerial behaviour, Agency C osts a n d Ownership Structure, Journal of Financial Economics 3, 305-360.
Kenya Sugar Board, (2010): A nnual Report and F inancial Statement fo r 2010.
Kenya Sugar Board, (2010): Kenya Sugar Industry Strategic Plan, 2010-2014.
Kenya Sugar Board: Sugar Industry Investment Guide.
Kenya Sugar Board, (2010): Year Book o f Statistics f o r 2010.
Kidero, E. (2004): Kenya Sugar Industry, National Sugar Conference 2004. strategies fo r revita lizing the Kenya Sugar Industry.
Kinandu, M. (1995): Parastatal Privatization, The Accountants Journal, April/June 8-11.Kole, S. (1996): M anagerial ownership and firm performance: incentives o r rewards?
Advances in Financial Economics, 2: 119-149.Kumar, J. (2003): Ownership structure and corporate firm performance, Indira Gandhi
Institute of Development Research, India.Kumar, P. (1985): Growth o f industrial corporation in India, New Delhi, Deep & Deep
Publication, 27.La Porta, R., Lopez-de-Silanes, F., & Shleifer, A. (1999): Corporate Ownership around
the World, Journal of Finance LIV, 471-517.La Porta, R., Lopez-de-Silanes, F., Shleifer, A., & Vishny, R (1998): L aw and Finance,
Journal of Political Economy, 106, 1 113-1155.Lichtenberg, F., & Pushner, G. M. (1994): Ownership structure and corporate firm
perform ance in Japan, Japan and the World Economy, Elsevier 6, 239-261.Loderer, C., & Martin, K. (1997): Executive Stock Ownership and Performance:
Tracking Faint Traces, Journal of Financial Economics 45, 223-255.Madura, J. (\992): International Financial Management, 3rd edition, Thomson South-
Western.55

Madura, J. (2007): Introduction to Business, 4,h edition, Thomson South-Western.McConnell, J. J., & Servaes, H. (1990): A dditional Evidence on Equity O wnership and
Corporate Value, Journal of Financial Economics 27, 595-612.McConnell, J. J., & Servaes, H. (1995): Equity O wnership and the Two Faces o f Debt,
Journal of Financial Economics 39, 131-157.Mclaney, E. (2009): Business Finance: Theory and Practice, 8th edition, Prentice HallMegginson, W.L., Nash, R., & Van Randenborgh, M. (1994): The fin a n c ia l a n d
operating perform ance o f newly priva tized firm s'. A n international em pirical analysis, Journal of Finance, 49, 403-52.
Miller, M.H. (1977): D ebt a n d Taxes, Journal of Finance 32 (2), 261-275.Morck, R., Shleifer, A., & Vishny, R. (1988): M anagem ent O wnership and M arket
Valuation, Journal of Financial Economics, 20,293-315.Murgor, P.K. (2008): Strategic Responses o f Sugar C om panies in Kenya in the Face o f
C hanging E nvironm enta l C onditions, an unpublished MBA Research Project, University o f Nairobi.
Mvvanthi, P.M. (2004): The F inancial Im pact o f P rivatization o f K enya A irw ays, an unpublished MBA Research Project, University of Nairobi.
Myres, S. (1977): D eterminants o f C orporate Borrowing, Journal of Financial Economics, 5, 147-176.
Myres, S. (1984): The Search fo r O ptim al Capital Structure, Midland Corporate Financial Journal, 1, 6-16.
Ng'ang'a, J.W. (2003): A C om parison o f the Financial Perform ance o f S ta te-O w ned E nterprises a n d P rivatized Enterprises in Kenya, an unpublished MBA Research Project, University of Nairobi.
Nigrini. M.J. (1996): Taxpayer com pliance application o f B enford’s law: Journal of the American Taxation Association, 18(1), 72-92.
Norman, M.S. (2010): Essentials o f Entrepreneurship a n d Sm all Business M anagement, 6th edition, Prentice Hall.
Obado, Z.O. (2005): Competitive Strategies Em ployed by the Sugar M anufacturing Firms in Kenya, an unpublished MBA Research Project, University of Nairobi.
Olteita, J.K.. (2002): Ownership Structure and the F inancial Perform ance o f L isted56

C om panies in Kenya, an unpublished MBA Research Project, University o f Nairobi.Ongore, V.O. (2008): The E ffects o f O w nership Structure, B oard E ffectiveness and
M anagerial D iscretion on Firm P erform ance o f L isted C om panies in Kenya, an unpublished PHD Research Project, University of Nairobi.
Pant, L.W. (1991): A n Investigation o f Industry a nd Firm Structural C haracteristics in C orporate Turnarounds, Journal o f Management Studies, 28, 623-643.
Pant, L.W. (1991): Perform ance in N orw egian L isted F irm s, Research Report 11, Norwegian School performance, Journal of Corporate Finance, 7, 209-233.
Peteraf, M. (1993): The C ornerstones o f Competitive Advantage: A Resource-based View, Strategic Management Journal, 14, 179-191.
Porter, M. (1981): The Contributions o f industrial organization to strategic m anagement, Academy of Management Review, 6, 609-620.
Rajagopalan, N. (1996): Strategic orientations, incentive p la n adoptions, a n d fir m perfo rm an ce: evidence fr o m electric utility firm s, Strategic Management Journal, 17: 761-785.
Sarkaria, M., & Shergill, G.S. (2000): M arket Structure a n d Financial Perform ance- An Ind ian evidence w ith enhanced controls, Indian Economic Journal, 48(2), 98-105.
Scherer, F. (1980): Industria l m arket structure and econom ic performance, 2nd Edition, Chicago: Rand-McNally
Schwartz, E., & Aronson, J.R. (1979): Some Surrogate Evidence in Support o f The C oncept o f The O ptim al Capital Structure, Journal o f Finance,22, 10-18.
Scott, J.T., & Pascoe, G. (1986): B eyo n d firm and industry effects on profitab ility in im perfect m arket, The Review o f Economics and Statistics, 68, 248-292.
Shepherd, W.G. (1972): The E lem ent o f M arket Structure, The Review of Economics and Statistics, 54 (1), 25-37
Sheshinski, E., & Lopez-Calva, L.F. (1998): P rivatization and its benefits: Theory and Evidence, CAER II, Discussion Paper No.35.
Shleifer, A., & Vishney, R.W. (1997): A survey o f C orporate Governance, Journal of Finance, LII, 737-783.
Short, H., & Keasey, K. (1999): M anageria l O wnership a n d the Perform ance o f F irm s: Evidence fr o m the UK, Journal o f Corporate Finance, 5, 79-101.
57

Wasilwa, T.W. (2008): Challenges P o s te d by COMESA on Sugar M illers in K enya, an unpublished MBA Research Project, University of Nairobi.
World Bank, (1999): Corporate G overnance : A F ram ew ork fo r Im plem entation, Washington.
Titman. S., & Wessels, R. (1988): The D eterminants o f C apita l Structure C hoice, Journalof Finance, 43, 1-19.
58

f NO. C O M P A N Y YEARE S T A B L IS H E D
O W N E R S H IP
STATUSS H A R E H O L D IN G REMARKS
Miwani Sugar Co. 1922 State owned 49% Kenya Govt 51% Vanessa Associates
Placed under-receivership & not operational
2 Muhoroni Sugar Co. 1966 State owned 82.78% Kenya Govt 16.86% Mehta Group 0.36% Smallholders
Operating under-receivership as from March 2001
3 Chemelil Sugar Co. 1968 State owned 97.11% Kenya Govt1.73% Grindlays Finance Corporation1.16% Kenya Shell Ltd.
In the process of being privatized
4 Mumias Sugar Co. 1973 Private 18% Kenya Govt 82% Public investors
Started as state owned, but privatized in 2001
5 Nzoia Sugar Co. 1978 State owned 98.87% Kenya Govt1.13% Fives Cail Babcock (France)
In the process of being privatized
6 South Nyanza Sugar Co. 1979 State owned 99.80% Kenya Govt 0.20% Mehta Group
In the process of being privatized
7 West Kenya Sugar Co. 1981 Private 100% Private investment Was the first 100% owned Sugar Company
8 Soin Sugar Co. 2006 Private 100% Private investment Has the smallest crushing capacity of 300 TCD (Tons of cane per day)
9 Kibos Sugar & Allied Industries Ltd.
2004 Private 100% Private investment Started production in December 2007
10 Butali Sugar Co. 2005 Private 100% Private investment Started production in February 2011
11 Transmara Sugar Co. 2006 Private 100% Private investment Started production in December 2011
12 Kwale International Sugar Co. 2007 Private 100% Private investment Under construction
13 Sukari Industries 2007 Private 100% Private investment Started production in December 2011
Source: Kenya Sugar Board Investment Guide
59

A p p en d ix 2: M o d e l s u m m a ry ta b le f o r r e la t io n s h ip o f in d e p e n d e n t v a r ia b le s a n dNPM
Companyname M o del R R Sq u are
Adjusted R Square
Std. Error o f the Estim ate Durbin-W atson
M uhoroni 1 .822 .676 .449 4.4741192 2.753
Miwani 1 .981 .963 .943 4.2845861 1.570
Chem elil 1 .715 .511 .169 .0971996 2.3 4 7
M umias 1 .891 .794 .611 .0302390 3.0 5 4
Nzoia 1 .948 .899 .829 .2585996 1.815
Sony 1 .780 .609 .395 .0682726 3.2 70
W est kenya 1 .974 .950 .922 .0151793 2.058
Av public 1 .942 .887 .808 .6736604 1.927
AV Private 1 .956 .914 .837 .0210341 2.207
R= Predictors (Constant): FOREIGN IN V E ST O R S SHAREHO LDING, LOGARITHM OF T O T A L A S S E T S ,
LOGARITHM OF T O T A L SA LE S , IN VEN TO RY TO TOTAL A S S E T S RATIO, CU RR EN T RATIO (CA/CL),
LOGARITHM OF S A L E S TO EM PLO YEES RATIO , TOTAL DEBT TO TO TAL A S S E T S RATIO
6 0

A ppendix 3: A N O V A ta b le f o r te s t in g r e la t io n s h ip o f in d e p e n d e n t v a r ia b le s a n d N P M(sign ificance o f t h e m o d e l)
Companyname M o del Sum o f Squares df M ean Square F Sig.
Muhoroni 1 Regression 4 1 7.770 7 59.681 2.981 .058
Residual 200.177 10 20.018
Total 617.947 17
Miwani 1 Regression 5288.444 6 881.407 48.013 .000
Residual 201.934 11 18.358
Total 5490.378 17
Chemelil 1 Regression .099 7 .014 1.493 .273
Residual .094 10 .009
Total .193 17
M umias 1 Regression .032 8 .004 4.3 40 .021
Residual .008 9 .001
Total .040 17
Nzoia 1 Regression 5.9 75 7 .854 12.765 .000
Residual .669 10 .067
Total 6 .6 44 17
Sony 1 Regression .080 6 .013 2.853 .063
Residual .051 11 .005
Total .131 17
W est Kenya 1 Regression .048 6 .008 34.515 .000
Residual .003 11 .000
Total .050 17
Av p u blic 1 Regression 35.615 7 5.088 11.211 .001
Residual 4.538 10 .454
Total 40.153 17
AV Private 1 Regression .042 8 .005 11.928 .001
Residual .004 9 .000
Total .046 17
61

est of relationship of independent variables and NPM (the coefficients) Muhoroni, Miwani and ChemelilUnstandardizedCoefficients
StandardizedCoefficients
95.0% Confidence Interval for B
Model B Std. Error Beta t Sig-LowerBound
UpperBound
1 (Constant) 104.952 102.082 1.028 .328 -122.501 332.405
LOGARITHM OF TOTAL ASSETS
1.745 18.334 .038 .095 .926 -39.107 42.597
LOGARITHM OF TOTAL SALES
-21.281 8.785 -1.034 -2.422 .036 -40.854 -1.707
CURRENT RATIO (CA/CL) -19.946 26.734 -.364 -.746 .473 -79.512 39.621
TOTAL DEBT TO TOTAL ASSETS RATIO
.163 .601 .225 .271 .792 -1.176 1.503
INVENTORY TO TOTAL ASSETS RATIO
-27.176 26.062 -.345 -1.043 .322 -85.247 30.894
LOGARITHM OF SALES TO EMPLOYEES RATIO
7.246 11.863 .488 .611 .555 -19.186 33.677
FOREIGN INVESTORS SHAREHOLDING
-17.135 33.690 -.104 -.509 .622 -92.200 57.931
1 (Constant) .130 1.618 .081 .937 -3.432 3.692
LOGARITHM OF TOTAL ASSETS
35.290 5.734 5.566 6.154 .000 22.669 47.910
LOGARITHM OF TOTAL SALES
-35.883 8.793 -4.802 -4.081 .002 -55.237 -16.529
CURRENT RATIO (CA/CL) 1017.115 1106.638 1.003 .919 .378 -1418.578 3452.808
TOTAL DEBT TO TOTAL ASSETS RATIO
.594 .117 .769 5.086 .000 .337 .852
INVENTORY TO TOTAL ASSETS RATIO
-69.005 94.723 -.688 -.728 .482 -277.489 139.479
LOGARITHM OF SALES TO EMPLOYEES RATIO
-6.885 4.068 -.566 -1.692 .119 -15.840 2.070
1 (Constant) 21.496 21.134 1.017 .333 -25.594 68.585
LOGARITHM OF TOTAL ASSETS
.376 .361 .916 1.042 .322 -.428 1.181
LOGARITHM OF TOTAL SALES
-.579 1.715 -.749 -.338 .743 -4.399 3.242
CURRENT RATIO (CA/CL) -.126 .203 -.430 -.621 .548 -.577 .325
TOTAL DEBT TO TOTAL ASSETS RATIO
.100 .666 .134 .150 .884 -1.383 1.583
INVENTORY TO TOTAL ASSETS RATIO
1.125 .884 .848 1.272 .232 -.845 3.094
LOGARITHM OF SALES TO EMPLOYEES RATIO
.197 1.567 .358 .126 .902 -3.295 3.689
CONTROLLING SHAREHOLDING (GOK)
-21.575 18.290 -.286 -1.180 .265 -62.328 19.178
62

est of relationship of independent variables and NPM (the coefficients) - Mumias, Nzoia & SonyUnstandardizedCoefficients
StandardizedCoefficients
95.0% Confidence Interval for B
Model B Std. Error Beta t Sig. Low erBound
UpperBound
1 (Constant) 1.962 1.392 1.409 .192 -1.187 5.110
LOGARITHM OF TOTAL ASSETS
-.004 .145 -.012 -.025 .981 -.332 .324
LOGARITHM OF TOTAL SALES
-.421 .288 -1.467 -1.465 .177 -1.072 .229
CURRENT RATIO (CA/CL) .025 .034 .257 .718 .491 -.053 .102
TOTAL DEBT TO TOTAL ASSETS RATIO
-.198 .165 -.440 -1.200 .261 -.571 .175
INVENTORY TO TOTAL ASSETS RATIO
.109 .152 .159 .713 .494 -.236 .453
LOGARITHM OF SALES TO EMPLOYEES RATIO
.313 .178 2.308 1.761 .112 -.089 .715
FOREIGN INVESTORS SHAREHOLDING
.269 .346 .514 .778 .457 -.514 1.053
CONTROLLING SHAREHOLDING (GOK)
-.037 .258 -.053 -.142 .890 -.619 .546
1 (Constant) -10.314 11.864 -.869 .405 -36.749 16.120
LOGARITHM OF TOTAL ASSETS
-1.018 .285 -2.637 -3.574 .005 -1.653 -.383
LOGARITHM OF TOTAL SALES
4.281 2.640 1.922 1.622 .136 -1.601 10.163
CURRENT RATIO (CA/CL) 8.643 3.690 .524 2.342 .041 .421 16.865
TOTAL DEBT TO TOTAL ASSETS RATIO
2.457 .722 2.121 3.401 .007 .847 4.067
INVENTORY TO TOTAL ASSETS RATIO
.000 .664 .000 .000 .999 -1.480 1.480
LOGARITHM OF SALES TO EMPLOYEES RATIO
-5.747 2.075 -3.549 -2.770 .020 -10.370 -1.124
CONTROLLING SHAREHOLDING (GOK)
2.686 3.208 .103 .837 .422 -4.462 9.835
1 (Constant) .897 5.071 .177 .863 -10.264 12.058
LOGARITHM OF TOTAL ASSETS
.369 .424 .703 .872 .402 -.563 1.302
LOGARITHM OF TOTAL SALES
-.499 .795 -.929 -.627 .543 -2.249 1.252
CURRENT RATIO (CA/CL) -.019 .092 -.089 -.207 .840 -.221 .183
TOTAL DEBT TO TOTAL ASSETS RATIO
.178 .441 .209 .405 .693 -.791 1.148
INVENTORY TOTOTAL ASSETS RATIO
.017 .866 .010 .019 .985 -1.890 1.924
LOGARITHM OF SALFS TO EMPLOYEES RATIO
-.046 .698 -.125 -.066 .949 -1.582 1.491
63

rst of relationship of independent variables and NPM (the coefficients)- West Kenya, Av. Public & Av. PrivateUnstandardized Standardized 95.0% ConfidenceCoefficients Coefficients Interval for B
ModelB Std. Error Beta t Sig- Lower
BoundUpperBound
1 (Constant) .000 .009 -.027 .979 -.020 .019
LOGARITHM OF TOTAL ASSETS
-.004 .036 -.191 -.121 .906 -.084 .076
LOGARITHM OF TOTALSALES
-.071 .040 -3.027 -1.756 .107 -.160 .018
CURRENT RATIO (CA/CL) .003 .002 .185 2.056 .064 .000 .007
TOTAL DEBT TO TOTAL ASSETS RATIO
-.023 .022 -.122 -1.071 .307 -.071 .024
INVENTORY TO TOTAL ASSETS RATIO
.137 .087 .150 1.568 .145 -.055 .330
LOGARITHM OF SALES TO EMPLOYEES RATIO
.164 .026 3.998 6.292 .000 .106 .221
1 (Constant) 147.690 36.254 4.074 .002 66.912 228.468
LOGARITHM OF TOTAL ASSETS
.736 .291 .730 2.531 .030 .088 1.384
LOGARITHM OF TOTAL SALES
-40.191 7.449 -4.035 -5.395 .000 -56.788 -23.593
CURRENT RATIO (CA/CL) 7.457 3.188 1.544 2.339 .041 .354 14.561
TOTAL DEBT TO TOTAL ASSETS RATIO
-.441 .290 -.633 -1.521 .159 -1.087 .205
INVENTORY TO TOTAL ASSETS RATIO
-29.933 8.582 -.755 -3.488 .006 -49.055 -10.812
LOGARITHM OF SALES TO EMPLOYEES RATIO
29.063 6.675 4.453 4.354 .001 14.190 43.936
CONTROLLING SHAREHOLDING (GOK)
11.365 24.582 .279 .462 .654 -43.408 66.137
1 (Constant) .140 .361 .387 .707 -.676 .955
LOGARITHM OF TOTAL ASSETS
-.003 .081 -.132 -.034 .973 tl a 00 -n1 .181
LOGARITHM OF TOTAL SALES
-.079 .135 -3.679 -.586 .573 -.383 .226
CURRENT RATIO (CA/CL) .003 .002 .153 1.164 .274 -.002 .008
TOTAL DEBT TO TOTAL ASSETS RATIO
-.026 .050 -.133 -.517 .617 -.139 .087
INVENTORY TOTOTAL ASSETS RATIO
-.338 .216 -.268 -1.565 .152 -.827 .151
LOGARITHM OF SALES TO EMPLOYEES RATIO
.186 .113 4.798 1.645 .134 -.070 .441
FOREIGN INVESTORS SHAREHOLDING
-.605 3.941 -.119 -.153 .881 -9.520 8.310
CONTROLLING SHAREHOLDING (GOK)
-.146 .360 -.267 -.407 .694 -.960 .668
64

APPENDIX 7: MUHORONl SUGAR COMPANYEXTRACT OF FINANCIAL STATEMENTS
STA TEM EN T OF C O M PREH EN SIV E INCO M E 19 9 3 1 9 9 4 ' 19 9 5 19 9 6 ' 1 S 9 7 ' 1 9 9 8 ' 1 9 9 9 ' 2 0 0 0 ' 2 0 0 1 ' 2 0 0 2 ' 2 0 0 3 ’ 2 0 0 4 ' 2 0 0 5 " 2 0 0 6 ' 2 0 0 7 ' 2 0 0 8 ’ 2 0 0 9 ' 2 0 10
KSHSOOO KSHSOOO KSHSOOO KSHSOOO X SH S'000 KSHSOOO KSHSOOO KSHSOOO KSHSOOO KSHSOOO KSHSOOO KSH S'000 KSHSOOO KSHSOOO KSHSOOO KSH S'000 KSHSOOO KSH S'000
TO TA U N CO M E 2 3 6 ,3 9 2 38 8 ,39 8 4 4 0 ,59 5 7 5 6 ,8 5 7 609.890 4 6 3 ,5 7 8 39 4 ,9 8 8 609,690 19 4 ,7 7 7 6 0 8 ,8 14 1,0 5 8 )0 0 4 1 ,2 1 5 ,4 5 3 1 , 1 3 7 ,9 7 2 1 ,3 2 7 ,9 8 7 2 , 1 1 1 , 7 0 1 1 , 5 8 2 ,2 4 1 1 ,8 9 1 ,0 4 2 1 6 9 1 .8 4 0
TOTAL EXPEN SES (34 5 ,2 4 0 ) (5 38 ,9 57 ) (5 2 4 ,2 9 2 ) (8 3 5 ,3 3 5 ) ( 8 0 1 ,4 6 1) (830,990) ( 1 1 8 8 , 1 0 7 ) ( 1 ,2 0 8 ,9 3 7 ) (4 ,574 ,0 08) ( 6 7 1 ,3 5 8 ) ( 1 , 14 4 ,9 6 2 ) . (3 7 5 ,4 4 3 ) ( 1 ,3 5 0 ,6 7 2 ) . ( 1 ,4 4 1 ,6 0 3 ) (2 ,79 6 ,7 9 6 ) (2 ,7 3 8 ,7 13 ) ( 2 ,7 5 0 ,3 3 7 ) (3 .9 7 8 .8 8 5 )
EBIT (10 8 ,8 4 8 ) (15 0 ,5 5 9 ) (83 ,69 7) (78 .478) ( 1 9 1 .5 7 1 ) ( 3 6 7 .4 U ) ( 2 5 3 , 1 1 5 ) (5 9 9 ,2 4 7 ) ( 4 ,3 7 9 ,2 3 1 ) (6 2 ,54 4 ) (86 ,958) 8 4 0 ,0 10 (2 12 ,7 0 0 ) ( 1 1 3 ,6 1 6 ) (6 8 5 ,09 5) ( 1 , 1 5 6 ,4 7 2 ) (859 ,29 5) (2 ,2 8 7 ,0 4 5 )
FIN A N CE CO STS/ INCO M E (NET] (4 1,0 9 2 ) (49,766) (96 ,89 2) ( 18 8 ,5 3 3 ) ( 18 8 ,5 3 1 ) (3 0 2 ,8 3 7 ) (299 ,246) ( 9 10 ,3 2 2 ) (7 3 0 ,3 3 2 ) (464,443) ( 3 9 5 ,2 15 ) (4 15 ,4 8 2 ) (4 0 4 ,14 7 ) (560,680) (5 4 4 ,8SS) 7 7 3 ,2 5 2 (3 7 2 ,8 2 3 ) (3 7 4 .8 2 2 )
TAXATION - . • . . . . - • . • - • • • • • •
LO SS/PR O FITA FT ER TAXATION (14 9 ,9 4 0 ) (2 0 0 ,32 5 ) ( 18 0 ,5 8 9 ) ( 2 6 7 ,0 1 1 ) (3 8 0 ,10 2 ) (670 ,249) (5 9 2 ,36 5) ( 1 ,5 0 9 ,5 6 9 ) (5 ,10 9 ,5 6 3 ) (52 6 ,9 8 7) ( 4 8 2 ,17 3 ) 4 2 4 ,5 2 8 (6 16 ,8 4 7 ) (674 ,296) ( 1 ,2 2 9 9 5 0 ) (3 8 3 ,2 2 0 ) ( 1 , 2 3 2 , 1 1 8 ) (2 .6 6 1 .8 6 7 )
STA TEM EN T OF FIN AN CIA L POSITION
N O N -CU RREN T A S S E T S 7 4 6 ,3 2 5 7 8 8 ,0 26 8 2 3 ,7 7 6 8 7 9 ,18 2 960,087 1,0 46 ,8 9 9 10 8 6 ,4 0 0 6 2 1 2 0 5 4 0 3 ,6 7 1 3 5 6 ,4 2 1 30 9 ,9 3 7 2 8 0 ,54 2 2 4 6 ,8 9 5 2 4 2 ,2 7 0 30 7 ,6 6 0 3 8 6 ,5 3 0 3 9 2 ,9 3 7 4 50 ,7 9 0
C U R R E N T A S S E T S 1 7 1 , 4 1 6 19 4 ,5 7 8 2 4 2 ,0 8 7 2 4 9 ,9 14 2 6 9 ,3 3 5 4 13 ,0 0 0 4 3 2 ,7 14 5 9 7 , 19 5 2 14 ,9 6 3 442,6 4 4 4 30 ,8 0 8 3 7 3 ,7 0 4 2 8 3 ,8 7 2 3 6 6 ,3 10 5 8 5 ,8 0 5 4 89 ,7 56 5 26 ,0 8 4 3 6 3 ,8 3 4
tivento fles 10 7 ,7 2 6 13 8 ,5 0 5 12 6 ,3 8 7 12 7 ,8 9 5 15 5 , 1 2 4 19 5 ,7 5 9 19 3 ,2 5 9 2 0 0 ,50 7 7 5 ,6 3 0 15 4 ,9 6 1 2 1 5 , 2 1 1 18 8 ,2 6 5 1 3 0 .2 5 3 1 19 ,6 4 2 2 4 9 ,2 3 3 3 2 2 ,10 8 2 15 ,5 6 6 15 7 , 5 5 7
C u rr e n t A s s e t s n e t o f f In v e n to r ie s 6 3 ,69 0 5 6 ,0 7 3 1 1 5 ,7 0 0 1 2 2 ,0 19 1 1 4 , 2 1 1 2 1 7 ,2 4 1 2 3 9 ,4S5 396 ,6 88 1 3 9 ,3 3 3 2 8 7 ,6 8 3 2 15 ,5 9 7 18 5 ,4 3 9 15 3 ,6 1 9 2 46 ,668 3 3 6 ,5 7 2 16 7 ,6 4 8 3 1 0 ,5 1 8 2 0 6 ,2 7 7
TO T A L A S S E T S 9 1 7 ,7 4 1 9 82 ,604 1 ,0 6 5 ,8 6 3 1 ,12 9 ,0 9 6 1,2 2 9 ,4 2 2 1 ,4 5 9 ,8 9 9 1 5 1 9 , 1 1 4 1 ,2 18 ,4 0 0 6 18 ,6 3 4 79 9 ,0 6 5 7 4 0 ,7 4 5 6 54 ,2 4 6 5 3 0 ,7 6 7 6 08 ,58 0 8 9 3 ,4 6 5 87 6 ,286 9 19 ,0 2 1 8 14 ,6 2 4
S H A R E H O L D E R S 'F U N D S (37 2 ,2 7 0 1 (572 ,59 4 ) (7 5 3 ,18 3 ) ( 1 ,0 2 0 ,19 4 ) ( 1 .4 0 0 ,2 9 6 ) (2 ,0 7 0 ,54 5) ( 16 6 2 ,9 10 ) ( 4 ,15 0 ,5 5 7 ) (9 ,3 0 8 ,13 8 ) ( 9 ,8 3 5 ,12 7 ) ( 10 ,3 17 ,3 0 0 ) (9 ,8 9 2 ,7 7 1) ( 10 ,5 0 9 ,6 18 ) ( 12 ,2 0 1 ,6 9 2 ) ( 1 4 ,2 6 1 , 1 3 3 ) ( 14 ,6 4 4 ,3 5 3 ) ( 15 ,8 7 6 ,4 7 1 ) ( 18 .5 3 8 ,5 3 8 )
N O N -CU RREN T L IA B IL IT IE S 6 9 5,06 7 7 6 7 ,8 6 7 940,866 1,0 6 4 ,0 4 3 1 , 1 1 1 , 1 5 7 1 ,4 0 9 ,6 8 4 17 9 0 ,3 3 6 - • • • • • • • • 8 6 ,6 07 5 0 6 3 3
C U R R E N T L IA B IL IT IE S 59 4 ,944 7 8 7 ,3 3 1 8 7 8 ,18 0 1 .0 8 S .2 4 7 1 ,5 1 8 ,5 6 1 2 .12 0 ,7 6 0 1 3 9 1 6 8 8 5 ,3 6 8 ,9 3 7 9 ,9 2 6 ,7 7 2 10 ,6 3 4 ,19 2 11 ,0 5 8 ,0 4 5 1 0 ,5 4 7 ,0 17 1 1 ,0 4 0 ,3 8 5 12 ,8 10 ,2 7 2 15 ,15 4 ,5 9 8 15 ,5 2 0 ,6 3 9 16 .7 0 8 .8 8 S 19 ,3 0 2 ,3 2 9
TO T A L L IA B IL IT IE S 1 .2 9 0 ,0 1 1 1 ,5 5 5 , 1 9 8 1 ,8 19 .0 4 6 2 ,14 9 ,2 9 0 2 ,6 2 9 ,7 18 3 ,5 3 0 ,4 4 4 4 , 1 8 1 0 2 4 5 ,3 6 8 ,9 3 7 9 ,9 2 6 ,7 7 2 10 ,6 3 4 ,19 2 1 1 ,0 5 8 ,0 4 5 1 0 ,5 4 7 ,0 17 1 1 ,0 4 0 ,3 8 S 12 ,8 10 ,2 7 2 15 , 1 5 4 ,5 9 8 15 ,5 2 0 ,6 3 9 16 ,7 9 5 ,4 9 2 19 ,3 5 2 ,9 6 2
TO T A L FIN AN CING 9 17 ,7 4 1 9 82 ,604 1,0 6 5 ,8 6 3 1 ,12 9 ,0 9 6 1,2 2 9 ,4 2 2 1 ,4 5 9 ,8 9 9 1 , 5 1 9 , 1 1 4 1 ,2 18 ,4 0 0 6 18 ,6 3 4 79 9 ,0 6 5 7 4 0 ,7 4 5 6 54 ,2 4 6 5 3 0 ,7 6 7 6 08,58 0 8 9 3 ,46 5 87 6 ,286 9 19 ,0 2 1 8 14 ,6 2 4
N U M B E R OF EM PLOYEES 1,6 0 5 1 ,5 0 7 1 , 4 3 1 1 ,4 3 2 1 ,3 6 2 1 ,2 6 5 U 3 2 1,0 4 6 3 7 3 852 6 74 659 6 20 6 73 608 7 3 9 706 697
FIN AN CIAL RATIOS 19 5 3 1 9 9 4 ' 19 9 5 19 9 6 " 1 9 9 7 ' 1 9 9 8 ' 1 9 9 9 ' 2 0 0 0 ' 2 0 0 1 ’ 2 0 0 2 ' 2 0 0 3 ' 2 0 0 4 ' 2 0 0 5 ' 2 0 0 6 ' 2 0 0 7 ' 2 0 0 8 ' 2 0 0 9 ' 2 0 10
ROA (EBIT/TOTAL A SSETS] (0 .12 ) ( 0 .15 ) (0-08) (0 .07) (0 .16 ) (0 .2 5 ) (0 .19 ) (0.49) (7 .08) (0.08) (0 .12 ) 1 .2 8 (0 .40) (0 .19 ) (0 .77 ) ( 1 3 2 ) (0 .94) ( 2 .8 1)
N P M (N ET PRO FIT/TO TA l INCOME) (0 .6 1) (0 .52 ) (0 .4 1) (0 .3 5 ) (0 .62) ( 1 .4 5 ) (0.66) ( 1 4 8 ) (2 6 .2 3) (0 .87) (0 .46) 0 .3 5 (0 .54) ( O i l ) (0 .58 ) ( 0 3 4 ) (0 .65) ( 1 .5 7 )
LOGARITHM O f TO TA LA SSETS S.96 5.99 6 .0 3 6 .0 5 6 .09 6 .16 6 . 18 6.09 5 .7 9 5 .9 0 5 .8 7 5 .8 2 5 .7 2 5 .7 8 5 .9 5 5 .94 5 .9 6 5 .9 1
LOGARITHM OF TOTAL SALES 5 .3 7 5 .59 5 .64 5 .8 8 5 .7 9 5 .6 7 5 .9 5 5 .79 5 .2 9 5 .7 8 6 .02 6 .08 6.06 6 . 12 6 .32 6 .20 6 .28 6 .2 3
CURREN T RATIO (C A /C l) 0 .29 0 .2 5 0 .2 8 0 .2 3 0 .1 8 0 . 1 9 0 . 3 1 0 . 1 1 0 .0 2 0.04 0.04 0.04 0 .0 3 0 .0 3 0.04 0 .0 3 0 .0 3 0 .0 2
TOTAL DEBT TO TOTAL ASSE TS RATIO 1 .4 1 1 .5 8 1 . 7 1 1 .9 0 2 . 1 4 2 .4 2 2 .7 5 4 .4 1 16 . OS 1 3 . 3 1 14 .9 3 1 6 . 1 2 20 .8 0 2 1 .0 5 16 .9 6 1 7 . 7 1 18 .2 8 2 3 .7 6
INVENTO RY TO TOTAL ASSETS RATIO 0 . 1 1 7 0 . 1 4 1 0 . 1 1 9 0 . 1 1 3 0 . 1 2 6 0 . 1 3 4 0 . 1 2 7 0 .1 6 5 0 . 1 2 2 0 .19 4 0 .2 9 1 0 .2 88 0 .2 4 5 0 .19 7 0 .2 7 9 0 .368 0 .2 3 5 0 1 9 3
LOGARITHM OF SA LES TO EMPLOYEES RATIO 2 .17 2 .4 1 2 .4 9 2 .7 2 1 6 5 2 .56 2 .9 0 2 .7 7 2 .7 2 2 .8 5 3 .2 0 3 .2 7 3 .2 6 3 .3 0 3 .5 4 3 3 3 3 .4 3 3 .3 9
SALES TO EMPLOYEES RATIO 14 7 .2 8 2 5 7 .7 3 30 7 .8 9 5 2 8 .5 3 4 4 7 .7 9 36 6 .4 6 7 9 G 6 3 58 2 .8 8 S 2 2 .19 7 1 4 3 7 1 ,5 6 9 .7 4 1 ,8 4 4 .3 9 1 ,8 3 5 .4 4 1 ,9 7 3 .2 3 3 ,4 7 3 . 19 2 , 14 1 .0 6 2 ,6 7 8 .5 3 2 ,4 2 7 .3 2
CONTRO LUNG SHAREHOLDING (GOK) 0 .8 278 0 .8 2 7 8 0 .8 27 8 0 .8 2 7 8 0 .8 2 7 8 0 .8 27 8 0 .8 2 7 8 0 .8 2 7 8 0 .8 27 8 0 .8 2 7 8 0 .8 2 7 8 0 .8 2 7 8 0 .8 27 8 0 .8 2 7 8 0 .8 2 7 8 0 .8 2 7 8 0 .8 27 8 0 .8 2 7 8
FOREIGN INVESTO RS SHAREHOLDING 0 .17 2 2 0 . 1 7 2 2 0 . 1 7 2 2 0 . 1 7 2 2 0 . 1 7 2 2 0 .1 7 2 2 0 . 1 7 2 2 0 . 1 7 2 2 0 . 1 7 2 2 0 . 1 7 2 2 0 . 1 7 2 2 0 . 1 7 2 2 0 . 1 7 2 2 0 . 1 7 2 2 ai722 0 . 1 7 2 2 0 . 1 7 2 2 0 . 1 7 2 2
No employment data was available for years 1993 to 1998 and esti mates were obtained
65

APPENDIX!. MIW AN! SUGAR COMPANYEXTRACTOF FINANCIAL STATEMENTS r f r
STA JEMENT O f COMPREHENSIVE INCOME ' 1 9 1 } 19 9 4 ' 19 9 5 ' 1 9 9 6 ' 1 9 9 7 ' 1 9 9 9 ' 1 9 9 9 ' 2 000 2 0 0 1 2 0 0 2 ' 2 0 0 3 200 4 20 0 $ 2006 2 0 0 7 200 8 2 00 9 2 0 10
KSHS'OCO KSHS'000 XSHS'000 KSHS'000 KSHS'000 KSHS’OOO XSHS'000 XSHS'000 KSHS'000 XSHS'000 XSHS'000 m m KSHS'000 XSHS'000 KSHS’OOO KSHS'000 KSHS'000 KSHS'000
7DTAI INCOME S 6 0 5 9 4 2 2 5 ,7 1 3 14 ,6 2 1 5 7 5 4 9 2 0 ,6 8 s 2 2 5 0 0 2 9 5 0 1 3 6 ,3 2 8 4 1 3 9 8 7 5 , 1 1 7 7 1 ,6 0 8
TOTAL EXPENSES (9 9 3 0 7 9 ) 1 1 , 2 1 7 4 6 1 ) (6 0 2 ,12 6 ) ( 5 1 4 5 8 2 ) (S8 5,949) ( 7 2 6 4 4 7 ) ( 9 1 4 3 8 0 ) ( 1 . 1 3 8 ,4 8 0 ) ( 1 ,4 0 ) ,8 2 2 ) ( 2 3 2 7 , 1 8 1 ) (2 ,4 9 0 ,7 6 0 )
EBIT . ( 3 3 2 4 4 5 ) (9 9 14 4 8 ) ( 5 8 7 5 0 5 ) (4 5 6 5 3 3 ) (56 5,06 4} (7 0 3 ,7 4 7 ) ( 8 8 5 3 7 9 ) ( 1 , 1 0 2 , 1 S 2) ( 1 3 6 3 5 2 4 ) ( 2 3 S 2 3 6 4 ) ( 2 3 1 9 3 5 2 )
FINANCE COSTS/INCOM E (NET) (9 9 4 2 8 4 ) (8 7 ,4 19 ) (99 ,055) ( 10 7 ,10 9 ) ( 12 2 ,5 3 4 ) ( 14 2 ,4 7 2 ) ( 1 5 5 3 8 8 ) ( 1 7 2 , 1 6 1 ) ( 10 4 3 5 8 ) ( 18 0 3 7 5 ) ( 1 6 6 3 4 2 )
TAXATION . • • • • • *
LOSVPROFIT AFTER TAXATION • • • ( 1 ,3 2 6 4 2 9 ) ( 1 4 7 9 4 6 7 ) 16 86 ,560) (5 6 4 4 4 2 ) (6 8 7 ,59 8) ( 8 4 6 4 19 ) ( W « , 5 6 7 ) ( 1 2 7 4 , 3 1 3 ) ( 1,4 6 4 ,7 8 2 ) ( 2 5 3 2 , 1 3 9 ) (2 5 8 5 ,9 9 4 )
STATEMENT OF FINANCIAL POSITION
N O N -C U R R E N T A S S E T S 4 3 1 4 3 8 3 5 2 ,9 8 8 2 8 8 ,7 7 5 2 3 4 , 1 5 5 19 8 ,5 5 8 16 7 ,3 3 5 1 3 2 ,0 1 6 99,402 1 3 8 4 3 3 6 1 ,7 5 2 ,7 4 5 1 5 4 4 3 4 5
C U R R E N T A S S E T S • . 1 3 7 4 1 4 . 4 2 4 2 6 7 2 7 9 6 5 2 4 6 ,760 S 3 4 3 2 3 5 1 6 ,19 2 18 ,2 2S 2 3 ,4 3 5 4 2 ,4 4 5
Inventories 43 4 38 1 9 4 2 3 1 5 3 0 1 5 3 0 1 ,6 7 3 1 5 7 3 1 5 9 2 1 ,5 9 2 1 ,5 9 5 1 3 3 0 1 3 8 2
Current A ssets n et o f f Inventories 9 3 4 76 2 3 4 0 3 5 ,74 9 5 4 9 4 5,087 3 ,3 7 0 1 3 5 9 4 ,600 1 6 3 3 0 2 1 ,6 0 5 4 1,0 6 3
T O T A L A S S E T S* • 5 6 9 3 5 2 • 3 9 5 ,9 14 2 9 6 4 5 4 2 4 0 ,7 7 9 2 0 5 ,3 18 1 7 2 5 7 8 1 3 4 3 6 7 10 5 X 9 4 1 3 1 1 2 3 6 1 1 ,7 7 6 ,18 0 1 ,6 8 7 2 9 0
S H A R E H O L D E R S 'F U N D S ( 1 2 4 9 , 17 8 ) (3 ,6 8 7 4 19 ) ( 4 5 7 3 5 7 9 ) ( 4 4 3 7 ,6 2 1) (5 ,6 2 5 ,2 19 ) (6 ,4 7 1 ,4 3 7 ) ( 7 5 1 2 ,0 0 4 ) (8 ,7 8 6 ,3 12 ) (6 ,4 6 5 3 9 4 ) ( 1 2 , 1 2 7 , 1 2 4 ) ( 1 4 , 7 1 3 3 1 8 )
N O N C U R R E N T L IA B IL IT IE S 14 5 3 ,7 5 8 1 5 8 3 , 1 7 7 1 , 0 8 1 5 7 7 762 ,689 6 3 5 ,4 2 1 7 4 3 3 8 6 8 1 1 X 7 1 1 .4 8 0 3 1 9 4 5 8 8 ,3 0 8 4 ,7 5 5 3 5 1
C U R R E N T L IA B IL IT IE S 1 4 1 8 4 3 0 3 4 2 9 , 1 7 5 3 5 86,456 4 4 9 6 ,4 2 3 5 ,0 6 7 ,8 4 8 5 ,9 4 8 3 9 4 6 3 0 3 ,5 8 5 8 X 8 0 ,0 3 5 8 3 8 8 ,2 3 6 9 3 14 ,9 9 6 1 1 , 6 4 5 3 5 7
T O T A L L IA B IL IT IE S • . . • 1 4 1 8 4 3 0 4 4 8 2 4 3 3 4 ,6 6 9 ,6 3 3 5 , 1 7 8 5 0 0 5 ,8 3 0 ,5 3 7 6 ,6 4 3 3 1 5 7 5 4 6 3 7 1 8 X 9 1X 0 6 10 3 6 8 ,4 5 5 1 3 3 0 3 3 0 4 16 ,4 0 0 ,4 0 8
T O T A L F IN A N C IN G • • * 5 6 9 3 52 3 9 5 ,9 14 2 9 6 ,0 54 2 4 0 ,7 7 9 2 0 5 ,3 18 1 7 2 3 7 8 1 3 4 3 6 7 10 5 ,5 9 4 1 5 0 2 ,8 6 1 1 ,7 7 6 , 18 0 1 5 8 7 3 9 0
NUMBER OF EMPLOYEES S 4 4 S29 S29 4 S 0 70 24 20 1 9 19 69 68 7 3
FINANCIAL RATIOS 19 9 3 r 1 9 9 4 ' 19 9 5 ' 19 9 6 ” 1 9 9 7 ' 1 9 9 1 ' 1 9 9 9 ' 2 0 0 0 ' 2 0 0 1 ' 2 0 0 2 ' 2 0 0 3 ' 2 0 0 4 ' 2 0 0 S ' 2 0 0 6 ' 2 0 0 7 ' 2 0 0 8 ' 2 0 0 3 ' 2 0 1 0
ROA (EBIT/TOTAL ASSETS) ' PDIY/Ol •0 IV /0 1 ' FOIV/OI fD lV /0 1 IOIV/OI ' IOIV/OI ( 0 i 8 ) ' flOlV/OI ( 2 2 1 ) ( 1 4 8 ) ( 1 4 0 ) (2-75) (4.08) (6 5 6 ) (10 .4 4 ) ( 0 3 1 ) ( 1 3 2 ) ( 1 .4 3 )
NPM (NET RROHT/TOTAL INCOME) ' l D I V / 0 1 FOIV/OI •D IV /0! ID iV /0! ID IV /01 ' IOIV/OI ( 2 2 7 ) IO<V/Ol (4.78) (4 6 4 6 ) (9 .73) (32 .9 2 ) ( 3 7 .6 1 ) ( 3 5 5 1 ) (3 5 X 8 ) ( 2 9 3 1 ) 1 3 3 3 1 ) ( 3 6 . 1 1 )
LOGARITHM OF TOTAL ASSETS ' INUMI IN U M I ' IN U M I ' INUM I IN U M I 9 IN U M I S .76 IN U M I 5.60 5 4 7 5 5 8 5 3 1 5 3 4 5 . 1 3 5 X 2 6 3 8 6 2 S 6 3 3
LOGARITHM OF TOTAL SALES ' INUMI ' FNUMI ' IN U M I ' IN U M I ' IN U M I ' INUM I 5 .7 5 ' IN U M I 5 J S 4 .16 4 .76 4 3 2 4 3 5 4 .47 4 i 6 4 3 9 4 3 8 4 .8 5
CURRENT RATIO (CA/Ct) ' fOIV/OI ' TOIV/OI ’ IOIV/C! ' IOIV/OI ID IV /0 ! ' IOIV/OI 0 .0 7 S 6 ' IOIV/OI 0 4 1 4 2 0 .0020 0 .0 0 16 0 X 0 1 3 03100 8 0 .0 00 4 0.0008 0 .0 0 2 1 0 ,0 02 5 0 3 0 3 6
TOTAL DEBT TO TOTAL ASSETS RATIO ’ eo iv /o i ' FOIV/O! ’ IOIV/OI ' ID IV /0! f IOIV/OI IOIV/OI 3 . 19 ' IOIV/OI 1 0 2 1 1 5 .7 7 2 1 5 1 2 8 .40 3 8 .5 4 56.66 8 4 .2 1 5 3 5 7 3 3 9 .7 2
INVENTOAYTO TOTAL ASSETS RATIO ' POIV/OI ' FOIV/OI ' IOIV/OI ' IOIV/OI r IOIV/OI ' FOIV/OI 0 .0 76 S ' IOIV/OI 0 .0 50 3 0 .0 0 5 2 0 .0 06 4 0 2 )0 8 1 03)097 0 3 3 1 18 0 X 1 5 1 0 .0008 0 3 0 1 0 0 5 0 0 6
LOGARITHM OF SALES TO EMPLOYEES RATIO ' IOIV/OI ' FOIV/OI ' IOIV/OI ' ID IV /0 ! r IOIV/OI r IOIV/OI 3 0 1 ' IN U M I 2 .63 1 5 1 2 4 2 2 .9 4 3 .0 5 3 .19 3 .2 8 2 J S 3 .0 4 2 3 9
SALES TO EMPLOYEES RATIO ' » V / 0 I ' FOIV/OI IOIV/OI ' KOIV/Ol ' HOIV/OI r IOIV/OI 1 4 3 0 2 9 • 4 26 .68 32 .4 9 8 2 7 4 4 8 7 0 3 1 1 , 1 2 5 3 3 0 1 ,5 4 2 . 1 6 1 ,9 1 2 X 0 7 1 4 3 6 13 0 4 .6 6 9 8 0 3 3
CONTROLLING SHAREHOLDING O i l O i l O i l O i l O i l O i l O i l O i l 0 5 1 0 5 1 O i l O i l 0 5 1 0 5 1 O i l 0 5 1 0 5 1 0 5 1
FOREIGN INVESTORS SHAREHOLDING 0.49 0.49 0.49 0.49 0.49 0.49 0 4 9 0 4 9 0 4 9 0 .49 0.49 0.49 0.49 0 3 9 0 X 9 0 3 9 0.49 0.49
The com pan y w as p u t u n d er-receiversh ip in 2 0 0 1 w ith onl> o p e ra t lo n b a n g c a n e fa rm in g In nucleus es ta te sin c e then. Som e data w as not a v a ila b le .
66

APPENDIX 9: CHIM IUlSUGAR COMPAM*EXTRACT OP FINANCIAL STATEMENTS
STA TEM EN T OF C O M PR EH EN SIV E IN C O M E * 19 9 3 * 19 9 4 * 19 9 5 19 9 6 1997 ' i s n 1999
tS H S '00 0 KSH S'000 KSH S'000 KSH S'000 KSH S'000 KSH S'000 KSH S'000
T O T A U N C O M l 5 8 9 ,8 8 1 1 ,0 5 8 ,0 3 6 1 , 3 3 3 ,3 0 1 1 ,6 1 5 ,6 5 6 1 ,9 3 9 , 1 0 5 J , 7 0 1 ,0 7 8 2 ,0 18 ,2 0 9
TOTAL EXPEN SES 1660,989) ( 1,0 0 9 ,6 7 8 ) ( 1 ,2 3 8 ,6 12 ) ( 1 ,4 6 1 ,8 9 9 ) (1 ,6 9 8 ,5 8 7 ) (1 ,8 4 2 ,9 0 7 ) (1,9 88 ,0 8 6 )
EBIT 2 8 ,89 2 4 8 ,358 9 4 ,6 89 15 3 ,7 5 7 2 4 0 ,5 18 ( 14 1 ,8 2 9 ) 3 0 , 1 2 3
FIN A N CE CO STS/ INCOM E (NET) 6 , 1 1 2 2 2 ,7 5 8 9 ,2 2 0 1 1 , 2 7 9 (2 3 ,9 5 7 ) ( 6 5 ,3 12 1 (5 9 ,6 3 7 )
TAXATION (17 ,4 6 0 ) (15 ,0 0 0 ) (34 ,6 3 4 ) (4 2 ,3 2 2 ) (36 ,0 0 2 ) •
LO SS/PRO FIT AFTER TAXATION 17 ,5 4 4 5 6 , 1 1 6 6 9 ,2 7 5 1 2 2 ,7 1 4 18 0 ,5 5 9 ( 2 0 7 , 1 4 1 1 ( 2 9 ,5 14 )
STA TEM EN T OF FIN A N CIA L POSITION
N O N -CU R R EN T A S S E T S 3 12 ,2 4 0 34 3 ,8 6 9 4 17 ,2 6 6 5 9 2 ,2 16 2 ,06 4 ,8 4 8 2 ,09 0 ,84 6 2 ,3 17 , 1 6 9
C U R R E N T A S S E T S 3 3 3 ,7 0 8 3 5 3 ,6 4 5 369,696 4 12 ,4 5 3 6 7 3 ,6 2 8 6 12 ,7 2 8 4 2 6 ,16 7Inventories 1 7 1 ,0 8 8 2 28 ,29 4 2 6 1,4 0 5 2 8 2 , 1 2 2 4 39 ,0 84 3 6 3 ,9 3 3 2 4 8 ,54 7
C u rr e n t A s s e t s n e t o f f I n v e n to r ie s 16 2 ,6 2 0 1 2 5 , 3 5 1 10 8 ,2 9 1 1 3 0 ,3 3 1 2 3 4 ,5 4 4 2 4 8 ,7 9 5 17 7 ,6 2 0
TO TA L A S S E T S 6 45 ,9 4 8 6 9 7 ,5 14 786,962 1 ,0 0 4 ,6 6 9 2 ,7 3 8 ,4 7 6 2 ,7 0 3 ,5 7 4 1 7 4 3 ,3 3 6
S H A R E H O LD ER S* FU N D S 3 2 9 ,7 2 8 3 8 1 ,3 7 9 4 4 6 ,6 2 5 5 5 3 ,0 1 7 2 , 0 1 1 , 3 1 0 1 ,8 1 7 ,2 6 9 1,7 8 4 ,5 2 7
N O N -CU RREN T L IA B IL IT IE S 3 8 ,3 7 6 8 8 ,3 7 6 7 0 ,00 0 7 0 ,0 0 0 10 6 ,0 0 0 5 0 ,0 00 2 5 ,0 0 0
C U R R E N T L IA B IL IT IE S 2 7 7 ,8 4 4 2 2 7 ,7 5 9 2 7 0 ,3 3 7 3 8 1 ,6 5 2 6 2 1 , 1 6 6 8 3 6 ,3 0 5 9 33 ,8 0 9TO T A L L IA B IL IT IE S 3 16 ,2 2 0 3 1 6 , 1 3 5 3 4 0 ,3 3 7 4 5 1 ,6 5 2 7 2 7 , 16 6 88 6 ,30S 9 58 ,8 09TO T A L FIN A N CIN G 6 45 ,9 4 8 6 9 7 ,5 14 7 8 6 ,9 62 1 ,0 0 4 ,6 6 9 2 ,7 3 8 ,4 7 6 2 ,7 0 3 ,5 7 4 1 7 4 3 ,3 3 6
N U M B E R OF EM PLO YEES 1 , 5 1 0 1 ,5 0 5 1 ,4 3 0 1 ,4 3 0 1 3 6 5 1 , 3 5 0 1 ,3 2 9
FIN AN CIA L RATIOS 1 9 9 3 ' 1 9 9 4 ' 19 9 5 19 9 6 1 9 9 7 ' 1 9 9 8 ' 19 9 9 '
ROA (EBIT/TO TAL ASSETS) 0 .04 0 .0 7 0 . 1 2 0 . 1 5 0 .0 9 (0 .05) 0 .0 1
N P M (N ET PRO FIT/TO TAL INCOME) 0 .0 3 0 .0 5 0 .0 5 0 .0 8 0 .0 9 ( 0 .12 ) ( 0 .0 1)
LOGARITHM OF TO TAL A SSETS 5 .8 1 5 .8 4 5 .9 0 6 .00 6 .4 4 6 .43 6 .4 4
LOGARITHM OF TO TAL SALES 5.84 6 .02 6 . 1 2 6 .2 1 6 .2 9 6 .2 3 6 .3 0
C U RREN T RATIO (CA/CL) 1 .2 0 1 .5 5 1 . 3 7 1 .0 8 1 .0 8 0 .7 3 0 .4 6
TO TAL DEBT TO TOTAL A SSE T S RATIO 0.49 0 .45 0 .4 3 0 .4 5 0 .2 7 0 .3 3 0 .3 S
IN VEN TO RY TO TO TAL A SSE TS RATIO 0.2 6 5 0 .3 2 7 0 .3 3 2 0 .2 8 1 0 .1 6 0 0 . 1 3 5 0 .0 9 1
LOGARITHM OF SA LES TO EM PLOYEES R A W 2 .66 2 .8 5 2 .9 7 3 .0 5 3 . 1 5 3 . 1 0 3 . 1 8
SA LES TO EM PLOYEES RATIO 4 5 6 .8 7 7 0 3 .0 1 9 3 2 .3 8 1 1 2 9 .8 3 14 2 0 .5 9 12 6 0 .0 6 1 ,5 1 8 .5 9
CONTRO LLIN G SHAREHOLDING (GOK) 0 .9 7 1 1 0 .9 7 1 1 0 .9 7 1 1 0 . 9 7 1 1 0 . 9 7 1 1 0 . 9 7 1 1 0 . 9 7 1 1
FOREIGN IN VESTO RS SHAREHOLDING 0.0 2 89 0 .0 2 89 0 .0 2 89 0 .0 2 8 9 0 .0 2 8 9 0 .0 2 8 9 0 .0 2 8 9
No employment data was available for years 1993 to 1998 and estimates were obtained

2 0 0 0 ' 2 0 0 1 ' 2 0 0 2 ' 2 0 0 3 ' 2 0 0 4 'r
200 5 2 006 ' 2 0 0 7 ' 2 0 0 8 ' 2009
KSH S'000 KSH S'000 K SH S'000 KSH S'000 K SH S’OOO KSH S‘00 0 KSHSOOO KSH S’OOO K SH S'000 KSHSOOO
2 ,2 4 7 ,4 10 1 ,5 7 8 ,4 4 2 1 ,6 0 2 ,5 2 0 1 ,7 4 7 ,5 2 5 1 ,7 2 7 ,5 6 9 2 , 14 3 ,5 4 0 2 ,4 5 5 ,7 15 2 ,4 3 2 ,9 5 9 2 ,5 10 ,6 5 4 1.6 7 6 ,4 7 9
( 2 ,0 4 1 , 18 6 ) ( 1 ,5 3 2 ,0 6 5 ) (1 ,7 2 9 ,6 4 0 ) (2 ,0 8 7 ,2 7 7 ) ( 1 ,7 8 8 ,9 9 2 ) (2 ,0 8 3 ,2 7 1) (2 ,5 7 8 ,8 0 5 ) (2 ,3 3 4 ,5 8 2 ) (2 ,7 0 2 ,3 5 5 ) (2 ,6 4 0 ,8 2 3)
2 0 6 ,2 2 4 4 6 ,3 7 7 ( 12 7 , 1 2 0 ) (3 3 9 ,7 5 2 ) ( 6 1 ,4 2 3 ) 6 0 ,2 69 ( 12 3 ,0 9 0 ) 9 8 ,3 7 7 ( 1 9 1 ,7 0 1 ) (9 6 4 ,34 4)
(59 ,6 9 7 ) (42 ,906) (3 8 ,3 2 6 ) 6 ,0 9 5 7 , U S ( 19 6 6 ) 2 ,7 2 0 2 1 ,5 6 0 (10 ,8 4 4 ) (2 1 ,8 7 2 )
(18 ,8 2 7 ) (10 ,6 4 2 ) 5 5 ,4 5 3 8 8 ,00 5 2 2 ,16 8 (2 4 ,5 10 ) 1 1 ,4 9 3 (3 3 ,9 7 6 ) 19 6 ,5 9 2 2 5 5 ,7 2 8
12 7 ,7 0 0 ( 7 , 1 7 1 ) ( 10 9 ,9 9 3 ) (2 4 5 ,6 5 2 ) (3 2 ,14 0 ) 3 3 ,7 9 3 (10 8 ,8 7 7 ) 8 5 ,9 6 1 (5 ,9 5 3 ) (730 ,4 88 )
2 , 3 1 9 , 1 3 4 2 ,3 3 5 , 16 7 2 ,3 2 5 ,9 16 2 ,3 8 4 ,5 8 7 2*323*879 2 ,0 9 9 ,2 8 7 2 ,16 6 ,5 5 9 1 ,9 5 0 ,9 7 9 2 ,9 5 3 ,4 2 0 1 7 7 7 ,8 2 8
6 10 ,9 9 2 6 5 9 ,3 5 3 8 22*4 50 4 4 6 ,8 0 1 4 6 0 ,3 5 1 6 7 7 ,5 2 0 6 0 5 ,9 7 8 9 3 0 ,2 7 2 9 4 5 ,8 9 3 8 4 3 ,4 9 3
3 1 3 ,8 3 3 37 7 ,8 0 5 6 17 ,0 9 8 2 8 2 ,59 9 2 6 8 ,9 77 2 8 3 , 14 5 3 0 1 ,8 5 5 3 6 8 ,4 0 3 5 2 2 ,9 3 4 5 0 8 ,0 2 6
2 9 7 ,15 9 2 8 1,5 4 8 2 0 5 ,3 5 2 16 4 ,2 0 2 1 9 1 , 3 7 4 3 9 4 ,3 7 5 3 0 4 , 1 2 3 5 6 1 8 6 9 4 2 2 ,9 5 9 3 3 5 ,4 6 7
2 ,9 3 0 ,1 2 6 2 ,9 9 4 ,5 2 0 3 ,14 8 ,3 6 6 2 ,8 3 1 ,3 8 8 2,7 84 ,230 2 ,7 7 6 .8 0 7 2 * 7 7 2 ,5 3 7 2 ,8 8 1 ,2 5 1 3 ,8 9 9 ,3 13 3 , 6 2 1 3 2 1
1 ,5 5 3 ,5 8 0 1,5 4 2 ,0 9 6 1 ,4 3 2 , 1 0 3 1* 2 2 7 ,5 4 3 1 1 9 5 , 4 0 3 1* 2 2 9 ,19 6 1* 12 0 * 3 19 1 ,2 0 6 ,2 8 0 1 ,6 3 5 ,9 7 9 88 7,9 8 6
3 5 3 ,7 1 2 36 3 ,9 0 0 3 0 8 ,6 7 8 2 8 7 ,7 5 7 6 19 ,0 6 5 3 5 2 ,2 4 2 6 5 9 ,3 0 2 5 3 6 ,6 4 3 1 , 1 8 6 ,4 1 3 7 57 ,9 7 0
1 ,0 2 2 ,8 3 4 1,0 8 8 ,5 2 4 1 ,4 0 7 ,5 8 5 1 ,3 16 ,0 8 8 9 6 9 ,7 62 1* 19 5 ,3 6 9 9 9 2 ,9 16 1 , 1 3 8 ,3 2 8 1 0 7 6 , 9 2 1 1 9 7 5 ,3 6 5
1 ,3 7 6 ,5 4 6 14 5 2 ,4 2 4 1 ,7 1 6 ,2 6 3 1 ,6 0 3 ,8 4 5 1*588*827 1* 5 4 7 ,6 1 1 1 6 5 2 , 2 1 8 1 ,6 7 4 ,9 7 1 2 ,2 6 3 ,3 3 4 1 7 3 3 , 3 3 5
2 ,9 3 0 ,1 2 6 2 ,9 9 4 ,5 2 0 3 ,14 8 ,3 6 6 2 ,8 3 1 ,3 8 8 2 ,7 8 4 ,2 3 0 2 ,7 7 6 ,8 0 7 2 ,7 7 2 ,5 3 7 2 , 8 8 1 2 5 1 3 ,8 9 9 ,3 13 3 , 6 2 1 3 2 1
1* 2 2 7 1,122 1 * 1 1 9 1 , 1 6 4 1 ,0 9 2 1 , 0 1 9 1 0 1 9 976 9 7 3 887
r * r r r •2 000 2 0 0 1 2 0 0 2 2 00 3 2 004 200 5 2006 200 7 2008 2009
0 .0 7 0 .0 2 (0 .04) ( 0 .12 ) (0 .02) 0 .0 2 (0 .04) 0 .0 3 (0 .05) ( 0 2 7 )
0 .0 6 (0.00) (0 .0 7 ) ( 0 .14 ) (0-02) 0 .0 2 (0.04) 0.04 (0.00) (0 .44)
6 .4 7 6 .48 6 .5 0 6 .4 5 6 .4 4 6.44 6 .44 6 .46 6 .59 6 .56
6 .3 5 6 .2 0 6 .2 0 6 .24 6 2 4 6 .3 3 6 .39 6 .39 6 .40 6 2 2
0 .6 0 0 .6 1 0 .5 8 0 .3 4 0 .4 7 0 .5 7 0 .6 1 0 .8 2 0.88 0 .4 3
0 .4 7 0 .49 0 .5 5 0 .5 7 0 3 7 0 .56 0 .6 0 0 .58 0 .58 0 .7 5
0 . 1 0 7 0 .1 2 6 0 .19 6 0 . 1 0 0 0 .0 9 7 0 . 1 0 2 0 .10 9 0 .1 2 8 0 . 1 3 4 0 .14 0
3 .2 6 3 . 1 5 3 . 1 6 3 . 1 8 3 .2 0 3 .3 2 3 .3 8 3.4C 3 .4 1 3 2 8
1 ,8 3 1 .6 3 1* 4 0 6 .8 1 1 ,4 3 2 . 1 0 1 , 5 0 1 . 3 1 1 ,5 8 2 .0 2 2 , 1 0 3 3 7 2 ,4 0 9 .9 3 2 ,4 9 2 .7 5 2 ,5 8 0 .3 2 1 ,8 9 0 .0 6
0 3 7 1 1 0 .9 7 1 1 0 3 7 1 1 0 3 7 1 1 0 . 9 7 1 1 0 . 9 7 1 1 0 . 9 7 1 1 0 .9 7 1 1 0 .9 7 1 1 0 .9 7 1 1
0 .0 2 89 0.0289 0 .0 2 89 0 .0 2 8 9 0 .0 2 8 9 0 .0 2 8 9 0 .0 2 89 0 .0259 0 .0 2 89 0 .0 2 8 9
2010KSH S'000
1 ,7 5 9 ,4 5 9
(2 ,29 6 ,9 0 2 )
(5 3 7 ,4 4 3 )
(5 8 ,0 19 )
17 1 ,7 9 9
(4 2 3 ,6 6 3)
2 ,9 2 0 ,3 4 0
7 16 ,5 4 4
4 78 ,6 7 8
2 3 7 ,8 6 6
3 .6 3 6 .8 8 4
4 6 4 ,3 2 3
5 4 1 , 1 9 7
2 ,6 3 1 ,3 6 4
3 , 1 7 2 ,5 6 1
3 .6 3 6 .8 8 4
8 9 1
2010( 0 .15 )
(0 .24)
6 .5 6
6 .2 5
0 .2 7
0 .8 7
0 . 1 3 2
3 .3 0
1 ,9 7 4 .7 0
0 .9 7 1 1
0 .0 2 8 9
67

A PPEN D IX 10 : M U M l AS SU O A R C O M P A N Y
EXTRACT OP FINANCIAL STATEMENTS
STATtMCNT OP COMPREHENSIVE INCOME 1 9 9 3 ' u m ' 1995 r 1996 1 9 9 7 ' 1 9 9 8 ' 1 9 9 9 ' 2 0 0 0 ' 2001 * 200 2 'KSHS'OOQ KSHSOOO KSHSOOO KSHSOOO KSHStXX) KSHSOOO KSHSOOO KSHSOOO KSHSTXX) KSHSOOO
T O T A L IN C O M E X 157,704 5,087,741 5,557,003 6.171,027 6,575,758 6,196,927 6,450,967 9,968,570 6,777.113 7,847,233TOTAL EXPENSES (3,005,424) (4,649,504) (4,428.154) (5 .2 8 0 ,8 9 7 ) (5 ,8 7 4 1 8 7 ) (5,816(530) (494 4 .1 7 5 ) (8,380,896) (5.645,439) (7.651,265)EBIT 152,280 438,237 1,128,849 890,130 701,571 380,397 506.792 158 7 ,6 7 4 113 1 ,6 7 4 195,968FINANCE COSTS/ INCOME (NET) (2 2 ,3 5 8 ) (49,424) (16,955) (91,627) (387,426) (385.149) (551.349) (212,135) (4,774) (5X 323)EXCEPTIONAL ITEMS • • (449,189) (230.856) (185,703) (108.642) • (4 4 1 2 7 1 ) (441,679) (39,093)TAXATION (CHARGE)/ CREDIT 262,901 315.970 (230,149) (122.386) (32,570) (25,468) 14,505 (304,054) (202,421) (39.436)LOSS/PROFIT AFTER TAXATION 192.826 704,783 881,745 676.117 281.575 (3 a 2 2 0 ) (30,052) 107 1 .485 924,479 104.209
STATEMENT OF FINANCIAL POSITION101-C U R R EN T A SSETS 2,784,752 3,099,532 3,858,841 5,859,229 6,353,312 6,307,436 6.020,420 5.748,422 6,521,693 6,220,884CURRENT A SSETS 168 1 .7 2 3 2,205,147 1,802.714 2,139,274 1 8 8 9 ,0 4 9 2.246,675 3,231,990 X 483,834 3,693,443 3,38X 228hvw itoriM 574,707 931,393 1,028.125 736,789 923,546 1.444,523 2.364.218 139 5 .7 2 7 2,527,465C u rre n t A sse ts n e t o f 1 1 n v en to ries L 107,016 1,273,754 774,589 1.402,485 965,503 802.152 867,772 1,088,107 X 165,978 3,383,228TOTAL A SSETS 4,466,475 5,304,679 5,661.555 7,998.503 8,242.361 8.554. I l l 9,252,410 8,232,256 10,215,136 9,604.112
SH A REH O LD ER S' FUNDS 3,493,800 4,199,662 4,477,036 5,118,368 5,206,852 3,999,898 3.885,642 4,221,015 5,354,095 5,08X 736NON-CURRENT LIABILITIES • 324,063 1.033,620 884,929 1,282.188 2.107.475 2.016,370 2.121,663 X 973.448CURRENT LIABILITIES 972,675 1,105,017 860,456 1,846,515 2,150,580 3,272.025 3,259,293 X 994,871 2.739,378 X 544,928TOTAL LIABILITIES 972,675 1.105,017 1.184,519 2,880,135 3,035,509 4 ,554,213 5,366,768 4,011,241 4,861.041 4,518,376TOTAL FINANCINO A 466.475 5,304,679 5,661,555 7,996.503 8,242.361 8,SS4,111 9.252.410 8 2 3 2 ,2 5 6 10,215,136 9.604,112
NUMBER OF PERMANENT EMPLOYEES 5,111 5,073 S.032 4,925 4 8 3 6 4.662 4,531 3,920 3,240 X 105
FINANCIAL RATIOS 1993' 1994' 1995 1996 1 9 9 7 ' 1998' 1999' 2000 ' 2001' 2002'ROA (EBIT/TOTAL ASSETS) 0 03 0.06 0 .2 0 0.11 0.09 0.04 aos 0.19 a n 0 .0 2NPM (NET PROF IT/TOTALINCOME) 0.12 0.14 0.16 0 .1 1 0.04 (0.00) (0.00) 0.11 a 14 0 .0 1LOGARITHM OF TOTAL ASSETS 6. €5 6.72 6.75 6 .9 0 6.92 6 3 3 6.97 6.92 7.01 6.98LOGARITHM OF TOTAL SALES 5.50 6.71 6.74 6.79 6.82 6.79 6.81 7.00 6.83 6.89CURRENT RATIO (CA/CL) 1.73 2.00 2.10 1.16 0.88 0.69 0.99 1.25 X35 1.33TOTAL DEBT TO TOTAL ASSETS RATIO 0.22 0.21 0 .2 1 0.36 0.37 0.S3 0 5 8 0.49 0.48 0.47INVENTORY TO TOTAL ASSETS RATIO 0.1287 0.1756 0.1816 0.0921 0.1120 0.1689 0.2555 0.1695 0.2474LOGARITHM OF SALES TO EMPLOYEES RATIO 2.79 3.00 3.04 3 .1 0 3.13 3.12 3.15 3.41 3.32 3.40SALES TO EMPLOYEES RAT1C 617.83 1,002.91 1,104.33 1,253.00 1,359.75 1.329.24 1.423.74 2,543.00 2,09X 70 2,527.29
CONTROLLING SHAREHOlD NG 0.7076 0.7076 0.7076 0.7076 0.7076 0.7076 0.7076 0.7076 0.5868 0.5868FOREIGN INVESTORS SHAREHOLDING 0.216 0.216 0.216 0.216 0.216 0 .2 16 0.216 0.216 0.0328 a 0 3 2 8OTHER SHAREHOLDING 0.0764 0.0764 0.0764 0.0764 0.0764 0.0764 0.0764 0.0764 0.3804 0.3804
NBFROM 1993 TO 2000, THE CONTROLLING SHAREHOLDING WAS THE GOVERNMENT, THEN THERE AFTER IT WAS THE PUBUC FOLLOWING PRIVATIZATION IN YEAR 2001
68
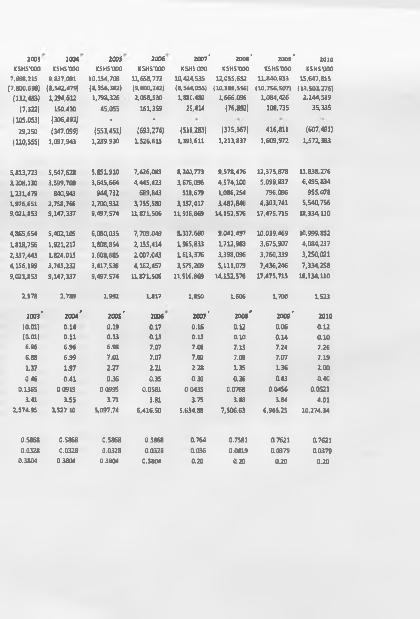
2003 2004 2005 2 0 0 6
KSHS'000 KSHS'000 KSHS'000 KSHS'0007.668.215 9,837,091 10,154,708 11.658.772
(7,800,698) (8,542,479) (8,356,382) (9,600,242)(132.483) 1,294,612 1,798,326 2,058,530
(7,322) 150,430 45,055 161,359(105,053) (306,492) • •
29,250 (347,099) (553,451) (693,274)(110,555) 1,097,943 1,289,930 1,526,615
5,813,723 5,547,628 5,851,910 7,426,0833,208,130 3,599,709 3,645,664 4,445,4231 2 3 1 ,4 7 9 840,943 944,732 689,8431.976,651 2,758,766 2,700,932 3,755,5809,021,853 9,147,337 9.497,574 1 18 71 ,50 6
4,865,6S4 5,402,105 6,080,035 7,709,0491,818,756 1,921,217 1,808,854 2 ,155,4142,337,443 1,824,015 1,608,68S 2,007,0434,156,199 3,745,232 3,417,539 4,162,4579,021,853 9,147,337 9,497,574 11,871,506
2,978 2,789 1,992 1.817
2 0 0 3 r 2 0 0 4 f 2 0 0 5 ' 2006(0.01) 0 .1 4 0.19 0.17(0.01) 0 .1 1 0.13 0.136.96 6.96 6.98 7.076.88 6.99 7.01 7.07L 3 7 1.97 2.27 2.210 46 0.41 0.36 0.35
0.1365 0.0919 0.0995 0.05813.41 3.55 3.71 3.81
2,574.95 3,527.10 5,097.74 6,416.50
0.5868 0.5868 0.5868 0.58680.0328 0 .0328 0 .0328 0.0328
0.3804 0.3804 0.3804 0.3804
2 0 0 7 ' 2 0 0 1 ' 2 0 0 9 ' 2010KSHS'000 KSHS'000 KSHS'000 KSHS'000
1 4 4 2 4 5 3 5 12,055,652 11,840,933 15,647,815(4544 ,055) (10.389.556) (10.756.507) (13,503,276)
188C.480 1.666.096 1 ,084,426 2,1 44 ,53925.414 (76,892) 108,735 35,335
(515,283) (375,367) 416.811 (607,491)1.393,611 1,213,837 1.609,972 1.572.383
8,243,773 9,578,476 12,375,878 1 1 ,8 3 4 2 7 63,675.096 4,574,100 5 ,099,837 6,4 95 .834
518,679 1,086,254 796,096 955,0783,157.417 3,487,846 4 ,303,741 5 ,5 4 4 7 5 6
11.916.869 14,152.576 17,475,715 18,334.110
433 7 ,6 6 0 9,041,497 10,039,469 10,999,8521,965,833 1,712,983 3 ,675.907 4,084,2371,613,376 3,398,096 3,7 60 ,339 3,250,0213,579,209 5,111.079 7 ,436,246 7 ,3 3 4 2 5 8
1 1 .9 1 6 .8 0 14,152,576 17,475,715 1 8 ,3 3 4 UO
1,850 1.606 1.700 1 5 2 3
2 0 0 7 ' 2008* 2 0 0 9 ' 20100.16 a u 0.06 0 .1 20.13 a i o 4 1 4 0 .1 07.08 7.15 7.24 7.267.02 7.08 7.07 7 .1 92.28 1.35 1.36 1 0 00.30 4 3 6 4 4 3 4 4 0
0.0435 0.0768 0.0456 0.05213.75 3.88 3.84 4.01
S,634 .88 7,506.63 6,965.25 10,274.34
0.764 0.7581 4 7 6 2 1 4 7 6 2 14 0 3 6 0.0419 4 0 3 7 9 4 0 3 7 90.20 4 2 0 4 2 0 0 .2 0

APPENDIX 11 :M0IA SUGAR COMPANYWTRAC1 O f FINANCIAL STATEMENTS
STATEM ENT OF COMPREHENSIVE INCOME 19 9 3 1 9 9 4 ' 1 9 9 5 ' 19 9 6 r 1 9 9 7 ' 19 9 8 ’ 19 9 9 ' 2000' 2001’ 2002' 2 0 0 3 ' 2 0 0 4 ' 200S ' 2 0 0 6 ' 2 0 0 7 ' 2 0 0 8 ' 2 0 0 9 ' 2010KSHStXX) KSHStXX) KSHStXX) KSHStXX) XSHStXX) XSHS’OOO XSHStXX) XSHStXX) XSHS'000 XSHStXX) KSHS'OOO KSHS’OOO KSHS'OOO KSHS'OOO XSHStXX) KSHS'OOO XSHStXX) KSHS'OOO
TOTAL INCOME 36 7,74 9 743,9 03 9 8 1 ,3 7 9 932 ,498 738,506 1,16 4 ,5 4 7 1,3 6 3 ,6 4 5 2,098 ,242 1 ,15 6 ,6 3 4 1,5 6 4 ,9 4 5 1,6 6 1 ,9 9 6 2 ,3 6 1 ,6 17 2 , 7 1 1 , 2 1 1 2 ,809 ,406 2 ,4 7 1 ,8 6 1 2 ,59 4 ,8 12 3 ,7 7 6 ,9 2 2 4 ,4 48 ,06 3
TOTAL EXPENSES (7 3 6 ,3 2 7 ) ( 1 , 1 6 3 ,3 5 3 ) (1,3 3 7 ,4 7 0 ) (1,2 2 8 ,6 29 ) ( 1 ,3 3 1 ,0 6 2 ) ( 1 ,7 2 5 ,2 6 2 ) (1,8 4 7 ,7 4 0 ) (2 ,0 12 .2 8 1) ( 1 ,4 0 9 ,7 12 ) (X 625 ,672) (1,7 2 0 ,7 2 9 ) (1,8 49 ,9 6 7) (2 ,6 4 5 ,6 5 1) (2 ,58 4 ,53 4 ) (2 ,6 0 6 ,0 12 ) 0 .9 19 ,0 15 ) (3 ,8 0 2 ,7 6 7 ) (3 ,9 27 ,780 )
EBIT (368,578) 14 4 9 ,4S0) 13 5 6 ,0 9 1) 12 9 6 ,1 3 1 ) (5 9 2 ,5S6) (5 6 0 ,7 15 ) (484,095) 8 5 ,9 6 1 (2 53,07 8) (60,727) (58 ,7 33) 5 1 1 ,6 5 0 65,56 0 2 24 ,872 ( 1 3 4 , 1 5 1 ) (3 34 ,2 0 3) (2 5 ,8 4 5) 520 ,28 3
FIN AN CE CO STS/IN CO M E ( m ) (189,677) (3 6 8 ,19 5) (5 10 ,8 2 9 ) (7 34 ,08 3) (7 8 4 ,2 10 ) ( 1 ,2 2 0 ,10 9 ) ( 1 ,0 3 0 ,3 1 3 ) (504,468) (478,887) (37 8 ,9 53) ( 1 3 2 ,7 1 3 ) (83,869) ( 1 1 8 ,4 0 5 ) ( 14 5 ,3 9 1) (2 23 ,4 4 2 ) ( 17 ,2 0 8 ) 6 ,302 (4 80 ,254 )
TAXATION - . . - . . . • • ( 12 8 ,3 3 4 ) • (2 0 ,8 14 ) • - * *
LOSS/PROFIT AFTER TAXATION (558 ,4 55) (8 17 ,6 4 5) (866,920) ( 1 ,0 3 0 ,2 14 ) (1,3 7 6 ,7 6 6 ) (1,7 8 0 ,8 2 4 ) ( 1 ,5 14 ,4 0 8 ) (4 18 ,5 0 7 ) (7 3 1,9 6 5 ) (439,680) ( 19 1 ,4 4 6 ) 299,447 (52 ,8 4 5) 58,667 (3 5 7 , S93) ( 3 5 1 ,4 1 1 ) (19 ,5 4 3 ) 40,029
STATEMENT OF FINANCIAL POSITIONNO N-CURRENT A S S E T S 3 ,7 4 3 ,2 15 4 ,4 7 2 ,8 3 3 4 ,5 2 7 ,9 2 3 5 ,29 3 ,79 5 5 ,29 3,803 5 ,6 3 9 ,3 5 7 7,46 9 ,6 30 7 ,6 2 2 ,4 39 7,565,948 7 ,4 9 4 ,5 11 7 ,360 ,567 7 ,2 3 0 ,3 5 5 7 ,13 8 ,8 6 7 7 ,3 2 1 ,7 7 1 7 ,280 ,36 4 7 ,345 ,2 6 8 7 ,3 2 2 ,3 7 1 6 , 1 5 3 ,3 4 1
C U R R E I T A S S E T S 2 4 8 ,2 2 7 4 10 ,3 0 0 596,909 7 5 0 ,9 10 590,889 689,369 535 ,8 9 7 5 3 9 ,2 1 1 59 1,6 6 2 5 3 9 ,6 16 803,440 1 ,10 6 ,2 5 6 1,3 8 7 ,0 9 7 1,5 6 8 ,6 4 7 1 ,6 0 6 ,19 1 1,6 9 5 ,4 8 2 1 ,8 0 3 ,8 0 7 4 ,8 0 5 ,5 7 7
k t v w f a t t t 12 9 ,9 0 3 16 5 ,54 8 16 8 ,4 5 7 19 4 ,8 4 1 205,998 244,890 2 48 ,20 7 3 1 1 , 7 5 2 3 7 1 ,9 6 7 39 1,4 0 4 446,037 4 2 9 ,10 4 3 8 4 ,13 3 37 4 ,7 9 7 38 3,26 4 740 ,403 7 12 ,2 8 7 8 4 7 ,6 7 1
C u rren t A s s e ts n e t o f f In ve n to ries 1 18 ,3 2 4 244 ,7 52 428 ,452 556 ,0 69 38 4 ,89 1 444,479 287,690 2 27 ,459 2 19 ,6 9 5 14 8 ,2 12 357 ,4 0 3 6 7 7 ,15 2 1,0 02 ,9 6 4 1 ,19 3 ,8 5 0 1,2 2 2 ,9 2 7 9 55 ,079 1 ,0 9 1 ,5 2 0 3,9 57 ,9 0 6
TO TA L A S S E T S 3 ,9 9 1,4 4 2 4 ,8 8 3 ,13 3 5 ,12 4 ,8 3 2 6,044 ,705 5 ,884,692 6 .328 ,72 6 8 ,0 0 5 ,5 2 7 8 ,16 1 ,6 5 0 8 .15 7 ,6 10 8 ,0 3 4 ,12 7 8 ,16 4 ,0 0 7 8 ,3 3 6 ,6 1 1 8 ,525 ,9 64 8 ,8 9 0 ,4 18 8,8 8 6 ,555 9 ,040 ,750 9 ,12 6 , 1 7 8 10 ,9 5 8 ,9 18
S H A R E H O L D E R S 'FU N OS ( 1,3 2 9 ,9 8 5 ) (2 ,22 9 ,2 34 ) ( 3 ,0 5 9 ,1 12 ) (4 ,10 8 ,2 7 0 ) (5 ,509 ,704) (7 ,4 14 ,5 3 3 ) (7 ,7 19 ,9 4 9 ) (7 ,794 ,366) (8 ,532 ,4 73) (8 ,9 7 2 ,15 3 ) (9 ,064,583) (8 ,7 6 5 ,136 ) (9 ,695,270) (9,686,680) ( 11 ,3 0 8 ,7 6 2 ) ( 11 ,3 4 6 ,2 0 7 ) ( 11 ,6 0 2 ,4 2 2 ) (9 ,836,9 57)
NON-CURRENT U A B IL IT IE S 3 ,6 1 1 , 1 3 8 3,800,465 3 ,4 2 2 ,2 5 1 3 ,2 8 4 ,4 2 0 3 ,0 58 ,3 2 7 2 ,52 4 ,74 9 2 ,13 5 ,7 5 9 1,6 7 8 ,9 6 3 948,588 7 0 3 ,14 4 246,099 324,000 300,000 • - • - -
CU RR EN T L IA B ILITIES 1 ,7 10 ,2 8 9 3 ,3 1 1 ,9 0 2 4 ,7 6 1,6 9 3 6 ,8 6 8 ,555 8 ,336 ,0 69 1 1 , 2 1 8 , 5 1 0 1 3 ,5 8 9 ,7 17 14 ,2 7 7 ,0 5 3 15 ,7 4 1 ,4 9 5 16 ,3 0 3 ,13 6 16 ,9 8 2 ,4 9 1 16 ,7 7 7 ,7 4 7 17 ,9 2 1 ,2 3 4 18 ,5 7 7 ,0 9 8 2 0 , 19 5 ,3 1 7 20 ,38 6 ,9 57 2 0 ,7 28 ,6 0 0 20 ,7 9 5 ,8 75
TO TAL LIA B ILITIES 5 ,3 2 1 ,4 2 7 7 , 1 1 2 ,3 6 7 8 ,18 3 ,9 4 4 10 ,15 2 ,9 7 5 11 ,3 9 4 ,3 9 6 13 ,7 4 3 ,2 5 9 15 ,7 2 5 ,4 7 6 15 ,9 5 6 ,0 16 16 ,6 9 0 ,0 63 17 ,0 0 6 ,2 8 0 17 ,2 2 8 ,5 9 0 17 ,10 1 ,7 4 7 18 ,2 2 1 ,2 3 4 18 ,5 7 7 ,0 9 8 2 0 , 19 5 ,3 1 7 20,386 ,957 2 0 ,7 28 ,60 0 2 0 ,7 9 5 ,87S
TO TAL FINANCING 3 ,9 9 1,4 4 2 4 ,8 8 3 ,13 3 5 ,12 4 ,8 3 2 6 ,044 ,705 5 ,884,692 6 ,328 ,72 6 8 ,0 0 5 ,5 2 7 8 ,16 1 ,6 5 0 8 ,15 7 ,6 10 8 ,0 3 4 ,12 7 8 ,16 4 ,0 0 7 8 ,3 3 6 ,6 1 1 8 ,52 5 ,9 64 8 ,8 9 0 ,4 18 8,8 8 6 ,555 9 ,040 ,750 9 , 12 6 , 1 7 8 10 ,9 5 8 ,9 18
N U M BER OF EMPLOYEES 2 ,54 0 2 ,54 0 2 ,360 2 ,360 2 ,2 7 5 2 ,2 1 5 2 ,14 5 2 ,0 36 1,9 5 6 1,8 9 6 1,7 8 9 1,6 9 4 1,5 9 0 1,5 9 8 1 ,3 8 0 1 ,3 0 7 1,2 6 4 1,0 6 8
FINANCIAL RATIOS 19 9 3 ' 19 9 4 ' 1 9 9 5 ' 19 9 6 ' 19 9 7 * 1 9 9 8 ' 19 9 9 ' 2000' 200l ' 2002' 2 0 0 3 ' 2 0 0 4 ' 2 0 0 S ' 2 0 0 6 ' 2 0 0 7 ' 2 0 0 8 ' 2 00 9 * 2010R O A (E8IT/TO TA l A SSETS) (0.09) (0.09) (0 0 7 ) (0 0 5 ) (0 .10 ) (0.09) (0.06) 0.01 (0 .03) (0 .0 1) (0 .0 1) 0.06 0.01 0.03 (0 0 2 ) (0.04) (0.00) 0.0 5
NPM (NET PROFIT/TOTAL INCOME) ( 1 .5 2 ) ( 1 . 1 0 ) (0.88) ( U O ) (1.8 6 ) (1-S 3 ) ( 1 . 1 1 ) (0.20) (0 .63) (0.28) (0 .12 ) 0 .1 3 (0.02) 0.02 (0 .14 ) (0 .14 ) (0 .0 1) 0.01LOGARITHM OF TOTAL ASSETS 6.60 6.69 6 .7 1 6 .78 6 .7 7 6.80 6.90 6 .9 1 6 .9 1 6 .90 6 .9 1 6.92 6.93 6.95 6.95 6.96 6.96 7.04
LOGARITHM OF TOTAL SALES 5 .5 7 5 .8 7 5.99 S37 5 .8 7 6 .0 7 6 . 1 3 6 .3 2 6.06 6 .19 6.22 637 6 .43 6.45 6.39 6 .4 1 6 .58 6.65
CURRENT RATIO (CA/CL) 0 . 1 5 0.12 0 1 3 0.11 0 0 7 0 .0 6 0.04 0.04 0.04 0 .0 3 0.0 5 0.07 0.08 0.08 0.08 0.06 0.09 0 .2 3
TOTAL DEBT TO TOTAL ASSETS RATIO 1 .3 3 1 .4 6 1 .6 0 1.68 1 .9 4 2 . 1 7 1 .9 6 1 .9 S 2.0S 2.12 2.11 2 .05 2 .14 2.09 2 .27 2 .26 1 2 7 1 .9 0
INVENTORY TO TOTAL A SSETS RATIO 0.0 33 0.034 0.0 33 0 .0 32 0 .0 35 0 .0 39 0 0 3 1 0 .038 0.046 0.049 0 .0 55 0 .0 5 1 0 .045 0.042 0.043 0.082 0.0 78 0 .0 77
LOGARITHM O f SALES TO EMPLOYEES RATIO 2.11 2 .4 7 2 .62 2 .6 0 2 .5 1 2 .7 2 2 .8 0 3 .0 1 2 .7 7 2 .9 2 2 .9 7 3 . 14 3 .2 3 3 .2 S 3 2 5 3 .30 3.48 3.62
SALES TO EMPLOYEES RATIO 14 4 .78 292.88 4 15 .8 4 3 9 5 .1 3 32 4 .6 2 5 2 5 .7 5 6 3 5 .7 3 1 ,0 3 0 .5 7 5 9 1 .3 3 8 2 5 .39 9 2 9 .0 1 1 , 3 9 4 . 1 1 1 ,7 0 5 . 16 1 ,7 5 8 .0 8 1 ,7 9 1 .2 0 1 ,9 6 5 .3 2 2,988.07 4 16 4 .8 5
CONTROLLING SHAREHOLDING (GOK) 0.9887 0.9887 0.9 887 0.9887 0.9 887 0 9 8 8 7 0.9887 0.9887 0.9887 0.9887 0.9887 0 .9 887 0.9 887 0.9887 0.9887 0.9 887 0.9 887 0.9887
FOREIGN INVESTORS SHAREHOLDING 0 .0 1 1 3 0 .0 1 1 3 0 .0 1 1 3 0 .0 1 1 3 0 .0 1 1 3 0 .0 1 1 3 0 .0 1 1 3 0 .0 1 1 3 0 .0 1 1 3 0 .0 1 1 3 0 .0 1 1 3 0 .0 1 1 3 0 .0 1 1 3 0 .0 1 1 3 0 .0 1 1 3 0 .0 1 1 3 0 .0 1 1 3 0 .0 1 1 3
N o e m p lo y m e n t d a ta w a s a v a ila b le fo r y e a rs 19 9 3 to 19 38 and e s t im a te s w e r e o b ta in e d
69

APPENDIX 13:SOUTH STANZA SUBAX COMPANY
EXTRACT OF flNANCIAt STATEMENTS
STATEMENT OF COMPREHENSIVE IN CO M E ' 19 9 3 19 9 4 1 9 9 5 ' 19 9 6 19 9 7 * 1 9 9 8 ' 19 9 9 2000 2 0 0 1 ' 2002 2 0 0 3 ' 200 4 2 0 0 5 ' 2006 2 00 7 2 008 2009 2 0 10
KSHSOOO KSHS'000 KSHS‘000 K S H 5 0 0 0 KSH S'000 KSHSOOO KSH S'000 K SH S'000 KSHSOOO KSHSOOO KSH S‘000 KSHSOOO KSHSOOO KSHSOOO KSHSOOO K SH S'000 KSHSOOO K SH S'000
TOTAL IN C O M E 7 3 4 ,3 4 1 1,398,724 1,491,021 2 ,0 6 9 ,0 8 7 1 ,8 0 2 ,3 2 3 1,9 0 0 ,3 0 7 2 . 1 3 1 , 3 9 5 1,8 8 9 ,0 5 2 1 ,2 2 6 ,9 4 1 2 , 1 0 3 ,6 3 1 1 , 5 7 8 , 1 3 1 2 ,3 9 4 ,2 6 0 2 ,9 8 3 ,13 4 2 ,5 8 5 ,3 5 5 2 ,9 3 5 ,6 2 5 2 ,7 5 7 , 1 4 9 3 ,2 3 3 ,9 3 3 3 ,5 0 1 , 1 0 7
TOTAL EXPENSES (7 3 6 ,3 4 7 ) ( 1 ,2 4 5 ,8 3 8 ) ( 1 , 3 1 3 ,0 2 1 ) (1,7 4 9 ,0 6 8 ) ( 1 ,8 7 8 , 1 3 8 ) (1 ,9 6 9 ,3 0 7 ) (2 ,2 19 ,3 9 7 ) (2 ,0 4 3 ,7 7 9 ) ( 1 , 5 0 1 ,6 7 S ) (2 ,0 7 9 ,0 2 7 ) (2 ,0 3 3 ,6 5 6 ) ( 2 ,2 6 2 ,2 5 6 ) (2 ,6 5 3 ,0 3 0 ) (2 ,8 0 4 ,2 7 8 ) (2 .7 9 9 .4 8 6 ) (2 ,7 8 4 ,5 4 8 ) ( 3 , 1 5 2 ,2 5 9 ) (3 ,2 2 0 ,8 7 7 )
W IT 57 ,9 9 4 15 2 ,8 8 6 17 8 ,0 0 0 3 2 0 ,0 19 ( 7 5 ,8 15 ) (69,000) (8 8 ,00 2) ( 15 4 ,7 2 7 ) (2 7 4 ,7 3 4 ) 2 4,604 ( 4 5 5 ,5 2 5 ) 13 2 ,0 0 4 3 3 0 , 10 4 (2 18 ,9 2 3 ) 1 3 6 , 1 3 9 (2 7 ,3 9 9 ) 8 1 ,6 7 4 2 8 0 ,2 3 0
FIN A N CE C O S T S /IN C O M E (N ET] (19 7 ,7 0 S ) ( 4 1 ,0 3 6 ) (56 ,649) ( 10 7 ,4 6 2 ) ( 1 1 3 ,3 6 9 ) ( 12 7 ,0 2 2 ) 1 1 5 1 ,9 6 9 ) (8 5 ,19 5 ) (9 5 ,9 34 ) (9 9 ,14 9 ) (7 0 ,54 8 ) (8 3 ,9 4 2 ) (4 2 ,9 9 9 ) (29 ,960) ( 3 9 ,16 3 ) (4 1 ,7 0 9 ) (37 ,9 9 9 ) -38 6 2 9
TAXATION . • • • • • • * ( 19 ,8 15 ) ( 5 6 ,3 18 )
LO SS/P R O FIT AFTER TAXATION ( 1 3 9 , 7 1 1 ) 1 1 1 . 8 S 0 1 2 1 , 3 5 1 2 12 ,5 5 7 ( 18 9 ,18 4 ) ( 19 6 ,0 2 2 ) ( 2 3 9 ,9 7 1) (2 3 9 ,9 2 2 ) (37 0 ,6 6 8 ) (7 4 .5 4 5 ) (5 2 6 ,0 7 3 ) 4 8 ,0 6 2 2 8 7 ,1 0 5 (248,883) 9 6 ,9 7 6 (6 9 ,10 8 ) 2 3 ,8 6 0 18 5 ,2 8 3
STA TEM EN T OF F IN A N CIA L PO SITION
ROH-CURRERT ASSETS 6 5 1 ,6 0 0 7 0 1 ,5 8 6 8 0 5 ,9 3 8 7 46 ,84 4 8 8 5 ,5 6 1 9 0 6 ,2 78 9 0 6 ,39 7 2 ,4 7 3 ,7 2 9 2 ,3 4 6 ,4 7 6 2 ,6 7 4 ,3 8 5 2 ,4 5 0 , 1 1 7 2 ,3 2 4 ,7 9 4 2 ,7 9 4 ,9 9 5 2 ,8 3 5 ,0 18 2 ,6 0 2 ,3 1 9 2 ,7 0 8 ,9 6 4 2 ,2 8 8 ,3 5 4 2 ,2 6 3 ,4 2 0
C U R R E N T A S S E T S 5 4 5 ,3 9 9 7 1 7 , 3 1 2 89 0 ,6 78 L 1 1 4 , 1 0 0 1 , 10 7 ,8 9 4 1 ,0 3 5 ,2 2 7 9 7 5 ,4 8 3 1 , 0 1 7 , 3 1 7 8 5 7 , 1 1 9 1 , 1 2 9 ,6 8 7 1 ,0 3 3 ,7 3 0 L 2 7 7 ,0 9 9 7 1 1 ,8 9 2 6 2 3 ,4 9 1 5 5 4 ,5 6 2 8 17 ,3 4 9 1 , 1 7 2 ,4 2 6 1 ,5 5 7 ,2 0 4
Inventories 2 4 6 ,4 8 1 30 9 ,80 4 3 3 4 ,6 7 5 3 2 7 ,4 0 0 4 6 1 ,8 0 3 5 5 0 ,0 9 5 4 88 ,9 9 2 498,966 4 89,694 5 5 6 ,5 4 3 4 70 ,8 0 6 4 0 5 ,3 0 2 4 2 4 ,5 7 5 4 0 9 ,538 3 2 5 ,3 0 2 5 6 8 ,2 0 1 3 8 4 ,3 1 5 4 86 ,9 6 7
C u rr e n t A s s e t s n e t o f f In v e n to r ie s 2 9 8 ,9 18 4 0 7 ,5 0 8 5 5 6 ,0 0 3 7 8 6 ,7 0 0 6 4 6 ,0 9 1 4 8 5 , 1 3 2 4 8 6 ,4 9 1 5 1 8 , 3 5 1 3 6 7 ,4 2 5 5 7 3 , 1 4 4 5 6 2 ,9 2 4 8 7 1 ,7 9 7 2 8 7 ,3 17 2 13 ,9 5 3 2 2 9 ,2 6 0 2 4 9 ,14 8 7 8 8 , 1 1 1 1 ,0 7 0 ,2 3 7
T O T A L A S S E T S 1 ,19 6 ,9 9 9 1 ,4 18 ,8 9 8 1,6 9 6 ,6 16 1 ,8 6 0 ,9 4 4 1,9 9 3 ,4 5 5 1 ,9 4 1 ,5 0 5 1 ,8 8 1 ,8 8 0 3 ,4 9 1,0 4 6 3 ,2 0 3 ,5 9 5 3 ,8 0 4 ,0 7 2 3 ,4 8 3 ,8 4 7 3 ,6 0 1 ,8 9 3 3 ,5 0 6 ,8 8 7 3 ,4 5 8 ,5 0 9 3 , 1 5 6 ,8 8 1 3 , 5 2 6 ,3 1 3 3 ,4 6 0 ,7 8 0 3 ,8 2 0 ,6 2 4
S H A R E H O L D E R S 'F U N D S 12 9 ,0 2 6 2 3 6 ,3 0 5 3 6 2 ,2 7 3 5 6 9 ,8 7 5 3 6 2 ,8 5 2 1 7 3 , 1 1 3 (6 5 ,27 6 ) 1 ,2 6 4 ,5 10 8 9 3 ,8 4 2 1 ,2 7 9 ,0 1 0 8 16 ,4 7 0 9 4 6 ,56 9 1 ,2 2 1 ,0 2 0 9 3 0 ,8 6 1 1 ,0 2 7 ,8 3 6 9 8 5 ,5 13 9 3 7 ,2 2 8 1 , 1 4 0 , 7 1 5
N O N -CU R R EN T L IA B IL IT IE S 7 0 6 ,2 6 1 6 14 ,2 2 7 6 8 8 ,6 3 3 5 9 4 ,3 2 4 5 3 1 ,8 2 9 5 14 ,9 7 7 445,9 04 4 6 8 ,2 7 7 5 0 4 , 1 8 1 3 3 7 ,4 2 4 4 9 1 ,0 3 5 5 5 0 , 16 2 5 0 9 ,2 7 5 4 6 6 ,10 1 59 6 ,0 0 5 5 6 3 , 19 3 7 3 9 ,0 3 2 7 4 0 9 10
C U R R E N T L IA B IL IT IE S 3 6 1 , 7 1 2 5 6 8 ,3 6 6 6 4 5 ,7 10 6 9 6 ,7 4 5 1,0 9 8 ,7 7 4 1 ,2 5 3 ,4 1 5 1 , 5 0 1 ,2 5 2 1 ,7 5 8 ,2 5 9 1 ,8 0 5 ,5 7 2 2 , 18 7 ,6 3 8 2 , 1 7 6 ,3 4 2 2 , 1 0 5 , 1 6 2 1 ,7 7 6 ,5 9 2 2 ,0 6 1 ,5 4 7 1 ,5 3 3 ,0 4 0 1,9 7 7 ,6 0 7 1 ,7 8 4 ,5 2 0 1,9 3 8 ,9 9 9
TO T A L L IA B IL IT IE S 1 ,0 6 7 ,9 7 3 1 , 1 8 2 ,5 9 3 1 ,3 3 4 ,3 4 3 1 ,2 9 1 ,0 6 9 1 ,6 3 0 ,6 0 3 1 ,7 6 8 ,3 9 2 1 ,9 4 7 , 1 5 6 2 ,2 2 6 ,5 3 6 2 ,3 0 9 ,7 5 3 2 ,5 2 5 ,0 6 2 2 ,6 6 7 ,3 7 7 2 ,6 5 5 ,3 2 4 2 ,2 8 5 ,8 6 7 2 ,5 2 7 ,6 4 8 2 ,12 9 ,0 4 5 2 ,54 0 ,8 0 0 2 ,5 2 3 ,5 5 2 2 ,6 7 9 ,9 0 9
T O T A L FIN AN CIN G 1 ,19 6 ,9 9 9 1,4 18 ,8 9 8 1,6 9 6 ,6 16 1,8 6 0 ,9 4 4 1 3 9 3 ,4 5 5 1 ,9 4 1 ,5 0 5 1 ,8 8 1 ,8 8 0 3 ,4 9 1,0 4 6 3 ,2 0 3 ,5 9 5 3 ,8 0 4 ,0 7 2 3 ,4 8 3 ,8 4 7 3 ,6 0 1 ,8 9 3 3 ,5 0 6 ,8 8 7 3 ,4 5 8 ,5 0 9 3 , 1 5 6 ,8 8 1 3 ,5 2 6 ,3 1 3 3 ,4 6 0 ,7 8 0 3 ,8 2 0 ,6 2 4
N U M B E R OF EM PLO YEES 2 , 1 1 5 2 , 1 1 5 2 ,0 5 0 2 ,0 5 0 1 ,9 0 0 1,8 0 0 1 ,7 6 3 1 ,6 7 8 L 5 5 1 1 ,4 4 2 1 ,3 4 5 1 ,2 6 6 1 , 3 1 5 L 3 3 9 L 3 2 2 L 3 0 3 1 ,2 8 2 1 1 6 1
F IN A N CIA L RATIOS 1 9 9 3 ’ 19 9 4 1 9 9 5 ’ 19 9 6 1 9 9 7 ’ 19 9 8 ' 19 9 9 2000 2001' 2002 2 0 0 3 ’ 2 0 0 4 ' 200 5 ’ 2006 2007' 2 00 8* 2 0 0 9 r 2010ROA (EBIT/TO TAL A SSE TS) 0 .0 5 0 . 1 1 0 . 1 0 0 . 1 7 (0 .04) (0 .04) (0 .05) (0 .04) (0 .09) 0 .0 1 ( 0 .13 ) 0 .04 0.0 9 (0 .06) 0.04 ( 0 .0 1) 0 .0 2 0 .0 7
N P M (N ET PRO FIT/TO TAL INCOM E) ( 0 .18 ) 0 .08 0.08 0 . 1 0 ( 0 .10 ) ( 0 .10 ) ( 0 . 1 1 ) (0 .13 ) (0 .30) (0 .04) (0 .3 3 ) 0 .0 2 0 . 1 0 ( 0 .10 ) 0 .0 3 (0 .0 3) 0 .0 1 0 .0 5
LOGARITHM OF TOTAL A SSE TS 6 .08 6 . 1 5 6 .2 3 6 .2 7 6 3 0 6 .2 9 6 .2 7 6 .54 6 .5 1 6 .5 8 6 .5 4 6 .5 6 6 .5 4 6 .5 4 6 .5 3 6 .5 S 6 .54 6 .58
LOGARITHM OF TOTAL SALES 5.9 0 6 . 1 5 6 . 1 7 6 .3 2 6 .2 6 6 .2 8 6 J 3 6 .28 6 .09 6 .3 2 6 .2 0 6 .3 8 6 .47 6 .4 1 6 .47 6 .4 4 6 .5 1 6 .54
C U RREN T RATIO (C A /C U L S I 1 .2 6 1 3 8 1 .6 0 1 . 0 1 0 .8 3 0 .6 5 0 .5 8 0 .4 7 0 .5 2 0 .4 7 0 .6 1 0 .4 0 0 .3 0 0 .36 0 .4 1 0 .66 0.8 0
TOTAL DEBT TO TO TAL A SSETS RATIO 0 .8 9 0 .8 3 0 .7 9 0 .6 9 0 .8 2 0 .9 1 1 .0 3 0.64 0 .7 2 0 .6 6 0 .7 7 0 .7 4 0 .6 5 0 .7 3 0.67 0 .7 2 0 .7 3 0 .7 0
IN VEN TO RY TO TO TAL ASSETS RATIO 0 .2 1 0 .2 2 0 .20 0 . 1 8 0 .2 3 0 .2 8 0 .2 6 0 .1 4 0 . 1 5 0 . 1 5 0 . 1 4 0 . 1 1 0 . 1 2 0 . 1 2 0 .10 0 . 1 6 0 . 1 1 0 . 1 3
LOGARITHM OF SA LES TO EM PLOYEES RATIC 2 .5 7 2 .8 2 2 .86 3 .0 0 2 .9 8 3 .0 2 3 .0 8 3 .0 5 2 .90 3 . 1 6 3 .0 7 3 .2 8 3 .3 6 3 .2 9 3 .3 5 3 .3 3 3 .4 0 3 .4 8
SA LES TO EM PLOYEES RATIO 3 7 5 .5 7 6 6 1 .3 4 7 2 7 3 3 10 0 9 .3 1 9 4 8 .59 10 5 5 .7 3 1,2 0 8 .9 6 1 , 1 2 5 .7 8 7 9 1.0 6 1 ,4 5 8 .8 3 1 , 1 7 3 . 3 3 L 8 9 1 .2 0 2 ,2 6 8 .5 4 L 9 3 0 .8 1 2 ,2 2 0 .5 9 2 , 1 1 6 .0 0 2 ,5 2 2 .5 7 3 ,0 15 .6 0
CONTRO LLIN G SHAREHOLDING (GO K) 0 .9 9 8 0.9 98 0.9 98 0.9 98 0.9 98 0 .9 9 8 0.9 98 0 .9 9 8 0.9 98 0.9 98 0 .9 9 8 0 .9 9 8 0 .9 9 8 0.9 98 0.998 0 .9 9 8 0.9 98 0 .9 9 8
FOREIGN IN V ESTO R S SHAREHOLDING 0 .0 02 0 .0 02 0 .0 0 2 0 .0 0 2 0 .0 02 0 .0 0 2 0 .0 02 0 .0 02 0 .0 02 0.002 0 .0 0 2 0 .0 0 2 0 .0 0 2 0 .0 0 2 0.002 0 .0 0 2 0 .002 0 .0 02
Rio employment date was available for years 1993to 1993 and estimates were obtained
70

APPENDIX13 :W£STKENYA SUGAR COMPANYEXTRACT OF FINANCIAL STATEMENTS
STATEM EN T OP CO M PR EH EN S IV E INCOM E r 1 9 9 3 1 1 9 9 4 19 9 5 19 9 6 ' 19 9 7 1 9 9 8 ' 19 9 9 2 0 0 0 2 0 0 1 ' 2 0 0 2 ’ 2 0 0 3 2 0 0 4 2 0 0 5 2 0 0 6 ’ 2 0 0 7 2 0 0 8 2 0 0 9
K S H S '0 0 0 K S H S '0 0 0 KSHS'000 K S H S '0 0 0 KSHS'000 K S H S '0 0 0 K S H S '0 0 0 K S H S '0 0 0 K S H S '0 0 0 K S H S '0 0 0 K S H S '0 0 0 K S H S '0 0 0 K S H S '0 0 0 K S H S '0 0 0 K S H S '0 0 0 K S H S '0 0 0 K S H S '0 0 0
T O T A L IN C O M E 1 1 2 , 9 6 3 1 8 7 ,8 2 4 1 9 7 , 7 5 2 5 0 2 ,9 9 5 5 6 1 , 5 7 5 6 5 9 ,4 9 9 6 0 8 ,4 8 8 7 5 5 ,6 2 5 9 1 1 , 1 4 3 1 , 2 9 2 , 3 3 9 2 , 0 2 8 , 1 5 6 1 ,7 2 4 ,0 0 6 2 ,6 5 6 ,7 2 0 4 , 3 8 3 , 3 1 1
T O T A L E X P E N S E S (102,731) (163,043) ( 18 3 ,0 6 4 ) 1 4 5 2 , 1 5 6 ) ( 5 1 0 ,5 3 6 ) ( 6 0 7 ,5 9 5 ) ( 5 5 1 ,9 9 0 ) ( 6 3 5 ,8 6 0 ) 1 7 8 5 , 1 2 8 ) 1 1 ,0 9 2 ,9 8 9 ) ( 1 , 5 2 8 , 9 0 1 ) ( 1 , 3 4 0 , 0 8 1 ) ( 1 , 9 3 3 , 7 3 1 ) ( 3 , 1 8 1 , 1 3 5 )
E B IT 1 0 . 2 3 2 2 4 , 7 8 1 1 4 ,6 8 8 5 0 ,8 3 9 5 1 , 0 3 9 5 1 ,9 0 4 • 5 6 ,4 9 8 1 1 9 , 7 6 5 1 2 6 , 0 1 5 1 9 9 ,3 5 0 4 9 9 ,2 5 5 3 8 3 , 9 2 5 7 2 2 ,9 8 9 1 , 2 0 2 , 1 7 6
F IN A N C E C O S T S / IN C O M E (N E T ) (6,847) ( 1 1 . 2 9 1 ) ( 1 2 , 2 5 2 ) ( 1 2 , 7 4 1 ) • - ( 1 0 ,6 3 9 ) ( 3 , 2 5 1 ) ( 5 , 7 4 1 ) ( 2 3 , 5 1 6 ) ( 1 7 ,8 7 8 ) ( 8 3 ,0 4 1 ) ( 2 5 4 ,6 4 5 ) ( 18 9 ,7 8 9 )
T A X A T IO N • . . 2 ,2 7 9 ( 5 .0 2 6 ) ( 9 , 1 9 6 ) 5 ,4 5 2 ( 4 5 , 1 2 3 ) 1 3 4 ,0 2 2 ) ( 4 1 ,6 6 4 ) ( 1 4 7 , 1 4 6 ) ( 6 8 ,7 9 1 ) ( 1 6 8 ,5 2 6 ) ( 3 0 5 , 1 3 4 )
L O S S /P R O F IT A F T E R T A X A T IO N 3,385 1 3 , 4 9 0 2 .4 3 6 4 0 ,3 7 7 4 6 ,0 1 3 4 2 ,7 0 8 - 5 1 , 3 1 1 7 1 , 3 9 1 8 6 ,2 5 2 1 3 4 , 1 7 0 3 3 4 , 2 3 1 2 3 2 ,0 9 3 2 9 9 ,8 1 8 7 0 7 , 2 5 3
S T A T E M E N T O f F IN A N C IA L P O S IT IO N
N O N -C U R R E N T A S S E T S 1 4 0 , 3 0 1 1 4 2 , 6 6 1 1 7 5 , 0 1 6 2 2 6 ,4 2 5 7 6 8 ,5 9 8 7 0 5 ,9 3 7 5 6 2 ,4 9 3 5 6 3 ,2 3 4 7 0 7 , 7 3 2 1 1 6 2 , 5 6 5 1 , 3 5 5 ,8 9 9 3 , 5 4 3 , 9 3 1 3 ,6 9 0 ,3 4 9 3 , 7 2 1 , 2 0 7
C U R R E N T A S S E T S 1 7 ,9 0 4 4 6 ,7 0 2 5 9 ,9 4 1 7 5 ,6 3 5 9 3 ,4 5 0 1 6 3 , 0 1 8 • 16 4 ,6 0 4 • 3 3 5 ,8 7 6 2 8 8 ,7 9 1 2 5 5 ,4 2 5 1 ,0 0 3 ,0 3 9 1 2 8 , 7 3 8 7 0 1 ,4 0 4 1 , 0 6 1 , 2 0 0
In ve n tories 1 , 4 6 3 3 ,3 9 4 9 ,7 4 5 1 4 , 3 7 3 4 0 ,7 8 3 2 2 ,2 9 3 2 5 ,6 4 7 1 0 4 , 2 6 3 4 1 ,6 4 8 4 4 ,7 4 9 4 9 ,8 3 2 5 2 ,6 2 5 1 5 5 , 1 9 2 2 9 2 ,8 0 1
C u r r e n t A s s e t s n e t o f f I n v e n t o r ie s 1 6 , 4 4 1 4 3 .3 0 8 5 0 , 1 9 6 6 1 ,2 6 2 5 2 ,6 6 7 1 4 0 ,7 2 5 1 3 8 ,9 5 7 2 3 1 , 6 1 3 2 4 7 , 1 4 3 2 1 0 ,6 7 6 9 5 3 ,2 0 7 7 6 , 1 1 3 5 4 6 , 2 1 2 7 6 8 ,3 9 9
T O T A L A S S E T S 1 5 8 , 2 0 5 1 8 9 ,3 6 3 2 3 4 ,9 5 7 3 0 2 ,0 6 0 8 6 2 ,0 4 8 8 6 8 ,9 5 5 - 7 2 7 ,0 9 7 • 8 9 9 , 1 1 0 9 9 6 ,5 2 3 1 , 4 1 7 , 9 9 0 2 ,3 5 8 ,9 3 8 3 ,6 7 2 ,6 6 9 4 , 3 9 1 , 7 5 3 4 ,7 8 2 ,4 0 7
S H A R E H O L D E R S ' F U N D S 2 0 ,3 9 8 3 3 ,8 8 8 3 6 ,3 2 3 1 3 8 , 1 3 6 6 9 8 ,0 9 2 6 7 9 ,9 3 3 4 0 2 ,8 2 8 5 1 3 , 5 1 2 5 9 0 ,4 3 1 7 1 5 . 9 5 6 1 1 0 1 , 2 0 8 9 6 3 ,9 6 8 1 ,2 6 3 ,7 8 6 1 ,8 0 9 ,0 3 9
N O N -C U R R E N T L I A B I L IT I E S 1 2 9 ,7 0 4 1 5 2 ,0 9 2 1 8 3 , 1 1 4 1 1 6 , 7 2 8 5 5 ,8 1 4 5 6 ,3 9 0 2 3 3 ,8 2 9 1 7 4 , 5 7 5 2 3 6 ,6 8 7 4 8 2 , 1 2 2 1 , 0 1 4 , 6 6 9 2 , 3 6 5 , 2 4 1 2 ,3 9 5 ,3 4 5 2 ,0 8 7 ,6 8 3
C U R R E N T L I A B I L IT I E S 8 , 1 0 3 3 , 3 8 3 1 5 , 5 2 0 4 7 , 1 9 6 1 0 8 , 1 4 2 1 3 2 , 6 3 2 9 0 ,4 4 0 2 1 1 , 0 2 3 1 6 9 ,4 0 5 2 1 9 , 9 1 2 2 4 3 ,0 6 1 3 4 3 ,4 6 0 7 3 2 ,6 2 2 8 8 5 ,6 8 5
T O T A L L IA B I L IT I E S 1 3 7 ,8 0 7 1 5 5 , 4 7 5 19 8 ,6 3 4 1 6 3 ,9 2 4 1 6 3 ,9 5 6 1 8 9 ,0 2 2 . 3 2 4 ,2 6 9 . 3 8 5 ,5 9 8 4 0 6 ,0 9 2 7 0 2 ,0 3 4 1 , 2 5 7 , 7 3 0 2 , 7 0 8 , 7 0 1 3 , 1 2 7 , 9 6 7 2 ,9 7 3 ,3 6 8
T O T A L F IN A N C IN G 1 5 8 , 2 0 5 1 8 9 ,3 6 3 2 3 4 ,9 5 7 3 0 2 ,0 6 0 8 6 2 ,0 4 8 8 6 8 ,9 5 5 * 7 2 7 ,0 9 7 • 8 9 9 , 1 1 0 9 9 6 ,5 2 3 1 , 4 1 7 . 9 9 0 2 ,3 5 8 ,9 3 8 3 ,6 7 2 ,6 6 9 4 , 3 9 1 , 7 5 3 4 ,7 8 2 .4 0 7
N U M B E R O F E M P L O Y E E S 3 9 3 4 0 6 4 1 4 4 2 4 4 8 7 5 3 4 5 4 1 2 1 2 3 8 9 3 9 7 4 1 0 4 3 6 4 2 3 4 4 0 4 0 2 4 5 7 4 8 6
F IN A N C IA L R A T IO S 1 9 9 3 19 9 4 1 9 9 5 ' 19 9 6 ‘ 1 9 9 7 ' 19 9 8 19 9 9 2 0 0 0 2 0 0 1 2 0 0 2 2 0 0 3 ' 2 0 0 4 ' 2 0 0 5 " 2 0 0 6 ^ 2 0 0 7 " 2 0 0 8 ' 2 0 0 9
R O A (E B IT /T O T A L A S S E T S ) 0 .0 6 0 . 1 3 0 .0 6 0 . 1 7 0 .0 6 0 .0 6 H D IV /01 '« D I V / 0 l 0 .0 8 r # D IV /0 ! 0 . 1 3 0 . 1 3 0 . 1 4 0 . 2 1 0 . 1 0 0 . 1 6 0 .2 5
N P M (N E T P R O F IT /T O T A L IN C O M E ) 0 .0 3 0 .0 7 0 . 0 1 0 .0 8 0 .0 8 0 .0 6 4 D IV / 0 ! r # D IV / 0 l 0 .0 8 r # D IV /0 ! 0 .0 9 0 .0 9 0 . 1 0 0 . 1 6 0 . 1 3 0 . 1 1 0 . 1 6
L O G A R IT H M O F T O T A L A S S E T S 5 .2 0 5 .2 8 5 .3 7 5 .4 8 5 .9 4 5 .9 4 R N U M ! ' 4 N U M I 5 .8 6 r N N U M l 5 .9 5 6 .0 0 6 . 1 5 6 .3 7 6 .5 6 6 .6 4 6 .6 8
L O G A R IT H M O F T O T A L S A L E S 5 .0 5 5 .2 7 5 .3 0 5 .7 0 5 .7 5 5 .8 2 0 N U M 1 r 4 N U M ! 5 .7 8 ' JJN U M I 5 .8 8 5 .9 6 6 . 1 1 6 . 3 1 6 .2 4 6 .4 2 6 .6 4
C U R R E N T R A T IO (C A /C L ) 2 . 2 1 1 3 . 8 0 3 .8 6 1 . 6 0 0 .8 6 1 . 2 3 A D IV /0 1 " # D I V / 0 ! 1 . 8 2 r # D IV /0 ! 1 5 9 1 . 7 0 1 . 1 6 4 . 1 3 0 .3 7 0 .9 6 1 . 2 0
T O T A L D E B T T O T O T A L A S S E T S R A T IO 0 .8 7 0 .8 2 0 .8 5 0 .5 4 0 . 1 9 0 .2 2 4 D IV / 0 1 r « D IV / 0 l 0 .4 5 '4 D I V / 0 I 0 .4 3 0 . 4 1 0 .5 0 0 .5 3 0 .7 4 0 . 7 1 0 .6 2
IN V E N T O R Y TO T O T A L A S S E T S R A TIO 0 .0 0 9 2 0 . 0 1 7 9 0 .0 4 1 5 0 .0 4 7 6 0 .0 4 7 3 0 .0 2 5 7 H D IV /01 " K D IV /0 1 0 .0 3 5 3 r H D IV /01 0 . 1 1 6 0 0 .0 4 1 8 0 . 0 3 1 6 0 . 0 2 1 1 0 .0 1 4 3 0 .0 3 5 3 0 .0 6 1 2
L O G A R IT H M O F S A L E S TO E M P L O Y E E S R A T 1C 2 .4 6 2 .6 7 2 .6 8 3 .0 7 3 .0 6 3 .0 9 # N U M I r # N U M ! 3 . 1 9 " U N U M l 3 .2 7 3 .3 2 3 .4 9 3 .6 6 3 .6 3 3 .7 6 3 .9 6
S A L E S T O E M P L O Y E E S R A T IO 2 8 7 .4 4 4 6 2 .6 2 4 7 7 .6 6 1 1 8 6 . 3 1 1 1 5 3 . 1 3 1 2 3 5 . 0 2 0 .0 0 0 .0 0 1 , 5 6 4 .2 4 * 1 ,8 4 2 .9 9 2 ,0 8 9 .7 8 3 , 0 5 5 . 1 7 4 ,6 0 9 .4 5 4 ,2 8 8 .5 7 5 , 8 1 3 . 3 9 9 , 0 1 9 . 1 6
C O N T R O L L IN G S H A R E H O L D IN G 1 1 1 1 1 1 1 1 1 1 1 1 1 1 1 1 1
F O R E IG N IN V E S T O R S S H A R E H O L D IN G 0 0 0 0 0 0 0 0 0 0 0 0 0 0 0 0 0
No em ploym ent data was available lor years 1993 to 1998 and estimates were obtained
2010
K S H S '0 0 0
5 , 1 0 6 , 8 9 1
( 3 ,7 9 5 ,0 9 6 )
1 , 3 1 1 , 7 9 5
( 1 1 7 , 1 2 9 )
( 3 5 9 ,8 6 4 )
8 3 4 ,8 0 2
3 ,9 4 7 ,2 8 7
1 ,6 5 3 ,8 2 9
7 7 8 ,4 5 7
8 7 5 ,3 7 2
5 . 6 0 1 . 1 1 6
2 , 5 9 3 , 1 6 3
1 ,6 6 5 ,9 8 0
1 , 3 4 1 , 9 7 3
3 ,0 0 7 ,9 5 3
5 . 6 0 1 . 1 1 6
5 0 5
20100 .2 3
0 . 1 6
6 .7 5
6 . 7 1
1 . 2 3
0 .5 4
0 . 1 3 9 0
4 .0 0
10, 112.66
10
71

APPEN D IX 14: A V ERA G E FOR PUBU C SUGAR CO M PAN IES
FINANCIAL RATIOS
R O A ( E B I T / T O T A l A S S E T S )
N P M ( N E T P A O F I T / T O T A l IN C O M E )
L O G A R IT H M O F T O T A L A S S E T S
L O G A R IT H M O F T O T A L S A L E S
C U R R E N T R A T IO ( C A / C L )
T O T A L D E B T T O T O T A L A S S E T S R A T IO
IN V E N T O R Y T O T O T A L A S S E T S R A T IO
L O G A R IT H M O F S A L E S T O E M P L O Y E E S R A T IO
S A L E S T O E M P L O Y E E S R A T IO
1993 1994 1995 1996
(0.0014) (0.0096) 0.0125 0.0696
10.43) (0.29) (0.23) (0.23)
6.29 6.33 6.36 6.41
5.90 6.11 6.16 6.27
0.90 0.90 0.90 1.00
0.92 0.96 1.00 1.03
0.17 0.14 0.16 0.14
2.58 2.79 2.87 2.98
643.24 888.45 991.68 1,317.98
1997 1998 1999 2000
(0.0035) (0.0510) (0.0263) (0.0675)
(0.47| (0.61) (0.35) (0.53)
6.51 6.55 6.57 6.63
6.24 6.26 6.35 6.36
0.92 0.81 0.75 0.53
1.10 1.24 1.28 1.57
0.13 0.13 0.11 0.11
3.X 3.04 3.14 3.19
1,647.87 1,924.90 1,957.76 2,415.50
72

2001 2002 2003 2004 2005 2006 2007 2008 2009 2010
11.80) (0.03) (0.09) 0.34 (0.07) (0.07) (0.18) (0.35) (0.30) (0.71)
(6.79) (0.31) (0.26) 0.12 (0.11) (0.16) (0.16) (0.10) (0.27) (0.44)
6.42 6.47 6.44 6.43 6.41 6.43 6.46 6.51 6.51 6.52
5.91 6.13 6.17 6.27 6.32 6.34 6.39 6.36 6.40 6.42
0.28 0.29 0.23 0.30 0.27 0.26 0.32 0.35 0.30 0.33
4.82 4.16 4.59 4.87 6.04 6.12 5.12 5.32 5.51 6.81
0.11 0.15 0.15 0.14 0.13 0.12 0.14 0.19 0.14 0.13
2.88 3.02 3.10 3.22 3.29 3.30 3.38 3.34 3.40 3.44
827.85 1,107.72 1,293.35 1,677.93 1,978.18 2,018.01 2,494.44 2,205.67 2,519.81 2,895.62

A PPEN D IX IS : A V ERA G E FOR PRIV ATE SU G AR CO M PAN IES
FINANCIAL RATIOS 1993 1994 1995 1996 1997 1998 1999 2000 r r
ROA (EBIT/TOTAL ASSETS] 0.06 0.13 0.06 0.17 0.06 0.06 #DI V/01 #DIV/0!r r
NPM (NET PROFIT/TOTALINCOME) 0.03 0.07 0.01 0.08 0.08 0.06 8DIV/0I 8DIV/0!
LOGARITHM OF TOTAL ASSETS 5.20 5.28 5.37 5.48 5.94 5.94 #NUM! #NUM!r r
LOGARITHM OF TOTAL SALES 5.05 5.27 5.30 5.70 5.75 5.82 #NUMI «NUM! r t
CURRENT RATIO (CA/CL) 2.21 13.80 3.86 1.60 0.86 1.23 8DIV/0I 8DIV/0I
TOTAL DEBT TO TOTAL ASSETS RATIO 0.87 0.82 0.85 0.54 0.19 0.22 #DI V/01 4DIV/0Ir r
INVENTORY TO TOTAL ASSETS RATIO 0.01 0.02 0.04 0.05 0.05 0.03 8DIV/0I 8DIV/0I9 r
LOGARITHM OF SALES TO EMPLOYEES RATIO 2.46 2.67 2.68 3.07 3.06 3.09 #NUMJ 8NUMI
SALES TO EMPLOYEES RATIO 287.44 462.62 477.66 1.186.31 1,153.13 1,235.02
73

2001 2002 r 2003 2004 2005 2006 2007 2008 2009 2010
0.09 #DIV/0!r 0.06 0.13 0.16 0.19 0.13 0.14 0.16 0.18
0.11 4DIV/0Ir 0.04 0.10 0.12 0.15 0.13 0.11 0.15 0.13
6.44 #NUM!r 6.45 6.48 6.56 6.72 6.82 6.90 6.96 7.01
6.31 tfNUMIr 6.38 6.48 6.56 6.69 6.63 6.75 6.86 6.95
1.58 #0IV/0! 1.48 1.84 1.71 3.17 1.33 U S 1.28 1.62
0.46^#DIV/0I 0.44 0.41 0.43 0.44 0.52 0.54 0.52 0.47
0.14 HDIV/01 0.13 0.07 0.07 0.04 0.03 0.06 0.05 0.10
3.26 #NUMJ 3.34 3.43 3.60 3.74 3.69 3.82 3.90 4.01
1827.97 1263.64 2208.97 2808.44 4076.46 5512.97 4961.73 6660.01 7992.21 10193.50