financial performance of selected city municipal ... · public finance & policy ... corporation...
TRANSCRIPT

Acme Intellects International Journal of Research in Management ISSN 2320 – 2939 (Print) ISSN 2320-2793 (online)
Let your Research be Global search– An Ultimate search of Truth- Reforms through Research Vol- 4 No. 4 Oct 2013
”Aano bhadraa krathavo yanthu vishwathaha”-"Let the noble thoughts come to all from all directions". Page No.1 Acme Intellects Research Center- A wing of Help to Help Charitable Trust®
Financial performance of
Selected city municipal corporations in karnataka
By Dr. N. M. Makandar[a]
Abstract
Like many other developing countries, India is undergoing rapid and extensive urbanization over
the last few decades. The role of urban areas as engines of growth has increased much significantly as
compared to the population. The municipal financial structure in India primarily consists of tax and non-
tax sources of revenue. They also receive funds from the State Government in the form of grants-in-aid
as also share in taxes collected by the State Government. On the other hand Municipal expenditure can
be categorized into three main components: Wages & Salaries; Operations and Maintenance; and
Interest on Payments. It is observed that the revenue structure of municipalities shows that the relative
share of own sources of revenue to transfers has declined. A study conducted by the National Institute of
Public Finance & Policy (2001) reveals that most of the urban Local Bodies are constrained in
discharging their obligatory functions due to a limited resource base. The low per capita receipts of
municipal governments do not enable them to meet the minimum standards of services. Improved
financial management is required to increase efficiency in revenue collection and expenditure control.
Therefore the financial health of an urban local body (ULB) is indicated by a set of closely interrelated
factors and not merely income-expenditure balance. The main objective of this paper is to evaluate the
financial health of the selected Municipal Corporation for the period of five years
Key words: financial health, municipal corporation, urbanization, funds
[a] Dr. N. M. Makandar
Associate Professor, Anjuman Arts, Science, Commerce College & PG Centre.
Dharwad -580 001 Karnataka State, India.
Email: [email protected], Ph:94483 26817
1. Introduction:
Like many other developing countries, India is undergoing rapid and extensive urbanization over
the last few decades. The role of urban areas as engines of growth has increased much significantly as
compared to the population. India has the world‟s second largest urban population. As per census
estimates, India‟s urban population has grown from 290 million in 2001 to 377 million in 2011;
accounting for over 30 percent of the country‟s population. Urban India accounted for 62 to 63 percent
of the country‟s GDP in 2009–10. This growth in urban areas also creates opportunities for the rural
economy and helps improve its productivity, especially in rural areas adjacent to urban centers. Local
Self-Government Institutions or Local Bodies directly influence the welfare of the people by providing
civic, social and economic infrastructure services and facilities in both urban and rural areas. Given their
strategic position in delivering services in the hierarchy of Government set up, following the
Constitution (73rd
& 74th) Amendment Acts, more functions, powers and resources have been provided
to them. However, over a period of time, the functions and responsibilities of LBs have increased
considerably without commensurate enhancement of their resource base.

Acme Intellects International Journal of Research in Management ISSN 2320 – 2939 (Print) ISSN 2320-2793 (online)
Let your Research be Global search– An Ultimate search of Truth- Reforms through Research Vol- 4 No. 4 Oct 2013
”Aano bhadraa krathavo yanthu vishwathaha”-"Let the noble thoughts come to all from all directions". Page No.2 Acme Intellects Research Center- A wing of Help to Help Charitable Trust®
Municipal financial management involves very important activities of planning, sourcing,
utilizing & disbursing, controlling and reporting. Municipalities require a substantial amount of money
to execute their functions. They derive this money from various internal and external sources. Internal
sources comprise income generated from various taxes and non-taxes levied by the municipality.
External sources include funds obtained (in the form of grants, loans, etc.) from the Central government,
State government, domestic institutions, financial intermediaries, capital markets, and bilateral and
multi-lateral donor agencies. In the era of globalization, privatization and decentralization, the financial
management of ULBs has assumed many new dimensions. Funds for meeting the cost of new
infrastructure projects identified by municipal governments are arranged from various sources. In recent
years, there is an emphasis on strengthening the municipal financial practices, so that the costs required
for project implementation are met from their internal (or own) sources, viz., taxes, and non-taxes.
However, due to the persistent weak financial condition of municipal governments, there exists a
practice of funds being transferred from a number of external sources.
2. Need for the Study:
Municipal governments in India are vested with the statutory responsibility for the provision and
maintenance of basic infrastructure and services in cities and towns. Additionally they have been
assigned a range of planning functions through the state legislature and other administrative orders. The
urban population is expected to rise to around 38 percent by 2026. India has to improve its urban areas
to achieve objectives of economic development. Huge investment is required in India‟s urban sector.
Since public funds for these services are inadequate, urban local bodies (ULBs) have to look for
innovative approaches for financing and management of urban services. Urban local governments in
India are among the weakest in the world both in terms of capacity to raise resources and financial
autonomy. While transfers from state governments and the Government of India have increased in
recent years, the tax bases of ULBs are narrow and inflexible and lack buoyancy, and they have also not
been able to levy rational user charges for the services they deliver. A study conducted by the National
Institute of Public Finance & Policy (2001) reveals that most of the urban Local Bodies are constrained
in discharging their obligatory functions due to a limited resource base. The low per capita receipts of
municipal governments do not enable them to meet the minimum standards of services. The study also
shows that the finances of municipal bodies are in a mess; a majority of them are not able to raise
adequate resources from their own sources to meet increasing expenditure on services. On the whole, the
status of municipal finance in India suggests that the present revenues are insufficient to meet the
growing expenditure needs of urban areas and the local municipal bodies are in a state of constant
financial stress.

Acme Intellects International Journal of Research in Management ISSN 2320 – 2939 (Print) ISSN 2320-2793 (online)
Let your Research be Global search– An Ultimate search of Truth- Reforms through Research Vol- 4 No. 4 Oct 2013
”Aano bhadraa krathavo yanthu vishwathaha”-"Let the noble thoughts come to all from all directions". Page No.3 Acme Intellects Research Center- A wing of Help to Help Charitable Trust®
3. Profile of Sample Units
The Directorate of municipal administration was established in the year 1984 to act as a nodal
agency to control and monitor administrative, development and financial activities of the urban local
bodies and act as an interface in the compilation and dissemination of information from local bodies of
government. In accordance with the powers conferred upon by the Karnataka municipalities Act, 1964,
the Directorate of Municipal Administration oversees the administration of 9 City Corporations, 44 City
municipal councils (CMCs), 94 Town municipal councils (TMCs), 68 Town Panchayats (TPs). The
DMA monitors these urban local bodies through a network of District Urban Development cells
(DUDCs) headed by a Project Director which reports to the Deputy Commissioner of the said district on
a day to day basis. Following are the city municipal corporations in Karnataka. Considering the
geographical area and structure of urbanization so as to evaluate their financial performance the
following city municipal corporations has been selected.
1. Belgaum City Municipal Corporation
2. Bellary City Municipal Corporation
3. Mangalore City Municipal Corporation
4. Review of Literature:
A comprehensive literature review was conducted to obtain the information needed for pursuing
the objectives of this research. Information was obtained from books, academic journals, government
and institutional reports. Athanassopoulos and Triantis (1998) have analyzed the efficiency of large
Greek municipalities on the basis of cash accounting data. Their conclusion shows that efficient
municipalities have a higher tax base, income level, and public investment share on total expenditure
and inefficiency is related to high share of grants in total municipal expenditure and population density.
R.K. Bhardwaj in his "The Municipal Administration in India (A Sociological Analysis of Rural and
Urban India)," discuss the causes of backwardness of municipal bodies In India. He expresses his
dissatisfaction in the following words. The way in which the people have dealt with the local bodies in
India does not bring credit to the smooth functioning of municipal administration. Om Prie
Srivastava's 'Municipal Government and Administration in India" is based on her research thesis of
1976 entitled "State Control over Municipal-Corporations." She explains the various kinds of state
control and suggests remedial measures that need to be taken. She has felt that government should
reorient its attitude in regard to municipal corporations, providing constructive guidance and adequate
assistance to them, as an active partner in the common cause of city administration.

Acme Intellects International Journal of Research in Management ISSN 2320 – 2939 (Print) ISSN 2320-2793 (online)
Let your Research be Global search– An Ultimate search of Truth- Reforms through Research Vol- 4 No. 4 Oct 2013
”Aano bhadraa krathavo yanthu vishwathaha”-"Let the noble thoughts come to all from all directions". Page No.4 Acme Intellects Research Center- A wing of Help to Help Charitable Trust®
5. Objectives:
Improved financial management is required to increase efficiency in revenue collection and
expenditure control. Therefore the financial health of an urban local body (ULB) is indicated by a set of
closely interrelated factors and not merely income-expenditure balance. The main objective of this paper
is to evaluate the financial health of the selected Municipal Corporation for the period of five years. The
specific objectives of the present paper are:
1. To examine the trends in major revenue sources and expenditures of municipalities and assess
their fiscal position.
2. To analyze the growth rate of total income and total expenses
3. To analyze the growth rate of income over expenditure
4. To offer useful suggestions
6. Data Base & Research Methodology:
This paper is based on published secondary data and research materials, budgets of relevant
urban governments, various reports, and discussion with concerned people in the municipal
governments. People doing research have also been discussed. Publications of the Government of India,
the State Government, and other publications have been reviewed. Important among these are the:
Karnataka State Municipal Acts, that contain information on legal provisions for municipalities; and the
State Finance Commission Reports, which describe the municipal finance practices and the financial
performance of municipalities at different time periods. Data maintained by the selected municipal
corporations a complete.
7. Analysis and Interpretation of Data:
The present paper intends to diagnose the financial health of the selected city Municipal
Corporation in Karnataka. Following parameters have been identified.
1. Per Capita Income
2. Per Capita Expenditure
3. Ratio Income over Expenditure
4. Ratio Percentage of Expenditure by Income
5. Ratio Percentage of Establishment Expenditure by total Revenue Income
6. Ratio Percentage of Administrative Expense by total Revenue Income
7. Ratio Percentage of Direct Expense by Total Revenue Income
8. Ratio Percentage of Financial Expense by Total Revenue Income
9. Ratio Percentage of Salary, Wages & allowances by Total Income
10. Ratio Percentage of Property Tax by Income from Tax

Acme Intellects International Journal of Research in Management ISSN 2320 – 2939 (Print) ISSN 2320-2793 (online)
Let your Research be Global search– An Ultimate search of Truth- Reforms through Research Vol- 4 No. 4 Oct 2013
”Aano bhadraa krathavo yanthu vishwathaha”-"Let the noble thoughts come to all from all directions". Page No.5 Acme Intellects Research Center- A wing of Help to Help Charitable Trust®
Table - 1
Per Capita Income
Rs. in lakhs
Year
Belgaum Bellary Mangalore
Rs.
Growth
Rs.
Growth
% Rs.
Growth
Rs.
Growth
% Rs.
Growth
Rs.
Growth
%
2006-07 908.90 - - 496.17 - - 1702.92 - -
2007-08 1378.43 469.54 51.66 901.08 404.91 81.61 2132.95 430.03 25.25
2008-09 1462.53 84.10 6.10 862.47 -38.61 -4.29 2419.69 286.74 13.44
2009-10 1680.11 217.58 14.88 993.94 131.48 15.24 2623.51 203.82 8.42
2010-11 2651.83 971.71 57.84 947.21 -46.73 -4.70 2645.55 22.04 0.84
Average 1616.36 435.73 32.62 840.17 112.76 21.97 2304.92 235.66 11.99
SD 22.45 35.36 8.87
CV 68.83 161.00 74.02
Source: Computed from Annual financial statements of sample units.
The perusal of table 1 reflects the per capita income of sample units for the period under the
study which is a measure of efficiency. The per capita income is found to be positive and highest 32.62,
21.97 & 11.99 percentage in case of Belgaum, Bellary & Mangalore City Corporations respectively. The
growth rate found as fluctuating indicating the city corporation has no fixed amount of revenues. The
table also indicates SD and CV of all the sample units on par with Mean.

Acme Intellects International Journal of Research in Management ISSN 2320 – 2939 (Print) ISSN 2320-2793 (online)
Let your Research be Global search– An Ultimate search of Truth- Reforms through Research Vol- 4 No. 4 Oct 2013
”Aano bhadraa krathavo yanthu vishwathaha”-"Let the noble thoughts come to all from all directions". Page No.6 Acme Intellects Research Center- A wing of Help to Help Charitable Trust®
Table- 2
Per Capita Expenditure
Rs. in lakhs
Year
Belgaum Bellary Mangalore
Rs. Growth
Rs.
Growth
% Rs.
Growth
Rs.
Growth
% Rs.
Growth
Rs.
Growth
%
2006-07 721.16 - - 246.75 - - 910.15 - -
2007-08 1044.01 322.85 44.77 445.99 199.24 80.74 1231.12 320.97 35.27
2008-09 1088.65 44.64 4.28 599.05 153.07 34.32 978.05 -253.07 -20.56
2009-10 1258.65 170.00 15.62 799.68 200.63 33.49 1717.73 739.68 75.63
2010-11 1649.43 390.78 31.05 823.68 24.01 3.00 1811.26 93.53 5.45
Average 1152.38 232.07 23.93 583.03 144.23 37.89 1329.66 225.28 23.95
SD 15.33 27.77 35.78
CV 64.08 73.30 149.44
Source: Computed from Annual financial statements of sample units.
In the above table 2 shows the per capita expenditure of sample units for the period under the
study. This growth rate measure the level of expenditure incurred by the corporation based on the
amount of revenue received during the period under the study. The per capita expenditure is found to be
positive and highest 23.93, 27.77 & 35.78 percent in case of Belgaum, Bellary & Mangalore City
Corporations respectively. The table also indicates SD and CV of all the sample units on par with Mean.

Acme Intellects International Journal of Research in Management ISSN 2320 – 2939 (Print) ISSN 2320-2793 (online)
Let your Research be Global search– An Ultimate search of Truth- Reforms through Research Vol- 4 No. 4 Oct 2013
”Aano bhadraa krathavo yanthu vishwathaha”-"Let the noble thoughts come to all from all directions". Page No.7 Acme Intellects Research Center- A wing of Help to Help Charitable Trust®
Table -3
Ratio Income over Expenditure
Rs. in lakhs
Year
Belgaum Bellary Mangalore
Rs. Growth
Rs.
Growth
% Rs.
Growth
Rs.
Growth
% Rs.
Growth
Rs.
Growth
%
2006-07 481.02 - - 285.60 - - 2786.33 - -
2007-08 796.34 315.33 65.55 1240.16 954.57 334.23 2559.82 -226.51 -8.13
2008-09 108.82 -687.53 -86.34 439.45 -800.71 -64.57 4329.77 1769.95 69.14
2009-10 927.03 818.21 751.91 -130.40 -569.85 -129.67 2354.21 -1975.56 -45.63
2010-11 3259.59 2332.57 251.62 -1237.23 -1106.83 848.81 1479.30 -874.90 -37.16
Average 245.69 247.20 -5.44
SD 315.83 390.11 45.25
CV 128.55 157.81 -831.22
Source: Computed from Annual financial statements of sample units.
From the above table 3 explain the Ratio of Income over Expenditure of sample units for the
period under the study. This ratio helps to know the excess of income over expenditures of sample
Municipal corporations. Endorsing the table-1& table-2 the growth rate is negative indicating they are
unable to generate sufficient revenues? The ratio of Income over Expenditure is found to be positive and
highest 245.69, & 247.20 per cent in the case of Belgaum & Bellary City Municipal Corporation
whereas Mangalore City Corporations indicates -5.44 percent. The table also indicates SD and CV of all
the sample units on par with Mean.
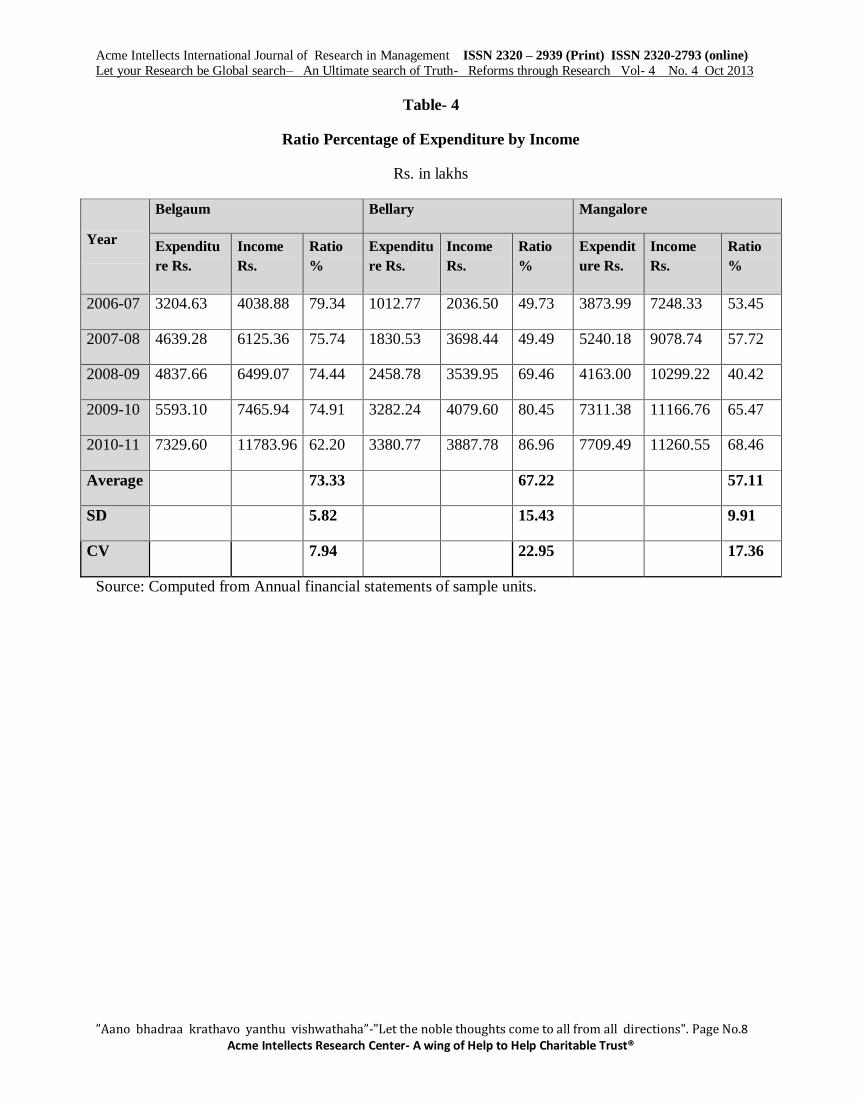
The perusal of table 4 shows that the Ratio Percentage of Expenditure by Income of sample units
for the period under the study. The Ratio Percentage of Expenditure by Income is found to be positive
and highest 73.33, 67.22 & 57.11 per cent in the case of Belgaum, Bellary & Mangalore City
Corporations respectively. The table also indicates SD and CV of all the sample units on par with Mean.
Acme Intellects International Journal of Research in Management ISSN 2320 – 2939 (Print) ISSN 2320-2793 (online)
Let your Research be Global search– An Ultimate search of Truth- Reforms through Research Vol- 4 No. 4 Oct 2013
”Aano bhadraa krathavo yanthu vishwathaha”-"Let the noble thoughts come to all from all directions". Page No.8 Acme Intellects Research Center- A wing of Help to Help Charitable Trust®
Table- 4
Ratio Percentage of Expenditure by Income
Rs. in lakhs
Year
Belgaum Bellary Mangalore
Expenditu
re Rs.
Income
Rs.
Ratio
%
Expenditu
re Rs.
Income
Rs.
Ratio
%
Expendit
ure Rs.
Income
Rs.
Ratio
%
2006-07 3204.63 4038.88 79.34 1012.77 2036.50 49.73 3873.99 7248.33 53.45
2007-08 4639.28 6125.36 75.74 1830.53 3698.44 49.49 5240.18 9078.74 57.72
2008-09 4837.66 6499.07 74.44 2458.78 3539.95 69.46 4163.00 10299.22 40.42
2009-10 5593.10 7465.94 74.91 3282.24 4079.60 80.45 7311.38 11166.76 65.47
2010-11 7329.60 11783.96 62.20 3380.77 3887.78 86.96 7709.49 11260.55 68.46
Average 73.33 67.22 57.11
SD 5.82 15.43 9.91
CV 7.94 22.95 17.36
Source: Computed from Annual financial statements of sample units.
Acme Intellects International Journal of Research in Management ISSN 2320 – 2939 (Print) ISSN 2320-2793 (online)
Let your Research be Global search– An Ultimate search of Truth- Reforms through Research Vol- 4 No. 4 Oct 2013
”Aano bhadraa krathavo yanthu vishwathaha”-"Let the noble thoughts come to all from all directions". Page No.9 Acme Intellects Research Center- A wing of Help to Help Charitable Trust®
Table- 5
Ratio Percentage of Establishment Expenditure by total Revenue Income
Rs. in lakhs
Year
Belgaum Bellary Mangalore
Establish
ment
Expenditure
Rs.
Revenue
Income
Rs.
Ratio
%
Establish
ment
Expenditure
Rs.
Revenue
Income Rs. Ratio %
Establish
ment
Expenditure
Rs.
Revenue
Income
Rs.
Ratio
%
2006-07 1421.67 507.00 35.66 473.95 266.96 56.33 932.03 664.95 71.34
2007-08 1698.93 637.19 37.51 605.68 286.98 47.38 1142.84 680.53 59.55
2008-09 1872.45 862.00 46.04 662.31 377.16 56.95 1203.60 1420.35 118.01
2009-10 1763.73 901.25 51.10 663.47 607.79 91.61 1328.82 2050.74 154.33
2010-11 1879.44 910.04 48.42 746.24 801.26 107.37 1367.65 2543.09 185.95
Average 43.74 71.93 117.84
SD 6.09 23.30 48.02
CV 13.92 32.39 40.75
Source: Computed from Annual financial statements of sample units.
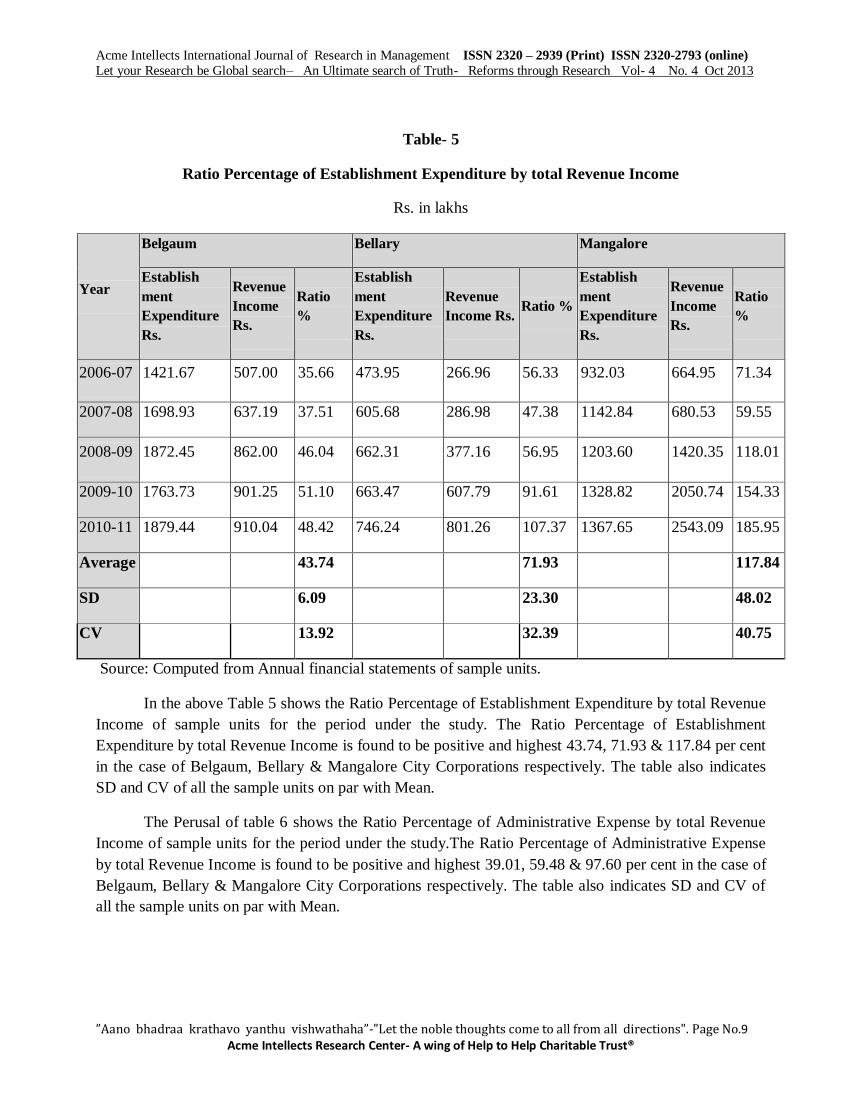
In the above Table 5 shows the Ratio Percentage of Establishment Expenditure by total Revenue
Income of sample units for the period under the study. The Ratio Percentage of Establishment
Expenditure by total Revenue Income is found to be positive and highest 43.74, 71.93 & 117.84 per cent
in the case of Belgaum, Bellary & Mangalore City Corporations respectively. The table also indicates
SD and CV of all the sample units on par with Mean.
The Perusal of table 6 shows the Ratio Percentage of Administrative Expense by total Revenue
Income of sample units for the period under the study.The Ratio Percentage of Administrative Expense
by total Revenue Income is found to be positive and highest 39.01, 59.48 & 97.60 per cent in the case of
Belgaum, Bellary & Mangalore City Corporations respectively. The table also indicates SD and CV of
all the sample units on par with Mean.

Acme Intellects International Journal of Research in Management ISSN 2320 – 2939 (Print) ISSN 2320-2793 (online)
Let your Research be Global search– An Ultimate search of Truth- Reforms through Research Vol- 4 No. 4 Oct 2013
”Aano bhadraa krathavo yanthu vishwathaha”-"Let the noble thoughts come to all from all directions". Page No.10 Acme Intellects Research Center- A wing of Help to Help Charitable Trust®
Table- 6
Ratio Percentage of Administrative Expense by total Revenue Income
Rs. in lakhs
Year
Belgaum Bellary Mangalore
Revenue
Income
Rs.
Administr
ative
Expenditu
re Rs.
Ratio
%
Revenue
Income
Rs.
Administr
ative
Expendit
ure Rs.
Ratio
%
Revenue
Income
Rs.
Administ
rative
Expendit
ure Rs.
Ratio
%
2006-07 507.00 1503.84 33.71 266.96 560.52 47.63 664.95 1177.30 56.48
2007-08 637.19 1923.76 33.12 286.98 651.65 44.04 680.53 1344.39 50.62
2008-09 862.00 2081.12 41.42 377.16 823.09 45.82 1420.35 1483.42 95.75
2009-10 901.25 2027.27 44.46 607.79 782.50 77.67 2050.74 1567.01 130.87
2010-11 910.04 2149.93 42.33 801.26 974.32 82.24 2543.09 1648.40 154.28
Average
39.01
59.48
97.60
SD
4.67
16.82
40.55
CV
11.98
28.28
41.54
Source: Computed from Annual financial statements of sample units.
The perusal of table 7 indicates the Ratio of Percentage of Direct Expense by Total Revenue
Income of sample units for the period under the study. The Ratio of Percentage of Direct Expense by
Total Revenue Income is found to be positive and highest 26.13, 62.26 & 3.98 per cent in the case of
Belgaum, Bellary & Mangalore City Corporations respectively. The table also indicates SD and CV of
all the sample units on par with Mean.

Acme Intellects International Journal of Research in Management ISSN 2320 – 2939 (Print) ISSN 2320-2793 (online)
Let your Research be Global search– An Ultimate search of Truth- Reforms through Research Vol- 4 No. 4 Oct 2013
”Aano bhadraa krathavo yanthu vishwathaha”-"Let the noble thoughts come to all from all directions". Page No.11 Acme Intellects Research Center- A wing of Help to Help Charitable Trust®
Table- 7
Ratio Percentage of Direct Expense by Total Revenue Income
Rs. in lakhs
Year
Belgaum Bellary Mangalore
Direct
Expenses
Rs.
Revenue
Income
Rs.
Ratio
%
Direct
Expenses
Rs.
Revenue
Income
Rs.
Ratio
%
Direct
Expenses
Rs.
Revenue
Income
Rs.
Ratio
%
2006-07 159.18 507.00 31.40 34.34 266.96 17.83 17.83 664.95 2.68
2007-08 275.28 637.19 43.20 47.15 286.98 36.74 36.74 680.53 5.40
2008-09 63.22 862.00 7.33 445.48 377.16 33.42 33.42 1420.35 2.35
2009-10 321.57 901.25 35.68 214.31 607.79 74.86 74.86 2050.74 3.65
2010-11 118.46 910.04 13.02 186.04 801.26 148.46 148.46 2543.09 5.84
Average 26.13 62.26 3.98
SD 13.68 47.00 1.41
CV 52.36 75.49 35.33
Source: Computed from Annual financial statements of sample units.

Acme Intellects International Journal of Research in Management ISSN 2320 – 2939 (Print) ISSN 2320-2793 (online)
Let your Research be Global search– An Ultimate search of Truth- Reforms through Research Vol- 4 No. 4 Oct 2013
”Aano bhadraa krathavo yanthu vishwathaha”-"Let the noble thoughts come to all from all directions". Page No.12 Acme Intellects Research Center- A wing of Help to Help Charitable Trust®
Table- 8
Ratio Percentage of Financial Expense by Total Revenue Income
Rs. in lakhs
Year
Belgaum Bellary Mangalore
Direct
Expenses
Rs.
Revenue
Income
Rs.
Ratio
%
Direct
Expenses
Rs.
Revenue
Income
Rs.
Ratio
%
Direct
Expenses
Rs.
Revenue
Income
Rs.
Ratio
%
2006-07 0.58 507.00 0.12 0.77 266.96 0.29 17.83 664.95 2.68
2007-08 0.41 637.19 0.06 1.33 286.98 0.46 1.46 680.53 0.21
2008-09 0.28 862.00 0.03 2.66 377.16 0.71 0.99 1420.35 0.07
2009-10 2.23 901.25 0.25 4.77 607.79 0.78 8.03 2050.74 0.39
2010-11 2.55 910.04 0.28 1.04 801.26 0.13 4.73 2543.09 0.19
Average 0.15 0.47 0.71
SD 0.10 0.25 0.99
CV 66.89 51.81 139.95
Source: Computed from Annual financial statements of sample units.
Table 8 indicates the Ratio of Percentage of Financial Expense by Total Revenue Income of
sample units for the period under the study. The Percentage of Financial Expense by Total Revenue
Income is found to be positive and highest 0.15, 0.47 & 0.71 per cent in the case of Belgaum, Bellary &
Mangalore City Corporations respectively. The table also indicates SD and CV of all the sample units on
par with Mean.
Acme Intellects International Journal of Research in Management ISSN 2320 – 2939 (Print) ISSN 2320-2793 (online)
Let your Research be Global search– An Ultimate search of Truth- Reforms through Research Vol- 4 No. 4 Oct 2013
”Aano bhadraa krathavo yanthu vishwathaha”-"Let the noble thoughts come to all from all directions". Page No.13 Acme Intellects Research Center- A wing of Help to Help Charitable Trust®
Table- 9
Ratio Percentage of Salary, Wages & Allowances by Total Income
Rs. in lakhs
Year
Belgaum Bellary Mangalore
Salary &
Allowance
Rs.
Total
Income
Rs.
Ratio
%
Salary &
Allowance
Rs.
Total
Income
Rs.
Ratio
%
Salary &
Allowance
Rs.
Total
Income
Rs.
Ratio
%
2006-07 1503.84 4038.88 37.23 560.52 2036.50 27.52 1177.30 7248.33 16.24
2007-08 1923.76 6125.36 31.41 651.65 3698.44 17.62 1344.39 9078.74 14.81
2008-09 2081.12 6499.07 32.02 823.09 3539.95 23.25 1483.42 10299.22 14.40
2009-10 2027.27 7465.94 27.15 782.50 4079.60 19.18 1567.01 11166.76 14.03
2010-11 2149.93 11783.96 18.24 974.32 3887.78 25.06 1648.40 11260.55 14.64
Average 29.21 22.53 14.83
SD 6.35 3.67 0.75
CV 21.74 16.27 5.09
Source: Computed from Annual financial statements of sample units.
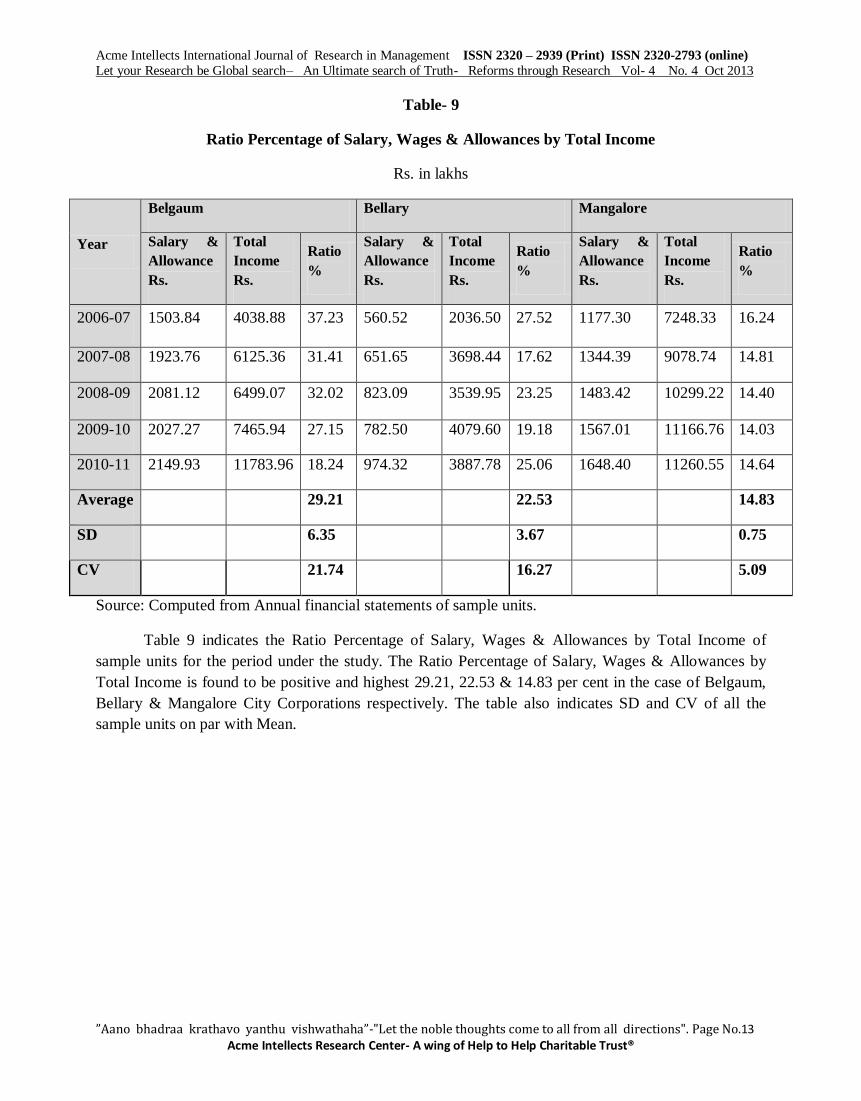
Table 9 indicates the Ratio Percentage of Salary, Wages & Allowances by Total Income of
sample units for the period under the study. The Ratio Percentage of Salary, Wages & Allowances by
Total Income is found to be positive and highest 29.21, 22.53 & 14.83 per cent in the case of Belgaum,
Bellary & Mangalore City Corporations respectively. The table also indicates SD and CV of all the
sample units on par with Mean.

Acme Intellects International Journal of Research in Management ISSN 2320 – 2939 (Print) ISSN 2320-2793 (online)
Let your Research be Global search– An Ultimate search of Truth- Reforms through Research Vol- 4 No. 4 Oct 2013
”Aano bhadraa krathavo yanthu vishwathaha”-"Let the noble thoughts come to all from all directions". Page No.14 Acme Intellects Research Center- A wing of Help to Help Charitable Trust®
Table- 10
Ratio Percentage of Property Tax by Income from Tax
Rs. in lakhs
Year
Belgaum Bellary Mangalore
Property
Tax Rs.
Income
from Tax
Rs.
Ratio
%
Property
Tax Rs.
Income
from Tax
Rs.
Ratio
%
Property
Tax Rs.
Income
from Tax
Rs.
Ratio
%
2006-07 500.00 507.00 98.62 256.45 258.49 99.21 619.17 664.95 93.12
2007-08 626.70 637.19 98.35 266.13 279.99 95.05 619.17 680.09 91.04
2008-09 850.00 862.00 98.61 370.97 377.14 98.36 1182.39 1255.70 94.16
2009-10 880.00 901.25 97.64 573.15 576.68 99.39 1778.29 1845.61 96.35
2010-11 890.00 910.04 97.80 778.54 791.15 98.41 2396.33 2467.09 97.13
Average 98.20 98.08 94.36
SD 0.41 1.57 2.20
CV 0.42 1.60 2.33
Source: Computed from Annual financial statements of sample units.
Table10 present the Ratio Percentage of Property Tax by Income from Tax of sample units for
the period under the study. The Ratio Percentage of Property Tax by Income from Tax is found to be
positive and highest 98.20, 98.08 & 94.36 percent in case of Belgaum, Bellary & Mangalore City
Corporations respectively. The table also indicates SD and CV of all the sample units on par with Mean.
8. Conclusion:
The analysis of the income and expenditure of the local bodies for the past five years under
Revenue, (Taxes, rents, fees, fines etc. and grants) and expenditure (Salaries, wages, electricity charges,
fuel charges, street lighting etc.) reveal that the expenditure is increasing considerably.The scale and size
of investment requirements cannot be met from government budgetary resources and hence multiple
sources of funding are needed. This pace of transition in amalgamation with degradation of natural
resources, has posed a huge challenge for city governing bodies. These bodies need to build their
capacities to tackle the emerging issues and problems which are resulting in undesirable levels of service
delivery and insufficient utilization of available resources; largely due to information gaps, inadequate
resource mobilization and lack of effective planning, management and monitoring. The measures to
bring about this includes, Overall expenditure control, Private sector participation in projects & service
delivery, Debt management and Maximization of equity and efficiency. Local governments are unable
to perform well due to various reasons.Self-assessment should be made mandatory which should be
publicized through public notice etc. This will also avoid unnecessary defaults by property owners

Acme Intellects International Journal of Research in Management ISSN 2320 – 2939 (Print) ISSN 2320-2793 (online)
Let your Research be Global search– An Ultimate search of Truth- Reforms through Research Vol- 4 No. 4 Oct 2013
”Aano bhadraa krathavo yanthu vishwathaha”-"Let the noble thoughts come to all from all directions". Page No.15 Acme Intellects Research Center- A wing of Help to Help Charitable Trust®
9. References:
1) M. Bhattacharya, - State Directorates of Municipal Administration, New Delhi, Indian
Institute of Public Administration, (1969).
2) P. K. Malto, - A Study of Local Self Government in Urban India‖, Jullandur: Jain Gneral
House, (1958).
3) R.K. Bhardwaj, - The Municipal Administration in India (A Sociological Analysis of Rural
and Urban India)‖, New Delhi, Sterling Publishers, p. 172 (1970).
4) S.R. Maheshwari, - Local Government in India‖, New Delhi, Orient Longman (1976).
5) Amreshwar Avasthi, - Municipal Administration in India‖, Agra Laxmi Narayan Agency
(1972).
6) Om Prie Srivastva, - Municipal Government and Administration in India‖- Allahbad, Chugh
Publication (1980).
7) Rumi Ajiz, - Challenges of Urban Local Government in India‖, Working Paper, (2006).
8) Kuchiki, A. (2005). Theory of a flowchart approach to industrial cluster policy. Discussion
Paper Series, Institute of Developing Economies-JETRO No. 36.
9) Arup Mitra Urbanization in India: Evidence on Agglomeration Economies High Powered
Expert Committee (2011), Report on Indian Urban Infrastructure and Services. Government of
India
10) India Infrastructure Report (1996), Report on the Commercialisation of Infrastructure,
Government of India.
11) McKinsey Global Institute (2010), India‟s Urban Awakening: Building Inclusive Cities,
Sustaining Economic Growth, McKinsey and Company
12) Ashraf, Quamrul H., Ashley Lester and David N. Weil (2008). “When does improving health
raise GDP?”, NBER Working Paper No. 14449, October.
13) Harsh Jaitli “Muncipal Finance Series 2 Urban Local Bodies” Published by: PRIA,
February 2004
14) Bhamberi C.P. “Municipalities and their finances Padma Book Co., Jaipur, 1969
15) Rao N.R. “Finances of Municipalities in North Karnataka District Author, Kumta, 1968.
16) Goshi R.N., ―Accountability of Local Government- CAG„s Initiatives and the Challenges
Ahead‖, Research Paper, (2005).
17) Emumuele Padovani, ―The Use of Financial Indicators to Determine Financial Indicators to
Determine Financial Health of Italian Municipalities‖, Study Paper, (2004).
18) Mathur Om Prakash, ―Financial Municipal Services – Reaching Out to Capital Markets‖,
Research Study, (2003).
19) M. Bhattacharya, ―State Directorates of Municipal Administration, New Delhi, Indian
Institute of Public Administration, (1969).