financial & operational performance - green packet · this presentation and the following...
TRANSCRIPT
Financial & Operational
Performance
Quarterly Financial Ended 30th September 2015
Copyright @ 2015 Green Packet. All rights reserved.
This presentation and the following discussion may contain forward looking
statements by Green Packet Berhad that reflect management’s current
expectation, beliefs, hopes, intentions or strategies regarding the future and
assumptions in light of currently available information. These statements are
subject to a number of risks and uncertainties that could cause actual results,
performance or achievements to differ materially from those discussed in the
forward looking statements. Such statements are not and should not be construed
as a representation as to the future performance or achievements of Green Packet
Berhad and Green Packet Berhad assumes no obligation to update any such
statements.
Copyright @ 2015 Green Packet. All rights reserved.
� Our continuing operating business pillars registered +0.4% higher quarterly sales QoQ
� Solutions pillar - The business unit shipped 8.7% more units of devices in the quarter QoQ. However, revenue dropped by 5.8% due lower price per unit
� Communications pillar – Revenue increase by 7.4% quarter sales QoQ
Highlights of Quarter ended 30 Sep’15
Copyright @ 2015 Green Packet. All rights reserved.
Contents
A. Solution Pillar
B. Communication Pillar
C. Group Financial Performance
Copyright @ 2015 Green Packet. All rights reserved.
A. Solution Pillar
Sales Review
a. Customer Base
b. Technology Update
c. Shipments
1
c Financials2
Copyright @ 2015 Green Packet. All rights reserved.
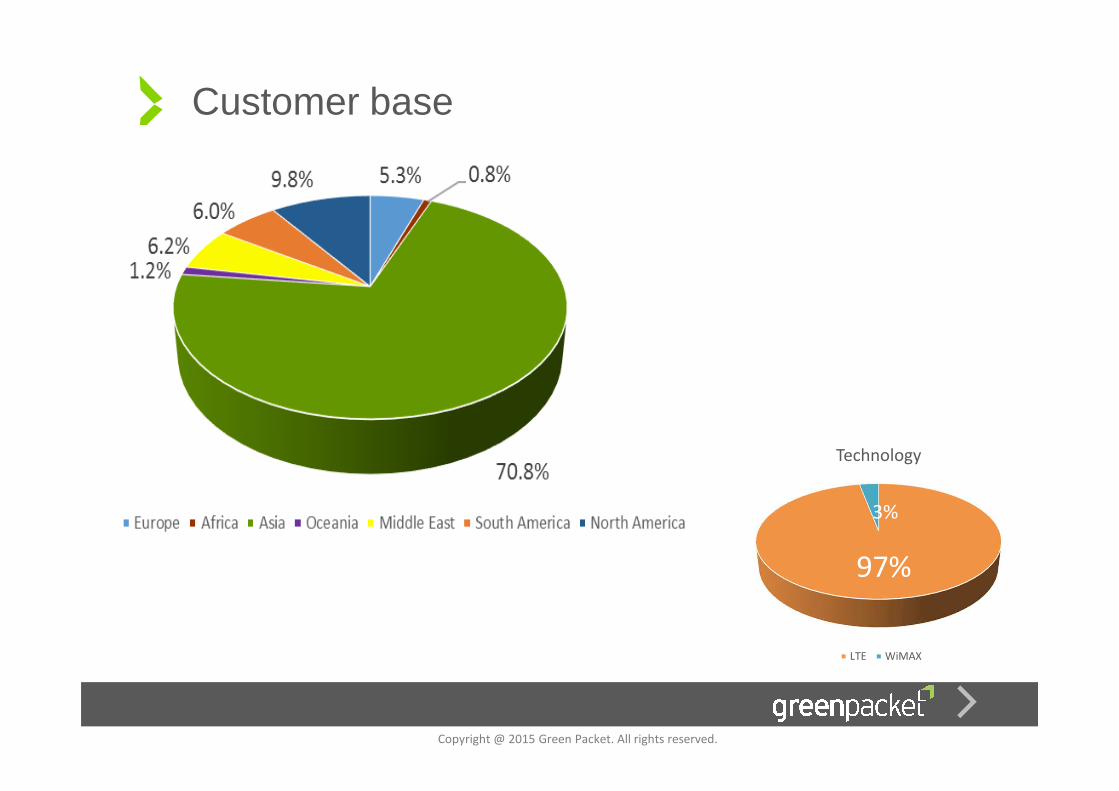
Customer base
Technology
LTE WiMAX
97%
3%
Copyright @ 2015 Green Packet. All rights reserved.
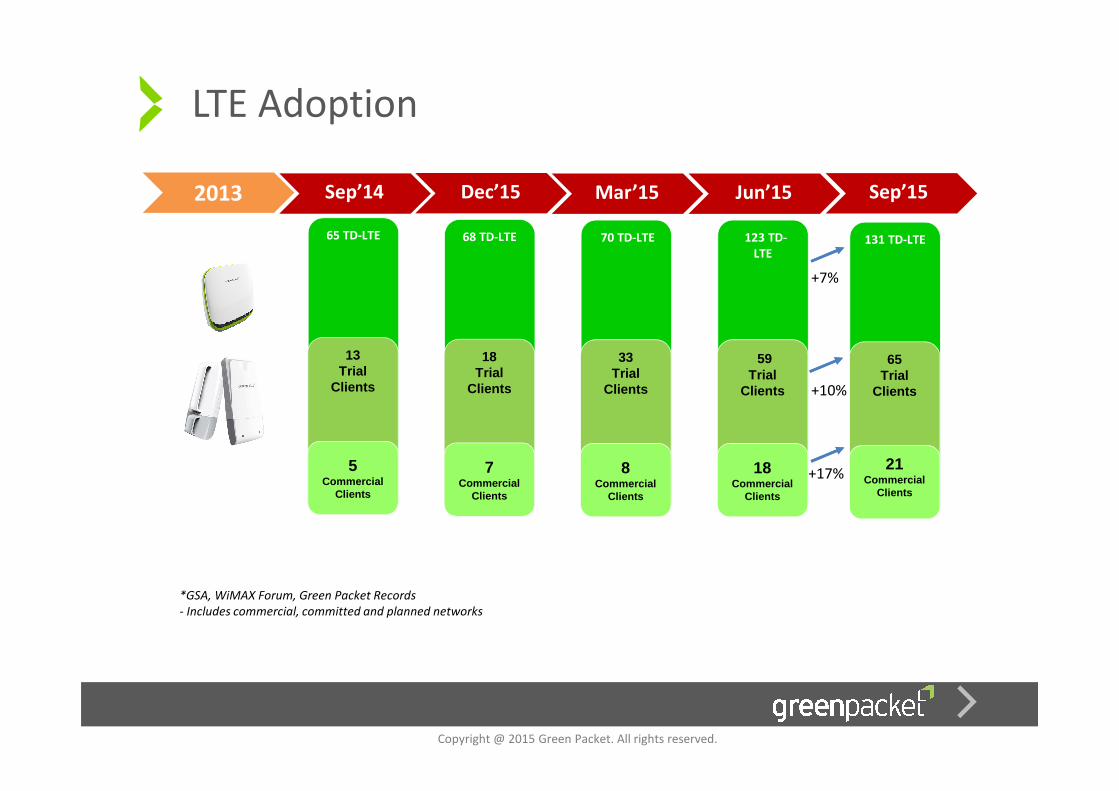
LTE Adoption
131 TD-LTE
65Trial
Clients
21 Commercial
Clients
65 TD-LTE
13Trial
Clients
5Commercial
Clients
68 TD-LTE
18Trial
Clients
7Commercial
Clients
Sep’15Dec’15Sep’14
*GSA, WiMAX Forum, Green Packet Records
- Includes commercial, committed and planned networks
70 TD-LTE
33Trial
Clients
8Commercial
Clients
Mar’15
123 TD-
LTE
59Trial
Clients
18Commercial
Clients
Jun’152013
+7%
+10%
+17%
Copyright @ 2015 Green Packet. All rights reserved.
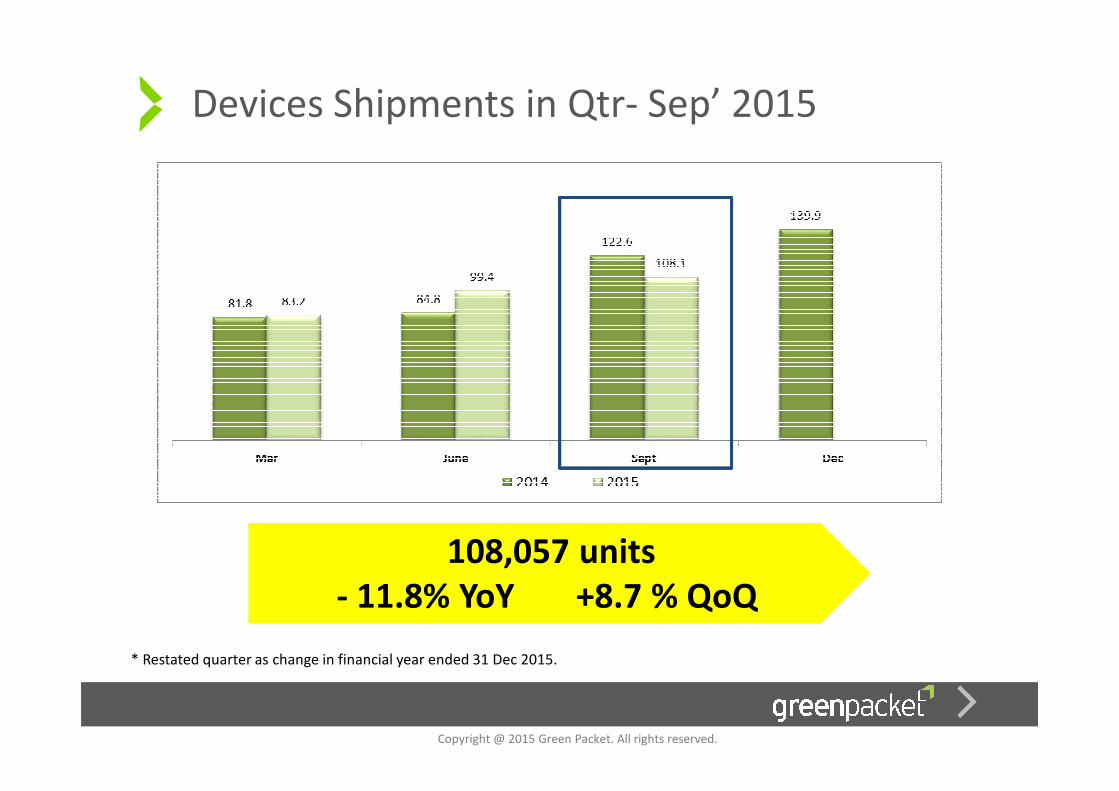
Devices Shipments in Qtr- Sep’ 2015
108,057 units
- 11.8% YoY +8.7 % QoQ
108,057 units
- 11.8% YoY +8.7 % QoQ
* Restated quarter as change in financial year ended 31 Dec 2015.
Copyright @ 2015 Green Packet. All rights reserved.
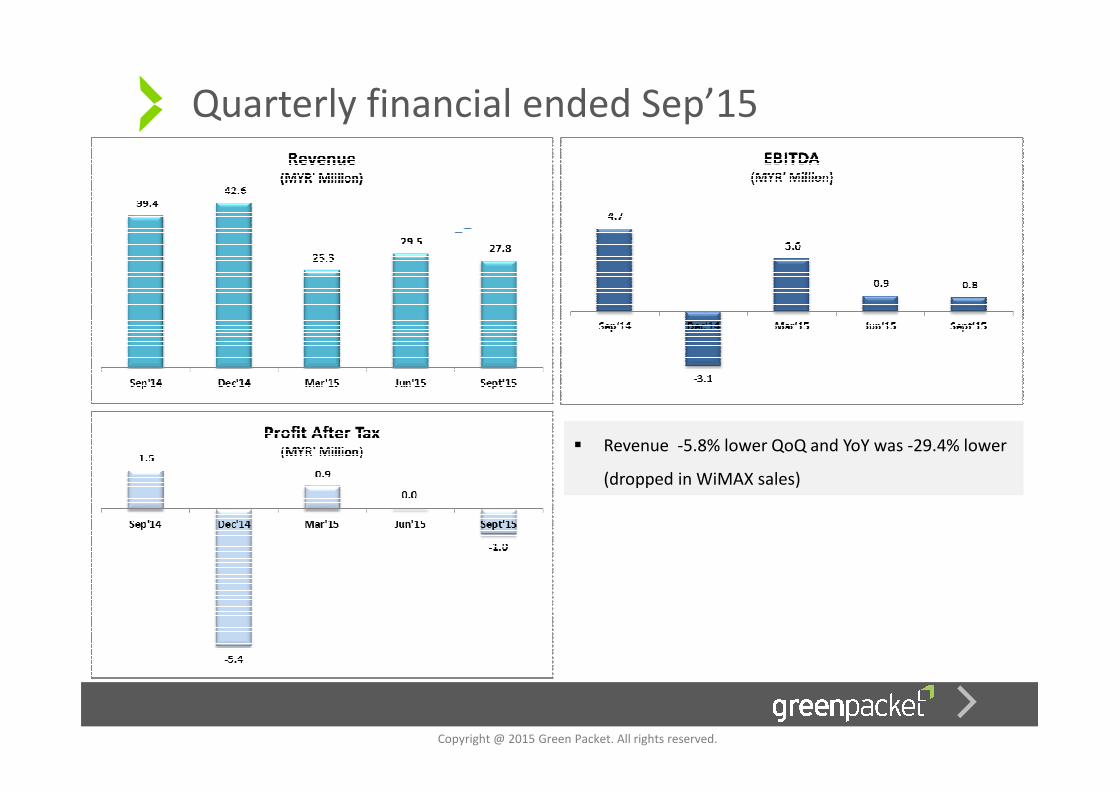
Quarterly financial ended Sep’15
� Revenue -5.8% lower QoQ and YoY was -29.4% lower
(dropped in WiMAX sales)
� Revenue -5.8% lower QoQ and YoY was -29.4% lower
(dropped in WiMAX sales)
Copyright @ 2015 Green Packet. All rights reserved.
B. Communication Pillar
c Financials
- Revenue, EBITDA & PAT
1
Copyright @ 2015 Green Packet. All rights reserved.
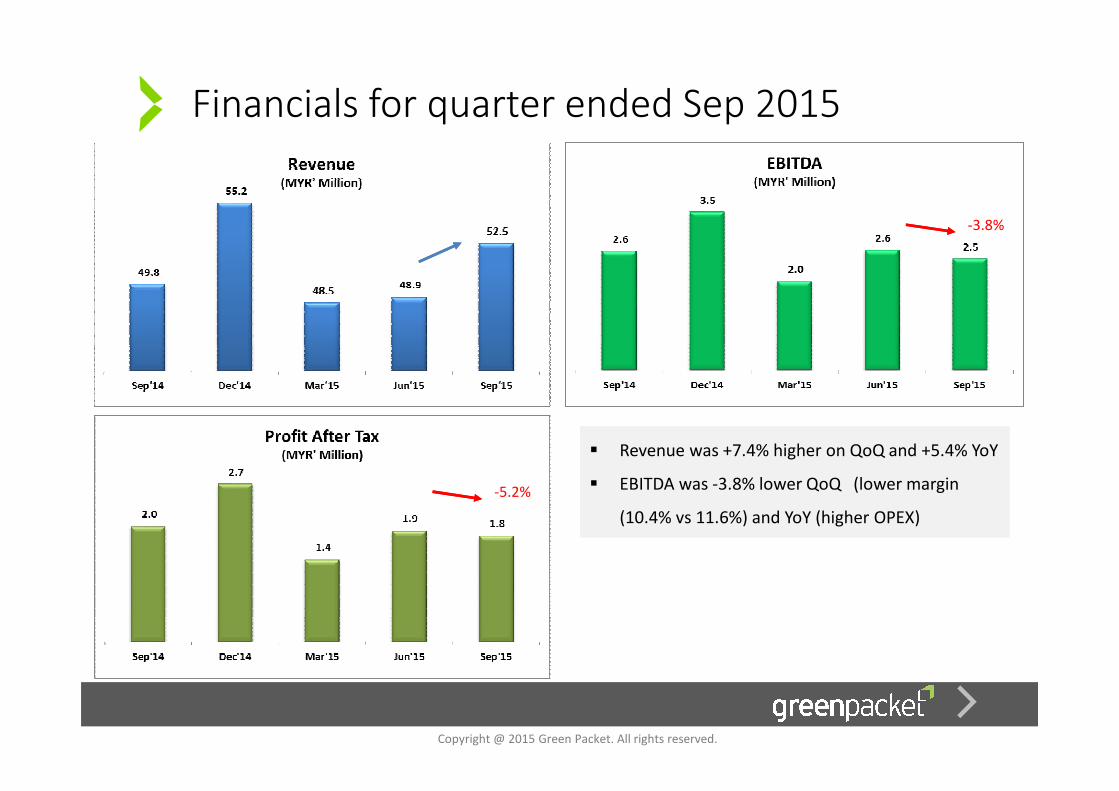
Financials for quarter ended Sep 2015
� Revenue was +7.4% higher on QoQ and +5.4% YoY
� EBITDA was -3.8% lower QoQ (lower margin
(10.4% vs 11.6%) and YoY (higher OPEX)
� Revenue was +7.4% higher on QoQ and +5.4% YoY
� EBITDA was -3.8% lower QoQ (lower margin
(10.4% vs 11.6%) and YoY (higher OPEX)
-3.8%
-5.2%
Copyright @ 2015 Green Packet. All rights reserved.
Group Financial Performance
c
Operational Results
a. Revenue
b. EBITDA
c. Consolidated Profit After Tax
Copyright @ 2015 Green Packet. All rights reserved.
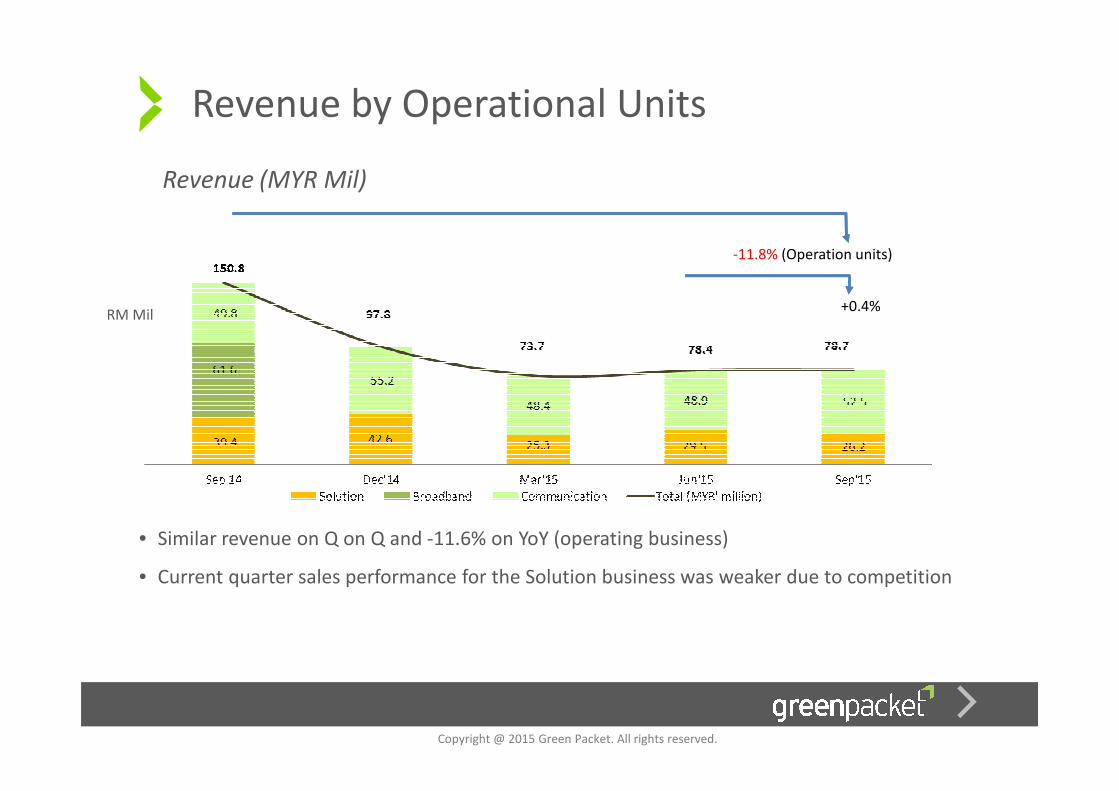
Revenue by Operational Units
Revenue (MYR Mil)
• Similar revenue on Q on Q and -11.6% on YoY (operating business)
• Current quarter sales performance for the Solution business was weaker due to competition
-11.8% (Operation units)
+0.4%RM Mil
Copyright @ 2015 Green Packet. All rights reserved.
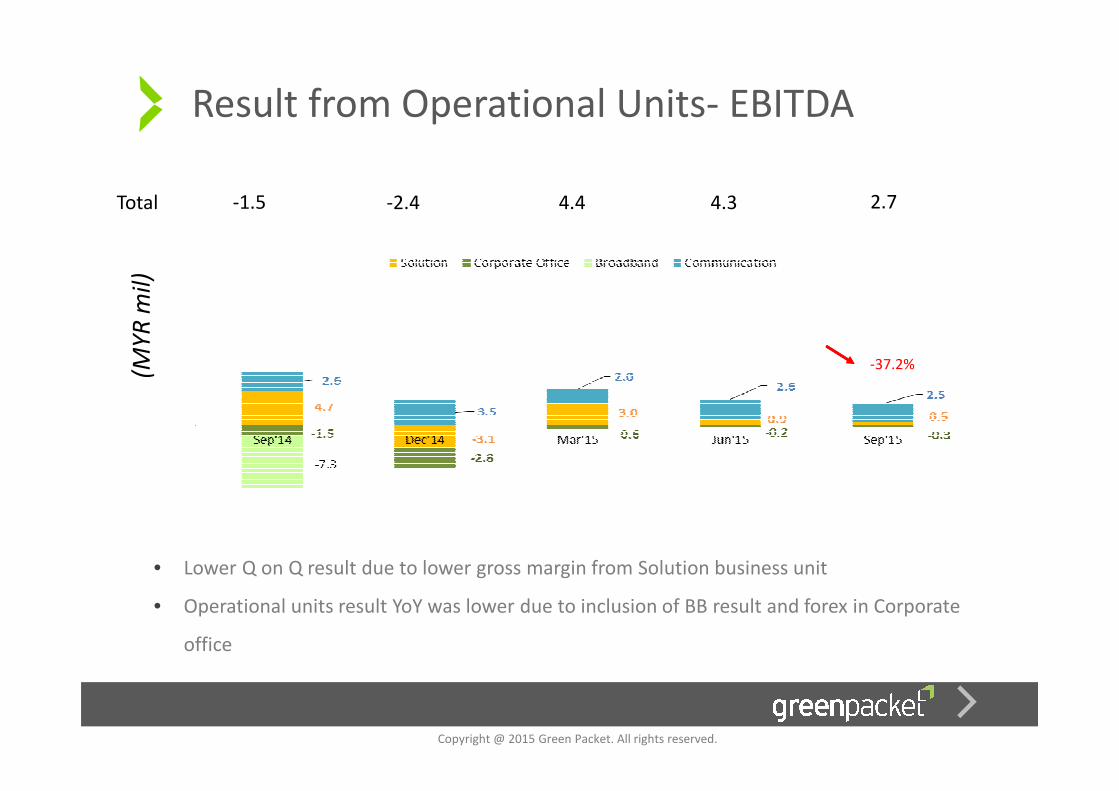
Result from Operational Units- EBITDA(M
YR
mil
)
• Lower Q on Q result due to lower gross margin from Solution business unit
• Operational units result YoY was lower due to inclusion of BB result and forex in Corporate
office
-2.4 4.4 2.7-1.5Total
-37.2%
4.3
Copyright @ 2015 Green Packet. All rights reserved.
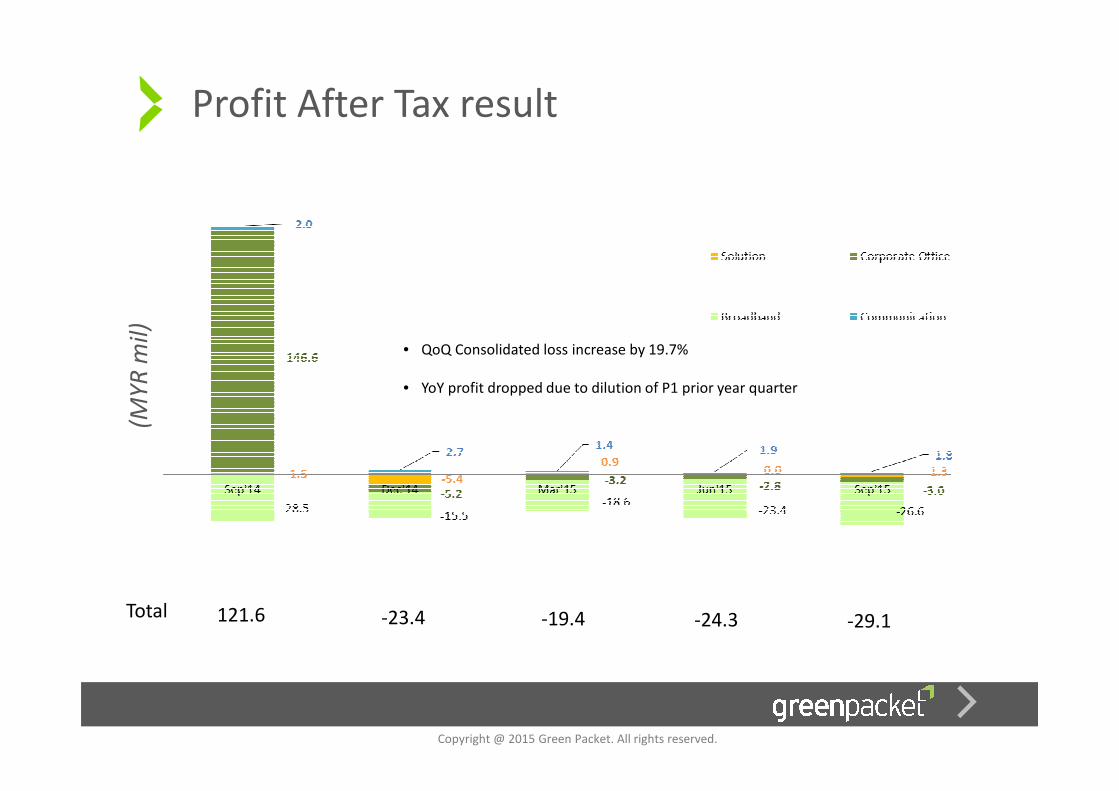
Profit After Tax result(M
YR
mil
)
-23.4 -19.4 -29.1121.6 -24.3Total
• QoQ Consolidated loss increase by 19.7%
• YoY profit dropped due to dilution of P1 prior year quarter

Thank you