financial management velocity - cimaglobal
TRANSCRIPT

Paper P2 – Performance Management Post Exam Guide November 2013 Exam
© The Chartered Institute of Management Accountants 2014 Page 1
General Comments The overall performance showed a marked improvement compared to the last few sittings. The questions within the paper covered a large portion of the syllabus which rewarded candidates who had studied and revised the entire syllabus. There was also a noticeable improvement in the presentation of scripts, particularly in the quality of handwriting and the layout of answers to quantitative questions. Even though there was an overall improvement it is still important to bring to the notice of candidates issues that will always need attention: Candidates:
• Must examine the official questions from previous papers to confirm the depth of knowledge required to answer questions
• Must pay particular attention to the layout of answers • Should clearly indicate if part of the answer to a question appears later in the answer book
The following observations were made when reviewing the scripts:
• The entire syllabus had not been studied • A “knowledge gap” relating to the exemption policy had not been addressed • Many candidates did not appear to be fully prepared for the exam • The content of previous PEGs had not been digested
The following points should be noted by candidates when reflecting on the paper just taken, and when preparing for future CIMA examinations:
1. Due to the progressive nature of the Performance Pillar, candidates sitting the P2 examination are advised to closely examine the syllabi of the Certificate paper CO1 and the P1 paper to ensure they have a thorough understanding of all the topics covered in those papers. Any identified knowledge gap must be addressed.
2. Candidates should always practise time management and relate the time they expend on
each question to the marks available. A simple approach is to allow 1.8 minutes for one mark. This will avoid candidates failing to complete the paper.
3. Candidates are advised to read Financial Management magazine and Velocity e-newsletter,
especially articles that relate to technical issues associated with the P2 syllabus.
4. Candidates should study and revise the entire syllabus and ignore suggestions put forward in accounting journals which give indications of the topics ‘likely’ to be examined.
5. Candidates are advised to understand the rubric of the paper and plan their attempts
accordingly.
6. Candidates should make full use of the 20 minutes allowed for planning.
7. Answers to discursive questions should relate to the scenario in the question. On many occasions general answers are submitted that attract few marks.
8. In preparing for the exam, candidates are advised to practise regularly using past CIMA
questions, comparing their answers to the examiner’s suggested answers. The effort exerted undertaking this task will allow candidates to measure their own progress. Candidates will also gain an understanding of the correct layout for quantitative questions and of the depth of answers required for discursive questions.
Paper P2 – Performance Management Post Exam Guide November 2013 Exam
© The Chartered Institute of Management Accountants 2014 Page 2
9. Candidates are advised to present answers in a clear and logical fashion i.e. with clear and legible handwriting and workings clearly referred to.
10. Do not write in red ink or pencil.
Paper P2 – Performance Management Post Exam Guide November 2013 Exam
© The Chartered Institute of Management Accountants 2014 Page 3
Section A – 50 marks
ANSWER ALL FIVE QUESTIONS IN THIS SECTION. EACH QUESTION IS WORTH 10 MARKS. YOU SHOULD SHOW YOUR WORKINGS AS MARKS ARE AVAILABLE FOR THE METHOD YOU USE.
Question 1
(a) (i) Calculate the time required to produce the 64th batch of Product Z.
(3 marks)
(ii) Calculate the total variable cost of the 64th batch of Product Z.
(2 marks)
(b) Explain THREE conditions that must exist in the production process of Product Z for the learning curve effect to be realised.
(5 marks)
(Total for Question One = 10 marks)
Rationale The question examines candidates’ knowledge and understanding of the learning curve. The learning outcome tested is B1(e), apply learning curves to estimate time and cost for new products and services. Suggested Approach Candidates needed to carefully read the question and use the information to relate their answers to the scenario. In part (a) candidates needed to calculate the time required to produce the 64th batch and the variable cost. The time for batch number 64 was required; candidates then needed to apply the variable costs to calculate the cost of the batch rather than the cost of a unit. In part (b) candidates were required to give three conditions that must exist in the production process of Product Z for the learning curve effect to be realised. Full explanations, relating the conditions to Product Z production, were needed to score the highest marks. Marking Guide
Marks
(a)(i) Cumulative average time (CAT) for 64 = 11.03 hours Total time for 64 batches = 11.03 *64 = 705.92 hours CAT for 63 = 11.04 hours Total time for 63 batches = 11.04 *63 = 695.52 hours Time for batch 64 = 705.92 – 695.52 = 10.40 hours Reasonable rounding allowed Maximum for part (a)(i)
1 mark 0.5 mark 1 mark 0.5 mark 0.5 mark 3 marks
Paper P2 – Performance Management Post Exam Guide November 2013 Exam
© The Chartered Institute of Management Accountants 2014 Page 4
(a)(ii) Labour cost = 10.40 hours * 25 = $260 Material cost = $52 * 10 = $520 Variable overhead = 10.40 hours * 5 = $52 Total variable cost = $832 Reasonable rounding allowed Maximum for part (a)(ii) (b) Labour intensive (manual tasks) Continuous production (repetitive) Complex product Low labour turnover No marks for only stating the product must be new without reference to other points. Max 3 marks for non-specific to PWR comments. Maximum for part (b)
0.5 mark 0.5 mark 0.5 mark 0.5 mark 2 marks 2 marks max 2 marks max 2 marks max 2 marks max 5 marks
Maximum marks awarded 10 marks Examiner’s Comments Most candidates were able to calculate the time required to produce the 64th batch of Product Z, and then calculate the total variable cost of the 64th batch. Part (b) presented no problems for most candidates. Common Errors: Part (a)
1. Calculating the difference between the 64th and 65th batch as opposed to the 63rd and 64th batch 2. Calculating the average time for each of the first 64 batches but assuming this figure to be the
time for the 64th batch 3. Rounding the figures far too early which greatly affected the final answer
Part (b) Assuming bullet points were sufficient to gain the marks available.
Paper P2 – Performance Management Post Exam Guide November 2013 Exam
© The Chartered Institute of Management Accountants 2014 Page 5
Question 2
(a) (i) Calculate the forecast total cost of producing and delivering a Model S car using activity
based costing principles to assign the overhead costs.
(4 marks)
(ii) Calculate the value of any cost gap that currently exists between the forecast total cost and the target total cost of a Model S car.
(2 marks)
(b) Explain TWO potential advantages to SXL of using target costing for the Model S car.
(4 marks)
(Total for Question Two = 10 marks)
Rationale The question examines candidates’ knowledge and understanding of target costing. The learning outcome tested is B1(h), explain how target costs can be derived from target prices and the relationship between target costs and standard costs. Suggested Approach It was important for candidates to carefully read the question in order to calculate the cost of producing and delivering a Model S car. Part (a) required candidates to use the cost driver information in the notes to calculate both the production line and delivery cost for a Model S car. In part (b) candidates should have used the information in the question, for example highlighting the limited production numbers of Model S and the importance of using target costing to achieve the required profit figures.
Paper P2 – Performance Management Post Exam Guide November 2013 Exam
© The Chartered Institute of Management Accountants 2014 Page 6
Marking Guide
Marks
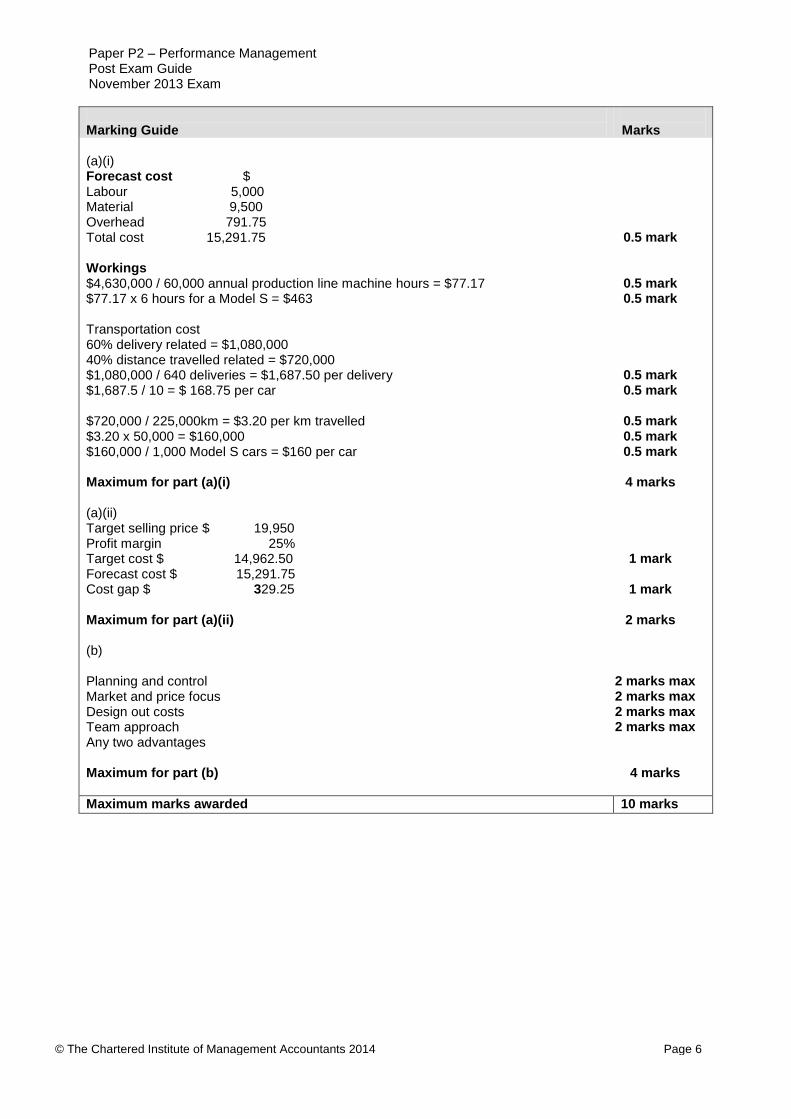
(a)(i) Forecast cost $ Labour 5,000 Material 9,500 Overhead 791.75 Total cost 15,291.75 Workings $4,630,000 / 60,000 annual production line machine hours = $77.17 $77.17 x 6 hours for a Model S = $463 Transportation cost 60% delivery related = $1,080,000 40% distance travelled related = $720,000 $1,080,000 / 640 deliveries = $1,687.50 per delivery $1,687.5 / 10 = $ 168.75 per car $720,000 / 225,000km = $3.20 per km travelled $3.20 x 50,000 = $160,000 $160,000 / 1,000 Model S cars = $160 per car Maximum for part (a)(i) (a)(ii) Target selling price $ 19,950 Profit margin 25% Target cost $ 14,962.50 Forecast cost $ 15,291.75 Cost gap $ 329.25 Maximum for part (a)(ii) (b) Planning and control Market and price focus Design out costs Team approach Any two advantages Maximum for part (b)
0.5 mark
0.5 mark 0.5 mark
0.5 mark 0.5 mark
0.5 mark 0.5 mark 0.5 mark
4 marks
1 mark
1 mark
2 marks
2 marks max 2 marks max 2 marks max 2 marks max
4 marks
Maximum marks awarded 10 marks
Paper P2 – Performance Management Post Exam Guide November 2013 Exam
© The Chartered Institute of Management Accountants 2014 Page 7
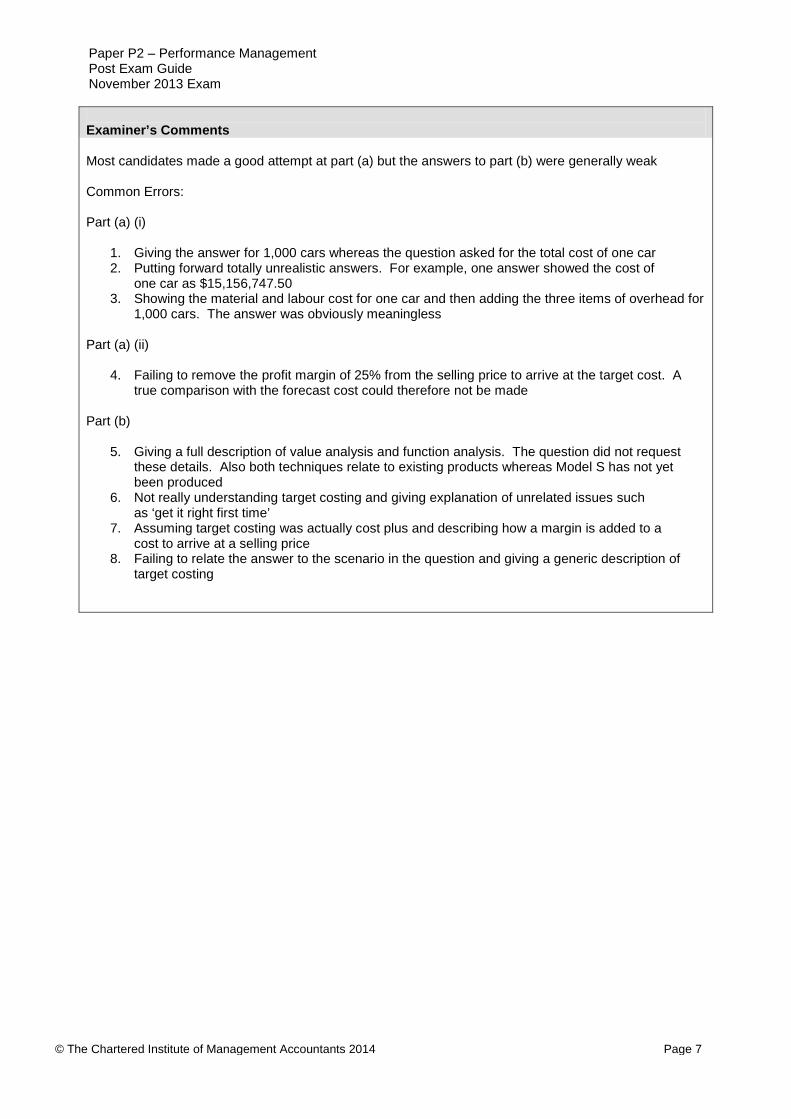
Examiner’s Comments Most candidates made a good attempt at part (a) but the answers to part (b) were generally weak Common Errors: Part (a) (i)
1. Giving the answer for 1,000 cars whereas the question asked for the total cost of one car 2. Putting forward totally unrealistic answers. For example, one answer showed the cost of
one car as $15,156,747.50 3. Showing the material and labour cost for one car and then adding the three items of overhead for
1,000 cars. The answer was obviously meaningless Part (a) (ii)
4. Failing to remove the profit margin of 25% from the selling price to arrive at the target cost. A true comparison with the forecast cost could therefore not be made
Part (b)
5. Giving a full description of value analysis and function analysis. The question did not request these details. Also both techniques relate to existing products whereas Model S has not yet been produced
6. Not really understanding target costing and giving explanation of unrelated issues such as ‘get it right first time’
7. Assuming target costing was actually cost plus and describing how a margin is added to a cost to arrive at a selling price
8. Failing to relate the answer to the scenario in the question and giving a generic description of target costing
Paper P2 – Performance Management Post Exam Guide November 2013 Exam
© The Chartered Institute of Management Accountants 2014 Page 8
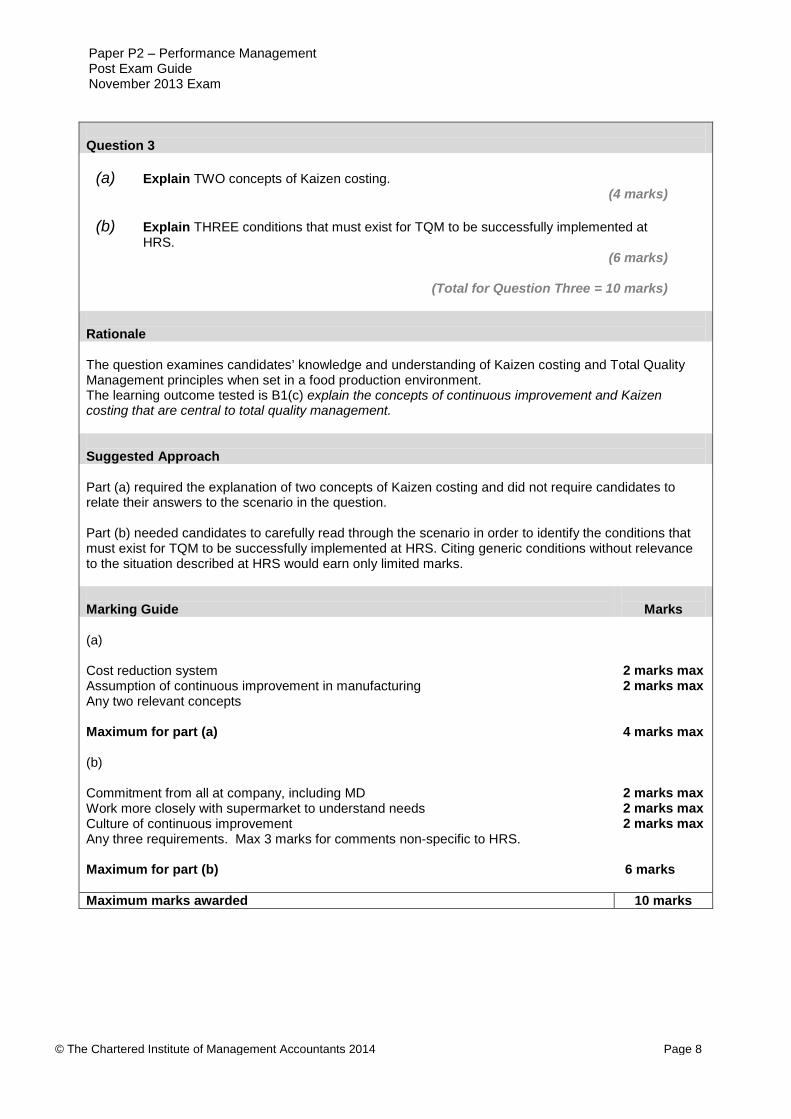
Question 3
(a) Explain TWO concepts of Kaizen costing. (4 marks)
(b) Explain THREE conditions that must exist for TQM to be successfully implemented at
HRS. (6 marks)
(Total for Question Three = 10 marks)
Rationale The question examines candidates’ knowledge and understanding of Kaizen costing and Total Quality Management principles when set in a food production environment. The learning outcome tested is B1(c) explain the concepts of continuous improvement and Kaizen costing that are central to total quality management. Suggested Approach Part (a) required the explanation of two concepts of Kaizen costing and did not require candidates to relate their answers to the scenario in the question. Part (b) needed candidates to carefully read through the scenario in order to identify the conditions that must exist for TQM to be successfully implemented at HRS. Citing generic conditions without relevance to the situation described at HRS would earn only limited marks. Marking Guide
Marks
(a) Cost reduction system Assumption of continuous improvement in manufacturing Any two relevant concepts Maximum for part (a) (b) Commitment from all at company, including MD Work more closely with supermarket to understand needs Culture of continuous improvement Any three requirements. Max 3 marks for comments non-specific to HRS. Maximum for part (b)
2 marks max 2 marks max
4 marks max
2 marks max 2 marks max 2 marks max
6 marks
Maximum marks awarded 10 marks
Paper P2 – Performance Management Post Exam Guide November 2013 Exam
© The Chartered Institute of Management Accountants 2014 Page 9
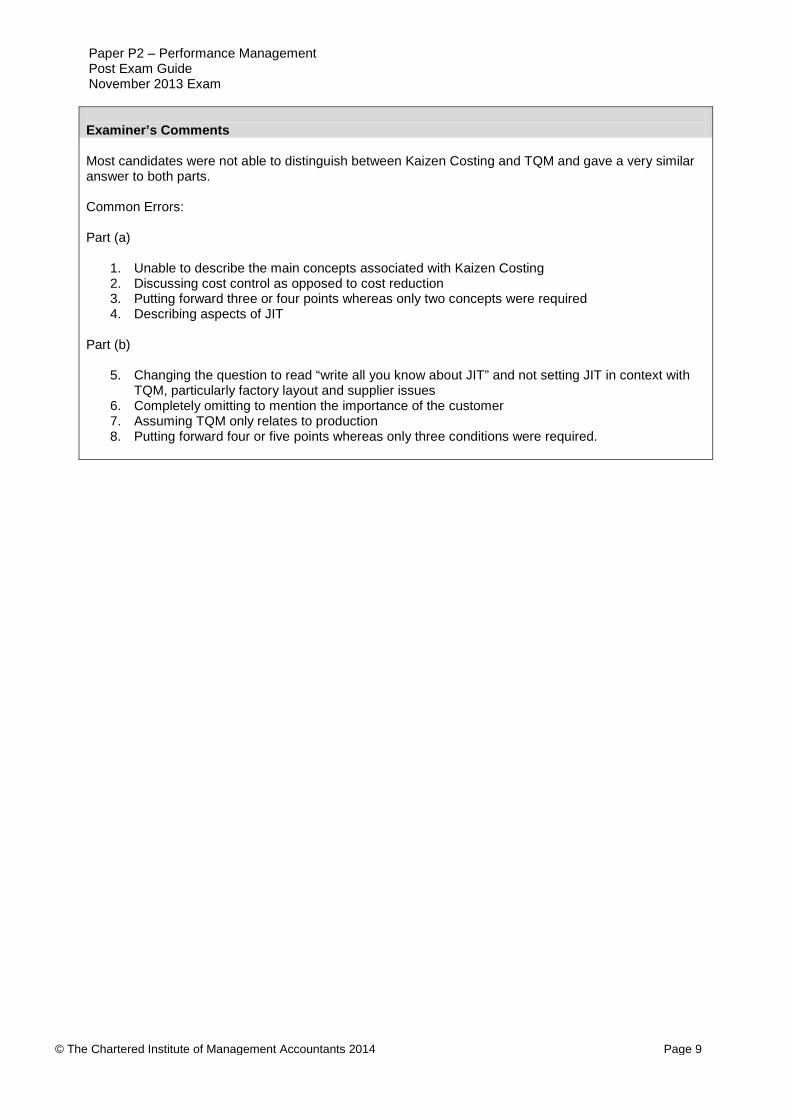
Examiner’s Comments Most candidates were not able to distinguish between Kaizen Costing and TQM and gave a very similar answer to both parts. Common Errors: Part (a)
1. Unable to describe the main concepts associated with Kaizen Costing 2. Discussing cost control as opposed to cost reduction 3. Putting forward three or four points whereas only two concepts were required 4. Describing aspects of JIT
Part (b)
5. Changing the question to read “write all you know about JIT” and not setting JIT in context with TQM, particularly factory layout and supplier issues
6. Completely omitting to mention the importance of the customer 7. Assuming TQM only relates to production 8. Putting forward four or five points whereas only three conditions were required.
Paper P2 – Performance Management Post Exam Guide November 2013 Exam
© The Chartered Institute of Management Accountants 2014 Page 10
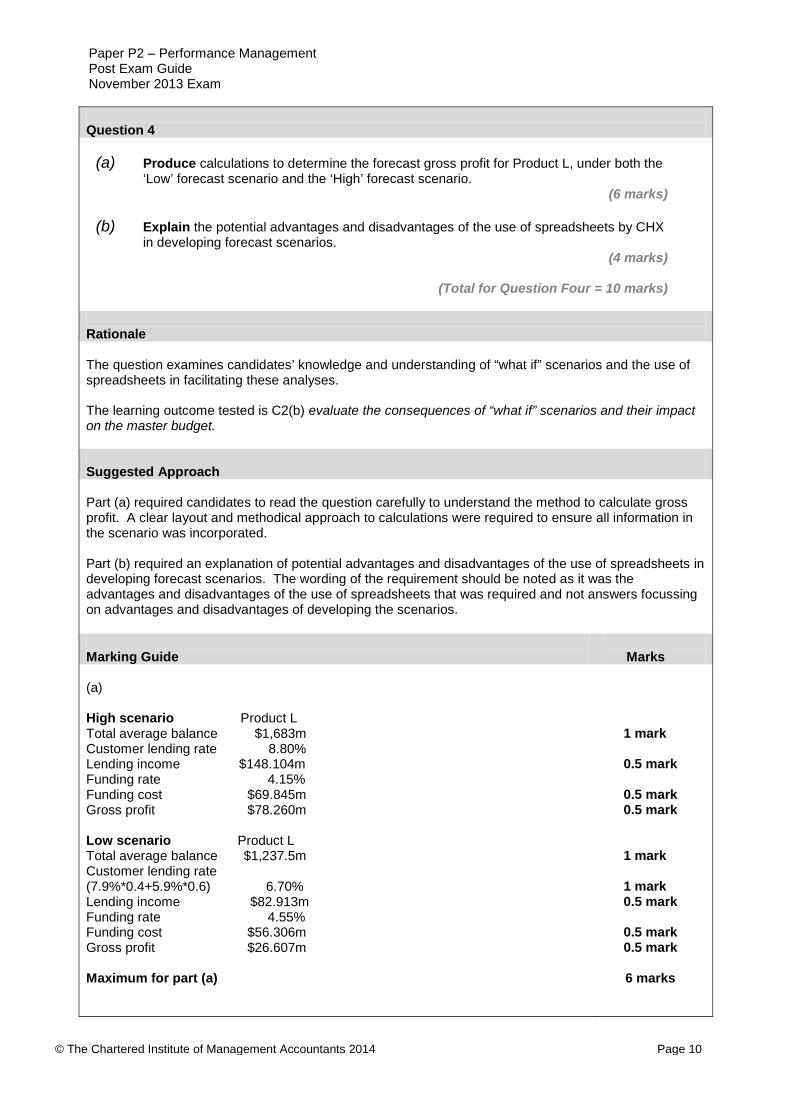
Question 4
(a) Produce calculations to determine the forecast gross profit for Product L, under both the
‘Low’ forecast scenario and the ‘High’ forecast scenario. (6 marks)
(b) Explain the potential advantages and disadvantages of the use of spreadsheets by CHX
in developing forecast scenarios. (4 marks)
(Total for Question Four = 10 marks)
Rationale The question examines candidates’ knowledge and understanding of “what if” scenarios and the use of spreadsheets in facilitating these analyses. The learning outcome tested is C2(b) evaluate the consequences of “what if” scenarios and their impact on the master budget. Suggested Approach Part (a) required candidates to read the question carefully to understand the method to calculate gross profit. A clear layout and methodical approach to calculations were required to ensure all information in the scenario was incorporated. Part (b) required an explanation of potential advantages and disadvantages of the use of spreadsheets in developing forecast scenarios. The wording of the requirement should be noted as it was the advantages and disadvantages of the use of spreadsheets that was required and not answers focussing on advantages and disadvantages of developing the scenarios.
Marking Guide
Marks
(a) High scenario Product L Total average balance $1,683m Customer lending rate 8.80% Lending income $148.104m Funding rate 4.15% Funding cost $69.845m Gross profit $78.260m Low scenario Product L Total average balance $1,237.5m Customer lending rate (7.9%*0.4+5.9%*0.6) 6.70% Lending income $82.913m Funding rate 4.55% Funding cost $56.306m Gross profit $26.607m Maximum for part (a)
1 mark 0.5 mark 0.5 mark 0.5 mark 1 mark 1 mark 0.5 mark 0.5 mark 0.5 mark
6 marks

Paper P2 – Performance Management Post Exam Guide November 2013 Exam
© The Chartered Institute of Management Accountants 2014 Page 11
(b) Flexibility Ability to see impact of changes Mistakes in input or formula Other relevant comment Max 3 marks for positive impacts, max 3 marks for negative impacts Maximum for part (b)
2 marks max 2 marks max 2 marks max 2 marks max 4 marks
Maximum marks awarded 10 marks Examiner’s Comments Most candidates put forward good answers to both parts of this question. Common Errors: Part (a)
1. Poor layout of answers with figures being shown with no description 2. Failure to adjust the actual total average balance ($1,650m) for the +2% for the high scenario
and the -25% for the low scenario Part (b)
3. Failing to include any disadvantages 4. Concentrating on aspects of data security as opposed to the use of spread sheets
Paper P2 – Performance Management Post Exam Guide November 2013 Exam
© The Chartered Institute of Management Accountants 2014 Page 12
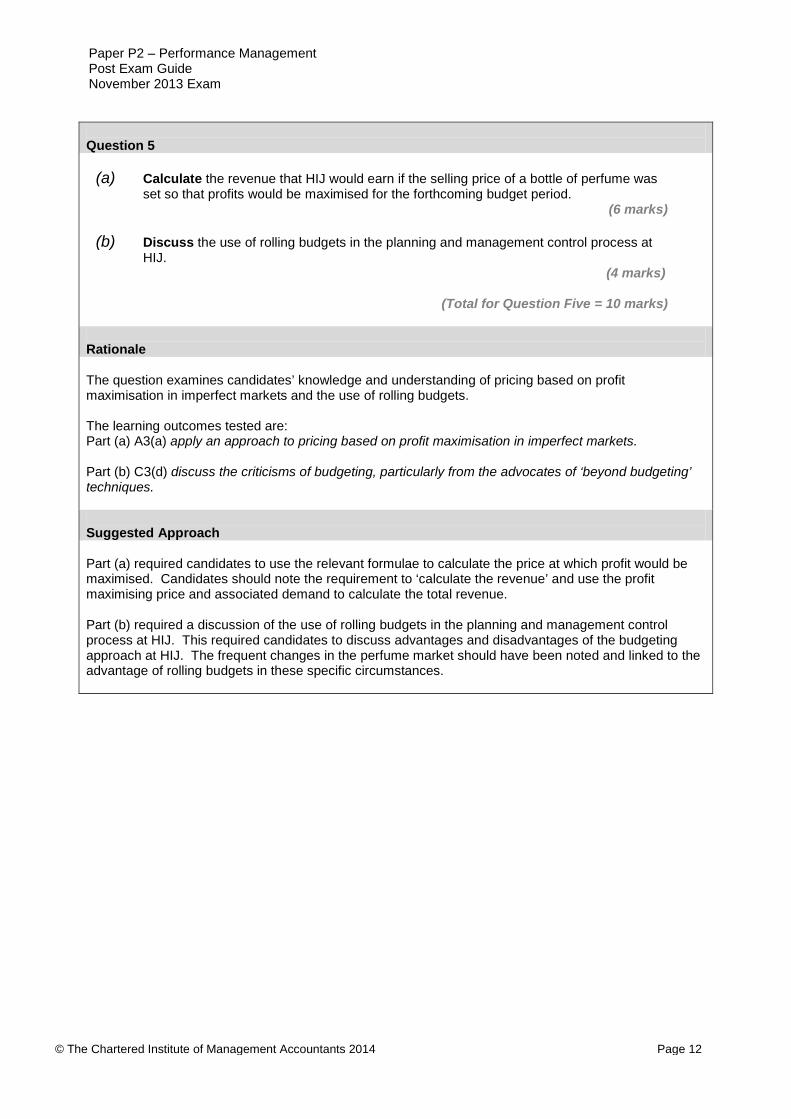
Question 5
(a) Calculate the revenue that HIJ would earn if the selling price of a bottle of perfume was set so that profits would be maximised for the forthcoming budget period.
(6 marks) (b) Discuss the use of rolling budgets in the planning and management control process at
HIJ. (4 marks)
(Total for Question Five = 10 marks)
Rationale The question examines candidates’ knowledge and understanding of pricing based on profit maximisation in imperfect markets and the use of rolling budgets. The learning outcomes tested are: Part (a) A3(a) apply an approach to pricing based on profit maximisation in imperfect markets. Part (b) C3(d) discuss the criticisms of budgeting, particularly from the advocates of ‘beyond budgeting’ techniques. Suggested Approach Part (a) required candidates to use the relevant formulae to calculate the price at which profit would be maximised. Candidates should note the requirement to ‘calculate the revenue’ and use the profit maximising price and associated demand to calculate the total revenue. Part (b) required a discussion of the use of rolling budgets in the planning and management control process at HIJ. This required candidates to discuss advantages and disadvantages of the budgeting approach at HIJ. The frequent changes in the perfume market should have been noted and linked to the advantage of rolling budgets in these specific circumstances.
Paper P2 – Performance Management Post Exam Guide November 2013 Exam
© The Chartered Institute of Management Accountants 2014 Page 13
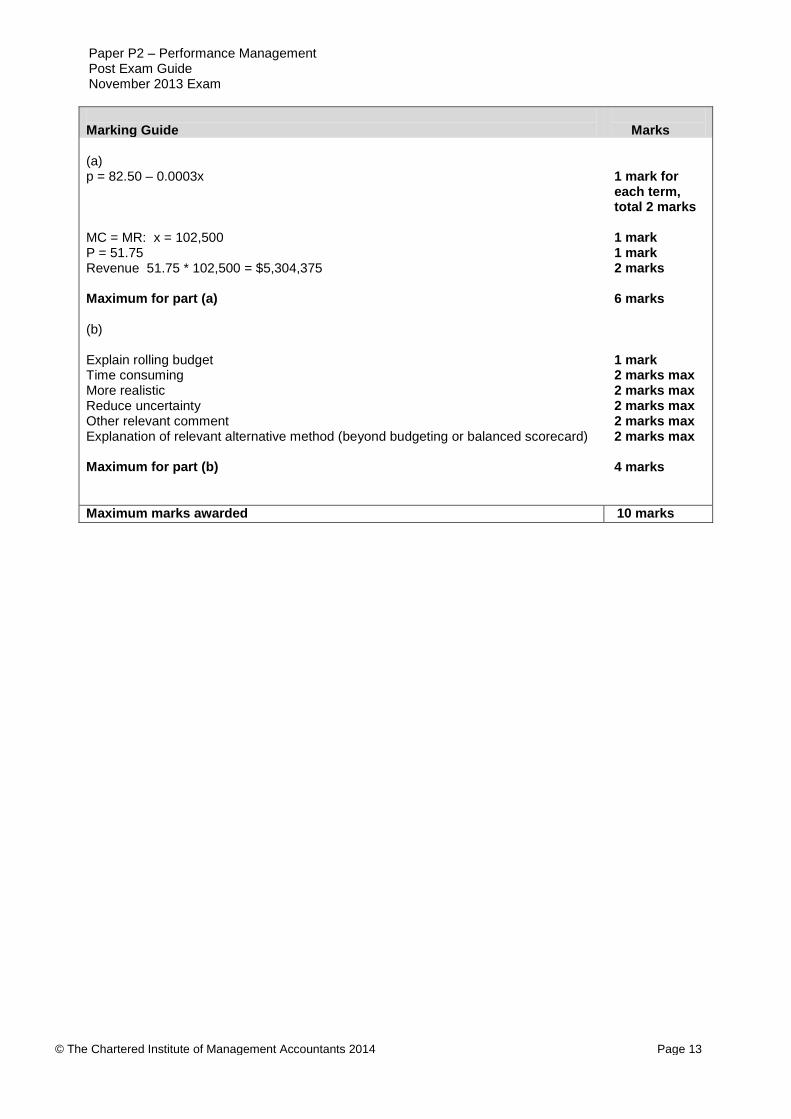
Marking Guide
Marks
(a) p = 82.50 – 0.0003x MC = MR: x = 102,500 P = 51.75 Revenue 51.75 * 102,500 = $5,304,375 Maximum for part (a) (b) Explain rolling budget Time consuming More realistic Reduce uncertainty Other relevant comment Explanation of relevant alternative method (beyond budgeting or balanced scorecard) Maximum for part (b)
1 mark for each term, total 2 marks 1 mark 1 mark 2 marks 6 marks 1 mark 2 marks max 2 marks max 2 marks max 2 marks max 2 marks max 4 marks
Maximum marks awarded 10 marks

Paper P2 – Performance Management Post Exam Guide November 2013 Exam
© The Chartered Institute of Management Accountants 2014 Page 14
Examiner’s Comment Most candidates made a good attempt at part (a) but the answers to part (b) were generally poor. Common Errors Part (a)
1. Calculating a total profit figure whereas the question requested a revenue figure 2. Stopping when the maximum selling price had been calculated ($51.75) 3. Putting forward totally unrealistic answers, for example stating that the selling price that would
maximise company profits is $0.75, as opposed to $51.75 4. Making simple mathematical errors 5. The final answer needed to be shown as an absolute figure. $5.304 x 10⁶ is not acceptable
Part (b)
6. Incorrectly stating that a rolling budget is simply another name for a flexed budget or a zero-based budget
7. Incorrectly describing an incremental budget but stating that the description was of a rolling budget
8. Failing to convince the marker that the main characteristics of a rolling budget were known 9. Failing to explain how a rolling budget would assist in planning and control 10. Failing to relate the answer to the simple scenario described in the question
Paper P2 – Performance Management Post Exam Guide November 2013 Exam
© The Chartered Institute of Management Accountants 2014 Page 15
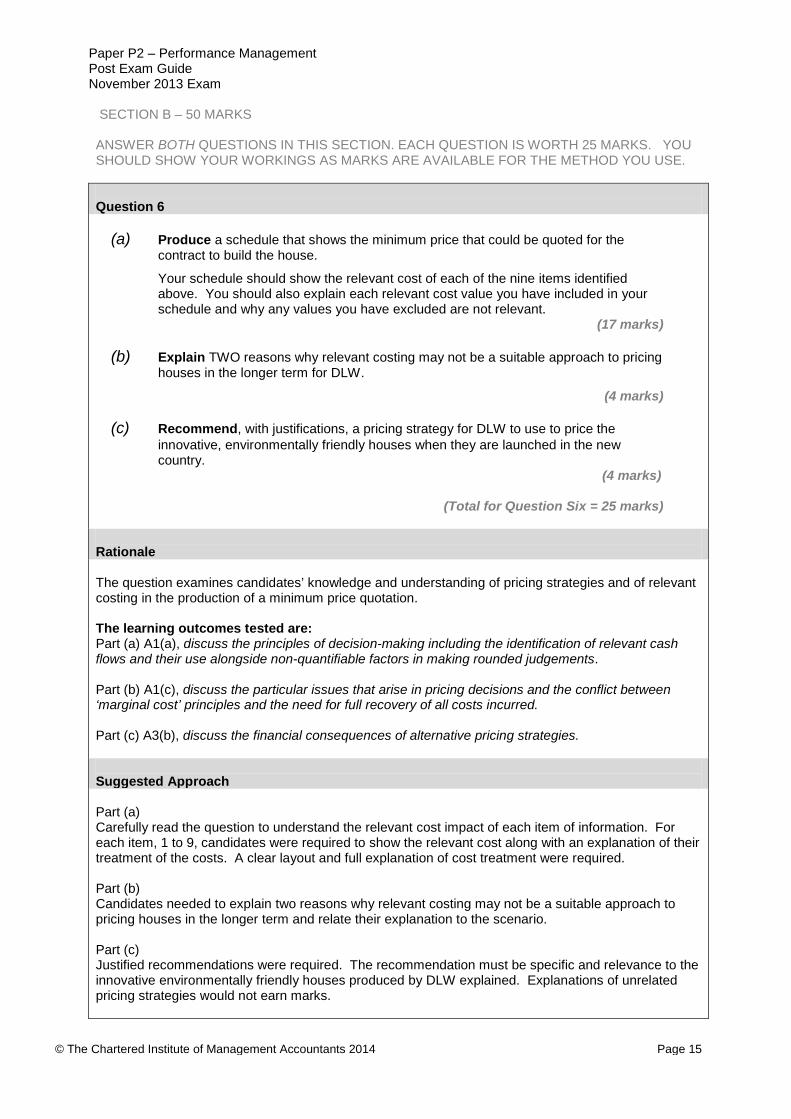
SECTION B – 50 MARKS ANSWER BOTH QUESTIONS IN THIS SECTION. EACH QUESTION IS WORTH 25 MARKS. YOU SHOULD SHOW YOUR WORKINGS AS MARKS ARE AVAILABLE FOR THE METHOD YOU USE. Question 6
(a) Produce a schedule that shows the minimum price that could be quoted for the contract to build the house.
Your schedule should show the relevant cost of each of the nine items identified above. You should also explain each relevant cost value you have included in your schedule and why any values you have excluded are not relevant.
(17 marks)
(b) Explain TWO reasons why relevant costing may not be a suitable approach to pricing houses in the longer term for DLW.
(4 marks)
(c) Recommend, with justifications, a pricing strategy for DLW to use to price the innovative, environmentally friendly houses when they are launched in the new country.
(4 marks)
(Total for Question Six = 25 marks)
Rationale The question examines candidates’ knowledge and understanding of pricing strategies and of relevant costing in the production of a minimum price quotation. The learning outcomes tested are: Part (a) A1(a), discuss the principles of decision-making including the identification of relevant cash flows and their use alongside non-quantifiable factors in making rounded judgements. Part (b) A1(c), discuss the particular issues that arise in pricing decisions and the conflict between ‘marginal cost’ principles and the need for full recovery of all costs incurred. Part (c) A3(b), discuss the financial consequences of alternative pricing strategies. Suggested Approach Part (a) Carefully read the question to understand the relevant cost impact of each item of information. For each item, 1 to 9, candidates were required to show the relevant cost along with an explanation of their treatment of the costs. A clear layout and full explanation of cost treatment were required. Part (b) Candidates needed to explain two reasons why relevant costing may not be a suitable approach to pricing houses in the longer term and relate their explanation to the scenario. Part (c) Justified recommendations were required. The recommendation must be specific and relevance to the innovative environmentally friendly houses produced by DLW explained. Explanations of unrelated pricing strategies would not earn marks.

Paper P2 – Performance Management Post Exam Guide November 2013 Exam
© The Chartered Institute of Management Accountants 2014 Page 16
Marking Guide
Marks
(a) Food and drink is a sunk cost – 0 550kg of Z replaced and valued at replacement cost - $35,750 650kg bought in and valued at replacement cost - $42,250 Construction workers, spare capacity, guaranteed wage, not relevant – 0 Engineers’ time valued at opportunity cost only. Opportunity cost of time is contribution from 3 units $4,485, lower than overtime cost $4,680 Relevant cost to hire machine is for coming period only as current hire contract is sunk. Hire cost less than purchase and re-sale $15,250 Window production cost is sunk Conference sales will not be lost as chief executive can visit clients at a later date Chief executive cost is not relevant as salaried – 0 Conference non-attendance fee $1,500, incurred if contract proceeds, is relevant 400kg other materials. Will be required if contract proceeds, relevant cost $6,000 Fixed costs incurred independent of contract, therefore not relevant. Profit mark-up not relevant in minimum price quote to cover relevant costs only. Note: Calculation marks awarded for stating ‘nil’ where a cost is not relevant. Maximum for part (a) (b) Relevant costing explanation Fixed costs not covered No profit margin Other relevant point Maximum for part (b) (c) Market skimming Justification relevant to DLW Premium pricing is also permitted. Maximum for part (c)
1 mark 1 mark 1 mark 1 mark 4 marks 4 marks 1 mark 1 mark 1 mark 1.5 marks 1 mark 1 mark 1 mark 17 marks
1 mark 2 marks max 2 marks max 2 marks max 4 marks 1 mark 3 marks max 4 marks
Maximum marks awarded 25 marks

Paper P2 – Performance Management Post Exam Guide November 2013 Exam
© The Chartered Institute of Management Accountants 2014 Page 17
Examiner’s Comments Most candidates made a good attempt at part (a), a topic that has appeared in many recent papers. There was a mixed level of response to part (b), whereas the answers put forward to part (c) were good. Common Errors Part (a)
1. Poor layouts that made the marking task extremely difficult 2. Failure to give any explanation of why a figure had been excluded from the build-up of the
relevant cost 3. Failing to give an adequate explanation of why a figure had been excluded. “Sunk cost” is
not sufficient. “Because it is not relevant” is not sufficient. 4. Putting forward a totally unrealistic figure as the selling price for the house. Many
candidates gave an answer exceeding $4 million, and one candidate gave a figure of $7,984,035
5. Not fully understanding the principles of relevant costing 6. Including a profit whereas the question clearly stated that the price for the house “will
exactly cover its relevant cost” Part (b)
7. Not specifically answering the question and describing items such as net present values and changes in interest and inflation rates
8. Incorrectly describing marginal costing rather than relevant costing Part (c)
9. Incorrectly putting forward market penetration and cost plus pricing as the preferred method
10. Suggesting that activity based costing is a pricing strategy 11. Describing two methods, such as skimming and penetration, and not making a final choice 12. Suggesting a penetration approach but then describing a skimming approach
Paper P2 – Performance Management Post Exam Guide November 2013 Exam
© The Chartered Institute of Management Accountants 2014 Page 18
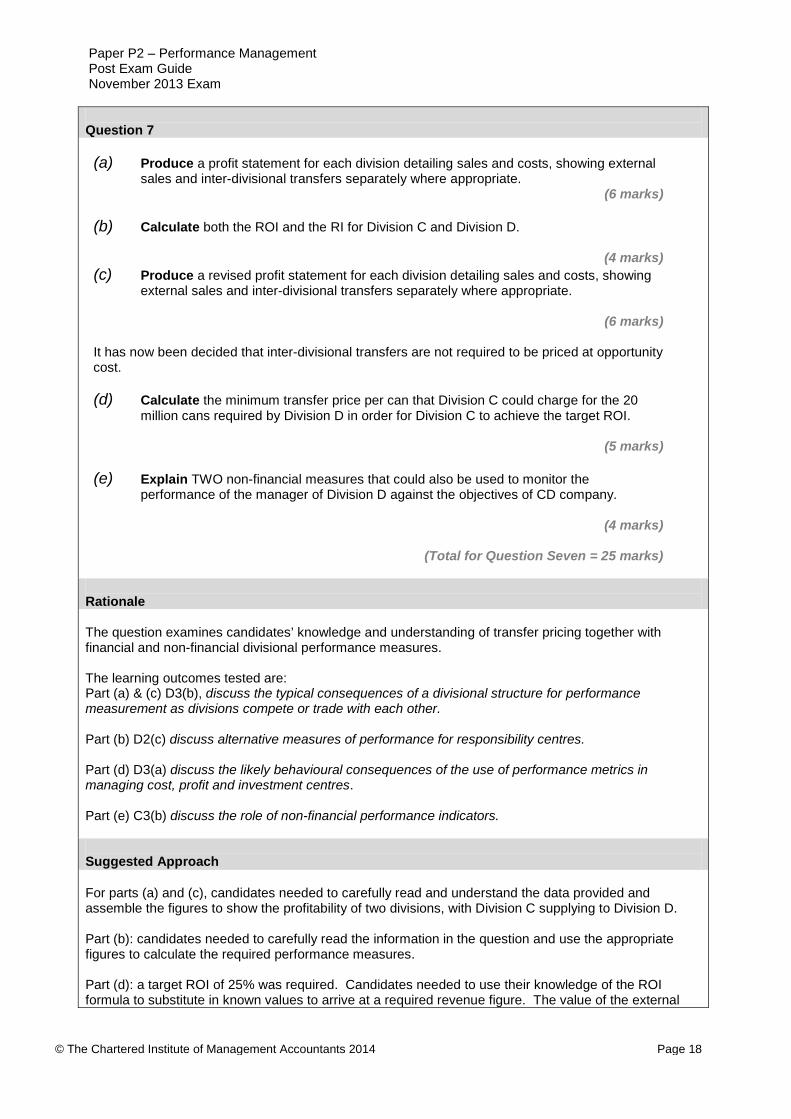
Question 7 (a) Produce a profit statement for each division detailing sales and costs, showing external
sales and inter-divisional transfers separately where appropriate. (6 marks)
(b) Calculate both the ROI and the RI for Division C and Division D.
(4 marks) (c) Produce a revised profit statement for each division detailing sales and costs, showing
external sales and inter-divisional transfers separately where appropriate.
(6 marks) It has now been decided that inter-divisional transfers are not required to be priced at opportunity cost. (d) Calculate the minimum transfer price per can that Division C could charge for the 20
million cans required by Division D in order for Division C to achieve the target ROI.
(5 marks) (e) Explain TWO non-financial measures that could also be used to monitor the
performance of the manager of Division D against the objectives of CD company.
(4 marks)
(Total for Question Seven = 25 marks) Rationale The question examines candidates’ knowledge and understanding of transfer pricing together with financial and non-financial divisional performance measures. The learning outcomes tested are: Part (a) & (c) D3(b), discuss the typical consequences of a divisional structure for performance measurement as divisions compete or trade with each other. Part (b) D2(c) discuss alternative measures of performance for responsibility centres. Part (d) D3(a) discuss the likely behavioural consequences of the use of performance metrics in managing cost, profit and investment centres. Part (e) C3(b) discuss the role of non-financial performance indicators. Suggested Approach For parts (a) and (c), candidates needed to carefully read and understand the data provided and assemble the figures to show the profitability of two divisions, with Division C supplying to Division D. Part (b): candidates needed to carefully read the information in the question and use the appropriate figures to calculate the required performance measures. Part (d): a target ROI of 25% was required. Candidates needed to use their knowledge of the ROI formula to substitute in known values to arrive at a required revenue figure. The value of the external
Paper P2 – Performance Management Post Exam Guide November 2013 Exam
© The Chartered Institute of Management Accountants 2014 Page 19
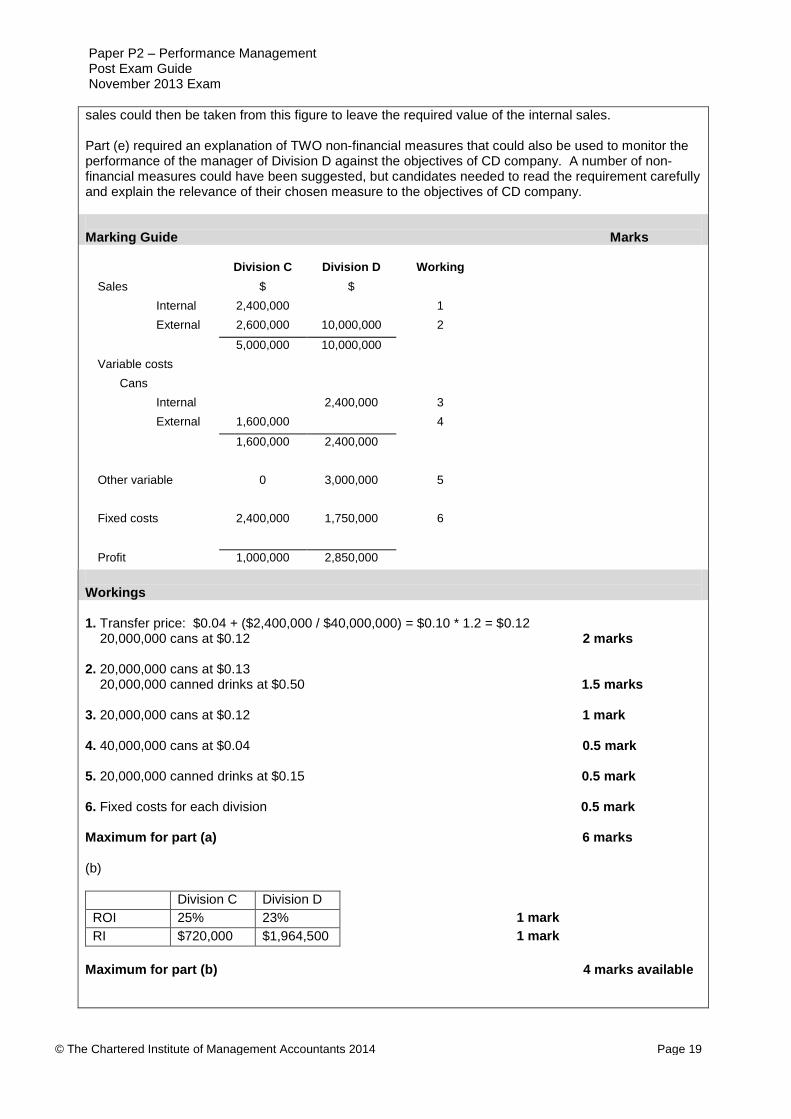
sales could then be taken from this figure to leave the required value of the internal sales. Part (e) required an explanation of TWO non-financial measures that could also be used to monitor the performance of the manager of Division D against the objectives of CD company. A number of non-financial measures could have been suggested, but candidates needed to read the requirement carefully and explain the relevance of their chosen measure to the objectives of CD company. Marking Guide Marks
Division C Division D Working Sales $ $
Internal 2,400,000 1 External 2,600,000 10,000,000 2
5,000,000 10,000,000 Variable costs
Cans Internal 2,400,000 3 External 1,600,000 4
1,600,000 2,400,000
Other variable 0 3,000,000 5
Fixed costs 2,400,000 1,750,000 6
Profit 1,000,000 2,850,000
Workings 1. Transfer price: $0.04 + ($2,400,000 / $40,000,000) = $0.10 * 1.2 = $0.12 20,000,000 cans at $0.12 2 marks 2. 20,000,000 cans at $0.13 20,000,000 canned drinks at $0.50 1.5 marks 3. 20,000,000 cans at $0.12 1 mark 4. 40,000,000 cans at $0.04 0.5 mark 5. 20,000,000 canned drinks at $0.15 0.5 mark 6. Fixed costs for each division 0.5 mark Maximum for part (a) 6 marks (b)
Division C Division D ROI 25% 23% 1 mark RI $720,000 $1,964,500 1 mark
Maximum for part (b) 4 marks available

Paper P2 – Performance Management Post Exam Guide November 2013 Exam
© The Chartered Institute of Management Accountants 2014 Page 20
(c) Division C Division D Working
Sales $ $ Internal 1,520,000 1 External 3,900,000 10,000,000 2
5,420,000 10,000,000 Variable costs Cans Internal 1,520,000 3 External 2,000,000 4
2,000,000 1,520,000 Other variable 0 3,000,000 5 Fixed costs 2,400,000 1,750,000 6
Profit 1,020,000 3,730,000
Workings 1. 8,000,000 cans at $0.13 opportunity cost 12,000,000 cans at $0.04 variable cost 2. 30,000,000 cans at $0.13 20,000,000 canned drinks at $0.50 3. As per division C internal sales revenue 4. 50,000,000 cans at $0.04 5. 20,000,000 canned drinks at $0.15 6. Fixed costs for each division Maximum for part (c) (d) 25% = Profit/net assets $1,125,000 = Contribution - fixed cost $3,525,000 = Contribution $5,525,000 = Revenue $1,625,000 = Internal sales $0.08 = Internal transfer price Maximum for part (d) (e) 1 mark for each relevant non-financial measure and 1 mark for explanation of relevance of measure to Divisions C and D. Maximum for part (e)
2 marks
1.5 marks
1 mark
0.5 mark
0.5 mark
0.5 mark
6 marks
1 mark 1 mark 1 mark 1 mark 1 mark
5 marks
4 marks
Maximum marks awarded 25 marks

Paper P2 – Performance Management Post Exam Guide November 2013 Exam
© The Chartered Institute of Management Accountants 2014 Page 21
Examiner’s comments The attempts at parts (a), (b), and (c) were generally good, but the attempts at part (d) and (e) were not quite so good. Common Errors: Part (a) and (c)
1. Unclear workings which made it difficult to award method marks or own figure marks 2. Not fully understanding the transfer pricing policy 3. Not fully understanding the opportunity cost approach to transfer pricing 4. Not ensuring that the internal sales revenue for Division C is equal to the internal purchases
figure for Division D 5. Failing to include the fixed cost figures 6. In part (c) adjusting the fixed cost figure although the question clearly stated that there was no
impact on fixed costs 7. The statement needed to show absolute figures, as opposed to figures such as:
12n x 0.4 20,000 x 0.13
Part (b)
8. Failing to use the profits obtained in part (a) when calculating the ROI and RI figures/percentages
9. Showing the RI figures as a percentage as opposed to an absolute figure 10. Giving the interest figure only as the RI for each division
Part (d)
11. Not fully appreciating what was required 12. Failing to follow the normal rules of sales minus variable costs equals contribution, and
contribution minus fixed costs equals profit. In this case the profit was easily calculated and candidates had to work backwards through the above calculation to arrive at the total internal transfer revenue for 20m units.
13. Suggesting an unrealistic transfer price e.g. $63.75 as opposed to $0.08 Part (e) Some fundamental errors were made by most candidates when attempting this part:
14. Putting forward performance measures that did not relate to the two objectives identified in the question
15. Putting forward performance measures that could not be measured 16. Suggesting a measure that was too vague.
Example 1 Conduct a survey Example 2 Send out a questionnaire
These items are far too subjective 17. Putting forward weak ideas. Example: “establish if the customers are happy”