financial integration and business cycle
TRANSCRIPT

TURKISH ECONOMIC ASSOCIATION
DISCUSSION PAPER 2004/1 http://www.tek.org.tr
THE DIRECTION, TIMING AND CAUSALITY RELATIONSHIPS
BETWEEN THE CYCLICAL COMPONENTS OF REAL AND
FINANCIAL VARIABLES DURING THE FINANCIAL LIBERALIZATION PERIOD
IN TURKEY
Aysu İnsel, Mehmet Ali Soytaş and Seda Gündüz
January, 2004

All Comments Are Welcomed
THE DIRECTION, TIMING AND CAUSALITY RELATIONSHIPS
BETWEEN THE CYCLICAL COMPONENTS OF REAL AND
FINANCIAL VARIABLES DURING THE FINANCIAL
LIBERALIZATION PERIOD IN TURKEY
Aysu İnsel*, Mehmet Ali Soytaş**, and Seda Gündüz*** *Professor of Economics *** Graduate Student ** Graduate student and Research Assistant York University Marmara University Faculty of Arts Department of Economics Department of Economics Goztepe, 34073 Ontario M3J IP3 Istanbul, TURKEY Toronto, CANADA e-mail: [email protected] e-mail: [email protected] [email protected]
January, 2004
DRAFT VERSION.1
Abstract The purpose of this paper is the determination of sources and pattern of business cycle in Turkey throughout the period 1988-2002 using quarterly data. The question of the paper is “Has financial liberalization increased the fragility of the financial and real sides of the Turkish economy?” The quantitative analysis of the paper includes the cross correlation and causality analysis. Financial development indicators are the bank credits and capital flows, efficiency indicators are the domestic and foreign interest rate spreads. It has been found that the pattern of real GDP is determined by demand side variables, whereas the source of fluctuations in the real GDP is the financial variables in Turkey. External spread, capital flows, and domestic spread are the transmission channels of a shock to the real economy. JEL classification: C32, E32, E36, E44
1
Keywords: business cycle, liberalization, decomposition, efficiency indicator,
development indicator, Turkey.

THE DIRECTION, TIMING, AND CAUSALITY RELATIONSHIPS BETWEEN
THE CYCLICAL COMPONENTS OF REAL AND FINANCIAL VARIABLES
DURING THE FINANCIAL LIBERALIZATION PERIOD IN TURKEY ∗
Aysu İnsel, Mehmet A. Soytaş, and Seda Gündüz
I. INTRODUCTION: Financial liberalization policies that began to be discussed with McKinnon-Shaw
hypothesis through the first period of seventies created important impacts from the point
of not only the functioning but also the run of the whole economic system. Although the
first experiments of the implementation of financial liberalization policy results could be
described, at least, as being unexpected but it did not bring the end of those
implementations for developing countries. On the contrary, through the 1980s, financial
liberalization gained impetus. The domestic market, which completed its integration
within the whole market as it was claimed, went one step further and integrated with the
world market. The results of international integration have been more unpredictable than
domestic integration. Financial turmoil turned into deep real-side crisis and it is
described as the global crises.
Through the 1980s and 1990s, a different approach of the neo-classical theory attempted
to understand what was happening to the real economy. As the new approach was trying
to give a new shape to the structure of the economy, the real business cycles were
figuring out the fluctuations of the real economy. The cyclical variations of the real GDP
were explained by real variables, like unemployment, total hours worked, and the real
wages. At the end of the 1990s, another question appeared to be answered. “What is the
relationship between the cyclical behaviors of real aggregates and those of monetary
∗ First version of this paper was presented at erc/METU International Conference in Economics VII, September 2003, Ankara, Turkey.
2

aggregates?” Furthermore, financial crises have triggered the curiosity about the question
that “Is there any positive impact of the financial market on the real side fluctuations?”
In the second half of the 1990s, the increasing frequency of financial and real crises and
the unexpected realization of observations on the financial variables made the economists
think about financial crises and real fluctuations together. The negative impacts of
financial variables over the real economic fluctuations are mainly observed.
Turkey is one of the examples on which all phases of the discussions about financial
liberalization policies can be observed clearly. In September 1980, Turkey changed its
economic structure from controlled economy to liberalized one step by step. Main
economic policy that adopted from the mid-sixties was the import substitution policy.
This policy was abandoned and encouraged exports with the great amount of subsidies.
In addition, the import substitution policy was gradually replaced by import
liberalization. Price mechanism became the basic indicator in order to provide the
functioning of market. In that direction, the public sector became smaller and the
government interventions were deceased. In addition to the trade liberalization, tax and
SEE reforms were realized. Flexible prices included exchange rate and interest rate
determination, and TL was devalued at the rate of 48.6%. The limitations were
implemented on the net domestic assets of the Central Bank and the net Central Bank
credit to non-financial public sector.
In 1984, foreign exchange rate regime was liberalized and residents were allowed to open
a foreign currency accounts. Banks could engage in external transactions that were
determined by the government. As inter-bank money market was established for short-
term borrowing activities in 1986, the government started open market activities in 1987.
The chain was completed in 1989 and the capital inflows and outflows were allowed.
The reel side effect of the 1980s has sourced from the groundless export-led growth but it
can be described as the immature domestic market. Economic actors were so
inexperienced to utilize the opportunities of the liberalized economies. The credit
3

allocation did not fill out its mission. The private investment on the manufacturing sector
was not sufficient to support the export-led growth, so opening the domestic market to the
world market was a necessary action because of the limits of financing the export that
was not feed by the real side. Then, the 1990s were the years of huge amount of capital
flows. The destiny of the economy was left to the justice of the international capital
market. Non-residents investors began to manage the route of the financial side of the
economy. Moreover, the breaking point, when the financial market was collapsing, it
was sweeping away the real market.
In this study, the main question is whether financial liberalization policies increased the
fragility of the financial and real side of the economy for the Turkish case through the
period 1988-2002 for quarterly data. The cyclical behavior of the financial variables and
the real variables are examined together. As defining liberalization policy indicators, two
main targets of liberalization are taken into account: financial efficiency and financial
deepening (development). Then, the relationship between these indicators with the real
side variables has been examined.
The domestic and external interest rate spreads are chosen for examining financial
efficiency whereas bank credit is for explaining the impact of financial deepening. The
short-term and portfolio capital flows are chosen to analyze the impacts of financial
liberalization on the financial side and the real side of the economy.
Next section of this paper includes a theoretical survey. The third section consists of a
quantitative analysis. The first part of third section contains the investigation of the data.
In this part, a brief overview of the Turkish economy, trends and irregular behavior are
discussed. Second part includes the decomposition of the variables. For this purposes, the
cyclical components have been separated from the seasonal, trend, and irregular
components. Third part consists of an analysis of the relationship among the cyclical
patterns of the economic series and the sources of business cycle. In this analysis the
sources and patterns of cycles in real output (RGDP) have been related to the cyclical
patterns of real GDP components (total consumption, total investment, private
4

consumption, private investment, public consumption, and public investment), of the
financial developments and efficiency indicators (total credit, private credit, public credit,
domestic spread, and external spread). Procyclical and countercyclical movements of the
variables have been determined by the cross correlation coefficient. In the third part of
the quantitative analysis, we have attempted to establish an empirical link between real
GDP (business cycle) and all the other indicators of our interest those are thought to be
the sources of economic fluctuations in Turkey. Thus in this part, some insights of the
causality relationship between given economic variables can be gained by the Granger
non-causality analysis. Last section of the paper concludes the findings.
II. THE THEORETICAL BACKGROUND II.1. Theory:
In the beginning of 1970's, the investigated characteristics of developing countries
opened the way for long debates on the policy implementation of financial liberalization
policies. The liberalization on the ''domestic'' markets and the positive correlation of the
functioning of undistorted financial markets with the real economic activity are defended
but the fact that financial crises whose severity, frequency and volatility have increased
with the application of international financial liberalization policies has put on the agenda
of the investigation of the relationship between financial markets and the real economic
activity.
According to McKinnon (1973), there is a strong relationship between the large real cash
balances processed by credit mechanism and the growth rate of investment and aggregate
economic activity. Any kind of intervention or direction on the set of all prices will
prevent the equilibrium of all markets so no economic indicator will clarify anything
about the market mechanism and the will of the market. For McKinnon (1973), not only
the interest rate ceilings but also other types of intervention, i.e. directed credit
mechanisms, make the economy underdeveloped because the intervening actions do not
allow any market to choose the best and the most productive, so may cause the funds to
flow into unproductive investment areas or into the same industries every time. Hence,
any fragmented or ''repressed'' economy must be liberalized domestically, or in other
5

words, if the financial market can do many things for the real economy perfectly, it must
be allowed to do so.
Shaw has the same arguments with McKinnon. They both defend the argument that
liberalized financial system can attract an increased volume of financial saving and in
turn allocate more capital to efficient projects. This result contributes to economic
growth. Stiglitz and Weiss (1981) paper explains the credit rationing mechanism that stems from
the inefficient information environment of financial market. According to Stiglitz and
Weiss, there are two main factors which banks take into account while making loan
decisions. One is the interest rate and the other is the riskiness of any project. In an
imperfect and costly information environment, the interest rate is an important device to
evaluate the riskiness of any project. If the domestic interest rate is above the foreign
interest level, which maximizes the expected return of the bank, then it shows that the
project is riskier and it will decline the average expected return of the bank.
The role of financial intermediaries whose existence is shown as an indicator of the
development of financial market is not only mobilizing savings and trading of any type of
assets but also diversifying the risk of individual projects over the market. However, the
information asymmetries prevent the correct risk diversification. If the debt market does
not improve any solution, either big financial crash will occur or real economy will face
the fact of rationing inevitably.
As it is reached to the twenties, the role of financial development, by increasing both the
volume of financial transactions and the quality of all financial services as a result of
domestic and international financial liberalization policies, on growth and development
process is analyzed by the huge literature but the impact of the financial development on
the fluctuations of the real economy is not focused intensively. There are some studies after the first half of nineties, which examines the impact of
external, contagious shocks on the efficiency indicators of financial markets and the real
6
economic activity. Agenor and Aizenman (1997) analyzes the impact of external shocks,
triggered by the events elsewhere, on the real economy. Agenor, Aizenman and
Hoffmaister (1998) study the impacts of banking sector spreads for the output
fluctuations in Argentina case. It is found that as the external spread and output
fluctuations increase the domestic spread, the increase in external spread trigger the
domestic spread but decrease the cyclical component of fluctuations.
Aizenmann and Powell (2002) present a model that explains the not only the spreads in
the interest rates but also the joint effect of the shocks and the imperfect information on
the supply of credit and the employment and output. The impact of the increasing
volatility, i.e. external shocks to the economy, with the imperfect information makes the
real economic activity fall significantly. Many studies suggest that the credit channel is
strong in many middle-income countries. The spread between lending and foreign interest
rates, so called the external spread has a strong effect on GDP, and even stronger effect
on credit.
Financial liberalization caused capital flows to travel freely, which in turn made the
domestic economies in middle income countries more fragile due to the movements in
capital flows. As a result, in some policy circles it has been argued that it might be
optimal to impose restrictions on capital flows and stop lending booms, which typically
followed by financial liberalization, as they mainly reflect excessive risk taking.
Although lending booms typically precedes twin crises, very few lending booms end in
crises. Most of the time the final is not a crises, but a gradually decelerating credit
growth.
Kregel (1998) explains aftermath of the international stabilization policies and the
reasons behind the 20th and 21st Century financial crises. Kregel considers the link of
financial crises to the combination of increasing free competition in banking and
increasing free global capital flows.
7

II.2. Applied Studies:
Reinhart and Tokatlidis (2001) provide a theoretical survey about the impact of financial
liberalization on investment, growth, financial deepening, and saving. They analyses
domestic liberalization and capital account liberalization using panel data from total 50
developed and developing countries for the period 1970-1998. They conclude that
financial liberalization results in higher interest rates, lower investment, higher foreign
direct investment, and higher gross capital flows in high income countries, however, low
income countries do not have any such benefits of financial liberalization.
Wyplosz (2001) examines whether or not financial liberalization is hazardous in
developed and developing countries. He concludes that fast liberalization activities have
led to the 1990s crises. However, liberalization may be useful to increase competition
and reduce monopoly powers in an economy as long as it is a safe liberalization.
Kaminsky and Schmukler (2002) construct a chronology of financial liberalization in 28
developing and emerging market economies, and examine the short and long run effects
of financial liberalization on capital market. Their main findings are:(1) The financial
liberalization chronology shows that different types of restrictions are removed during the
domestic and international financial liberalization process over time. (2) The pattern of
liberalization is different for developed and developing countries. Stock market is the
first to be liberalized for developed countries whereas financial market is the first to be
liberalized for the emerging market countries. (3) Financial liberalization leads to larger
financial cycles in the short run. (4) The immediate aftermath of liberalization is larger
booms and crashes in emerging market countries.
Kose, Prasad, and Terrones (2002) examine the impact of international financial
integration on macroeconomic volatility for a large number of developed and developing
countries for the period 1960-1997. They conclude that international financial integration
does not increase macroeconomic volatility during 1990s. While financial openness
increases relative volatility of consumption.
8

Buch (2002) reviews the theoretical and the empirical models on the linkage between
globalization and real sector volatility. Similar work of Buch, Döpke, and Pierdzioch
(2002) confirms that there is not a stable relationship between financial openness and
business cycle fluctuations over time.
II.3. Selected Business Cycle and Liberalization Studies on the Turkish
Economy:
Alper (2000) analyses the sources of business cycle in two small open developing
countries, namely Turkey and Mexico, for the period 1987-2000. Alper finds that
(1) Consumption expenditure is more volatile that real output in Mexico and Turkey.
(2) Consumption has a high contemporaneous correlation with real GDP implying that
any cyclical shock to income affects consumption. (3) Investment is the most volatile
component of GDP. (4) Capital flow is important, strongly procyclical and one quarter
leading variable.
Denizer, Iyigun, and Owen (2000) investigates the role of finance providing empirical
evidence on the link between depth and structure of a country’s financial sector and the
severity of its business cycle using annual data from 70 countries for the period 1956-
1998. They use financial development indicator as a proxy for asymmetric information.
Their main findings are: (1) Highly developed financial sectors experience less
fluctuations in output, consumption and investment growth, since these economies can
absorb shocks more easily. (2) Private sector finance is important in reducing
macroeconomic volatility. Banks are thought to be important in reducing consumption
and investment volatility, whereas availability of private sector credit helps to smooth
consumption and GDP.
Boratav and Yeldan (2001) identify and study the main stylized facts and processes
characterizing the dynamic macroeconomic adjustment of Turkey since 1980. They find
that openness has a little impact on profits and investments, and liberalization has not
generated a productivity gains in the leading exporting sectors. They conclude that the
9
Turkish adjustment experience throughout the post-1980 period shows a process in which
a developing market economy trapped within the needs of integration with the world
market.
Celasun, Denizer, and Dong He (2003) examine the impacts of capital flows on the real
side of the Turkish economy for the period 1990-1997. They find that capital flows are
positively associated with private consumption and investment but not with public
consumption and investment.
In this study, the link is constructed among the internationally integrated domestic market
and the real economic activity. The credit market is emphasized through both the
domestic market efficiency defining as the spread between lending and borrowing interest
rates and the international market efficiency defining as the spread between the domestic
market rate and the world market interest rate. According to the study, the increase in the
probability of the default of the lenders that funds their investment in credit market will
trigger the domestic and foreign financial market spreads. That will also increase the loan
obligations of lenders. The real economic activity will be affected negatively from the
increasing inefficiency of financial markets. Moreover, the fragility of the real side of the
economy will also increase. The fluctuations of the output will be observed as it
decreases.
If the economy is evaluated from the side of financial intermediaries, as the inefficiency
problem of financial markets sourcing from not acquiring information, liquidity and the
risk diversification is not solved, the impediments front of the real economic activity will
not be overcome. The models which analyze the relationship between the performance of
financial intermediaries and the real economic activity support this view in a formal way
through the long-term relationship but now there is another questions, especially gaining
importance after the first half of nineties with the occurrence of frequent and deep
financial crises. One is about the changes in the efficiency of financial intermediaries
after the international financial liberalization activities. What the impact of integration
with the rest of the world on the services of financial intermediaries is not handled with
10

formally. It is claimed that the international integration will provide the efficiency of
intermediaries by increasing the number of instruments, diversifying risks over many
lenders, providing liquidity and gathering information; hence increasing the efficiency of
existing financial conditions but the proof of all claims is not supported empirically also.
The other is about the other side of the real economy, fluctuations. In the short-term, what
is the impact of financial intermediaries, the associated risk measures; such as external
spread, credit channel, capital flows on the fluctuated real economic activity?
Conclusively, if any shocks to the system as a reason, or any significant drops as a result
of external shock can follow each other, there is another question, what is the relationship
between cyclical behaviors between the financial variables and the real economic activity
after the financial liberalization period?
III. QUANTITATIVE ANALYSIS III.1. AN INVESTIGATION OF THE DATA:
1.1. A Brief Overview of the Turkish Economy: Trends, Cycles and Shocks:
In 1988 the Turkish economy went into recession because of insufficient financial
sources. The low level of economic growth necessitated to implement new economic
adjustments and also to find new financial support to finance the deficit.
In August 1989 the liberalization of the capital account created new financial
opportunities for the government to finance the budget and current account deficits, and
to achieve a high growth. The restrictions on the capital flows were removed and the TL
was become a convertible currency. In addition, a substantial increase in real wages and
the agriculture subsidies resulted in an increase in the domestic demand and in the budget
deficit. Financial deregulations and liberalization led to a lending boom increasing the
facilities for bank credits and helped the deepening of the financial sector via increasing
short term capital flows into banking sector.
In 1990 the Central Bank of Republic of Turkey (CBRT) announced a monetary program
in order to control the public sector credits. The real effective exchange rate was
11

appreciated in order to slow down the inflationary pressure. The first impacts of financial
liberalization process in Turkey were the deterioration in the current account deficit and
the appreciation of the TL. Rapid capital inflows led to a rapid but a short economic
recovery period. Although the monetary program was successfully implemented in 1990,
the early local election decision and the Gulf War in 1991 negatively affected the
economy.
Throughout the 1989-93 period short term foreign borrowing grew by 223%. The main
source of the economic growth during this period was the monetary expansion. The
CBRT did not sterilize the capital flows from 1989 to 1993. In 1993, open market
operations led to a higher level of interest payments and thus worsened the public sector
financial position, whereas appreciation of the TL and high economic growth led to a
larger trade deficit and hence worsened the current account deficit. All these adverse
effects aggravated the devaluation expectations meanwhile higher interest rates escalated
the inflationary expectations.
In 1994, an artificial reduction in the interest rates caused a sharp increase in the currency
substitution and a sudden capital outflow. “1994 crisis” had the following destructive
consequences: (i) The Turkish lira was sharply devaluated, (ii) the inflation speeded up,
(ii) the interest rates increased, (iv) the real wages decreased substantially, and (v) the
economy contracted by 6.1%.
During the period 1995-99, the central bank sterilized the capital flows in order to stop
the monetization of budget deficits. However, this policy put further pressure on interest
rates, and hence on inflationary expectations. In 1995 capital inflows accelerated and the
economic growth reached to 8.1%. The sources of the economic growth were the
domestic consumption and the private investment. Inflation declined, the real exchange
stability stimulated exports and the current account deficit decreased. After 1996 the high
interest rates and the inflationary expectations and thus the vulnerability and the risk of
the financial sector increased once again. They also increased the cost of production by
12

affecting the credits and the open foreign exchange position of the banking sector through
uncovered interest parity.
The “1997 Asian crisis” and the “1998 Russian crisis” reversed the capital flows to
Turkey, and reduced the amount of external financing available for the budget deficit.
This resulted in an increased pressure on domestic borrowing, and enlarged the size of the
domestic debt, raising the real interest rates on treasury bills.
In 1998 the CBRT announced a new monetary program and managed to reduce the
inflation rate. In August 1998, “Staff Monitoring Program” was signed with the IMF.
1998 economic program led the inflation and the inflationary expectations to decline. In
1994, just after economic crisis, the CBRT chose to control monetary expansion and
hence a tight monetary policy resulted in high interest rates, whereas, in 1998 the CBRT
chose to control the exchange rate as an anchor and left the interest rate to the market. In
1999, however, the inflation rate jumped again, and at the beginning of the year the 2000,
the disinflationary program was launched.
“2001 crisis” abolished the validity of the disinflationary program, and the fixed
exchange regime was abandoned. Collapse of the fixed (pegged) exchange rate regime
led to withdrawal of foreign capital in February 2001 and resulted in a direct and
depressing impact on the banking sector. All these brought about pressure on the
currency. Devaluation of the exchange rate and a sharp increase in the interest rates
worsened the cash flows of government (increasing capital outflow) and depressed
output.
1.2.Data Description:
It is believed that quarterly data will give a good view of short run cyclical behavior. In
this analysis GDP, total/private/public consumption, total/private/public investment, bank
credits to total/private/public sector, traded/non-traded goods production are used in
logarithm forms and real. Traded goods production is defined as the sum of the
production at the agriculture and industry sectors, and the rest of the production is
13

accepted as the non-traded goods production. Real capital flow defined as the net sum of
short term capital flow and portfolio investments in TL and deflated by wholesale price
index. Domestic spread is the difference between three months inter-bank lending rate
and deposit rate. External Spread is equal to the three months deposit rate minus three
months LIBOR on US$ plus inflation rate minus depreciation rate. External spread is
defined different than the uncovered interest rate parity because of over-valuation of TL
during the investigation period.
1.3. Decomposition of the Economic Series
The macroeconomic indicators can be expressed as the seasonal variation, trend, cycle,
and irregular components. Seasonal adjustment removes the seasonal highs and lows
(annual effects) with different smoothing techniques. When the seasonal effects are
eliminated from the series, the component might display erratic movements. The cyclical
component exhibits the short run regular or irregular fluctuations in the series. The trend
component shows the accumulated effects of the fluctuations in the long run behavior of
the series. When the trend and the seasonal cycle are extracted from the original series,
the residual would correspond to an irregular component. This component should be
generated by a stationary stochastic process, and hence should have the characteristic that
any segment of consecutive observations looks similar to any other segment of the same
duration regardless of the time interval. This component sums to zero over time.
However, if the irregular component of a series contains non-random events, this results
in a shift in the amplitude of the time series. This is called a shock. A shock can be
defined as an additive outlier or a level shift. An additive outlier shock causes a spike in
the series, whereas level shift shock has a permanent effect on the series. If the irregular
component follows a trend, or a regular pattern, then it includes the features of the other
components.
In this analysis the purposes of decomposition are as follows: First, the elimination of the
seasonal and irregular components from the economic series gives a clearer picture of the
important characteristics. Second, the elimination of short run erratic movements
improves the economic relevance of the estimation results.
14

Accordingly, the relationship among the cyclical patterns of the economic series and the
sources of business cycle has been examined. For the above purposes, the cyclical
components have been separated from the other components following the two steps.
First, the X-12-ARIMA model-based technique has been used to decompose the seasonal
adjusted, irregular, and trend-cycle components of each series. Then, the cyclical
components for each series have been extracted from the trend-cycle components by
applying the Hodrick-Prescott (HP) de-trending filtering technique.
1.4.Trend and Irregular Tendencies:
The trend and the cycle components of real GDP have been shown in Figure.1. There is a
positive long run trend throughout the period 1988-2002. However, in 1998 the increase
in the trend component of real GDP slows down. Table.1 shows the cyclical movements
in real GDP. The real GDP has completed approximately five cycles over the period.
Each cycles exhibits a different pattern. Second and third phases last longer than the
others.
The trend and the irregular components of the series are shown in Figure.2 and Figure.3,
respectively. The negative impacts of the 1994, 1998, and 2001 economic crises on the
macroeconomic fundamentals can be explained in terms of a change in the tendency of
trends, and the large deviation in the irregular components.
Trend Components:
An important benchmark to start analyzing the aftermath of financial liberalization in
Turkey is the interpretation of the trend behavior of the series. The empirical growth
literature and the literature on the determinants of real and financial crises explore that
the main macroeconomic indicators are interconnected to the potential currency and
banking crisis. An investigation of a possible interrelation between the real and financial
variables, or in other terms “early warning” indicators of crises give a clear view that:
15

FIGURE.1: ACTUAL REAL GDP and TREND
9.89.9
10.010.110.210.310.4
88 89 90 91 92 93 94 95 96 97 98 99 00 01 02
TREND ACTUAL REAL GDP
Table.1: A Brief Time Pattern of the Business Cycle in Turkey: 1988:1-2002:4 Business Cycle Recession Trough Recovery Peak I. 1988:1-1990:2 1988:1-1989:2
6 quarters 1989:2 1989:3-1990:2
4 quarters 1990:2
II. 1990:2-1993:3 1990:2-1991:2 5 quarters
1992:2 1992:3-1993:3 5 quarters
1993:3
III. 1993:3-1998:1 1993:3-1994:3 5 quarters
1994:3 1994:4-1998:1 14 quarters
1998:1
IV. 1998:1-2000:3 1998:1-1999:3 7 quarters
1999:3 1999:4-2000:3 4 quarters
2000:3
V. Second and third 2000:3-continues
2000:3-2001:3 5 quarters
2001:3 2001:4-2002:4 continues
continues
(a) Real GDP, total consumption, private consumption, public consumption, traded
goods and non-traded goods productions display a linear upward trend, but it slows
down after 1998. The correlation coefficients are higher than 0.90 indicate the
strong co-movements of trends. This result implies that the trend behavior or
direction of the main real macroeconomic fundamentals in Turkey have been
changed in 1998.
(b) The trend components of total and private investment, total and private credit,
capital flow and external spread exhibit a non-linear trend. Capital flow and the
spread have an increasing trend up to 1994, after then they follow a decreasing trend.
Investments and credits have a positive trend up to the 1998 crises and then the
tendencies reversed. Interestingly, the trend in capital flow and external spread
change the direction in 1994. These results show a high level of correlations, and
16

explain the coherent transition of trends between the financial development
indicators and the corresponding real variables1.
(c) Domestic spread shows an interesting trend, first increases up to 1994, then
decreases up to 1998, and rises again. This result shows the implications of the
interest rate and exchange rate policies in Turkey.
(d) Downwards trend behavior in the public sector credit is consistent with the financial
liberalization process. Even though the trend in consumption has increased over
time, the non-linear trend in public investment has changed the pattern just after
1994.
Irregular Components:
The plots of the irregular components attract the attention that all of the components are
affected by the 1989, 1994, 1998, and 2001 shocks. In Table.2 pair-wise high positive
correlation coefficients of the irregular components of the real GDP with a corresponding
variable reveal that a shock to the real total consumption; to the real private consumption;
and to the real traded/non-traded production, respectively, is highly related to a shock to
the real GDP. That is, any production shock will directly affect the fluctuations in these
variables2.
Shocks to production and external spread are negatively related to each other. However,
there is a weak relationship between the irregular components of real GDP and real (total
and private) credits, real investment (total/private/public), respectively, implying that
there is no synchronization of a real GDP shock with these variables.
On the other hand, the irregular components of capital flow, public consumption, public
credit, and domestic spread are not related the irregular component of real GDP. This
result implies that the irregular components of these variables are not affected by the
same shock contemporaneously.
1 The pair-wise correlation results are not shown in the paper. 2 Note that these variables are related in a non-causality manner, there is a contemporaneous relationship between them.
17

Table.2: The Irregular and Trend Correlations: 1988:I-2002:IV
Contemporaneous Pairwise Correlation Coefficients VARIABLE Irregular Components Trend components Real Total Consumption 0.9010 0.998 Real Total Investment 0.4544 0.831 Real Total Credit 0.4232 0.938 Real Private Consumption 0.8444 0.995 Real Public Consumption -0.0038 0.985 Real Private Investment 0.3323 0.785 Real Public Investment 0.3096 0.029 Real Private Credit 0.3892 0.956 Real Public Credit 0.1380 -0.963 Real Traded Goods Prod. 0.8911 0.999 Real Non-Traded Goods Prod. 0.9451 0.999 Domestic Spread 0.1306 -0.363 External Spread -0.4903 0.691 Real Capital flow 0.0458 -0.511
Shaded area shows the strong relationships. Correlation coefficients between irregular component of real GDP with the irregular components of the indicators, and trend component of real GDP with the trend components of the indicators are shown in the table.
III.2. THE CYCLICAL BEHAVIOR OF MACROECONOMIC VARIABLES-
THE DEGREE AND THE TIMING OF THE CO-MOVEMENTS:
In this quantitative analysis the sources and patterns of cycles in real output (RGDP) have
been related to the cyclical patterns of real GDP components3 and of the financial
developments4 and efficiency indicators5.
Cyclical behavior of a macroeconomic variable has mainly two characteristics. The first
is “direction” and the second is “timing”. The direction explains the degree of co-
movements with the cyclical pattern of real GDP. The “procyclicality” and the
“countercyclicality” definitions are used as to evaluate the measure of the
degree/direction of co-movements. In some cases, the business cycle does not occur at
regular and predictable intervals, this tendency is called “recurrent”, but not periodic. A
standard pattern of the phases recurs again and again.
3 Total consumption, total investment, private consumption, private investment, public consumption and public investment. 4 Total, private and public credits. 5 Domestic spread and external spread.
18

Regular and predictable pattern or tendency of the business cycles tendency is known
“co-movement”. An increase in real GDP might be followed by further increase, or a
decline in real GDP to be followed by further decline is called “persistence”. The
persistency of the business cycle shows the tendency and it is measured by the first order
autoregressive coefficient.
The contemporaneous movements of cyclical components for each variable with the
cyclical behavior of the real GDP are determined according to the positive and negative
signs of cross correlations at the four lags/leads interval. When a positive cross
correlation coefficient approaches to 1, it shows the “strong procyclical” characteristic
of the series. The opposite is true for the “strong countercyclical” relationship. A value
close to zero indicates that two series do not move contemporaneously in any systematic
way and in any clear pattern. These series are called “acyclical” economic series.
The timing explains the turning points (peak and trough) of a variable relative to the
turning points of the real GDP (business cycle). In other terms, timing explains the phase
shift in the movement of a time series relative to real GDP. Figure.3 in appendix shows
the cyclical components of variables.
An economic variable is a “leading variable” if it tends to move in advance of real GDP.
This means that the peaks and troughs in a leading variable occur before the
corresponding peaks and troughs in the real GDP. This variable leads the cycle and is
shifted backwards. A “lagging variable” is one whose cycle peaks and troughs occur
later than the corresponding peaks and troughs in the real GDP. This means that the
peaks and troughs in business cycle occur before the corresponding peak and troughs of
an economic variable. This variable lags the cycle and is shifted forwards. Peaks and
troughs of a “coincident” variable occur about the same time as the corresponding
business cycle peaks and troughs.
19

a) Pattern and Source of Business Cycle:
In this part of the paper it is conjectured that “the source and pattern of the real GDP is
affected by the patterns of the components of real GDP, the financial development
indicators (credits and capital flow) and the efficiency indicators (domestic and external
spreads) during the financial liberalization process over the period 1988-2002.”
Cyclical Components:
The comovements of cyclical components are determined according to the highest cross-
correlation coefficients of lag or lead values, which are significantly greater than the
contemporaneous values of the correlations.
Table.1 in appendix summarizes the cross correlation results. The real GDP and the real
total consumption are the first two series examined for the co-movement relationship.
The result shows that the direction of the current relationship is procyclical with the cross
correlation coefficient of 0.91. It is a coincident variable. Like total consumption, real
private consumption has a procyclical relationship with the real GDP, 0.92, and it is also
a coincident variable. The cross-correlations decrease as the lead and lag numbers
increase. For example, the fourth lag of private consumption has an effect of -0.31 on the
real GDP where negative relationship observed after the second period.
When the relationship between the real public consumption and business cycle is
examined, it has been found that the cross correlation between the current real public
consumption and the real GDP (0.49) is not as high as the cross correlation between the
private consumption and the real GDP. The public consumption displays procyclical
movement and is a coincident variable.
Accordingly, the results indicate that a high degree of correlation between real GDP and
private consumption implies the synchronization. In addition, the procyclical and
coincident characteristics of private and total consumption and also their volatilities
support the view that rational individuals adjust their portfolio positions to smooth
20

consumption. This can be explained in terms of “wealth effect” since the volatility6 of
investment (9.226) is higher than of consumption (3.343) and output (3.146).
Real total investment, the real private investment, the real public investment has the
highest cross correlation coefficients with real GDP, (0.85, 0.79, and 0.67, respectively).
Total investment and private investment are coincident, but public investment is a lagging
variable. As in the consumption case, on average, the volume of private investment in
total investment is more than the public investment and private investment has lower
volatility than public investment during the period.
As traded and non-traded sectors are taken into account, both of them have high positive
cross correlation coefficients (0.95 and 0.98, respectively) with the current real GDP.
They show a strong pro-cyclical characteristic and they are coincident variables. The
result displays that there is no clear distinction between the tradable and non-tradable
sectors in the light of procyclical relationship. This is an unexpected result in the sense
that traded sectors can have bigger borrowing opportunities in the international credit
market than the non-traded sectors and could lead the real GDP fluctuations. There is
also a clear distinction between the tradable and the non-tradable sectors from the
perspective of the external and internal borrowing opportunities. However, in the Turkish
economy, there is a high dependency of the traded and non-traded sectors to the domestic
credit market but less to the international borrowing facilities. In addition, financial
liberalization stimulates specialization of production through the reallocation of capital
and promotes the total output. However, in Turkey, financial liberalization has produced
a depressing impact rather than specialization.
The relationship between the real GDP and the real private credit is highly procyclical,
and the private credit is a lagging variable. The timing of the relationship is unexpectedly
from the real side to the financial side. The highest level of the correlation, 0.70, is
observed between the current real GDP and the one period ahead of the private credit.
The evidence is against the view that the financial development in the liberalization
6 The volatility of the series is measured as the percent standard deviation of the cyclical components.
21

process is expected to trigger the real economic activity. The relationship is also
investigated in sub-periods. It is observed that the strength of the correlations increase but
the timing does not change during 1987-2000 period.
When the comovements between the cyclical behavior of the real GDP and the domestic
and external spreads are investigated, both spreads show a countercyclical characteristic
and they lead the business cycle. The second lag of domestic spread affects the real GDP
in a negative direction (0.57) but the real GDP creates a positive impact on the two period
ahead in the future, while a negative relationship (0.58) is observed between the first lag
of the external spread and the real GDP.
Another leading variable in this analysis is the real capital flow. The positive cross
correlation coefficients indicate a procyclical characteristic between the real GDP and the
capital flow. In emerging market economies, capital account liberalization is expected to
promote financial sectors, to reduce the cost of capital flow and thus to increase
production.
The cyclical components of domestic and external spreads move in the same direction
with the cyclical component of real GDP, but it is shifted forward.
Figure.2: Contemporaneous Relationships with Real GDP (Direction): Real GDP
Countercyclicals Persistence External Spread AR(1) Domestic Spread
Procyclicals Total Consumption Total Investment Private Consumption Public Consumption Private Investment Public Investment Traded Goods Production Non-traded Goods Production Capital Flow Total Credit Private Credit Public Credit
22
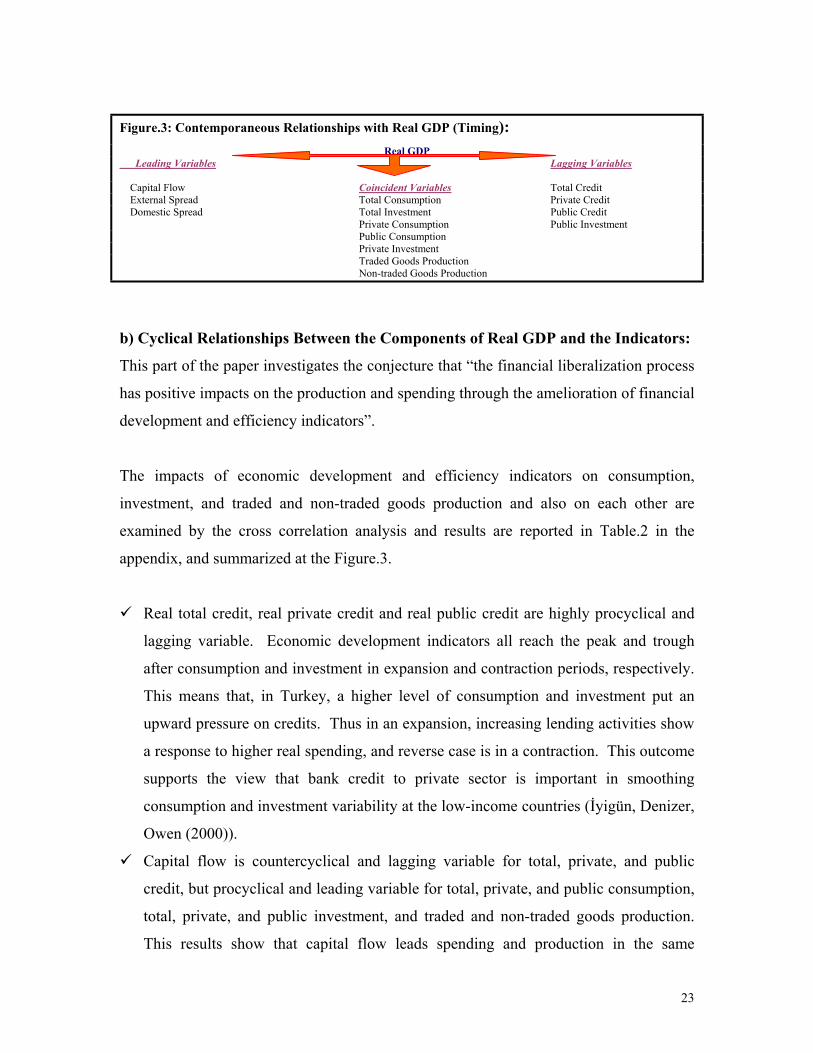
Figure.3: Contemporaneous Relationships with Real GDP (Timing): Real GDP
Leading Variables Lagging Variables Capital Flow Coincident Variables Total Credit External Spread Total Consumption Private Credit Domestic Spread Total Investment Public Credit Private Consumption Public Investment Public Consumption Private Investment Traded Goods Production Non-traded Goods Production
b) Cyclical Relationships Between the Components of Real GDP and the Indicators:
This part of the paper investigates the conjecture that “the financial liberalization process
has positive impacts on the production and spending through the amelioration of financial
development and efficiency indicators”.
The impacts of economic development and efficiency indicators on consumption,
investment, and traded and non-traded goods production and also on each other are
examined by the cross correlation analysis and results are reported in Table.2 in the
appendix, and summarized at the Figure.3.
Real total credit, real private credit and real public credit are highly procyclical and
lagging variable. Economic development indicators all reach the peak and trough
after consumption and investment in expansion and contraction periods, respectively.
This means that, in Turkey, a higher level of consumption and investment put an
upward pressure on credits. Thus in an expansion, increasing lending activities show
a response to higher real spending, and reverse case is in a contraction. This outcome
supports the view that bank credit to private sector is important in smoothing
consumption and investment variability at the low-income countries (İyigün, Denizer,
Owen (2000)).
Capital flow is countercyclical and lagging variable for total, private, and public
credit, but procyclical and leading variable for total, private, and public consumption,
total, private, and public investment, and traded and non-traded goods production.
This results show that capital flow leads spending and production in the same
23
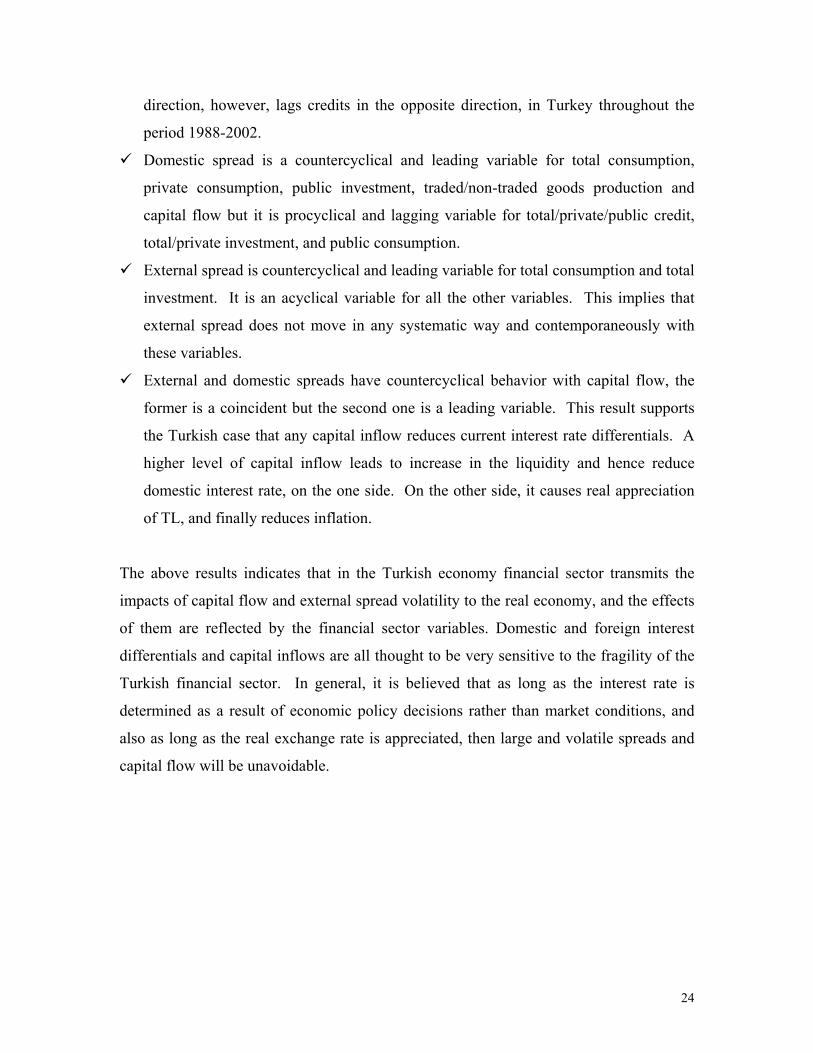
direction, however, lags credits in the opposite direction, in Turkey throughout the
period 1988-2002.
Domestic spread is a countercyclical and leading variable for total consumption,
private consumption, public investment, traded/non-traded goods production and
capital flow but it is procyclical and lagging variable for total/private/public credit,
total/private investment, and public consumption.
External spread is countercyclical and leading variable for total consumption and total
investment. It is an acyclical variable for all the other variables. This implies that
external spread does not move in any systematic way and contemporaneously with
these variables.
External and domestic spreads have countercyclical behavior with capital flow, the
former is a coincident but the second one is a leading variable. This result supports
the Turkish case that any capital inflow reduces current interest rate differentials. A
higher level of capital inflow leads to increase in the liquidity and hence reduce
domestic interest rate, on the one side. On the other side, it causes real appreciation
of TL, and finally reduces inflation.
The above results indicates that in the Turkish economy financial sector transmits the
impacts of capital flow and external spread volatility to the real economy, and the effects
of them are reflected by the financial sector variables. Domestic and foreign interest
differentials and capital inflows are all thought to be very sensitive to the fragility of the
Turkish financial sector. In general, it is believed that as long as the interest rate is
determined as a result of economic policy decisions rather than market conditions, and
also as long as the real exchange rate is appreciated, then large and volatile spreads and
capital flow will be unavoidable.
24

Figure.4: Contemporaneous Interrelationships Between Variables:
Leads
Lags Lags Public Consumption Lags
Coincident Leads
Leads .
Domestic Spread
RGDP Total Consumption Private Consumption Public Investment Traded Goods Prod. Non-traded Goods Prod. Capital Flow
External Spread
RGDP Total Consumption Total Investment
Total Credit Private Credit Public Credit Total Investment Public Consumption
RGDP Total Consumption Total Investment Private Consumption Public Consumption Private Investment Public Investment Traded Goods Prod. Non-traded Goods Prod.
III.3. CAUSALITY RELATIONSHIP:
In this paper, we have attempted to establish an empirical link between real GDP
(business cycle) and all the other indicators that are thought to be the sources of economic
fluctuations in Turkey. Some insights of the short run causality relationship between the
economic variables are gained by the Granger non-causality analysis.
It is important to keep in mind two points about the causality relationship. First there will
not exist a stable causality patterns if the results are different for the different lag length,
namely 1 to 4. Second there might exist reverse causality if the volatilities in variables
are large.
Table.3 and Table.4 in appendix illustrate the causality test results. It is assumed that
first if the results are the same for any two lag lengths the causality pattern is accepted as
stable. Second if the percent standard deviation of a variable is larger than 4 percent, the
volatility of that variable is accepted as large.
25

As it has been presented in Table.3 in appendix, consumption (except public), bank
credits, traded and non-traded goods production, capital flow, and external spread all
have a stable causality pattern with the real GDP, even though some of them have large
volatilities over the period 1988-2002.
Figure.4 shows that first, there is a contemporaneous rather than causality relationship
between the Turkish real GDP and total consumption, private consumption, total credit,
private credit, public credit, traded and non-traded goods production, and capital flow,
respectively. These results support that all these variables possess very similar cyclical
characteristics (coincident) with the real GDP, and the cyclical movements are
accompanied generating demand side effects. Second, the real GDP causes the public
consumption and investment in Turkey. So the cyclical movement in the private sector
spending is a reason, but in the public spending is a consequence of the real GDP
movements. External spread is also a consequence of the real GDP cycles. Third, the
mutual causality between real GDP and domestic spread explains the virtual spiral in the
Turkish economy.
Figure.5 represents some historical interconnections between the development and
efficiency indicators and Table.4 in appendix presents the causality relationships between
the different combinations of GDP components and the development/efficiency
indicators. A stable causality pattern has been obtained between total investment and
external spread, public consumption and public credit, public consumption and capital
flow, private consumption and private credit, public investment and capital flow, private
credit and capital flow, total credit and capital flow, public credit and capital flow, total
consumption and capital flow, traded goods production and capital flow, and finally non-
traded goods production and capital flow, capital flow and external/domestic spreads,
respectively.
26

Figure.5: Causality Relationship with Real GDP:
• Capital Flow • Total Credit • Private Credit • Public Credit
o Total Consumption o Private Consumption o Private Investment o Traded/Non-traded Goods Prod.
No Causality
RGDP Causes
Mutual Causality
• Domestic Spread
o Total Investment o Public Consumption o Public Investment • External Spread
Figure.5 Panel.A shows domestic spread and total investment cause total credit, and then
total credit causes total consumption. Panel.B presents the causality relationship between
domestic spread and the public sector investment and credit cycles. The causality link
from domestic spread to private credit is from spread to credit and a higher volatility in
domestic spread and bank credits is a crucial result of high and volatile lending rates in
Turkey. Panel.C shows that total and private credits have a mutual causality with capital
flow. Capital flow is a result of external spread, public investment, private consumption,
and non-traded goods production cycles, whereas it causes traded goods production.
Public investment, private consumption, and non-traded goods production trigger capital
flow, and capital flow contribute traded goods production in Turkey between 1988 and
2002. There is a contemporaneous relationship between the economic development
indicators, namely bank credits and capital flow. This result supports the view that the
removal of restrictions on the Turkish financial market (deregulations) has produced the
synchronic movements of short run bank credits and capital inflow. Panel.D summarizes
the causality sequence of the cyclical components. Domestic spread causes both external
spread and credits, and external spread causes capital flow.
27

The overall causality results support the view that the real side variables are closely
related to the financial variables. The prevalence roles of capital flow and spreads on the
real variables are noteworthy results. Capital inflows heavily relied on an arbitrage of
interest rate differentials has made the pursuit of domestic stabilization more difficult in
Turkey. Foreign flows invested on government papers led to increase in domestic credits
and liquidity in the Turkish economy. These have increased international reserves and
created an illusion of strong exchange rate. On the other hand, heavily issues of public
debt have put an upward pressure on interest rates, and proceeded interest rate
differentials and attract more foreign capital inflows. This has put upward pressure on
the exchange rate in a high inflationary environment, and led to real appreciation in
Turkey. As a result, increases in trade deficit and budget deficit, and also real
appreciation have presented unsustainable policies in Turkey and always ended with a
crisis.
Figure.6: Causality Relationships With Indicators: PANEL.A
Domestic Spread Total Credit Total Consumption Total Investment Causes Causes
No causality Capital Flow External Spread Traded/Non-traded Goods Prod.
PANEL.B
Private Credit Public Investment Causes Public Credit No causality Private Consumption Causes Causes Private Investment Domestic Spread No causality Capital Flow Public Consumption External Spread Capital Flow External Spread
28

PANEL.C
Capital Flow No causality
Mutual causality Total Investment Private Investment Causes
Causes
Traded Goods Prod.
Total Consumption Public Consumption Total Credit Private Credit Public Credit Domestic Spread
External Spread Non-traded Goods Prod Public Investment Private Consumption
PANEL.D
Private Investment Causes RGDP Non-traded Goods Prod. Total Investment Mutual causality Public Credit Total Consumption Mutual Causality Causes Causes External Spread Total Credit No Causality Private Credit Traded Goods Prod. Capital Flow
Private Credit Public Credit Total Credit Private Consumption Public Consumption Private Investment Public Investment
Domestic Spread
RGDP Total investment Public investment Non-traded goods prod.
III.4. IMPLICATIONS OF THE RESULTS FOR THE TURKISH ECONOMY:
Turkish economy grew with a high PSBR, high inflation rate, high interest rates, real
appreciation of TL between the periods 1988-2002, but at the end of each expansion
period and rapid growth, the economy experienced an economic crisis, such as 1994 and
2001. Bank credits were steered the production and spending in the boom periods via a
higher level of capital inflows. Large interest differentials have always been attractive for
the foreign investors and speculators. In Turkey, both spreads exhibit high volatility
throughout the period 1988-2002, but the external spread is more volatile than the
domestic spread. Domestic spread, in Turkey, is one of the highest one among the
emerging market economies. A high level of spreads means inefficient performance of
the domestic financial intermediaries, even though it also indicates a high level of non-
29

performing costs or imposed costs. On the one side, as a result of a high level of
government domestic and foreign borrowing to finance budget and trade deficits in
Turkey, the cost of borrowing has risen and domestic spread has widen and hence
become more volatile. In Turkey, both spreads exhibit high volatility throughout the
period 1988-2002, but the external spread is more volatile than the domestic spread.
Domestic spread, in Turkey, is one of the highest one among the emerging market
economies. A high level of spreads means inefficient performance of the domestic
financial intermediaries, even though it also indicates a high level of non-performing
costs or imposed costs. On the one side, as a result of a high level of government
domestic and foreign borrowing to finance budget and trade deficits in Turkey, the cost of
borrowing has risen and domestic spread has widen and hence become more volatile. On
the other side, large external spreads led to the purchases of domestic assets, mainly
treasury bills, by foreigners.
The mutual relationship between the capital inflow and external spread has weakened the
impact of capital flow on investment. However, since the Turkish financial system is not
sufficiently developed to cope with volatile capital flows, any weak or inconsistent policy
resulted in sudden reversals in capital flows and hence led to a higher volatility and
contraction of the economy.
The results reveal that firstly, the pattern of the real GDP cycles is determined by the
demand side variables, namely consumption and investment. Secondly, the source of the
real GDP fluctuations is attributed to the capital flow and bank credits via both the
domestic and external spreads. Thirdly, the relationship between the efficiency and
development indicators explains the fluctuations in the real side of the Turkish economy.
Throughout the financial liberalization period, markets in Turkey have not performed
well and the increase in interest rates has not been sufficient to provide the capital
accumulation. Liberalized financial market has not been enough for the saving and
investment opportunities. The imperfect nature of the financial system has led to the
collapse of financial liberalization policies. The lack of information, or in other words
30

asymmetric information, about the quality of borrowers has prepared the background for
the distressed financial sector and the risk of lending has increased. Thus real economic
activities have not expanded, rather sunk into recession. As Stiglitz and Weiss (1981)
state, a higher interest rate will both invite the riskier projects to the market and also
affect the incentives of existing borrowers to take projects whose payment probability is
low. It is a fact that the information asymmetry between bank and borrower causes the
probability of default be greater than zero. The probability of default is directly related to
the interest rate on credit. Hence as the interest rate on credit increases, the probability of
default also increases. Charging a high interest rate on credit is not optimal strategy for
banks. The expected return on given credit should be optimized. This phenomenon stems
the fact that as lending rate increases, the credit will be directed to the more risky projects
and thus this will reduce the expected payoff of banks from credit.
The above explanation is about the credit mechanism and the determination of lending
rate in a weak financial market. In other words, it is about the credit rationing side of the
credit mechanism. In addition to the credit rationing, domestic and external spreads, and
capital flows have also impacts on credit mechanism through domestic deposit and
lending rates and the foreign interest rates. It is so clear that banks can lend only if there
exists excess resources.
In this paper, the timing and direction relations between the credits and real GDP
emphasize the mechanism behind the credit rationing in Turkey. The results suggest that
total credit is procyclical and lags cycle. An increase in credit follows the increase in real
GDP7. Thus economic expansion periods are the periods of increasing credits to the real
side of the economy. Investment is closely related to the credit. Capital flows are also a
source of investment in Turkey. A higher capital flow follows a higher level of credits.
Increase in investment leads to increase in domestic spread in the foregoing periods as a
result of the supply and demand conditions in the credit market. A higher level of
demand for credit couples with a higher level of public sector borrowing and would put
an upward pressure on the interest rates. This result would, in turn, decrease the expected
7 This result is valid also for private and public credits.
31

payoff of banks. This view can be supported by the result that there is a countercyclical
relationship between the total credits and capital flows. In other words, a higher
investment would lead to a higher credit but a lower capital flows. A lower capital flow
means that the risk associated with the Turkish economy is increasing. So the external
spread increases signaling a higher risk of the economy. Moreover, a decrease in capital
inflow would decrease future real GDP although investment is increasing. This outcome
reveals that a credit increase by bidding up interest rate is not healthy way to finance big
projects because of a high risk associated with these projects and also a lower level of
expected payoffs from these projects. Accordingly, even in the expansion periods, the
bank credits must be well controlled since a higher level of credit does not mean an
increase in payoffs.
IV. CONCLUSION:
The purpose of the paper is the determination of the source and pattern of the business
cycle in Turkey throughout the liberalization period. The main question is whether the
financial liberalization policies have increased the fragility of the financial and real side
of the economy for the Turkish case through the period 1988-2002 for quarterly data. The
cyclical components of the financial variables and the real variables are examined by the
cross correlation and causality analyses. Liberalization policy indicators have been used
as the financial efficiency and financial deepening indicators. The domestic and external
interest rate spreads are chosen for examining financial efficiency whereas credit
expansion is for explaining the impact of financial deepening. The short-term and
portfolio capital flows are chosen to analyze the impacts of financial liberalization on the
financial side and the real side of the economy.
In this paper, if the analysis is evaluated from the business cycle side during the
liberalization process, it is found that the pattern of the real GDP cycle is determined by
the demand side of the economy, namely by consumption and investment, however, the
source of fluctuations attributed to the supply side of the economy, namely bank credits
and capital flow throughout the period 1988.I-2002.IV.
32
In addition, if this analysis is evaluated from the financial intermediaries side during the
liberalization process, it is clear that inefficiency problem of financial market in Turkey is
a source of economic instability. Thus the financial liberalization process in the Turkish
economy for the period 1988.I-2002.IV increased the fragility of both the real and
financial sides of the economy.
REFERENCES:
Agenor, P., Aizenman, J., (1997), “Contagion and Volatility with Imperfect Capital
Markets”, IMF Working Paper, No: 127.
Agenor, P.R., Aizenman, j., Hoffmaister, A., (1998), “Contagion, Bank Lending Spreads
and Output Fluctuations”, NBER Working Papers, No: 6850.
Aizenman, J., Powell, A., (2002), “Volatility and Financial Intermediation”, NBER
Working Paper, No: 6320.
Alper, E., (2000), “Stylized Facts of Business Cycles, Excess Volatility and Capital
Flows: Evidence from Mexico and Turkey”, http://www.econturk.org/
Turkisheconomy/alper2.pdf.
Bandiera, O., Caprio, G., Honohan, P. and Schiantarelli, F., (2000), “Does Financial
Reform Raise or Reduce Saving”, The Review of Economics and Statistics, Vol.82.
Boratav, K. and Yeldan, E., (2001), “Turkey, 1980-2000: Financial Liberalization,
Macroeconomic (In)-Stability, and patterns of Distribution, Mimeo.
Buch, C. M., (2002), “Business Cycle Volatility and Glabalization: A Survey”, Kiel
Institute of World Economics, Kiel Working Paper, No: 1107.
Buch, C. M., Döpke, J. and Pierdzioch, C., (2002), “Financial openness and Business
Cycle Volatility”, Kiel Institute of World Economics, Kiel Working Paper, No: 1121.
Celasun, O., Denizer, C., and He D., (1999), “Capital Flows, Macroeconomic
Management and the Financial System: The Turkish Case, 1989-97”,
http://econ.worldbank.org/docs/596.pdf.
Denizer, C., Iyigun, M.F. and Owen, A.L., (2000), “Finance and Macroeconomic
Volatility”, World Bank Policy Research Working Paper, No: 2487.
33

Gunduz, S., (2002), “Financial Liberalization and Growth: An Overview”, Unpublished
MA Thesis, Department of Economics, Marmara University, Goztepe, Istanbul.
Inflation Report, (2000), the Central Bank of the Turkish Republic.
Insel, A. and Sungur, N., (2000), “The Effects of Capital Flows on Macroeconomic
Indicators- Turkish Case: 1989.Q3-1999.Q4, (Sermaye Akımlarının Temel
Makroekonomik Göstergeler Üzerindeki Etkileri: Türkiye Örneği 1989:III-1999:IV),
presented at erc/METU International Conference in Economics IV, Ankara.
Honohan, P., (1999), “Financial Liberalization: How far? How Fast?”, Mimeo.
Kaminsky, G. L., Lizondo, S. and Reinhart C.M., (1977), “Leading Indicators of
Currency Crises”, IMF Working Paper, No: 79.
Kaminisky, G. L. and Reinhart, C., (2002), “The Center and the Periphery: The
Globalization of Financial Turmoil”, http://home.gwu.edu/~graciela.
Kaminisky, G. L. and Schmukler, S. L., (2002), “Short Run Pain, Long Run Gain: The
Effects of Financial Liberalization”, http://home.gwu.edu/~graciela.
Kose, M. A., Prasad, E. S. and Terrones, M., (2002), “Financial Integration and
Economic Volatility”, Mimeo.
Kregel, J.A., (1998), “Capital Flows, Global Banking and Financial Crises in the Post-
Bretton Woods Era as A Guide to the 21st Century’s Financial Crises”,
http://iml.umkc.edu/econ/economics/faculty/Kregel/Readings/CapitalFlowsGlobalBanks.
pdf.
McKinnon, R. I., (1973), “Money and Capital in Economic Development”, The Brooking
Institution, Washington D.C.
Reinhart, C. M. and Tokatlidis, I., (2001), “Before and After Financial Liberalization”,
Mimeo.
Tornell, A. and Westermann, F., (2002), “The Credit Channel in Middle Income
Countries”, NBER Working Papers, NO: 9355.
Stiglitz. J. E.; Weiss, A., (1981), ''Credit Rationing in Markets with Imperfect
Information'', American Economic Review, 71:3, pp. 393-410.
Wyplosz, C., (2001), “How Risky is Financial Liberalization in the Developing
Countries?”, Mimeo.
34

APPENDIX
FIGURE.1: TREND COMPONENTS
9 .7
9 .8
9 .9
1 0 .0
1 0 .1
1 0 .2
1 0 .3
8 8 9 0 9 2 9 4 9 6 9 8 0 0 0 2
R E A L G D P
9 .5
9 .6
9 .7
9 .8
9 .9
1 0 .0
8 8 9 0 9 2 9 4 9 6 9 8 0 0 0 2
R E A L T O T A L C O N S U M P T IO N
8 .3
8 .4
8 .5
8 .6
8 .7
8 .8
8 .9
9 .0
8 8 9 0 9 2 9 4 9 6 9 8 0 0 0 2
R E A L T O T A L IN V E S T M E N T
4 .7
4 .8
4 .9
5 .0
5 .1
5 .2
5 .3
5 .4
5 .5
8 8 9 0 9 2 9 4 9 6 9 8 0 0 0 2
R E A L T O T A L C R E D IT
- 1 6 0 0 0
- 1 2 0 0 0
- 8 0 0 0
- 4 0 0 0
0
4 0 0 0
8 0 0 0
8 8 9 0 9 2 9 4 9 6 9 8 0 0 0 2
R E A L E X T E R N A L F IN A N C E
9 .4
9 .5
9 .6
9 .7
9 .8
9 .9
8 8 9 0 9 2 9 4 9 6 9 8 0 0 0 2
R E A L P R IV A T E C O N S U M P T IO N
7 .2
7 .3
7 .4
7 .5
7 .6
7 .7
7 .8
7 .9
8 8 9 0 9 2 9 4 9 6 9 8 0 0 0 2
R E A L P U B L IC C O N S U M P T IO N
7 .8
8 .0
8 .2
8 .4
8 .6
8 .8
8 8 9 0 9 2 9 4 9 6 9 8 0 0 0 2
R E A L P R IV A T E IN V E S T M E N T
7 .1 5
7 .2 0
7 .2 5
7 .3 0
7 .3 5
7 .4 0
7 .4 5
7 .5 0
8 8 9 0 9 2 9 4 9 6 9 8 0 0 0 2
R E A L P U B L IC IN V E S T M E N T
4 .4
4 .6
4 .8
5 .0
5 .2
5 .4
5 .6
8 8 9 0 9 2 9 4 9 6 9 8 0 0 0 2
R E A L P R IV A T E C R E D IT
1 .6
1 .8
2 .0
2 .2
2 .4
2 .6
2 .8
3 .0
3 .2
8 8 9 0 9 2 9 4 9 6 9 8 0 0 0 2
R E A L P U B L IC C R E D IT
9 .2
9 .3
9 .4
9 .5
9 .6
9 .7
9 .8
8 8 9 0 9 2 9 4 9 6 9 8 0 0 0 2
R E A L N O N -T R A D E D G O O D S P R O D U C T IO N
8 .8
8 .9
9 .0
9 .1
9 .2
9 .3
8 8 9 0 9 2 9 4 9 6 9 8 0 0 0 2
R E A L T R A D E D G O O D S P R O D U C T IO N
- 4
- 2
0
2
4
6
8
1 0
8 8 9 0 9 2 9 4 9 6 9 8 0 0 0 2
D O M E S T IC S P R E A D
2 0
3 0
4 0
5 0
6 0
7 0
8 0
8 8 9 0 9 2 9 4 9 6 9 8 0 0 0 2
E X T E R N A L S P R E A D
FIGURE.2: IRREGULAR COMPONENTS
- .0 6
- .0 4
- .0 2
.0 0
.0 2
.0 4
.0 6
8 8 9 0 9 2 9 4 9 6 9 8 0 0 0 2
R E A L G D P
- .0 5
- .0 4
- .0 3
- .0 2
- .0 1
.0 0
.0 1
.0 2
.0 3
8 8 9 0 9 2 9 4 9 6 9 8 0 0 0 2
R E A L TO TA L C O N S U M P TIO N
- .1 2
- .0 8
- .0 4
.0 0
.0 4
.0 8
.1 2
8 8 9 0 9 2 9 4 9 6 9 8 0 0 0 2
R E A L TO TA L IN V E S TM E N T
- .1 2
- .0 8
- .0 4
.0 0
.0 4
.0 8
.1 2
8 8 9 0 9 2 9 4 9 6 9 8 0 0 0 2
R E A L TO TA L C R E D IT
- 8 0 0 0 0
- 6 0 0 0 0
- 4 0 0 0 0
- 2 0 0 0 0
0
2 0 0 0 0
4 0 0 0 0
6 0 0 0 0
8 8 9 0 9 2 9 4 9 6 9 8 0 0 0 2
R E A L E X TE R N A L F IN A N C E
- .0 6
- .0 4
- .0 2
.0 0
.0 2
.0 4
8 8 9 0 9 2 9 4 9 6 9 8 0 0 0 2
R E A L P R IV A TE C O N S U M P TIO N
- .0 8
- .0 6
- .0 4
- .0 2
.0 0
.0 2
.0 4
.0 6
8 8 9 0 9 2 9 4 9 6 9 8 0 0 0 2
R E A L P U B L IC C O N S U M P TIO N
- .1 2
- .0 8
- .0 4
.0 0
.0 4
.0 8
.1 2
8 8 9 0 9 2 9 4 9 6 9 8 0 0 0 2
R E A L P R IV A TE IN V E S TM E N T
- .3
- .2
- .1
.0
.1
.2
.3
8 8 9 0 9 2 9 4 9 6 9 8 0 0 0 2
R E A L P U B L IC IN V E S TM E N T
- .1 2
- .0 8
- .0 4
.0 0
.0 4
.0 8
.1 2
8 8 9 0 9 2 9 4 9 6 9 8 0 0 0 2
R E A L P R IV A TE C R E D IT
- .6
- .4
- .2
.0
.2
.4
8 8 9 0 9 2 9 4 9 6 9 8 0 0 0 2
R E A L P U B L IC C R E D IT
- .0 4
- .0 3
- .0 2
- .0 1
.0 0
.0 1
.0 2
.0 3
.0 4
.0 5
8 8 9 0 9 2 9 4 9 6 9 8 0 0 0 2
R E A L N O N -TR A D E D G O O D S P R O D U C TIO N
- .0 6
- .0 4
- .0 2
.0 0
.0 2
.0 4
.0 6
8 8 9 0 9 2 9 4 9 6 9 8 0 0 0 2
R E A L TR A D E D G O O D S P R O D U C TIO N
- 4 0
- 3 0
- 2 0
- 1 0
0
1 0
2 0
3 0
4 0
5 0
8 8 9 0 9 2 9 4 9 6 9 8 0 0 0 2
D O M E S TIC S P R E A D
- 4 0
- 2 0
0
2 0
4 0
6 0
8 8 9 0 9 2 9 4 9 6 9 8 0 0 0 2
E X TE R N A L S P R E A D
35

FIGURE.3: CYCLICAL COMPONENTS:
-.08
-.04
.00
.04
.08
1988 1990 1992 1994 1996 1998 2000 2002
REAL GDP
-20
0
20
40
60
1988 1990 1992 1994 1996 1998 2000 2002
DOMESTIC SPREAD
-40000
-20000
0
20000
40000
1988 1990 1992 1994 1996 1998 2000 2002
CAPITAL FLOW
-80
-40
0
40
80
1988 1990 1992 1994 1996 1998 2000 2002
EXTERNAL SPREAD
-.08
-.04
.00
.04
.08
1988 1990 1992 1994 1996 1998 2000 2002
PRIVATE CONSUMPTION
-.08
-.04
.00
.04
.08
1988 1990 1992 1994 1996 1998 2000 2002
NON-TRADED GOODS PRODUCTION
-.3
-.2
-.1
.0
.1
.2
.3
1988 1990 1992 1994 1996 1998 2000 2002
PRIVATE INVESTMENT
-.3
-.2
-.1
.0
.1
.2
.3
1988 1990 1992 1994 1996 1998 2000 2002
PUBLIC INVESTMENT
-.4
-.2
.0
.2
.4
1988 1990 1992 1994 1996 1998 2000 2002
PRIVATE CREDIT
-.8
-.4
.0
.4
1988 1990 1992 1994 1996 1998 2000 2002
PUBLIC CREDIT
-.08
-.04
.00
.04
.08
1988 1990 1992 1994 1996 1998 2000 2002
TOTAL CONSUMPTION
-.3
-.2
-.1
.0
.1
.2
.3
1988 1990 1992 1994 1996 1998 2000 2002
TOTAL INVESTMENT
-.08
-.04
.00
.04
.08
1988 1990 1992 1994 1996 1998 2000 2002
TRADED GOODS PRODUCTION
-.10
-.05
.00
.05
.10
1988 1990 1992 1994 1996 1998 2000 2002
PUBLIC CONSUMPTION
-.4
-.2
.0
.2
.4
1988 1990 1992 1994 1996 1998 2000 2002
TOTAL CREDIT
Table.1: The Relationship Between the Cyclical Component of Real GDP and Cyclical Components of Each Indicator: 1988:I-2002:IV
CHARACTERISTICS
Variables
Volatility (%) S.D.
Direction Timing (Cross Corr. Coeff.)
t-i, t+j Real GDP
3.141 Persistent (i=1) 0.832 (i=2) 0.402 (i=3) -0.056 (i=4)-0.005
Real Total Consumption 3.343 Procyclical Coincident (i=0) 0.9120
Real Total Investment 9.226 Procyclical Coincident (i=0) 0.8502
Real Private Consumption 3.557 Procyclical Coincident (i=0) 0.9285
Real Public Consumption 3.291 Procyclical Coincident (i=0) 0.4901
Real Private Investment 9.716 Procyclical Coincident (i=0) 0.7989
Real Traded Goods Prod. 3.084 Procyclical Coincident (i=0) 0.9521
Real Non-Traded Goods Prod. 2.630 Procyclical Coincident (i=0) 0.9833
Real Total Credit 13.959 Procyclical Lags cycle (j=1) 0.7038
Real Public Investment 13.694 Procyclical Lags cycle (j=1) 0.6746
Real Private Credit 14.153 Procyclical Lags cycle (j=1) 0.7017
Real Public Credit 21.022 Procyclical Lags cycle (j=1) 0.2742
Domestic Spread 14.387 Countercyclical Leads cycle (i=2) -0.5723
External Spread 27.567 Countercyclical Leads cycle (i=1) -0.5778
Real Capital flow 109.543 Procyclical Leads cycle (i=1) 0.6112
Bold and italic shows the cross correlation coefficients.
36
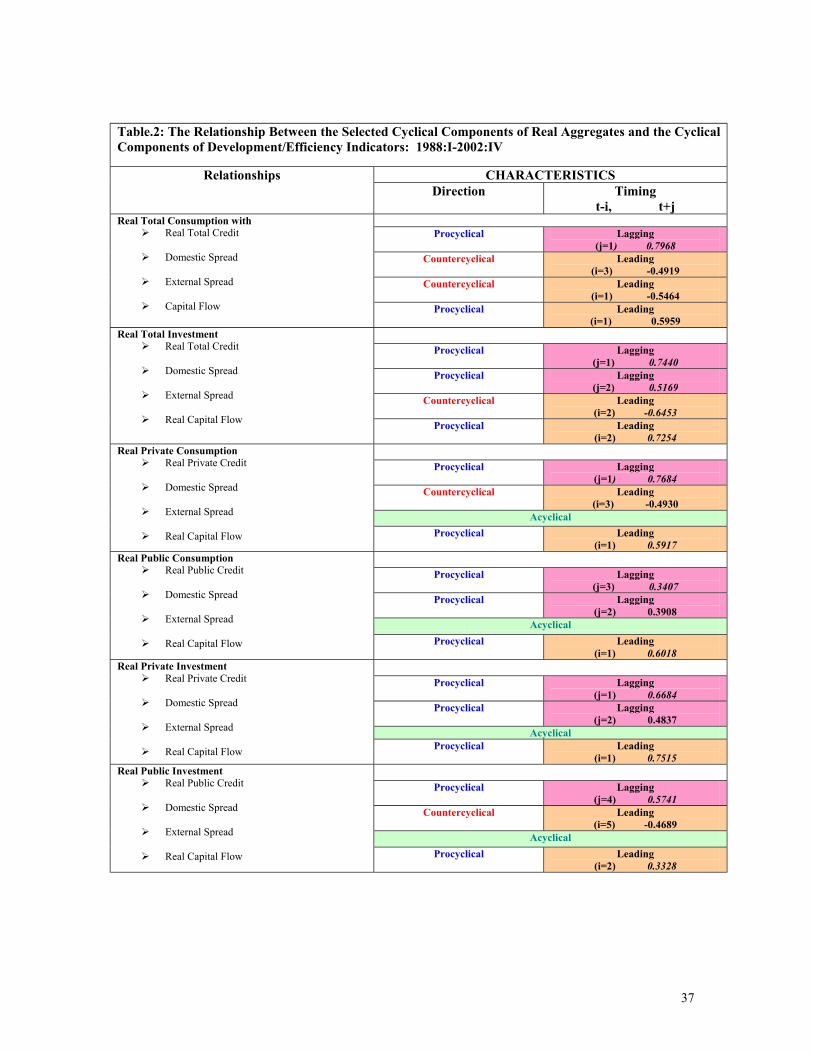
Table.2: The Relationship Between the Selected Cyclical Components of Real Aggregates and the Cyclical Components of Development/Efficiency Indicators: 1988:I-2002:IV
CHARACTERISTICS Relationships Direction Timing
t-i, t+j
Procyclical Lagging (j=1) 0.7968
Countercyclical
Leading (i=3) -0.4919
Countercyclical
Leading (i=1) -0.5464
Real Total Consumption with Real Total Credit
Domestic Spread
External Spread
Capital Flow
Procyclical Leading
(i=1) 0.5959
Procyclical Lagging (j=1) 0.7440
Procyclical Lagging (j=2) 0.5169
Countercyclical Leading (i=2) -0.6453
Real Total Investment Real Total Credit
Domestic Spread
External Spread
Real Capital Flow Procyclical Leading
(i=2) 0.7254
Procyclical Lagging (j=1) 0.7684
Countercyclical
Leading (i=3) -0.4930
Acyclical
Real Private Consumption Real Private Credit
Domestic Spread
External Spread
Real Capital Flow Procyclical Leading
(i=1) 0.5917
Procyclical Lagging (j=3) 0.3407
Procyclical Lagging (j=2) 0.3908
Acyclical
Real Public Consumption Real Public Credit
Domestic Spread
External Spread
Real Capital Flow Procyclical Leading
(i=1) 0.6018
Procyclical Lagging (j=1) 0.6684
Procyclical Lagging (j=2) 0.4837
Acyclical
Real Private Investment Real Private Credit
Domestic Spread
External Spread
Real Capital Flow Procyclical Leading
(i=1) 0.7515
Procyclical Lagging (j=4) 0.5741
Countercyclical
Leading (i=5) -0.4689
Acyclical
Real Public Investment Real Public Credit
Domestic Spread
External Spread
Real Capital Flow Procyclical Leading
(i=2) 0.3328
37

Table.2 (Continues): The Relationship Between the Selected Cyclical Components of Real Aggregates and the Cyclical Components of Development/Efficiency Indicators: 1988:I-2002:IV
CHARACTERISTICS Relationships Direction Timing
t-i, t+j
Procyclical
Lagging (j=2) 0.4285
Acyclical
Real Private Credit Domestic Spread
External Spread
Real Capital Flow
Countercyclical Lagging (j=2) -0.4062
Procyclical
Lagging
(j=2) 0.4266 Acyclical
Real Total Credit Domestic Spread
External Spread
Real Capital Flow
Countercyclical
Lagging (j=2) –0.4071
Procyclical
Lagging
(j=2) 0.3257 Acyclical
Real Public Credit Domestic Spread
External Spread
Real Capital Flow
Countercyclical Lagging (j=3) -0.3361
Procyclical Lagging
(j=2) 0.6791 Countercyclical
Leading
(i=2) –0.5661 Acyclical
Real Traded Goods Production Real Total Credit
Domestic Spread
External Spread
Real Capital Flow
Procyclical
Leading (i=1) 0.5525
Procyclical Lagging
(j=1) 0.6632 Countercyclical Leading
(i=2) –0.5227 Acyclical
Real Non-Traded Goods Production Real Total Credit
Domestic Spread
External Spread
Real Capital Flow
Procyclical Leading (i=1) 0.5799
Countercyclical Leading
(i=1) -0.3399
Capital flow Domestic Spread
External Spread Countercyclical Coincident
(i=0) -0.4683 External Spread
Domestic Spread Acyclical
Cycle Component of one variable related to the cycle components of the other variable:
38

Table.3: Granger Causality Test Between the Cyclical Component of Real GDP and the Cyclical Component of Corresponding Variables- i=1,2,3,4,1988:I-2002:IV Variable(X) i=1 i=2 i=3 i=4 Real Total Consumption No causality No causality No causality No causality
Real Total Investment Mutual causality
No causality RGDP causes X RGDP causes X
Real Total Credit
Mutual causality No causality No causality No causality
Real Private Consumption
No causality No causality No causality No causality
Real Public Consumption No causality
No causality RGDP causes X RGDP causes X
Real Private Investment Mutual causality
RGDP causes X No causality No causality
Real Public Investment RGDP causes X
No causality RGDP causes X RGDP causes X
Real Private Credit
Mutual causality No causality No causality No causality
Real Public Credit
X causes RGDP No causality No causality No causality
Real Traded Goods Prod.
No causality No causality No causality No causality
Real Non-Traded Goods Prod.
No causality No causality No causality No causality
Domestic Spread Mutual causality No causality Mutual causality X causes RGDP
External Spread Mutual causality RGDP causes X
RGDP causes X RGDP causes X
Real Capital Flow
Mutual causality No causality No causality No causality
Results are accepted at the 5% significance level. Shaded areas show the stable causality relationship.
39

Table.4: Granger Causality Test Between the Cyclical Component of Real Variables and the Cyclical Component of Development/Efficiency Indicators- i=1,2,3,4 :1988:I-2002:IV
Lag Orders Relationships
i=1
i=2 i=3
i=4 Consumption causes Credit Credit causes
Consumption No causality Credit causes
Consumption Mutual causality No causality Consumption causes
dom. Spr. Domestic spr.causes Cons.
Mutual causality Consumption causes Ext. Spr
Mutual causality No causality
Real Total Consumption with Real Total Credit
Domestic Spread
External Spread
Capital Flow Mutual causality No causality No causality No causality
Mutual causality
No causality
Investment causes Credit
Investment causes Credit
Mutual causality Investment causes Capital flow
Mutual causality No causality
Mutual causality
No causality Mutual causality No causality
Real Total Investment
Real Total Credit
Real Capital Flow
Domestic Spread
External Spread Mutual causality
Investment causes External Spread
Investment causes External Spread
Investment causes External Spread
Mutual causality Credit causes
consumption No causality No causality
Mutual causality No causality Consumption causes capital flow
Consumption causes capital flow
Mutual causality
No causality Mutual causality
Dom. Spr. causes prv. consumption
Real Private Consumption Real Private Credit
Real Capital Flow
Domestic Spread
External Spread No causality
No causality No causality No causality
No causality
No causality No causality No causality
Mutual causality No causality
No causality No causality
Mutual causality
No causality Dom. spread causes pub. cons.
No causality
Real Public Consumption
Real Public Credit Real Capital Flow
Domestic Spread
External Spread No causality
No causality No causality No causality
Investment causes Credit No causality No causality No causality
Mutual causality Investment causes
capital flow Mutual causality No causality
Mutual causality
No causality Private investment causes dom. spread
Private investment causes dom. spread
Real Private Investment
Real Private Credit
Real Capital Flow
Domestic Spread
External Spread No causality
No causality No causality No causality
No causality Mutual causality Investment causes
Credit Investment causes Credit
Capital flow causes Investment
Investment causes Capital flow
Investment causes Capital flow
Investment causes Capital flow
Mutual causality
No causality Mutual causality Dom. spread causes public inv.
Real Public Investment Real Public Credit
Real Capital Flow
Domestic Spread
External Spread No causality
No causality No causality No causality
40
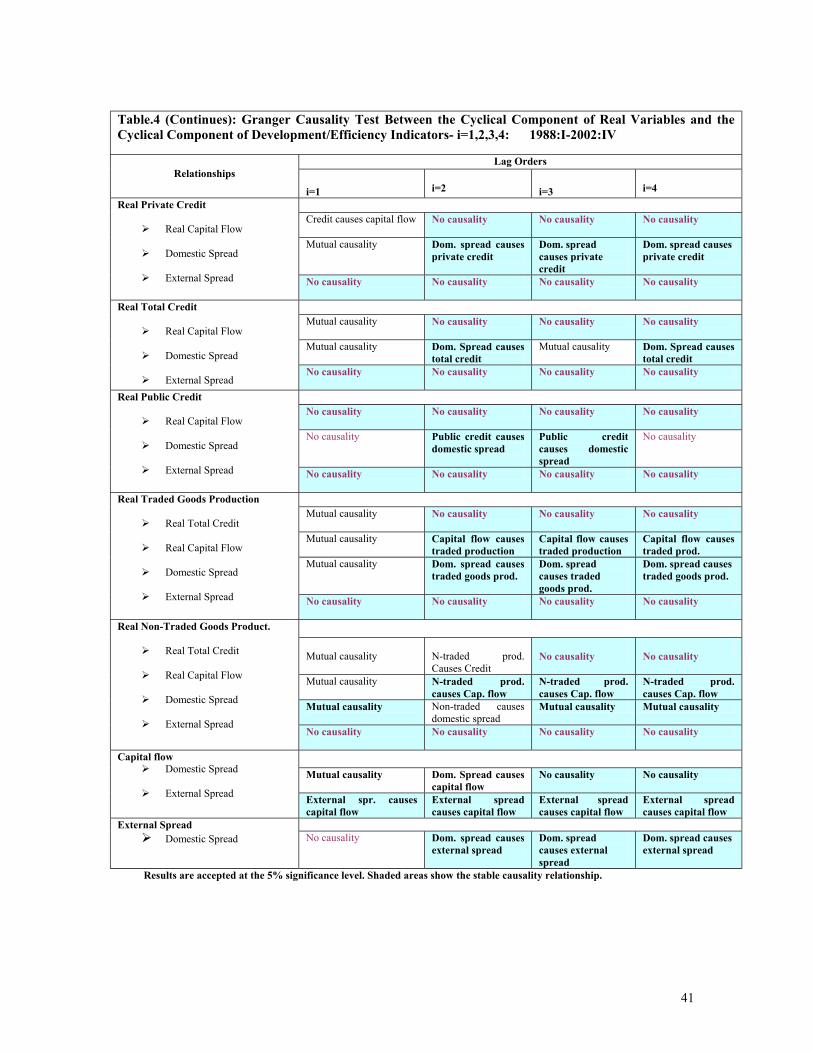
Table.4 (Continues): Granger Causality Test Between the Cyclical Component of Real Variables and the Cyclical Component of Development/Efficiency Indicators- i=1,2,3,4: 1988:I-2002:IV
Lag Orders Relationships
i=1 i=2 i=3
i=4
Credit causes capital flow
No causality No causality No causality
Mutual causality Dom. spread causes private credit
Dom. spread causes private credit
Dom. spread causes private credit
Real Private Credit
Real Capital Flow Domestic Spread
External Spread No causality
No causality No causality No causality
Mutual causality
No causality No causality No causality
Mutual causality
Dom. Spread causes total credit
Mutual causality Dom. Spread causes total credit
Real Total Credit
Real Capital Flow Domestic Spread
External Spread
No causality
No causality No causality No causality
No causality
No causality No causality No causality
No causality
Public credit causes domestic spread
Public credit causes domestic spread
No causality
Real Public Credit
Real Capital Flow Domestic Spread
External Spread No causality
No causality No causality No causality
Mutual causality No causality No causality No causality
Mutual causality Capital flow causes
traded production Capital flow causes traded production
Capital flow causes traded prod.
Mutual causality
Dom. spread causes traded goods prod.
Dom. spread causes traded goods prod.
Dom. spread causes traded goods prod.
Real Traded Goods Production
Real Total Credit Real Capital Flow
Domestic Spread
External Spread No causality
No causality No causality No causality
Mutual causality
N-traded prod. Causes Credit
No causality
No causality
Mutual causality N-traded prod. causes Cap. flow
N-traded prod. causes Cap. flow
N-traded prod. causes Cap. flow
Mutual causality
Non-traded causes domestic spread
Mutual causality Mutual causality
Real Non-Traded Goods Product.
Real Total Credit
Real Capital Flow
Domestic Spread
External Spread No causality
No causality No causality No causality
Mutual causality Dom. Spread causes capital flow
No causality No causality
Capital flow Domestic Spread
External Spread External spr. causes
capital flow External spread causes capital flow
External spread causes capital flow
External spread causes capital flow
External Spread Domestic Spread No causality Dom. spread causes
external spread Dom. spread causes external spread
Dom. spread causes external spread
Results are accepted at the 5% significance level. Shaded areas show the stable causality relationship.
41