financial indicators for critical access hospitals - home · pdf file ·...
TRANSCRIPT

Flex Monitoring Team Briefing Paper No. 7
Financial Indicators for Critical Access Hospitals
May 2005

The Flex Monitoring Team is a consortium of the Rural Health Research Centers located at the Universities of Minnesota, North Carolina at Chapel Hill, and Southern Maine. Under contract with the federal Office of Rural Health Policy (PHS Grant No. U27RH01080), the Flex Monitoring Team is cooperatively conducting a performance monitoring project for the Medicare Rural Hospital Flexibility Program (Flex Program). The monitoring project is assessing the impact of the Flex Program on rural hospitals and communities and the role of states in achieving overall program objectives, including improving access to and the quality of health care services; improving the financial performance of Critical Access Hospitals; and engaging rural communities in health care system development. The authors of this report are George H. Pink, Ph.D., Associate Professor in the Health Policy and Administration Department at the University of North Carolina at Chapel Hill and Senior Research Fellow at the Cecil G. Sheps Center for Health Services Research (Sheps Center), G. Mark Holmes Ph.D., Research Fellow for the North Carolina Rural Health Research and Policy Analysis Center (NC RHR & PAC) at the Sheps Center, Cameron D’Alpe, M.S.P.H., Postgraduate Administrative Fellow for Kaiser Permanente Northern California Region, Lindsay A. Strunk, BSPH, Research Assistant at the Sheps Center, Patrick McGee, M.S.P.H., C.P.A., Research Assistant at the Sheps Center and Rebecca Slifkin, Ph.D., Director of the NC RHR & PAC at the Sheps Center.
Flex Monitoring Team http://www.flexmonitoring.org
University of Minnesota
Division of Health Services Research & Policy 420 Delaware Street, SE, Mayo Mail Code 729
Minneapolis, MN 55455-0392 612.624.8618
University of North Carolina at Chapel Hill
Cecil G. Sheps Center for Health Services Research 725 Airport Road, CB #7590 Chapel Hill, NC 27599-7590
919.966.5541
University of Southern Maine Muskie School of Public Service
PO Box 9300 Portland, ME 04104-9300
207.780.443
Acknowledgments: The authors gratefully acknowledge Dave Berk, Brandon Durbin, Roger Thompson, and Greg Wolf for their guidance and advice throughout this project.

EXECUTIVE SUMMARY
The purpose of this project was to develop and disseminate comparative financial
indicators specifically for Critical Access Hospitals (CAHs) using Medicare Cost Report
(Healthcare Report Information System) data. A Technical Advisory Group of individuals with
extensive experience in rural hospital finance and operations provided advice to a research team
from the University of North Carolina at Chapel Hill. A literature review identified 114 financial
ratios that have proven useful for assessing financial condition. Twenty indicators deemed
appropriate for assessment of CAH financial condition were chosen. In September 2004, the
CEOs of 853 CAHs were mailed a CAH Financial Indicators Report© (the Report) that included
values specifically for their CAH and national median values. State-level reports were sent to
State Flex Coordinators.
Results showed that over the six years since 1998, CAHs generally became more
profitable and increased utilization of beds. However, while on average CAHs with long-term
care became more liquid and reduced their use of debt over time, those without long-term care
became less liquid and increased their use of debt. In the most recent year for which we have
data (2003), CAHs without long-term care generally were more profitable, were more liquid, had
less debt, and had higher utilization of beds in comparison to CAHs with long-term care.
An evaluation form queried respondents regarding the overall usefulness of the Report
and of individual indicators. Among 180 respondents, 82 percent rated the report as either very
useful or useful. Net days revenue in accounts receivable, FTEs per adjusted occupied bed, and
total margin were rated most useful by the greatest number of respondents. Every indicator in
the Report was rated most useful by a substantial number of respondents and least useful by only
a few respondents.
1

The CAH Financial Indicators Report© represents a genuine collaboration between a
university-based research team and practitioners with experience and expertise in the financial
management of CAHs. Together, both parties worked to produce financial indicators that CAH
boards and management can use to improve the financial management of their organizations.
The Report has several limitations, including use of historical data that may not be
predictive of future results, variations in CAH service mix may influence indicator values, no
consensus about good performance, and data quality concerns. For example, some hospitals
reported zero total patient charges, negative patient deductions, negative current assets, and zero
age of plant. From a theoretical standpoint, these numbers were highly unlikely or impossible
and reaffirmed a research objective held by the research team since the beginning of the project –
to improve the quality of data included in Medicare Cost Reports.
Despite the described limitations, the consensus of the TAG, coupled with feedback from
administrators, support the Report as a reasonable and appropriate mechanism for portraying the
financial performance of CAHs. In the summer of 2005, administrators will receive a 2005 CAH
Financial Indicators Report© with data specific for their CAH, and an evaluation form. State
Flex coordinators will receive a Report for each CAH in their state. In addition to the content
included in the 2004 report, there will be more discussion of results, state medians over time,
additional data displays, and median data for four peer groups: CAHs with and without long-
term care (as before), total revenue greater than and less than $10 million, government and non-
government ownership, and with and without a provider based rural health clinic. The addition
of another year of cost report data will provide a longer comparison period and will also result in
post-conversion data for a larger number of hospitals.
2

INTRODUCTION
Financial statement analysis is important to boards, managers, payers, lenders, and others
who make judgments about the financial health of organizations. One widely accepted method
of assessing financial statements is ratio analysis, which uses data from the balance sheet and
income statement to produce values that have easily interpreted financial meaning. Most
hospitals, health systems and other healthcare organizations routinely evaluate their financial
condition by calculating various ratios and comparing the values to those for previous periods,
looking for differences that could indicate a meaningful change in financial condition. Many
healthcare organizations also compare their own ratio values to those for similar organizations,
looking for differences that could indicate weaknesses or opportunities for improvement.
Comparisons with other organizations are only as useful as the degree to which the
organizations are similar. Contrasting the financial position of a Critical Access Hospital (CAH)
with that of a major teaching hospital is not informative because the two hospitals have vastly
different missions. Therefore, one key element in financial statement analysis is the collection of
financial data for similar hospitals. Such data for hospitals are available from commercial
suppliers (e.g., Moody’s, Standard & Poor’s, Solucient, Data Advantage Corporation, Ingenix,
and FITCH), and industry trade groups (example.g., the American Hospital Association and the
Healthcare Financial Management Association). Each of these data suppliers produces
comparative data, but there are minor and sometimes major differences among them due to
different samples of hospitals used to calculate the ratios and different definitions and accounts
included in the ratio numerators and denominators. If a hospital compares its ratios either to
those for a group that includes dissimilar hospitals or to those that do not use the same
definitions, erroneous interpretations and conclusions could result.
3

For CAHs, differences between groups of hospitals are particularly important. Much of
the comparative data for all hospitals is grouped by size and type of facility, with CAHs typically
included in a category such as “less than 50 beds”. Within such a category there would be
substantial hospital variation in revenues, volumes, fixed costs, ownership, patient mix,
technology, system affiliation, long-term care service, and other factors. Perhaps most
important, the category of “less than 50 beds” would include both hospitals that have Medicare
Prospective Payment System reimbursement and CAHs that have cost-based reimbursement.
The heterogeneity of hospitals used to produce comparative data for small hospitals makes
comparisons difficult and limits the usefulness and relevance of the data for CAH decision-
making.
The authors are not aware of any routinely-produced, national comparative data for
CAHs only. However, there are some initiatives underway that have produced comparative data
for CAHs in specific regions. The Rural Health Resource Center and Stroudwater Associates are
working with small hospitals in the Mississippi Delta Region, providing technical expertise and
information and producing business tools to improve hospital performance. The Montana CAH
Quality Improvement Network initiated a benchmarking project and has generated facility
specific “dashboard reports”, beginning in July 2001. The Colorado Health and Hospital
Association produces a DATABANK monthly report that CAHs can use to compare their
performance with a peer group average.
In 2002, the Medicare Rural Hospital Flexibility Performance Monitoring Project (Flex
Monitoring Project) was funded under a cooperative agreement with the federal Office of Rural
Health Policy. The Rural Health Research Centers at the Universities of Minnesota, North
Carolina, and Southern Maine are collaborating on a multi-year assessment of the impact of the
4

Flex Program on rural hospitals and communities. A critical objective of the Flex Monitoring
Project is the development and dissemination of comparative financial indicators designed
specifically for CAHs.
The purpose of this paper is to describe the development of a set of financial indicators
(also referred to as ratios) displayed in the CAH Financial Indicators Report© (the Report), that
was produced and disseminated to 853 CAHs in the summer of 2004. The indicators described
in this paper are designed to specifically measure financial principles relevant to CAHs. CAHs
face a set of challenges disparate from non-CAH hospitals, so the development of financial
indicators specific to their environment is critical in performance assessment. Because these
hospitals tend to have a higher risk of financial insolvency, assessing their financial performance
is key to ensuring their long term financial survival.
PROCESS
The process used to develop and produce the CAH Financial Indicators Report© is
depicted in Figure 1. In the sections that follow, each step is described.
Step 1: Selection of the technical advisory group
From the outset of the project, the academic team sought to ground the research in
practical financial management. To this end, a Technical Advisory Group (TAG) was selected to
provide practical advice on the selection and use of financial indicators for CAHs. To select
members for the TAG, a variety of industry and opinion leaders were canvassed for names of
individuals who are knowledgeable about CAH financial and operational issues, data, and
reporting practices. Four individuals with a valuable mix of expertise and geographic
5

perspective agreed to serve on the TAG: Dave Berk (Rural Health Financial Services, Anacortes,
Washington), Brandon Durbin, CPA (Durbin & Company, LLP, Lubbock, Texas), Roger
Thompson, CPA, FHFMA (Seim, Johnson, Sestak & Quist, LLP, Omaha, Nebraska), and
Gregory Wolf (Stroudwater Associates, Portland, Maine).
Figure 1: Method for Developing CAH Financial Indicators Report©
Advice
Literature review 114 indicators
Used in ≥ 5 articles 37 indicators
Financial performance dimensions
Technical Advisory Group selection
Used in < 5 articles 77 indicators
Step 1
Step 2
Step 3
Step 4
Indicator selection 13 indicators
Indicator selection 7 indicators
Dissemination and eval.
Pre-test and revision
Presentation format
Data analysis
Indicator definitions
Step 5
Step 6
Step 7
Step 8
Step 9
Step 10
6

Throughout the entire research process, the TAG provided practical advice on numerous
methodological issues, including: sources of information about CAH financial performance and
condition; timeliness, accuracy, completeness, and relevance of data; potential indicators of CAH
financial performance and condition; selection of financial indicators to be produced using
secondary data; precise definitions of selected indicators, including account codes; reliability of
Medicare Cost Report accounts; face validity of data analyses; interpretation of results and data
limitations; and methods of dissemination and evaluation.
Step 2: Identification of dimensions of financial performance
Establishing dimensions of financial performance provided an overarching structure for
identification of relevant financial indictors. Different financial indicators measure different
dimensions of financial performance, such as profitability and liquidity, and all of this
information is needed to make an informed judgment about the financial health of an
organization. For example, profitability indicators may indicate an organization is earning a
profit, but liquidity indicators may show it is having difficulty paying its bills and capital
structure indicators may show a large increase in debt.
To select financial performance dimensions, the five top-selling textbooks on healthcare
financial management were reviewed. The intent was to select performance dimensions that
would be familiar to graduates of health administration programs and others who had received
formal training in ratio analysis. Not surprisingly, there was substantial overlap and it was
relatively straightforward to establish five preliminary dimensions of financial performance:
profitability, liquidity, capital structure, activity, and other.
7

Step 3: Review of the literature
The third step was to identify the financial ratios that had been found to be or deemed to
be important measures of hospital financial performance. A non-systematic literature review
was undertaken to identify the financial ratios included in articles in peer-reviewed journals,
industry publications, and articles in practitioner journals.
To identify ratios in peer-reviewed articles, searches of Medline and other academic
databases using keywords such as “hospital”, “financial performance”, and “ratio analysis” were
undertaken. Articles published prior to 1990 were excluded from the searches in order to ensure
that only the most recent studies were included. This exclusion was important because of the
many changes in healthcare since 1990 and the likely lower relevance of articles prior to these
changes. Ratios were selected from the articles if results showed that they were statistically
significant in explaining a dimension of hospital financial performance, such as profitability or
financial distress. To identify ratios in industry publications, the websites of various commercial
suppliers and industry organizations were reviewed. Finally, to identify ratios in practitioner
journal articles, searches of various databases including these journals using the keywords above
were undertaken. Due to the lack of statistical analysis in these articles, judgment of the project
staff was used in selection of ratios.
In total, 114 ratios were identified in the peer-reviewed journals, industry publications,
and articles in practitioner journals. The bibliography lists all of the articles and publications in
which the 114 indicators were found.
8

Step 4: Identification of frequently used indicators
Among the 114 ratios found to be or deemed to be important indicators of hospital
financial performance, some were used in many articles and some were used in only one article.
Identification of the most frequently used indicators was considered to be a logical way of
reducing the opportunity set of indicators from 114 to a more manageable number.
All publications and the ratios used in them were recorded and coded in a database. The
database was then queried to count the articles that found a particular indicator to be important.
An indicator was defined as frequently used if it appeared in five or more articles and
infrequently used if it appeared in four or fewer articles. On this basis, 37 indicators were
identified as frequently used, and 77 identified as infrequently used.
To assess the extent to which the 37 frequently used indicators identified in the literature
review measured different dimensions of financial performance, each ratio was assigned to one
of the five dimensions listed in Step 2. Table 1 shows the five dimensions of financial
performance, the ratios included under each dimension, a definition of each ratio, and the
frequency of the indicator in the articles identified in the literature review.
9
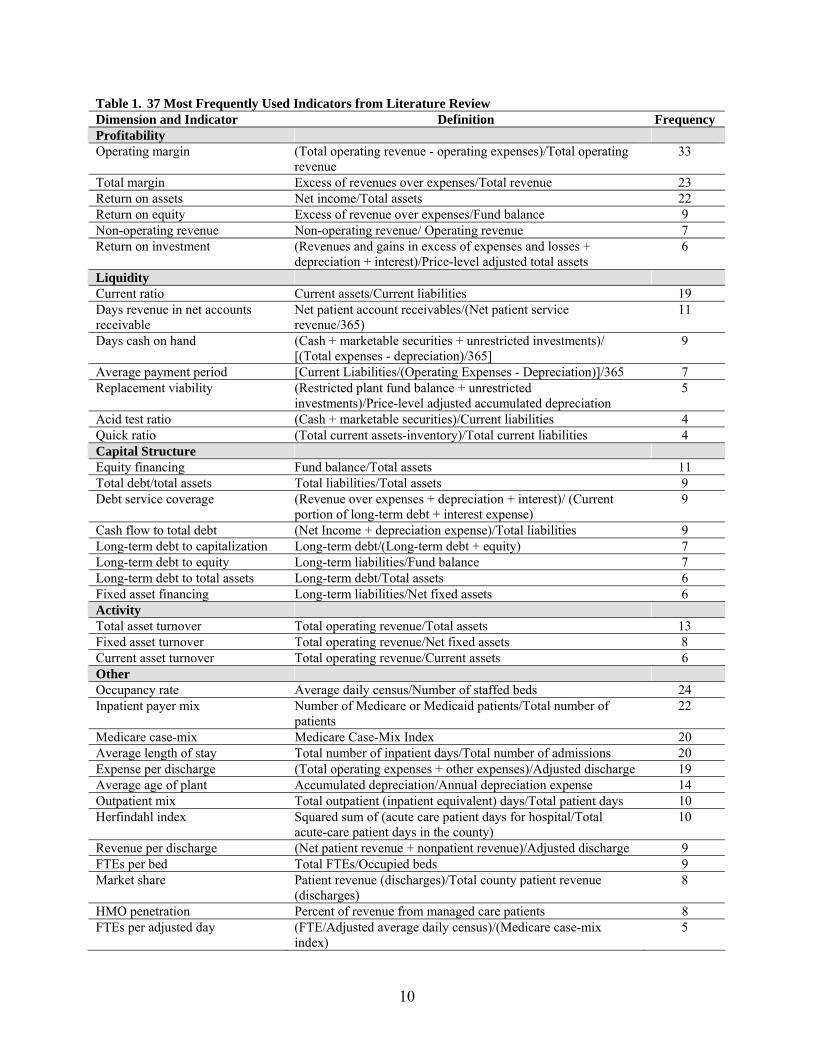
Table 1. 37 Most Frequently Used Indicators from Literature Review Dimension and Indicator Definition Frequency Profitability Operating margin (Total operating revenue - operating expenses)/Total operating
revenue 33
Total margin Excess of revenues over expenses/Total revenue 23 Return on assets Net income/Total assets 22 Return on equity Excess of revenue over expenses/Fund balance 9 Non-operating revenue Non-operating revenue/ Operating revenue 7 Return on investment (Revenues and gains in excess of expenses and losses +
depreciation + interest)/Price-level adjusted total assets 6
Liquidity Current ratio Current assets/Current liabilities 19 Days revenue in net accounts receivable
Net patient account receivables/(Net patient service revenue/365)
11
Days cash on hand (Cash + marketable securities + unrestricted investments)/ [(Total expenses - depreciation)/365]
9
Average payment period [Current Liabilities/(Operating Expenses - Depreciation)]/365 7 Replacement viability (Restricted plant fund balance + unrestricted
investments)/Price-level adjusted accumulated depreciation 5
Acid test ratio (Cash + marketable securities)/Current liabilities 4 Quick ratio (Total current assets-inventory)/Total current liabilities 4 Capital Structure Equity financing Fund balance/Total assets 11 Total debt/total assets Total liabilities/Total assets 9 Debt service coverage (Revenue over expenses + depreciation + interest)/ (Current
portion of long-term debt + interest expense) 9
Cash flow to total debt (Net Income + depreciation expense)/Total liabilities 9 Long-term debt to capitalization Long-term debt/(Long-term debt + equity) 7 Long-term debt to equity Long-term liabilities/Fund balance 7 Long-term debt to total assets Long-term debt/Total assets 6 Fixed asset financing Long-term liabilities/Net fixed assets 6 Activity Total asset turnover Total operating revenue/Total assets 13 Fixed asset turnover Total operating revenue/Net fixed assets 8 Current asset turnover Total operating revenue/Current assets 6 Other Occupancy rate Average daily census/Number of staffed beds 24 Inpatient payer mix Number of Medicare or Medicaid patients/Total number of
patients 22
Medicare case-mix Medicare Case-Mix Index 20 Average length of stay Total number of inpatient days/Total number of admissions 20 Expense per discharge (Total operating expenses + other expenses)/Adjusted discharge 19 Average age of plant Accumulated depreciation/Annual depreciation expense 14 Outpatient mix Total outpatient (inpatient equivalent) days/Total patient days 10 Herfindahl index Squared sum of (acute care patient days for hospital/Total
acute-care patient days in the county) 10
Revenue per discharge (Net patient revenue + nonpatient revenue)/Adjusted discharge 9 FTEs per bed Total FTEs/Occupied beds 9 Market share Patient revenue (discharges)/Total county patient revenue
(discharges) 8
HMO penetration Percent of revenue from managed care patients 8 FTEs per adjusted day (FTE/Adjusted average daily census)/(Medicare case-mix
index) 5
10

Step 5: Selection of the indicators
The research team and the Technical Advisory Group (TAG) met in Chicago in February
2004. Prior to the meeting, the TAG was provided with an information package that included
TAG member biographies, overview of the project, TAG terms of reference, project work plan,
the five performance dimensions, literature review, list and definitions of the 37 frequently used
indicators, a form for evaluating the 37 indicators, and a form for defining the account codes
from Medicare Cost Reports needed to calculate each ratio.
The TAG was asked to evaluate each of the 37 frequently used indicators using three
criteria: feasibility (whether the indicator can be accurately calculated from Medicare cost report
data), importance (whether the indicator is an important measure of the financial management of
CAHs), and usefulness (whether the indicator is useful to CAH administrators). After
preliminary discussion, 6 indicators were dropped from the 37 because they were considered not
applicable to CAHs. For the remaining 31 indicators, each was evaluated on each criterion,
using a scale from one to four, with four being very feasible, important, and useful and one
represented as very unfeasible, unimportant and not useful. Table 2 shows the TAG’s evaluation
of 31 of the 37 most frequently used indicators.
11

Table 2. Evaluation of 31 of the 37 Most Frequently Used Indicators by Technical Advisory Group Performance Dimension and Indicator
Feasibility Importance Usefulness Total Overall Ranking
Profitability Operating margin 4 4 4 12 1 Total margin 4 3 3 10 2 Cash flow margin 4 3.5 2.5 10 2 Return on equity 4 3 2.5 9.5 4 Return on assets 4 2 1 7 5
Liquidity
Days cash on hand 4 4 4 12 1 Days revenue in net accounts Receivable
3.5 4 4 11.5 2
Current ratio 4 3 2 9 3 Average payment period 4 1 2 7 4
Capital Structure
Long-term debt to capitalization 4 4 4 12 1 Debt service coverage 2 4 4 10 2 Equity financing 4 2 2 8 3 Total debt/total assets 4 1 1 6 4 Cash flow to total debt 4 1 1 6 4
Activity
Fixed asset turnover 4 3 2 9 1 Total asset turnover 4 2 1 7 2 Current asset turnover 4 1 1 6 3
Other
Outpatient mix 4 4 3 11 1 Average daily census 4 4 3 11 1 Patient deductions 4 3.5 3 10.5 3 Average age of plant 4 3 3 10 4 FTEs per adjusted occupied bed 4 3 3 10 4 Medicare inpatient revenue / Medicare patient days
4 3 3 10 4
Outpatient payer mix 4 3 3 10 4 Medicare outpatient cost to charge ratio
4 3 3 10 4
Inpatient payer mix 4 3 3 10 4 Medicare case-mix 1 4 3 8 10 Average length of stay 4 2 2 8 10 Expense per discharge 4 2 2 8 10 Salaries, wages, and benefits as a percent of expenses
3 2 2 7 13
Occupancy rate 4 1 1 6 14 Scale 1. Very unfeasible, unimportant or not useful 2. Somewhat unfeasible, unimportant or not useful 3. Somewhat feasible, important, or useful 4. Very feasible, important, or useful
12

After extensive debate and consideration, the TAG decided to retain 13 of the 37 most
frequently used indicators. However, the TAG believed that the 13 did not capture some
important attributes of CAH financial management. At this point of the indicator selection
process, the research value and importance of the professional experience and expertise of the
TAG members was particularly evident. Their knowledge of the operating reality of CAHs - low
volumes, the impact of swing beds, and effects of payer mix, for example - led to consideration
of indicators that were included among the 77 less frequently used indicators that had been
eliminated by the research team. From these indicators, seven were selected that the TAG was
confident would be feasible, important and useful to CAH managers and boards. In the end, the
TAG selected 20 indicators that included 13 of the 37 most frequently used indicators and seven
of the 77 less frequently used indicators, although the precise definitions of seven indicators
were slightly modified to be more relevant for CAHs.
The final 20 indicators forced revisiting the five original performance dimensions of
profitability, liquidity, capital structure, activity, and other. Among the final 20 indicators, there
were traditional measures of profitability, liquidity and capital structure, so these performance
dimensions were retained. However, the activity and other performance dimensions were
dropped and three new ones created: revenue, cost, and utilization. The final performance
dimensions were defined as follows:
• Profitability indicators measure the ability of an organization to generate the financial return
required to replace assets, meet increases in service demands, and compensate investors (in
the case of a for-profit organization).
• Liquidity indicators measure the ability of an organization to meet its cash obligations in a
timely manner.
13

• Capital structure indicators measure the extent to which an organization uses debt and
equity financing.
• Revenue indicators measure the amount and mix of different sources of revenue.
• Cost indicators measure the amount and mix of different types of costs.
• Utilization indicators measure the extent to which fixed assets (beds) are fully occupied.
The 20 indicators are fairly evenly distributed across the six performance dimensions,
with the exception of the dimension entitled “revenue” in which there are relatively more
indicators assigned.
Step 6: Definition of indicators using the Medicare Cost Report accounts
The production of actual indicator values requires detailed financial data for each CAH.
The TAG considered the feasibility and desirability of various sources of financial data,
including the American Hospital Association database and the Medicare Cost Reports from the
Healthcare Cost Report Information System (HCRIS). After brief deliberation, Medicare Cost
Reports were selected as the data source because they are the only national data that use standard
definitions, have sufficient detail, and will eventually include data for all CAHs. Although lack
of timeliness and data quality concerns were identified, the advantages were deemed to outweigh
the disadvantages.
Each indicator was then defined using the Medicare Cost Report accounts, which proved
to be a complex and time-consuming activity. Carefully thinking about the precise definition of
each indicator, and the appropriate accounts to include in the numerator and denominator was
simple for some indicators, such as the current ratio, and very complicated for others, such as the
14

FTEs per adjusted occupied bed. Table 3 shows the six performance dimensions, 20 indicators,
definitions, and Medicare Cost Report accounts used in the Report.
Table 3. CAH Financial Indicators Report©: Performance Dimensions, Indicators, Definitions, and Medicare Cost Report Accounts* Performance Dimension and Indicator
Definition Medicare Cost Report Accounts
Profitability Total margin Net income/Total revenues Worksheet G-3, Line 31/Worksheet G-3, Line 3 +
25 Cash flow margin ((Net income - (contributions,
investments and appropriations)) + depreciation + interest) / (Net patient revenue + other income -(contributions, investments, and appropriations))
((Worksheet G-3, Line 31 - (Worksheet G-3, Lines 6,7, 23)) + Worksheet A, Lines 1, 2, 3, 4, Column 3 + Worksheet A, Line 88, Column 3)/(Worksheet G-3, Line 3 + Worksheet G-3, Line 25 - (Worksheet G-3, Lines 6, 7, 23))
Return on equity Net income / Fund balance Worksheet G-3, Line 31/(Worksheet G, Line 51, Columns 1, 2, 3, 4)
Liquidity Current ratio Current assets / Current liabilities (Worksheet G, Line 11, Columns 1, 2, 3, 4)/
(Worksheet G, Line 36, Columns 1, 2, 3, 4) Days cash on hand (Cash + marketable securities +
unrestricted investments) / [(Total expenses-depreciation)/Days in period]
(Worksheet G, Lines 1, 2, 22, Columns 1, 2, 3, 4)/ [((Worksheet A, Line 101, Column 3) - Worksheet A, Lines 1, 2, 3, 4, Column 3))/Days in Period]
Net days revenue in accounts receivable
(Net patient accounts receivable) / (Net patient service revenue / Days in period)
(Worksheet G, Line 4 - “absolute value”6, Column1)/((Worksheet G-3, Line 3)/Days in period)
Capital Structure Equity financing Fund balance / Total assets (Worksheet G, Line 51, Columns 1, 2, 3, 4)/
(Worksheet G, Line 27, Columns 1, 2, 3, 4) Debt service coverage*
(Net Income + depreciation + interest) / (Current portion of long-term debt + interest expense)
(Worksheet G-3, Line 31 + Worksheet A, Lines 1, 2, 3, 4, Column 3 + Worksheet A, Line 88, Column 3)/(Worksheet G, Line 31, Columns 1, 2, 3, 4 + Worksheet 8, Line 88, Column 3)
Long-term debt to capitalization
Long-term debt / (Long-term debt + fund balance)
(Worksheet G, Lines 42+31, Columns 1, 2, 3, 4)/(Worksheet G, Lines 42+31, Columns 1, 2, 3, 4 + Worksheet G, Line 51, Columns 1, 2, 3, 4)
Revenue Outpatient revenues to total revenues
Total outpatient revenue / Total patient revenue
Worksheet G-2, Line 25, Column 2/Worksheet G-2, Line 25, Column 3
Patient deductions (Contractual allowances + discounts) / Gross total patient revenue
Worksheet G-3, Line 2/Worksheet G-3, Line 1
Medicare inpatient payer mix
Medicare inpatient days / (Total inpatient days - Nursery bed days - SNF swing bed days)
Worksheet S-3, Part I, Line 12, Column 4/(Worksheet S-3, Part I Line 12 - Line 11 - Line 4, Column 6)
Medicare outpatient payer mix
Outpatient Medicare charges / Total outpatient charges
(Worksheet D, Part V, Title XVII, Hospital Line 104, Columns 2, 3, 4, 5, 5.01, 5.02)/(Worksheet C, Part I, Line 101, Column 7)
15

Medicare outpatient cost to charge
Outpatient Medicare costs / Outpatient Medicare charges
(Worksheet D, Part V, Title XVII, Hospital, Line 104, Columns 6, 7, 8, 9, 9.01, 9.02)/(Worksheet D, Part V, Title XVII, Hospital, Line 104, Columns 2, 3, 4, 5, 5.01, 5.02)
Medicare revenue per day
Medicare revenue / (Medicare days – NF swing bed days)
(Worksheet E-3, Part II, Line 4)/(Worksheet S-3, Part I, Line 12, Column 4 - Worksheet S-3, Part I, Line 3 Column 4)
Cost Salaries to total expenses
Salary expense / Total expenses Worksheet A, Line 101, Column 1/(Worksheet A, Line 101, Column 3)
Average age of plant*
Accumulated depreciation / Annual depreciation expense
(Worksheet G, Lines 12.01, 13.01, 14.01, 15.01, 16.01, 17.01, 18.01, 19.01, Columns 1, 2, 3, 4)/Worksheet A, Lines 1, 2, 3, 4, Column 3
FTEs per adjusted occupied bed
(Number of FTEs / [((Inpatient days - NF swing days - nursery days) * (total patient revenues / (Total inpatient revenue - NF revenue - other LTC revenue))) / Days in period]
(Worksheet S-3, Part 1, Line 25, Column 10)/[((Worksheet S-3, Part I, Line 12, Column 6 -Line 4 - Line 11)*(Worksheet G-2, Part I, Line 25, Column 3)/(Worksheet G-2, Part I, Line 25, Column 1 - Worksheet G-2, Part I, Line 7, Column 1 - Worksheet G-2, Part I, Line 8, Column 1)))/Days in period]
Utilization Average daily census swing-SNF beds
Inpatient swing bed SNF days / Days in period
Worksheet S-3, Part I, Line 3, Column 6/Days in period
Average daily census acute beds
Inpatient acute care bed days / Days in period
Worksheet S-3, Part, Line 12 - (Lines 3 + 4 + 11), Column 6/Days in period
* © 2005, The University of North Carolina at Chapel Hill, for use in the public domain. Minor adjustments will be made to the definition and Medicare Cost Report accounts in the next version of the CAH Financial Indicators Report© to be issued in Summer 2005
Step 7: Analysis of data
The research team developed a computer program that produces, organizes, and analyses
the indicator values for individual CAHs using data from Medicare Cost Reports. Descriptive
statistics, histograms and scatterplots were used to verify programming accuracy. After
eliminating probable programming errors, results showed that there were some obvious data
quality problems, such as hospitals reporting zero total patient charges, negative patient
deductions, negative current assets, and zero age of plant. From a theoretical standpoint, these
numbers were highly unlikely or impossible and reaffirmed a research objective held by the
research team since the beginning of the project – to encourage improved data quality in
Medicare Cost Reports.
16
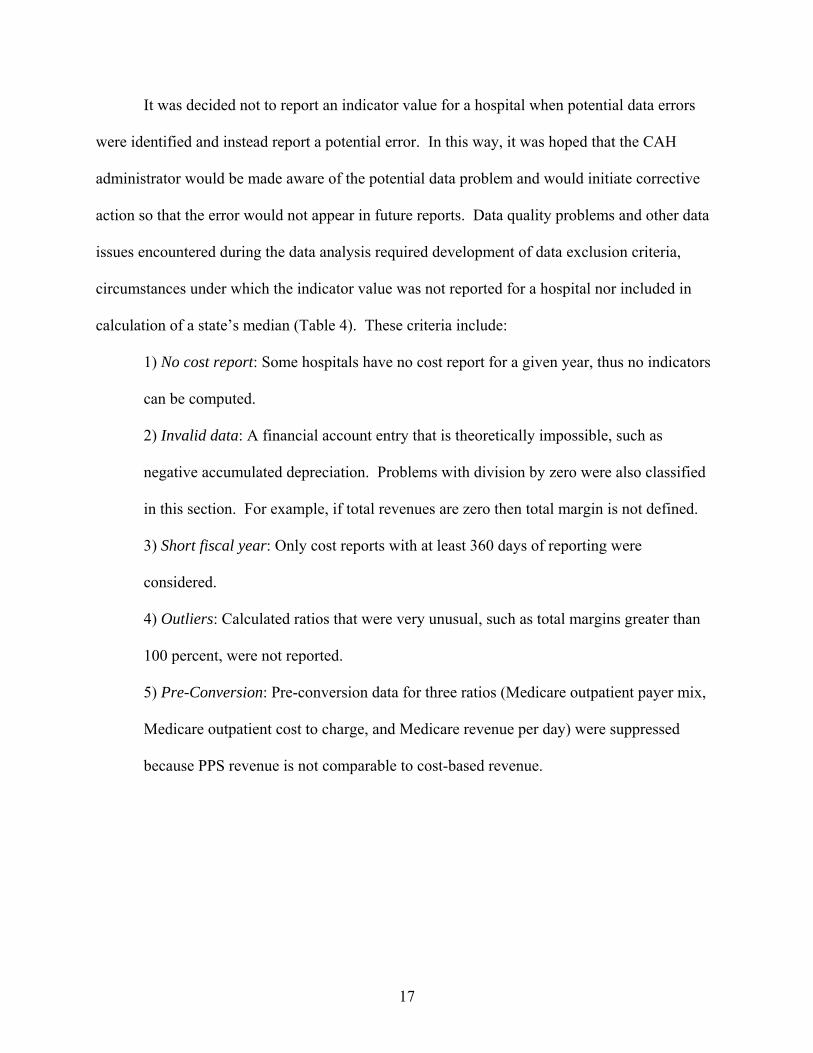
It was decided not to report an indicator value for a hospital when potential data errors
were identified and instead report a potential error. In this way, it was hoped that the CAH
administrator would be made aware of the potential data problem and would initiate corrective
action so that the error would not appear in future reports. Data quality problems and other data
issues encountered during the data analysis required development of data exclusion criteria,
circumstances under which the indicator value was not reported for a hospital nor included in
calculation of a state’s median (Table 4). These criteria include:
1) No cost report: Some hospitals have no cost report for a given year, thus no indicators
can be computed.
2) Invalid data: A financial account entry that is theoretically impossible, such as
negative accumulated depreciation. Problems with division by zero were also classified
in this section. For example, if total revenues are zero then total margin is not defined.
3) Short fiscal year: Only cost reports with at least 360 days of reporting were
considered.
4) Outliers: Calculated ratios that were very unusual, such as total margins greater than
100 percent, were not reported.
5) Pre-Conversion: Pre-conversion data for three ratios (Medicare outpatient payer mix,
Medicare outpatient cost to charge, and Medicare revenue per day) were suppressed
because PPS revenue is not comparable to cost-based revenue.
17

Table 4. CAH Financial Indicators Report©: Data Quality / Exclusion Criteria Performance Dimension and Indicator
Data Quality / Exclusion Criteria
Profitability Total margin Hospitals with total revenues of zero were excluded from calculation of medians. Cash flow margin There may be variations in non-cash items included in net income. Hospitals whose
net patient revenue, other income, and contributions, investments and appropriations sum to zero were excluded from the calculation of medians.
Return on equity The real equity of a hospital may not be reflected in its fund balance if it is part of a larger system. Hospitals with a fund balance of $1 or less were excluded from the calculation of medians.
Liquidity Current ratio There may be variations in the classification of investments as either current or long-
term. Hospitals with negative current assets or negative current liabilities were excluded from the calculation of medians.
Days cash on hand Hospitals with negative days cash on hand were excluded from the calculation of medians, as were those with total expenses of zero. It is possible that worksheet G, columns 1-4, line 22 could include donor restricted, trustee restricted or board designated investments.
Net days revenue in accounts receivable
Hospitals with negative net days revenue in accounts receivable and those with net patient service revenue of zero were excluded from the calculation of medians.
Capital structure Equity financing The real equity of a hospital may not be reflected in its fund balance if it is part of a
larger system. Hospitals with a fund balance of $1 or less were excluded from the calculation of medians.
Debt service coverage Hospitals with no current portion of long-term debt and no interest expense were excluded from the calculation of medians.
Long-term debt to capitalization
Other long-term liabilities may include some items that do not relate to debt, such as deferred compensation. The real equity of a hospital may not be reflected in its fund balance if it is part of a larger system. Hospitals with a fund balance of $1 or less were excluded from the calculation of medians.
Revenue Outpatient revenues to total revenues
Hospitals with zero total patient charges were excluded from the calculation of medians.
Patient deductions Hospitals with zero total patient charges were excluded from the calculation of medians, as were those with patient deductions of zero or less.
Medicare inpatient payer mix
Hospitals with zero total inpatient days were excluded from the calculation of medians.
Medicare outpatient payer mix
Hospitals with zero total outpatient charges were excluded from the calculation of medians. Pre-conversion data was suppressed because PPS revenue may not be comparable to cost-based revenue as disclosed on the Medicare cost reports.
Medicare outpatient cost to charge
Hospitals in states with rate regulation may have higher values than those hospitals in non-rate regulated states. Hospitals with Medicare outpatient charges of zero were excluded from the calculation of medians. Pre-conversion data was suppressed because PPS revenue may not be comparable to cost-based revenue as disclosed on the Medicare cost reports.
Medicare revenue per day
Hospitals where all Medicare days were SNF swing bed days were excluded from the calculation of medians. Pre-conversion data was suppressed because PPS revenue may not be comparable to cost-based revenue as disclosed on the Medicare cost reports.
Cost Salaries to total expenses Hospitals with zero total expenses were excluded from the calculation of medians. Average age of plant Hospitals with average age of plant of zero or less and those with depreciation
18

expense of zero were excluded from the calculation of medians. FTEs per adjusted occupied bed
Hospitals with total inpatient revenues of zero were excluded from the calculation of medians.
Utilization
Average daily census swing- SNF beds
Hospitals that were not licensed to maintain swing beds were excluded from the calculation of the medians.
Average daily census acute beds
There were no exclusion criteria for this indicator.
Throughout the data analysis, the TAG was extensively consulted. Several
teleconference calls were held to discuss the validity of the indicator definitions, outliers, and
data quality problems. After resolution of these problems, the TAG reviewed the data analysis,
including tabular and graphical presentation of values for each indicator. From their knowledge
of the operating reality of CAHs, the TAG hypothesized that indicator values for CAHs with
long-term care may differ from those for CAHs without long-term care and subsequent testing of
this hypothesis confirmed this difference. Therefore, two peer groups of CAHs were created and
national median values were produced for CAHs with and without long-term care.
Step 8: Selection of presentation format
After all of the data problems were addressed and indicator values had been produced,
the research team turned to presentation of the data. Several presentation principles were
established: the name of the CAH should appear on the cover page to inform the reader that the
report includes results specifically for their hospital; the report overview should be in the form of
an executive summary; details about the method should be kept to a minimum and located in an
appendix; all of the information about an indicator should be on one page so readers would not
have to search for information; indicators should be defined in both words and Medicare Cost
Report accounts; results over time should be simply displayed in a graph with no more than three
19

lines and in a table; no data should appear in the graph that do not also appear in the table, and
vice versa; an interpretation of the indicator and a brief summary of results over time and for
CAHs with and without long-term care should be provided; and data quality and exclusion
criteria should be explicitly stated to assist the reader in assessing robustness of the data.
Alternative presentation formats were considered and a draft of the Report was produced.
Step 9: Pilot testing
Two pilot tests were conducted to ensure the accuracy of our calculations. First, each
member of the TAG selected some of their own CAH clients that represented a cross-section of
CAHs. We compared our calculated financial indicators with those independently calculated by
the TAG member. Second, two CAH Chief Financial Officers with high levels of expertise were
selected to preview the draft CAH Financial Indicators Report©. These individuals provided
valuable feedback about the presentation and user-friendliness of the data and suggestions for
future reports. No significant problems with the indicators were identified. Suggested changes
in presentation were made and the final version of the Report was produced.
As an additional check on the accuracy of the calculations, we created a spreadsheet-
based calculator that individual hospital administrators could use. This spreadsheet calculates
the financial indicators based on values for specific Medicare Cost Report account codes entered
by the user. Thus, the indicator values we produced by the statistical packages could be
compared with values obtained using the independently created spreadsheet program. The
values for roughly 20 randomly chosen CAHs were reconciled and it was concluded that the
calculations were consistent and accurate.
20
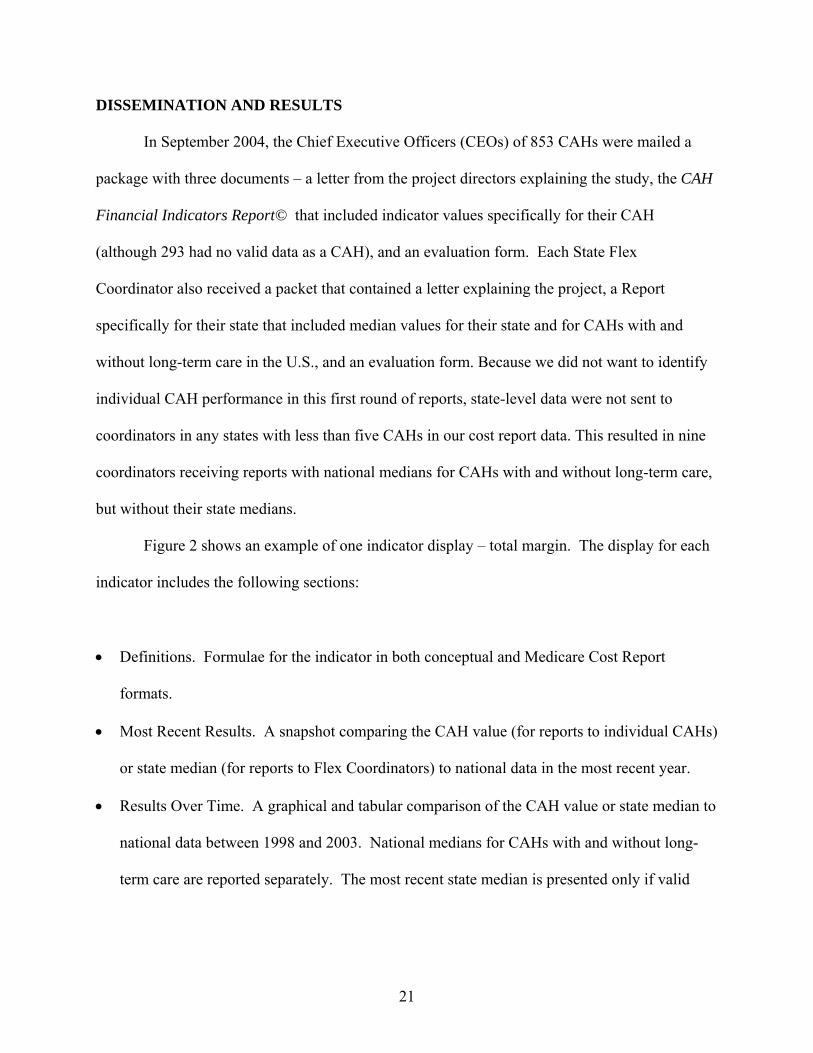
DISSEMINATION AND RESULTS
In September 2004, the Chief Executive Officers (CEOs) of 853 CAHs were mailed a
package with three documents – a letter from the project directors explaining the study, the CAH
Financial Indicators Report© that included indicator values specifically for their CAH
(although 293 had no valid data as a CAH), and an evaluation form. Each State Flex
Coordinator also received a packet that contained a letter explaining the project, a Report
specifically for their state that included median values for their state and for CAHs with and
without long-term care in the U.S., and an evaluation form. Because we did not want to identify
individual CAH performance in this first round of reports, state-level data were not sent to
coordinators in any states with less than five CAHs in our cost report data. This resulted in nine
coordinators receiving reports with national medians for CAHs with and without long-term care,
but without their state medians.
Figure 2 shows an example of one indicator display – total margin. The display for each
indicator includes the following sections:
• Definitions. Formulae for the indicator in both conceptual and Medicare Cost Report
formats.
• Most Recent Results. A snapshot comparing the CAH value (for reports to individual CAHs)
or state median (for reports to Flex Coordinators) to national data in the most recent year.
• Results Over Time. A graphical and tabular comparison of the CAH value or state median to
national data between 1998 and 2003. National medians for CAHs with and without long-
term care are reported separately. The most recent state median is presented only if valid
21

data for five or more CAHs were available. Missing indicator values are coded and an
explanation provided beneath the table.
• Interpretation. A description of the indicator and an overview of national trends over the past
few years.
• Data Quality / Exclusion Criteria. Identification of potential data quality problems and a
description of the rules that were used to decide whether an indicator is presented.
Figure 2: Example indicator display
The 1998-2003 national median values for each indicator included in the CAH Financial
Indicators Report© are shown in Table 5.
22

Table 5: CAH Financial Indicators Report©: Indicator Medians, 1998-2003 Performance Dimension and Indicator 1998 1999 2000 2001 2002 2003 Profitability
Total margin .15 -.81 -2.37 .95 3.16 2.33 Cash flow margin -1.63 -3.10 -1.79 2.55 5.06 3.12 Return on equity 1.46 -.78 -3.94 3.28 7.15 5.72
Liquidity Current ratio 1.78 1.95 1.56 2.03 2.05 1.90 Days cash on hand 29.66 45.95 22.15 34.40 45.22 41.74 Net days revenue in accounts receivable 69.96 63.96 62.67 62.18 61.60 59.31
Capital structure Equity financing 65.05 63.03 63.45 61.89 63.86 62.99 Debt service coverage 1.31 .36 1.16 2.35 3.02 2.77 Long-term debt to capitalization 16.60 17.27 12.06 21.04 20.67 20.65
Revenue Outpatient revenue to total revenue .72 .70 .65 .60 .57 .57 Patient deductions 16.85 17.38 18.55 20.12 22.28 23.40 Medicare Inpatient payer mix 87.38 86.21 83.79 80.82 78.71 78.86 Medicare outpatient payer mix 34.90 38.14 40.60 40.00 38.57 37.38 Medicare outpatient cost to charge 48.34 47.87 54.01 58.60 60.22 60.35 Medicare revenue per day 1427.80 1448.51 1428.20 1333.89 1247.62 1283.98
Cost Salaries to total expenses 52.31 50.70 49.28 47.67 45.90 45.65 Average age of plant 14.99 15.50 12.43 12.29 11.64 12.32 FTEs per adjusted occupied bed 6.76 7.94 7.38 6.63 6.20 6.17
Utilization Average daily census swing-SNF beds 1.12 1.04 1.02 1.18 1.35 1.51 Average daily census acute beds 1.05 1.15 1.62 2.19 2.81 2.87
Number of reporting CAHs 31 62 211 424 633 260 CAH Financial Indicator Calculator, ©2005, The University of North Carolina at Chapel Hill, for use in the public domain.
In forming a dissemination strategy, the research team decided to directly confront two
weaknesses of the Medicare Cost Report data – lack of timeliness and data quality problems. An
Excel® spreadsheet called the CAH Financial Indicator Calculator© was created. This easy-to-
use spreadsheet calculates all of the indicator values included in the Report. Every Medicare
Cost Report account that is used in the calculation of indicators is listed in the order in which
they appear in the Cost Report. When a value for each account is entered in the designated cell,
the spreadsheet automatically calculates the associated indicator values. No creation of formulae
23

is required, just simple entry of data already reported in the Medicare Cost Reports. This can be
done for any CAH for any year that data are available, including data that are more recent than
those included in the hospital-specific Report distributed to CAH administrators in Summer
2004.
It is hoped that the CAH Financial Indicator Calculator© at least partially addresses
weaknesses of the Medicare Cost Report data in two ways. First, it helps to identify data quality
problems, particularly for CAHs with missing values for many indicators in their Report. The
spreadsheet allows the CAH administrators to explore the reasons for the missing data and
provides an independent check on the calculations performed by the research team. Second, it
allows administrators to calculate more timely indicator values when data are available to them
but are not yet part of the publicly available Medicare Cost Report data files. Because there is
often a substantial delay between the closing of the fiscal year and inclusion of data in the
publicly released Medicare cost reports, the data accessible to the research team were not as
timely as the data to which individual administrators have access.
In the letter sent to the CEOs in Summer 2004, the CAH Financial Indicator Calculator©
was described. Instructions on how to obtain a copy of the spreadsheet, as well as an electronic
file of the Report for their hospital, were provided. As of March 1, 2005, 56 requests for the
CAH Financial Indicator Calculator and 53 requests for the electronic files of specific reports
had been received.
EVALUATION
Included in the information package sent to the CEOs of CAHs and the State Flex
Coordinators in Summer 2004 was an evaluation form that asked recipients to provide feedback
24
about the overall usefulness of the CAH Financial Indicators Report©, to rank the usefulness of
each individual indicator, to suggest any needed changes to the indicator formulae, to suggest
any indicators not included in the proposed set of 20, and to identify possible peer groups.
Recipients were asked to return the evaluation form by mail or fax.
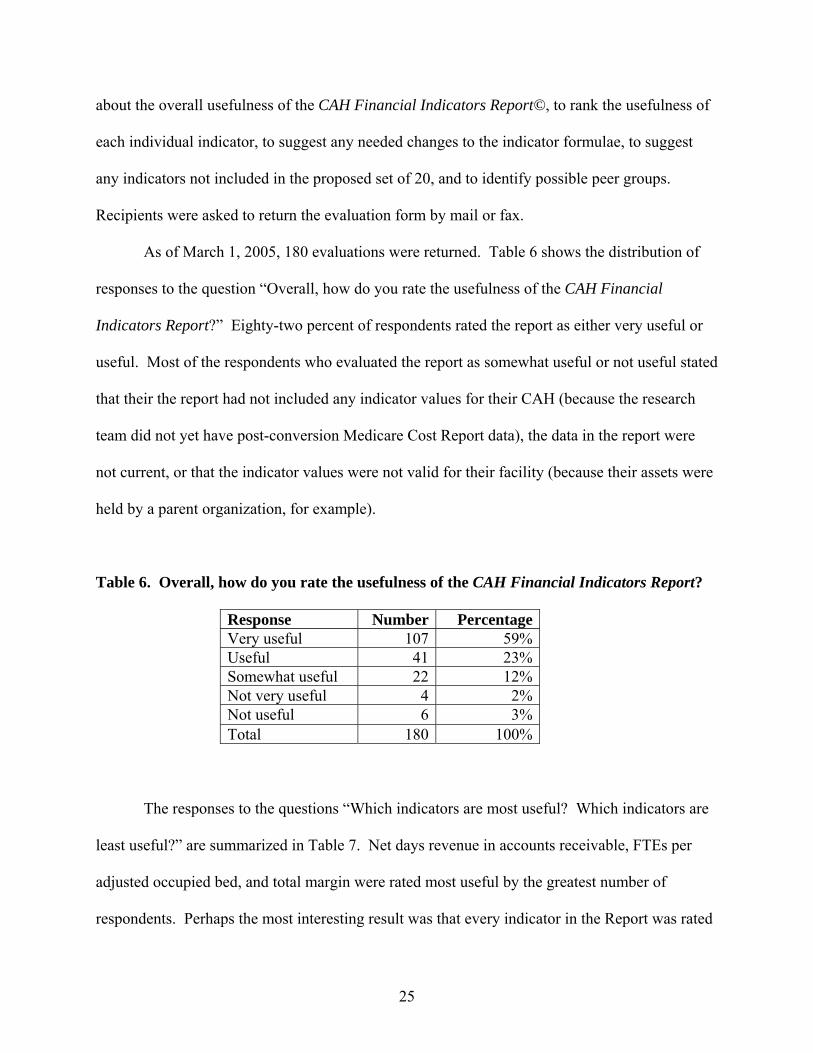
As of March 1, 2005, 180 evaluations were returned. Table 6 shows the distribution of
responses to the question “Overall, how do you rate the usefulness of the CAH Financial
Indicators Report?” Eighty-two percent of respondents rated the report as either very useful or
useful. Most of the respondents who evaluated the report as somewhat useful or not useful stated
that their the report had not included any indicator values for their CAH (because the research
team did not yet have post-conversion Medicare Cost Report data), the data in the report were
not current, or that the indicator values were not valid for their facility (because their assets were
held by a parent organization, for example).
Table 6. Overall, how do you rate the usefulness of the CAH Financial Indicators Report?
Response Number PercentageVery useful 107 59%Useful 41 23%Somewhat useful 22 12%Not very useful 4 2%Not useful 6 3%Total 180 100%
The responses to the questions “Which indicators are most useful? Which indicators are
least useful?” are summarized in Table 7. Net days revenue in accounts receivable, FTEs per
adjusted occupied bed, and total margin were rated most useful by the greatest number of
respondents. Perhaps the most interesting result was that every indicator in the Report was rated
25

most useful by a substantial number of respondents and least useful by only a few respondents.
Most respondents considered most of the indicators to be useful.
Table 7: Which indicators are most useful? Which indicators are least useful?
Performance Dimension and Indicator Most Useful (%) Least Useful (%) Profitability
Total margin 95 7Cash flow margin 94 4Return on equity 75 12
Liquidity Current ratio 81 5Days cash on hand 89 5Net days revenue in accounts receivable 99 5
Capital structure Equity financing 67 16Debt service coverage 71 16Long-term debt to capitalization 69 14
Revenue Outpatient revenues to total revenues 80 3Patient deductions 78 8Medicare inpatient payer mix 89 8Medicare outpatient payer mix 83 9Medicare outpatient cost to charge 79 7Medicare revenue per day 77 11
Cost Salaries to total expenses 89 8Average age of plant 73 20FTEs per adjusted occupied bed 96 10
Utilization Average daily census - swing/SNF beds 73 12Average daily census - acute beds 71 8
Many comments about the CAH Financial Indicators Report© were provided by
respondents. All comments from the evaluations were categorized and their content analyzed in
a report that was distributed to the TAG. Many of the suggestions for change will be
incorporated in future reports.
26

CONCLUSION
The CAH Financial Indicators Report© is an attempt to provide CAH administrators
with a set of comparative financial indicators designed specifically for these small, Medicare
cost-based reimbursed hospitals. The Report is a genuine collaboration between a university-
based research team and practitioners with experience and expertise in the financial management
of CAHs. Together both parties worked to produce financial indicators that CAH boards and
management can use to improve the financial management of their organizations.
Limitations
The CAH Financial Indicators Report© has several limitations:
• Use of historical data. Indicators values reflect the results of past decisions and may not be
predictive of future results.
• Variations in CAH service mix. Among CAHs there is significant variation in the volume
and types of services provided, including physician clinics, home health services, wellness
centers, and diagnostic and treatment technology. Differences in indicator values across
facilities may reflect variation in service mix.
• No consensus about good performance. For many of the indicators in the report, there are no
ranges of values that are generally accepted to be “good performance” or “bad performance”.
• Data quality concerns. There are reporting variations and other data quality concerns that
affect the validity of the indicators. It is hoped that the dissemination of indicators that use
data from Medicare Cost Reports will make administrators aware of data quality problems,
which could lead to better data in the future.
27

Next Steps
The consensus of the TAG, coupled with positive feedback from CAH administrators,
gives the research team confidence that the 20 indicators in the Report represent a reasonable and
appropriate mechanism for portraying the financial performance of CAHs. Therefore, using the
same set of indicators, a 2005 CAH Financial Indicators Report will be produced in the summer
of 2005. In addition to the content included in the 2004 report, there will be more discussion of
results, state medians over time, additional data displays, and median data for peer groups that
potentially include: CAHs with and without long-term care (as before), groupings by total
revenue, government and non-government ownership, and with and without a provider based
rural health clinic. CAH CEOs will each receive the 2005 Report with data specific to their
institution, and State Flex Coordinators will receive Reports for each CAH in their state. The
addition of another year of cost report data will provide a longer comparison period, and will
also result in the availability of post-conversion data for a larger number of facilities.
28
REFERENCES 1. American Hospital Association. AHD.com American Hospital Directory, accessed from
http://www.ahd.com. Indicators; 2004 Jan. 2. Bazzoli G, Andes S. Consequences of hospital financial distress. Hospital and Health Services
Administration. 1995;40(4):472-95. 3. Bazzoli GJ, Chan B, Shortell SM, D'Aunno T. The financial performance of hospitals belonging
to health networks and systems. Inquiry. 2000;37(3):234-52. 4. Bazzoli GJ, Cleverley WO. Hospital bankruptcies: an exploration of potential causes and
consequences. Health Care Management Review. 1994;19(3):41-51. 5. Carpenter CE. Determinants of hospital tax-exempt debt yields: corrections for selection and
simultaneous equation bias. Health Services Research 27(5) December 1992:695-713. 6. Carpenter CE, McCue MJ, Hossack JB. Association of bond, market, operational, and financial
factors with multi-hospital system bond issues. Journal of Health Care Finance. 2001;28(2):26-34.
7. Center for Healthcare Industry Performance Studies. CHIPS 2000 Almanac of Hospital
Finanical and Operating Indicators. 8. Chan B, Feldman R, Manning WG. The effects of group size and group economic factors on
collaboration: a study of the financial performance of rural hospitals in consortia. Health Services Research. 1999 Apr;34(1 Pt 1):9-31.
9. Chu DK, Zollinger TW, Kelly AS, Saywell RM. An empirical analysis of cash flow, working
capital, and the stability of financial ratio groups in the hospital industry. Journal of Accounting and Public Policy. 1991;10(1):39-58.
10. Clement JP, D’Aunno TA, Poyzer BM. Hospital corporate restructuring and financial
performance. Medical Care. 1993 Nov;31(11)(a): 975-988. 11. Clement JP, D’Aunno TA, Poyzer BM. The financial performance of diversified hospital
subsidiaries. Health Services Research. 1993 Feb;27(6)(b):741-763. 12. Clement JP, McCue MJ, Luke RD, Bramble JD, Rossiter LF, Ozcan YA, Pai CW. Strategic
hospital alliances: impact on financial performance. Health Affairs. 1997;16(6): 193-203. 13. Cleverley WO. Improving financial performance: a study of 50 hospitals. Hospital and Health
Services Administration. 1990;35(2):173-87.
29
14. Cleverley WO, Harvey RK. Does hospital financial performance measure up? Healthcare Financial Management. 1992 May;46(5)(a):20-4, 26.
15. Cleverley WO. Financial and operating performance of systems: voluntary versus investor-
owned. Topics in Health Care Financing. 1992. 18(4): 16. Cleverley WO. Economic value added--a framework for health care executive compensation.
Hospital and Health Services Administration. 1993;38(2):215-28. 17. Cleverly WO. Understanding your hospital's true financial position and changing it. Health Care
Management Review. 1995;20(2):62-73. 18. Cleverley WO. The hospital cost index: a new way to assess relative cost-efficiency. Healthcare
Financial Management. 2002 Jul;56(7):36-42. 19. Data Advantage Corp., Hospital Financial Profile Report, accessed from http://www.data-
advantage.com/products/financial.asp, on March 1, 2005. 20. Dobson A, Koenig L, Sen N, Ho S, Gilani J. Financial Performance of Academic Health Center
Hospitals, 1994-2000. Commonwealth Fund Report 543, September 2002. 21. Ehreht JL. The development and evaluation of hospital performance measures for policy
analysis. Medical Care. 1994 June; 32(6): 568-87. 22. FITCH, 2004 Median Ratios for Nonprofit Hospitals and Health Care Systems, accessed from
http://www.fitchratings.com/corporate/search/results.cfm, on March 1, 2005. 23. Franco, SJ. (1999). Implications of the BBA for Rural Hospitals. Working Paper. Bethesda,
The Project HOPE Walsh Center for Rural Health Analysis. 24. Gapenski LC. Using MVA and EVA to measure financial performance. Healthcare Financial
Management. 1996 Mar;50(3):56, 58, 60. 25. Gapenski LC, Vogel WB, Langland-Orban B. The determinants of hospital profitability.
Hospital and Health Services Administration. 1993;38(1):63-80. 26. Gardiner LR, Oswald SL, Jahera JS Jr. Prediction of hospital failure: a post-PPS analysis.
Hospital and Health Services Administration. 1996;41(4):441-60. 27. Gautam K, Campbell C, Arrington B. Financial performance of safety-net hospitals in a
changing health care environment. Health Services Management Research. 1996 Aug; 9(3): 156-71.
28. Gertler, P. J. and D. M. Waldman. Quality-adjusted cost functions and policy evaluation in
the nursing home industry. Journal of Political Economy. 1992;100(6): 1232-56.
30
29. Goes JB, Zhan C. The effects of hospital-physician integration strategies on hospital financial performance. Health Services Research. 1995 Oct;30(4):507-530.
30. Hadley, J., K. Nair, et al. Hospital closures, financial status, and access to care: A rural and
urban analysis, Center for Health Policy Studies; Georgetown University. 1992. 31. Harkey, J. and R. Vraciu. Quality of health care and financial performance: Is there a link?.
Health Care Management Review. 1992;17(4): 55. 32. HCIA-Sachs. 100 Top Hospitals: Benchmarks for Success. 2000. 33. HospitalBenchmarks.com, 2006 Almanac of Hospital Financial and Operating Indicators,
accessed from http://www.hospitalbenchmarks.com/default.asp, March 1, 2005. 34. Ingenix, Financial Analysis Service / Strategic Operating Indicator Service, accessed from
http://www.ingenix.com/esg/products.php?pid=314, on March 1, 2005. 35. Kane NM. Hospital profits, a misleading measure of financial health. Journal of American
Health Policy. 1991 Jul-Aug;1(1):27-35. 36. Kuhn, E. M., A. J. Hartz, et al. The relationship of hospital characteristics and the results of
peer review in six large states. Medical Care. 1991;29(10): 1028-1037. 37. Langland-Orban B, Gapenski LC, Vogel WB. Differences in characteristics of hospitals with
sustained high and sustained low profitability. Hospital and Health Services Administration. 1996;41(3):385-99.
38. Levitt SW. Quality of care and investment in property, plant, and equipment in hospitals. Health
Services Research. 1994 Feb;28(6):713-727. 39. Li LX, Collier DA. The role of technology and quality on hospital financial performance: An
exploratory analysis. International J Service Industry Management. 2000;11(3);202-224. 40. Lynch JR, McCue MJ. The effects of for-profit multihospital system ownership on hospital
financial and operating performance. Health Services Management Research. 1990 Nov;3(3): 182-192.
41. Lynn ML, Wertheim P. Key financial ratios can foretell hospital closures. Healthcare Financial
Management. 1993 Nov;47(11):66-70. 42. McCue MJ. The use of cash flow to analyze financial distress in California hospitals. Hospital
and Health Services Administration. 1991;36(2):223-41(a). 43. McCue MJ. Bed size and system influence on financial structure: a time-series and cross-
sectional analysis of California hospitals. Health Services Management Research. 1991 Nov;4(3):206-215(b).
31

44. McCue MJ. Association of HMO penetration and other credit quality factors with tax-exempt
bond yields. Inquiry. 1997;34(3): 217-227. 45. McCue MJ, Renn SC, Pillari GD. Factors affecting credit rating downgrades of hospital revenue
bonds. Inquiry. 1990;27(3):242-54. 46. McCue MJ, Clement JP. Characteristics of the divested HCA and AMI hospitals. Medical Care.
1992 April;30(4): 360-372. 47. McCue MJ, Ozcan YA. Determinants of capital structure. Hospital & Health Services
Administration. 1992;37(3):333-346. 48. McCue MJ, Clement JP, Hoerger TJ. The association of ownership and system affiliation with
the financial performance of inpatient psychiatric hospitals. Inquiry. 1993;30(3):306-317. 49. McCue MJ, Clement JP. Assessing the characteristics of hospital bond defaults. Medical Care.
1996 Nov;34(11):1121-34. 50. McCue, M. J., N. McCall, et al. Financial performance and participation in Medicaid and
Medi-Cal managed care. Health Care Finance Review. 2001;23(2): 69-81. 51. McCue MJ, Thompson JM, Dodd-McCue D. Association of market, mission, operational, and
financial factors with hospitals' level of cash and security investments. Inquiry. 2000-01;37(4):411-22.
52. McCue MJ, Thompson JM. Association of ownership and system affiliation with the financial
performance of rehabilitation hospitals. Health Services Management Research. 1997 Feb;10(1):13-23.
53. Menke TJ. The effect of chain membership on hospital costs. Health Services Research. 1997
June;32(2):177-196. 54. Moody’s Investors Service, Not-for-Profit Health Care Medians, accessed from
http://www.moodys.com/cust/default.asp, on March 1, 2005. 55. Nauenberg E, Brewer CS, Basu K, Bliss MK, Osborne JW. Network structure and hospital
financial performance in New York State: 1991-1995. Medical Care Research and Review. 1999 Dec;56(4):415-39.
56. Nelson, E., R. Rust, et al. Do patient perceptions of quality relate to hospital financial
performance? Journal of Health Care Mark. 1992;12(4): 6-13. 57. Oswald S, Gardiner L, Jahera J Jr. Indicators of hospital closure under PPS and Blue Cross/Blue
Shield cost-based reimbursements. Journal of Hospital Marketing. 1992;6(2):149-82.
32

58. Ozcan YA, McCue MJ. Development of a financial performance index for hospitals: DEA approach. Journal of Operational Research Society. 1996;47(1):18-26.
59. Prince TR. Assessing financial outcomes of not-for-profit community hospitals. Hospital &
Health Services Administration. 1991;36(3):331-349. 60. Prince TR, Ramanan R. Bond ratings, debt insurance, and hospital operating performance.
Health Care Management Rev. 1994;19(1):64-73. 61. Rizzo, J.A. Has Medicare been a "bad deal" for rural hospitals? Journal of Rural Health.
1991;7(5):599-617. 62. Schoenman, JA, C. M. Cheng, et al. Do hospital-based rural health clinics improve the
performance of the parent hospitals? Washington DC, The Project HOPE Walsh Center for Rural Health Analysis. 1999.
63. Sear, AM. Operating characteristics and comparative performance of investor-owned
multihospital systems. Hospital and Health Services Administration. 1992;37(3): 403-15.
64. Shukla RK, Pestian P, Clement J. A comparative analysis of revenue and cost-management strategies of not-for-profit and for-profit hospitals. Hospital and Health Services Administration. 1997;42(1):117-134.
65. Solucient. The Comparative Performance of U.S. Hospitals: 2004 Sourcebook, accessed from
http://solucient.ecnext.com/coms2/page_cpush2002_description, on March 1, 2005. 66. Tennyson DH, Fottler MD. Does system membership enhance financial performance in
hospitals? Medical Care Research Review. 2000 Mar;57(1):29-50. 67. Vogel WB, Langland-Orban B, Gapenski LC. Factors influencing high and low profitability
among hospitals. Health Care Management Review. 1993;18(2):15-26. 68. Watkins AL. Hospital financial ratio classification patterns revisited: Upon considering
nonfinancial information. Journal of Accounting and Public Policy. 2000;19(1):73-95. 69. Wedig GJ, Hassan M, Morrissey MA. Tax-exempt debt and the capital structure of nonprofit
organizations: an application to hospitals. Journal of Finance. 1996 Sep;51(4):1247-1283. 70. Wedig GJ, Hassan M, Van Horn RL, Morrissey MA. Hospital affiliation and capital structure:
how will capital markets guide health care restructuring? Journal of Public Budgeting, Accounting and Financial Management. 1998;10(3):413-440.
71. Williams, D. and J. Pettengill. The role of profitability and community characteristics in
hospital closure an urban and rural analysis. Washington DC, Prospective Payment Assessment Commission. 1991.
33

72. Younis M, Rice J, Barkoulas J. An empirical investigation of hospital profitability in the post-PPS era. Journal of Health Care Finance. 2001;28(2):65-73.
73. Zeller TL, Stanko BB, Cleverley WO. A new perspective on hospital financial ratio analysis.
Healthcare Financial Management. 1997 Nov;51(11):62-66. 74. Zeller TL, Stanko BB, Cleverley WO. A revised classification pattern of hospital financial ratios.
Journal of Accounting and Public Policy. 1996;15(2):161-181. 75. Zeller TL, Stanko BB. Hospital industry cash flow ratio analysis: a sufficiency and efficiency
perspective. Hospital Cost Management and Accounting. 1997 Jan;8(10):5-8.
34