financial inclusion measurement for regulators
TRANSCRIPT

Data Working Group21-22 June 2010, Kuala Lumpur, Malaysia
Financial Inclusion measurement for regulators

2
2) Defining & measuring financial inclusion
3) Selecting the appropriate approach
1) Understanding the rationale and scope
To create a common framework of understanding of the issues and choices surrounding the measurement of financial inclusion

Rationale: Why measure financial inclusion?

Questions which data can answer
Category
Questions one may ask of the data
Decisions taken based on the data
One time financial access data
Internationally comparable data
Data collected over time
Data designed to show causality
Dia
gnos
is
Which population segment lacks what type of financial services?
- Targeted regulation- Further research / deeper survey
X
Why do they lack access?- Begin to identify barriers to formulate policy X
How much use takes place from informal / unregulated services?
- Begin to identify at risk consumers X
Is there evidence of consumer abuse?
-Targeted regulation X

Questions which data can answer (2)
Category
Questions one may ask of the data
Decisions taken based on the data
One time financial access data
Internationally comparable data
Data collected over time
Data designed to show causality
Polic
y&
regu
lato
ry re
form
How does country X compare to a peer group? (by regional or level of income)
- Whether any reform or action is required
X
What targets for access can be measured credibly?
- Choice of targets X X X
Is inclusion and protection improving over time?
- Targeted regulation X
Mon
itori
ng What has been the impact of a particular regulatory change?
- Modification of regulation
X X

6
2) Defining and measuring financial inclusion
3) Selecting the appropriate approach
1) Understanding the rationale and scope
To create a common framework of understanding of the issues and choices surrounding the measurement of financial inclusion

Financial inclusion goals need clear definition to be measurable
UNCDF - Vision of Inclusive Finance
With a view to significantly increase outreach… each developing country should have a continuum of financial institutions that… would be characterized by: a) access at a reasonable cost of all households and
enterprises to the range of financial services for which they are “bankable,” including savings, credit, leasing and factoring, mortgages, insurance, pensions, payments and local and international transfers;
b) sound institutions, guided by appropriate internal management systems, industry performance standards and performance monitoring by the market, as well as by sound prudential regulation where required;
c) financial and institutional sustainability as a means of providing access to financial services over time; and
d) Multiple providers of financial services, so as to bring cost-effective and a wide variety of alternatives to customers.
SA Financial Sector CharterEffective Access means:a) Being within a distance of 20 kms to the nearest
service point at which first-order retail financial services can be undertaken, and includes ATM and other origination points …
b) Being within a distance of 20 kms to the nearest accessible device at which an electronic (other than ATM) service can be undertaken
c) A sufficiently wide range of first-order retail financial products and services …which are aimed at and are appropriate for individuals who fall into the All Media Product Survey (AMPS) categories of LSM 1-5…
First order retail products and services means:a) Transaction products and services… for day to day
purposesb) Savings products and servicesc) Credit for low-income housing (definition provided)d) Insurance products and services
7
Vision must be translated to actionable standards at country level
Specific standards provide benchmarks against which to measure progress

Definition of financial inclusion: e.g. Center for Financial Inclusion (2010)
“A state in which all people who can use them have access to a full suite of quality financial services, provided at affordable prices, in a convenient manner, and with dignity for the clients. Financial services are delivered by a range of providers, most of them private, and reach everyone who can use them, including disabled, poor, rural, and other excluded populations”.
Four dimensions:• What is provided: full range in four main areas• How it is provided: quality=convenience, affordability, safety and
dignity• Who receives: everyone who can use• Who provides: a range of providers led by mainstream financial
institutions

2. Usage
• Actual usage of financial services / products:
• Regularity• Frequency• Patterns
The four dimensions of financial inclusion in the AFI policy note
• Ability to use formal financial services, i.e. minimal barriers to opening an account:
• Physical proximity• Affordability • Eligibility
1. Access
• Product attributes match the needs of customers e.g. portfolio• Choice available
3.Quality
• Effect on the livelihoods of the customers
• Welfare/ consumption• Personal/ business productivity
4.Welfare
Financial inclusion
More complex definitions require additional measurement resources
9

Towards a cross country definition of financial inclusion
• Emphases and targets will and should vary by country since circumstances differ widely
• However, the underlying components can be standardized to enable cross country dialog and measurement
• This would require developing and agreeing common definitions or understandings of the main building block concepts: e.g.
– The main dimensions of inclusion– Access : e.g. “The availability to a given person of affordable and appropriate
financial services”. ACCION Glossary– Basic categories of financial service: transaction/payments, savings, insurance,
credit– % Banked, unbanked, underbanked, previously banked: what is the denominate– Active/ dormant
10

Examples of indicators associated with the dimensions
Dimension Component Possible Indicators
1. Access
Distribution Channels• No. of access points/ 100,000 • % of population lying beyond define
distance from access point
Demographic/geographic• No. or % of people ‘banked’• No. of accounts open by product type• Profile of who is banked
Product eligibility• % of population excluded as a result of
particular product rules
2. UsageProducts & services
• Transaction profile per account• Cost of average profile account
Sustainability• % active accounts• Transactions profile per touch point

Examples of Indicators contd.
Dimension Component Indicator
3. Quality (suitability)
Consumer protection• Number and type of complaints by
channel and type of consumer
Financial literacy• % of households able to answer
defined question
Choice• Range of competing products in
defined markets
4. WelfareDefined behavior • Increased savings behavior
Desired outcomes• Improved consumption of food,
education, etc
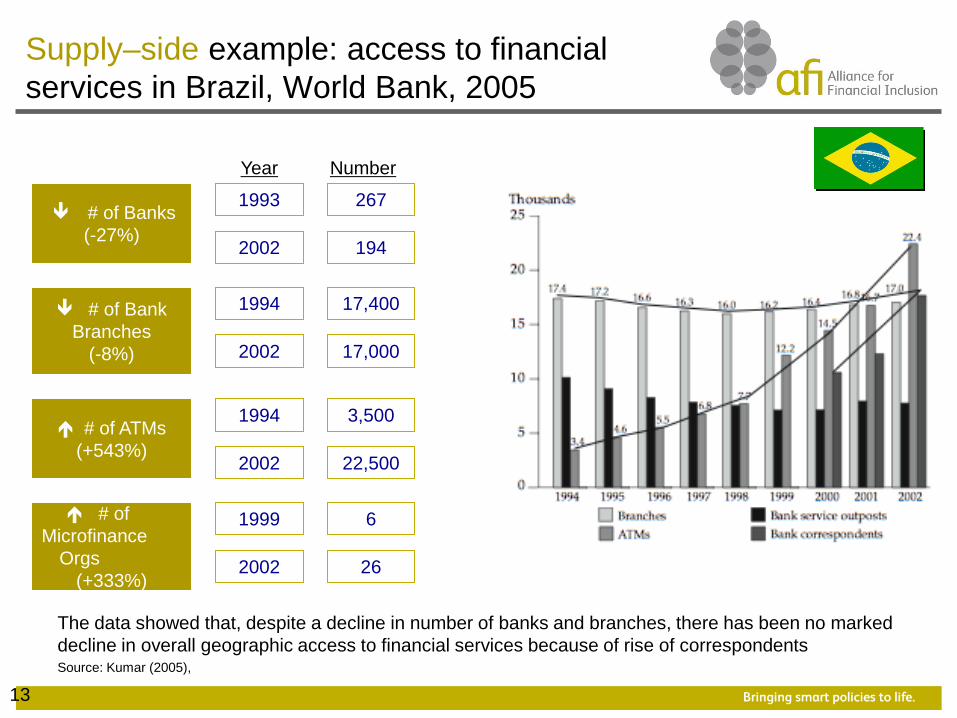
Supply–side example: access to financial services in Brazil, World Bank, 2005
# of Banks(-27%)
# of Bank Branches
(-8%)
# of ATMs(+543%)
# ofMicrofinance
Orgs(+333%)
Year
1993
2002
267
194
1994
2002
17,400
17,000
1994
2002
3,500
22,500
1999
2002
6
26
Number
The data showed that, despite a decline in number of banks and branches, there has been no marked decline in overall geographic access to financial services because of rise of correspondents
13Source: Kumar (2005),

Various cross country supply side efforts are gathering pace…
14
Survey Name Institution # of countries Frequency Data collectedCGAP Global Survey on Access Financial Services(ff Banking the Poor)
135 countries (2009)
Annual
Number of accounts in regulated institutions, ATM cards, machines and loans as well as data on costs, collateral and disclosure.
International Financial Statistics(Upcoming, to be presented)
190 countries. Annual
8 indicators using number of all financial institutions, including branches, ATMs, number of depositors and borrowers, and financial services (deposits, loans, insurance technical reserves).

National demand-side surveys have been completed in more than 25 countries
Timor Leste –WB
Indonesia–WBS. Africa (Diaries),
Kenya, Lesotho, Malawi, Mozambique, Rwanda, Swaziland, Tanzania, Zambia-FinScope
Namibia, Botswana –FinScopeWB
Nigeria -FinScope
Mexico – WB
Columbia –WB
Brazil– WB
India – WB; Diaries
Bangladesh –Diaries
Pakistan –WB; FinScope
Iran– WB
Ghana - WB

Seeking international comparability of globalheadline demand-side indicators
•Global Financial Access Snapshots of high-level repeated comparable financial access indicators from demand side add-on to existing cross-country surveys.
•Being undertaken by DEC, World Bank under a Gates Foundation grant from 2010, likely to deliver first round in 2012
- Multi-country outreach (100-130 countries)
- Individual-level surveys to be conducted in household
- Repeated every three years- Ability to segment by key demographics
Attributes
Standardized questionnaire to be added onto an already existing survey- Account ownership- Frequency of use (deposit/withdrawal),
- Connection to the payment system,- Means of deposit and withdrawal of cash,
- Reasons for not having an account
Proposed Question Content
16

17
2) Defining & measuring financial inclusion
3) Selecting the appropriate approach
1) Understanding the rationale and scope
To create a common framework of understanding of the issues and choices surrounding the measurement of financial inclusion

Where does the data come from?
18
National profile of financial inclusion
National Surveys
How many use this instrument?
Who are they?
Who are the non-users and why?
Attitudes to different services & providers?
RCTs, focus groups
Panel studies
Size of financial flows and portfolio allocations?
Impact on welfare of service or policy?
Demand sideSupply side
Provider data
Fees paid?
User profiles?
Product eligibility rules?
Geographic distribution
Provider/Ombuds
Consumer vulnerabilities
Credit bureaus
Aggregate indebtedness profiles?

Different demand side survey techniques are available to meet different objectives
Type of survey Definition Survey Objective Examples
One time cross -section
Cross section of the population is randomly selected and interviewed once
Snapshot of current level of financial access
- FinScope Zambiia- World Bank Access to finance
Repeated cross section
As above, but subsequently another cross section of the population (resembling the first sample) is randomly selected and interviewed once using same or similar instrument.
Monitor progress of financial access across time.
- FinScope – South Africa, Kenya- Survey of Consumer Finances (SCF) USA
PanelThe same households/individuals are interviewed multiple times at regular intervals.
Can be used to show a causal impact of changes in policy if combined with other factors.
-Financial Diaries - ENNViH (Family life survey)-Mexico---Thailand
19
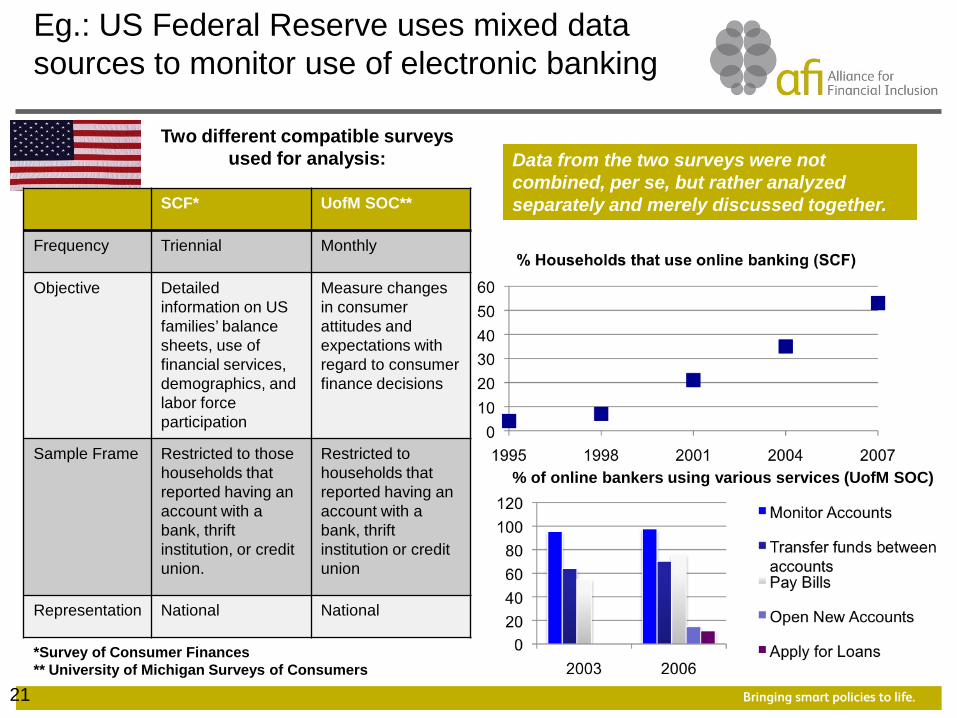
Eg.: US Federal Reserve uses mixed data sources to monitor use of electronic banking
Two different compatible surveys used for analysis:
SCF* UofM SOC**
Frequency Triennial Monthly
Objective Detailed information on US families’ balance sheets, use of financial services, demographics, and labor force participation
Measure changes in consumer attitudes and expectations with regard to consumer finance decisions
Sample Frame Restricted to those households that reported having an account with a bank, thrift institution, or credit union.
Restricted to households that reported having an account with a bank, thrift institution or credit union
Representation National National
21
Data from the two surveys were not combined, per se, but rather analyzed separately and merely discussed together.
% of online bankers using various services (UofM SOC)
*Survey of Consumer Finances** University of Michigan Surveys of Consumers

Design new surveyImpact
Quality
Survey objective and survey approach are closely related
Usage
Access
Resources
Com
plex
ity
Survey Objective
Resources
Com
plex
ity
Survey Approach
Leverage existing surveys
Gather available
data
22

Timeline for creating a survey
23
1 4 5 6 7 8 9 102 3
Indicative timeline drawn from FinScope SA process, which spans 10 months developing, implementing, analysing and launching an annual demand-side survey
Build user/funder consortium : Determine which institutions (e.g. commercial banks but could be donors or govt agencies) will join the research effort as syndicates
Finalize Questionnaire: Collect input from syndicates members and pilot
Field Work (2 months) -contracted by a large survey house
Analysis and Verification (2 months) -Done by the market research team as well as in house analysts
Dissem-ination: high profile event
Number of Months

Survey costs vary with sample size and complexity
0
100,000
200,000
300,000
400,000
500,000
600,000
0 1000 2000 3000 4000
Sample Size
Sur
vey
Cos
t (U
SD
)
24
Legend:Panel Design Cross section – add on
moduleCross-section new survey

Other stakeholders have an interest in the data, and may support/ benefit from survey efforts
25
Regulators
Private Sector
Providers
Statistical Bureau
Other Government
Agencies
Many data needs across stakeholders will overlap…
Example: Finscope in Zambia
In Zambia, a number of banks have responded positively to headline data provided by a FinScope survey.
Barclays
Justified the re-opening of a number of branches and service centres in non-urban areas.Created a new brand and business model specifically focused on the unbanked
ZANACO
Launched a mobile banking venture similar to Wizzit
DunavantCreated a mobile payment linkage for 150,000 of its cotton-growers
Institution Initiative

The role of regulators in surveys varies widely
RegulatorsZambia Kenya US Fed Indonesia
Design FundAnalyzeDisseminatePublicly available data
Y Y Y N
26
Fully responsible
Partially responsible
No responsibility

Beyond measurement, surveys can also be used to deepen understanding of financial inclusion
1. Measurement
2. Deepen Understanding
Identify priorities
Measure progress over time
Test hypotheses about relationships between financial inclusion and other variables
Determine the impact of particular policies and programs
Main Purpose Specific Purpose
Incentivize Reform
27

Example: going deeper…
28
The Financial Diaries approach seeks to understand the usage of financial instruments by poor households at a detailed level. Diaries can track cash flows accurately in ways that
other surveys do not. In this way, the portfolios of the poor can be better understood.
Mea
n an
nual
Sav
ings
A
ccum
ulat
ion
(US
D)

Conclusion
• Measuring the dimensions of financial inclusion is both feasible and desirable but carries costs and tradeoffs– An increasing range of robust measurement approaches and
instruments is available– These must be tailored according to objective and resources
available.• The regulators’ role may not always be to provide demand side data
but at least to support its collection and use it, together with supply side information to measure and understand.– Most countries concerned about inclusion need a credible
national financial survey repeated at suitable intervals. • If financial inclusion cannot be clearly defined, it cannot be clearly
measured. While the definition will vary across country, it is possible to harmonize underlying concepts and understandings. An ISO-type approach to defining the components
29
