financial highlights - snl · financial highlights stockholders’ equity ... at an attractive...
TRANSCRIPT

Transatlantic Holdings, Inc.
2010 Annual Report
www.transre.com
Transatlantic Holdings, Inc.
80 Pine StreetNew YorkNY 10005Tel. 212.365.2200
Financial Highlights
Stockholders’ Equity ($ Billions)
Net Income ($ Millions)
Transatlantic Holdings, Inc.
2010
Annual R
eport
0.42 0.50 0.56 0.77 0.76 0.99 1.14 1.36 1.61 1.64 1.86 1.85 2.03 2.38 2.59 2.54 2.96 3.35 3.20 4.03 4.28
90 91 92 93 94 95 96 97 98 99 00 01 02 03 04 05 06 07 08 09 10
62 71 72 133 102 132 155 186 248 187 212 19 169 304 255 38 428 487 102 478 402
90 91 92 93 94 95 96 97 98 99 00 01 02 03 04 05 06 07 08 09 10
($ in millions, except per share data and ratio) 2010 2009 Change %
Net Premiums Written $ 3,882 $ 3,986 (2.6) %
Net Income 402 478 (15.8)
Combined Ratio 98.2% 93.5% 4.7
Net Income Per Common Share - Diluted 6.19 7.15 (13.4)
Investments and Cash $ 13,257 12,511 6.0
Total Assets 15,705 $ 14,944 5.1
Stockholders’ Equity 4,284 4,034 6.2
Book Value Per Common Share 68.83 60.77 13.3

Transatlantic Holdings, Inc.
2010 Annual Report
www.transre.com
Transatlantic Holdings, Inc.
80 Pine StreetNew YorkNY 10005Tel. 212.365.2200
Financial Highlights
Stockholders’ Equity ($ Billions)
Net Income ($ Millions)
Transatlantic Holdings, Inc.
2010
Annual R
eport
0.42 0.50 0.56 0.77 0.76 0.99 1.14 1.36 1.61 1.64 1.86 1.85 2.03 2.38 2.59 2.54 2.96 3.35 3.20 4.03 4.28
90 91 92 93 94 95 96 97 98 99 00 01 02 03 04 05 06 07 08 09 10
62 71 72 133 102 132 155 186 248 187 212 19 169 304 255 38 428 487 102 478 402
90 91 92 93 94 95 96 97 98 99 00 01 02 03 04 05 06 07 08 09 10
($ in millions, except per share data and ratio) 2010 2009 Change %
Net Premiums Written $ 3,882 $ 3,986 (2.6) %
Net Income 402 478 (15.8)
Combined Ratio 98.2% 93.5% 4.7
Net Income Per Common Share - Diluted 6.19 7.15 (13.4)
Investments and Cash $ 13,257 12,511 6.0
Total Assets 15,705 $ 14,944 5.1
Stockholders’ Equity 4,284 4,034 6.2
Book Value Per Common Share 68.83 60.77 13.3

At the same time, the ongoing depressed level of interest
rates and markedly lower investment yields required steely
determination in managing the asset side of the balance
sheet to deliver acceptable investment returns.
This company has a long track record of positive cash-
flow, never having had to divest any investment position
to cover claims or operating expenses. Throughout the
year we identified opportunities to deploy our positive
cash flow; we repurchased $220 million of common stock
at an attractive weighted average discount to book value
of 19%.
Looking ForwardWe enter 2011 with a strong belief in the enduring value
of the Transatlantic franchise. We will work hard to deliver
long-term value by focusing on our core specialties and by
taking full advantage of our global network.
For example, in Europe we expect to see continued benefit
from the trend towards increased syndication as the
implementation of Solvency II approaches. However, and
in keeping with our view that the industry is already well
regulated, we expect increased demand for reinsurance
to be selective rather than wholesale. Having built strong
relationships with regulators around the world, we will be fully
prepared for these and any other changes, while remaining
committed to customers and brokers.
ConclusionWe hope that you are pleased with the performance of the
company in this difficult environment. We are proud of the
teams around the world for their consistent delivery of our
mission. We built our plans on their experienced, seasoned,
professional leadership.
With a strong financial position, the right people in the right
positions, and a proven business model, we believe that
the future is bright, as we diligently strive to deliver on our
commitments to you in 2011 and beyond.
Dear Stockholders,
We believe that the global market will be less centralized in the future, and that Transatlantic must have a presence in the regional hubs if it is to maximize its potential.
Richard S. PressChairman
Richard S. PressChairman
Robert F. OrlichPresident and Chief Executive Officer
Robert F. OrlichPresident and Chief Executive Officer
Transatlantic Reinsurance Company®
80 Pine StreetNew York, NY 10005(212) 365 2200 » [email protected]
Transatlantic Holdings, Inc.80 Pine StreetNew York, NY 10005(212) 365 2200 » [email protected]
Trans Re Zurich Reinsurance Company Ltd.Nüschelerstrasse 32PO Box 14758021 Zurich, Switzerland(41) 44 227 61 00 » [email protected]
Professional Risk Management Services, Inc.1515 Wilson Boulevard Suite 800Arlington, VA 22209(800) 245 3333 » [email protected]
Our Offices
Buenos AiresTransatlantic Re (Argentina), S.A.Carlos Pelligrini 10235th FloorC1009ABU Buenos AiresArgentina(5411) 5296 [email protected]
CHiCAGo 300 South Riverside Plaza22nd FloorChicago, IL 60606(312) 930 [email protected]
CoLuMBus1515 West Lane AvenueSuite 18Columbus, OH 43221(614) 488 [email protected]
HAMiLTonPar-La-Ville Place5th Floor14 Par-La-Ville RoadHamiltonBermuda(441) 405 [email protected]
MuniCHTransatlantic Reinsurance Company (German Branch)Promenadeplatz 880333 MunichGermany(49) 89 1894 2554 [email protected]
oVerLAnD PArK6900 College BoulevardSuite 860Overland Park, KS 66211(913) 319 [email protected]
PAnAMA CiTYTRC (PANAMÁ) S.A.Calle 50Edificio Torre GlobalSuite 1809Panama City, Republic of Panama(507) 340 [email protected]
PAris21 Boulevard HaussmannParis 75009 France(33) 1 4006 [email protected]
HonG KonG(Asia-Pacific Regional Headquarters)3303 The Lee Gardens33 Hysan AvenueCauseway BayHong Kong S.A.R.People’s Republic of China(852) 2574 [email protected]
JoHAnnesBurGMS Upson & Associates c.c.Kildrummy Office ParkBlock 7Cnr Witkoppen Road & Umhlanga CrescentPaulshof, South Africa(27) 11 803 0885 [email protected]
LonDonCorn Exchange55 Mark LaneLondon, EnglandEC3R 7NE(44) 207 204 [email protected]
MiAMi (Latin America/Caribbean) 701 N.W. 62nd AvenueSuite 790Miami, FL 33126(786) 437 [email protected]
rio De JAneiroTransatlantic Reinsurance Company – Representative OfficeRua da Candelaria 65Sala 2101Rio de Janeiro, Brazil20091-020(55) 21 2127 [email protected]
sAn FrAnCisCoEmbarcadero Center West275 Battery StreetSuite 460San Francisco, CA 94111(415) 399 [email protected]
sHAnGHAiRm 1511 Ruijin BuildingNo. 205 Maoming Road (S)Shanghai 200020People’s Republic of China(86) 21 6473 7681/[email protected]
sTAMForD1177 Summer StreetSuite 400BStamford, CT 06905(203) 905 [email protected]
sToCKHoLMNOBAREDanavägen 5BSE-18260 DjursholmSweden(46) 8753 [email protected]
sYDneYLevel 21, Australia Square264 George StreetSydney NSW 2000Australia(61) 2 9274 [email protected]
ToKYoNew Yurakucho Building,3rd Floor12-1, Yurakucho 1-chomeChiyoda-Ku, Tokyo100-0006Japan(81) 3 3212 [email protected]
ToronTo145 Wellington Street WestToronto, Ontario M5J 1H8Canada(416) 596 [email protected]
WArsAWTransatlantic Polska Sp. z o.o.15 Jana Pawla II Street9th floor00-828 Warsaw, Poland(48) 22 697 [email protected]
We are pleased to present our latest set of financial results. They are a
graphic demonstration of your company’s ongoing resilience in the face
of challenging economic and market pressures.
OverviewHaving successfully navigated the recent economic crisis, insurance and
reinsurance companies have been able to rebuild their capital positions.
This is a two-edged sword, however, as the industry has created excess
capital at a time when subdued economic activity and low interest rates
have made the achievement of meaningful returns more challenging
than usual.
The confluence of these factors has applied greater pressure both to our
teams and to customers as they seek to achieve their own objectives.
Despite these challenges, we continue to pursue price discipline and
acceptable ROEs.
DevelopmentsWe believe that reinsurance offers the most flexible, customizable,
quickly deployed, annually re-priced, contingent capital that insurance
customers can buy. While alternative structures are emerging (which the
company uses when appropriate), we continue to have confidence in the
enduring strength of this business model, based on customer needs.
Despite current pricing pressures, Transatlantic remains firmly committed
to being the best risk partner for its clients. In the past year we have
further developed the global network of local support capabilities:
- We upgraded the Munich office to full branch status. Since opening in
2008, the team, with the support of the Paris office, has become an
important example of the local delivery of the global brand that is such
a key component of the overall value proposition.
- We opened a new office in Hamilton, Bermuda, which is one of the
world’s insurance and reinsurance hubs. We decided that a physical
presence was the best way to access both the flow of deals and
the flow of market intelligence. We look forward to building out our
platform in this market.
- We established Calpe Insurance Company Limited to assist European
clients. A core of insurance expertise and support has been building
in Gibraltar in recent years. We are excited to join this development,
which fits with our world view. We believe that the global
market will be less centralized in the future, and that
Transatlantic must have a presence in the regional hubs if
it is to maximize its returns. We will continue to be vigilant
in monitoring developments and monetizing opportunities.
- We recently completed an investment in Lloyd’s, which
has been an important customer for many years. We see
opportunities to invest in syndicates we already know
well, which will enable us to diversify the portfolio and to
garner reinsurance opportunities as well.
Transatlantic has the financial strength, personnel depth and the
vision to make these investments in the franchise successful
through all stages of the cycle, and we will actively explore
opportunities to expand wherever we believe it will add value.
IndependenceThis past year we completed our operational independence
from our former majority stockholder. This separation has
had a number of benefits:
- An increased flow of new business opportunities
- An increased, already demonstrated, financial flexibility
- An increased flexibility in corporate strategy
- An increased collaboration between the board and
executive team
On this last point, your board welcomed two new members,
Stephen Bradley from the Harvard Business School, and
Reuben Jeffery III, formerly US Under Secretary of State for
Economic, Energy and Agricultural Affairs. Between them
Stephen and Reuben bring a wide range of experience and
insight to your board’s deliberations.
We thank all the directors and executive leadership team for
their continuing efforts on your behalf, and their inputs and
insights regarding future direction and success.
Creating Stockholder ValueTransatlantic benefits from both underwriting discipline and
global diversification. We have already noted the continuing
investments made in the global network and the expansion
of the core franchise.
We have also effectively integrated both enterprise risk
management and an economic capital model into the way
we do business every day. This progress has been noted by
the rating agencies. We believe that these tools put us in a
stronger position going forward.
Calpe Insurance Company LimitedGrand Ocean Plaza First FloorOcean Village, Gibraltar (00350) 200 74570 » [email protected]

UNITED STATESSECURITIES AND EXCHANGE COMMISSION
Washington, D.C. 20549
FORM 10-K(Mark One)
� ANNUAL REPORT PURSUANT TO SECTION 13 OR 15(d) OF THESECURITIES EXCHANGE ACT OF 1934
FOR THE FISCAL YEAR ENDED DECEMBER 31, 2010
OR
� TRANSITION REPORT PURSUANT TO SECTION 13 OR 15(d) OF THESECURITIES EXCHANGE ACT OF 1934
FOR THE TRANSITION PERIOD FROM to
COMMISSION FILE NUMBER 1-10545
TRANSATLANTIC HOLDINGS, INC.(Exact name of registrant as specified in its charter)
Delaware 13-3355897(State or other jurisdiction of (I.R.S. Employer Identification No.)incorporation or organization)
80 Pine Street, New York, New York 10005(Address of principal executive offices) (Zip Code)
(212) 365-2200(Registrant’s telephone number, including area code)
Securities registered pursuant to Section 12(b) of the Act:
Name of Each Exchange onTitle of Each Class Which Registered
Common Stock, Par Value $1.00 per Share New York Stock Exchange
Securities registered pursuant to Section 12(g) of the Act: None
Indicate by check mark if the registrant is a well-known seasoned issuer, as defined in Rule 405 of the Securities Act. Yes � No �
Indicate by check mark if the registrant is not required to file reports pursuant to Section 13 or Section 15(d) of the Act. Yes � No �
Indicate by check mark whether the registrant (1) has filed all reports required to be filed by Section 13 or 15(d) of the SecuritiesExchange Act of 1934 during the preceding 12 months (or such shorter period that the registrant was required to file such reports), and(2) has been subject to such filing requirements for the past 90 days. Yes � No �
Indicate by check mark whether the registrant has submitted electronically and posted on its corporate Web site, if any, everyInteractive Data File required to be submitted and posted pursuant to Rule 405 of Regulation S-T (§ 232.405 of this chapter) during thepreceding 12 months (or for such shorter period that the registrant was required to submit and post such files). Yes � No �
Indicate by check mark if disclosure of delinquent filers pursuant to Item 405 of Regulation S-K (Section 229.405 of this chapter) is notcontained herein, and will not be contained, to the best of registrant’s knowledge, in definitive proxy or information statements incorporatedby reference in Part III of this Form 10-K or any amendment to this Form 10-K. �
Indicate by check mark whether the registrant is a large accelerated filer, an accelerated filer, a non-accelerated filer, or a smallerreporting company. See the definitions of ‘‘large accelerated filer,’’ ‘‘accelerated filer,’’ and ‘‘smaller reporting company’’ in Rule 12b-2 ofthe Exchange Act. (check one):
Large accelerated filer � Accelerated filer � Non-accelerated filer � Smaller reporting company �(Do not check if a smaller
reporting company)
Indicate by check mark whether the registrant is a shell company (as defined in Rule 12b-2 of the Exchange Act). Yes � No �
The aggregate market value of the voting and non-voting common equity held by non-affiliates of the registrant computed by referenceto the price at which the common equity was last sold, as of June 30, 2010 (the last business day of the registrant’s most recently completedsecond fiscal quarter) was approximately $3,047,542,231.
As of January 31, 2011, there were outstanding 62,332,961 shares of Common Stock, $1.00 par value, of the registrant.
Documents Incorporated by Reference
Portions of the registrant’s definitive proxy statement filed or to be filed with the Securities and Exchange Commission pursuant toRegulation 14A involving the election of directors at the annual meeting of the stockholders of the registrant scheduled to be held onMay 26, 2011 are incorporated by reference in Part III of this Form 10-K.

(This page has been left blank intentionally.)

TRANSATLANTIC HOLDINGS, INC. AND SUBSIDIARIES
TABLE OF CONTENTS
Page
PART IItem 1. Business . . . . . . . . . . . . . . . . . . . . . . . . . . . . . . . . . . . . . . . . . . . . . . . . . . . . . . . 1Item 1A. Risk Factors . . . . . . . . . . . . . . . . . . . . . . . . . . . . . . . . . . . . . . . . . . . . . . . . . . . . 21Item 1B. Unresolved Staff Comments . . . . . . . . . . . . . . . . . . . . . . . . . . . . . . . . . . . . . . . . . 30Item 2. Properties . . . . . . . . . . . . . . . . . . . . . . . . . . . . . . . . . . . . . . . . . . . . . . . . . . . . . . 30Item 3. Legal Proceedings . . . . . . . . . . . . . . . . . . . . . . . . . . . . . . . . . . . . . . . . . . . . . . . . 30Executive Officers of the Registrant . . . . . . . . . . . . . . . . . . . . . . . . . . . . . . . . . . . . . . . . . . . . . 32
PART IIItem 5. Market for the Registrant’s Common Equity, Related Stockholder Matters and
Issuer Purchases of Equity Securities . . . . . . . . . . . . . . . . . . . . . . . . . . . . . . . . . 33Item 6. Selected Financial Data . . . . . . . . . . . . . . . . . . . . . . . . . . . . . . . . . . . . . . . . . . . . 35Item 7. Management’s Discussion and Analysis of Financial Condition and Results of
Operations . . . . . . . . . . . . . . . . . . . . . . . . . . . . . . . . . . . . . . . . . . . . . . . . . . . . 38Item 7A. Quantitative and Qualitative Disclosures About Market Risk . . . . . . . . . . . . . . . . . 78Item 8. Financial Statements and Supplementary Data . . . . . . . . . . . . . . . . . . . . . . . . . . . . 79Item 9. Changes in and Disagreements With Accountants on Accounting and Financial
Disclosure . . . . . . . . . . . . . . . . . . . . . . . . . . . . . . . . . . . . . . . . . . . . . . . . . . . . 133Item 9A. Controls and Procedures . . . . . . . . . . . . . . . . . . . . . . . . . . . . . . . . . . . . . . . . . . . 133Item 9B. Other Information . . . . . . . . . . . . . . . . . . . . . . . . . . . . . . . . . . . . . . . . . . . . . . . . 134
PART IIIItem 10. Directors, Executive Officers and Corporate Governance . . . . . . . . . . . . . . . . . . . . 134Item 11. Executive Compensation . . . . . . . . . . . . . . . . . . . . . . . . . . . . . . . . . . . . . . . . . . . . 134Item 12. Security Ownership of Certain Beneficial Owners and Management and Related
Stockholder Matters . . . . . . . . . . . . . . . . . . . . . . . . . . . . . . . . . . . . . . . . . . . . . 134Item 13. Certain Relationships and Related Transactions, and Director Independence . . . . . . 135Item 14. Principal Accountant Fees and Services . . . . . . . . . . . . . . . . . . . . . . . . . . . . . . . . . 135
PART IVItem 15. Exhibits and Financial Statement Schedules . . . . . . . . . . . . . . . . . . . . . . . . . . . . . . 136
i

(This page has been left blank intentionally.)

PART I
Throughout this Annual Report on Form 10-K, Transatlantic Holdings, Inc. (the ‘‘Company’’, andcollectively with its subsidiaries, ‘‘TRH’’) presents its operations in the way it believes will be most meaningful.In certain instances, TRH’s unpaid losses and loss adjustment expenses are presented net of related reinsurancerecoverable in accordance with principles prescribed or permitted by insurance regulatory authorities as these arestandard measures in the insurance and reinsurance industries.
Item 1.
TRANSATLANTIC HOLDINGS, INC. AND SUBSIDIARIESBUSINESS
The Company and Its History
The Company is a holding company incorporated in the state of Delaware. Originally formed in 1986under the name PREINCO Holdings, Inc. as a holding company for Putnam Reinsurance Company(‘‘Putnam’’), the Company’s name was changed to Transatlantic Holdings, Inc. on April 18, 1990 followingthe acquisition on April 17, 1990 of all of the common stock of Transatlantic Reinsurance Company�(‘‘TRC’’) in exchange for shares of common stock of the Company (the ‘‘Share Exchange’’). Prior to theShare Exchange, American International Group, Inc. (‘‘AIG’’, and collectively, with its subsidiaries, the‘‘AIG Group’’) held a direct and indirect interest of approximately 25% in the Company and an indirectinterest of 49.99% in TRC. As a result of the Share Exchange, AIG became the beneficial owner ofapproximately 41% of the Company’s outstanding common stock and TRC became a wholly-ownedsubsidiary of the Company. In June 1990, certain stockholders of the Company (other than AIG) soldshares of the Company’s common stock in a public offering.
Prior to June 10, 2009 and as of December 31, 2008, AIG beneficially owned approximately 59% ofthe Company’s outstanding shares. On June 10, 2009, AIG and American Home Assurance Company(‘‘AHAC’’), a wholly owned subsidiary of AIG, consummated a secondary public offering (the ‘‘June 2009Offering’’) of 29.9 million issued and outstanding shares of the Company owned by AIG and AHAC. OnMarch 15, 2010, AHAC consummated another secondary public offering (the ‘‘March 2010 Offering’’, andcollectively with the June 2009 Offering, the ‘‘Secondary Offerings’’) of 8.5 million issued and outstandingshares of the Company’s common stock owned by AHAC. The Company repurchased two million shares ofits common stock from AHAC in the March 2010 Offering pursuant to a stock offering agreement for anaggregate purchase price of approximately $105 million. TRH did not receive any proceeds from theSecondary Offerings. Immediately following the March 2010 Offering, the AIG Group, including AHAC,beneficially owned 0.7 million shares of the Company’s common stock (excluding shares held by certainmutual funds that are advised or managed by subsidiaries of AIG), representing approximately 1.1% of theCompany’s then outstanding shares. As a result of its reduced ownership percentage, the AIG Group wasno longer considered a related party after March 15, 2010. (See Relationship with the AIG Group for adescription of recent events relating to AIG.)
The Company, through its wholly-owned subsidiaries, TRC, Trans Re Zurich ReinsuranceCompany Ltd. (‘‘TRZ’’), acquired by TRC in 1996, and Putnam (contributed by the Company to TRC in1995), offers reinsurance capacity for a full range of property and casualty products, directly and throughbrokers, to insurance and reinsurance companies, in both the domestic and international markets on botha treaty and facultative basis. One or both of TRC and Putnam is licensed, accredited, authorized or canserve as a reinsurer in 50 states and the District of Columbia in the United States and in Puerto Rico andGuam. Through its international locations, TRH has operations worldwide, including Bermuda, Canada,seven locations in Europe, three locations in Central and South America, two locations in Asia (excludingJapan), and one location in each of Japan, Australia and Africa. TRC is licensed in Bermuda, Canada,Japan, the United Kingdom, the Dominican Republic, the Hong Kong Special Administrative Region, the
1

People’s Republic of China and Australia. TRC is an Admitted Reinsurer in Brazil, where it maintains anoffice in Rio de Janeiro. In addition, TRC is registered and authorized as a foreign reinsurer in Argentina(where it maintains a representative office in Buenos Aires, Transatlantic Re (Argentina) S.A.), theRepublic of Panama (where it maintains a representative office, TRC (PANAMA) S.A.), Bolivia, Chile,Colombia, Ecuador, El Salvador, France, Germany, Guatemala, Honduras, Mexico, Nicaragua, Paraguay,Peru, Uruguay and Venezuela, and is authorized to maintain a representative office in Shanghai, thePeople’s Republic of China. TRZ is licensed as a reinsurer in Switzerland and registered in Argentina,Honduras, Guatemala, the Dominican Republic and Colombia. Transatlantic Polska Sp. z o.o., a subsidiaryof TRC, maintains a registered representative office in Warsaw, Poland.
The Reinsurance Business
Reinsurance is an arrangement whereby one or more companies, the reinsurer(s), agrees to indemnifyanother insurance or reinsurance company, the ceding company, for all or part of the insurance risksunderwritten by the ceding company. Reinsurance can provide certain basic benefits to the cedingcompany. It reduces net liability on individual risks, thereby enabling the ceding company to underwritemore business than its own resources can support and it provides catastrophe protection to lessen theimpact of large or multiple losses.
TRH offers two types of reinsurance based on the underlying insurance coverage:
• Casualty. Casualty insurance protects the insured against financial loss arising out of its obligationto others for loss or damage to their person or property. Casualty reinsurance protects the cedingcompany against loss to the extent of the reinsurance coverage provided. TRH’s principal lines ofcasualty reinsurance include other liability (including directors’ and officers’ liability (‘‘D&O’’),errors and omissions liability (‘‘E&O’’) and general casualty), medical malpractice, ocean marineand aviation, auto liability (including non-standard risks), accident and health (‘‘A&H’’) and suretyand credit.
Casualty insurance can be written on a claims-made or an occurrence basis. Claims-made policiesgenerally provide coverage for claims made during the policy period regardless of when the actcausing the claim occurred. Occurrence policies generally provide coverage in perpetuity for actscommitted during the policy period regardless of when the claim is made. Depending on the natureof the business and statute of limitations, the final claims costs for occurrence business can takemany years to be definitively known given that new claims can come in at any time and the cost ofexisting claims may continue to change over time. Claims-made business, while also taking asignificant time to finalize claims costs, due to the development of open claims, generally has ashorter period for completion as the number of claims is known shortly after the policy expires.
Casualty business as a whole is volatile in that the ultimate claims costs for a policy or portfolio arenot known for a significant amount of time. Reasons for this are the complexity of liability theory,the occurrence nature of some coverages, the potential for litigation, adverse court rulings,unpredictable claims and social inflation trends and reporting lag time between cedants andreinsurers.
• Property. Property insurance protects the insured against financial loss arising out of the loss ofproperty or its use caused by an insured peril. Property reinsurance protects the ceding companyagainst loss to the extent of the reinsurance coverage provided. TRH’s principal lines of propertyreinsurance include fire, allied lines, auto physical damage and homeowners multiple peril.
Property reinsurance is written on an occurrence basis, but, because the loss is generally immediateand manifest, claims are adjusted and closed in a much shorter period than casualty business.However, due to the unpredictable nature of fires, hurricanes, earthquakes and other natural orman-made catastrophic events as well as the imperfect models that exist in measuring the
2

probability and potential magnitude of costs from these events, there is a great deal of volatility inproperty reinsurance as well.
TRH writes reinsurance either through treaty or facultative reinsurance arrangements:
• Treaty. Treaty reinsurance is a contractual arrangement that provides for the automatic reinsuringof a type or category of risk underwritten by the ceding company.
• Facultative. Facultative reinsurance is the reinsurance of individual risks. Rather than agreeing toreinsure all or a portion of a class of risk, the reinsurer separately rates and underwrites each risk.Facultative reinsurance is normally purchased for risks not covered by treaty reinsurance or forindividual risks covered by reinsurance treaties that are in need of capacity beyond that provided bysuch treaties.
TRH provides reinsurance for most major lines of insurance on both pro rata and excess-of-loss bases.A ceding company’s reinsurance program may involve pro rata and excess-of-loss reinsurance on both atreaty and facultative basis:
• Pro rata. Under pro rata reinsurance (also referred to as proportional), the ceding company and thereinsurer share the premiums as well as the losses and expenses in an agreed proportion. As prorata business is a proportional sharing of premiums and losses between ceding company andreinsurer, generally, the underwriting results of such business more closely reflect the underwritingresults of the business ceded than do the results of excess-of-loss business. In pro rata reinsurance,the reinsurer generally pays the ceding company a ceding commission. Generally, the cedingcommission is based on the ceding company’s cost of obtaining the business being reinsured (i.e.,brokers’ and agents’ commissions, local taxes and administrative expenses).
• Excess-of-Loss. Under excess-of-loss reinsurance, the reinsurer agrees to reimburse the cedingcompany for all losses in excess of a predetermined amount up to a predetermined limit. Premiumspaid by the ceding company to the reinsurer for excess-of-loss coverage are generally notproportional to the premiums that the ceding company receives because the reinsurer does notassume a proportionate risk. Often there is no ceding commission on excess-of-loss reinsurance andtherefore the pricing mechanism used by reinsurers in those instances is a rate applicable topremiums of the individual policy or policies subject to the reinsurance agreement.
Operations
TRH’s activities in the United States are conducted through its worldwide headquarters in New York,NY, its branch in Miami, FL and offices in Chicago, IL, Overland Park, KS, San Francisco, CA, Columbus,OH and Stamford, CT. All domestic treaty and facultative business is underwritten by, or under thesupervision of, senior officers of TRH located in New York. TRH’s headquarters in New York and officesin Miami, Rio de Janeiro, Toronto, Bermuda, London, Paris, Zurich, Munich, Hong Kong, Tokyo andSydney offer treaty as well as facultative reinsurance. In addition, TRH operates representative offices inBuenos Aires, Panama, Warsaw and Shanghai, and maintains exclusive representative arrangements withMS Upson Associates c.c. in Johannesburg, South Africa and with NOBARE in Stockholm, Sweden. TRHalso operates Professional Risk Management Services, Inc. (‘‘PRMS’’), a wholly-owned subsidiary of theCompany. Based in Arlington, VA, PRMS is an insurance program manager specializing in professionalliability insurance services, including underwriting, claims and risk management, for individual healthcareproviders, group practices, facilities and organizations. During 2010, TRH opened an office in Bermuda tofurther support TRH’s local business partners; upgraded TRH’s Munich office to full branch status toenhance TRH’s standing in the local market; established a new entity in Gibraltar, Calpe InsuranceCompany Limited, to expand TRH’s access to business in Europe; and completed a strategic investment toparticipate as a corporate name in Lloyd’s of London.
3

TRH reinsures risks from a broad spectrum of industries throughout the United States and foreigncountries. Business underwritten by all branches located outside the United States and by the Miamibranch (which underwrites business in Latin America and the Caribbean) accounted for approximately50%, 49% and 50% of worldwide net premiums written in 2010, 2009 and 2008, respectively. (SeeManagement’s Discussion and Analysis of Financial Condition and Results of Operations (‘‘MD&A’’) for adiscussion of premium fluctuations between years, Regulation for a discussion of certain conditionsassociated with international business and Note 17 of Notes to Consolidated Financial Statements forfinancial data by business segment.)
After March 15, 2010, the AIG Group ceased to be a related party of TRH, as discussed above. Grosspremiums written originated by the AIG Group and ceded to TRH from contracts that were entered intowhile the AIG Group was a related party totaled approximately $196 million (4.8%), $263 million (6.3%)and $310 million (7.0%) in 2010, 2009 and 2008, respectively. These amounts exclude (a) premiumsassumed that initially were insured by AIG subsidiaries as a result of TRH’s marketing efforts and thenceded to TRH by prearrangement; (b) amounts assumed from an AIG subsidiary and ceded in an equalamount to other AIG subsidiaries; and (c) all premiums from contracts that were effective after March 15,2010. The amount of premiums assumed that initially were insured by AIG subsidiaries as a result ofTRH’s marketing efforts and then ceded to TRH by prearrangement are not material. (See Note 16 ofNotes to Consolidated Financial Statements (‘‘Note 16’’) for the amount of premiums assumed from anAIG subsidiary and ceded in an equal amount to other AIG subsidiaries.) (See Relationship with the AIGGroup.)
In addition, TRH holds a 40% interest in Kuwait Reinsurance Company (K.S.C.) (‘‘Kuwait Re’’),acquired in 2000, which has a balance sheet carrying value of $49.0 million and $44.2 million atDecember 31, 2010 and 2009, respectively. Kuwait Re provides property, casualty and life reinsuranceproducts to clients in Middle Eastern and North African markets.
TRC and Putnam have a quota share reinsurance agreement where TRC cedes 5% of its assumedreinsurance, net of other retrocessions, to Putnam. Presently all of Putnam’s business is assumed fromTRC pursuant to this quota share reinsurance agreement. This agreement was entered into for operationalreasons and had no impact on TRH’s consolidated financial position or results of operations.
4

Property and Casualty Lines of Business
Casualty reinsurance constitutes the larger portion of TRH’s business, accounting for 71% of netpremiums written in 2010, 71% in 2009 and 70% in 2008. The following table presents certain underwritinginformation concerning TRH’s casualty and property business for the periods indicated (see MD&A):
Years Ended December 31,
Net Losses and Loss andLoss Adjustment Loss Adjustment
Net Premiums Written Net Premiums Earned Expenses Incurred Expense Ratio
2010 2009 2008 2010 2009 2008 2010 2009 2008 2010 2009 2008
(dollars in millions)Casualty:
Other liability(1)(2)(3)(4) . . . . . . . . . $1,058.0 $1,077.5 $1,037.2 $1,081.0 $1,037.6 $1,061.3 $ 916.5 $ 865.7 $ 842.3 84.8% 83.4% 79.4%Accident and health . . . . . . . . . . 422.7 416.0 314.0 411.6 399.3 302.8 356.3 331.7 232.0 86.6 83.1 76.6Medical malpractice(4) . . . . . . . . . 309.7 339.3 372.4 313.5 359.0 372.5 266.2 255.6 295.8 84.9 71.2 79.4Ocean marine and aviation(2)(4) . . . . 267.7 291.8 323.6 256.9 305.8 329.2 130.6 217.1 251.7 50.8 71.0 76.5Auto liability(4) . . . . . . . . . . . . . 237.6 241.1 317.6 217.6 274.6 297.0 173.3 224.9 210.2 79.6 81.9 70.8Surety and credit(2)(3) . . . . . . . . . 211.6 239.2 224.6 206.4 222.9 214.7 60.3 136.3 140.3 29.2 61.1 65.3Other(2) . . . . . . . . . . . . . . . . . 235.7 236.7 278.6 235.1 246.8 300.7 216.3 218.3 273.5 92.0 88.5 91.0
Total casualty . . . . . . . . . . . . 2,743.0 2,841.6 2,868.0 2,722.1 2,846.0 2,878.2 2,119.5 2,249.6 2,245.8 77.9 79.0 78.0
Property:Fire(2)(3)(4) . . . . . . . . . . . . . . . . 497.3 507.5 582.7 492.0 544.6 573.7 321.2 236.2 393.5 65.3 43.4 68.6Allied lines(2)(3)(4) . . . . . . . . . . . . 388.2 349.0 314.6 385.1 342.1 304.8 121.9 56.5 128.6 31.6 16.5 42.2Auto physical damage(2) . . . . . . . . 87.3 122.3 170.5 105.0 131.0 136.9 64.3 107.2 93.7 61.2 81.9 68.4Homeowners multiple peril(4) . . . . . 82.9 70.5 72.8 74.5 77.5 72.4 17.3 16.1 13.5 23.3 20.7 18.7Other(2) . . . . . . . . . . . . . . . . . 83.0 95.2 99.5 79.9 97.9 101.4 37.6 13.6 32.1 47.1 13.9 31.7
Total property . . . . . . . . . . . . 1,138.7 1,144.5 1,240.1 1,136.5 1,193.1 1,189.2 562.3 429.6 661.4 49.5 36.0 55.6
Total . . . . . . . . . . . . . . . . . $3,881.7 $3,986.1 $4,108.1 $3,858.6 $4,039.1 $4,067.4 $2,681.8 $2,679.2 $2,907.2 69.5 66.3 71.5
(1) A large majority of the amounts within the other liability line relates to complex risks such as E&O and D&O, to generalcasualty risks and, to a much lesser extent, environmental impairment liability.
(2) In 2010, development on reserves held at December 31, 2009 relating to losses that occurred in 2009 and prior yearssignificantly decreased net losses and loss adjustment expenses incurred in the surety and credit, other property, ocean marine,auto physical damage and fire lines and significantly increased net losses and loss adjustment expenses incurred in the othercasualty and other liability lines. In addition, pre-tax net catastrophe losses of $204 million significantly increased net losses andloss adjustment expenses incurred in the fire, other property, allied lines and ocean marine lines.
(3) In 2009, development on reserves held at December 31, 2008 relating to losses that occurred in 2008 and prior yearssignificantly decreased net losses and loss adjustment expenses incurred in the fire, allied lines and surety and credit lines andsignificantly increased net losses and loss adjustment expenses incurred in the other liability line. There were no significantcatastrophe losses incurred for events occurring in 2009.
(4) In 2008, development on reserves held at December 31, 2007 relating to losses that occurred in 2007 and prior yearssignificantly decreased net losses and loss adjustment expenses incurred in the allied lines, homeowners multiple peril, autoliability and fire lines and significantly increased net losses and loss adjustment expenses incurred in the other liability andmedical malpractice lines. In addition, pre-tax net catastrophe losses of $180 million significantly increased net losses and lossadjustment expenses incurred in the allied lines, ocean marine and fire lines.
Operating results in 2010, 2009 and 2008 included pre-tax net catastrophe costs (net of reinsuranceand reinstatement premiums) of $202 million, ($6) million and $170 million, respectively. (See MD&A.)
In general, the overall operating results (including investment performance) and other changes tostockholders’ equity of property and casualty insurance and reinsurance companies, and TRH, inparticular, are subject to significant fluctuations due to competition, natural and man-made catastrophicevents, general economic and social conditions, financial, credit and industry market conditions, foreigncurrency exchange rate fluctuations, interest rates, operating performance and prospects of investeecompanies and other factors, such as changes in tax laws, tort laws and the regulatory environment.
5

Treaty and Facultative Reinsurance
Treaty reinsurance constitutes the great majority of TRH’s business, accounting for 97% of netpremiums written in each of 2010, 2009 and 2008. Facultative reinsurance comprises the balance of netpremiums written.
The following table presents certain information concerning TRH’s treaty and facultative business forthe periods indicated:
Treaty
Years Ended December 31,
2010(1) 2009(2) 2008
(in millions)
Gross premiums written . . . . . . . . . . . . . . . . . . . . . . . . . . . . . . . . . . . $3,844.7 $3,947.3 $4,088.7Net premiums written . . . . . . . . . . . . . . . . . . . . . . . . . . . . . . . . . . . . 3,754.6 3,867.8 3,976.6Net premiums earned . . . . . . . . . . . . . . . . . . . . . . . . . . . . . . . . . . . . 3,739.4 3,918.9 3,938.0
Facultative
Years Ended December 31,
2010(1) 2009(2) 2008
(in millions)
Gross premiums written . . . . . . . . . . . . . . . . . . . . . . . . . . . . . . . . . . . $ 288.2 $ 256.5 $ 334.5Net premiums written . . . . . . . . . . . . . . . . . . . . . . . . . . . . . . . . . . . . 127.1 118.3 131.5Net premiums earned . . . . . . . . . . . . . . . . . . . . . . . . . . . . . . . . . . . . 119.2 120.2 129.4
(1) In 2010 compared to 2009, domestic treaty net premiums written decreased significantly in the other liability, A&H, autoliability and medical malpractice lines. International treaty net premiums written remained level, with significant increases inthe A&H and auto liability lines being largely offset by significant decreases in the ocean marine and credit lines. Facultativegross premiums written increased in 2010 compared to 2009 due largely to an increase in premiums that, by prearrangementwith TRH, were assumed from an AIG subsidiary and then ceded in an equal amount to other AIG subsidiaries in the propertyand other liability lines. Facultative net premiums written in 2010 increased compared to 2009 principally in the other liabilityline, partially offset by a significant decrease in the A&H line.
(2) In 2009 compared to 2008, domestic treaty net premiums written increased significantly in the A&H and other liability lines,offset in part by a significant decrease in the medical malpractice line. International treaty net premiums written decreasedsignificantly in the property, auto liability, boiler and machinery and ocean marine lines, partially offset by a significant increasein the A&H and other liability lines. Facultative gross premiums written decreased in 2009 compared to 2008 due largely to adecrease in premiums that, by prearrangement with TRH, were assumed from an AIG subsidiary and then ceded in an equalamount to other AIG subsidiaries in the property and other liability lines. Facultative net premiums written in 2009 decreasedcompared to 2008 principally in the other liability line along with relatively smaller decreases spread across several lines.
Treaty Reinsurance
Treaty reinsurance accounted for approximately $3.84 billion of gross premiums written and$3.75 billion of net premiums written in 2010. Approximately 68% of total treaty gross premiums written in2010 represented treaty reinsurance written on a pro rata basis and the balance represented treatyreinsurance written on an excess-of-loss basis. Approximately 71% of treaty net premiums written resultedfrom casualty lines treaties, with the remainder from property lines treaties. Treaty business written byTRH’s international operations accounted for approximately 48% of TRH’s total net premiums written forthe year ended December 31, 2010.
TRH’s treaty business consists primarily of business within the other liability (including D&O andE&O), A&H, medical malpractice, ocean marine and aviation, auto liability (including non-standardrisks), surety and credit, fire, allied lines, auto physical damage and homeowners multiple peril lines. Asignificant portion of TRH’s business within these lines (primarily other liability, medical malpractice andA&H) is derived from complex risks.
6

TRH’s treaty business accepts a portfolio of risks on either a risk attaching basis or loss occurringduring (‘‘LOD’’) basis. For risk attaching treaties, if an individual risk covered by the treaty incepts duringthe treaty period, TRH’s liability for that policy goes to that treaty year regardless of when the loss occurs.For LOD treaties, TRH covers losses occurring during the treaty coverage period on all in-force policies,regardless of the date the policies were issued by the ceding company.
TRH’s treaty underwriting process emphasizes a team approach among TRH’s underwriters, actuariesand claims staff, as appropriate. Treaties are reviewed for compliance with TRH’s underwriting guidelinesand objectives and most treaties are evaluated in part based upon actuarial analyses conducted by TRH.TRH’s actuarial models used in such analyses are tailored in each case to the exposures and experienceunderlying the specific treaty and the loss experience for the risks covered. Property catastrophe exposedtreaties are generally evaluated using industry standard models. These models are used as a guide for riskassessment and are continually being updated. TRH also frequently conducts underwriting and claimsaudits at the offices of a prospective ceding company both before and after entering into major treaties,because reinsurers, including TRH, do not separately evaluate each of the individual risks assumed undertheir treaties and, consequently, are largely dependent on the original underwriting decisions made by theceding company. Such dependence subjects TRH, and reinsurers in general, to the possibility that theceding companies have not adequately evaluated the risks to be reinsured and, therefore, that thepremiums ceded in connection therewith may not adequately compensate the reinsurer for the riskassumed.
TRH offers brokers full service with large capacity for both casualty and property risks. TRH oftenseeks to lead treaty arrangements. The lead reinsurer on a treaty generally accepts one of the largestpercentage shares of the treaty and takes the initiative in negotiating price, terms and conditions. TRHbelieves that this strategy has enabled it to influence more effectively the terms and conditions of thetreaties in which it has participated. When TRH does not lead the treaty, it may still suggest changes to anyaspect of the treaty. TRH may reject any treaty business offered to it based upon its assessment of allrelevant factors. Such factors include type and level of risk assumed, actuarial and underwriting judgmentwith respect to rate adequacy, various treaty terms, prior and anticipated loss experience (includingexposure to natural and man-made catastrophes) on the treaty, prior business experience with the cedingcompany, overall financial position, operating results, the Standard & Poor’s (‘‘S&P’’), A.M. BestCompany (‘‘Best’’) and Moody’s Investors Service (‘‘Moody’s’’) ratings of the ceding company and social,legal, regulatory, environmental and general economic conditions affecting the risks assumed or the cedingcompany.
TRH currently has approximately 4,000 treaties in effect for the current underwriting year. In 2010, nosingle treaty exceeded 4% of treaty gross premiums written. No single ceding company accounted for morethan 6% of total treaty gross premiums written in 2010.
Approximately 5% of treaty gross premiums written in 2010 were originated by the AIG Group andceded to TRH. These originated amounts exclude premiums assumed that initially were insured by AIGsubsidiaries as a result of TRH’s marketing efforts and then ceded to TRH by prearrangement. Theamount of premiums assumed that initially were insured by AIG subsidiaries as a result of TRH’smarketing efforts and then ceded to TRH by prearrangement are not material. (See Relationship with theAIG Group.) The majority of TRH’s treaty premiums were written on a pro rata basis.
7
Facultative Reinsurance
During 2010, TRH wrote approximately $288.2 million of gross premiums written and $127.1 millionof net premiums written of facultative reinsurance. The vast majority of ceded premiums writtenrepresents amounts assumed from an AIG subsidiary and ceded in an equal amount to other AIGsubsidiaries. Approximately 62% of facultative net premiums written represented casualty risks with thebalance comprising property risks. TRH provides facultative reinsurance on predominantly anexcess-of-loss basis, although some business is written on a pro rata basis. Facultative business written byTRH’s international operations accounted for approximately 1% of TRH’s total net premiums written forthe year ended December 31, 2010.
TRH’s facultative contracts (also called certificates) provide prospective coverage on virtually thesame basis as the original policy issued by the ceding insurer. In 2010, TRH’s facultative book of businessfocused on the property, other liability and medical malpractice lines, although coverage is generallyoffered for most lines of business, and is written principally on a risk attaching basis for each risk (i.e.,TRH’s liability starts with the underlying policy inception and ends when the underlying policy expires).With respect to facultative contracts, TRH’s clients come to TRH on a risk by risk basis when they wish toobtain a larger policy limit than provided by their existing outward treaty reinsurance or when their existingtreaty reinsurance excludes a class of business or type of coverage they provide to policyholders.
Other underwriting expenses associated with facultative business are generally higher in proportion torelated premiums than those associated with treaty business, reflecting, among other things, the morelabor-intensive nature of underwriting and servicing facultative business.
No single ceding company accounted for more than 6% of total facultative gross premiums written in2010. Approximately 5% of facultative gross premiums written in 2010 were originated by the AIG Group.These originated amounts exclude amounts assumed from an AIG subsidiary and ceded in an equalamount to other AIG subsidiaries. (See Relationship with the AIG Group.)
Retrocession Arrangements
To a limited extent, TRH enters into retrocession arrangements, generally in order to reduce theeffect of individual or aggregate losses, to reduce volatility in specific lines, to improve risk adjustedportfolio returns and to increase gross premium writings and risk capacity without requiring additionalcapital.
Retrocession arrangements do not relieve TRH from its obligations to the insurers and reinsurersfrom whom it assumes business. The failure of retrocessionnaires to honor their obligations could result inlosses to TRH. TRH holds substantial amounts of funds, trust agreements and letters of credit tocollateralize reinsurance recoverables. Such funds, trust agreements and letters of credit can be drawn onfor amounts remaining unpaid beyond contract terms. In addition, an allowance has been established forestimated unrecoverable amounts.
As of December 31, 2010, TRH had in place approximately 120 active retrocessional arrangements forcurrent and prior underwriting years with approximately 310 retrocessionnaires, and reinsurancerecoverable on paid and unpaid losses and loss adjustment expenses totaled $819.7 million. No unsecuredrecoverables from a single retrocessionnaire are considered material to the financial position of TRH. (SeeNote 16.)
Risk Management
TRH employs an Enterprise Risk Management (‘‘ERM’’) framework to identify, assess, quantify,mitigate and manage TRH’s risks in order to maximize its long-term value and achieve its corporateobjectives. This framework is integrated into the day-to-day activities of TRH as well as its strategicplanning processes.
8

As part of this framework, TRH determines its underwriting risk profile by giving underwriters writtenunderwriting authorities which are linked to competence and delegated according to class, risk limits,program limits and premium limits. The monitoring of underwriting and claims performance takes variousforms including the qualitative review of underwriting files and rationales by peers and internal auditreviews of underwriting authorities and data input into TRH’s real-time management information system.Class results are reviewed quarterly at meetings between the regional Chief Underwriting Officers, the riskmanagement department, the heads of underwriting areas, line underwriters, actuaries and the claimsdepartment. In addition, the actuarial department monitors rate adequacy, conducts profitability studiesand assesses reserve adequacy.
Aggregating exposures are managed centrally through the establishment of risk tolerances which areset annually and monitored through quarterly and half-yearly roll ups of actual exposures. TRH has alsodeveloped a scenario-based assessment of potential loss events that focuses on cross-class aggregations andcorrelations. For natural catastrophe exposures, roll-ups are conducted using proprietary rating modelssupplemented by internally generated assessments for un-modeled exposures. (See Catastrophe Exposurein MD&A for further information.)
The risk management team is led by the Chief Risk Officer (‘‘CRO’’) who reports directly to the ChiefExecutive Officer (‘‘CEO’’). The CEO chairs a Corporate Risk Management Committee composed ofexecutive officers including the CRO, Chief Financial Officer, Chief Underwriting Officer, DomesticOperations, President International Operations, President Latin American and Caribbean Division, ChiefActuary, General Counsel, Chief Information Officer, Senior Claims Executive in New York and the ChiefCompliance Officer, among others. In addition, the Risk Management Committee of the Company’sBoard of Directors provides board oversight of the risk management of TRH.
In all major branches, local risk committees meet quarterly to review the major risks of TRH includingregulatory, operational, credit and other financial risks. These committees include senior representativesfrom the finance and accounting, claims, actuarial, systems, legal, compliance and underwritingdepartments and report to the risk management department in New York. TRH uses various toolsincluding an employee code of conduct, mandatory ethics training, internal audit reviews and businesscontinuity planning to mitigate its operational risks.
TRH utilizes investment strategies to manage asset type, sector, industry, issuer and issueconcentrations within the investment portfolio and uses an approved reinsurers list to communicatethroughout TRH the acceptability of potential retrocessionaires.
TRH is engaged in the continuous review and enhancement of its ERM framework, which includesthe development of an economic capital model to assess the probability and potential severity of riskevents and to determine the optimum risk adjusted profile for TRH.
Marketing
TRH provides property and casualty reinsurance capacity through brokers as well as directly toinsurance and reinsurance companies in both the domestic and international markets. TRH believes itsworldwide network of offices helps position TRH to take advantage of market opportunities.
Brokerage fees generally are paid by reinsurers. In 2010, approximately 76% of TRH’s grosspremiums written was written through brokers and the balance was written directly. In 2010, companiescontrolled by Aon Corporation (‘‘Aon’’) and Marsh & McLennan Companies, Inc. (‘‘Marsh’’), were TRH’slargest brokerage sources of business. Business brokered by Aon, Marsh and the rest of TRH’s ten largest
9

brokerage sources of business as a percentage of TRH’s consolidated revenues and total gross premiumswritten in 2010 are presented below:
GrossPremiums
Revenues Written
Aon . . . . . . . . . . . . . . . . . . . . . . . . . . . . . . . . . . . . . . . . . . . . . . . . . . . . . . . . . 25% 26%Marsh . . . . . . . . . . . . . . . . . . . . . . . . . . . . . . . . . . . . . . . . . . . . . . . . . . . . . . . . 18 19Next eight largest brokerage sources . . . . . . . . . . . . . . . . . . . . . . . . . . . . . . . . . . 18 20
Ten largest brokerage sources . . . . . . . . . . . . . . . . . . . . . . . . . . . . . . . . . . . . . . . 61% 65%
The business attributable to a broker includes all gross premiums produced by that broker and itsaffiliates in the full year regardless of the date that any such affiliate was acquired.
TRH believes that its emphasis on generally seeking the lead position in reinsurance treaties in whichit participates is beneficial in obtaining business. Brokers do not have the authority to bind TRH withrespect to reinsurance agreements, nor does TRH commit in advance to accept any portion of the businessthat brokers submit to it.
Claims
Claims are managed by TRH’s professional claims staff whose responsibilities include the review ofinitial loss reports, creation of claim files, determination of whether further investigation is required,establishment and adjustment of case reserves and payment of claims. In addition to claims assessment,processing and payment, the claims staff conducts comprehensive claims audits of both specific claims andoverall claims procedures at the offices of selected ceding companies, which TRH believes benefit allparties to the reinsurance arrangement. Claims audits are conducted in the ordinary course of business. Incertain instances, a claims audit may be performed prior to assuming reinsurance business.
Reserves for Unpaid Losses and Loss Adjustment Expenses (‘‘Gross Loss Reserves’’)
Significant periods of time may elapse between the occurrence of an insured loss, the reporting of theloss to the ceding company and the reinsurer, and the ceding company’s payment of that loss andsubsequent payments to the ceding company by the reinsurer. Insurers (and reinsurers) establish gross lossreserves, which represent estimates of future amounts needed to pay claims and related expenses withrespect to insured events which have occurred on or before the balance sheet date, including events whichhave not been reported to the company.
Upon receipt of a notice of claim from the ceding company, TRH establishes its own case reserve forthe estimated amount of the ultimate settlement, if any. Case reserves usually are based upon the amountof reserves recommended by the ceding company and may be supplemented by additional amounts asdeemed necessary. In certain instances, TRH establishes case reserves even when the ceding company hasnot reported any liability to TRH.
TRH also establishes reserves to provide for the estimated expenses of settling claims, including legaland other fees, the general expenses of administering the claims adjustment process (i.e., loss adjustmentexpenses (‘‘LAE’’)), and for losses and LAE incurred but not reported (‘‘IBNR’’). TRH calculates LAEand IBNR reserves by using generally accepted actuarial reserving techniques to estimate the ultimateliability for losses and LAE. Such reserves are periodically reassessed by TRH to adjust for changes in theexpected loss emergence pattern over time. TRH has an in-house actuarial staff which periodically reviewsTRH’s unpaid losses and LAE both gross and net of related reinsurance recoverables.
Gross loss reserves represent the accumulation of case reserves and IBNR reserves. Provisions forinflation and social inflation (e.g., awards by judges and juries which progressively increase in size at a rate
10

exceeding that of general inflation) are implicitly considered in the overall reserve setting process as anelement of the numerous judgments which are made as to expected trends in average claim severity.Legislative changes may also affect TRH’s liabilities, and evaluation of the impact of such changes is madein the reserve setting process.
The methods of determining estimates for unreported losses and establishing the resulting reservesand related reinsurance recoverable are continually reviewed and updated, and any resulting adjustmentsare reflected in income currently. The process relies upon the basic assumption that past experience,adjusted for the effect of current developments and likely trends, is an appropriate basis for predictingfuture events. However, estimation of loss reserves is a difficult process, especially in view of changing legaland economic environments which impact the development of loss reserves, and therefore quantitativetechniques frequently have to be supplemented by subjective considerations and managerial judgment. Inaddition, trends that have affected development of liabilities in the past may not necessarily occur or affectliability development to the same degree in the future.
While the reserving process is difficult and subjective for the ceding companies, the inherentuncertainties of estimating such reserves are even greater for the reinsurer, due primarily to the longerterm nature of much reinsurance business, the diversity of development patterns among different types ofreinsurance treaties or facultative contracts, the necessary reliance on the ceding companies forinformation regarding reported claims and differing reserving practices among ceding companies, whichcan be subject to change without notice. TRH writes a significant amount of non-proportional assumedcasualty reinsurance as well as proportional assumed reinsurance of excess casualty business for classessuch as medical malpractice and D&O, which can exhibit greater volatility over time than most otherclasses due to their low frequency, high severity nature and loss cost trends that are more difficult topredict.
During the loss settlement period, which can be many years in duration, additional facts regardingindividual claims and trends usually become known. As these become apparent, it usually becomesnecessary to refine and adjust the reserves upward or downward. Even then, the ultimate net liability maybe materially different from the revised estimates which are reflected in TRH’s consolidated financialstatements, and such differences may have, and in certain years have had, a material effect on net income.(See MD&A, including the discussion of Critical Accounting Estimates, and Note 2(i) of Notes toConsolidated Financial Statements for further discussion.)
Net losses and LAE incurred consist of the estimated ultimate cost of settling claims incurred withinthe reporting period (net of related reinsurance recoverable), including IBNR claims, plus changes inestimates of liabilities for prior period losses.
The ‘‘Analysis of Consolidated Net Loss Reserves Development’’ which follows presents thedevelopment of unpaid losses and LAE net of related reinsurance recoverables (‘‘net loss reserves’’) forcalendar years 2000 through 2010. The upper half of the table shows the cumulative amounts paid duringsuccessive years relating to the opening reserve. For example, with respect to the net loss reserve of$7.35 billion as of December 31, 2008, by the end of 2010 (two years later) $2.79 billion had actually beenpaid in settlement of those net loss reserves. In addition, as reflected in the lower section of the table, theoriginal net loss reserve of $7.35 billion was re-estimated to be $7.41 billion at December 31, 2010. Thischange from the original estimate would normally result from a combination of a number of factors,including losses being settled for different amounts than originally estimated. The original estimates willalso be increased or decreased as more information becomes known about the individual claims, overallclaim frequency and severity patterns. The net (deficiency) redundancy depicted in the table, for anyparticular calendar year, shows the aggregate change in estimates over the period of years subsequent tothe calendar year reflected at the top of the respective columns. For example, the net deficiency of$56.1 million at December 31, 2010 relating to December 31, 2008 net loss reserves of $7.35 billionrepresents the cumulative amount by which net loss reserves as of year-end 2008 have developed adverselyfrom that date through the end of 2010.
11

Each amount other than the original reserves in the following table includes the effects of all changesin amounts for prior periods. For example, if a loss settled in 2007 for $150,000 was first reserved in 2004 at$100,000 and remained unchanged until settlement, the $50,000 deficiency (actual loss minus originalestimate) would be included in the cumulative net (deficiency) redundancy in each of the years in theperiod 2004 through 2006 shown in the following table. Conditions and trends that have affecteddevelopment of liability in the past may not necessarily occur in the future. Accordingly, it may not beappropriate to extrapolate future development based on this table.
The ‘‘Analysis of Net Unpaid Losses and Loss Adjustment Expenses and Net Reestimated Liability’’presents additional information regarding the development of gross loss reserves.
ANALYSIS OF CONSOLIDATED NET LOSS RESERVES DEVELOPMENT(1)
2000 2001 2002 2003 2004 2005 2006 2007 2008 2009 2010
(in thousands)
Net loss reserves, as of December 31:(2) . . $ 2,614,917 $ 2,908,887 $ 3,257,906 $ 3,956,420 $ 4,980,609 $5,690,443 $6,207,220 $6,899,716 $7,349,078 $7,871,825 $8,214,773Cumulative paid as of:
One year later . . . . . . . . . . . . . . . 892,752 1,033,574 1,057,314 1,090,058 1,492,464 1,447,284 1,464,916 1,841,768 1,559,712 1,730,801Two years later . . . . . . . . . . . . . . . 1,573,227 1,759,047 1,806,388 2,035,299 2,416,036 2,526,261 2,761,250 2,813,396 2,785,333Three years later . . . . . . . . . . . . . . 2,071,480 2,332,901 2,535,149 2,792,484 3,263,061 3,549,463 3,485,127 3,670,987Four years later . . . . . . . . . . . . . . 2,499,596 2,932,043 3,198,831 3,485,611 4,028,731 4,127,882 4,087,258Five years later . . . . . . . . . . . . . . . 2,940,058 3,479,594 3,792,955 4,112,690 4,453,364 4,600,637Six years later . . . . . . . . . . . . . . . 3,333,401 3,953,515 4,297,909 4,470,656 4,830,109Seven years later . . . . . . . . . . . . . . 3,649,883 4,365,880 4,609,558 4,787,305Eight years later . . . . . . . . . . . . . . 3,952,850 4,620,686 4,877,601Nine years later . . . . . . . . . . . . . . 4,137,488 4,840,932Ten years later . . . . . . . . . . . . . . . 4,311,121
Net reestimated liability as of:(2)
End of year . . . . . . . . . . . . . . . . . 2,614,917 2,908,887 3,257,906 3,956,420 4,980,609 5,690,443 6,207,220 6,899,716 7,349,078 7,871,825 8,214,773One year later . . . . . . . . . . . . . . . 2,650,589 3,248,013 3,580,493 4,273,802 5,249,445 5,871,571 6,295,600 6,899,232 7,310,130 7,814,866Two years later . . . . . . . . . . . . . . . 3,088,303 3,561,876 4,112,290 4,781,344 5,557,243 6,133,365 6,385,124 6,958,926 7,405,177Three years later . . . . . . . . . . . . . . 3,392,021 4,176,419 4,637,194 5,110,862 5,878,870 6,282,334 6,441,824 7,040,272Four years later . . . . . . . . . . . . . . 3,872,054 4,641,988 4,976,922 5,485,195 6,066,219 6,401,324 6,530,650Five years later . . . . . . . . . . . . . . . 4,217,748 4,904,646 5,345,798 5,701,065 6,209,964 6,527,430Six years later . . . . . . . . . . . . . . . 4,396,225 5,184,316 5,555,013 5,881,308 6,364,893Seven years later . . . . . . . . . . . . . . 4,584,446 5,390,160 5,742,547 6,044,934Eight years later . . . . . . . . . . . . . . 4,747,977 5,570,367 5,911,378Nine years later . . . . . . . . . . . . . . 4,898,056 5,730,318Ten years later . . . . . . . . . . . . . . . 5,045,101
Net (deficiency) redundancy as ofDecember 31, 2010 . . . . . . . . . . . . $(2,430,184) $(2,821,431) $(2,653,472) $(2,088,514) $(1,384,284) $ (836,987) $ (323,430) $ (140,556) $ (56,099) $ 56,959
(1) This table is on a calendar year basis and does not present accident or underwriting year data.(2) Represents unpaid losses and loss adjustment expenses, net of related reinsurance recoverables.
12

ANALYSIS OF NET UNPAID LOSSES AND LOSS ADJUSTMENT EXPENSESAND NET REESTIMATED LIABILITY(1)
2000 2001 2002 2003 2004 2005 2006 2007 2008 2009 2010
(in thousands)
End of year:Gross liability . . . . . . . . . . . . . . . . . . . . . . $ 3,077,162 $ 3,747,583 $ 4,032,584 $ 4,805,498 $ 5,941,464 $7,113,294 $7,467,949 $7,926,261 $8,124,482 $8,609,105 $9,020,610Related reinsurance recoverable . . . . . . . . . . . . 462,245 838,696 774,678 849,078 960,855 1,422,851 1,260,729 1,026,545 775,404 737,280 805,837
Net liability . . . . . . . . . . . . . . . . . . . . . . . $ 2,614,917 $ 2,908,887 $ 3,257,906 $ 3,956,420 $ 4,980,609 $5,690,443 $6,207,220 $6,899,716 $7,349,078 $7,871,825 $8,214,773
One year later:Gross reestimated liability . . . . . . . . . . . . . . . $ 3,126,518 $ 4,136,126 $ 4,465,908 $ 5,117,490 $ 6,344,019 $7,306,595 $7,633,138 $7,918,300 $8,070,824 $8,584,657Reestimated related reinsurance recoverable . . . . . . 475,929 888,113 885,415 843,688 1,094,574 1,435,024 1,337,538 1,019,068 760,694 769,791
Net reestimated liability . . . . . . . . . . . . . . . . $ 2,650,589 $ 3,248,013 $ 3,580,493 $ 4,273,802 $ 5,249,445 $5,871,571 $6,295,600 $6,899,232 $7,310,130 $7,814,866
Two years later:Gross reestimated liability . . . . . . . . . . . . . . . $ 3,565,853 $ 4,556,676 $ 5,003,598 $ 5,761,231 $ 6,633,579 $7,618,979 $7,722,795 $7,988,632 $8,192,939Reestimated related reinsurance recoverable . . . . . . 477,550 994,800 891,308 979,887 1,076,336 1,485,614 1,337,671 1,029,706 787,762
Net reestimated liability . . . . . . . . . . . . . . . . $ 3,088,303 $ 3,561,876 $ 4,112,290 $ 4,781,344 $ 5,557,243 $6,133,365 $6,385,124 $6,958,926 $7,405,177
Three years later:Gross reestimated liability . . . . . . . . . . . . . . . $ 3,970,012 $ 5,188,506 $ 5,678,239 $ 6,096,568 $ 7,017,192 $7,769,983 $7,770,305 $8,109,348Reestimated related reinsurance recoverable . . . . . . 577,991 1,012,087 1,041,045 985,706 1,138,322 1,487,649 1,328,481 1,069,076
Net reestimated liability . . . . . . . . . . . . . . . . $ 3,392,021 $ 4,176,419 $ 4,637,194 $ 5,110,862 $ 5,878,870 $6,282,334 $6,441,824 $7,040,272
Four years later:Gross reestimated liability . . . . . . . . . . . . . . . $ 4,492,711 $ 5,814,220 $ 6,034,785 $ 6,536,334 $ 7,219,505 $7,886,168 $7,905,520Reestimated related reinsurance recoverable . . . . . . 620,657 1,172,232 1,057,863 1,051,139 1,153,286 1,484,844 1,374,870
Net reestimated liability . . . . . . . . . . . . . . . . $ 3,872,054 $ 4,641,988 $ 4,976,922 $ 5,485,195 $ 6,066,219 $6,401,324 $6,530,650
Five years later:Gross reestimated liability . . . . . . . . . . . . . . . $ 4,868,258 $ 6,099,084 $ 6,467,893 $ 6,766,081 $ 7,364,727 $8,064,325Reestimated related reinsurance recoverable . . . . . . 650,510 1,194,438 1,122,095 1,065,016 1,154,763 1,536,895
Net reestimated liability . . . . . . . . . . . . . . . . $ 4,217,748 $ 4,904,646 $ 5,345,798 $ 5,701,065 $ 6,209,964 $6,527,430
Six years later:Gross reestimated liability . . . . . . . . . . . . . . . $ 5,058,733 $ 6,441,624 $ 6,692,327 $ 6,952,158 $ 7,577,067Reestimated related reinsurance recoverable . . . . . . 662,508 1,257,308 1,137,314 1,070,850 1,212,174
Net reestimated liability . . . . . . . . . . . . . . . . $ 4,396,225 $ 5,184,316 $ 5,555,013 $ 5,881,308 $ 6,364,893
Seven years later:Gross reestimated liability . . . . . . . . . . . . . . . $ 5,262,921 $ 6,660,562 $ 6,887,469 $ 7,177,351Reestimated related reinsurance recoverable . . . . . . 678,475 1,270,402 1,144,922 1,132,417
Net reestimated liability . . . . . . . . . . . . . . . . $ 4,584,446 $ 5,390,160 $ 5,742,547 $ 6,044,934
Eight years later:Gross reestimated liability . . . . . . . . . . . . . . . $ 5,439,253 $ 6,849,486 $ 7,120,562Reestimated related reinsurance recoverable . . . . . . 691,276 1,279,119 1,209,184
Net reestimated liability . . . . . . . . . . . . . . . . $ 4,747,977 $ 5,570,367 $ 5,911,378
Nine years later:Gross reestimated liability . . . . . . . . . . . . . . . $ 5,591,138 $ 7,075,398Reestimated related reinsurance recoverable . . . . . . 693,082 1,345,080
Net reestimated liability . . . . . . . . . . . . . . . . $ 4,898,056 $ 5,730,318
Ten years later:Gross reestimated liability . . . . . . . . . . . . . . . $ 5,780,354Reestimated related reinsurance recoverable . . . . . . 735,253
Net reestimated liability . . . . . . . . . . . . . . . . $ 5,045,101
Gross (deficiency) redundancy as of December 31, 2010 . $(2,703,192) $(3,327,815) $(3,087,978) $(2,371,853) $(1,635,603) $ (951,031) $ (437,571) $ (183,087) $ (68,457) $ 24,448
(1) This table is on a calendar year basis and does not represent accident or underwriting year data.
13

The trend depicted in the latest development year in the net reestimated liability portion of the‘‘Analysis of Consolidated Net Loss Reserves Development’’ table and in the ‘‘Analysis of Net UnpaidLosses and Loss Adjustment Expenses and Net Reestimated Liability’’ table reflects net favorabledevelopment. Net favorable development of $57.0 million was recorded in 2010 on losses occurring in allprior years. (See MD&A for a discussion of the causes of the net favorable development.) This netfavorable development was comprised of net favorable development of $216.9 million for losses occurringin 2002 to 2009, partially offset by net adverse development of $159.9 million for losses occurring in 2001and prior.
For TRH’s domestic subsidiaries (TRC and Putnam), there is no difference in reserves for losses andLAE, net of related reinsurance recoverable, whether determined in accordance with generally acceptedaccounting principles in the U.S. (‘‘GAAP’’) or statutory accounting principles. (See Note 6 of Notes toConsolidated Financial Statements for a reconciliation of beginning and ending gross and net lossreserves.)
Investment Operations
TRH’s investments must comply with the insurance laws of the State of New York, the state ofdomicile of TRC and Putnam, and of the other states and jurisdictions in which the Company and itssubsidiaries are regulated. These laws prescribe the kind, quality and concentration of investments whichmay be made by insurance companies. In general, these laws permit investments, within specified limitsand subject to certain qualifications, in federal, state and municipal obligations, corporate fixed maturities,preferred and common stocks, real estate mortgages and real estate. The Finance and InvestmentCommittee of the Company’s Board of Directors and senior management oversee investments, establishTRH’s investment strategy and implement investment decisions. Through June 30, 2009, the AIG Groupacted as financial advisors and managers of TRH’s investment portfolio and, in connection therewith,made the selection of particular investments. Effective July 1, 2009, TRH employs a third party notaffiliated with AIG to provide these services.
TRH’s current investment strategy seeks to optimize after-tax income through a high qualitydiversified taxable fixed maturity and tax-exempt municipal fixed maturity portfolio, while maintaining anadequate level of liquidity. TRH adjusts its mix of taxable and tax-exempt investments, as appropriate,generally as a result of strategic investment and tax planning considerations. Historically, tax-exempt fixedmaturities carry lower pre-tax yields than taxable fixed maturities that are comparable in risk and term tomaturity due to their tax-advantaged status. (See MD&A.) The equity portfolio is structured to achievecapital appreciation primarily through a selection of large capitalization U.S. stocks. Other invested assetsprincipally include alternative investments and TRH’s 40% interest in Kuwait Re.
Through 2008, TRH participated in a securities lending program (the ‘‘Securities Lending Program’’)managed by a subsidiary of AIG, whereby certain securities (principally fixed maturities available for sale)from its portfolio were loaned to third parties. (See Note 4(h) of Notes to Consolidated FinancialStatements.) Under such program, TRH loaned securities to counterparties and received collateral,generally cash, which was invested to earn a spread. The collateral received was invested in separateportfolios containing floating rate bonds (i.e., fixed maturities), including asset-backed securities, andinterest-bearing cash equivalents. These portfolios were maintained in segregated accounts for TRH by theprogram manager. The collateral was returned to the counterparties when the loaned securities werereturned to TRH at a future date. In the fourth quarter of 2008, TRH terminated its participation in theSecurities Lending Program.
14

The following table reflects investment results for TRH for each of the five years in the period endedDecember 31, 2010.
INVESTMENT RESULTS(1)
Excluding Securities LendingConsolidated Program(2)
Average AverageInvestments Investments
and Pre-Tax Net Pre-Tax and Pre-Tax Net Pre-TaxInterest-Bearing Investment Effective Interest-Bearing Investment Effective
Years Ended December 31, Cash(3) Income Yield(4) Cash(5) Income(6) Yield(7)
(dollars in thousands)
2010 . . . . . . . . . . . . . . . . . . . $12,838,300 $473,547 3.7% $12,838,300 $473,547 3.7%2009 . . . . . . . . . . . . . . . . . . . 11,460,994 467,402 4.1 11,460,994 467,402 4.12008 . . . . . . . . . . . . . . . . . . . 11,595,522 440,451 3.8 10,589,507 437,883 4.12007 . . . . . . . . . . . . . . . . . . . 12,024,944 469,772 3.9 10,171,508 467,293 4.62006 . . . . . . . . . . . . . . . . . . . 10,270,004 434,540 4.2 9,119,143 432,343 4.7
(1) See discussion of the impact of the Securities Lending Program on investment yields in 2008 in Results of Operations inMD&A.
(2) Represents consolidated information excluding the Securities Lending Program which better reflects the return on the currentinvestment portfolio as the Securities Lending Program was terminated in the fourth quarter of 2008.
(3) Average of beginning and ending carrying values of investments and interest-bearing cash and cash equivalents for the year.(4) Pre-tax net investment income divided by average investments and interest-bearing cash and cash equivalents.(5) Average of beginning and ending carrying values of investments and interest-bearing cash and cash equivalents excluding
securities lending invested collateral.(6) Pre-tax net investment income excluding net investment income from securities lending invested collateral.(7) Pre-tax net investment income excluding net investment income from securities lending invested collateral divided by average
investments and interest-bearing cash and cash equivalents excluding securities lending invested collateral.
The carrying values of available for sale securities are subject to significant volatility from changes intheir fair values. (See MD&A.)
As of December 31, 2010, the fair value of the total investment portfolio was $13.02 billion.
In addition, TRH’s investments are exposed to market and other significant risks which could result inthe loss of fair value. Market risk results from the potential for adverse fluctuations in interest rates, equityprices and foreign currency exchange rates. TRH has performed Value at Risk (‘‘VaR’’) analyses toestimate the maximum potential loss of fair value that could occur as a result of market risk over a periodof one month at a confidence level of 95%. TRH’s market risk analyses do not provide weight to risksrelating to market issues such as liquidity and the credit-worthiness of investments. (See Item 7A.Quantitative and Qualitative Disclosures About Market Risk.)
Competition
The reinsurance business is a mature, highly competitive industry in virtually all lines of business. (SeeMD&A for a discussion of market conditions and trends in competition intensity in recent years.)
Competition in the types of reinsurance in which TRH engages is based on many factors, including theperceived overall financial strength of the reinsurer, S&P, Best and Moody’s ratings, states or otherjurisdictions where the reinsurer is licensed, accredited, authorized or can serve as a reinsurer, capacity andcoverages offered, premiums charged, specific terms and conditions of the reinsurance offered, value-added services offered, speed of claims payment and reputation and experience in the lines of businessunderwritten. These factors also operate in the aggregate across the reinsurance industry, generally incombination with prevailing economic conditions. Reinsurance purchases are also sensitive to cyclical
15

movements in reinsurance rates, terms and conditions and, ultimately, the reinsurance industry’s overallfinancial results.
TRH competes in the United States and international reinsurance markets with numerousinternational and domestic reinsurance companies, some of which have greater resources than TRH oroperate in different regulatory jurisdictions and tax environments. TRH’s competitors include independentreinsurance companies, subsidiaries or affiliates of established worldwide insurance companies,reinsurance departments of certain primary insurance companies, domestic and European underwritingsyndicates and, in some instances, government owned or subsidized facilities. Although most reinsurancecompanies operate in the broker market, TRH’s largest competitors also work directly with cedingcompanies, competing with brokers.
Traditional reinsurers as well as capital market participants from time to time produce alternativeproducts (such as reinsurance securitizations, catastrophe bonds and various derivatives such as swaps)that may compete with certain types of reinsurance, such as property catastrophe. Over time, thesenumerous initiatives could significantly affect supply, pricing and competition in the reinsurance industry.
Employees
At December 31, 2010, TRH had approximately 640 employees. Approximately 270 employees werelocated in the New York headquarters; 120 employees were located in other locations in the United Statesand 250 employees were located in offices outside of the United States.
Regulation
TRH’s operations are subject to regulation in the U.S. and abroad. Changes to the regulatoryenvironment can have a significant effect on TRH and its businesses. TRC, TRZ and Putnam, in commonwith other reinsurers, are subject to regulation and supervision by the states and by other jurisdictions inwhich they do business. Within the United States, the method of such regulation varies but generally has itssource in statutes that delegate regulatory and supervisory powers to an elected or appointed stateinsurance official. This regulation and supervision focuses primarily on the level of solvency that must bemaintained, including risk-based capital measurements, limitations on the form of investments and otherforms of risk. In addition, such regulation covers the licensing of underwriters of insurance andreinsurance, restrictions on the size of risks which may be insured under a single contract, specifications fordeposits of securities for the benefit of ceding companies, methods of accounting, periodic examinations ofthe affairs and financial reports of insurance companies, the form and content of reports of financialcondition required to be filed, and reserves for unearned premiums, losses and other purposes. Asrequired by the State of New York, TRC and Putnam use the Codification of Statutory AccountingPrinciples as primary guidance on statutory accounting. In general, such regulation is for the protection ofthe ceding companies and, ultimately, their policyholders rather than security holders.
The rates and contract terms of reinsurance agreements with non-affiliates are generally not subject toregulation by any governmental authority. This contrasts with primary insurance agreements where therates and policy terms are generally closely regulated by governmental authorities. As a practical matter,however, the rates charged by primary insurers and the policy terms of primary insurance agreements mayaffect the rates charged and the policy terms under associated reinsurance agreements.
The Company, under the relevant insurance laws, is deemed an insurance holding company and TRHand its insurance company affiliates are subject to the insurance holding company statutes of various statesand jurisdictions. The insurance holding company laws and regulations vary from jurisdiction tojurisdiction, but generally require domestic insurance holding companies and insurers and reinsurers thatare subsidiaries of insurance holding companies to register with the applicable state regulatory authorityand to file with that authority certain reports which provide information concerning their capital structure,ownership, financial condition, affiliated company transactions and general business operations.
16
Such insurance holding company laws generally also require prior regulatory agency approval ofchanges in direct or indirect control of an insurer or reinsurer and of certain material intercorporatetransfers of assets within the holding company structure. The New York insurance law provides that nocorporation or other person, except an authorized insurer, may acquire direct control of TRC or Putnam,or acquire control of the Company and thus indirect control of TRC and Putnam, unless such corporationor person has obtained the prior approval of the New York State Insurance Department (the ‘‘NYS ID’’)for such acquisition. For the purposes of the New York insurance law, any investor acquiring ten percent ormore of the Company’s common shares would be presumed to be a ‘‘controlling person’’ of the Companyand its subsidiaries, unless the NYS ID determines upon application that such investor would not controlthe Company. An investor who could be deemed a ‘‘controlling person’’ of the Company would berequired to obtain the approval of the NYS ID prior to such acquisition. In addition, such investor wouldbecome subject to various ongoing reporting requirements in New York and in certain other states.
Risk Based Capital (‘‘RBC’’) is designed to measure the adequacy of an insurer’s statutory surplus inrelation to the risks inherent in its business. Thus, in theory, inadequately capitalized insurance companiescan be identified. The RBC formula develops a risk adjusted target level of statutory surplus by applyingcertain factors to various asset, premium and reserve items. Higher factors are applied to items deemed tohave more risk by the National Association of Insurance Commissioners (‘‘NAIC’’) and lower factors areapplied to items that are deemed to have less risk. Thus, the target level of statutory surplus varies not onlyas a result of the insurer’s size, but also on the risk profile of the insurer’s operations.
The RBC Model Law provides for four incremental levels of regulatory attention for insurers whosesurplus is below the calculated RBC target. These levels of attention range in severity from requiring theinsurer to submit a plan for corrective action to placing the insurer under regulatory control.
At December 31, 2010, the statutory surpluses of TRC and Putnam each exceeded the level of surplusrequired under RBC requirements for regulatory attention.
Through the ‘‘credit for reinsurance’’ mechanism, TRC and Putnam are indirectly subject to theeffects of regulatory requirements imposed by the states in which TRC’s and Putnam’s ceding companiesare licensed. In general, an insurer which obtains reinsurance from a reinsurer that is licensed, accreditedor authorized by the state in which the insurer files statutory financial statements is permitted to take acredit on its statutory financial statements in an aggregate amount equal to the reinsurance recoverable onpaid losses and the liabilities for unearned premiums and loss and LAE reserves ceded to the reinsurer,subject to certain limitations where amounts of reinsurance recoverable on paid losses are more than90 days overdue. Certain states impose additional requirements that make it difficult to become soauthorized, and certain states do not allow credit for reinsurance ceded to reinsurers that are not licensedor accredited in that state without additional provision for security.
In July 2010, the Dodd-Frank Wall Street Reform and Consumer Protection Act (‘‘Dodd-Frank’’) wasenacted. Dodd-Frank included specific provisions regarding the regulation of reinsurance. Under thereinsurance provisions of Dodd-Frank, with respect to reinsurance agreements entered on or after July 21,2011, whether credit for reinsurance in financial statements is allowed will be determined by the state thatis the domestic U.S. regulator of the ceding insurer, provided such state is accredited by the NAIC orfound to be substantially equivalent. This provision prevents the non-domestic regulators of the cedinginsurer from reaching a separate determination with respect to availability of credit for reinsurance.Dodd-Frank also creates the Federal Insurance Office (the ‘‘FIO’’). The FIO has no administrativeauthority but will have the authority to collect data and to assist the U.S. Secretary of the Treasury innegotiating covered agreements. A covered agreement is a bilateral or multilateral agreement regardingprudential measures with respect to the business of insurance or reinsurance that is (i) entered intobetween the U.S. and one or more foreign governments, authorities or regulatory entities; and (ii) relatesto the recognition of prudential measures with respect to the business of insurance or reinsurance thatachieves a level of protection achieved under state insurance or reinsurance regulation.
17

In response to Dodd-Frank, several individual states including Florida and New York have developedtheir own credit for reinsurance guidelines modeled on the NAIC Reinsurance Regulatory ModernizationFramework proposal. These state-based initiatives permit the insurance supervisor to consider the financialcondition of an assuming reinsurer in addition to its domicile when determining credit for reinsurance. TheNAIC is currently in the process of drafting a sweeping Solvency Modernization Initiative. While thisinitiative is in its early stages, the NAIC has completed a road-map and has articulated its objectives. Thefinal manifestation of the initiative will come in the form of draft Model laws and Acts for adoption by theindividual states. These drafts are not expected to be completed in the near future.
In addition to the Dodd-Frank and the various state actions, a federal proposal was introduced inCongress which would allow industry participants to voluntarily choose a federal charter over the currentstate system. Consequently, collateral requirements under credit for reinsurance rules may be based in parton domicile and in part on each reinsurer’s financial strength rating as assigned by the NAIC or itsdesignated rating organization(s). TRH does not presently expect this proposal to have a material effect onits operations. However, such proposal is expected to reduce the amount of collateral that many non-U.S.domiciled companies will need to post to secure their obligations to U.S. domiciled insurers and reinsurers.
TRH’s international operations are regulated in various jurisdictions with respect to licensingrequirements, currency, amount and type of security deposits, amount and type of reserves and amountand type of local investment. International operations and assets held abroad may be adversely affected bypolitical and other developments in foreign countries, including possible tax changes, nationalization andchanges in regulatory policy, as well as by consequences of hostilities and unrest. The risks of suchoccurrences and their overall effect upon TRH vary from country to country and cannot easily bepredicted. Regulations governing technical reserves and remittance of balances in some countries mayhinder remittance of profits and repatriation of assets.
The Terrorism Risk Insurance Act of 2002 (‘‘TRIA’’) was signed into law in November 2002 andextended for two years in December 2005. TRIA provided coverage to the insurance industry for acts ofterrorism, as defined by TRIA. The Terrorism Risk Insurance Extension Act of 2005 (‘‘TRIEA’’) greatlyincreased the portion of the loss the insurance industry would pay in the event of a terrorist attack andreduced the number of lines covered. This coverage does not apply to reinsurers. The Terrorism RiskInsurance Program Reauthorization Act of 2007 (‘‘TRIPRA’’) extended the TRIEA program through 2014.TRIPRA removes the distinction between foreign and domestic acts of terrorism and hardens the cap oninsurers’ aggregate liability at $100 billion. Additionally, TRIPRA mandates that Federal fund outlays berecouped by mandatory policyholder surcharges. In general, TRH does not provide terrorism cover underinternational property treaties nor does it provide cover for certified acts of terrorism, as defined byTRIEA, under domestic property treaties. TRH offers terrorism-specific treaty coverages to cedingcompanies on a limited basis. With respect to other lines of business, TRH assumes terrorism risk inmarine, aviation and other casualty treaties after careful underwriting consideration and, in many cases,with limitations.
Within the European Union (the ‘‘EU’’), the EU Reinsurance Directive of November 2005 (the‘‘Directive’’) was adopted. The Directive requires member countries to lift barriers to trade within the EUfor companies that are domiciled in an EU country. TRH operates within the EU through a series offoreign branches and continues to evaluate the potential impact of the implementation of the Directivewhich could vary from country to country. TRH has contacted insurance regulators throughout the EU toascertain their regulatory intent and to discuss each country’s rule applicable to TRH. Currently, TRHcontinues to conduct business within the EU through its foreign branches with no significant impact on itsoperations. As each country within the EU adopts rules implementing the Directive, TRH could bematerially adversely affected by the adopted rules. TRH may be required to post additional collateral inEU countries or may need to consider restructuring its business in order to comply with the rules adoptedin EU countries implementing the Directive.
18

In addition to the Directive, the EU is phasing in a new regulatory regime for regulation of financialservices known as ‘‘Solvency II.’’ Solvency II is a principles-based regulatory regime that seeks to enhancetransparency, promote uniformity, and encourage a proactive approach to company solvency. It is built ona risk-based approach to setting capital requirements of insurers and reinsurers. The regulatory authoritiesin Europe have scheduled Solvency II for implementation on January 1, 2013. TRH could be materiallyimpacted by the implementation of Solvency II depending on the costs associated with implementation byeach EU country, any increased capitalization requirements and any costs associated with adjustments toTRH’s corporate operating structure.
Traditionally, regulatory and legislative changes affecting the insurance and reinsurance industries, aswell as the financial services industry as a whole, are conducted in an organized and structured mannerencompassing the issuance of draft legislation or regulations and a significant period for review, evaluationand comment by the industry and markets. As a result of the recent displacement in the financial marketsand its impact on the insurance and reinsurance industry, legislators and/or regulators may feel compelledto pass new rules in an expedited manner without the normal review periods. The passage of newregulatory rules on an expedited basis may have a material adverse impact on TRH if those rules increasethe cost of doing business or restrict TRH’s ability to underwrite certain lines of business and/or makecertain investments without providing TRH with the normal amount of time to review the new rules, assesstheir impact on TRH and allow TRH to alter its business strategies or restructure in the most efficientmanner.
Relationship with the AIG Group
Secondary Public Offering of the Company’s Common Stock by AIG
AIG, a Delaware corporation, is a holding company which, through its subsidiaries, is engaged in abroad range of insurance and insurance-related activities in the United States and abroad. AIG’s primaryactivities include general insurance, life insurance and retirement services operations. Other significantactivities include financial services and asset management.
Prior to June 10, 2009 and as of December 31, 2008, AIG beneficially owned approximately 59% ofthe Company’s outstanding shares. On June 10, 2009, AIG and AHAC, a wholly owned subsidiary of AIG,consummated the June 2009 Offering of 29.9 million issued and outstanding shares of the common stockof the Company owned by AIG and AHAC. On March 15, 2010, AHAC consummated the March 2010Offering of 8.5 million issued and outstanding shares of the Company’s common stock owned by AHAC.The Company repurchased two million shares of its common stock from AHAC in the March 2010Offering pursuant to a stock offering agreement for an aggregate purchase price of approximately$105 million. TRH did not receive any proceeds from the Secondary Offerings. Immediately following theMarch 2010 Offering, the AIG Group, including AHAC, beneficially owned 0.7 million shares of theCompany’s common stock (excluding shares held by certain mutual funds that are advised or managed bysubsidiaries of AIG), representing approximately 1.1% of the Company’s then outstanding shares. As aresult of its reduced ownership percentage, the AIG Group was no longer considered a related party afterMarch 15, 2010.
Reinsurance Assumed from the AIG Group
In the normal course of business, TRH sells reinsurance to subsidiaries of the AIG Group. Basedupon TRH’s assessment of risk selection, pricing, terms and conditions and other relevant factors, TRHeither accepts or rejects potential AIG Group business. Except where premiums assumed were insured byAIG subsidiaries as a result of TRH’s marketing efforts and then ceded to TRH by prearrangement, TRHhas generally not set terms and conditions as lead underwriter with respect to the treaty reinsurancepurchased by the AIG Group; however, TRH may in the future set terms and conditions with respect to
19

such business as lead underwriter and intends that the terms and conditions of any such reinsurance will benegotiated on an arm’s length basis.
After March 15, 2010, the AIG Group ceased to be a related party of TRH, as discussed above. Grosspremiums written originated by the AIG Group and ceded to TRH from contracts that were entered intowhile the AIG Group was a related party totaled approximately $196 million (4.8%), $263 million (6.3%)and $310 million (7.0%) in 2010, 2009 and 2008, respectively. These amounts exclude (a) premiumsassumed that initially were insured by AIG subsidiaries as a result of TRH’s marketing efforts and thenceded to TRH by prearrangement; (b) amounts assumed from an AIG subsidiary and ceded in an equalamount to other AIG subsidiaries; and (c) all premiums from contracts that were effective after March 15,2010. The amount of premiums assumed that initially were insured by AIG subsidiaries as a result ofTRH’s marketing efforts and then ceded to TRH by prearrangement are not material. (See Note 16 for theamount of premiums assumed from an AIG subsidiary and ceded in an equal amount to other AIGsubsidiaries.)
Available Information
The Company files annual, quarterly and current reports, proxy statements and other documents withthe Securities and Exchange Commission (the ‘‘SEC’’). The public may read and copy any materials filedwith the SEC at the SEC’s Public Reference Room at 100 F Street, N.E., Washington, DC 20549. Thepublic may obtain information on the operation of the Public Reference Room by calling the SEC at1-800-SEC-0330. Also, the SEC maintains an Internet Web site that contains reports, proxy andinformation statements, and other information regarding issuers, including the Company, that fileelectronically with the SEC. The public can obtain any documents that the Company files electronicallywith the SEC at http://www.sec.gov or through the New York Stock Exchange, 20 Broad Street, New York,New York 10005, on which the Company’s common stock is listed.
TRH’s website, which can be found on the Internet at http://www.transre.com, contains frequentlyupdated information about the Company and its operations. Copies of the Company’s recent Forms 10-K,Forms 10-Q and Forms 8-K, and all amendments to those reports, can be accessed free of charge as soonas reasonably practicable after the reports and amendments are electronically filed with or furnished to theSecurities and Exchange Commission by selecting ‘‘SEC Filings’’ on the drop-down menu under ‘‘InvestorInformation.’’ References to TRH’s website in this report are provided as a convenience and do notconstitute, and should not be viewed as, an incorporation by reference of the information contained on, oravailable through, the website. Therefore, such information should not be considered part of this report.
In addition, copies of any of the Company’s reports on Form 10-K, Form 10-Q and Form 8-K, and allamendments to those reports, as well as any Quarterly Earnings Press Release may be obtained bycontacting the Company’s Investor Relations department at:
Transatlantic Holdings, Inc.80 Pine StreetNew York, New York 10005Telephone: (212) 365-2200E-mail: [email protected]
20

Item 1A.
TRANSATLANTIC HOLDINGS, INC. AND SUBSIDIARIESRISK FACTORS
The risks described below could materially affect TRH’s business, results of operations, cash flows orfinancial condition.
The occurrence of severe catastrophic events could have a material adverse effect on TRH’s financial condition,results of operations and operating cash flows.
Because TRH underwrites property and casualty reinsurance and has large aggregate exposures tonatural and man-made disasters, TRH expects that its loss experience will from time to time include eventsof great severity. The frequency and severity of catastrophe losses are inherently unpredictable,particularly in light of the acceleration of climate change. Consequently, the occurrence of losses from asevere catastrophe or series of catastrophes could have a material adverse effect on TRH’s financialcondition, results of operations and cash flows. Increases in the values and geographic concentrations ofinsured property and the effects of inflation have historically resulted in increased severity of industrylosses in recent years, and TRH expects that those factors will increase the severity of catastrophe losses inthe future.
If TRH is required to increase its liabilities for loss reserves, TRH’s financial condition, results of operations andultimately its cash flows may be materially adversely affected.
Significant periods of time may elapse between the occurrence of an insured loss, the reporting of theloss to the ceding company and the reinsurer, and the ceding company’s payment of that loss andsubsequent payments to the ceding company by the reinsurer. TRH is required by applicable insurancelaws and regulations and GAAP to establish liabilities on its consolidated balance sheet for payment oflosses and LAE that will arise in the future from its reinsurance products for losses that have occurred asof the balance sheet date. Under GAAP, TRH is not permitted to establish liabilities until an event occursthat may give rise to a loss. Once such an event occurs, liabilities are established in TRH’s financialstatements for its losses, based upon estimates of losses incurred by the ceding companies. As a result, onlyliabilities applicable to losses incurred up to the reporting date may be established, with no allowance forthe provision of a contingency reserve to account for expected or unexpected future losses. Losses arisingfrom future events will be estimated and recognized at the time the losses occur. Although TRH annuallyreviews the adequacy of its established reserves for losses and LAE, there can be no assurance that TRH’sloss reserves will not develop adversely and have a material effect on TRH’s results of operations. To theextent these liabilities may be insufficient to cover actual losses or LAE, TRH will have to add to theseliabilities and incur a charge to its earnings, which could have a material adverse effect on TRH’s financialcondition, results of operations and ultimately its cash flows. (See MD&A for a further discussion of therisks and uncertainties relating to loss reserves.)
A downgrade in the ratings assigned to TRH could adversely affect TRH’s ability to write new business and/orTRH’s cost and availability of any future unsecured financing, and may adversely impact TRH’s existingagreements.
S&P, Best and Moody’s are generally considered to be significant rating agencies with respect to theevaluation of insurance and reinsurance companies. Financial strength and credit ratings by these ratingagencies are important factors in establishing a competitive position for insurance and reinsurancecompanies. Financial strength ratings measure a company’s ability to meet its insurance and reinsuranceobligations to contract holders. Credit ratings measure a company’s ability to repay its debt obligations anddirectly affect the cost and availability of unsecured financing. Ratings are subject to periodic review at thediscretion of each respective rating agency and may be revised downward or revoked at their sole
21

discretion. Rating agencies also may increase their scrutiny of rated companies, revise their ratingstandards or take other action. In addition, a ceding company’s own rating may be adversely affected by adowngrade in the rating of its reinsurer or an affiliated company. Therefore, a downgrade of a rating of theCompany or its operating subsidiaries may dissuade a ceding company from reinsuring with TRH in thefuture and may influence a ceding company to reinsure with one of TRH’s competitors that has a higherfinancial strength rating. In general, if the insurer financial strength ratings and/or financial strengthratings of TRC, TRZ or Putnam from these rating agencies fall below ‘‘A-,’’ certain rating agency triggersin TRH’s contracts would allow customers to elect to take a number of actions such as terminating thecontracts on a run-off or cut-off basis, requiring TRH to post collateral for all or a portion of theobligations or requiring commutation under the contract as described below. A downgrade of TRH’s debtratings may also increase future borrowing costs.
A significant portion of TRH’s in-force treaty contracts as of December 31, 2010 permit the cedingcompany to cancel the contract on a cut-off or run-off basis if TRH’s operating subsidiaries’ financialstrength rating is downgraded below a certain rating level, generally ‘‘A-’’. In addition, contracts may alsopermit the ceding company to cancel the contract if there is a significant decline in the statutory surplus ofTRC, generally of at least 20%. Contracts may contain one or both of the aforementioned contractualprovisions, certain other cancellation triggers or other stipulations, such as a requirement to post collateralfor all or a portion of TRH’s obligations or require commutation under the contract if a triggering eventoccurs. Whether a ceding company would exercise any of these cancellation rights would depend on,among other factors, the reason and extent of such downgrade or surplus reduction, the prevailing marketconditions and the pricing and availability of replacement reinsurance coverage.
When a contract is cancelled on a ‘‘cut-off’’ basis, as opposed to a ‘‘run-off’’ basis, the liability of thereinsurer under policies which became effective under the treaty prior to the cancellation date of suchtreaty ceases with respect to losses resulting from events taking place on and after said cancellation date.Accordingly, unearned premiums on that business as of the cut-off date are returned to the cedingcompany, net of a proportionate share of the original ceding commission. In the accounting period of thecancellation effective date, the amount of unearned premiums returned would be recorded as a reductionof gross premiums written with a like reduction in gross unearned premiums with no effect on grosspremiums earned. Thus, the canceling of a contract generally has liquidity and future implications toTRH’s business but rarely affects premiums already earned.
TRH cannot predict in advance the extent to which these cancellation rights would be exercised, if atall, or what effect such cancellations would have on TRH’s financial condition or future operations, butsuch effect potentially could be materially adverse.
TRH may secure its obligations under its various reinsurance contracts using trusts and letters ofcredit. TRH may enter into agreements with ceding companies that require TRH to provide collateral forits obligations under certain reinsurance contracts with these ceding companies under variouscircumstances, including where TRH’s obligations to these ceding companies exceed negotiatedthresholds. These thresholds may vary depending on TRH’s ratings, and a downgrade of TRH’s ratings ora failure to achieve a certain rating may increase the amount of collateral TRH is required to provide.TRH may provide the collateral by delivering letters of credit to the ceding company, depositing assets intoa trust for the benefit of the ceding company or permitting the ceding company to withhold funds thatwould otherwise be delivered to TRH under the reinsurance contract. The amount of collateral TRH isrequired to provide typically represents all or a portion of the obligations TRH may owe the cedingcompany, often including estimates made by the ceding company of IBNR claims. Since TRH may berequired to provide collateral based on the ceding company’s estimate, TRH may be obligated to providecollateral that exceeds TRH’s estimates of the ultimate liability to the ceding company. An increase in theamount of collateral TRH is obligated to provide to secure its obligations may have an adverse impact on,among other things, TRH’s ability to write additional reinsurance.
22

If TRH’s risk management methods and pricing models are not effective, TRH’s financial condition, results ofoperations and cash flows could be materially adversely affected.
TRH’s property and casualty reinsurance contracts cover unpredictable events such as hurricanes,windstorms, hailstorms, earthquakes, volcanic eruptions, fires, industrial explosions, freezes, riots, floodsand other natural or man-made disasters, including those that may result from terrorist activity. TRH isalso exposed to multiple insured losses arising out of a single occurrence that have the potential toaccumulate to material amounts and affect multiple risks/programs and classes of business. TRH usesmodeling techniques to manage certain of such risks to acceptable limits, although current techniques usedto estimate the exposure may not accurately predict the probability of such an event or the extent ofresulting losses. In addition, TRH may purchase retrocession protection designed to limit the amount oflosses that it may incur. Retrocession arrangements do not relieve TRH from its obligations to the insurersand reinsurers from whom TRH assumes business. The failure of retrocessionnaires to honor theirobligations could result in losses to TRH. Moreover, from time to time, market conditions may limit and insome cases prevent reinsurers from obtaining the types and amounts of reinsurance that they consideradequate for their risk management. If TRH is unable to obtain retrocessional coverage in the amounts itdesires or on acceptable terms, TRH’s capacity and appetite for risk could change, and TRH’s financialcondition, results of operations and cash flows may be materially adversely affected.
Further, various provisions of TRH’s contracts, such as limitations to or exclusions from coverage orchoice of legal forum, may not be enforceable in the manner TRH intends, due to, among other things,disputes relating to coverage and choice of legal forum. Additionally, underwriting is a matter of judgment,involving important assumptions about matters that are inherently difficult to predict and are beyondTRH’s control, and for which historical experience and probability analysis may not provide sufficientguidance. Also, TRH’s risk management methods, models, databases and experience may not adequatelyaddress the emergence of various matters, such as the impact of climate change or TRH employees orthird-party service providers exceeding their authority or otherwise breaching their obligations, that couldsignificantly affect TRH’s business in future periods. One or more catastrophic or other events andemerging risks could result in claims or have an impact that substantially exceeds TRH’s expectations,which could have a material adverse effect on TRH’s financial condition, results of operations and cashflows.
The property and casualty reinsurance business is historically cyclical, and TRH expects to experience periods withexcess underwriting capacity and unfavorable pricing.
Historically, property and casualty reinsurers have experienced significant fluctuations in operatingresults. Demand for reinsurance is influenced significantly by underwriting and investment results ofprimary insurers and prevailing general economic and market conditions, all of which affect cedingcompanies’ decisions as to the amount or portion of risk that they retain for their own accounts andconsequently how much they decide to cede to reinsurance companies. The supply of reinsurance is relatedto prevailing prices, the levels of insured losses and the levels of industry surplus, among other factors,that, in turn, may fluctuate in response to changes in rates of return on investments being earned in thereinsurance industry. In addition, the supply of reinsurance is affected by a reinsurer’s confidence in itsability to accurately assess the probability of expected underwriting outcomes, particularly with respect tocatastrophe losses. As a result, the property and casualty reinsurance business historically has been acyclical industry, characterized by periods of intense price competition due to excessive underwritingcapacity as well as periods when shortages of capacity permitted favorable pricing.
The cyclical trends in the industry and the industry’s profitability can also be affected significantly byvolatile and unpredictable developments, including what TRH believes to be a trend of courts to grantincreasingly larger awards for certain damages, changes in the political, social or economic environment,natural disasters (such as catastrophic hurricanes, windstorms, tornadoes, earthquakes and floods),man-made disasters (such as those arising from terrorist activities), fluctuations in interest rates, changes in
23

the investment environment that affect market prices of and returns on investments and inflationarypressures that may affect the size of losses experienced by primary insurers. TRH cannot predict whethermarket conditions will improve, remain constant or deteriorate. Unfavorable market conditions may affectTRH’s ability to write reinsurance at rates that TRH considers appropriate relative to the risk assumed. IfTRH cannot write property and casualty reinsurance at appropriate rates, TRH’s ability to transactreinsurance business would be significantly and adversely affected.
Increased competition could adversely affect TRH’s profitability.
The property and casualty reinsurance industry is highly competitive in virtually all lines. TRH couldface increased competition from new market entrants, existing market participants devoting additionalcapital to the types of business written by TRH, alternatives to reinsurance available to cedants, such ascapital market alternatives, and government-sponsored reinsurance entities.
Competition in the types of reinsurance in which TRH is engaged is based on many factors, includingthe perceived overall financial strength of the reinsurer, ratings of S&P, Best and Moody’s, states or otherjurisdictions where the reinsurer is licensed, accredited, authorized or can serve as a reinsurer, capacity andcoverages offered, premiums charged, specific terms and conditions of the reinsurance offered, servicesoffered, speed of claims payment and reputation and experience in the lines of business underwritten.
TRH competes in the U.S. and international reinsurance markets with numerous international anddomestic reinsurance companies, some of which have greater resources than TRH or operate in differentregulatory jurisdictions and tax environments. TRH’s competitors include independent reinsurancecompanies, subsidiaries or affiliates of established worldwide insurance companies, reinsurancedepartments of certain primary insurance companies, domestic and European underwriting syndicates and,in some instances, government-owned or subsidized facilities. Certain of these competitors have beenoperating substantially longer than TRH and have established long-term and continuing businessrelationships throughout the industry, which can be a significant competitive advantage.
Traditional reinsurers as well as capital market participants from time to time produce alternativeproducts or reinsurance vehicles (such as reinsurance securitizations, catastrophe bonds and variousderivatives, such as swaps, and sidecars) that may compete with certain types of reinsurance, such asproperty catastrophe. Hedge funds may provide reinsurance and retrocessional protections throughcaptive companies or other alternative transactions on a fully collateralized basis for property and energycatastrophe business. Over time, these numerous initiatives could significantly affect supply, pricing andcompetition in the reinsurance industry.
Additionally, government involvement in the reinsurance markets continues to evolve. For example,the Florida legislature has recently begun to decrease the amount of reinsurance offered by the state-runreinsurer, the Florida Hurricane Catastrophe Fund (‘‘FHCF’’). In 2009, the Florida legislature, recognizingthe inadequacy of current rates, authorized Citizens Property Insurance Corporation, the state-sponsoredinsurer, to increase its rates and further reduce its capacity with the goals of reinstating the FHCF’s role asa market of last resort and reinvigorating private reinsurer participation in the state. Further actions by thelegislature are expected during 2011. Throughout 2010, the Florida insurance regulator continued toapprove significant rate increases for insurers writing Florida property risks and relaxed the collateralrequirements for credit for reinsurance for several non-U.S. reinsurers.
A limited number of brokers account for a large portion of TRH’s premiums; the loss of all or a substantial portionof the business provided by them may have an adverse effect on TRH.
The great majority of TRH’s premiums are written through brokers. In 2010, business brokered bycompanies controlled by Aon and Marsh accounted for 26% and 19%, respectively, of total grosspremiums written. In addition, business brokered by TRH’s 10 largest brokerage sources of businessaccounted for 65% of total gross premiums written in 2010. These brokers also have, or may in the future
24

acquire, ownership interests in insurance and reinsurance companies that may compete with TRH. Theloss of all or a substantial portion of the business provided by TRH’s brokers could have a material adverseeffect on TRH.
Concentration of TRH’s investment portfolios in any particular segment of the economy may have adverse effects.
Concentration of TRH’s investment portfolios in any particular industry, group of related industries,asset class or geographic region could have an adverse effect on TRH’s investment portfolios andconsequently on TRH’s consolidated results of operations or financial condition. While TRH seeks tomitigate this risk by having a broadly diversified portfolio, events or developments that have a negativeeffect on any particular industry, group of related industries, asset class or geographic region may have agreater adverse effect on investment portfolios to the extent that the portfolios are concentrated ratherthan diversified. Further, TRH’s ability to sell assets relating to such particular groups of related assets maybe limited if other market participants are seeking to sell at the same time.
The valuation of TRH’s investments includes methodologies, estimations and assumptions which are subject todiffering interpretations; a change in interpretations could result in changes to investment valuations that mayadversely affect TRH’s results of operations or financial condition.
The vast majority of TRH’s investments are measured at fair value using methodologies, estimationsand assumptions which are subject to differing interpretations. Financial instruments with quoted prices inactive markets generally have more pricing observability and less judgment is used in measuring fair value.Conversely, financial instruments traded in other-than-active markets or that do not have quoted priceshave less observability and are measured at fair value using valuation models or other pricing techniquesthat require more judgment. Investments recorded at fair value in the consolidated balance sheet areclassified in a hierarchy for disclosure purposes consisting of three ‘‘levels’’ based on the observability ofinputs available in the marketplace used to measure the fair values. (See Note 3 of Notes to ConsolidatedFinancial Statements for the types of assets included in each of the three levels.)
Securities that are less liquid are more difficult to value and trade. During periods of marketdisruption, including periods of significantly rising or high interest rates, rapidly widening credit spreads orilliquidity, it may be difficult to value certain of the securities in TRH’s investment portfolio if tradingbecomes less frequent or market data becomes less observable. There may be certain asset classes thatwere in active markets with significant observable data that become illiquid due to changes in the financialenvironment. In such cases, more securities may fall to Level 3 and thus require more subjectivity andjudgment of TRH’s management. In addition, prices provided by independent pricing services andindependent broker quotes can vary widely even for the same security.
As such, valuations may include inputs and assumptions that are less observable or require greaterestimation as well as valuation methods which are more sophisticated, thereby resulting in values whichmay be greater or less than the value at which the investments may be ultimately sold. Further, rapidlychanging or strained credit and equity market conditions could materially impact the valuation of securitiesas reported within TRH’s consolidated financial statements and the period-to-period changes in valuecould vary significantly. Decreases in value may have a material adverse effect on TRH’s results ofoperations or financial condition. (See MD&A for a further discussion of the risks and uncertaintiesrelating to critical accounting estimates.)
The determination of the amount of other-than-temporary impairment (‘‘OTTI’’) taken on TRH’s investments issubjective and could materially impact TRH’s results of operations or financial condition.
The determination that a security has incurred an other-than-temporary decline in value requires thejudgment of TRH’s management and consideration of the fundamental condition of the issuer, its
25
near-term prospects and all relevant facts and circumstances. (See Note 4(g) of Notes to ConsolidatedFinancial Statements for the methodology TRH uses to determine OTTI.)
There can, however, be no assurance that TRH has accurately assessed the level of impairmentsreflected in its financial statements. Furthermore, additional impairments may need to be taken in thefuture. Historical trends may not be indicative of future impairments.
An investment is impaired if its fair value falls below its cost or amortized cost. The determination ofwhether an impairment is other-than-temporary is subjective and involves considerable judgment and theconsideration of various factors and circumstances. The significant factors include:
• the severity of the decline in fair value• the length of time the fair value is below cost• the issuer’s financial condition, including profitability and cash flows• the issuer’s credit status• the issuer’s specific and general competitive environment• published reports• the general economic environment• the regulatory and legislative environment• other relevant factors
If TRH’s determination of OTTI is materially incorrect, it could have a material adverse effect onTRH’s financial condition, results of operations and cash flows.
TRH’s liquidity could be materially impaired by future events within or outside of TRH’s control, includingconditions in the financial and credit markets.
The Company depends on dividends, distributions and other payments from its subsidiaries to funddividend payments and to fund payments on its obligations, including debt obligations. Regulatory andother legal restrictions may limit TRH’s ability to transfer funds freely, either to or from its subsidiaries. Inparticular, certain of TRH’s branches or subsidiaries are subject to laws and regulations, including those inforeign jurisdictions, that authorize regulatory bodies to block or reduce transfers of funds to the homeoffice in the U.S. or TRH’s affiliates. These laws and regulations may hinder TRH’s ability to access fundsthat it may need to make payments on its obligations.
Certain of TRH’s investments may become illiquid. TRH’s investments include fixed maturities(including asset-backed securities), equity investments and other invested assets (including alternativeinvestments and direct equity investments). Disruptions in the credit and financial markets may materiallyaffect the liquidity of TRH’s investments. If TRH requires significant amounts of cash on short notice inexcess of normal cash requirements in a period of market illiquidity, then TRH may have difficulty sellinginvestments in a timely manner or may be forced to dispose of them for less than what TRH mightotherwise have been able to under other conditions.
Furthermore, TRH does not currently have a credit facility to help it respond to any liquidityproblems it may encounter and from time to time it may be difficult for TRH to obtain a credit facility. Inaddition, conditions in the credit and financial markets, changes in the Company’s stock price and otherfactors could make it difficult for TRH to raise cash in the capital markets.
The impact on TRH of governmental actions made in response to the recent economic crisis is difficult to determineat this time.
In response to the recent financial crises affecting the credit and financial markets and concern aboutcertain financial institutions’ ongoing viability, numerous regulatory and governmental actions have beentaken or proposed. Within the U.S., the Federal Reserve has taken action through reduced federal fundsrates and the expansion of acceptable collateral for its loans to provide additional liquidity. Numerous
26
financial institutions have received and may continue to receive capital both in the form of emergencyloans and direct U.S. Government equity investments. Within the United Kingdom and Europe, similaractions, including interest rate cuts and capital injections into financial institutions, have been undertaken.It is possible that some of TRH’s competitors may participate in some of these programs. There can be noassurance as to the effect that any such governmental actions will have on the financial markets generallyor on TRH’s financial condition, results of operations and cash flows in particular.
Difficult and volatile conditions in the global capital and credit markets and in the overall economy could materiallyand adversely affect TRH’s operating results, investment portfolio and financial condition.
Disruption and volatility in the global capital and credit markets and in the overall economy affectsTRH’s business in a number of ways, including the following:
• disruption in the capital and credit markets may increase claims activity in TRH’s reinsurance lines,such as D&O, E&O, credit and, to a limited extent, mortgage guaranty business
• significant fluctuations in the fixed maturities, asset-backed securities and equities markets couldreduce TRH’s investment returns and the fair value of its investment portfolio
• volatility in the capital and credit markets makes it more difficult to access those markets, ifnecessary, to maintain or improve TRH’s financial strength and credit ratings or to generateliquidity
• disruption in the overall economy may reduce demand for insurance and reinsurance products• increases in inflation could result in higher losses on reinsurance contracts, particularly in longer
tailed lines of business, increased operating costs and decrease the fair value of TRH’s investmentportfolio
It is difficult to predict when and how long these conditions will exist and how TRH’s markets,business and investments will be adversely affected. Accordingly, these conditions could have a materialadverse effect on TRH’s consolidated financial condition or results of operations in future periods.
TRH may be adversely affected by the impact of market volatility and interest rate and foreign currency exchangerate fluctuations.
TRH’s principal invested assets are fixed maturity investments and other interest rate sensitivesecurities, which are subject to the market risk of potential losses from adverse changes in interest rates,credit spreads or trading liquidity and may also be adversely affected by foreign currency exchange ratefluctuations. Depending on TRH’s classification of the investment, changes in the fair value of TRH’ssecurities are reflected in its consolidated balance sheet, statement of operations and/or statement ofcomprehensive income. TRH’s investment portfolio is also subject to credit risk resulting from adversechanges in the issuers’ ability to repay the debt or the ability of bond insurers to meet their obligations topay principal and/or interest if an issuer is unable to repay its debt. Moreover, issuers may face liquiditypressures as a result of economic conditions and, in turn, may be subject to downgrades by the credit ratingagencies. These risks could materially adversely affect TRH’s results of operations and financial condition.
A principal exposure to foreign currency risk is TRH’s obligation to settle claims in foreign currencies.The possibility exists that TRH may incur foreign currency exchange gains or losses as TRH ultimatelysettles claims required to be paid in foreign currencies. To mitigate this risk, TRH also maintainsinvestments denominated in certain foreign currencies in which the claims payments will be made. To theextent TRH does not seek to hedge its foreign currency risk or hedges prove ineffective, the resultingimpact of a movement in foreign currency exchange rates could materially adversely affect TRH’s resultsof operations or financial condition.
27

TRH’s businesses are heavily regulated, and changes in regulation may reduce TRH’s profitability and limit itsgrowth.
TRH’s reinsurance subsidiaries are subject to extensive regulation and supervision in the jurisdictionsin which they conduct business. This regulation is generally designed to protect the interests ofpolicyholders, as opposed to reinsurers and their stockholders and other investors, and relates toauthorization to transact certain lines of business, capital and surplus requirements, investment limitations,underwriting limitations, transactions with affiliates, dividend limitations, changes in control and a varietyof other financial and non-financial components of an insurance company’s business.
Traditionally, regulatory and legislative changes affecting the insurance and reinsurance industries, aswell as the financial services industry as a whole, are conducted in an organized and structured mannerencompassing the issuance of draft legislation or regulations and a significant period for review, evaluationand comment by the industry and markets. As a result of the displacement in the financial markets and itsimpact on the insurance and reinsurance industry, legislators and/or regulators may feel compelled to passnew rules in an expedited manner without the normal review periods. The passage of new regulatory ruleson an expedited basis may have a material adverse impact on TRH if those rules increase the cost of doingbusiness or restrict TRH’s ability to underwrite certain lines of business and/or make certain investmentswithout providing TRH with the normal amount of time to review the new rules, assess their impact onTRH and allow TRH to alter its business strategies or restructure in the most efficient manner.Additionally, any proposed or future legislation or insurance regulatory initiatives may be more restrictivethan current regulatory requirements or may result in higher costs. (See Regulation in Item 1. Business fora discussion of regulatory developments and related risks.
TRH’s offices that operate in jurisdictions outside the U.S. are subject to certain limitations and risks that areunique to foreign operations.
TRH’s international operations are also regulated in various jurisdictions with respect to licensingrequirements, currency, amount and type of security deposits, amount and type of reserves, amount andtype of local investments and other matters. International operations and assets held abroad may beadversely affected by political and other developments in foreign countries, including possibilities of taxchanges, nationalization and changes in regulatory policy, as well as by consequences of hostilities andunrest. The risks of such occurrences and their overall effect upon TRH vary from country to country andcannot easily be predicted. In addition, TRH’s results of operations and net unrealized currencytranslation gain or loss (a component of accumulated other comprehensive income) are subject to volatilityas the value of the foreign currencies fluctuate relative to the U.S. dollar. Regulations governing technicalreserves and remittance balances in some countries may hinder remittance of profits and repatriation ofassets.
The loss of key personnel or the inability to access TRH’s facilities could adversely affect TRH’s results of operations,financial condition and cash flows.
TRH relies upon the knowledge and talent of its employees to successfully conduct business. A loss ofkey personnel could have a material effect on TRH’s results of operations, financial condition and cashflows in future periods. TRH also relies upon access to its facilities by employees to conduct such business.The inability by employees to access TRH’s facilities, if over a prolonged time period, could have amaterial effect on TRH’s results of operations, financial condition and cash flows in future periods.
The Company is a holding company and depends on the ability of its subsidiaries to distribute funds to it in order tomeet its financial and other obligations.
The payment of dividends, interest and other obligations by the Company is dependent on the abilityof its subsidiaries to pay dividends. The payment of dividends by the Company’s subsidiaries is restricted by
28
insurance regulations. For example, under New York insurance law, TRC and Putnam may pay dividendsonly out of their statutory earned surplus. The inability of the Company’s subsidiaries to pay dividends inan amount sufficient for the Company to meet its obligations could have a material adverse effect on TRH.
TRH’s counterparties may acquire certain rights upon a change in control of TRH, which could negatively affectTRH.
TRH is a party to numerous contracts, agreements, licenses, permits, authorizations and otherarrangements that contain provisions giving counterparties certain rights (including, in some cases,termination rights) in the event of a change in control of the Company or its subsidiaries. If a change incontrol occurs, cedants may be permitted to cancel contracts on a cut-off or run-off basis, and TRH may berequired to provide collateral to secure premium and reserve balances or may be required to cancel andcommute the contract, subject to an agreement between the parties that may be settled in arbitration. If acontract is cancelled on a cut-off basis, TRH may be required to return unearned premiums, net ofcommissions. In certain instances, contracts contain dual triggers, such as a change in control and a ratingsdowngrade, both of which must be satisfied for the contractual right to be exercisable.
Whether a ceding company would have cancellation rights in connection with a change in control ofTRH depends upon the language of its agreement with TRH. Whether a ceding company exercises anycancellation rights it has would depend on, among other factors, such ceding company’s views with respectto the prevailing market conditions, the pricing and availability of replacement reinsurance coverage andTRH’s ratings.
In addition, contracts may provide a ceding company with multiple options, such as collateralizationor commutation, that would be triggered by a change in control. Collateral requirements may take theform of trust agreements or be funded by securities held or letters of credit. Upon commutation, theamount to be paid to settle the liability for gross loss reserves would typically consider a discount to thefinancial statement loss reserve value, reflecting the time value of money resident in the ultimatesettlement of such loss reserves. TRH cannot presently predict the effects, if any, a change in control willhave, including the extent to which cancellation rights would be exercised, if at all, nor the effect of achange in control on TRH’s financial condition, results of operations, or cash flows, but such effect couldbe material.
Provisions in the Company’s certificate of incorporation and by-laws and the insurance laws of the jurisdictions inwhich TRH operates could discourage another company from acquiring TRH and may prevent attempts by theCompany’s stockholders to replace or remove TRH’s current management.
Some provisions of the Company’s certificate of incorporation and by-laws may have the effect ofdelaying, discouraging or preventing a merger, acquisition or other change in control that the Company’sstockholders may consider favorable, including transactions in which stockholders may receive a premiumfor their shares. In addition, these provisions may frustrate or prevent any attempts by the Company’sstockholders to replace or remove TRH’s current management by making it more difficult for stockholdersto replace or remove the Company’s board of directors. These provisions include:
• the Company’s board of directors’ ability to issue preferred stock and determine the rights anddesignations of the preferred stock at any time without stockholder approval
• limitations on the ability of stockholders to call special meetings
In addition, at any time and without stockholder approval, the Company’s board of directors mayamend the Company’s by-laws in a manner that has the effect of delaying, discouraging or preventing amerger, acquisition or other change in control that the Company’s stockholders may consider favorable,including transactions in which stockholders may receive a premium for their shares.
29

TRH is also subject to the laws governing insurance holding companies of various states and countrieswhere TRH’s reinsurance subsidiaries are domiciled. Under these laws, a person generally must obtain theapplicable insurance regulator’s approval to acquire, directly or indirectly, ten percent (or sometimes fivepercent) or more of the outstanding voting securities of TRH’s reinsurance subsidiaries. These laws mayprevent, delay or defer a change in control of the Company or TRH’s reinsurance company subsidiaries.
Volatility in the market price of the Company’s common stock may make it difficult or impossible for stockholders toobtain a favorable selling price for their shares.
Volatility in the market price of the Company’s common stock may prevent stockholders from beingable to sell their shares at or above the price they paid for their shares. The Company’s common stockprice may be volatile due to factors such as:
• general market and economic conditions• actual or anticipated variations in operating results• investor perceptions of TRH and the reinsurance industry• natural or man-made catastrophes• war, terrorist acts and epidemic disease• changes in financial estimates or recommendations by stock market analysts regarding TRH or its
competitors• possible losses of large customers• future sales of the Company’s common stock
The stock market in general has experienced extreme price and volume fluctuations that have oftenbeen unrelated or disproportionate to the operating performance of companies like TRH. These broadmarket and industry factors may materially reduce the market price of the Company’s common stock,regardless of TRH’s operating performance.
Item 1B.
TRANSATLANTIC HOLDINGS, INC. AND SUBSIDIARIESUNRESOLVED STAFF COMMENTS
None.
Item 2.
TRANSATLANTIC HOLDINGS, INC. AND SUBSIDIARIESPROPERTIES
TRH utilizes office space in New York, where TRH’s headquarters is located, and in various locationsaround the world, all of which are leased.
Item 3.
TRANSATLANTIC HOLDINGS, INC. AND SUBSIDIARIESLEGAL PROCEEDINGS
TRH, in common with the reinsurance industry in general, is subject to litigation in the normal courseof its business. TRH does not believe that any pending litigation will have a material adverse effect on itsconsolidated results of operations, financial position or cash flows.
In the ordinary course of business, TRH is involved in lawsuits, arbitrations and other formal andinformal dispute resolution procedures, the outcomes of which will determine TRH’s rights andobligations under reinsurance agreements and other more general contracts. In some disputes, TRH seeksto enforce its rights under an agreement or to collect funds owing to it. In other matters, TRH is resisting
30

attempts by others to enforce alleged rights. Such disputes are resolved through formal and informalmeans, including litigation, arbitration and mediation.
In all such matters, TRH believes that its positions are legally and commercially reasonable. TRH alsoregularly evaluates those positions, and where appropriate, establishes or adjusts loss reserves to reflect itsevaluation. TRH’s aggregate loss reserves take into account the possibility that TRH may not ultimatelyprevail in each and every disputed matter. TRH takes into consideration changes in judicial interpretationof legal liability and policy coverages, changes in claims handling practices and inflation. TRH considersnot only monetary increases in the cost of what it reinsures, but also changes in societal factors thatinfluence jury verdicts and case law, TRH’s approach to claim resolution, and, in turn, claim costs. TRHbelieves its aggregate loss reserves reduce the potential that an adverse resolution of one or more of thesematters, at any point in time, would have a material impact on TRH’s financial condition or results ofoperations. However, there can be no assurance that adverse resolutions of such matters in any one periodor in the aggregate will not result in a material adverse effect on TRH’s results of operations or financialcondition.
On May 21, 2010, the Company and its subsidiaries, TRC and TRZ (collectively, the ‘‘TRH Parties’’),filed a demand for arbitration, with the American Arbitration Association, against AIG, AIG SecuritiesLending Corp. and AIG Securities Lending (Ireland) Ltd. (collectively, ‘‘AIG Securities Lending’’) forlosses in excess of $350 million suffered by TRH arising from its participation in a securities lendingprogram administered and managed by AIG Securities Lending during the period that TRH wascontrolled by AIG. The TRH Parties’ participations in such securities lending program ended in the fourthquarter of 2008. While the final outcome cannot be predicted with certainty, TRH believes this arbitration,when resolved, will not have a material adverse effect on TRH’s results of operations, financial position orcash flows.
On September 30, 2009, TRC initiated arbitration proceedings, with the AIDA Reinsurance andInsurance Arbitration Society, against United Guaranty Residential Insurance Company, United GuarantyMortgage Indemnity Company, United Guaranty Credit Insurance Company and United GuarantyResidential Insurance Company of North Carolina (collectively, ‘‘UGC’’), each a subsidiary of the AIGGroup. The arbitration proceedings involve certain contracts related to subprime mortgages and creditdefault insurance pursuant to which UGC purchased reinsurance from TRC (the ‘‘Disputed Contracts’’).TRC seeks in the proceedings, among other things, to rescind the Disputed Contracts. While the finaloutcome cannot be predicted with certainty, TRH believes these arbitration proceedings, when resolved,will not have a material adverse effect on TRH’s consolidated results of operations, financial position orcash flows.
In addition, from time to time, regulators commence investigations into insurance and reinsurance-industry practices. TRH has cooperated, and will continue to cooperate, in producing documents and otherinformation in response to subpoenas and other requests. While TRH does not believe that any of theseinquiries will have a material impact on TRH’s business or financial results, it is not possible to predictwith any certainty at this time what impact, if any, these inquiries may have on TRH’s business or financialresults.
31

TRANSATLANTIC HOLDINGS, INC. AND SUBSIDIARIESEXECUTIVE OFFICERS OF THE REGISTRANT
The table below sets forth the names, positions and ages of the persons who are the executive officersof the Company as of February 22, 2011.
Served asName Position Age Officer Since
Robert F. Orlich . . . . . . . . . . . . . . . . President and Chief Executive Officer and 63 1990(1)
DirectorKenneth Apfel . . . . . . . . . . . . . . . . . Executive Vice President and Chief Actuary 52 2004(2)
Paul A. Bonny . . . . . . . . . . . . . . . . . Executive Vice President, President 54 1994International Operations
Michael C. Sapnar . . . . . . . . . . . . . . Executive Vice President and Chief 44 2005(3)
Underwriting Officer, DomesticOperations
Steven S. Skalicky . . . . . . . . . . . . . . . Executive Vice President and Chief 62 1995Financial Officer
Javier E. Vijil . . . . . . . . . . . . . . . . . . Executive Vice President, President Latin 57 1996American and Caribbean Division
Gary A. Schwartz . . . . . . . . . . . . . . . Senior Vice President and General Counsel 50 1999(4)
Amy M. Cinquegrana . . . . . . . . . . . . Corporate Secretary 36 2009(5)
(1) Prior to April 1990, Mr. Orlich was a director or an officer of TRC and Putnam, but not of the Company.(2) Mr. Apfel was named Executive Vice President and Chief Actuary of the Company, TRC and Putnam by election of the Board
of Directors in September 2008. From May 2005 to the present, Mr. Apfel served as a Director of TRC and Putnam, but not ofthe Company. From August 2004 to September 2008, Mr. Apfel was Senior Vice President and Chief Actuary of the Company,TRC and Putnam.
(3) Mr. Sapnar was named Executive Vice President and Chief Underwriting Officer, Domestic Operations of the Company, TRCand Putnam by election of the Board of Directors in May 2006. From December 2005 to May 2006, Mr. Sapnar was Senior VicePresident and Chief Underwriting Officer, Domestic Operations of the Company. From December 2004 to the present,Mr. Sapnar has served as a Director of TRC and Putnam, but not of the Company. From March 2002 to May 2006, Mr. Sapnarwas Senior Vice President and Chief Underwriting Officer, Domestic Operations of TRC and Putnam.
(4) Since May 2004, Mr. Schwartz was Senior Vice President and General Counsel of the Company, TRC and Putnam. FromNovember 2008 to March 2009, Mr. Schwartz also was Corporate Secretary of the Company, TRC and Putnam. From July 1999to May 2004, Mr. Schwartz was Vice President and General Counsel of the Company, TRC and Putnam. From May 2005 to thepresent, Mr. Schwartz served as a Director of TRC and Putnam, but not of the Company.
(5) Ms. Cinquegrana was elected Corporate Secretary of the Company in March 2009. For more than three years prior to joiningthe Company in February 2009, Ms. Cinquegrana served as an officer, and most recently as Secretary, of certain AIG Groupcompanies.
32

PART II
Item 5.
TRANSATLANTIC HOLDINGS, INC. AND SUBSIDIARIESMARKET FOR THE REGISTRANT’S COMMON EQUITY, RELATED STOCKHOLDER
MATTERS AND ISSUER PURCHASES OF EQUITY SECURITIES
The following table sets forth the high and low sales prices and the dividends declared per share ofTransatlantic Holdings, Inc. (the ‘‘Company’’) Common Stock (‘‘TRH shares’’) on the New York StockExchange Composite Tape for each of the four quarters of 2010 and 2009:
2010 2009
Dividends DividendsHigh Low Declared High Low Declared
First Quarter . . . . . . . . . . . . . . . . . . . . . . . . $54.25 $46.67 $0.20 $40.52 $26.16 $0.19Second Quarter . . . . . . . . . . . . . . . . . . . . . . 53.39 44.08 0.21 46.83 34.92 0.20Third Quarter . . . . . . . . . . . . . . . . . . . . . . . . 51.50 46.05 0.21 51.36 41.48 0.20Fourth Quarter . . . . . . . . . . . . . . . . . . . . . . . 54.08 49.68 0.21 56.42 49.01 0.20
The Company paid each dividend in the quarter following the quarter of declaration.
The declaration and payment of future dividends, if any, by the Company will be at the discretion ofthe Board of Directors (the ‘‘Board’’) and will depend upon many factors, including the Company’sconsolidated earnings, financial condition and business needs, capital and surplus requirements of theCompany’s operating subsidiaries, regulatory considerations and other factors. See Note 15 of Notes toConsolidated Financial Statements for restrictions on the Company’s operating subsidiaries’ ability to paydividends.
As of January 31, 2011, the approximate number of holders of TRH shares, including those whoseTRH shares are held in nominee name, was 30,000.
In December 2009, the Board authorized the purchase of up to $200 million of TRH shares from timeto time in the open market or via negotiated transactions through December 31, 2011 (the ‘‘December2009 Authorization’’). In October 2010, the Board approved a new share repurchase program, whichauthorizes the Company to repurchase up to $200 million of the Company’s outstanding common sharesfrom time to time in the open market or via negotiated transactions through December 31, 2012 (the‘‘October 2010 Authorization’’). The October 2010 Authorization superceded the December 2009Authorization. In the fourth quarter of 2010, the Company repurchased 1,055,000 shares of its commonstock as detailed below:
Total Dollar AmountNumber Still Available
of Shares Under thePurchased October 2010
Total Number as Part of the Authorizationof Shares Average Price October 2010 at End of Month
Purchased(1) Paid Per Share Authorization (in thousands)
October 2010 . . . . . . . . . . . . . . . . . . . . . . . — $ — — $200,000November 2010 . . . . . . . . . . . . . . . . . . . . . . 815,000 51.79 815,000 157,788December 2010 . . . . . . . . . . . . . . . . . . . . . . 240,000 51.61 240,000 145,402
Total . . . . . . . . . . . . . . . . . . . . . . . . . . . . . 1,055,000 51.75 1,055,000 145,402
(1) Does not include 120,066 shares relating to options exercised in the fourth quarter of 2010 that were attested to in satisfactionof the exercise price by holders of the Company’s employee or director stock options.
33

9FEB201109410797
Performance Graph
The following Performance Graph compares the cumulative total return to stockholders on TRHshares for a five-year period (December 31, 2005 to December 31, 2010) with the cumulative total returnof the S&P 500 stock index (the ‘‘S&P 500 Index’’), a new peer group of companies (the ‘‘New PeerGroup’’) and the new peer group of companies used in the 2009 Annual Report on Form 10-K (the ‘‘OldPeer Group’’). Dividend reinvestment has been assumed and returns have been weighted to reflect relativestock market capitalization.
The Old Peer Group consists of sixteen reinsurance companies to which TRH compared its businessand operations: Arch Capital Group Ltd., Axis Capital Holdings Ltd., Endurance Specialty Holdings Ltd.,Everest Re Group Ltd., IPC Holdings, Ltd. (through September 4, 2009, when it was acquired by ValidusHoldings, Ltd.), Max Capital Group Ltd. (through May 12, 2010, when it merged with Harbor Point Ltd. toform Alterra Capital Holdings Ltd.), Montpelier Re Holdings Ltd., Odyssey Re Holdings Corp. (throughOctober 28, 2009, when it was acquired by Fairfax Financial Holdings Limited), Partner Re Ltd., PlatinumUnderwriters Holdings, Ltd., PXRE Group Ltd. (through August 6, 2007, when it was acquired by ArgoGroup International Holdings, Ltd.), RenaissanceRe Holdings Ltd., SCOR S.E., SCOR Holding(Switzerland) (formerly known as Converium Holding AG, through June 27, 2008 when it was delisted)and Swiss Reinsurance Company Ltd. and Validus Holdings Ltd. (starting on September 8, 2009). Theperformance of IPC Holdings, Ltd., Max Capital Group Ltd., Odyssey Re Holdings Corp., PXREGroup Ltd. and SCOR Holding (Switzerland) are included for a shorter period since they were not publiccompanies for the entire five-year performance period. The New Peer Group consists of the Old PeerGroup with the addition of Alterra Capital Holdings Ltd. starting on May 13, 2010, the first trading dayfollowing its formation.
Cumulative Total Return to StockholdersValue of $100 Invested at December 31, 2005
Comparison of Cumulative Five Year Total Return
$40
$60
$80
$100
$120
$140
2005 2006 2007 2008 2009 2010
Do
llars
S&P 500 Index Transatlantic Holdings, Inc. Old Peer Group New Peer Group
Company/Index Dec. 2005 Dec. 2006 Dec. 2007 Dec. 2008 Dec. 2009 Dec. 2010
Transatlantic Holdings, Inc. $100.00 $ 93.20 $109.99 $61.47 $ 81.45 $ 82.04S&P 500 Index . . . . . . . . . 100.00 115.79 122.16 76.96 97.33 111.99New Peer Group . . . . . . . . 100.00 115.21 113.09 94.52 102.32 117.32Old Peer Group . . . . . . . . . 100.00 115.21 113.09 94.52 102.32 116.78
34

Item 6.
TRANSATLANTIC HOLDINGS, INC. AND SUBSIDIARIESSELECTED FINANCIAL DATA
The Selected Financial Data should be read in conjunction with Management’s Discussion andAnalysis of Financial Condition and Results of Operations and the consolidated financial statements andaccompanying notes included elsewhere herein.
Years Ended December 31,
2010 2009 2008 2007 2006
(in thousands, except per share data and ratios)Statement of Operations Data:
Net premiums written . . . . . . . . . . . $ 3,881,693 $ 3,986,101 $ 4,108,092 $ 3,952,899 $ 3,633,440
Net premiums earned . . . . . . . . . . . $ 3,858,620 $ 4,039,082 $ 4,067,389 $ 3,902,669 $ 3,604,094Net losses and loss adjustment
expenses incurred . . . . . . . . . . . . (2,681,774) (2,679,171) (2,907,227) (2,638,033) (2,462,666)Net commissions . . . . . . . . . . . . . . (932,820) (927,918) (980,626) (980,121) (903,666)Increase (decrease) in deferred
policy acquisition costs . . . . . . . . 2,898 (12,406) 6,956 16,901 13,471Other underwriting expenses . . . . . . (177,624) (158,181) (131,555) (115,760) (102,339)
Underwriting profit(1) . . . . . . . . . . . 69,300 261,406 54,937 185,656 148,894Net investment income . . . . . . . . . . 473,547 467,402 440,451 469,772 434,540Realized net capital gains (losses)(2) . 30,101 (70,641) (435,541) 9,389 10,862(Loss) gain on early extinguishment
of debt . . . . . . . . . . . . . . . . . . . (115) 9,869 10,250 — —Interest on senior notes . . . . . . . . . (68,272) (43,454) (43,359) (43,421) (43,405)Other expenses, net . . . . . . . . . . . . (31,773) (28,549) (23,515) (25,644) (10,983)
Income before income taxes . . . . . . 472,788 596,033 3,223 595,752 539,908Income (taxes) benefits . . . . . . . . . . (70,587) (118,371) 99,031 (108,611) (111,756)
Net income . . . . . . . . . . . . . . . . . . $ 402,201 $ 477,662 $ 102,254 $ 487,141 $ 428,152
Per Common Share:Net income:
Basic . . . . . . . . . . . . . . . . . . . . . $ 6.28 $ 7.20 $ 1.54 $ 7.37 $ 6.49Diluted . . . . . . . . . . . . . . . . . . . 6.19 7.15 1.53 7.31 6.46
Cash dividends declared . . . . . . . . . 0.83 0.79 0.73 0.62 0.53Share Data:
Weighted average common sharesoutstanding:Basic . . . . . . . . . . . . . . . . . . . . . 64,092 66,381 66,270 66,124 65,955Diluted . . . . . . . . . . . . . . . . . . . 64,930 66,802 66,722 66,654 66,266
Ratios:(3)
Loss ratio . . . . . . . . . . . . . . . . . . . 69.5% 66.3% 71.5% 67.6% 68.3%
Commission ratio . . . . . . . . . . . . 24.1 23.3 23.9 24.7 24.7Other underwriting expense ratio . 4.6 3.9 3.2 2.9 2.9
Underwriting expense ratio . . . . . . . 28.7 27.2 27.1 27.6 27.6
Combined ratio . . . . . . . . . . . . . . . 98.2% 93.5% 98.6% 95.2% 95.9%
35

As of December 31,
2010 2009 2008 2007 2006
(in thousands, except per share data)
Balance Sheet Data:Total investments . . . . . . . . . . . . . . . . $12,972,739 $12,315,395 $10,229,557 $12,500,540 $11,130,832Cash and cash equivalents . . . . . . . . . 284,491 195,723 288,920 255,432 205,264Total assets . . . . . . . . . . . . . . . . . . . . 15,705,354 14,943,659 13,376,938 15,484,327 14,268,464Unpaid losses and loss adjustment
expenses . . . . . . . . . . . . . . . . . . . . 9,020,610 8,609,105 8,124,482 7,926,261 7,467,949Unearned premiums . . . . . . . . . . . . . 1,212,535 1,187,526 1,220,133 1,226,647 1,144,022Senior notes . . . . . . . . . . . . . . . . . . . 1,030,511 1,033,087 722,243 746,930 746,633Total stockholders’ equity . . . . . . . . . . 4,284,459 4,034,380 3,198,220 3,349,042 2,958,270
Book value per common share(4) . . . . . . $ 68.83 $ 60.77 $ 48.19 $ 50.56 $ 44.80
(1) Includes pre-tax net catastrophe (costs) of ($202) million in 2010, $6 million in 2009, ($170) million in 2008, ($55) million in2007 and ($29) million in 2006.
(2) Includes OTTI write-downs charged to earnings of ($8) million in 2010, ($83) million in 2009, ($318) million in 2008, ($27)million in 2007 and ($1) million in 2006.
(3) The loss ratio represents the absolute value of net losses and loss adjustment expenses incurred expressed as a percentage of netpremiums earned. The underwriting expense ratio represents the sum of the commission ratio and the other underwritingexpense ratio. The commission ratio represents the absolute value of the sum of net commission and the (decrease) increase indeferred policy acquisition costs expressed as a percentage of net premiums earned. The other underwriting expense ratiorepresents the absolute value of other underwriting expenses expressed as a percentage of net premiums earned. The combinedratio represents the sum of the loss ratio and the underwriting expense ratio.
(4) Book value per common share is stockholders’ equity divided by common shares outstanding.
36

Cautionary Statement Regarding Forward-Looking Information
This Annual Report on Form 10-K and other publicly available documents may include, andTransatlantic Holdings, Inc. and its subsidiaries (collectively, ‘‘TRH’’), through their officers andrepresentatives, may from time to time make, statements which may constitute ‘‘forward-lookingstatements’’ within the meaning of the U.S. federal securities laws. These forward-looking statements areidentified, including without limitation, by their use of such terms and phrases as:
• ‘‘intend’’ • ‘‘plans’’• ‘‘intends’’ • ‘‘anticipates’’• ‘‘intended’’ • ‘‘anticipated’’• ‘‘goal’’ • ‘‘should’’• ‘‘estimate’’ • ‘‘think’’• ‘‘estimates’’ • ‘‘thinks’’• ‘‘expect’’ • ‘‘designed to’’• ‘‘expects’’ • ‘‘foreseeable future’’• ‘‘expected’’ • ‘‘believe’’• ‘‘project’’ • ‘‘believes’’• ‘‘projects’’ • ‘‘scheduled’’• ‘‘projected’’ • and similar expressions• ‘‘projections’’
These statements are not historical facts but instead represent only TRH’s belief regarding futureevents and financial performance, many of which, by their nature, are inherently uncertain and outside ofTRH’s control. These statements may address, among other things, TRH’s strategy and expectations forgrowth, product development, government and industry regulatory actions, legal matters, financial, creditand industry market conditions, financial results and reserves, as well as the expected impact on TRH ofnatural and man-made (e.g., terrorist attacks) catastrophic events and political, economic, legal and socialconditions.
It is possible that TRH’s actual results, financial condition and expected outcomes may differ, possiblymaterially, from those anticipated in these forward-looking statements. Important factors that could causeTRH’s actual results to differ, possibly materially, from those discussed in the specific forward-lookingstatements may include, but are not limited to, uncertainties relating to economic conditions, financial andcredit market conditions, cyclical industry conditions, credit quality, government, regulatory andaccounting policies, volatile and unpredictable developments (including natural and man-madecatastrophes), the legal environment, legal and regulatory proceedings, failures of pricing models toaccurately assess risks, the reserving process, the competitive environment in which TRH operates, interestrate and foreign currency exchange rate fluctuations and the uncertainties inherent in internationaloperations.
These factors are further discussed throughout Management’s Discussion and Analysis of FinancialCondition and Results of Operations and in Part I, Item 1A. Risk Factors of this Form 10-K. TRH is notunder any obligation to (and expressly disclaims any such obligation to) update or alter any forward-looking statement, whether written or oral, that may be made from time to time, whether as a result of newinformation, future events or otherwise.
37

Item 7.
TRANSATLANTIC HOLDINGS, INC. AND SUBSIDIARIESMANAGEMENT’S DISCUSSION AND ANALYSIS OF FINANCIAL CONDITION
AND RESULTS OF OPERATIONS(‘‘MD&A’’)
Throughout this Annual Report on Form 10-K, Transatlantic Holdings, Inc. (the ‘‘Company’’, andcollectively with its subsidiaries, ‘‘TRH’’) presents its operations in the way it believes will be mostmeaningful. In certain instances, TRH’s unpaid losses and loss adjustment expenses (‘‘LAE’’) arepresented net of related reinsurance recoverable (‘‘net loss reserves’’) in accordance with principlesprescribed or permitted by insurance regulatory authorities, as these are standard measures in theinsurance and reinsurance industries.
Financial Statements
The following discussion refers to the consolidated financial statements of TRH as of December 31,2010 and 2009 and for each of the three years in the period ended December 31, 2010, which are presentedelsewhere herein. Financial data discussed below have been affected by certain transactions between TRHand related parties. (See Notes 12, 14 and 16 of Notes to Consolidated Financial Statements.)
Executive Overview
The operations of the Company are conducted principally by its three major operating subsidiaries—Transatlantic Reinsurance Company� (‘‘TRC’’), Trans Re Zurich Reinsurance Company Ltd. (‘‘TRZ’’) andPutnam Reinsurance Company (‘‘Putnam’’)—and are managed based on its geographic segments.Through its operations on six continents, TRH offers reinsurance capacity on both a treaty and facultativebasis—structuring programs for a full range of property and casualty products, with an emphasis onspecialty lines, which may exhibit greater volatility of results over time than most other lines. Such capacityis offered through reinsurance brokers and, to a lesser extent, directly to domestic and foreign insuranceand reinsurance entities.
TRH conducts its business and assesses performance through segments organized along geographiclines. The Domestic segment principally includes financial data from branches in the United States exceptMiami, as well as revenues and expenses of the Company (including interest expense on the Company’ssenior notes and stock-based compensation expense). Data from the London and Paris branches and fromTRZ are reported in the aggregate as International-Europe and considered as one segment due tooperational and regional similarities. Data from the Miami (which serves Latin America and theCaribbean), Toronto, Hong Kong and Tokyo branches are grouped as International-Other and representsthe aggregation of segments that are generally not material.
TRH’s operating strategy emphasizes product and geographic diversification as key elements inmanaging its level of risk concentration. TRH seeks to focus on more complex risks within the casualty andproperty lines and adjusts its mix of business to take advantage of market opportunities. Over time, TRHhas most often capitalized on market opportunities when they arise by strategically expanding operationsin an existing location or opening a branch or representative office in new locations. TRH’s operationsserving international markets leverage TRH’s product knowledge, worldwide resources and financialstrength, typically utilizing indigenous management and staff with a thorough knowledge of local marketsand product characteristics.
38

TRANSATLANTIC HOLDINGS, INC. AND SUBSIDIARIESMANAGEMENT’S DISCUSSION AND ANALYSIS OF FINANCIAL CONDITION
AND RESULTS OF OPERATIONS (Continued)
In 2010, casualty lines comprised 71% of TRH’s net premiums written, while property lines totaled29%. In addition, treaty reinsurance totaled 97% of net premiums written, with the balance representingfacultative accounts. Business written by international operations represented 50% of net premiumswritten in 2010. (See Operational Review for year to year comparisons of such measures.)
TRH’s major sources of revenues are net premiums earned for reinsurance risks undertaken andincome from investments. The great majority of TRH’s investments are in held to maturity and availablefor sale fixed maturities. In general, premiums are received significantly in advance of related claimspayments.
Secondary Public Offering of the Company’s Common Stock by American InternationalGroup, Inc. (‘‘AIG’’, and collectively with its subsidiaries, the ‘‘AIG Group’’)
Prior to June 10, 2009 and as of December 31, 2008, AIG beneficially owned approximately 59% ofthe Company’s outstanding shares. On June 10, 2009, AIG and American Home Assurance Company(‘‘AHAC’’), a wholly owned subsidiary of AIG, consummated a secondary public offering (the ‘‘June 2009Offering’’) of 29.9 million issued and outstanding shares of the common stock of the Company owned byAIG and AHAC. On March 15, 2010, AHAC consummated another secondary public offering (the‘‘March 2010 Offering’’, and collectively with the June 2009 Offering, the ‘‘Secondary Offerings’’) of8.5 million issued and outstanding shares of the Company’s common stock owned by AHAC. TheCompany repurchased two million shares of its common stock from AHAC in the March 2010 Offeringpursuant to a stock offering agreement for an aggregate purchase price of approximately $105 million.TRH did not receive any proceeds from the Secondary Offerings. Immediately following the March 2010Offering, the AIG Group, including AHAC, beneficially owned 0.7 million shares of the Company’scommon stock (excluding shares held by certain mutual funds that are advised or managed by subsidiariesof AIG), representing approximately 1.1% of the Company’s then outstanding shares. As a result of itsreduced ownership percentage, the AIG Group was no longer considered a related party after March 15,2010.
Consolidated Results
The following table summarizes TRH’s revenues, income before income taxes and net income for theperiods indicated:
Years Ended December 31,
2010 2009 2008
Change ChangeFrom From
Amount Prior Year Amount Prior Year Amount
(dollars in millions)
Revenues . . . . . . . . . . . . . . . . . . . . . . . . . . . . $4,362.2 (1.9)% $4,445.7 8.9% $4,082.5Income before income taxes . . . . . . . . . . . . . . . 472.8 (20.7) 596.0 — 3.2Net income . . . . . . . . . . . . . . . . . . . . . . . . . . . 402.2 (15.8) 477.7 367.1 102.3
Revenues decreased in 2010 compared to 2009 due primarily to a decrease in net premiums earned,partially offset by realized net capital gains in 2010 compared to realized net capital losses in 2009. Thedecrease in net premiums earned occurred principally in the Domestic and International-Europesegments. The lines with the most significant decreases in net premiums earned were the auto liability,property, medical malpractice and ocean marine lines, partially offset by a significant increase in the otherliability line. The increase in realized net capital gains (losses) in 2010 is due to a decrease in
39

TRANSATLANTIC HOLDINGS, INC. AND SUBSIDIARIESMANAGEMENT’S DISCUSSION AND ANALYSIS OF FINANCIAL CONDITION
AND RESULTS OF OPERATIONS (Continued)
other-than-temporary impairments (‘‘OTTI’’) and an increase in realized net capital gains on sales andredemptions of securities, partially offset by an increase in net foreign currency transaction losses. (SeeNote 4(e) of Notes to Consolidated Financial Statements (‘‘Note 4(e)’’) for a breakdown of realized netcapital gains (losses).)
Revenues increased in 2009 compared to 2008 due primarily to a decrease in realized net capitallosses. The decrease in realized net capital losses was due principally to a decrease in OTTI and anincrease in realized net capital gains (losses) on sales and redemptions of securities in 2009 as financial andcredit markets stabilized and partially recovered from the turmoil at the end of 2008.
Results for 2010 included pre-tax net catastrophe costs of $202 million principally relating to theearthquake in Chile, the earthquake in New Zealand, storms and floods in Australia and the DeepwaterHorizon explosion. While there were no significant catastrophe losses for events occurring in 2009, theyear 2009 included a reduction of pre-tax net catastrophe costs incurred of ($6) million relating to eventsoccurring in prior years. Results for 2008 included pre-tax net catastrophe costs of $170 million principallyarising from Hurricane Ike. Catastrophe costs include losses incurred and related reinstatement premiums,the details of which can be found in Note 10 of Notes to Consolidated Financial Statements (‘‘Note 10’’).Reinstatement premiums may arise on both assumed and ceded business as a result of contractualprovisions found in certain catastrophe excess-of-loss reinsurance contracts that require additionalpremium to be paid in the event of a loss to reinstate coverage for the remaining portion of the contractperiod. Net assumed (ceded) reinstatement premiums serve to increase (decrease) net premiums writtenand earned.
Income before income taxes and net income decreased in 2010 compared to 2009 primarily as a resultof a decrease in underwriting profit and an increase in interest expense, offset in part by realized netcapital gains in 2010 compared to realized net capital losses in 2009. The decrease in underwriting profitwas primarily due to an increase in catastrophe costs in 2010, partially offset by an increase in favorable netloss reserve development. The net impact of increased catastrophe costs and increased favorable net lossreserve development was to decrease pre-tax underwriting profit in 2010 by $185.5 million compared to2009. The increase in interest expense is due to the issuance of $350 million principal amount of TRH’s8.00% senior notes due in 2039 (the ‘‘2039 Notes’’) in November 2009. The decrease in net incomebetween periods was mitigated by reduced tax expense in 2010 primarily related to the lower pre-taxincome in 2010.
Income before income taxes and net income increased in 2009 compared to 2008 primarily as a resultof a decrease in realized net capital losses and increased underwriting profit. The increase in underwritingprofit was primarily due to decreased catastrophe costs and an increase in favorable net loss reservedevelopment in 2009. The increase in net income between periods was reduced by the significant taxexpense in 2009 caused by the improved results in 2009. The net impact of decreased catastrophe costs andincreased favorable net loss reserve development was to increase pre-tax underwriting profit in 2009 by$216.2 million compared to 2008.
Underwriting profit (loss) is defined as net premiums earned less net losses and LAE incurred, net ofcommissions and other underwriting expenses, plus (minus) any increase (decrease) in deferred policyacquisition costs. (See Operational Review for further discussion.)
Market Conditions and Outlook
The market conditions in which TRH operates have historically been cyclical, experiencing periods ofprice erosion followed by rate strengthening as a result of catastrophes or other significant losses or events
40

TRANSATLANTIC HOLDINGS, INC. AND SUBSIDIARIESMANAGEMENT’S DISCUSSION AND ANALYSIS OF FINANCIAL CONDITION
AND RESULTS OF OPERATIONS (Continued)
that affect the overall capacity of the industry to provide coverage. For the years under discussion, thereinsurance market has been characterized by significant competition worldwide in most lines of business.Additionally, TRH is exposed to the operating cycles of primary insurers as the rates charged by, and thepolicy terms associated with, primary insurance agreements may affect the rates charged by, and the policyterms associated with, reinsurance agreements, particularly for pro rata reinsurance business.
Following improvements in the U.S. property marketplace after significant catastrophe losses in 2004and 2005, additional capacity entered the reinsurance market in the form of new companies in Bermuda aswell as the entrance of capacity from the capital markets via sidecars, catastrophe bonds and otherderivative products. The entrance of the new capacity slowly eroded property insurance and reinsurancerates through the first half of 2008, although the marketplace remained generally favorable.
During the second half of 2008, however, the global credit and financial crisis began to significantlyimpact the insurance and reinsurance markets. First, many alternative reinsurance solutions (such assidecars) were terminated or not renewed. Second, the impairment of insurance company balance sheetsmeant historical risk levels in many cases represented a higher than desired percentage of surplus. Third,Hurricane Ike produced one of the highest insured losses from a natural peril event despite being only acategory 2 storm. These changes produced an increase in demand for traditional reinsurance frominsurance companies as they could not raise capital by issuing debt, did not want to issue equity atdepressed stock prices and lost the ability to access the capital markets for alternative reinsurancesolutions. In addition, many reinsurers, affected by similar issues, could not maintain the levels of capacitythat they had in recent years to take on risk.
Trends in reinsurance rates at the beginning of 2009 were inconsistent, with rates increasing, stayinglevel or deteriorating depending on the line of business or region. However, as 2009 progressed,improvements in general economic conditions, the strengthening of insurers’ and reinsurers’ balancesheets and the low level of catastrophe losses in 2009 put downward pressure on reinsurance rates. Insurershad greater capacity to retain risk and increased access to capital market alternatives to reinsurancecompared to late 2008, while the strengthening of reinsurer balance sheets increased the amount ofcapacity available in the reinsurance market. Despite weakness in primary rates in several casualty linesand an increase in capacity, reinsurers generally remained disciplined during the January 1, 2010 renewalperiod. The January 1, 2010 renewals generally saw higher net retentions by cedants and reinsurance ratesremaining within acceptable levels while exhibiting greater stability than primary rates.
In the casualty lines, rates were uneven in 2009. Certain lines, like directors’ and officers’ liability(‘‘D&O’’) of financial institutions have shown rate increases, while others have been flat or showndecreases. Results in many casualty lines had benefited from favorable accident year loss severity andfrequency trends in 2009. During the January 1, 2010 renewal period, casualty insurance rates generallyremained under pressure, with some modest improvements in certain lines.
In the property lines, some catastrophe-exposed regions, particularly peak zones, saw significant rateincreases in the first half of 2009, which leveled off in the second half of 2009. Overall this businessremained at acceptable rate levels through the January 1, 2010 renewal period, with rates in the U.S. downslightly and rates outside of the U.S. generally flat. The strengthening of insurers’ balance sheets also led tohigher net retentions by cedants during the January 1, 2010 renewal period.
Market conditions were generally challenging in 2010 as a result of several trends: there wasdownward pressure on reinsurance rates in many lines; ceding companies increased their retentions; therewas excess capital in the reinsurance marketplace; and primary insurance brokers pushed for higher cedingcommissions.
41

TRANSATLANTIC HOLDINGS, INC. AND SUBSIDIARIESMANAGEMENT’S DISCUSSION AND ANALYSIS OF FINANCIAL CONDITION
AND RESULTS OF OPERATIONS (Continued)
While the catastrophe events occurring in 2010, which principally affected property lines, resulted insignificant losses for the industry, they did not meaningfully impact overall catastrophe reinsurance pricingtrends. In addition, some rate softening was evident, with U.S. catastrophe-exposed lines coming undergreater pressure than international lines. In the casualty lines, opportunities remained in certain specialtycasualty lines such as D&O, which continues to show favorable loss frequency trends, medical malpracticeand accident and health (‘‘A&H’’), although these lines faced increased pressure as the year progressed.Market conditions for marine and offshore energy lines showed sustained improvement following theDeepwater Horizon explosion, while rate increases leveled off in the aviation line. Primary rates for othercasualty lines generally remained under pressure, although internationally they are showing some signs ofimprovement.
The competitive market conditions generally continued into the January 1, 2011 renewal period.However, certain lines that TRH focuses on did exhibit favorable loss frequency and severity trends andmaintained stable terms and conditions. In the property lines, rates decreased slightly but generallyremained at acceptable levels. In the casualty lines, certain lines were acceptable while others were morecompetitive. Marine and offshore energy, domestic medical malpractice, certain errors and omissionsliability (‘‘E&O’’) niches, international A&H and U.K. motor were among the lines that were acceptable.D&O and most general casualty business were among the lines that were more competitive. With thecontinued competitive market conditions, TRH continued its practice of not renewing certain business thatdid not meet TRH’s underwriting standards.
The existence of favorable or improving market conditions in certain regions and lines of businessdoes not necessarily translate into ultimate pricing adequacy for business written under such conditions. Inaddition, there can be no assurance that these favorable or improving conditions will occur or remain ineffect in the future.
Starting in mid-2007, the U.S. residential mortgage market and the global credit and financial marketsexperienced serious disruptions, although some improvement was evident in the latter part of 2009 and in2010. TRH’s operating results and financial condition have been adversely affected and may continue to beadversely affected by this disruption. (See Disruption in Global Credit and Financial Markets.) However,the current global credit and financial markets may present attractive opportunities for strategicacquisitions and investments, particularly given TRH’s strong capital position, financial resources andreputation, which TRH may, from time to time, evaluate and pursue.
Further information relating to items discussed in this Executive Overview may be found throughoutMD&A.
Critical Accounting Estimates
This discussion and analysis of financial condition and results of operations is based on TRH’sconsolidated financial statements which have been prepared in accordance with generally acceptedaccounting principles in the United States (‘‘GAAP’’). The preparation of these financial statementsrequires the use of estimates and judgments that affect the reported amounts and related disclosures. TRHrelies on historical experience and on various other assumptions that it believes to be reasonable, under thecircumstances, to make judgments about the carrying values of assets and liabilities that are not readilyapparent from other sources. Actual results may differ materially from these estimates.
TRH believes its most critical accounting estimates are those with respect to loss reserves, fair valuemeasurements of certain financial assets, OTTI of investments and premium revenues, as they requiremanagement’s most significant exercise of judgment on both a quantitative and qualitative basis in the
42
TRANSATLANTIC HOLDINGS, INC. AND SUBSIDIARIESMANAGEMENT’S DISCUSSION AND ANALYSIS OF FINANCIAL CONDITION
AND RESULTS OF OPERATIONS (Continued)
preparation of TRH’s consolidated financial statements and footnotes. The accounting estimates thatresult require the use of assumptions about certain matters that are highly uncertain at the time ofestimation. To the extent actual experience differs from the assumptions used, TRH’s results of operationsand financial condition would be affected, possibly materially. A discussion of these most criticalaccounting estimates follows:
(a) Loss Reserves
Estimates of loss reserves take into account TRH’s assumptions with respect to many factors that willaffect ultimate loss costs but are not yet known. The ultimate process by which actual carried reserves aredetermined considers not only actuarial estimates but a myriad of other factors. Such factors, both internaland external, which contribute to the variability and unpredictability of loss costs, include trends relating tojury awards, social inflation, medical inflation, worldwide economic conditions, tort reforms, courtinterpretations of coverages, the regulatory environment, underlying policy pricing, terms and conditionsand claims handling, among others. In addition, information gathered through underwriting and claimsaudits is also considered. To the extent that these assumptions underlying the loss reserve estimates aresignificantly incorrect, ultimate losses may be materially different from the estimates included in thefinancial statements and may materially and adversely affect results of operations and financial condition.The impact of those differences is reflected in the period they become known.
The reserving process is inherently difficult and subjective, especially in view of changing legal andeconomic environments which impact the development of loss reserves, and therefore quantitativetechniques frequently have to be supplemented by subjective considerations and managerial judgment. Inaddition, trends that have affected development of liabilities in the past may not necessarily occur or affectdevelopment to the same degree in the future.
While this process is difficult and subjective for ceding companies, the inherent uncertainties ofestimating loss reserves are even greater for reinsurers, due primarily to the longer-term nature of muchreinsurance business, the diversity of development patterns among different types of reinsurance treatiesor facultative contracts, the necessary reliance on the ceding companies for information regarding reportedclaims and differing reserving practices among ceding companies, which can be subject to change withoutnotice. Nevertheless, data received from cedants is subjected to audits periodically by TRH claims andunderwriting personnel, to help ensure that reported data is supported by proper documentation andconforms to contract terms, and is analyzed, as appropriate, by TRH underwriting and actuarial personnel.Such analysis often includes a detailed review of reported data to assess the underwriting results ofreinsurance assumed and to explain any significant departures from expected performance. Over time,reported loss information is ultimately corroborated when such information eventually attains paid status.
Standard actuarial methodologies employed to estimate ultimate losses incorporate the inherent ‘‘lag’’from the time claims are reported to the cedant to when the cedant reports the claims to the reinsurer.Certain actuarial methodologies may be more appropriate than others in instances where this ‘‘lag’’ maynot be consistent from period to period. Consequently, additional actuarial judgment is employed in theselection of methodologies to best incorporate the potential impact of this situation.
Generally, for each line of business, significant actuarial judgments are made with respect to thefollowing factors used in the loss reserve setting process:
• Loss trend factors are used to establish expected loss ratios (‘‘ELRs’’) for subsequent accident yearsbased on the projected loss ratios for prior accident years. Provisions for inflation and socialinflation (e.g., awards by judges and juries which progressively increase in size at a rate exceeding
43

TRANSATLANTIC HOLDINGS, INC. AND SUBSIDIARIESMANAGEMENT’S DISCUSSION AND ANALYSIS OF FINANCIAL CONDITION
AND RESULTS OF OPERATIONS (Continued)
that of general inflation) and trends in court interpretations of coverage are among the factorswhich must be considered.
• ELRs for the latest accident years generally reflect the ELRs from prior accident years adjusted forthe loss trend (see Loss trend factors discussion), as well as the impact of rate level changes andother quantifiable factors. For certain longer-tail lines of business that are typically lower frequency,higher severity classes, such as excess medical malpractice and D&O, ELRs are often utilized forthe last several accident years.
• Loss development factors are used to arrive at the ultimate amount of losses incurred for eachaccident year based on reported loss information. These factors, which are initially calculated basedon historical loss development patterns (i.e., the emergence of reported losses over time relative tothe ultimate losses to be paid) may then be adjusted for current trends.
During the loss settlement period, which can be many years in duration, additional facts regardingindividual claims and trends usually become known. As these facts and trends emerge, it usually becomesnecessary to refine and adjust the loss reserves upward or downward and even then the ultimate netliability may be materially different from the revised estimates. There is potential for significant variationin the development of loss reserves when actual costs differ from those costs implied by the use of theassumptions employed in the reserve setting process. This is particularly true for assumed reinsurance oflong-tail casualty classes. Among the most critical assumptions are those made for ELRs and lossdevelopment factors.
The methodologies that TRH employs to assess the reasonableness of loss reserve estimates includethe paid loss development, incurred loss development, paid Bornhuetter-Ferguson (‘‘B-F’’) and incurredB-F methods. The actuarial methods that TRH employs to determine the appropriate loss reserves forshort-tail lines of business are the same as those employed for longer-tail lines. However, the judgmentsthat are made with regard to factors such as loss trends, ELRs and loss development factors for shorter-taillines generally have much less of an effect on the determination of the loss reserve amount than whenthose same judgments are made regarding longer-tailed lines of business. In contrast to the longer-tailedlines of business, reported losses for the shorter-tailed classes, such as the property lines of business(e.g., fire and homeowners multiple peril) and certain marine and energy classes, generally reach theultimate level of incurred losses in a relatively short-period of time. Rather than having to rely onassumptions regarding ELRs and loss development factors for many accident years for a given line, theseassumptions are generally only relevant for the most recent accident year or two. Therefore, theseassumptions tend to be less critical and the reserves calculated pursuant to these assumptions are subjectto less variability for the shorter-tailed lines of business.
The characteristics of each line of business are considered in the reserving process. TRH’s major linesof business and reserve methodologies are discussed below:
• Other Liability: The key components of the other liability line of business are excess casualty, D&Oand E&O.
• Excess Casualty: The vast majority of this class consists of domestic treaties, including pro rataand excess-of-loss contracts of general liability business. Excess casualty is dominated byumbrella business, some of which have very high attachment points. This business is generallyvery long-tailed and characterized by relatively low frequency and high severity type losses.Therefore, expected loss ratio methods, such as the incurred B-F method, are heavily reliedupon for most years due to the lack of mature reported experience in the most recent years and
44

TRANSATLANTIC HOLDINGS, INC. AND SUBSIDIARIESMANAGEMENT’S DISCUSSION AND ANALYSIS OF FINANCIAL CONDITION
AND RESULTS OF OPERATIONS (Continued)
the volatile nature of experience in older years. The ELRs utilized for the most recent years arebased on the projected ultimate loss ratios of prior years adjusted for rate level changes,estimated loss cost trends and other quantifiable changes, as well as actuarial pricingindications.
• D&O and E&O: These classes are dominated by high layer excess-of-loss D&O business aswell as E&O classes such as lawyers and accountants. Much of this business is domestic,although significant amounts are written by the London branch. This business is reviewedseparately by operating branch and for pro rata versus excess-of-loss contracts and for treatyversus facultative. Additionally, homogeneous groupings of accountant, lawyer, and architectand engineer risks are reviewed separately. These classes are long-tailed in nature, oftencharacterized by very high attachment points. Therefore, B-F methods are generally reliedupon for the most recent years due to the lack of mature reported experience. The selectionsfor older years will often be based on the weighted average of the loss development methodsand B-F methods. The selection of ELRs for these classes is generally analogous to that of theExcess Casualty class described above but with added emphasis on actuarial pricing indications,as these accounts are often very large and are virtually all actuarially reviewed before thebusiness is underwritten.
• Medical Malpractice: Healthcare professional, which is the most significant component of TRH’smedical malpractice line of business, is reviewed by operating branch and separately for treaty andfacultative contracts. Pro rata contracts are reviewed separately from excess-of-loss contracts. Thereis significant volume in all groupings. This class is also quite long-tailed due to the excess-of-lossnature of many of the contracts. Due to the lack of mature reported experience, B-F methods aregenerally utilized for the most recent underwriting years with some weight given to the lossdevelopment methods for earlier years. Because almost all of these accounts are actuarially priced,the indications from these reviews are critical to the selection of the ELRs.
• Shorter-tailed lines: These would include the property lines of business (such as fire andhomeowners multiple peril), A&H and certain marine and energy classes. These lines are written byseveral of TRH’s worldwide offices and the reserves are reviewed separately for each operatingbranch. Where sufficiently credible experience exists, these lines are reviewed after segregating prorata contracts from excess-of-loss contracts. For a reinsurer, these lines do not develop to ultimateloss as quickly as when written on a primary basis; however, they are significantly shorter-tailed thanthe casualty classes discussed earlier. For these classes, a combination of loss development methodsand B-F methods are used. Generally, selections for all but the most recent few years are based onloss development methods with the most recent years based on weightings of loss development andexpected loss ratio indications.
A comprehensive annual loss reserve review is conducted in the fourth quarter of each year. Thereview is conducted in full detail for each class or line of business for each underwriting office and consistsof more than one hundred individual analyses. In completing these detailed actuarial reserve analysessignificant actuarial judgment is often employed. TRH is required to make numerous assumptions,including the selection of loss development factors and ELRs. Additionally, TRH needs to select the mostappropriate actuarial method(s) to employ for each class of business.
Triangles of written premium, paid losses and incurred losses are organized by underwriting yearevaluated at six month intervals. The data triangles are split by branch, contract type (i.e., treaty versusfacultative), line of business and often between excess-of-loss and pro rata business. The line of business
45

TRANSATLANTIC HOLDINGS, INC. AND SUBSIDIARIESMANAGEMENT’S DISCUSSION AND ANALYSIS OF FINANCIAL CONDITION
AND RESULTS OF OPERATIONS (Continued)
groupings vary by branch and are reviewed annually to ensure a proper balance between homogeneity andcredibility of data. In the loss development methods, paid and incurred losses by underwriting year areprojected to an ultimate basis by applying appropriate age to ultimate development factors to the inceptionto date paid and incurred losses. The development factors are selected based on curves fitted to thehistorical average which best represent the data. In the B-F methods, estimates of unpaid and unreportedlosses are arrived at by multiplying underwriting year earned premium by an ELR and an estimatedpercentage of unpaid or unreported losses. These percentages of unpaid or unreported losses are derivedfrom the loss development factors described above. These methods yield an indication of the ultimatelosses for each underwriting year. The indicated incurred but not reported (‘‘IBNR’’) reserve need is thendetermined (by year, by line of business) by subtracting the reported losses (which are equal to the sum ofinception to date paid losses and the case reserves as of the balance sheet date) from the indicated ultimatelosses.
In the course of these detailed loss reserve reviews, which are performed by underwriting year and byline of business, a point estimate of the loss reserve need is determined. Differences between theindications arising from the various methods are analyzed to understand the drivers of these differences, sothat TRH can make a selection based on the methods that are believed to be most appropriate for that lineof business. Frequently, the selection is based on an average of the various indications, giving the mostweight to the indications deemed most appropriate. Generally speaking, TRH is often able to give moreweight to loss development indications for more mature years where credible reported losses exist, asopposed to the more current years, where the B-F method is often highly relied upon due to the lack ofcredible and mature reported experience. When the actuarial point estimate is compared to the carriedreserve, it is recognized that there is an implicit range around the indicated point estimate whereby acarried reserve within that range may be considered reasonable. TRH reviews the appropriateness of theheld reserves relative to the indicated point estimate considering many factors. These factors may include,but are not limited to, the amount and direction of any difference between the point estimate and the heldreserve, any operational issues which may be difficult to actuarially quantify, various actuarial assumptionson which management may want additional input or any observations regarding optimism or conservatismwhich management may believe need to be considered. Thus, the carried reserves, as determined bymanagement, may be more or less than the actuarially determined point estimate. As of December 31,2010 and 2009, TRH’s carried loss and LAE reserves, net of related reinsurance recoverable, were$8.21 billion and $7.87 billion, respectively, and were equal to the actuarial point estimate.
There is potential for significant variation in the development of loss reserves when actual costs differfrom those costs implied by the assumptions used to test the loss reserves. This is particularly true forassumed reinsurance of long-tail casualty classes. Among the most critical assumptions are those made forELRs and loss development factors.
46

TRANSATLANTIC HOLDINGS, INC. AND SUBSIDIARIESMANAGEMENT’S DISCUSSION AND ANALYSIS OF FINANCIAL CONDITION
AND RESULTS OF OPERATIONS (Continued)
TRH’s annual loss reserve review for 2010 did not include the calculation of a range of loss reserveestimates. Because management does not believe it can currently assign credible probabilistic values to arange, a better understanding of the volatility of loss reserve estimates can be gained via an analysis of thesensitivity of these estimates to changes in the critical assumptions used in the loss reserve review processas opposed to creating a range during the loss reserve review process.
An analysis of the sensitivity of the loss reserve indications to these key assumptions can be performedby measuring the effect of various changes to the assumptions utilized in the reviews. The assumptionsmade regarding factors considered in the sensitivity analysis, such as loss trends, ELRs and lossdevelopment factors, are generally consistent with TRH’s historical experience. Loss development factors,for example, which are used to project reported paid and incurred losses to an ultimate incurred loss, areselected based on the curves fitted to the historical averages which best represent the data. ELRs are basedon the ultimate loss ratios for the more mature years adjusted for changes in the rate levels and otherquantifiable factors to enable the ELRs to remain consistent with historical experience. In general, it isbelieved that the vast majority of potential volatility in the loss reserves results from the longer-tailed linesof business. For the purpose of these sensitivity analyses, only the IBNR portion of loss reserves from theselonger-tailed lines, which represent approximately 85% of the total IBNR portion of loss reserves atDecember 31, 2010, were included in the calculations. Additionally, only those underwriting years where itis believed reasonable for deviations from the original assumptions to occur were utilized. Generally, thelast 15 years were included in the analysis. The results derived from the sensitivity analyses are roughly thesame whether utilizing unpaid losses and loss adjustment expenses (‘‘gross loss reserves’’) or net lossreserves.
While noting that there exists the potential for greater variations, TRH believes utilizing 5% and 10%changes to the assumptions made for both loss development factors and ELRs provide reasonablebenchmarks for a sensitivity analysis of the loss reserve estimates at December 31, 2010. For example,changing the ELRs by 5 percentage points has an impact of about $230 million (either positively ornegatively) on the loss reserve estimate. While less likely for many classes of business, TRH notes thatchanging the ELRs by 10 percentage points has an effect of about $470 million. As previously described,another key assumption is the selection of loss development patterns. The effect of increasing the tail onthe selected loss development patterns by 5% is about $380 million. Similarly, a 10% deviation wouldimpact the reserve estimate by about $745 million. Because a downward adjustment to the lossdevelopment patterns can result in implied negative future development on reported losses for certainyears, this scenario is not believed to be as likely as that of an upward deviation of this amount.
Due to the assumptions and methodologies utilized by TRH in its reviews of longer-tailed classes ofbusiness, changes to the ELRs generally have a much greater impact on the assessment of loss reserves forthe most recent few underwriting years while deviations from the loss development factors utilized in thereviews generally are more critical to the loss reserve indications for older underwriting years (i.e., 2002and prior). Management believes that it is reasonable to simultaneously vary both of the assumptionspreviously discussed by 5% and 10%. The effect of varying these assumptions together by 5% is about$625 million. Increasing these assumptions by 10% simultaneously adds approximately $1.29 billion to thereserve estimates, although management considers this scenario to be significantly less likely than the 5%scenario previously discussed. TRH also notes that the classes of business for which these assumptions aremost critical are medical malpractice, D&O, E&O and excess casualty.
Net loss reserves include amounts for risks relating to environmental impairment and asbestos-relatedillnesses. The majority of TRH’s environmental and asbestos-related net loss reserves arose from contracts
47
TRANSATLANTIC HOLDINGS, INC. AND SUBSIDIARIESMANAGEMENT’S DISCUSSION AND ANALYSIS OF FINANCIAL CONDITION
AND RESULTS OF OPERATIONS (Continued)
entered into after 1985 that were underwritten specifically as environmental or asbestos-related coveragesrather than as standard general liability coverages, where the environmental or asbestos-related liabilitieswere neither clearly defined nor specifically excluded. The reserves carried for these claims, including theIBNR portion, are based upon known facts and current law. However, significant uncertainty exists indetermining the amount of ultimate liability for environmental impairment and asbestos-related losses,particularly for those occurring in 1985 and prior. This uncertainty is due to inconsistent court resolutionsand judicial interpretations with respect to underlying policy intent and coverage and uncertainties as tothe allocation of responsibility for resultant damages, among other things.
See discussion of net development on losses occurring in prior years (which includes a discussion ofthe causative factors of such net development) under Results of Operations and further information aboutgross loss reserves under Financial Condition and Liquidity.
(b) Fair Value Measurements of Certain Financial Assets
TRH measures at fair value on a recurring basis financial instruments included principally in itsavailable for sale securities portfolios and certain short-term investments. The fair value of a financialinstrument is the amount that would be received to sell an asset in an orderly transaction between willing,able and knowledgeable market participants at the measurement date.
The degree of judgment used in measuring the fair value of financial instruments generally correlateswith the level of pricing observability. Financial instruments with quoted prices in active markets generallyhave more pricing observability and less judgment is used in measuring fair value. Conversely, financialinstruments traded in other-than-active markets or that do not have quoted prices have less observabilityand are measured at fair value using valuation models or other pricing techniques that require morejudgment. An active market is one in which transactions for the asset being valued occurs with sufficientfrequency and volume to provide pricing information on an ongoing basis. An other-than-active market isone in which there are few transactions, the prices are not current, price quotations vary substantiallyeither over time or among market makers, or in which little information is released publicly for the assetbeing valued. Pricing observability is affected by a number of factors, including the type of financialinstrument, whether the financial instrument is new to the market and not yet established, thecharacteristics specific to the transaction and general market conditions. (See Note 3 of Notes toConsolidated Financial Statements (‘‘Note 3’’) for the valuation techniques and inputs TRH uses todetermine the fair value.)
As of December 31, 2010, of TRH’s $11.5 billion of fixed maturities available for sale, equitiesavailable for sale and other invested assets measured at fair value on a recurring basis, $11.3 billion wasbased on prices received from independent pricing services and $0.2 billion was based on non-bindingbroker quotes or internal valuation sources. Management reviewed fair values from external sources anddid not make any material adjustments to fair values.
Through June 30, 2009, the AIG Group managed the investments and performed investmentrecordkeeping and the valuation services discussed in Note 3 for TRH. Effective July 1, 2009, TRHemploys third parties not affiliated with AIG to provide these services.
See Note 3 for discussion of how TRH determines the fair value of its fixed maturities available forsale, equities available for sale and certain short-term investments.
48

TRANSATLANTIC HOLDINGS, INC. AND SUBSIDIARIESMANAGEMENT’S DISCUSSION AND ANALYSIS OF FINANCIAL CONDITION
AND RESULTS OF OPERATIONS (Continued)
Fair Value Hierarchy and Level 3 Assets
Assets recorded at fair value in the consolidated balance sheet are classified in a hierarchy fordisclosure purposes consisting of three levels based on the observability of inputs available in themarket place used to measure the fair value. (See Note 3 for additional information about fair valuemeasurements.)
The valuation of Level 3 assets requires the greatest degree of judgment, as these measurementsmay be made under circumstances in which there is little, if any, market activity for the asset. AtDecember 31, 2010, TRH classified $230.0 million of assets measured at fair value on a recurring basisas Level 3. This represented 2.0% of total assets measured at fair value on a recurring basis. Level 3fair value measurements are based on valuation techniques that use at least one significant input thatis unobservable. TRH’s assessment of the significance of a particular input to the fair valuemeasurement in its entirety requires judgment.
In making the assessment, TRH considers factors specific to the asset. In certain cases, the inputsused to measure fair value may fall into different levels of the fair value hierarchy. In such cases, thelevel in the fair value hierarchy within which the fair value measurement in its entirety falls isdetermined based on the lowest level input that is significant to the fair value measurement in itsentirety.
TRH values its assets classified as Level 3 using judgment and valuation models or other pricingtechniques that require a variety of inputs including contractual terms, market prices and rates, yieldcurves, credit curves, measures of volatility, prepayment rates and correlations of such inputs, some ofwhich may be unobservable. The following paragraphs describe the methods TRH uses to measure ona recurring basis the fair value of the most significant types of assets classified as Level 3.
• Certain residential mortgage-backed securities (‘‘RMBS’’) and commercial mortgage-backedsecurities (‘‘CMBS’’): These assets initially are valued at the transaction price. Subsequently,they may be valued by comparison to transactions in instruments with similar collateral and riskprofiles, remittances received and updated cumulative loss data on underlying obligations,discounted cash flow techniques and/or option adjusted spread analyses.
• Certain other asset-backed securities—non-mortgage: These assets initially are valued at thetransaction price. Subsequently, they may be valued based on external price/spread data. Whenposition-specific external price data are not observable, the valuation is based on prices ofcomparable securities.
• Other invested assets: Fair values for other invested assets, principally direct equity investmentsand alternative investments, are initially valued at the transaction price. Subsequently, fairvalue is based on the net asset value or financial statement information of the investee.
(c) OTTI of Investments
See Note 4(g) of Notes to Consolidated Financial Statements (‘‘Note 4(g)’’) for the criteria TRH usesto evaluate if an investment is a candidate for OTTI.
The determination that a security has incurred OTTI in value requires the judgment of managementand consideration of the fundamental condition of the issuer, its near-term prospects and all the relevantfacts and circumstances.
49

TRANSATLANTIC HOLDINGS, INC. AND SUBSIDIARIESMANAGEMENT’S DISCUSSION AND ANALYSIS OF FINANCIAL CONDITION
AND RESULTS OF OPERATIONS (Continued)
There can, however, be no assurance that TRH has accurately assessed the level of OTTI reflected inits financial statements. Furthermore, additional OTTI may need to be taken in the future. Historicaltrends may not be indicative of future OTTI.
At December 31, 2010, TRH had gross unrealized losses on all fixed maturities (including fixedmaturities classified as held to maturity) and equities totaling $150 million which did not meet the criteriafor OTTI charged to earnings. If TRH’s determination of OTTI is materially incorrect, it could have amaterial adverse effect on TRH’s results of operations.
(d) Premium Revenues
Management must make certain judgments in the determination of premiums written and earned byTRH. For pro rata treaty contracts, premiums written and earned are based on reports received fromceding companies. For excess-of-loss treaty contracts, premiums are generally recorded as written based oncontract terms and are earned ratably over the terms of the related coverages provided. In recent years,treaty contracts have generated approximately 97% of TRH’s premium revenues. Unearned premiums andprepaid reinsurance premiums represent the portion of gross premiums written and ceded premiumswritten, respectively, relating to the unexpired terms of such coverages. The relationship between netpremiums written and net premiums earned will, therefore, vary depending generally on the volume andinception dates of the business assumed and ceded and the mix of such business between pro rata andexcess-of-loss reinsurance.
Premiums written and earned, along with related costs, for which data has not been reported by theceding companies, are estimated based on historical patterns and other relevant information. Suchestimates of premiums earned are considered when establishing the IBNR portion of loss reserves. Thedifferences between these estimates and the actual data subsequently reported, which may be material as aresult of the diversity of cedants and reporting practices and the inherent difficulty in estimating premiuminflows, among other factors, are recorded in the period when the actual data become available and maymaterially affect results of operations. In the Consolidated Statements of Operations, premiums writtenand earned and the change in unearned premiums are presented net of reinsurance ceded.
50

TRANSATLANTIC HOLDINGS, INC. AND SUBSIDIARIESMANAGEMENT’S DISCUSSION AND ANALYSIS OF FINANCIAL CONDITION
AND RESULTS OF OPERATIONS (Continued)
TRH’s financial statements reflected estimates of gross premiums written, commissions and premiumbalances receivable, for which data had as yet to be reported by cedants as of December 31, 2010 and 2009,as follows:
2010
Gross PremiumsPremiums Balances
Major Class Written Commissions Receivable
(in thousands)
Casualty:Other liability . . . . . . . . . . . . . . . . . . . . . . . . . . . . . . . . . . $108,025 $39,656 $ 68,369Accident and health . . . . . . . . . . . . . . . . . . . . . . . . . . . . . 20,232 1,594 18,638Medical malpractice . . . . . . . . . . . . . . . . . . . . . . . . . . . . . 23,059 6,119 16,940Ocean marine and aviation . . . . . . . . . . . . . . . . . . . . . . . . 42,013 4,611 37,402Auto liability . . . . . . . . . . . . . . . . . . . . . . . . . . . . . . . . . . 7,325 1,522 5,803Surety and credit . . . . . . . . . . . . . . . . . . . . . . . . . . . . . . . 31,137 9,827 21,310Other . . . . . . . . . . . . . . . . . . . . . . . . . . . . . . . . . . . . . . . 17,961 4,845 13,116
Total casualty . . . . . . . . . . . . . . . . . . . . . . . . . . . . . . . . 249,752 68,174 181,578Property:
Fire . . . . . . . . . . . . . . . . . . . . . . . . . . . . . . . . . . . . . . . . . 55,952 13,009 42,943Allied lines . . . . . . . . . . . . . . . . . . . . . . . . . . . . . . . . . . . . 10,873 2,360 8,513Auto physical damage . . . . . . . . . . . . . . . . . . . . . . . . . . . . 4,639 1,259 3,380Homeowners multiple peril . . . . . . . . . . . . . . . . . . . . . . . . 11,491 3,975 7,516Other . . . . . . . . . . . . . . . . . . . . . . . . . . . . . . . . . . . . . . . 10,082 1,996 8,086
Total property . . . . . . . . . . . . . . . . . . . . . . . . . . . . . . . . 93,037 22,599 70,438Total . . . . . . . . . . . . . . . . . . . . . . . . . . . . . . . . . . . . . . . $342,789 $90,773 $252,016
51

TRANSATLANTIC HOLDINGS, INC. AND SUBSIDIARIESMANAGEMENT’S DISCUSSION AND ANALYSIS OF FINANCIAL CONDITION
AND RESULTS OF OPERATIONS (Continued)
2009
Gross PremiumsPremiums Balances
Major Class Written Commissions Receivable
(in thousands)
Casualty:Other liability . . . . . . . . . . . . . . . . . . . . . . . . . . . . . . . . . . $ 85,380 $24,152 $ 61,228Accident and health . . . . . . . . . . . . . . . . . . . . . . . . . . . . . 14,975 3,908 11,067Medical malpractice . . . . . . . . . . . . . . . . . . . . . . . . . . . . . 37,130 9,668 27,462Ocean marine and aviation . . . . . . . . . . . . . . . . . . . . . . . . 46,920 8,687 38,233Auto liability . . . . . . . . . . . . . . . . . . . . . . . . . . . . . . . . . . 7,794 1,888 5,906Surety and credit . . . . . . . . . . . . . . . . . . . . . . . . . . . . . . . 36,198 12,107 24,091Other . . . . . . . . . . . . . . . . . . . . . . . . . . . . . . . . . . . . . . . 14,292 3,483 10,809
Total casualty . . . . . . . . . . . . . . . . . . . . . . . . . . . . . . . . 242,689 63,893 178,796Property:
Fire . . . . . . . . . . . . . . . . . . . . . . . . . . . . . . . . . . . . . . . . . 56,255 15,600 40,655Allied lines . . . . . . . . . . . . . . . . . . . . . . . . . . . . . . . . . . . . 13,301 2,734 10,567Auto physical damage . . . . . . . . . . . . . . . . . . . . . . . . . . . . 1,251 893 358Homeowners multiple peril . . . . . . . . . . . . . . . . . . . . . . . . 3,742 1,324 2,418Other . . . . . . . . . . . . . . . . . . . . . . . . . . . . . . . . . . . . . . . 9,311 1,882 7,429
Total property . . . . . . . . . . . . . . . . . . . . . . . . . . . . . . . . 83,860 22,433 61,427Total . . . . . . . . . . . . . . . . . . . . . . . . . . . . . . . . . . . . . . . $326,549 $86,326 $240,223
TRH has provided no allowance for bad debts relating to the premium estimates based on itshistorical experience, the general profile of its cedants and the ability TRH has in most cases tosignificantly offset these premium receivables with losses and LAE or other amounts payable to the sameparties.
Operational Review
Results of Operations
TRH derives its revenue from two principal sources: premiums from reinsurance assumed net ofreinsurance ceded (i.e., net premiums earned) and income from investments. The following table shows netpremiums written, net premiums earned, net investment income, realized net capital gains (losses), (loss)gain on early extinguishment of debt and total revenue of TRH for the periods indicated:
Years Ended December 31,
2010 2009 2008
Change ChangeFrom From
Amount Prior Year Amount Prior Year Amount
(dollars in millions)
Net premiums written . . . . . . . . . . . . . . . . . . $3,881.7 (2.6)% $3,986.1 (3.0)% $4,108.1Net premiums earned . . . . . . . . . . . . . . . . . . 3,858.6 (4.5) 4,039.1 (0.7) 4,067.4Net investment income . . . . . . . . . . . . . . . . . 473.5 1.3 467.4 6.1 440.5Realized net capital gains (losses) . . . . . . . . . . 30.1 142.6 (70.6) 83.8 (435.5)(Loss) gain on early extinguishment of debt . . (0.1) (101.2) 9.9 (3.7) 10.3Total revenues . . . . . . . . . . . . . . . . . . . . . . . . 4,362.2 (1.9) 4,445.7 8.9 4,082.5
52
TRANSATLANTIC HOLDINGS, INC. AND SUBSIDIARIESMANAGEMENT’S DISCUSSION AND ANALYSIS OF FINANCIAL CONDITION
AND RESULTS OF OPERATIONS (Continued)
Net premiums written decreased in 2010 compared to 2009 due principally to a decrease in theDomestic segment. The decrease in net premiums written reflects increased ceding company retentionsand competitive market conditions which led TRH not to renew certain business that did not meet TRH’sunderwriting standards.
Net premiums written decreased in 2009 compared to 2008 due in large part to changes in foreigncurrency exchange rates, but also reflected competitive market conditions which led TRH not to renewcertain business that did not meet TRH’s underwriting standards.
In 2010 and 2009, each as compared to the respective immediately prior year, the changes in netpremiums written were primarily from treaty business. In general, premium fluctuations reflect prevailingmarket conditions and strategic decisions by TRH’s management in recent periods as discussed earlier inMD&A.
A breakdown of total net premiums written in 2010, 2009 and 2008 is as follows:
Years Ended December 31,
2010 2009 2008
Casualty . . . . . . . . . . . . . . . . . . . . . . . . . . . . . . . . . . . . . . . . . . . . . . . 70.7% 71.3% 69.8%Property . . . . . . . . . . . . . . . . . . . . . . . . . . . . . . . . . . . . . . . . . . . . . . . 29.3 28.7 30.2Total . . . . . . . . . . . . . . . . . . . . . . . . . . . . . . . . . . . . . . . . . . . . . . . . . 100.0% 100.0% 100.0%
Treaty . . . . . . . . . . . . . . . . . . . . . . . . . . . . . . . . . . . . . . . . . . . . . . . . 96.7% 97.0% 96.8%Facultative . . . . . . . . . . . . . . . . . . . . . . . . . . . . . . . . . . . . . . . . . . . . . 3.3 3.0 3.2Total . . . . . . . . . . . . . . . . . . . . . . . . . . . . . . . . . . . . . . . . . . . . . . . . . 100.0% 100.0% 100.0%
Domestic . . . . . . . . . . . . . . . . . . . . . . . . . . . . . . . . . . . . . . . . . . . . . . 50.2% 51.5% 49.6%International . . . . . . . . . . . . . . . . . . . . . . . . . . . . . . . . . . . . . . . . . . . 49.8 48.5 50.4Total . . . . . . . . . . . . . . . . . . . . . . . . . . . . . . . . . . . . . . . . . . . . . . . . . 100.0% 100.0% 100.0%
The following table summarizes the net effect of changes in foreign currency exchange rates comparedto the U.S. dollar on the percentage change in net premiums written in 2010 and 2009 compared to therespective immediately prior year.
2010 2009
Change excluding foreign exchange . . . . . . . . . . . . . . . . . . . . . . . . . . . . . . . . . . . (2.5)% (0.5)%Foreign exchange effect . . . . . . . . . . . . . . . . . . . . . . . . . . . . . . . . . . . . . . . . . . . (0.1) (2.5)Change as reported in U.S. dollars . . . . . . . . . . . . . . . . . . . . . . . . . . . . . . . . . . . (2.6) (3.0)
Domestic net premiums written decreased in 2010 by $101.5 million, or 5.0%, from 2009 to$1.95 billion. Significant decreases in Domestic net premiums written were recorded in the A&H($28.5 million), auto liability ($25.7 million), medical malpractice ($24.3 million) and other liability($20.2 million) lines.
International net premiums written in 2010 totaled $1.93 billion and remained level with 2009.Significant decreases in net premiums written occurred in the Miami ($36.5 million) and Paris($35.7 million) branches, largely offset by significant increases in TRZ ($24.5 million) and the Hong Kong($17.3 million) and Tokyo ($13.3 million) branches. Significant decreases in International net premiumswritten were recorded in the ocean marine ($26.9 million) and credit ($24.9 million) lines. These decreases
53

TRANSATLANTIC HOLDINGS, INC. AND SUBSIDIARIESMANAGEMENT’S DISCUSSION AND ANALYSIS OF FINANCIAL CONDITION
AND RESULTS OF OPERATIONS (Continued)
were largely offset by significant increases in the A&H ($35.1 million) and auto liability ($22.2 million)lines. Changes in foreign currency exchange rates decreased 2010 International net premiums written by$4.6 million compared to 2009. Excluding the impact of changes in foreign currency exchange rates,International net premiums written would have increased 0.1% in 2010 compared to 2009.
Domestic net premiums written increased in 2009 by $15.4 million, or 0.8%, from 2008 to$2.05 billion. Significant increases in Domestic net premiums written were recorded in the A&H($38.1 million) and other liability ($21.5 million) lines. These increases were largely offset by significantdecreases in the medical malpractice ($31.9 million) and auto liability ($17.5 million) lines.
International net premiums written decreased in 2009 by $137.4 million, or 6.6%, from 2008 to$1.94 billion. The significant decreases in net premiums written occurred in the London ($103.1 million),Paris ($100.0 million) and Hong Kong ($27.3 million) branches, partially offset by significant increases inTRZ ($46.2 million) and the Toronto branch ($26.9 million). Significant decreases in International netpremiums written were recorded in the property ($101.2 million), auto liability ($59.0 million), boiler andmachinery ($22.0 million) and ocean marine ($20.7 million) lines. These decreases were partially offset bysignificant increases in the A&H ($63.9 million) and other liability ($18.8 million) lines. Of the$137.4 million decrease in international net premiums written, $98.5 million was due to changes in foreigncurrency exchange rates. Excluding the impact of changes in foreign currency exchange rates, Internationalnet premiums written would have decreased 1.9% in 2009 compared to 2008.
Generally, reasons for changes in gross premiums written between years are similar to those for netpremiums written, except for changes in ceded premiums, including premiums assumed from a subsidiaryof AIG that, by prearrangement, were ceded in an equal amount to other subsidiaries of AIG. See Note 16of Notes to Consolidated Financial Statements (‘‘Note 16’’). The majority of the increase in premiumsceded in 2010 compared to 2009 is due to an increase in premiums assumed from a subsidiary of AIG that,by prearrangement with TRH, were then ceded in an equal amount to other subsidiaries of AIG. Themajority of the decrease in premiums ceded in 2009 compared to 2008 is due to a decrease in premiumsassumed from a subsidiary of AIG that, by prearrangement with TRH, were then ceded in an equalamount to other subsidiaries of AIG. As further discussed in Note 14 of Notes to Consolidated FinancialStatements, certain business assumed by TRH from the AIG Group were related party transactions as aresult of the AIG Group’s ownership interest during those periods. TRH either accepted or rejectedbusiness with such companies based on its assessment of risk selection, pricing, terms and conditions,among other factors.
As premiums written are primarily earned ratably over the terms of the related coverage, the reasonsfor changes in net premiums earned are generally similar to the reasons for changes in net premiumswritten over time.
Net investment income in 2010 increased compared to 2009 due largely to an increase in investmentincome from fixed maturities of $25.1 million, offset by decreases in investment income from equities of$3.8 million and other investment income of $12.1 million. Excluding the impact of foreign currencyexchange rate changes, net investment income in 2010 would have increased by 1.5% compared to 2009.The increase in investment income from fixed maturities is due in part to the investment of net operatingcash inflows in recent periods. Net investment income in 2009 increased compared to 2008 due to anincrease in investment results from other invested assets of $40 million, principally related to alternativeinvestments. Excluding the changes in foreign currency exchange rates, net investment income in 2009would have increased 8.1% compared to 2008. Net investment income from other invested assets candisplay greater volatility than other classes of investments. (See Note 4(d) of Notes to Consolidated
54

TRANSATLANTIC HOLDINGS, INC. AND SUBSIDIARIESMANAGEMENT’S DISCUSSION AND ANALYSIS OF FINANCIAL CONDITION
AND RESULTS OF OPERATIONS (Continued)
Financial Statements for a breakdown of the components of net investment income and the cash flowdiscussion under Financial Condition and Liquidity.)
For 2010, 2009 and 2008, the pre-tax effective yields on investments were 3.7%, 4.1% and 3.8%,respectively. The pre-tax effective yield on investments represents net investment income divided by theaverage balance sheet carrying value of investments and interest-bearing cash. The decrease in the pre-taxeffective yield on investments for 2010 compared to 2009 is due primarily to a lower pre-tax effective yieldon the fixed maturity portfolio. The increase in the pre-tax effective yield on investments for 2009compared to 2008 is due largely to increased investment income from other invested assets and the impactof securities lending invested collateral on the yield in 2008, partially offset by the decrease in pre-taxeffective yield on fixed maturities for 2009 compared to 2008. Investment returns from securities lendinginvested collateral served to negatively impact the yield in 2008 by 0.3%, as the net return from theinvested collateral is very small in relation to the balance sheet carrying amount because investmentincome earned from invested collateral is reduced by interest payable to the collateral provider. (SeeInvestment Results in Item 1. Business.)
Realized net capital gains (losses) totaled $30.1 million, ($70.6) million and ($435.5) million in 2010,2009 and 2008, respectively. Realized net capital gains (losses) generally result from (a) investmentdispositions, which reflect TRH’s investment and tax planning strategies to optimize after-tax income;(b) OTTI of investments; and (c) foreign currency transaction gains (losses). See Note 4(e) for abreakdown of realized net capital gains (losses).
Realized net capital losses in 2010 included ($8.0) million of OTTI write-downs charged to earnings,largely related to issuer-specific credit losses on fixed maturities. OTTI decreased in 2010 compared to2009 due in large part to improvements in the financial and credit markets. Realized net capital losses in2009 included ($83.1) million of OTTI write-downs charged to earnings, due in large part to the depressedfair values of certain securities and issuer specific credit events in 2009. OTTI decreased in 2009 comparedto 2008 as financial and credit markets stabilized and partially recovered from the turmoil at the end of2008. Realized net capital losses in 2008 included ($99.9) million of net losses on sales and redemptions ofsecurities and ($317.8) million of OTTI write-downs. The significant realized net capital losses from salesand redemptions of securities and OTTI write-downs in 2008 generally resulted from declines in the fairvalues of securities and issuer-specific credit events due to the downturn in the U.S. economy, turmoil inthe financial markets and financial market illiquidity in 2008.
Upon the ultimate disposition of securities for which write-downs have been recorded, a portion ofthe write-downs may be recoverable depending on market conditions at the time of disposition. (SeeNote 4(g) for the criteria used in the determination of such write-downs.)
55

TRANSATLANTIC HOLDINGS, INC. AND SUBSIDIARIESMANAGEMENT’S DISCUSSION AND ANALYSIS OF FINANCIAL CONDITION
AND RESULTS OF OPERATIONS (Continued)
OTTI write-downs by balance sheet category at the time of impairment and type of impairmentrecorded for the years indicated are presented in the table below:
Lack of Issuer-Severity Intent to Specificand/or Hold to Credit
Duration Recovery Events Total
(in millions)
Year Ended December 31, 2010:Fixed maturities . . . . . . . . . . . . . . . . . . . . . . . . . . . . . . . . . . . . $ — $ — $ (6.3) $ (6.3)Equities . . . . . . . . . . . . . . . . . . . . . . . . . . . . . . . . . . . . . . . . . . (1.1) — — (1.1)Other invested assets . . . . . . . . . . . . . . . . . . . . . . . . . . . . . . . . — — (0.6) (0.6)
Total included in the statement of operations . . . . . . . . . . . . . . . $ (1.1) $ — $ (6.9) (8.0)
Fixed maturities—included in the statement of comprehensiveincome . . . . . . . . . . . . . . . . . . . . . . . . . . . . . . . . . . . . . . . . . (6.7)
Total . . . . . . . . . . . . . . . . . . . . . . . . . . . . . . . . . . . . . . . . . . $ (14.7)
Year Ended December 31, 2009:Fixed maturities . . . . . . . . . . . . . . . . . . . . . . . . . . . . . . . . . . . . $ (14.7) $ (6.0) $(19.1) $ (39.8)Equities . . . . . . . . . . . . . . . . . . . . . . . . . . . . . . . . . . . . . . . . . . (35.4) (4.4) (3.5) (43.3)
Total included in the statement of operations . . . . . . . . . . . . . . . $ (50.1) $(10.4) $(22.6) (83.1)
Fixed maturities—included in the statement of comprehensiveincome . . . . . . . . . . . . . . . . . . . . . . . . . . . . . . . . . . . . . . . . . (13.4)
Total . . . . . . . . . . . . . . . . . . . . . . . . . . . . . . . . . . . . . . . . . . $ (96.5)
Year Ended December 31, 2008:Fixed maturities . . . . . . . . . . . . . . . . . . . . . . . . . . . . . . . . . . . . $(115.4) $ (2.4) $ (7.3) $(125.1)Equities . . . . . . . . . . . . . . . . . . . . . . . . . . . . . . . . . . . . . . . . . . (69.2) (3.3) (22.5) (95.0)Securities lending invested collateral . . . . . . . . . . . . . . . . . . . . . (79.7) (3.9) (14.1) (97.7)
Total included in the statement of operations . . . . . . . . . . . . . $(264.3) $ (9.6) $(43.9) $(317.8)
In 2010, 2009 and 2008, TRH repurchased portions of its 5.75% senior notes due in 2015 (the ‘‘2015Notes’’ and together with the 2039 Notes, the ‘‘Senior Notes’’). There were no repurchases of the 2039Notes in 2010 and 2009. (See Note 7 of Notes to Consolidated Financial Statements (‘‘Note 7’’) for theimpact of the repurchases.)
The property and casualty insurance and reinsurance industries use the combined ratio as a measureof underwriting profitability. The combined ratio reflects only underwriting results and does not includeincome from investments. Generally, a combined ratio under 100% indicates an underwriting profit and acombined ratio exceeding 100% indicates an underwriting loss. Underwriting profitability is subject tosignificant fluctuations due to competition, natural and man-made catastrophic events, economic andsocial conditions, foreign currency exchange rate fluctuations, interest rates and other factors. TRH’scombined ratio and its components, for all periods in this Form 10-K, are presented in accordance with themethodology commonly used by insurance industry analysts and TRH’s peers. The combined ratiorepresents the sum of the loss ratio and the underwriting expense ratio. The loss ratio represents net lossesand LAE incurred expressed as a percentage of net premiums earned. The underwriting expense ratiorepresents the sum of the commission ratio and the other underwriting expense ratio. The commission
56

TRANSATLANTIC HOLDINGS, INC. AND SUBSIDIARIESMANAGEMENT’S DISCUSSION AND ANALYSIS OF FINANCIAL CONDITION
AND RESULTS OF OPERATIONS (Continued)
ratio represents the sum of net commissions and the decrease (increase) in deferred policy acquisitioncosts expressed as a percentage of net premiums earned. The other underwriting expense ratio representsother underwriting expenses expressed as a percentage of net premiums earned.
The following table presents loss ratios, underwriting expense ratios and combined ratios forconsolidated TRH and each of TRH’s reporting segments, for the years indicated:
Years EndedDecember 31,
2010 2009 2008
Consolidated:Loss ratio . . . . . . . . . . . . . . . . . . . . . . . . . . . . . . . . . . . . . . . . . . . . . . . . . . 69.5% 66.3% 71.5%
Commission ratio . . . . . . . . . . . . . . . . . . . . . . . . . . . . . . . . . . . . . . . . . . . 24.1 23.3 23.9Other underwriting expense ratio . . . . . . . . . . . . . . . . . . . . . . . . . . . . . . . . 4.6 3.9 3.2
Underwriting expense ratio . . . . . . . . . . . . . . . . . . . . . . . . . . . . . . . . . . . . . . 28.7 27.2 27.1
Combined ratio . . . . . . . . . . . . . . . . . . . . . . . . . . . . . . . . . . . . . . . . . . . . . . 98.2% 93.5% 98.6%
Domestic:Loss ratio . . . . . . . . . . . . . . . . . . . . . . . . . . . . . . . . . . . . . . . . . . . . . . . . . . 67.1% 66.0% 78.7%
Commission ratio . . . . . . . . . . . . . . . . . . . . . . . . . . . . . . . . . . . . . . . . . . . 23.7 23.2 23.1Other underwriting expense ratio . . . . . . . . . . . . . . . . . . . . . . . . . . . . . . . . 5.0 4.2 3.2
Underwriting expense ratio . . . . . . . . . . . . . . . . . . . . . . . . . . . . . . . . . . . . . . 28.7 27.4 26.3
Combined ratio . . . . . . . . . . . . . . . . . . . . . . . . . . . . . . . . . . . . . . . . . . . . . . 95.8% 93.4% 105.0%
International—Europe:Loss ratio . . . . . . . . . . . . . . . . . . . . . . . . . . . . . . . . . . . . . . . . . . . . . . . . . . 75.4% 73.9% 68.9%
Commission ratio . . . . . . . . . . . . . . . . . . . . . . . . . . . . . . . . . . . . . . . . . . . 21.5 21.9 23.2Other underwriting expense ratio . . . . . . . . . . . . . . . . . . . . . . . . . . . . . . . . 4.0 3.4 3.0
Underwriting expense ratio . . . . . . . . . . . . . . . . . . . . . . . . . . . . . . . . . . . . . . 25.5 25.3 26.2
Combined ratio . . . . . . . . . . . . . . . . . . . . . . . . . . . . . . . . . . . . . . . . . . . . . . 100.9% 99.2% 95.1%
International—Other:Loss ratio . . . . . . . . . . . . . . . . . . . . . . . . . . . . . . . . . . . . . . . . . . . . . . . . . . 63.2% 46.7% 49.8%
Commission ratio . . . . . . . . . . . . . . . . . . . . . . . . . . . . . . . . . . . . . . . . . . . 32.6 27.6 29.6Other underwriting expense ratio . . . . . . . . . . . . . . . . . . . . . . . . . . . . . . . . 4.5 4.1 4.0
Underwriting expense ratio . . . . . . . . . . . . . . . . . . . . . . . . . . . . . . . . . . . . . . 37.1 31.7 33.6
Combined ratio . . . . . . . . . . . . . . . . . . . . . . . . . . . . . . . . . . . . . . . . . . . . . . 100.3% 78.4% 83.4%
The higher loss ratio for consolidated TRH in 2010 compared to 2009 is due principally to increasedcatastrophe costs, partially offset by increased favorable net loss reserve development. The lower loss ratiofor consolidated TRH in 2009 compared to 2008 is due principally to lower catastrophe costs and increasedfavorable net loss reserve development. In the aggregate, catastrophe costs and net loss reservedevelopment added (decreased) 3.9%, (0.9)% and 4.4% to (from) the consolidated TRH combined ratioin 2010, 2009 and 2008, respectively.
57

TRANSATLANTIC HOLDINGS, INC. AND SUBSIDIARIESMANAGEMENT’S DISCUSSION AND ANALYSIS OF FINANCIAL CONDITION
AND RESULTS OF OPERATIONS (Continued)
2010 includes pre-tax net catastrophe costs of $202.4 million, principally relating to the earthquake inChile, the earthquake in New Zealand, storms and flooding in Australia and the Deepwater Horizonexplosion. Net catastrophe costs in the aggregate added (decreased) 5.2%, (0.1)%, 8.2% and 17.4% to the2010 combined ratios for consolidated, Domestic, International-Europe and International-Other,respectively. (See Note 10 for the amounts of net catastrophe costs by segment and the amounts ofconsolidated gross and ceded catastrophe losses incurred and reinstatement premiums. See discussion inCatastrophe Exposure of the magnitude of TRH’s catastrophe exposures.)
While TRH believes that it has taken appropriate steps to manage its exposure to possible futurecatastrophe losses, the occurrence of one or more natural or man-made catastrophic events ofunanticipated frequency or severity, such as a terrorist attack, earthquake or hurricane, that causes insuredlosses could have a material adverse effect on TRH’s results of operations, liquidity or financial condition.Current techniques and models may not accurately predict the probability of catastrophic events in thefuture and the extent of the resulting losses. Moreover, one or more catastrophe losses could weakenTRH’s retrocessionnaires and result in an inability of TRH to collect reinsurance recoverables.
In addition, in 2010, TRH decreased its estimates of the ultimate amounts of net losses occurring in2009 and prior years by $57.0 million. This net favorable development was comprised of net favorabledevelopment of $216.9 million for losses occurring in 2002 to 2009, partially offset by net adversedevelopment of $159.9 million relating to losses occurring in 2001 and prior. The detail of the $57.0 millionnet favorable development by line of business relating to all prior years is presented in the table below:
Amount ofYear-end 2009 Net Reestimation
Net Loss Reserve at Reestimated Liability (Deficiency)Line of Business December 31, 2009 at Year-end 2010 Redundancy(1)
(in thousands)
Other liability . . . . . . . . . . . . . . . . . . . . . . . . . . . $3,586,268 $3,702,923 $(116,655)Fire . . . . . . . . . . . . . . . . . . . . . . . . . . . . . . . . . . 509,749 439,679 70,070Surety and credit . . . . . . . . . . . . . . . . . . . . . . . . 275,241 220,481 54,760Ocean marine . . . . . . . . . . . . . . . . . . . . . . . . . . . 428,058 382,260 45,798Fidelity . . . . . . . . . . . . . . . . . . . . . . . . . . . . . . . 316,555 348,612 (32,057)Other, net . . . . . . . . . . . . . . . . . . . . . . . . . . . . . 2,755,954 2,720,911 35,043
Total . . . . . . . . . . . . . . . . . . . . . . . . . . . . . . . . $7,871,825 $7,814,866 $ 56,959
(1) Amount of reestimation represents the (increase) decrease in net losses and LAE incurred in 2010 relating to losses occurringin 2009 and prior years.
Net favorable development was recorded for losses occurring in the fire, surety and credit and oceanmarine lines, arising principally from losses occurring in 2005 to 2009. Significant net adverse developmentwas recorded in 2010 in the other liability line, arising principally from losses occurring in 2002 and prior,partially offset by favorable development from losses occurring between 2003 and 2006. The other liabilityline includes certain specialty casualty classes, such as D&O and E&O, and general casualty classes. Inaddition, net adverse development was recorded in 2010 for losses occurring in the fidelity line, arisingprincipally from losses occurring in 2006 to 2009. (See Note 10 for amounts included in net favorabledevelopment that relate to catastrophe losses.)
The favorable development in 2005 through 2009 results generally from favorable loss trends. The netadverse development arising from losses occurring in 2001 and prior generally relates to various excesscasualty lines such as general liability and excess umbrella liability which were impacted by late reportedexcess claims.
58

TRANSATLANTIC HOLDINGS, INC. AND SUBSIDIARIESMANAGEMENT’S DISCUSSION AND ANALYSIS OF FINANCIAL CONDITION
AND RESULTS OF OPERATIONS (Continued)
TRH writes a significant amount of non-proportional assumed casualty reinsurance as well asproportional assumed reinsurance of excess liability business for such volatile classes as medicalmalpractice, D&O, E&O and general casualty. At the primary level, there are significant risk factors whichcontribute to the variability and unpredictability of the loss trend factor for this business such as juryawards, social inflation, medical inflation, tort reforms and court interpretations of coverage. In addition,as a reinsurer, TRH is also highly dependent upon the claims reserving and reporting practices of itscedants, which vary greatly by size, specialization and country of origin and whose practices can be subjectto change without notice.
Based on information presently available, TRH’s current loss reserves represent management’s bestestimate of ultimate losses, but there can be no assurance that TRH’s loss reserves will not developadversely due to, for example, the inherent volatility in loss trend factors and variability of reportingpractices for those classes, among other factors, and materially exceed the carried loss reserves as ofDecember 31, 2010 and thus, have a material adverse effect on future net income, financial condition andcash flows.
For 2010 compared to 2009, the change in gross and ceded losses and LAE incurred includes thechanges in gross and ceded catastrophe losses as discussed in Note 10.
While there were no significant net catastrophe costs for events occurring during 2009, 2009 includesestimated net catastrophe costs incurred of ($5.6) million relating to events occurring in prior years. Netcatastrophe costs in the aggregate (decreased) added (0.1)%, 0.0%, (0.4)% and (0.1)% to the 2009combined ratios for consolidated, Domestic, International-Europe and International-Other, respectively.
In addition, in 2009, TRH decreased its estimates of the ultimate amounts of net losses occurring in2008 and prior years by $38.9 million. This net favorable development was comprised of net favorabledevelopment of $219.1 million for losses occurring in 2002 to 2008, partially offset by net adversedevelopment of $180.2 million relating to losses occurring in 2001 and prior. The detail of the $38.9 millionnet favorable development by line of business relating to all prior years is presented in the table below:
Year-end 2008 Amount ofNet Reestimated Reestimation
Net Loss Reserve at Liability at (Deficiency)Line of Business December 31, 2008 Year-end 2009 Redundancy(1)
(in thousands)
Other liability . . . . . . . . . . . . . . . . . . . . . . . . . . . . . $3,220,712 $3,341,142 $(120,430)Fire . . . . . . . . . . . . . . . . . . . . . . . . . . . . . . . . . . . . . 546,050 441,940 104,110Allied lines . . . . . . . . . . . . . . . . . . . . . . . . . . . . . . . 157,194 114,785 42,409Fidelity . . . . . . . . . . . . . . . . . . . . . . . . . . . . . . . . . . 255,808 285,829 (30,021)Surety and credit . . . . . . . . . . . . . . . . . . . . . . . . . . . 242,205 216,909 25,296Other, net . . . . . . . . . . . . . . . . . . . . . . . . . . . . . . . . 2,927,109 2,909,525 17,584
Total . . . . . . . . . . . . . . . . . . . . . . . . . . . . . . . . . . $7,349,078 $7,310,130 $ 38,948
(1) Amount of reestimation represents the (increase) decrease in net losses and LAE incurred in 2009 relating to losses occurringin 2008 and prior years.
Significant net favorable development was recorded for losses occurring in the fire and allied lines,arising principally from losses occurring in 2007 to 2008, and the surety and credit line, arising principallyfrom losses occurring in 2004 to 2008. The line of business with the most significant net adversedevelopment recorded in 2009 was the other liability line, arising principally from losses occurring in 2001
59

TRANSATLANTIC HOLDINGS, INC. AND SUBSIDIARIESMANAGEMENT’S DISCUSSION AND ANALYSIS OF FINANCIAL CONDITION
AND RESULTS OF OPERATIONS (Continued)
and prior, partially offset by favorable development from losses occurring between 2004 and 2006. Theother liability line includes certain specialty casualty classes, such as D&O and E&O, and general casualtyclasses. In addition, significant net adverse development was recorded in 2009 for losses occurring in thefidelity line, arising principally from losses occurring in 2007 to 2008, related to the global credit crisis. (SeeNote 10 for amounts included in net favorable development that relate to catastrophe losses.)
The favorable development in 2004 through 2008 results generally from favorable loss trends. The netadverse development arising from losses occurring in 2001 and prior generally relates to various excesscasualty lines such as general liability and excess umbrella liability which were impacted by late reportedhigh layer excess claims. Ceding companies and their reinsurers continue to experience increased loss costsrelative to expectations as loss emergence patterns continue to lengthen as regards the soft market years of1997 through 2001.
For 2009 compared to 2008, the changes in gross and ceded losses and LAE incurred each include theeffect of a $22 million decrease in losses and LAE incurred relating to business assumed from an AIGsubsidiary which, by prearrangement with TRH, was then ceded in an equal amount to other AIGsubsidiaries. (See Note 16.) In addition, the change in gross and ceded losses and LAE incurred includesthe changes in gross and ceded catastrophe losses as discussed in Note 10.
2008 includes net catastrophe costs of $169.7 million, principally relating to Hurricane Ike. Netcatastrophe costs in the aggregate added 4.2%, 7.2%, 1.4% and 0.0% to the 2008 combined ratios forconsolidated, Domestic, International-Europe and International-Other, respectively.
In addition, in 2008, TRH decreased its estimates of the ultimate amounts of net losses occurring in2007 and prior years by $0.5 million. This net favorable development was comprised of net favorabledevelopment of $209.7 million for losses occurring in 2003 to 2007, offset by net adverse development of$209.2 million, relating to losses occurring in 2002 and prior. The detail of the $0.5 million net favorabledevelopment by line of business relating to all prior years is presented in the table below:
Year-end 2007 Amount ofNet Reestimated Reestimation
Net Loss Reserve at Liability at (Deficiency)Line of Business December 31, 2007 Year-end 2008 Redundancy(1)
(in thousands)
Other liability . . . . . . . . . . . . . . . . . . . . . . . . . . . $2,966,824 $3,046,459 $(79,635)Allied lines . . . . . . . . . . . . . . . . . . . . . . . . . . . . . 128,184 84,543 43,641Medical malpractice . . . . . . . . . . . . . . . . . . . . . . 1,048,066 1,083,515 (35,449)Homeowners multiple peril . . . . . . . . . . . . . . . . . 26,951 9,963 16,988Auto liability . . . . . . . . . . . . . . . . . . . . . . . . . . . 550,869 537,664 13,205Fire . . . . . . . . . . . . . . . . . . . . . . . . . . . . . . . . . . 492,853 481,281 11,572Other, net . . . . . . . . . . . . . . . . . . . . . . . . . . . . . 1,685,969 1,655,807 30,162
Total . . . . . . . . . . . . . . . . . . . . . . . . . . . . . . . . $6,899,716 $6,899,232 $ 484
(1) Amount of reestimation represents the (increase) decrease in net losses and LAE incurred in 2008 relating to losses occurringin 2007 and prior years.
Significant net favorable development was recorded for losses occurring in the allied lines and firelines, each arising principally from losses occurring in 2007, and in the homeowners multiple peril and autoliability lines, each arising principally from losses occurring in 2005 to 2007. The line of business with themost significant net adverse development recorded in 2008 was the other liability line, arising principally
60

TRANSATLANTIC HOLDINGS, INC. AND SUBSIDIARIESMANAGEMENT’S DISCUSSION AND ANALYSIS OF FINANCIAL CONDITION
AND RESULTS OF OPERATIONS (Continued)
from losses occurring between 1997 and 2002, partially offset by favorable development from lossesoccurring in 2004 to 2006. The other liability line includes certain specialty casualty classes, such as D&Oand E&O, and general casualty classes. In addition, significant net adverse development was recorded in2008 for losses occurring in the medical malpractice line, arising principally from losses occurring in 1995to 2001 and in 2006. (See Note 10 for amounts included in net adverse development that relate tocatastrophe losses.)
The favorable development in 2004 through 2007 results generally from favorable loss trends. The netadverse development arising from losses occurring in years 1998 through 2001, which represent the greatmajority of the 2002 and prior development, generally relates to the fact that for many classes within theseyears, ceding companies continue to experience increased loss costs relative to expectations, coupled withan unexpected lengthening of the loss emergence patterns. Generally, loss activity was greater thanexpected from losses occurring in the D&O and E&O classes, although to a lesser extent than in previouscalendar year periods. Also, classes such as medical malpractice and excess umbrella were impacted by latereported high layer excess claims to a greater extent than expected. Contributing to this increase, is the factthat many policies during this period covered underlying contracts that extended over multiple years, whichcontributed to recent reported loss activity exceeding previous expectations. This has led to an increase inboth the frequency and severity of claims entering the reinsured excess-of-loss coverage layers at laterpoints in time than had previously been experienced.
The underwriting expense ratio for consolidated TRH in 2010 increased 1.5% compared to 2009 dueto increases of 0.8% in the commission ratio and of 0.7% in the other underwriting expense ratio. Theincrease in the commission ratio occurred in International-Other and Domestic. The increase in the otherunderwriting expense ratio in 2010 compared to 2009 is related largely to increased employeecompensation and benefits expenses, including stock compensation. The underwriting expense ratio forconsolidated TRH in 2009 remained level with 2008 as an increase of 0.7% in the other underwritingexpense ratio was offset by a decrease of 0.6% in the commission ratio. The increase in the otherunderwriting expense ratio in 2009 compared to 2008 is related largely to additional compensation costsassociated with improved results in 2009 compared to 2008 and expenses incurred related to an employeeretention plan (the ‘‘Retention Plan’’) covering a significant number of its employees, including itssenior-most management. The decrease in the commission ratio occurred in the International-Europe andInternational-Other segments.
On October 3, 2008, TRH adopted the Retention Plan covering a significant number of its employees,including its senior-most management. Salary expense incurred related to the Retention Plan totaled nil in2010, $20 million in 2009 and $8 million in 2008. (See Note 19 of Notes to Consolidated FinancialStatements.)
Deferred policy acquisition costs vary as the components of net unearned premiums change and thedeferral rate changes. Policy acquisition costs, consisting primarily of commissions incurred, are charged toearnings over the period in which the related premiums are earned.
In November 2009, the Company issued $350 million principal amount of the 2039 Notes, all of whichremains outstanding as of December 31, 2010. $692 million and $695 million principal amount of the 2015
61

TRANSATLANTIC HOLDINGS, INC. AND SUBSIDIARIESMANAGEMENT’S DISCUSSION AND ANALYSIS OF FINANCIAL CONDITION
AND RESULTS OF OPERATIONS (Continued)
Notes were outstanding at December 31, 2010 and 2009, respectively. Interest expense incurred andinterest paid in connection with the Senior Notes is shown below:
Years Ended December 31,
2010 2009 2008
(in thousands)
Interest expense incurred . . . . . . . . . . . . . . . . . . . . . . . . . . . . . . . . . . . $68,272 $43,454 $43,359Interest paid . . . . . . . . . . . . . . . . . . . . . . . . . . . . . . . . . . . . . . . . . . . . 68,439 40,394 43,113
The increased interest expense incurred and paid in 2010 compared to 2009 is due principally to the2039 Notes.
General corporate expenses, certain stock-based compensation costs and expenses relating toProfessional Risk Management Services, Inc. (‘‘PRMS’’) are the primary components of ‘‘other expenses,net’’ on the Consolidated Statement of Operations. PRMS, a wholly owned subsidiary of the Company, isan insurance program manager specializing in professional liability insurance services.
Income before income taxes was $472.8 million in 2010, $596.0 million in 2009 and $3.2 million in2008. The decrease in income before income taxes in 2010 compared to 2009 principally resulted from adecrease in underwriting profit, partially offset by realized net capital gains in 2010 compared to realizednet capital losses in 2009. The decrease in underwriting profit is due principally to increased catastrophecosts, partially offset by increased favorable net loss reserve development. The net impact of increasedcatastrophe costs and increased favorable net loss reserve development was to decrease pre-taxunderwriting profit in 2010 by $185.5 million compared to 2009.
The increase in income before income taxes in 2009 compared to 2008 resulted from a decrease inrealized net capital losses and an increase in underwriting profit. The increase in underwriting profit is dueto a decrease in catastrophe costs and an increase in favorable net loss reserve development in 2009. Thenet impact of decreased catastrophe costs and increased favorable net loss reserve development was toincrease pre-tax underwriting profit in 2009 by $216.2 million compared to 2008.
Federal and foreign income tax expense (benefit) of $70.6 million, $118.4 million and ($99.0) millionwere recorded in 2010, 2009 and 2008, respectively. The 2008 tax benefit, which exceeds income beforeincome taxes in 2008, resulted from the tax benefit generated by the significant amount of realized netcapital losses occurring during the year, including the tax benefit on $100.3 million of tax capital losscarrybacks to prior years, in addition to the customary tax benefits associated with tax-exempt interest andthe dividends received deduction.
Income tax expense in 2010 includes $5.5 million of deferred tax benefits from minimum tax creditcarryforwards. Income tax expense in 2009 includes $56.7 million of deferred tax benefits from minimumtax credit carryforwards. In 2008, TRH reversed $15.0 million of previously recorded deferred tax benefitsfrom minimum tax credit carryforwards.
The effective tax rates, which represent the sum of current and deferred income taxes (benefits)divided by income before income taxes, were 14.9% in 2010, 19.9% in 2009 and (3,073.0%) in 2008. Thedecrease in effective tax rates in 2010 compared to 2009 was due in part to tax exempt income representinga larger percentage of pretax income in 2010 compared to 2009, largely as a result of significant netcatastrophe costs in 2010, and a tax benefit of $8.4 million (net of interest on taxes) related to theresolution of certain prior year tax matters. The difference in effective tax rates in 2009 compared to 2008was due to tax exempt income representing a smaller percentage of pretax income in 2009 compared to
62

TRANSATLANTIC HOLDINGS, INC. AND SUBSIDIARIESMANAGEMENT’S DISCUSSION AND ANALYSIS OF FINANCIAL CONDITION
AND RESULTS OF OPERATIONS (Continued)
2008. Net catastrophe costs and realized net capital losses significantly reduced pretax income in 2008.(See Note 5 of Notes to Consolidated Financial Statements.)
TRH recognized income tax (benefits) expenses of ($70.9) million, $2.0 million and ($59.4) millionrelating to catastrophe costs occurring in 2010, 2009 and 2008, respectively.
Net income and net income per common share on a diluted basis are summarized below for the yearsindicated:
Years Ended December 31,
2010 2009 2008
Per Common Per Common Per CommonShare Share Share
Amount (Diluted) Amount (Diluted) Amount (Diluted)
(in millions, except per share amounts)
Net income . . . . . . . . . . . . . . . . . . . $402.2 $6.19 $477.7 $7.15 $102.3 $1.53
Non-GAAP Measures
The performance of TRH is commonly assessed by analysts and others based on performancemeasures which are not defined under GAAP. Those measures include net operating income (‘‘NOI’’),NOI per Common Share (diluted) and operating return on equity (‘‘Operating ROE’’). NOI is defined asGAAP net income excluding realized net capital gains (losses) and the (loss) gain on early extinguishmentof debt, net of taxes. NOI Per Common Share (diluted) represents NOI divided by average common sharesoutstanding on a diluted basis. Operating ROE is defined as NOI divided by the average of beginning andending stockholders’ equity. In addition, GAAP return on equity (‘‘GAAP ROE’’) is defined as GAAP netincome divided by the average of beginning and ending stockholders’ equity. TRH uses these measures inanalyzing its performance as these measures focus on the core fundamentals of TRH’s operations. WhileTRH considers realized capital gains (losses) and the (loss) gain on early extinguishment of debt asintegral parts of its business and results, such items are not indicative of the core fundamentals of TRH’soperations. TRH believes these measures are of interest to the investment community because theyprovide additional meaningful methods of evaluating certain aspects of TRH’s operating performancefrom period to period on bases that are not otherwise apparent under GAAP. These non-GAAP measures,namely, NOI, NOI Per Common Share (diluted) and Operating ROE should not be viewed as substitutesfor GAAP net income, GAAP net income per common share on a diluted basis and GAAP ROE,respectively. Reconciliations of NOI, NOI Per Common Share (diluted) and Operating ROE to GAAP net
63

TRANSATLANTIC HOLDINGS, INC. AND SUBSIDIARIESMANAGEMENT’S DISCUSSION AND ANALYSIS OF FINANCIAL CONDITION
AND RESULTS OF OPERATIONS (Continued)
income, GAAP net income per common share on a diluted basis and GAAP ROE, respectively, the mostdirectly comparable GAAP measures, are included below:
Years Ended December 31,
2010 2009 2008
Per Per PerCommon Common Common
Share Share ShareAmount (Diluted) Amount (Diluted) Amount (Diluted)
(in millions, except per share amounts)
Net income . . . . . . . . . . . . . . . . . . . . . . . . . $402.2 $ 6.19 $477.7 $ 7.15 $102.3 $ 1.53Realized net capital (gains) losses, net of
tax(1) . . . . . . . . . . . . . . . . . . . . . . . . . . . . (19.6) (0.30) 45.9 0.69 283.1 4.25Loss (gain) on early extinguishment of debt,
net of tax(1) . . . . . . . . . . . . . . . . . . . . . . . 0.1 0.00 (6.4) (0.10) (6.7) (0.10)
Net operating income . . . . . . . . . . . . . . . . . $382.7 $ 5.89 $517.2 $ 7.74 $378.7 $ 5.68
Years Ended December 31,
2010 2009 2008
GAAP return on equity . . . . . . . . . . . . . . . . . . . . . . . . . . . . . . . . . . . . 9.7% 13.2% 3.1%Realized net capital (gains) losses, net of tax(1) . . . . . . . . . . . . . . . . . . . (0.5) 1.3 8.7Loss (gain) on early extinguishment of debt, net of tax(1) . . . . . . . . . . . 0.0 (0.2) (0.2)
Operating return on equity . . . . . . . . . . . . . . . . . . . . . . . . . . . . . . . . . 9.2% 14.3% 11.6%
(1) Assumes a 35% tax rate.
The decreases in NOI, NOI per Common Share (diluted) and Operating ROE in 2010 compared to2009 is due largely to an increase in catastrophe costs in 2010. The increase in NOI, NOI per CommonShare (diluted) and Operating ROE in 2009 compared to 2008 is due largely to a decrease in catastrophecosts in 2009.
Segment Results
(a) Domestic:
2010 compared to 2009—Revenues increased slightly in 2010 due principally to realized net capitalgains in 2010 compared to realized net capital losses in 2009, largely offset by a decrease in net premiumsearned. The increase in realized net capital gains (losses) is due in part to a reduction in OTTI in 2010.The decrease in net premiums earned occurred principally in the medical malpractice, auto liability, A&Hand property lines, partially offset by an increase in the other liability line.
Income before income taxes increased due principally to realized net capital gains in 2010 comparedto realized net capital losses in 2009, partially offset by a decrease in underwriting profit and an increase ininterest expense on the Senior Notes. The decrease in underwriting profit reflects increases in the expenseratio and the loss ratio. The increase in interest expense is due to increased interest expense on the 2039Notes in 2010. Interest expense on the 2039 Notes was minimal in 2009.
Net catastrophe costs in 2010 and 2009 were insignificant.
Assets increased by $337 million in 2010 due principally to a $356 million increase in investments. Theincrease in investments is due largely to an increase of $753 million in fixed maturities available for sale,
64
TRANSATLANTIC HOLDINGS, INC. AND SUBSIDIARIESMANAGEMENT’S DISCUSSION AND ANALYSIS OF FINANCIAL CONDITION
AND RESULTS OF OPERATIONS (Continued)
partially offset by a decrease of $456 million in short-term investments. The increase in fixed maturitiesavailable for sale and the decrease in short-term investments are due in part to the reallocation of someshort-term investments to fixed maturities. The increase in fixed maturities is also due in part to theinvestment of net operating cash inflows. The decrease in short-term investments is also due in part to theuse of some proceeds from the sales or redemptions of short-term investments to repurchase shares of theCompany’s common stock pursuant to the Company’s share repurchase program in 2010.
2009 compared to 2008—Revenues increased in 2009 due principally to a decrease in realized netcapital losses, including OTTI write-downs, and, to lesser extents, increases in net investment income andnet premiums earned. The reduction in realized net capital losses resulted in part from a decrease in OTTIwrite-downs as financial and credit markets stabilized and partially recovered from the turmoil at the endof 2008. The increase in net investment income in 2009 is largely due to an increase in results from otherinvested assets, principally related to alternative investments. The increase in net premiums earned in 2009occurred primarily in the property and A&H lines offset in part by significant decreases in the medicalmalpractice and other liability lines. Income (loss) before income taxes for 2009 increased due primarily toa decrease in realized net capital losses and an increase in underwriting profit (loss). The increase inunderwriting profit (loss) is largely due to a decrease in net catastrophe costs.
Net catastrophe costs in 2009 were insignificant. 2008 includes net catastrophe costs of $147.4 millionprincipally relating to Hurricane Ike.
Assets increased by $943 million in 2009 due largely to an increase in investments of $1.35 billion,partially offset by decreases in the net deferred income tax asset and premium balances receivable, net.The increase in investments is due largely to increases of $852 million in fixed maturities available for saleand $487 million in short-term investments. The increase in investments generally reflects the investmentof net operating cash inflows, changes in the fair value of investments and the investment of the proceedsfrom the issuance of the 2039 Notes.
(b) International-Europe (London and Paris branches and TRZ):
2010 compared to 2009—Revenues decreased due to decreases in net premiums earned. Revenuesdecreased in the London and Paris branches, partially offset by an increase in TRZ. The decrease in netpremiums earned occurred principally in the property, ocean marine, boiler and machinery and creditlines, partially offset by significant increases in the A&H and other liability lines. Income before incometaxes decreased largely due to a decrease in underwriting profit (loss). The decrease in underwriting profit(loss) reflects an increase in catastrophe costs, partially offset by a lower combined ratio excludingcatastrophe costs.
2010 includes net catastrophe costs of $112.3 million, principally related to the earthquake in Chile,the earthquake in New Zealand, storms and flooding in Australia and the Deepwater Horizon explosion.Net catastrophe costs in 2009 were insignificant.
In addition, net premiums written decreased in 2010, due largely to changes in foreign currencyexchange rates between the U.S. dollar and the currencies in which premiums are written, which decreasednet premiums written by $34.2 million in 2010 as compared to 2009.
65
TRANSATLANTIC HOLDINGS, INC. AND SUBSIDIARIESMANAGEMENT’S DISCUSSION AND ANALYSIS OF FINANCIAL CONDITION
AND RESULTS OF OPERATIONS (Continued)
Assets increased by $181 million in 2010 due principally to a $145 million increase in investments. Theincrease in investments is due principally to a $443 million increase in fixed maturities available for sale,partially offset by a decrease of $293 million in short term-investments. The increase in fixed maturitiesavailable for sale and the decrease in short-term investments are due in part to the reallocation of someshort-term investments to fixed maturities. The increase in fixed maturities is also due in part to theinvestment of net operating cash inflows.
2009 compared to 2008—Revenues decreased due to decreases in net premiums written, net of thechange in unearned premiums, and, to a lesser extent, net investment income partially offset by a decreasein realized net capital losses. Changes in foreign currency exchange rates between the U.S. dollar and thecurrencies in which premiums are written in 2009 as compared to 2008 decreased net premiums written by$78.7 million. Revenues decreased in the London and Paris branches, partially offset by an increase inTRZ. Net premiums earned decreased principally in the property, auto liability and fidelity lines offset inpart by a significant increase in the A&H line. Net investment income decreased in both the London andParis branches and in TRZ and was due in part to changes in foreign currency exchange rates and loweryields on investments. Income before income taxes for 2009 decreased due primarily to decreases inunderwriting profit and net investment income partially offset by a decrease in realized net capital losses.The decrease in underwriting profit reflects a higher loss ratio, excluding net catastrophe costs, partiallyoffset by lower net catastrophe costs and a lower commission ratio.
Net catastrophe costs in 2009 were insignificant. 2008 includes net catastrophe costs of $22.1 millionprincipally relating to Hurricane Ike, offset in part by favorable development on catastrophe eventsoccurring in 2007 and 2005.
Assets increased by $408 million in 2009 due principally to a $526 million increase in investments. Theincrease in investments is due largely to increases of $296 million in fixed maturities available for sale and$223 million in short-term investments. The increase in investments generally reflects the investment of netoperating cash inflows and changes in the fair value of investments.
(c) International-Other (Miami (serving Latin America and the Caribbean), Toronto, Hong Kong andTokyo branches):
2010 compared to 2009—Revenues decreased in 2010 due largely to a decrease in net premiumsearned and an increase in realized net capital losses. Revenues decreased in the Miami and Hong Kongbranches, partially offset by increases in the Toronto and Tokyo branches. The decrease in net premiumsearned occurred principally in the auto liability line, partially offset by a significant increase in the propertyline. Income before income taxes decreased due principally to a decrease in underwriting profit. Thedecrease in underwriting profit reflects increased catastrophe costs and an increase in the commissionratio.
2010 includes net catastrophe costs of $91.5 million, principally related to the earthquake in Chile andhailstorms in Canada. Net catastrophe costs in 2009 were insignificant.
In addition, while net premiums written were level in 2010 compared to 2009, changes in foreigncurrency exchange rates between the U.S. dollar and the currencies in which premiums are writtenincreased net premiums written by $29.6 million in 2010 as compared to 2009.
Assets increased by $243 million in 2010 due principally to a $157 million increase in investments anda $51 million increase in reinsurance recoverable on paid and unpaid losses and LAE. The increase ininvestments is due principally to a $172 million increase in fixed maturities. The increase in reinsurance
66

TRANSATLANTIC HOLDINGS, INC. AND SUBSIDIARIESMANAGEMENT’S DISCUSSION AND ANALYSIS OF FINANCIAL CONDITION
AND RESULTS OF OPERATIONS (Continued)
recoverable on paid and unpaid losses and LAE is due in part to increases in reinsurance recoverablesrelating to catastrophe events occurring in 2010.
2009 compared to 2008—Revenues increased in 2009 due largely to an increase in net premiumswritten, net of the change in unearned premiums and a decrease in realized net capital losses. Changes inforeign currency exchange rates between the U.S. dollar and the currencies in which premiums are writtenlessened the increase in net premiums written by $19.8 million in 2009 compared to 2008. The increase innet premiums earned occurred principally in the surety line along with relatively smaller increases spreadacross several lines. Significant increases in revenues occurred in the Tokyo and Toronto branches. Incomebefore income taxes increased in 2009 due to an increase in underwriting profit and a decrease in realizednet capital losses. The increase in underwriting profit generally reflects a lower loss ratio and a lowercommission ratio.
Assets increased by $216 million in 2009 due principally to a $205 million increase in investments. Theincrease in investments is due to an increase of $294 million in fixed maturities available for sale, partiallyoffset by decreases of $57 million in short-term investments and $32 million in common stocks available forsale. The increase in investments generally reflects the investment of net operating cash inflows andchanges in the fair value of investments.
Financial Condition and Liquidity
As a holding company, the Company’s assets consist primarily of the stock of its subsidiaries. TheCompany’s liabilities consist primarily of the Senior Notes and related interest payable. The Company’scash inflows depend on the availability of dividends or other statutorily permissible payments from TRCand its wholly-owned operating subsidiaries, TRZ and Putnam. (See Note 15 of Notes to ConsolidatedFinancial Statements for a discussion of restrictions on dividend payment and Schedule II—CondensedFinancial Information of Registrant As of December 31, 2010 and 2009 and For the Years EndedDecember 31, 2010, 2009 and 2008 for the condensed financial statements of the Company.) In 2009, cashinflows also included the proceeds from the issuance of the 2039 Notes. TRH considers TRC’s ability topay dividends to the Company to be adequate for the Company’s liquidity needs through the end of 2011and thereafter for a period the length of which is difficult to predict, but which TRH believes will be atleast one year. In 2010, 2009 and 2008, the Company received cash dividends, primarily from TRC, of$231.5 million, $121.5 million and $103.5 million, respectively. Based on statutory surplus of $4.30 billionas of December 31, 2010, TRC would be able to pay dividends of approximately $430 million withoutregulatory approval by December 31, 2011. The Company uses cash primarily to pay interest to the holdersof the Senior Notes, dividends to its common stockholders and, to a lesser extent, operating expenses. TheCompany also uses cash to repurchase portions of the Senior Notes or its common shares when TRHbelieves it is advantageous to do so.
Sources of funds for the operating subsidiaries consisted primarily of premiums, reinsurancerecoveries, investment income and proceeds from sales, redemptions and the maturing of investments.Funds are applied by the operating subsidiaries primarily to the purchase of investments and the paymentsof claims, commissions, ceded reinsurance premiums, operating expenses, income taxes and, in 2008 only,securities lending payables. Premiums are generally received substantially in advance of related claimspayments. Cash and cash equivalents are maintained for the payment of claims and expenses as theybecome due. TRH does not anticipate any material capital expenditures in the foreseeable future.
While the expected payout pattern of liabilities (see the contractual obligations table later in thissection) is considered in the investment management process, it is not the only factor considered as TRH
67

TRANSATLANTIC HOLDINGS, INC. AND SUBSIDIARIESMANAGEMENT’S DISCUSSION AND ANALYSIS OF FINANCIAL CONDITION
AND RESULTS OF OPERATIONS (Continued)
has historically funded its claims payments from current operating cash flows. As a result of such fundinghistory, as of December 31, 2010 TRH did not maintain a credit facility. TRH’s primary investment goal isto optimize after-tax income through a high quality diversified taxable fixed maturity and tax-exemptmunicipal fixed maturity portfolio, while maintaining an adequate level of liquidity. See discussion later inthis section of the potential liquidity strain that could arise as a result of significant acceleration of paidlosses beyond TRH’s ability to fund such cash needs.
At December 31, 2010, total investments were $12.97 billion compared to $12.32 billion atDecember 31, 2009, an increase of $657.3 million. The increase in investments reflects $685 million of netpurchases of investments and a $43 million increase in net unrealized appreciation of investmentsexcluding the impact of a correction. (See Note 2 of Notes to Consolidated Financial Statements(‘‘Note 2’’).) In addition, the impact on the carrying value of investments of foreign currency exchange ratechanges between the U.S. dollar and certain currencies in which investments are denominated decreasedtotal investments as of 2010 compared to 2009 by approximately $55 million.
The following table summarizes the investments of TRH (on the basis of carrying value) as ofDecember 31, 2010 and 2009:
December 31, 2010 December 31, 2009
Amount Percent Amount Percent
(dollars in thousands)
Fixed maturities:Held to maturity (at amortized cost):
States, municipalities and political subdivisions . . . . . $ 1,189,801 9.2% $ 1,214,238 9.8%
Available for sale (at fair value):U.S. Government and government agencies . . . . . . . 890,225 6.8 528,808 4.3States, municipalities and political subdivisions . . . . . 4,841,639 37.3 5,668,828 46.0Foreign government . . . . . . . . . . . . . . . . . . . . . . . . . 801,308 6.2 553,541 4.5Corporate . . . . . . . . . . . . . . . . . . . . . . . . . . . . . . . . 3,695,352 28.5 2,317,041 18.8Asset-backed:
RMBS . . . . . . . . . . . . . . . . . . . . . . . . . . . . . . . . . 244,540 1.9 258,445 2.1CMBS . . . . . . . . . . . . . . . . . . . . . . . . . . . . . . . . . 249,991 1.9 93,191 0.8Other asset-backed . . . . . . . . . . . . . . . . . . . . . . . . 99,281 0.8 34,918 0.3
Total available for sale . . . . . . . . . . . . . . . . . . . 10,822,336 83.4 9,454,772 76.8
Total fixed maturities . . . . . . . . . . . . . . . . . . . 12,012,137 92.6 10,669,010 86.6
Equities available for sale . . . . . . . . . . . . . . . . . . . . . . . . 564,530 4.4 506,612 4.1Other invested assets . . . . . . . . . . . . . . . . . . . . . . . . . . . 275,977 2.1 256,437 2.1Short-term investments . . . . . . . . . . . . . . . . . . . . . . . . . . 120,095 0.9 883,336 7.2
Total investments . . . . . . . . . . . . . . . . . . . . . . $12,972,739 100.0% $12,315,395 100.0%
Short-term investments decreased significantly in 2010 compared to 2009. The decrease in short-terminvestments is due in part to a reallocation to fixed maturities as well as the use of some proceeds from thesales or redemptions of short-term investments to repurchase 4.3 million shares of the Company’s commonstock at an aggregate cost of $219.7 million pursuant to the Company’s share repurchase program in 2010.
TRH’s fixed maturities classified as held to maturity and available for sale are predominantlyinvestment grade, liquid securities. Approximately 56.4% and 45.3% of the non-asset-backed fixed
68

TRANSATLANTIC HOLDINGS, INC. AND SUBSIDIARIESMANAGEMENT’S DISCUSSION AND ANALYSIS OF FINANCIAL CONDITION
AND RESULTS OF OPERATIONS (Continued)
maturities will mature in less than 10 years as of December 31, 2010 and 2009, respectively. By their nature,asset-backed fixed maturities do not generally have single maturity dates. Activity within the fixedmaturities available for sale portfolio for the periods under discussion includes strategic portfoliorealignments to optimize after-tax income. TRH adjusts its mix of taxable and tax-exempt investments, asappropriate, generally as a result of strategic investment and tax planning considerations. With respect tothe fixed maturities which are classified as held to maturity and carried at amortized cost, TRH has thepositive intent and ability to hold each of these securities to maturity. The average duration of TRH’sentire fixed income portfolio was 3.6 years as of December 31, 2010 and 3.7 years as of December 31, 2009.
The decrease in the percentage of TRH’s investment portfolio in state, municipality and politicalsubdivision fixed maturities available for sale as of December 31, 2010 compared to December 31, 2009 isdue to multiple factors including: opportunistic sales of certain securities to manage exposures as well asthe investment of new cash inflows into taxable investments to manage the asset allocation of theinvestment portfolio.
The following table summarizes the ratings of fixed maturities held to maturity and available for sale(on the basis of carrying value):
Ratings as of December 31, 2010(1)
BelowBBB or
Not-AAA AA A BBB Rated(2) Total
(dollars in millions)
Held to maturity:States, municipalities and political subdivisions . . $ 348 $ 716 $ 126 $ — $ — $ 1,190
Available for sale:U.S. Government and government agencies . . 890 — — — — 890States, municipalities and political subdivisions . . 1,485 2,818 458 72 9 4,842Foreign government . . . . . . . . . . . . . . . . . . . . 480 303 18 — — 801Corporate . . . . . . . . . . . . . . . . . . . . . . . . . . . 443 971 1,933 342 6 3,695Asset-backed:
RMBS . . . . . . . . . . . . . . . . . . . . . . . . . . . . 164 19 16 — 46 245CMBS . . . . . . . . . . . . . . . . . . . . . . . . . . . . 144 48 45 13 — 250Other asset-backed . . . . . . . . . . . . . . . . . . . 93 — 6 — — 99
Total available for sale . . . . . . . . . . . . . . 3,699 4,159 2,476 427 61 10,822
Total fixed maturities . . . . . . . . . . . . . . $4,047 $4,875 $2,602 $ 427 $ 61 $12,012
Percent of total fixed maturities . . . . . . . . . . . . . 33.7% 40.6% 21.7% 3.5% 0.5% 100.0%
(1) Principally Standard & Poor’s ratings.(2) Consists of $4 million of BB rated securities, $32 million of CCC rated securities, $14 million of CC rated securities and
$11 million of not-rated securities.
69
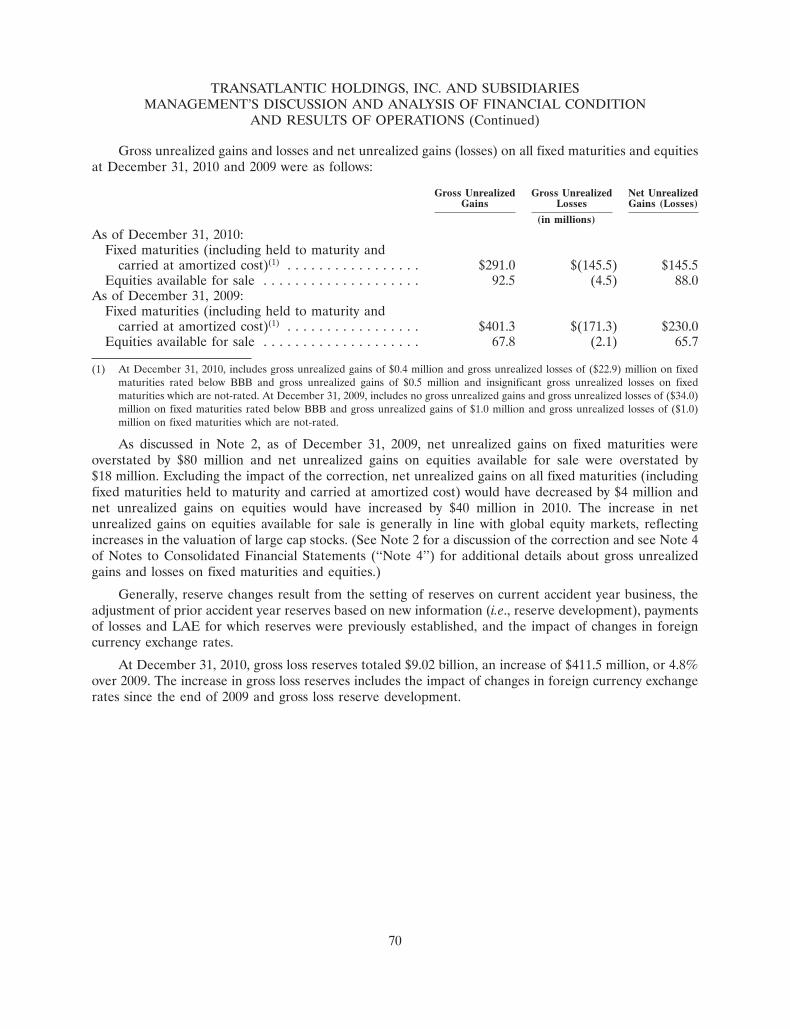
TRANSATLANTIC HOLDINGS, INC. AND SUBSIDIARIESMANAGEMENT’S DISCUSSION AND ANALYSIS OF FINANCIAL CONDITION
AND RESULTS OF OPERATIONS (Continued)
Gross unrealized gains and losses and net unrealized gains (losses) on all fixed maturities and equitiesat December 31, 2010 and 2009 were as follows:
Gross Unrealized Gross Unrealized Net UnrealizedGains Losses Gains (Losses)
(in millions)
As of December 31, 2010:Fixed maturities (including held to maturity and
carried at amortized cost)(1) . . . . . . . . . . . . . . . . . $291.0 $(145.5) $145.5Equities available for sale . . . . . . . . . . . . . . . . . . . . 92.5 (4.5) 88.0
As of December 31, 2009:Fixed maturities (including held to maturity and
carried at amortized cost)(1) . . . . . . . . . . . . . . . . . $401.3 $(171.3) $230.0Equities available for sale . . . . . . . . . . . . . . . . . . . . 67.8 (2.1) 65.7
(1) At December 31, 2010, includes gross unrealized gains of $0.4 million and gross unrealized losses of ($22.9) million on fixedmaturities rated below BBB and gross unrealized gains of $0.5 million and insignificant gross unrealized losses on fixedmaturities which are not-rated. At December 31, 2009, includes no gross unrealized gains and gross unrealized losses of ($34.0)million on fixed maturities rated below BBB and gross unrealized gains of $1.0 million and gross unrealized losses of ($1.0)million on fixed maturities which are not-rated.
As discussed in Note 2, as of December 31, 2009, net unrealized gains on fixed maturities wereoverstated by $80 million and net unrealized gains on equities available for sale were overstated by$18 million. Excluding the impact of the correction, net unrealized gains on all fixed maturities (includingfixed maturities held to maturity and carried at amortized cost) would have decreased by $4 million andnet unrealized gains on equities would have increased by $40 million in 2010. The increase in netunrealized gains on equities available for sale is generally in line with global equity markets, reflectingincreases in the valuation of large cap stocks. (See Note 2 for a discussion of the correction and see Note 4of Notes to Consolidated Financial Statements (‘‘Note 4’’) for additional details about gross unrealizedgains and losses on fixed maturities and equities.)
Generally, reserve changes result from the setting of reserves on current accident year business, theadjustment of prior accident year reserves based on new information (i.e., reserve development), paymentsof losses and LAE for which reserves were previously established, and the impact of changes in foreigncurrency exchange rates.
At December 31, 2010, gross loss reserves totaled $9.02 billion, an increase of $411.5 million, or 4.8%over 2009. The increase in gross loss reserves includes the impact of changes in foreign currency exchangerates since the end of 2009 and gross loss reserve development.
70

TRANSATLANTIC HOLDINGS, INC. AND SUBSIDIARIESMANAGEMENT’S DISCUSSION AND ANALYSIS OF FINANCIAL CONDITION
AND RESULTS OF OPERATIONS (Continued)
The components of gross loss reserves as of December 31, 2010 and 2009 by major class of business,split between the case portion and the IBNR portion is presented below:
2010
Gross Loss Reserves
Case IBNR Total
(in millions)
Casualty:Other liability(1) . . . . . . . . . . . . . . . . . . . . . . . . . . . . . . . . . . . . . . . $1,193.5 $2,955.8 $4,149.3Accident and health . . . . . . . . . . . . . . . . . . . . . . . . . . . . . . . . . . . . 242.9 134.5 377.4Medical malpractice . . . . . . . . . . . . . . . . . . . . . . . . . . . . . . . . . . . . 532.2 828.4 1,360.6Ocean marine and aviation . . . . . . . . . . . . . . . . . . . . . . . . . . . . . . . 401.6 172.1 573.7Auto liability . . . . . . . . . . . . . . . . . . . . . . . . . . . . . . . . . . . . . . . . . 256.6 214.8 471.4Surety and credit . . . . . . . . . . . . . . . . . . . . . . . . . . . . . . . . . . . . . . 112.0 130.4 242.4Other . . . . . . . . . . . . . . . . . . . . . . . . . . . . . . . . . . . . . . . . . . . . . . 464.8 398.4 863.2
Total casualty . . . . . . . . . . . . . . . . . . . . . . . . . . . . . . . . . . . . . . . 3,203.6 4,834.4 8,038.0
Property:Fire . . . . . . . . . . . . . . . . . . . . . . . . . . . . . . . . . . . . . . . . . . . . . . . . 460.1 180.0 640.1Allied lines . . . . . . . . . . . . . . . . . . . . . . . . . . . . . . . . . . . . . . . . . . 70.3 108.9 179.2Auto physical damage . . . . . . . . . . . . . . . . . . . . . . . . . . . . . . . . . . . 22.3 31.2 53.5Homeowners multiple peril . . . . . . . . . . . . . . . . . . . . . . . . . . . . . . . 12.6 7.6 20.2Other . . . . . . . . . . . . . . . . . . . . . . . . . . . . . . . . . . . . . . . . . . . . . . 77.2 12.4 89.6
Total property . . . . . . . . . . . . . . . . . . . . . . . . . . . . . . . . . . . . . . . 642.5 340.1 982.6
Total . . . . . . . . . . . . . . . . . . . . . . . . . . . . . . . . . . . . . . . . . . . . . $3,846.1 $5,174.5 $9,020.6
71

TRANSATLANTIC HOLDINGS, INC. AND SUBSIDIARIESMANAGEMENT’S DISCUSSION AND ANALYSIS OF FINANCIAL CONDITION
AND RESULTS OF OPERATIONS (Continued)
2009
Gross Loss Reserves
Case IBNR Total
(in millions)
Casualty:Other liability(1) . . . . . . . . . . . . . . . . . . . . . . . . . . . . . . . . . . . . . . . $1,192.7 $2,655.5 $3,848.2Accident and health . . . . . . . . . . . . . . . . . . . . . . . . . . . . . . . . . . . . 233.0 122.5 355.5Medical malpractice . . . . . . . . . . . . . . . . . . . . . . . . . . . . . . . . . . . . 478.2 785.0 1,263.2Ocean marine and aviation . . . . . . . . . . . . . . . . . . . . . . . . . . . . . . . 430.3 184.3 614.6Auto liability . . . . . . . . . . . . . . . . . . . . . . . . . . . . . . . . . . . . . . . . . 298.5 209.8 508.3Surety and credit . . . . . . . . . . . . . . . . . . . . . . . . . . . . . . . . . . . . . . 138.7 158.1 296.8Other . . . . . . . . . . . . . . . . . . . . . . . . . . . . . . . . . . . . . . . . . . . . . . 420.5 393.0 813.5
Total casualty . . . . . . . . . . . . . . . . . . . . . . . . . . . . . . . . . . . . . . . 3,191.9 4,508.2 7,700.1
Property:Fire . . . . . . . . . . . . . . . . . . . . . . . . . . . . . . . . . . . . . . . . . . . . . . . . 453.2 172.7 625.9Allied lines . . . . . . . . . . . . . . . . . . . . . . . . . . . . . . . . . . . . . . . . . . 56.4 67.3 123.7Auto physical damage . . . . . . . . . . . . . . . . . . . . . . . . . . . . . . . . . . . 33.1 38.3 71.4Homeowners multiple peril . . . . . . . . . . . . . . . . . . . . . . . . . . . . . . . 14.5 8.2 22.7Other . . . . . . . . . . . . . . . . . . . . . . . . . . . . . . . . . . . . . . . . . . . . . . 46.3 19.0 65.3
Total property . . . . . . . . . . . . . . . . . . . . . . . . . . . . . . . . . . . . . . . 603.5 305.5 909.0
Total . . . . . . . . . . . . . . . . . . . . . . . . . . . . . . . . . . . . . . . . . . . . . $3,795.4 $4,813.7 $8,609.1
(1) A large majority of the amounts within the other liability line relates to complex risks such as E&O and D&O, to generalcasualty risks and, to a much lesser extent, environmental impairment liability.
Gross loss reserves represent the accumulation of estimates for losses occurring on or prior to thebalance sheet date. Gross case reserves are principally based on reports and individual case estimatesreceived from ceding companies. The IBNR portion of gross loss reserves is based on past experience andother factors. The methods used to determine such estimates and to establish the resulting reserves arecontinually reviewed and updated. Any adjustments are reflected in income currently.
At December 31, 2010, reinsurance recoverable on gross loss reserves totaled $793.8 million (acomponent of reinsurance recoverable on paid and unpaid losses on the Consolidated Balance Sheet,which is net of an allowance for uncollectible reinsurance recoverable of $12 million), an increase of$68.6 million, or 9.5%, from the prior year-end. The increase in reinsurance recoverable is due largely toan increase in reinsurance recoverables relating to catastrophe events occurring in 2010. Of the amount ofreinsurance recoverable on paid and unpaid losses and LAE, which totaled $819.7 million as ofDecember 31, 2010, $467.6 million represented balances that were unsecured. Of such unsecured balances,97% was due from companies rated A� or better. (See Note 16.)
Net loss reserves totaled $8.21 billion at December 31, 2010, an increase of $342.9 million, or 4.4%,from the prior year-end. The overall increase in net loss reserves was mitigated by the exchange rateimpact of changes in certain foreign currency exchange rates against the U.S. dollar since the end of 2009which served to decrease net loss reserves by $131.4 million. An analysis of the change in net loss reservesfrom year-end 2009 to year-end 2010 is included in Note 6 of Notes to Consolidated Financial Statements.
72

TRANSATLANTIC HOLDINGS, INC. AND SUBSIDIARIESMANAGEMENT’S DISCUSSION AND ANALYSIS OF FINANCIAL CONDITION
AND RESULTS OF OPERATIONS (Continued)
Net loss reserves include amounts for risks relating to environmental impairment and asbestos-relatedillnesses totaling $212 million and $163 million at December 31, 2010 and 2009, respectively, including$71 million and $30 million at the aforementioned dates, respectively, relating to such losses occurring in1985 and prior. As TRC, the major operating subsidiary of the Company, commenced operations in 1978,the majority of TRH’s environmental and asbestos-related net loss reserves arose from contracts enteredinto after 1985 that were underwritten specifically as environmental or asbestos-related coverages ratherthan as standard general liability coverages, where the environmental or asbestos-related liabilities wereneither clearly defined nor specifically excluded. The reserves carried for these claims, including the IBNRportion, are based upon known facts and current law. However, significant uncertainty exists indetermining the amount of ultimate liability for environmental impairment and asbestos-related losses,particularly for those occurring in 1985 and prior. This uncertainty is due to inconsistent court resolutionsand judicial interpretations with respect to underlying policy intent and coverage and uncertainties as tothe allocation of responsibility for resultant damages, among other things.
Because the reserving process is inherently difficult and subjective, actual losses may materially differfrom reserves and related reinsurance recoverables reflected in TRH’s consolidated financial statements,and, accordingly, may have a material effect on future results of operations, financial condition and cashflows. And while there is also the possibility of changes in statutes, laws, regulations and other factors thatcould have a material effect on these liabilities and, accordingly, the financial statement elements citedimmediately above, TRH believes that its loss reserves carried at December 31, 2010 are adequate.
See Critical Accounting Estimates for a discussion of the significant assumptions and factorsconsidered in the reserve setting process.
In the ordinary course of business, TRH is involved in lawsuits, arbitrations and other formal andinformal dispute resolution procedures, the outcomes of which will determine TRH’s rights andobligations under reinsurance agreements and other more general contracts. In some disputes, TRH seeksto enforce its rights under an agreement or to collect funds owing to it. In other matters, TRH is resistingattempts by others to enforce alleged rights. Such disputes are resolved through formal and informalmeans, including litigation, arbitration and mediation. (See Item 3. Legal Proceedings.)
In all such matters, TRH believes that its positions are legally and commercially reasonable. TRH alsoregularly evaluates those positions, and where appropriate, establishes or adjusts loss reserves to reflect itsevaluation. TRH’s aggregate loss reserves take into account the possibility that TRH may not ultimatelyprevail in each and every disputed matter. TRH takes into consideration changes in judicial interpretationof legal liability and policy coverages, changes in claims handling practices and inflation. TRH considersnot only monetary increases in the cost of what it reinsures, but also changes in societal factors thatinfluence jury verdicts and case law, TRH’s approach to claim resolution, and, in turn, claim costs. TRHbelieves its aggregate loss reserves reduce the potential that an adverse resolution of one or more of thesematters, at any point in time, would have a material impact on TRH’s financial condition or results ofoperations. However, there can be no assurance that adverse resolutions of such matters in any one periodor in the aggregate will not result in a material adverse effect on TRH’s results of operations or financialcondition.
For 2010, TRH’s net operating cash inflows were $1.06 billion, an increase of $109.5 million from2009. The increase results, in large part, from net recoveries of income taxes in 2010 compared to netpayments of income taxes in 2009 and increased cash received from underwriting activities, partially offsetby an increase in interest paid on the Senior Notes. The total income taxes recovered in 2010 of$131.1 million consist of a $109.0 million refund of federal income taxes related to amended tax returns for
73

TRANSATLANTIC HOLDINGS, INC. AND SUBSIDIARIESMANAGEMENT’S DISCUSSION AND ANALYSIS OF FINANCIAL CONDITION
AND RESULTS OF OPERATIONS (Continued)
prior tax years and $22.1 million of refund claims related to capital loss carrybacks to certain other priortax years. (See Note 5 of Notes to Consolidated Financial Statements.)
For 2009, TRH’s net operating cash inflows were $951.5 million, a decrease of $145.0 million from2008. The decrease results, in large part, from a decrease in cash received from underwriting activities.
If paid losses accelerated significantly beyond TRH’s ability to fund such paid losses from currentoperating cash flows, TRH would be compelled to liquidate a portion of its investment portfolio and/orarrange for financing. Such events that may cause such a liquidity strain could be the result of severalcatastrophic events occurring in a relatively short period of time. Additional strain on liquidity could occurif the investments sold to fund such cash needs were sold in a depressed marketplace and/or reinsurancerecoverable on paid losses became uncollectible.
Based on its history of consistently strong operating cash flows, the present composition of itsinvestment portfolio (including present levels of cash, cash equivalents, short-term investments and otherliquid investment classes) and consideration of its cash needs, TRH considers its liquidity to be adequatethrough the end of 2011 and thereafter for a period the length of which is difficult to predict, but whichTRH believes will be at least one year.
TRH’s stockholders’ equity totaled $4.28 billion at December 31, 2010, an increase of $250.1 millionfrom year-end 2010. The net increase consisted primarily of net income of $402.2 million and othercomprehensive income (‘‘OCI’’) of $84.9 million, partially offset by $219.7 million of repurchases of theCompany’s common stock and cash dividends declared of $52.5 million.
The abovementioned OCI principally consisted of, net unrealized foreign currency translation gainfrom functional currencies, net of income taxes, (‘‘UTA, net of tax’’) of $120.6 million partially offset by netunrealized depreciation of investments, net of income taxes, (‘‘URA, net of tax’’) of ($36.1) million. TheURA, net of tax, is composed principally of a decrease of $50.8 million in net unrealized appreciation offixed maturities available for sale (principally due to net unrealized depreciation on states, municipalitiesand political subdivision and corporate fixed maturities, partially offset by net unrealized appreciation onRMBS fixed maturities), partially offset by an increase of $14.5 million in net unrealized appreciation ofequities available for sale. Each of the preceding UTA, net of tax, and URA, net of tax, amounts includesthe impact of a correction of the treatment of foreign currency exchange rates on the costs of investmentsdenominated in functional currencies. The correction increased the reduction of URA, net of tax, in totalby $63.7 million and increased UTA, net of tax, by the same amount with no net impact on othercomprehensive income for 2010. (See Note 2 for a discussion of the correction and Note 4 for details ofgross unrealized gains and losses by security type.)
URA, net of tax, is subject to significant volatility resulting from changes in the fair value of fixedmaturities available for sale, equities available for sale and other invested assets. Fair values may fluctuatedue to changes in general economic and political conditions, market interest rates, prospects of investeecompanies and other factors.
In December 2009, the Company’s Board of Directors (the ‘‘Board’’) authorized the repurchase of upto $200 million of the Company’s outstanding common shares from time to time in the open market or viaprivately negotiated transactions through December 31, 2011 (the ‘‘December 2009 Authorization’’). InOctober 2010, the Board approved a new share repurchase program, which authorizes the Company torepurchase up to $200 million of the Company’s outstanding common shares from time to time in the openmarket or via negotiated transactions through December 31, 2012 (the ‘‘October 2010 Authorization’’).The October 2010 Authorization superceded the December 2009 Authorization. In 2010, the Companyrepurchased 4.3 million shares of its common stock at an aggregate cost of $219.7 million. Of the shares
74

TRANSATLANTIC HOLDINGS, INC. AND SUBSIDIARIESMANAGEMENT’S DISCUSSION AND ANALYSIS OF FINANCIAL CONDITION
AND RESULTS OF OPERATIONS (Continued)
purchased in 2010, two million shares were repurchased from AHAC at an aggregate cost of $105 millionpursuant to a stock offering agreement in connection with the March 2010 Offering. As of December 31,2010 there was $145.4 million remaining under the October 2010 Authorization. (See Item 5. Market for theRegistrant’s Common Equity, Related Stockholder Matters and Issuer Purchases of Equity Securities.)
In November 2009, the Company issued $350 million principal amount of the 2039 Notes, all of whichremains outstanding as of December 31, 2010 and 2009. In 2010 and 2009, TRH repurchased $3 millionand $30 million, respectively, principal amount of the 2015 Notes. $692 million and $695 million principalamount of the 2015 Notes were outstanding at December 31, 2010 and 2009, respectively. (See Note 7 forthe (losses) gains realized on the early extinguishment of the 2015 Notes.)
As of December 31, 2010, the amounts due and the estimated period between year-end 2010 and thedates of payment, under specified contractual obligations of TRH are as follows:
Less Than More ThanTotal 1 Year 1-3 Years 3-5 Years 5 Years
(in thousands)
Long-term debt(1) . . . . . . . . . . . . . . . $ 2,052,952 $ 67,790 $ 135,580 $ 827,582 $1,022,000Operating leases . . . . . . . . . . . . . . . 84,235 12,292 21,813 17,685 32,445Gross loss reserves . . . . . . . . . . . . . . 9,020,610 1,994,039 2,592,395 1,591,606 2,842,570Other(2) . . . . . . . . . . . . . . . . . . . . . . 17,189 17,189 — — —
Total . . . . . . . . . . . . . . . . . . . . . . $11,174,986 $2,091,310 $2,749,788 $2,436,873 $3,897,015
(1) Includes anticipated interest payments.(2) Represents commitments to provide funding to a non-U.S. reinsurer (see Note 18 of Notes to Consolidated Financial
Statements) and to invest in limited partnerships.
With respect to commitments and contingent liabilities, see Note 18 of Notes to ConsolidatedFinancial Statements.
Risk Based Capital (‘‘RBC’’) standards, promulgated by the National Association of InsuranceCommissioners (‘‘NAIC’’), relate an individual company’s statutory policyholders’ surplus to the riskinherent in its overall operations and set thresholds at which certain company and regulatory correctiveactions are mandated. At December 31, 2010 the statutory surpluses of TRC and Putnam each exceededthe level of surplus required under RBC requirements for regulatory attention.
Catastrophe Exposure
The nature of TRH’s business exposes it to losses from various catastrophe events. In a catastropheevent, losses from many insureds across multiple lines of business may result directly or indirectly fromsuch single occurrence. In order to control such exposures, TRH employs a combination of measures,including setting targets for the amount of its exposure in key geographic zones and product lines that areprone to catastrophic events, monitoring and modeling accumulated exposures and purchasing catastrophereinsurance when deemed cost effective.
Natural disasters such as hurricanes, earthquakes and other catastrophes have the potential toadversely affect TRH’s operating results by material amounts. Other risks, such as an outbreak of apandemic disease, a major terrorist event, the bankruptcy of a major company, or a marine and/or aviationdisaster, could also have a materially adverse effect on TRH’s business and operating results to an extentthat may be only partially offset by reinsurance.
75

TRANSATLANTIC HOLDINGS, INC. AND SUBSIDIARIESMANAGEMENT’S DISCUSSION AND ANALYSIS OF FINANCIAL CONDITION
AND RESULTS OF OPERATIONS (Continued)
TRH evaluates catastrophic events and assesses the probability of occurrence and magnitude throughthe use of industry recognized models and other techniques. TRH supplements these models byperiodically monitoring the exposure risks of its operations and adjusting such modeled output accordingly.
It is important to recognize that there is no single standard methodology to project the possible lossesfrom catastrophe exposures. Further, there are no industry standard assumptions to be utilized inprojecting these losses and the form and quality of the data obtained from ceding companies used in thesemodels are not uniformly compatible with the data requirements of all models. The use of differentmethodologies and assumptions could materially change the projected losses. Therefore, these modeledlosses may not be comparable to estimates made by other companies.
While the analytical tools used to estimate catastrophe exposure are useful in both pricing andmonitoring catastrophe risk, the estimates derived by use of these techniques are inherently uncertain anddo not reflect TRH’s maximum exposures to these events. While the models are frequently updated, theseprojections are nevertheless inherently imprecise. It is highly likely that TRH’s losses will vary, perhapsmaterially, from these estimates.
Projections of potential catastrophe losses are typically expressed in terms of the probable maximumloss (‘‘PML’’). TRH defines PML as its anticipated maximum loss (taking into account contract limits)caused by a single catastrophic event affecting a broad contiguous area. These modeled losses areestimated based upon contracts in force at January 1, 2011.
The following is an overview of such modeled PMLs from property, engineering, marine and energyexposures and the associated natural perils that TRH deems most significant. The estimated amount ofthese modeled losses are presented in three ways: (a) gross losses; (b) pre-tax net catastrophe costs (i.e.,gross losses, net of reinsurance and the impact of net reinstatement premiums); and (c) after-tax netcatastrophe costs (i.e., the net cost to TRH). The reduction for reinsurance assumes that all reinsurersfulfill their obligations to TRH in accordance with contract terms. The values provided have a likelihood ofbeing exceeded in any single year of 1.0% or 0.4%.
1.0% 0.4%
Pre-Tax Net After-Tax Net Pre-Tax Net After-Tax NetGross Catastrophe Catastrophe Gross Catastrophe CatastropheLosses Costs Costs Losses Costs Costs
(in millions)
Florida, Wind . . . . . . . . . . . . . . . . $636 $599 $389 $1,146 $1,061 $690Japan, Wind . . . . . . . . . . . . . . . . . 543 443 288 626 518 336Japan, Earthquake . . . . . . . . . . . . 521 420 273 645 521 338Europe, Wind . . . . . . . . . . . . . . . 511 392 255 658 524 341Northeast U.S., Wind . . . . . . . . . . 486 459 298 1,138 1,053 685California, Earthquake . . . . . . . . . 456 417 271 899 813 529
‘‘Florida, Wind’’ has the highest modeled after-tax net catastrophe costs arising out of events with a1.0% probability of being exceeded and would represent 9.1% of TRH’s stockholders’ equity atDecember 31, 2010. ‘‘Florida, Wind’’ has the highest modeled after-tax net catastrophe costs arising out ofevents with a 0.4% probability of being exceeded and would represent 16.1% of TRH’s stockholders’equity at December 31, 2010. If multiple severe catastrophic events occur in any one year, the potentialeconomic cost to the company could be materially higher than any one of the amounts shown above.
There is much uncertainty and imprecision in the compilation of these estimates at many stages in theprocess. Moreover, the makeup of TRH’s in-force business is constantly changing as new business is added
76

TRANSATLANTIC HOLDINGS, INC. AND SUBSIDIARIESMANAGEMENT’S DISCUSSION AND ANALYSIS OF FINANCIAL CONDITION
AND RESULTS OF OPERATIONS (Continued)
and existing contracts terminate or expire, including contracts for reinsurance coverage purchased byTRH. In addition, these estimates take into account what TRH believes to be the most likely accumulationof territories and/or lines of business in a catastrophic natural peril event, but there can be no assurancethat TRH has captured every possible scenario in its analysis. As a result of these factors, among others,there can be no assurance that TRH will not experience after-tax net catastrophe costs from individualevents that will exceed these estimates by a material amount. There also can be no assurance that TRH willnot experience catastrophe events more frequently than the modeled probabilities would suggest. In anygiven year, catastrophe events could have a material adverse effect on TRH’s financial condition, results ofoperations, cash flows and liquidity.
See Note 10 for catastrophe costs incurred in 2010, 2009 and 2008.
Disruption in Global Credit and Financial Markets
In mid-2007, the U.S. residential mortgage market began to experience serious disruption due tocredit quality deterioration in a significant portion of loans originated, particularly to non-prime andsub-prime borrowers; evolving changes in the regulatory environment; a residential housing marketcharacterized by a slowing pace of transactions and declining prices; increased cost of borrowings formortgage participants; a rising unemployment rate; increased delinquencies in non-mortgage consumercredit; and illiquid credit markets. In addition, the financial strength of certain bond insurers has beencompromised to varying degrees by losses these entities experienced due in part to the coverage theyprovide for domestic RMBS. These conditions continued through 2008 and into 2009, expanding into thebroader global credit markets and resulting in greater volatility, a steep decline in equity markets, lessliquidity, widening of credit spreads, a lack of price transparency, increased credit losses in certain marketsand the collapse of several prominent financial institutions. By the end of 2009 and through 2010, thedisruptions to the global credit and financial markets had moderated as the markets started to stabilize or,in some cases, recover. TRH cannot predict whether current trends will continue, deteriorate or improve.
These issues carry risk relating to certain lines of business TRH underwrites because disruption in thecredit and financial markets may increase claim activity in lines such as D&O, E&O, credit, and to alimited extent mortgage guaranty business, among others. TRH also participates in the mortgage marketthrough investments in mortgage-backed securities.
The operating results and financial condition of TRH have been and may continue to be adverselyaffected by factors related to the market disruptions referred to above, among others. The duration andseverity of the downward cycle could extend further if there is an increase in the severity of the economicdifficulties being experienced around the world, including the U.S. Continued difficulties in the economymay have an adverse effect on TRH’s operating results in the future. The impact on TRH’s operations withexposure to the credit and financial markets will be somewhat dependent on future market conditions.
TRH’s operating results, investment portfolio and overall consolidated financial condition could befurther adversely impacted if global economic conditions deteriorate in the future, although TRH attemptsto mitigate these, as well as other financial and operational risks, by disciplined underwriting of adiversified book of business, generally conservative investment strategies and risk management. WhileTRH cannot predict with any certainty the ultimate impact the recent economic deterioration will have onTRH, these events may have a material adverse effect on TRH’s results of operations, financial conditionand cash flows and the Company’s stock price.
Recent Accounting Standards
See Note 2(k) of Notes to Consolidated Financial Statements for a discussion of recent accountingstandards and their application to TRH.
77

Item 7A.
TRANSATLANTIC HOLDINGS, INC. AND SUBSIDIARIESQUANTITATIVE AND QUALITATIVE DISCLOSURES ABOUT MARKET RISK
TRH’s operations are exposed to market risk. Market risk is the risk of loss of fair value resultingfrom adverse fluctuations in interest rates, equity prices and foreign currency exchange rates. TRH’smarket risk exposures arise from the following:
• TRH is a globally diversified enterprise with capital employed in a variety of currencies.• The large amount of TRH’s capital invested in fixed income or equity securities.
TRH analyzes market risk using Value at Risk (‘‘VaR’’). VaR is a summary statistical measure thatapplies the estimated volatility and correlation of market factors of TRH’s market position. The outputfrom the VaR calculation is the maximum loss that could occur over a defined period of time given acertain probability. VaR measures not only the size of the individual exposures but also the interactionbetween different market exposures, thereby providing a portfolio approach to measuring market risk.
While VaR models are relatively sophisticated, the quantitative market risk information generated islimited by the assumptions and parameters established in creating the related models. TRH believes thatstatistical models alone do not provide a reliable method of monitoring and controlling market risk.Therefore, such models are tools and do not substitute for the experience or judgment of seniormanagement.
TRH has performed VaR analyses to estimate the maximum potential loss of fair value for financialinstruments for each type of market risk. In this analysis, financial instrument assets include allinvestments, cash and accrued investment income. Financial instrument liabilities include unpaid lossesand LAE and unearned premiums, each net of reinsurance, and the Senior Notes.
TRH calculated the VaR with respect to net fair values at each quarter end in 2010 and 2009. TheVaR number represents the maximum potential loss as of those dates that could be incurred with a 95%confidence (i.e., only 5% of historical scenarios show losses greater than the VaR figures) within aone-month holding period. Starting in the second quarter of 2009, TRH refined the calculations of VaR.For the values calculated starting June 30, 2009, TRH employed a variance-covariance methodology thatentails modeling the linear sensitivities of all the assets and liabilities to a broad set of systematic marketrisk factors and idiosyncratic risk factors. Risk factor returns are assumed to be joint-normally distributed.The most recent two years of historical changes in these risk factors are utilized. Information prior toJune 30, 2009 that was utilized in calculating the average, high and low values for the year endedDecember 31, 2009 presented below have been calculated using the historical simulation methodology.TRH does not believe that the differences between methods materially affect an evaluation of thepotential impact that market risk may have on TRH. TRH expects to use the variance-covariancemethodology for future period data.
TRH’s market risk analyses do not provide weight to risks relating to market issues such as liquidityand the credit-worthiness of investments.
The following table presents the year-end, average, high and low VaRs on a diversified basis and ofeach component of market risk for 2010 and 2009. The diversified VaR is usually smaller than the sum ofits components due to correlation effects.
2010 2009
Year-End Average High Low Year-End Average High Low
(in millions)
Diversified . . . . . . . . . . . . . . . . . . . . . . . . . $164 $153 $170 $137 $170 $192 $276 $91Interest rate . . . . . . . . . . . . . . . . . . . . . . . . 109 97 140 75 140 149 216 84Equity . . . . . . . . . . . . . . . . . . . . . . . . . . . . 78 77 80 73 80 94 138 80Currency . . . . . . . . . . . . . . . . . . . . . . . . . . . 42 47 51 42 49 58 79 47
78
Item 8.
TRANSATLANTIC HOLDINGS, INC. AND SUBSIDIARIESFINANCIAL STATEMENTS AND SUPPLEMENTARY DATA
INDEX TO CONSOLIDATED FINANCIAL STATEMENTS AND SCHEDULES
Page
Report of Independent Registered Public Accounting Firm . . . . . . . . . . . . . . . . . . . . . . . . . . . . 80Consolidated Balance Sheets As of December 31, 2010 and 2009 . . . . . . . . . . . . . . . . . . . . . . . . 81Consolidated Statements of Operations For the Years Ended December 31, 2010, 2009 and 2008 . 82Consolidated Statements of Stockholders’ Equity For the Years Ended December 31, 2010, 2009
and 2008 . . . . . . . . . . . . . . . . . . . . . . . . . . . . . . . . . . . . . . . . . . . . . . . . . . . . . . . . . . . . . . . 83Consolidated Statements of Cash Flows For the Years Ended December 31, 2010, 2009 and 2008 84Consolidated Statements of Comprehensive Income (Loss) For the Years Ended December 31,
2010, 2009 and 2008 . . . . . . . . . . . . . . . . . . . . . . . . . . . . . . . . . . . . . . . . . . . . . . . . . . . . . . . 85Notes to Consolidated Financial Statements . . . . . . . . . . . . . . . . . . . . . . . . . . . . . . . . . . . . . . . 86Schedules:
I—Summary of Investments—Other than Investments in Related Parties As of December 31,2010 . . . . . . . . . . . . . . . . . . . . . . . . . . . . . . . . . . . . . . . . . . . . . . . . . . . . . . . . . . . . . . . . S-1
II—Condensed Financial Information of Registrant As of December 31, 2010 and 2009 andFor the Years Ended December 31, 2010, 2009 and 2008 . . . . . . . . . . . . . . . . . . . . . . . . . . S-2
III—Supplementary Insurance Information As of December 31, 2010, 2009 and 2008 and Forthe Years Then Ended . . . . . . . . . . . . . . . . . . . . . . . . . . . . . . . . . . . . . . . . . . . . . . . . . . . S-5
IV—Reinsurance For the Years Ended December 31, 2010, 2009 and 2008 . . . . . . . . . . . . . . . S-6VI—Supplementary Information Concerning Property/Casualty Insurance Operations As of
December 31, 2010, 2009 and 2008 and For the Years Then Ended . . . . . . . . . . . . . . . . . . . S-7
79

Report of Independent Registered Public Accounting Firm
To the Board of Directors and Stockholders ofTransatlantic Holdings, Inc.:
In our opinion, the consolidated financial statements listed in the accompanying index present fairly, in allmaterial respects, the financial position of Transatlantic Holdings, Inc. and its subsidiaries (the ‘‘Company’’) atDecember 31, 2010 and 2009, and the results of their operations and their cash flows for each of the three yearsin the period ended December 31, 2010 in conformity with accounting principles generally accepted in theUnited States of America. In addition, in our opinion, the financial statement schedules listed in theaccompanying index present fairly, in all material respects, the information set forth therein when read inconjunction with the related consolidated financial statements. Also in our opinion, the Company maintained,in all material respects, effective internal control over financial reporting as of December 31, 2010, based oncriteria established in Internal Control—Integrated Framework issued by the Committee of SponsoringOrganizations of the Treadway Commission (COSO). The Company’s management is responsible for thesefinancial statements and financial statement schedules, for maintaining effective internal control over financialreporting and for its assessment of the effectiveness of internal control over financial reporting, included in theaccompanying Management’s Report on Internal Control over Financial Reporting appearing under Item 9A.Our responsibility is to express opinions on these financial statements, on the financial statement schedules,and on the Company’s internal control over financial reporting based on our integrated audits. We conductedour audits in accordance with the standards of the Public Company Accounting Oversight Board (UnitedStates). Those standards require that we plan and perform the audits to obtain reasonable assurance aboutwhether the financial statements are free of material misstatement and whether effective internal control overfinancial reporting was maintained in all material respects. Our audits of the financial statements includedexamining, on a test basis, evidence supporting the amounts and disclosures in the financial statements,assessing the accounting principles used and significant estimates made by management, and evaluating theoverall financial statement presentation. Our audit of internal control over financial reporting includedobtaining an understanding of internal control over financial reporting, assessing the risk that a materialweakness exists, and testing and evaluating the design and operating effectiveness of internal control based onthe assessed risk. Our audits also included performing such other procedures as we considered necessary in thecircumstances. We believe that our audits provide a reasonable basis for our opinions.
As discussed in Note 2 to the consolidated financial statements, the Company changed the manner inwhich it accounts for other-than-temporary impairment of debt securities in 2009 in connection with itsadoption of new accounting guidance.
A company’s internal control over financial reporting is a process designed to provide reasonableassurance regarding the reliability of financial reporting and the preparation of financial statements for externalpurposes in accordance with generally accepted accounting principles. A company’s internal control overfinancial reporting includes those policies and procedures that (i) pertain to the maintenance of records that, inreasonable detail, accurately and fairly reflect the transactions and dispositions of the assets of the company;(ii) provide reasonable assurance that transactions are recorded as necessary to permit preparation of financialstatements in accordance with generally accepted accounting principles, and that receipts and expenditures ofthe company are being made only in accordance with authorizations of management and directors of thecompany; and (iii) provide reasonable assurance regarding prevention or timely detection of unauthorizedacquisition, use, or disposition of the company’s assets that could have a material effect on the financialstatements.
Because of its inherent limitations, internal control over financial reporting may not prevent or detectmisstatements. Also, projections of any evaluation of effectiveness to future periods are subject to the risk thatcontrols may become inadequate because of changes in conditions, or that the degree of compliance with thepolicies or procedures may deteriorate.
/s/ PricewaterhouseCoopers LLPPricewaterhouseCoopers LLPNew York, New YorkFebruary 22, 2011
80

TRANSATLANTIC HOLDINGS, INC. AND SUBSIDIARIESCONSOLIDATED BALANCE SHEETS
As of December 31, 2010 and 2009
2010 2009
(in thousands, except share data)ASSETS
Investments:Fixed maturities:
Held to maturity, at amortized cost (fair value: 2010—$1,240,678;2009—$1,271,397) . . . . . . . . . . . . . . . . . . . . . . . . . . . . . . . . . . $ 1,189,801 $ 1,214,238
Available for sale, at fair value (amortized cost: 2010—$10,727,717; 2009—$9,281,934) . . . . . . . . . . . . . . . . . . . . . . . . . 10,822,336 9,454,772
Equities, available for sale, at fair value (cost: 2010—$476,516;2009—$440,924) . . . . . . . . . . . . . . . . . . . . . . . . . . . . . . . . . . . . . 564,530 506,612
Other invested assets . . . . . . . . . . . . . . . . . . . . . . . . . . . . . . . . . . . 275,977 256,437Short-term investments, at cost (approximates fair value) . . . . . . . . . 120,095 883,336
Total investments . . . . . . . . . . . . . . . . . . . . . . . . . . . . . . . . . . . 12,972,739 12,315,395Cash and cash equivalents . . . . . . . . . . . . . . . . . . . . . . . . . . . . . . . . . 284,491 195,723Accrued investment income receivable . . . . . . . . . . . . . . . . . . . . . . . . 150,695 148,055Premium balances receivable, net . . . . . . . . . . . . . . . . . . . . . . . . . . . . 605,094 591,300Reinsurance recoverable on paid and unpaid losses and loss adjustment
expenses . . . . . . . . . . . . . . . . . . . . . . . . . . . . . . . . . . . . . . . . . . . . 819,734 747,073Deferred policy acquisition costs . . . . . . . . . . . . . . . . . . . . . . . . . . . . 238,296 237,466Prepaid reinsurance premiums . . . . . . . . . . . . . . . . . . . . . . . . . . . . . . 75,291 60,251Deferred tax assets, net . . . . . . . . . . . . . . . . . . . . . . . . . . . . . . . . . . . 463,808 454,483Other assets . . . . . . . . . . . . . . . . . . . . . . . . . . . . . . . . . . . . . . . . . . . 95,206 193,913
Total assets . . . . . . . . . . . . . . . . . . . . . . . . . . . . . . . . . . . . . . . $15,705,354 $14,943,659
LIABILITIES AND STOCKHOLDERS’ EQUITYUnpaid losses and loss adjustment expenses . . . . . . . . . . . . . . . . . . . . $ 9,020,610 $ 8,609,105Unearned premiums . . . . . . . . . . . . . . . . . . . . . . . . . . . . . . . . . . . . . 1,212,535 1,187,526Senior notes . . . . . . . . . . . . . . . . . . . . . . . . . . . . . . . . . . . . . . . . . . . 1,030,511 1,033,087Other liabilities . . . . . . . . . . . . . . . . . . . . . . . . . . . . . . . . . . . . . . . . . 157,239 79,561
Total liabilities . . . . . . . . . . . . . . . . . . . . . . . . . . . . . . . . . . . . . 11,420,895 10,909,279
Commitments and contingent liabilities (see Note 18)
Preferred stock, $1.00 par value; shares authorized: 10,000,000; noneissued . . . . . . . . . . . . . . . . . . . . . . . . . . . . . . . . . . . . . . . . . . . . . . — —
Common stock, $1.00 par value; shares authorized: 200,000,000; sharesissued: 2010—67,611,341; 2009—67,431,121 . . . . . . . . . . . . . . . . . . . 67,611 67,431
Additional paid-in capital . . . . . . . . . . . . . . . . . . . . . . . . . . . . . . . . . . 318,064 283,036Accumulated other comprehensive income . . . . . . . . . . . . . . . . . . . . . 154,615 69,701Retained earnings . . . . . . . . . . . . . . . . . . . . . . . . . . . . . . . . . . . . . . . 3,988,891 3,639,200Treasury stock, at cost: 2010—5,362,800; 2009—1,048,500 shares of
common stock . . . . . . . . . . . . . . . . . . . . . . . . . . . . . . . . . . . . . . . . (244,722) (24,988)
Total stockholders’ equity . . . . . . . . . . . . . . . . . . . . . . . . . . . . . 4,284,459 4,034,380
Total liabilities and stockholders’ equity . . . . . . . . . . . . . . . . . . $15,705,354 $14,943,659
The accompanying notes are an integral part of the consolidated financial statements.
81

TRANSATLANTIC HOLDINGS, INC. AND SUBSIDIARIESCONSOLIDATED STATEMENTS OF OPERATIONS
For the Years Ended December 31, 2010, 2009 and 2008
2010 2009 2008
(in thousands, except per share data)
Revenues:Net premiums written . . . . . . . . . . . . . . . . . . . . . . . . . . . . . . $3,881,693 $3,986,101 $4,108,092(Increase) decrease in net unearned premiums . . . . . . . . . . . . (23,073) 52,981 (40,703)
Net premiums earned . . . . . . . . . . . . . . . . . . . . . . . . . . . . . . 3,858,620 4,039,082 4,067,389
Net investment income . . . . . . . . . . . . . . . . . . . . . . . . . . . . . 473,547 467,402 440,451
Realized net capital gains (losses):Total other-than-temporary impairments . . . . . . . . . . . . . . . (14,685) (96,527) (317,790)Less: Total other-than-temporary impairments recognized in
other comprehensive income (loss) . . . . . . . . . . . . . . . . . 6,713 13,445 —
Other-than-temporary impairments charged to earnings . . . (7,972) (83,082) (317,790)Other realized net capital gains (losses) . . . . . . . . . . . . . . . 38,073 12,441 (117,751)
Total realized net capital gains (losses) . . . . . . . . . . . . 30,101 (70,641) (435,541)
(Loss) gain on early extinguishment of debt . . . . . . . . . . . . . . (115) 9,869 10,250
Total revenues . . . . . . . . . . . . . . . . . . . . . . . . . . . . 4,362,153 4,445,712 4,082,549
Expenses:Net losses and loss adjustment expenses . . . . . . . . . . . . . . . . 2,681,774 2,679,171 2,907,227Net commissions . . . . . . . . . . . . . . . . . . . . . . . . . . . . . . . . . 932,820 927,918 980,626(Increase) decrease in deferred policy acquisition costs . . . . . . (2,898) 12,406 (6,956)Other underwriting expenses . . . . . . . . . . . . . . . . . . . . . . . . . 177,624 158,181 131,555Interest on senior notes . . . . . . . . . . . . . . . . . . . . . . . . . . . . 68,272 43,454 43,359Other expenses, net . . . . . . . . . . . . . . . . . . . . . . . . . . . . . . . 31,773 28,549 23,515
Total expenses . . . . . . . . . . . . . . . . . . . . . . . . . . . . 3,889,365 3,849,679 4,079,326
Income before income taxes . . . . . . . . . . . . . . . . . . . . . . . . . . . 472,788 596,033 3,223
Income taxes (benefits):Current . . . . . . . . . . . . . . . . . . . . . . . . . . . . . . . . . . . . . . . . 125,630 96,771 45,277Deferred . . . . . . . . . . . . . . . . . . . . . . . . . . . . . . . . . . . . . . . (55,043) 21,600 (144,308)
Total income taxes (benefits) . . . . . . . . . . . . . . . . . . 70,587 118,371 (99,031)
Net income . . . . . . . . . . . . . . . . . . . . . . . . . . . . . . . . . . . . . . . $ 402,201 $ 477,662 $ 102,254
Net income per common share:Basic . . . . . . . . . . . . . . . . . . . . . . . . . . . . . . . . . . . . . . . . . . $ 6.28 $ 7.20 $ 1.54Diluted . . . . . . . . . . . . . . . . . . . . . . . . . . . . . . . . . . . . . . . . 6.19 7.15 1.53
Weighted average common shares outstanding:Basic . . . . . . . . . . . . . . . . . . . . . . . . . . . . . . . . . . . . . . . . . . 64,092 66,381 66,270Diluted . . . . . . . . . . . . . . . . . . . . . . . . . . . . . . . . . . . . . . . . 64,930 66,802 66,722
The accompanying notes are an integral part of the consolidated financial statements.
82

TRANSATLANTIC HOLDINGS, INC. AND SUBSIDIARIESCONSOLIDATED STATEMENTS OF STOCKHOLDERS’ EQUITY
For the Years Ended December 31, 2010, 2009 and 2008
2010 2009 2008
(in thousands, except per share data)
Common Stock:Balance, beginning of year . . . . . . . . . . . . . . . . . . . . . . . . . . $ 67,431 $ 67,353 $ 67,222Issued under stock compensation plans . . . . . . . . . . . . . . . . . 180 78 131
Balance, end of year . . . . . . . . . . . . . . . . . . . . . . . . . . . . . 67,611 67,431 67,353
Additional paid-in capital:Balance, beginning of year . . . . . . . . . . . . . . . . . . . . . . . . . . 283,036 268,027 249,853Excess of proceeds (costs) over par value of common stock
issued under stock compensation plans . . . . . . . . . . . . . . . . 883 1,514 (1,052)Contributed capital . . . . . . . . . . . . . . . . . . . . . . . . . . . . . . . . 34,145 13,495 19,226
Balance, end of year . . . . . . . . . . . . . . . . . . . . . . . . . . . . . 318,064 283,036 268,027
Accumulated other comprehensive income (loss):Balance, beginning of year . . . . . . . . . . . . . . . . . . . . . . . . . . 69,701 (257,690) (34,692)Net change for year . . . . . . . . . . . . . . . . . . . . . . . . . . . . . . . 130,638 613,783 (343,074)Deferred income tax effect on above net change . . . . . . . . . . (45,724) (214,823) 120,076Cumulative effect of accounting change, net of tax . . . . . . . . . — (71,569) —
Balance, end of year . . . . . . . . . . . . . . . . . . . . . . . . . . . . . 154,615 69,701 (257,690)
Retained earnings:Balance, beginning of year . . . . . . . . . . . . . . . . . . . . . . . . . . 3,639,200 3,142,449 3,088,578Net income . . . . . . . . . . . . . . . . . . . . . . . . . . . . . . . . . . . . . 402,201 477,662 102,254Cash dividends declared (per common share: 2010—$0.83;
2009—$0.79; 2008—$0.73) . . . . . . . . . . . . . . . . . . . . . . . . . (52,510) (52,480) (48,383)Cumulative effect of accounting change, net of tax . . . . . . . . . — 71,569 —
Balance, end of year . . . . . . . . . . . . . . . . . . . . . . . . . . . . . 3,988,891 3,639,200 3,142,449
Treasury Stock:Balance, beginning of year . . . . . . . . . . . . . . . . . . . . . . . . . . (24,988) (21,919) (21,919)Acquisition of treasury stock . . . . . . . . . . . . . . . . . . . . . . . . . (219,734) (3,069) —
Balance, end of year . . . . . . . . . . . . . . . . . . . . . . . . . . . . . (244,722) (24,988) (21,919)
Total stockholders’ equity . . . . . . . . . . . . . . . . . . . . . . . . . . . . . $4,284,459 $4,034,380 $3,198,220
The accompanying notes are an integral part of the consolidated financial statements.
83

TRANSATLANTIC HOLDINGS, INC. AND SUBSIDIARIESCONSOLIDATED STATEMENTS OF CASH FLOWS
For the Years Ended December 31, 2010, 2009 and 2008
2010 2009 2008
(in thousands)Cash flows from operating activities:
Net income . . . . . . . . . . . . . . . . . . . . . . . . . . . . . . . . . . . . . . . . $ 402,201 $ 477,662 $ 102,254
Adjustments to reconcile net income to net cash provided byoperating activities:
Changes in unpaid losses and loss adjustment expenses, unearnedpremiums and prepaid reinsurance premiums . . . . . . . . . . . . . 421,474 476,003 179,086
Changes in premium and reinsurance balances receivable andpayable, net . . . . . . . . . . . . . . . . . . . . . . . . . . . . . . . . . . . (70,568) 111,329 236,445
Change in deferred policy acquisition costs . . . . . . . . . . . . . . . . (830) 2,144 8,471Change in accrued investment income . . . . . . . . . . . . . . . . . . . (20,606) (27,390) 28,575Realized net capital (gains) losses from investments . . . . . . . . . . (32,656) 62,156 407,455Changes in current and deferred income taxes . . . . . . . . . . . . . . 83,136 48,377 (218,090)Change in unrealized net foreign exchange losses (gains) . . . . . . 152,818 (187,288) 307,364Changes in other assets and liabilities, net . . . . . . . . . . . . . . . . 31,596 (49,375) (8,923)Other, net . . . . . . . . . . . . . . . . . . . . . . . . . . . . . . . . . . . . . . 94,438 37,867 53,850
Total adjustments . . . . . . . . . . . . . . . . . . . . . . . . . . . . . . . . 658,802 473,823 994,233
Net cash provided by operating activities . . . . . . . . . . . . . . . . 1,061,003 951,485 1,096,487
Cash flows from investing activities:Proceeds of fixed maturities available for sale sold . . . . . . . . . . . . . . 1,186,098 1,229,268 4,346,358Proceeds of fixed maturities available for sale redeemed or matured . . 947,819 600,939 619,493Proceeds of fixed maturities held to maturity redeemed . . . . . . . . . . 20,000 — 25,000Proceeds of equities available for sale sold . . . . . . . . . . . . . . . . . . . 200,953 944,695 877,755Purchase of fixed maturities available for sale . . . . . . . . . . . . . . . . . (3,573,780) (2,514,442) (5,157,138)Purchase of equities available for sale . . . . . . . . . . . . . . . . . . . . . . (199,815) (849,162) (899,896)Net sale (purchase) of other invested assets . . . . . . . . . . . . . . . . . . 7,082 14,902 (22,265)Net sales in securities lending invested collateral . . . . . . . . . . . . . . . — — 1,329,619Net sale (purchase) of short-term investments . . . . . . . . . . . . . . . . . 725,957 (791,086) (173,520)Change in other liabilities for securities in course of settlement . . . . . (6,510) 40,479 (84,369)Other, net . . . . . . . . . . . . . . . . . . . . . . . . . . . . . . . . . . . . . . . . . — (16,456) (10,398)
Net cash (used in) provided by investing activities . . . . . . . . . . (692,196) (1,340,863) 850,639
Cash flows from financing activities:Net change in securities lending payable . . . . . . . . . . . . . . . . . . . . . — — (1,845,822)Dividends to stockholders . . . . . . . . . . . . . . . . . . . . . . . . . . . . . . . (52,611) (51,780) (46,382)Common stock issued . . . . . . . . . . . . . . . . . . . . . . . . . . . . . . . . . (43) 1,579 (924)Acquisition of treasury stock . . . . . . . . . . . . . . . . . . . . . . . . . . . . . (219,734) (3,069) —Repurchase of senior notes . . . . . . . . . . . . . . . . . . . . . . . . . . . . . . (3,105) (19,612) (14,750)Net proceeds from issuance of senior notes . . . . . . . . . . . . . . . . . . . — 336,929 —Other, net . . . . . . . . . . . . . . . . . . . . . . . . . . . . . . . . . . . . . . . . . 3,279 1,254 2,946
Net cash (used in) provided by financing activities . . . . . . . . . (272,214) 265,301 (1,904,932)
Effect of exchange rate changes on cash and cash equivalents . . . . . . . . (7,825) 30,880 (8,706)
Change in cash and cash equivalents . . . . . . . . . . . . . . . . . . . 88,768 (93,197) 33,488Cash and cash equivalents, beginning of year . . . . . . . . . . . . . . . . . . . 195,723 288,920 255,432
Cash and cash equivalents, end of year . . . . . . . . . . . . . . . . . $ 284,491 $ 195,723 $ 288,920
Supplemental cash flow information:Income taxes recovered (paid), net . . . . . . . . . . . . . . . . . . . . . . . . . $ 15,529 $ (108,713) $ (119,474)Interest (paid) on senior notes . . . . . . . . . . . . . . . . . . . . . . . . . . . (68,439) (40,394) (43,113)
The accompanying notes are an integral part of the consolidated financial statements.
84

TRANSATLANTIC HOLDINGS, INC. AND SUBSIDIARIESCONSOLIDATED STATEMENTS OF COMPREHENSIVE INCOME (LOSS)
For the Years Ended December 31, 2010, 2009 and 2008
2010 2009 2008
(in thousands)
Net income . . . . . . . . . . . . . . . . . . . . . . . . . . . . . . . . . . . . . . . . . $402,201 $ 477,662 $ 102,254
Other comprehensive income (loss):Net unrealized (depreciation) appreciation of investments, net of
tax:Net unrealized holding losses of fixed maturities on which
other-than-temporary impairments were taken . . . . . . . . . . (6,713) (13,445) —Net unrealized holding gains (losses) on all other securities . . 4,967 635,091 (772,771)Reclassification adjustment for (gains) losses included in net
income . . . . . . . . . . . . . . . . . . . . . . . . . . . . . . . . . . . . . . (53,791) 64,989 417,705Deferred income tax benefit (charge) . . . . . . . . . . . . . . . . . . 19,438 (240,322) 124,273
(36,099) 446,313 (230,793)
Change in retirement plan liability, net of tax:Change in retirement plan liability . . . . . . . . . . . . . . . . . . . . 696 — —Deferred income tax charge . . . . . . . . . . . . . . . . . . . . . . . . (244) — —
452 — —
Net unrealized currency translation gain (loss), net of tax:Net unrealized currency translation gain (loss) . . . . . . . . . . . 185,479 (72,852) 11,992Deferred income tax (charge) benefit . . . . . . . . . . . . . . . . . . (64,918) 25,499 (4,197)
120,561 (47,353) 7,795
Other comprehensive income (loss) . . . . . . . . . . . . . . . . . 84,914 398,960 (222,998)
Comprehensive income (loss) . . . . . . . . . . . . . . . . . . . . . . . . . . . . $487,115 $ 876,622 $(120,744)
The accompanying notes are an integral part of the consolidated financial statements.
85

TRANSATLANTIC HOLDINGS, INC. AND SUBSIDIARIESNOTES TO CONSOLIDATED FINANCIAL STATEMENTS
1. Organization and Nature of Operations
Transatlantic Holdings, Inc. (the ‘‘Company’’, and collectively with its subsidiaries, ‘‘TRH’’) is aholding company, incorporated in the state of Delaware, which owns all of the common stock ofTransatlantic Reinsurance Company� (‘‘TRC’’). TRC owns all of the common stock of Trans Re ZurichReinsurance Company Ltd. (‘‘TRZ’’) and Putnam Reinsurance Company (‘‘Putnam’’).
Prior to June 10, 2009 and as of December 31, 2008, American International Group, Inc. (‘‘AIG’’, andcollectively with its subsidiaries, the ‘‘AIG Group’’) beneficially owned approximately 59% of theCompany’s outstanding shares. On June 10, 2009, AIG and American Home Assurance Company(‘‘AHAC’’), a wholly owned subsidiary of AIG, consummated a secondary public offering (the ‘‘June 2009Offering’’) of 29.9 million issued and outstanding shares of the common stock of the Company owned byAIG and AHAC. On March 15, 2010, AHAC consummated another secondary public offering (the‘‘March 2010 Offering’’, and collectively with the June 2009 Offering, the ‘‘Secondary Offerings’’) of8.5 million issued and outstanding shares of the Company’s common stock owned by AHAC. TheCompany repurchased two million shares of its common stock from AHAC in the March 2010 Offeringpursuant to a stock offering agreement for an aggregate purchase price of approximately $105 million.TRH did not receive any proceeds from the Secondary Offerings. Immediately following the March 2010Offering, the AIG Group, including AHAC, beneficially owned 0.7 million shares of the Company’scommon stock (excluding shares held by certain mutual funds that are advised or managed by subsidiariesof AIG), representing approximately 1.1% of the Company’s then outstanding shares. As a result of itsreduced ownership percentage, the AIG Group was no longer considered a related party after March 15,2010. (See Note 14 for additional discussion regarding AIG’s beneficial ownership of the Company.)
TRH, through its primary operating subsidiaries TRC, TRZ and Putnam, offers reinsurance capacityfor a full range of property and casualty products to insurers and reinsurers on a treaty and facultativebasis, with an emphasis on specialty classes. Including domestic as well as international risks, TRH’sprincipal lines of business are other liability (including directors’ and officers’ liability (‘‘D&O’’), errorsand omissions liability (‘‘E&O’’) and general casualty), medical malpractice, ocean marine and aviation,auto liability (including non-standard risks), accident and health and surety and credit in the casualty lines,and fire, allied lines, auto physical damage and homeowners multiple peril lines in the property lines(which include property catastrophe risks). Casualty lines represented 70.7%, 71.3% and 69.8% of netpremiums written in 2010, 2009 and 2008, respectively. The balance represented property lines.
2. Summary of Significant Accounting Policies
(a) Basis of Presentation
The consolidated financial statements include the accounts of the Company and its majority ownedsubsidiaries. The Company consolidates subsidiaries in which it holds a controlling financial interest.Entities where the Company holds 20% to 50% of the voting rights and alternative investments in whichTRH holds a 5% or greater interest or where it has more than a minor influence over the operations of theinvestee are accounted for under the equity method.
Subsequent events through the time of filing of this Form 10-K were evaluated for potentialrecognition or disclosure in the financial statements. (See Note 21.)
The accompanying consolidated financial statements have been prepared in accordance with U.S.generally accepted accounting principles (‘‘GAAP’’). All material intercompany accounts and transactionshave been eliminated. Certain reclassifications and format changes have been made to prior years’amounts to conform to the 2010 presentation.
86
TRANSATLANTIC HOLDINGS, INC. AND SUBSIDIARIESNOTES TO CONSOLIDATED FINANCIAL STATEMENTS (Continued)
2. Summary of Significant Accounting Policies (Continued)
Correction of Amortized Cost or Cost of Certain Fixed Maturities and Equities Denominated in FunctionalCurrencies
In the first quarter of 2010, it was determined that as of December 31, 2009 the amortized cost offixed maturities and cost of equities available for sale that were denominated in functional currencies wereincorrectly translated into the reporting currency (i.e., U.S. dollars) using historical, rather thanperiod-end, foreign currency exchange rates. This practice, which began in the third quarter of 2009,resulted in an understatement of amortized cost or cost of such investments of $98.1 million ($80.1 millionrelating to fixed maturities and $18.0 million relating to equities) as of December 31, 2009. Thus, netunrealized appreciation of investments, net of tax, (a component of accumulated other comprehensiveincome (‘‘AOCI’’) on the Balance Sheet) was overstated by $63.7 million as of December 31, 2009 with anequal and offsetting overstatement of net unrealized currency translation loss, net of tax (also a componentof AOCI). The related components of other comprehensive income (loss) (‘‘OCI’’) were similarly affected,with no net effect on OCI. The error discussed above had no net effect on AOCI, stockholders’ equity, netincome, comprehensive income or cash flows for 2009.
As of December 31, 2010, the amortized cost of fixed maturities and cost of equities available for salethat are denominated in functional currencies were properly translated into the reporting currency usingperiod-end foreign currency exchange rates. However, as the correction of the treatment discussed earlieroccurred in 2010, both net unrealized depreciation of investments, net of tax, and net unrealized currencytranslation gain, net of tax, in the 2010 Statement of Comprehensive Income include $63.7 million relatedto this correction, with no net effect on OCI. In addition, this correction had no net impact on AOCI andstockholders’ equity as of December 31, 2010 nor did it have any net impact on net income, comprehensiveincome or cash flows for 2010.
This error and its related corrections did not have a material effect on 2010 or any prior period andthus prior period financial statements have not been restated.
(b) Use of Estimates
The preparation of financial statements in conformity with GAAP requires the use of estimates andassumptions that affect the reported amounts and related disclosures. TRH relies on historical experienceand on various other assumptions that it believes to be reasonable, under the circumstances, to makejudgments about the carrying values of assets and liabilities that are not readily apparent from othersources. Actual results may differ materially from these estimates.
TRH believes its most critical accounting estimates are those with respect to loss reserves, fair valuemeasurements of certain financial assets, other-than-temporary impairments (‘‘OTTI’’) of investments andpremium revenues, as they require management’s most significant exercise of judgment on both aquantitative and qualitative basis in the preparation of TRH’s consolidated financial statements andfootnotes. The accounting estimates that result require the use of assumptions about certain matters thatare highly uncertain at the time of estimation. To the extent actual experience differs from the assumptionsused, TRH’s results of operations and financial condition would be affected, possibly materially.
(c) Investments
Fixed maturities are classified as held to maturity and carried at amortized cost if TRH has thepositive intent and ability to hold each of these securities to maturity. When TRH does not have thepositive intent to hold fixed maturities to maturity, such fixed maturities are classified as available for saleand carried at fair value. Premiums and discounts arising from the purchase of fixed maturities are treated
87

TRANSATLANTIC HOLDINGS, INC. AND SUBSIDIARIESNOTES TO CONSOLIDATED FINANCIAL STATEMENTS (Continued)
2. Summary of Significant Accounting Policies (Continued)
as yield adjustments over their estimated lives, until maturity or call date, if applicable. Equities are carriedat fair value. See Note 3 for TRH’s methodology for determining the fair value of its investments.
Other invested assets primarily include alternative investments in which TRH holds a 5% or greaterinterest or where TRH has more than a minor influence over operations of the investee and TRH’s 40%interest in Kuwait Reinsurance Company (K.S.C.). Such investments are accounted for on the equitymethod. In applying the equity method of accounting, TRH consistently uses the most recently availablefinancial information for each of these investments for the period ended one to three months prior to theend of TRH’s reporting period. The financial statements of these investees are generally audited on anannual basis. The carrying value of such investments represents TRH’s share of the net asset value of theseentities. The changes in such net asset values for investments carried on the equity method, other than theportion related to TRH’s share of the investees’ changes in AOCI, are recorded in net investment income.In each of 2010 and 2009, the fair value option was elected for one investment. These investments arecarried at fair value and unrealized gains and losses on these investments are reported in earnings throughnet investment income.
Short-term investments are carried at cost or amortized cost, which approximates fair value, andprincipally include money market instruments, treasury bills and commercial paper.
Through 2008, TRH participated in a securities lending program (the ‘‘Securities Lending Program’’)managed by a subsidiary of AIG, whereby certain securities (principally fixed maturities available for sale)from its portfolio were loaned to third parties. Under such program, TRH loaned securities tocounterparties and received collateral, generally cash, which was invested to earn a spread. The collateralwas returned to the counterparties when the loaned securities were returned to TRH at a future date. Inthe fourth quarter of 2008, TRH terminated its participation in the Securities Lending Program.
Prior to the fourth quarter of 2008, the transfers of securities in exchange for collateral under theSecurities Lending Program were accounted for as secured borrowings. Securities lending investedcollateral was shown on the balance sheet at fair value. A liability was recorded in an amount equal to thecollateral received, reflecting TRH’s obligation to return the collateral when the loaned securities werereturned. Income earned on invested collateral, net of interest payable to the collateral provider, wasincluded in net investment income. As a result of conditions affecting the financial and credit markets, inthe fourth quarter of 2008, counterparties were successful in negotiating significantly reduced collaterallevels (i.e., collateral received as a percentage of the fair value of the security loaned). Due to the lowercollateral levels, during the fourth quarter of 2008, many of such loaned securities were accounted for assales at the time of transfer and as purchases when the securities were subsequently returned.
Unrealized gains and losses from fixed maturities available for sale, equities available for sale andother invested assets, are reported as a separate component of AOCI, net of deferred income taxes, instockholders’ equity. Investments in fixed maturities and equities are recorded on a trade date basis.
Each quarter, TRH evaluates its investments for OTTI. See Note 4(g) for the criteria TRH uses toevaluate if an investment is a candidate for OTTI.
In periods subsequent to the recognition of OTTI on fixed maturity securities, which are not creditrelated, TRH generally accretes the discount or amortizes the reduced premium resulting from thereduction in cost basis into income over the remaining life of the security.
88

TRANSATLANTIC HOLDINGS, INC. AND SUBSIDIARIESNOTES TO CONSOLIDATED FINANCIAL STATEMENTS (Continued)
2. Summary of Significant Accounting Policies (Continued)
(d) Cash and Cash Equivalents
Cash and cash equivalents, which are principally interest-bearing, generally include cash deposited indemand deposits at banks and highly liquid investments with original maturities of 90 days or less.
(e) Deferred Income Taxes
Deferred tax assets and liabilities are recorded for the effects of temporary differences between thetax basis of an asset or liability and its reported amount in the consolidated financial statements. TRHassesses its ability to realize deferred tax assets considering all available evidence including earningshistory, the timing, character and amount of future earnings potential, the reversal of taxable temporarydifferences and the tax planning strategies available to legal entities when recognizing deferred tax assets.See Note 5 for further discussion of income taxes.
(f) Unearned Premiums and Premium Revenues
In recent years, premiums from treaty contracts have approximated 97% of net premiums written,while facultative contracts have approximated 3%. For pro rata treaty contracts, premiums written andearned are based on reports received from ceding companies. For excess-of-loss treaty contracts, premiumsare generally recorded as written based on contract terms. Premiums are earned ratably over the term ofthe related coverages. Unearned premiums and prepaid reinsurance premiums represent the portion ofgross premiums written and ceded premiums written, respectively, relating to the unexpired terms of suchcoverages. Premiums written and earned, along with related costs, for which data has not been reported bythe ceding companies, are estimated based on historical patterns and other relevant information. Theseestimates can be subject to change when actual data for such estimated items becomes available. In theConsolidated Statements of Operations, premiums written and earned and the change in unearnedpremiums are presented net of reinsurance ceded.
(g) Net Investment Income
Net investment income consists primarily of:
• Interest income from fixed maturities, as well as amortization and accretion of premiums anddiscounts on fixed maturities
• Dividend income and distributions from common and preferred stock and other investments whenreceivable
• Earnings from investments accounted for under the equity method• Less expenses related to investments
(h) Realized Net Capital Gains and Losses
Realized capital gains and losses principally emanate from the following sources:
• Sales and redemptions of fixed maturities, equities, securities lending invested collateral andalternative investments
• Reductions to the cost basis of fixed maturities, equity securities, securities lending investedcollateral and other invested assets (except for where the fair value option has been elected) forOTTI which are recognized through earnings
• Exchange gains and losses resulting from foreign currency transactions
89

TRANSATLANTIC HOLDINGS, INC. AND SUBSIDIARIESNOTES TO CONSOLIDATED FINANCIAL STATEMENTS (Continued)
2. Summary of Significant Accounting Policies (Continued)
(i) Losses and Loss Adjustment Expenses (‘‘LAE’’)
Unpaid losses and LAE (‘‘gross loss reserves’’) are principally based on reports and individual caseestimates received from ceding companies. The incurred but not reported (‘‘IBNR’’) portion of gross lossreserves is based on past experience and other factors. The methods used to determine such estimates andto establish the resulting reserves are continually reviewed and updated. Any adjustments are reflected inincome currently. Net losses and LAE incurred consists of the estimated ultimate cost of settling claimsincurred within the reporting period (net of related reinsurance recoverable), including IBNR claims, pluschanges in estimates of prior period losses.
The estimation of loss reserves is inherently difficult and subjective, especially in view of changinglegal and economic environments which impact the development of loss reserves, and thereforequantitative techniques frequently have to be supplemented by subjective considerations and managerialjudgment. In addition, trends that have affected development of liabilities in the past may not necessarilyoccur or affect liability development to the same degree in the future.
While the reserving process is difficult for ceding companies, the inherent uncertainties of estimatingloss reserves are even greater for reinsurers, due primarily to the longer-term nature of much reinsurancebusiness, the diversity of development patterns among different types of reinsurance treaties or facultativecontracts, the necessary reliance on the ceding companies for information regarding reported claims anddiffering reserving practices among ceding companies, which can be subject to change without notice. TRHwrites a significant amount of non-proportional assumed casualty reinsurance as well as proportionalassumed reinsurance of excess liability business for classes such as medical malpractice, D&O, E&O andgeneral casualty. Claims from such classes can exhibit greater volatility over time than most other classesdue to their low frequency, high severity nature and loss cost trends that are more difficult to predict.
Losses and loss adjustment expenses net of related reinsurance recoverable (‘‘net loss reserves’’)include amounts for risks relating to environmental impairment and asbestos-related illnesses. Themajority of TRH’s environmental and asbestos-related net loss reserves arose from contracts entered intoafter 1985 that were underwritten specifically as environmental or asbestos-related coverages rather thanfrom standard general liability coverages, where the environmental or asbestos-related liabilities wereneither clearly defined nor specifically excluded. The reserves carried at December 31, 2010 and 2009 forsuch claims, including the IBNR portion, are based upon known facts and current law at the respectivebalance sheet dates. However, significant uncertainty exists in determining the amount of ultimate liabilityfor environment impairment and asbestos-related losses, particularly for those occurring in 1985 and prior.This uncertainty is due to inconsistent court resolutions and judicial interpretations with respect tounderlying policy intent and coverage and uncertainties as to the allocation of responsibility for resultantdamages, among other things. Further, there is always the possibility of changes in statutes, laws,regulations and other factors that could have a material effect on these liabilities and, accordingly, futureearnings.
(j) Currency Translation
Assets and liabilities denominated in foreign currencies are translated into U.S. dollars at period-endexchange rates. Income and expense accounts are translated at average exchange rates for the year. Theresulting unrealized currency translation gain (loss) for functional currencies is recorded, net of tax, inAOCI, a component of stockholders’ equity.
Transaction gains and losses on assets and liabilities denominated in foreign currencies are recordedas a component of realized net capital gains (losses) during the period in which they occur.
90

TRANSATLANTIC HOLDINGS, INC. AND SUBSIDIARIESNOTES TO CONSOLIDATED FINANCIAL STATEMENTS (Continued)
2. Summary of Significant Accounting Policies (Continued)
(k) Recently Adopted Accounting Standards
(1) Adoption of new accounting guidance on OTTI
In April 2009, the Financial Accounting Standards Board (‘‘FASB’’) issued new accountingguidance on OTTI. This guidance amended prior OTTI guidance for fixed maturities to make it moreoperational and to improve presentation and disclosure of OTTI on fixed maturity and equitysecurities in the financial statements. This guidance also requires recognition of OTTI on a fixedmaturity in an unrealized loss position if (a) an entity intends to sell the security; (b) it is more likelythan not the entity will be required to sell the security prior to an anticipated recovery in fair value inorder to meet a liquidity, regulatory or other business need; or (c) an entity determines it will notrecover the entire amortized cost basis of the security. If an impaired fixed maturity security isdesignated for sale, or if it is more likely than not it will have to be sold, the total amount of theunrealized loss position is recognized in earnings as a realized capital loss.
For all other impaired fixed maturities, this guidance requires entities to develop a best estimateof the present value of expected cash flows on a security by security basis. Entities must recognizeOTTI equal to the difference between the present value of expected cash flows and the amortized costbasis of the security, if the results of the cash flow analysis indicate the entity will not recover the fullamount of its amortized cost basis in the investment. This amount is the credit component of theOTTI and is recorded in earnings as a realized capital loss. The difference between the totalunrealized loss position on the security and the OTTI amount recognized in earnings is non-creditrelated and is recorded in OCI as ‘‘net unrealized holding losses of fixed maturities on whichother-than-temporary impairments were taken’’.
TRH adopted this guidance effective April 1, 2009. Upon adoption, this guidance requiredentities to assess the credit versus non-credit components of previously recognized OTTI on fixedmaturities still held, and for which the entity did not intend to sell or more likely than not would notbe required to sell prior to an anticipated recovery in fair value. The cumulative amount of non-creditrelated OTTI amounts on these securities, net of income tax effect, was recorded as an increase toretained earnings and an equal and offsetting reduction to AOCI as of April 1, 2009, with no netchange to total stockholders’ equity. TRH recorded a cumulative effect adjustment (‘‘CEA’’) of$110.1 million, or $71.6 million, net of tax, related to its adoption of this guidance. The adoption ofthis guidance did not have a material effect on TRH’s consolidated financial condition, results ofoperations, comprehensive income or cash flows.
(2) Adoption of new accounting guidance on subsequent events (Accounting Standards Update(‘‘ASU’’) 2010-09)
In February 2010, the FASB issued an amendment to certain recognition and disclosurerequirements on subsequent events. An entity that is a Securities and Exchange Commission filer isrequired to evaluate subsequent events through the date that the financial statements are issued. Theentity is not required to disclose the date through which subsequent events have been evaluated.
TRH adopted this guidance in the first quarter of 2010. The adoption of this guidance had noeffect on TRH’s consolidated financial condition, results of operations or cash flows.
(3) Adoption of new accounting guidance on disclosures about fair value measurements (ASU2010-06)
91

TRANSATLANTIC HOLDINGS, INC. AND SUBSIDIARIESNOTES TO CONSOLIDATED FINANCIAL STATEMENTS (Continued)
2. Summary of Significant Accounting Policies (Continued)
In January 2010, the FASB issued new accounting guidance on disclosures about fair valuemeasurements. This guidance requires the amounts and reasons for significant transfers in and out ofLevels 1 and 2 to be discussed. In addition, a greater level of disaggregation of asset and liabilityclasses is required in fair value measurement disclosures. For fair value measurements that fall ineither Level 2 or Level 3, a reporting entity should provide disclosures about the valuation techniquesand inputs used to measure fair value for both recurring and nonrecurring fair value measurements.TRH adopted this portion of the guidance in the first quarter of 2010. The adoption of this guidancehad no effect on TRH’s consolidated financial condition, results of operations or cash flows.
In addition, for activity within Level 3, this guidance requires that purchases, sales, issuances andsettlements be presented separately rather than as one net amount, as currently permitted. For TRH,these disclosures are effective for interim and annual periods beginning after December 15, 2010. Theadoption of this guidance is expected to have no effect on TRH’s results of operations, financialcondition or cash flows.
(4) Adoption of new accounting guidance on the consolidation of variable interest entities (‘‘VIE’’)(ASU 2009-17)
In June 2009, the FASB issued new accounting guidance on the consolidation of VIE. Thisguidance makes significant changes to an enterprise’s analysis to determine whether the enterprise’svariable interest or interests give it a controlling financial interest in a VIE. This guidance replaces thequantitative-based risks and rewards calculation for determining which enterprise, if any, has acontrolling financial interest in a VIE with an approach focused on identifying which enterprise hasthe power to direct the activities of a VIE that most significantly impacts the entity’s economicperformance and the obligation to absorb losses of the entity or the right to receive benefits from theentity. Additionally, this guidance adds an additional reconsideration event for determining whetheran entity is a VIE, requires ongoing assessments of whether an enterprise is the primary beneficiary ofa VIE and requires additional disclosures about an enterprise’s involvement in the VIE. TRH adoptedthis guidance in the first quarter of 2010 with its provisions applied prospectively. The adoption of thisguidance did not have a material effect on TRH’s consolidated financial condition, results ofoperations or cash flows.
(5) Adoption of new accounting guidance on accounting for transfers of financial assets (ASU2009-16)
In June 2009, the FASB issued new accounting guidance on accounting for transfers of financialassets. This guidance changes financial reporting for transfers of financial assets by eliminating theexceptions for qualifying special purpose entities from the consolidation guidance and the exceptionthat permitted sale accounting for certain mortgage securitizations when a transferor has notsurrendered control over the transferred financial assets. In addition, comparability and consistency inaccounting for transferred financial assets will be improved through clarifications of the requirementsfor isolation and limitations on portions of financial assets that are eligible for sale accounting. Thisguidance requires enhanced disclosures about the risks that a transferor continues to be exposed tobecause of its continuing involvement in transferred financial assets. Also, this guidance clarifies andimproves certain prior accounting provisions that have resulted in inconsistencies in application.
TRH adopted this guidance in the first quarter of 2010 with its provisions applied prospectively.The adoption of this guidance did not have a material effect on TRH’s consolidated financialcondition, results of operations or cash flows.
92
TRANSATLANTIC HOLDINGS, INC. AND SUBSIDIARIESNOTES TO CONSOLIDATED FINANCIAL STATEMENTS (Continued)
2. Summary of Significant Accounting Policies (Continued)
(6) Adoption of new accounting standard on disclosures about the credit quality of financingreceivables and the allowance for credit losses (ASU 2010-20)
In July 2010, the FASB issued new accounting guidance on disclosures about the credit quality offinancing receivables and the allowance for credit losses. This guidance requires additional disclosuresto facilitate the evaluation of the nature of an entity’s credit risk and the determination of and changesin the entity’s allowance for credit losses. TRH adopted this guidance in the fourth quarter of 2010.The adoption of this guidance had no effect on TRH’s consolidated financial condition, results ofoperations or cash flows.
(7) Future Application of Accounting Standards
In October 2010, the FASB issued new accounting guidance on accounting for costs associatedwith acquiring or renewing insurance contracts (ASU 2010-26). This guidance specifies thatincremental direct costs of contract acquisition and certain costs directly related to certain acquisitionactivities performed by the insurer for the contract should be capitalized. All other acquisition-relatedcosts should be charged to expense as incurred.
For TRH, this guidance is effective for fiscal years, and interim periods within those fiscal years,beginning after December 15, 2011 and shall be applied prospectively. TRH does not currently expectthe implementation of this guidance to be material to TRH’s consolidated financial condition, resultsof operations or cash flows.
3. Fair Value Measurements
(a) Fair Value Measurements on a Recurring Basis
TRH measures at fair value on a recurring basis financial instruments included principally in itsavailable for sale securities portfolios and certain short-term investments. The fair value of a financialinstrument is the amount that would be received to sell an asset or settle a liability in an orderly transactionbetween willing, able and knowledgeable market participants at the measurement date.
The degree of judgment used in measuring the fair value of financial instruments generally correlateswith the level of pricing observability. Financial instruments with quoted prices in active markets generallyhave more pricing observability and less judgment is used in measuring fair value. Conversely, financialinstruments traded in other-than-active markets or that do not have quoted prices have less observabilityand are measured at fair value using valuation models or other pricing techniques that require morejudgment. An active market is one in which transactions for the asset being valued occurs with sufficientfrequency and volume to provide pricing information on an ongoing basis. An other-than-active market isone in which there are few transactions, the prices are not current, price quotations vary substantiallyeither over time or among market makers, or in which little information is released publicly for the assetbeing valued. Pricing observability is affected by a number of factors, including the type of financialinstrument, whether the financial instrument is new to the market and not yet established, thecharacteristics specific to the transaction and general market conditions.
TRH management is responsible for the determination of the value of the financial assets and thesupporting methodologies and assumptions. With respect to securities, TRH employs independent thirdparty valuation service providers to gather, analyze and interpret market information and derive fair valuesbased upon relevant methodologies and assumptions for individual instruments. When TRH’s valuationservice providers are unable to obtain sufficient market observable information upon which to estimate thefair value for a particular security, fair value is determined either by requesting from brokers who are
93

TRANSATLANTIC HOLDINGS, INC. AND SUBSIDIARIESNOTES TO CONSOLIDATED FINANCIAL STATEMENTS (Continued)
3. Fair Value Measurements (Continued)
knowledgeable about these securities to provide a quote, which is generally non-binding, or by employingwidely accepted internal valuation models.
Valuation service providers typically obtain data about market transactions and other key valuationmodel inputs from multiple sources and, through the use of widely accepted internal valuation models,provide a single fair value measurement for individual securities for which a fair value has been requestedunder the terms of service agreements. The inputs used by the valuation service providers include, but arenot limited to, market prices from recently completed transactions and transactions of comparablesecurities, interest rate yield curves, credit spreads, currency rates, and other market observableinformation, as applicable. The valuation models take into account, among other things, market observableinformation as of the measurement date as well as the specific attributes of the security being valuedincluding its term, interest rate, credit rating, industry sector, and when applicable, collateral quality andother issue or issuer specific information. When market transactions or other market observable data islimited, the extent to which judgment is applied in determining fair value is greatly increased.
TRH employs specific control processes to determine the reasonableness of the fair values of TRH’sfinancial assets. TRH’s processes are designed to ensure that the values received or internally estimatedare accurately recorded and that the data inputs and the valuation techniques utilized are appropriate,consistently applied, and that the assumptions are reasonable and consistent with the objective ofdetermining fair value. TRH assesses the reasonableness of individual security values received fromvaluation service providers through various analytical techniques. In addition, TRH may validate thereasonableness of fair values by comparing information obtained from TRH’s valuation service providersto other third party valuation sources for selected securities. TRH also validates prices obtained frombrokers for selected securities through reviews by those who have relevant expertise and who areindependent of those charged with executing investing transactions.
A further discussion of the most significant categories of investments carried at fair value on arecurring basis follows:
(1) Fixed Maturity and Equity Securities Available for Sale
TRH maximizes the use of observable inputs and minimizes the use of unobservable inputs whenmeasuring fair value. Whenever available, TRH obtains quoted prices in active markets for identicalassets at the balance sheet date to measure at fair value fixed maturity and marketable equitysecurities in its available for sale portfolios. Market price data generally are obtained from exchangeor dealer markets.
TRH estimates the fair value of fixed maturity securities not traded in active markets by referringto traded securities with similar attributes, using dealer quotations and matrix pricing methodologies,discounted cash flow analyses or internal valuation models. This methodology considers such factorsas the issuer’s industry, the security’s rating and tenor, its coupon rate, its position in the capitalstructure of the issuer, yield curves, credit curves, prepayment rates and other relevant factors. Forfixed maturity securities that are not traded in active markets or that are subject to transferrestrictions, valuations are adjusted to reflect illiquidity and/or non-transferability, and suchadjustments generally are based on available market evidence. In the absence of such evidence,management’s best estimate is used.
Fair values for fixed maturity securities based on observable market prices for identical or similarinstruments implicitly include the incorporation of counterparty credit risk. Fair values for fixedmaturity securities based on internal models would incorporate counterparty credit risk by using
94

TRANSATLANTIC HOLDINGS, INC. AND SUBSIDIARIESNOTES TO CONSOLIDATED FINANCIAL STATEMENTS (Continued)
3. Fair Value Measurements (Continued)
discount rates that take into consideration cash issuance spreads for similar instruments or otherobservable information.
(2) Certain Short-Term Investments
Short-term investments are carried at cost or amortized cost, which approximates fair value, andprincipally include money market instruments, treasury bills and commercial paper. Theseinstruments are typically not traded in active markets; however, their fair values are based on marketobservable inputs.
(b) Fair Value Measurements on a Non-Recurring Basis
TRH also measures the fair value of certain assets on a non-recurring basis, generally quarterly,annually, or when events or changes in circumstances indicate that the carrying amount of the asset maynot be recoverable. These assets primarily include held-to-maturity fixed maturities, which are carried onthe balance sheet at amortized cost, and equity method investments. When TRH determines that thecarrying value of these assets may not be recoverable, TRH records the assets at fair value with the lossrecognized in income as a realized capital loss. In such cases, TRH measures the fair value of these assetsusing the techniques discussed above for fixed maturity and equity securities.
(c) Fair Value Hierarchy
Assets recorded at fair value in the consolidated balance sheet are measured and classified in ahierarchy for disclosure purposes consisting of three levels based on the observability of inputs available inthe marketplace used to measure the fair values as discussed below:
• Level 1: Fair value measurements that are quoted prices (unadjusted) in active markets that TRHhas the ability to access for identical assets. Market price data generally is obtained from exchangeor dealer markets. Assets measured at fair value on a recurring basis and classified as Level 1principally include actively traded listed common stocks and mutual funds (which are included onthe balance sheet in equities available for sale).
• Level 2: Fair value measurements based on inputs other than quoted prices included in Level 1that are observable for the asset, either directly or indirectly. Level 2 inputs include quoted pricesfor similar assets in active markets and inputs other than quoted prices that are observable for theasset, such as interest rates and yield curves that are observable at commonly quoted intervals.Assets measured at fair value on a recurring basis and classified as Level 2 generally include mostgovernment and government agency securities, state, municipal and political subdivisionobligations, most investment-grade and high-yield corporate bonds, most residential mortgage-backed securities (‘‘RMBS’’), most commercial mortgage-backed securities (‘‘CMBS’’), certainother asset-backed securities and most short-term investments.
• Level 3: Fair value measurements based on valuation techniques that use significant inputs thatare unobservable. These measurements may be made under circumstances in which there is little, ifany, market activity for the asset. TRH’s assessment of the significance of a particular input to thefair value measurement in its entirety requires judgment. In making the assessment, TRH considersfactors specific to the asset. In certain cases, the inputs used to measure fair value may fall intodifferent levels of the fair value hierarchy. In such cases, the level in the fair value hierarchy withinwhich the fair value measurement in its entirety falls is determined based on the lowest level inputthat is significant to the fair value measurement in its entirety. Assets measured at fair value on a
95

TRANSATLANTIC HOLDINGS, INC. AND SUBSIDIARIESNOTES TO CONSOLIDATED FINANCIAL STATEMENTS (Continued)
3. Fair Value Measurements (Continued)
recurring basis and classified as Level 3 principally include certain RMBS, CMBS, other-assetbacked securities and other invested assets.
(d) Assets Measured at Fair Value on a Recurring Basis
The following table presents information about assets measured at fair value on a recurring basis atDecember 31, 2010 and 2009 and indicates the level of the fair value measurement based on the levels ofthe inputs used:
Level 1 Level 2 Level 3 Total
(in millions)
As of December 31, 2010Assets(1):
Fixed maturities available for sale:U.S. Government and government agencies . . . . . . . . . . $ — $ 890.2 $ — $ 890.2States, municipalities and political subdivisions . . . . . . . . — 4,841.6 — 4,841.6Foreign governments . . . . . . . . . . . . . . . . . . . . . . . . . . . — 800.5 0.8 801.3Corporate . . . . . . . . . . . . . . . . . . . . . . . . . . . . . . . . . . . — 3,688.9 6.5 3,695.4Asset-backed:
RMBS . . . . . . . . . . . . . . . . . . . . . . . . . . . . . . . . . . . — 217.8 26.7 244.5CMBS . . . . . . . . . . . . . . . . . . . . . . . . . . . . . . . . . . . — 158.8 91.2 250.0Other asset-backed . . . . . . . . . . . . . . . . . . . . . . . . . . — 85.9 13.4 99.3
Total fixed maturities available for sale . . . . . . . . . . — 10,683.7 138.6 10,822.3Equities available for sale . . . . . . . . . . . . . . . . . . . . . . . . . 559.5 — 5.0 564.5Other invested assets(2) . . . . . . . . . . . . . . . . . . . . . . . . . . . — — 86.4 86.4Short-term investments(3) . . . . . . . . . . . . . . . . . . . . . . . . . — 120.2 — 120.2Total . . . . . . . . . . . . . . . . . . . . . . . . . . . . . . . . . . . . . . . . $559.5 $10,803.9 $230.0 $11,593.4
As of December 31, 2009Assets(1):
Fixed maturities available for sale:U.S. Government and government agencies . . . . . . . . . . $ — $ 528.8 $ — $ 528.8States, municipalities and political subdivisions . . . . . . . . — 5,668.8 — 5,668.8Foreign governments . . . . . . . . . . . . . . . . . . . . . . . . . . . — 552.1 1.4 553.5Corporate . . . . . . . . . . . . . . . . . . . . . . . . . . . . . . . . . . . — 2,317.1 — 2,317.1Asset-backed:
RMBS . . . . . . . . . . . . . . . . . . . . . . . . . . . . . . . . . . . — 239.9 18.6 258.5CMBS . . . . . . . . . . . . . . . . . . . . . . . . . . . . . . . . . . . — 60.5 32.7 93.2Other asset-backed . . . . . . . . . . . . . . . . . . . . . . . . . . — 17.3 17.6 34.9
Total fixed maturities available for sale . . . . . . . . . . — 9,384.5 70.3 9,454.8Equities available for sale . . . . . . . . . . . . . . . . . . . . . . . . . 481.5 17.6 7.5 506.6Other invested assets(2) . . . . . . . . . . . . . . . . . . . . . . . . . . . — — 72.2 72.2Short-term investments(3) . . . . . . . . . . . . . . . . . . . . . . . . . — 846.3 — 846.3Total . . . . . . . . . . . . . . . . . . . . . . . . . . . . . . . . . . . . . . . . $481.5 $10,248.4 $150.0 $10,879.9
(1) Represents only items measured at fair value.(2) Primarily private equities.(3) Short-term investments in Level 2 are carried at cost or amortized cost which approximates fair value.
96

TRANSATLANTIC HOLDINGS, INC. AND SUBSIDIARIESNOTES TO CONSOLIDATED FINANCIAL STATEMENTS (Continued)
3. Fair Value Measurements (Continued)
In 2010, there were no transfers in or out of Level 1, $64.2 million of transfers into Level 2 fromLevel 3 and $10.8 million of transfers out of Level 2 into Level 3. In 2009, there were no transfers in or outof Level 1, $14.2 million of transfers into Level 2 from Level 3 and $39.5 million of transfers out of Level 2into Level 3. The transfers into Level 2 from Level 3 in 2010 were due to an increase in observable inputsrelated to the valuation of such securities. No other transfers in 2010 and 2009 were significant.
At December 31, 2010 and 2009, Level 3 assets totaled $230.0 million and $150.0 million, respectively,representing 2.0% and 1.4%, respectively, of total assets measured at fair value on a recurring basis.
Both observable and unobservable inputs may be used to determine the fair values of positionsclassified in Level 3. As a result, the unrealized gains and losses on instruments held at December 31, 2010and 2009 may include changes in fair value that were attributable to both observable inputs (e.g., changesin market interest rates) and unobservable inputs (e.g., changes in unobservable long-dated volatilities).
Net unrealized depreciation related to Level 3 investments approximated $6.7 million and$23.9 million at December 31, 2010 and 2009, respectively.
The following tables present analyses of the changes during 2010 and 2009 in Level 3 assets measuredat fair value on a recurring basis:
Purchases,Net realized/unrealized sales,gains (losses) included in: issuancesBalance, Net Realized and Transfers
beginning investment net capital settlements, in (out) of Balance,of year income losses(1) AOCI net Level 3 end of year
(in millions)
2010Fixed maturities available for sale:
Foreign governments . . . . . . . . . . . $ 1.4 $ — $ — $ 0.2 $ (1.6) $ 0.8 $ 0.8Corporate . . . . . . . . . . . . . . . . . . . — — — — 6.5 — 6.5Asset-backed:
RMBS . . . . . . . . . . . . . . . . . . . . 18.6 0.7 (6.1) 14.0 (5.9) 5.4 26.7CMBS . . . . . . . . . . . . . . . . . . . . 32.7 (1.1) — 12.2 83.2 (35.8) 91.2Other asset-backed . . . . . . . . . . . 17.6 0.2 — 2.6 16.8 (23.8) 13.4
Equities available for sale . . . . . . . . . 7.5 — — — (2.5) — 5.0Other invested assets(2) . . . . . . . . . . . 72.2 3.0 — (0.6) 4.5 7.3 86.4Other assets . . . . . . . . . . . . . . . . . . . — — (2.4) — 2.4 — —
Total . . . . . . . . . . . . . . . . . . . $150.0 $ 2.8 $(8.5) $28.4 $103.4 $(46.1) $230.0
(1) There were $6.1 million of OTTI related to RMBS fixed maturities available for sale that was recorded in realized net capitallosses in 2010 on instruments still held at December 31, 2010.
(2) Primarily private equities.
97

TRANSATLANTIC HOLDINGS, INC. AND SUBSIDIARIESNOTES TO CONSOLIDATED FINANCIAL STATEMENTS (Continued)
3. Fair Value Measurements (Continued)
Net realized/unrealized Purchases,gains (losses) included in: sales,Realized issuances
Balance, Net net capital and Transfersbeginning investment gains settlements, in (out) of Balance,
of year income (losses)(1) AOCI net Level 3 end of year
(in millions)
2009Fixed maturities available for sale:
States, municipalities and politicalsubdivisions . . . . . . . . . . . . . . . . $ — $ — $ — $ 0.1 $ 11.4 $(11.5) $ —
Foreign governments . . . . . . . . . . . 0.7 — 0.1 (0.1) (0.7) 1.4 1.4Asset-backed:
RMBS . . . . . . . . . . . . . . . . . . . 35.1 3.2 (10.9) 10.8 (22.7) 3.1 18.6CMBS . . . . . . . . . . . . . . . . . . . . 36.7 (0.3) (14.5) 26.1 (33.3) 18.0 32.7Other asset-backed . . . . . . . . . . 12.9 1.6 (2.8) 0.1 (3.5) 9.3 17.6
Equities available for sale . . . . . . . . . 2.5 — — — — 5.0 7.5Other invested assets(2) . . . . . . . . . . . 33.2 14.9 — (0.9) 25.0 — 72.2Other assets . . . . . . . . . . . . . . . . . . . — — (5.3) — 5.3 — —
Total . . . . . . . . . . . . . . . . . . . $121.1 $19.4 $(33.4) $36.1 $(18.5) $ 25.3 $150.0
(1) There were $1.7 million of OTTI related to RMBS fixed maturities available for sale that was recorded in realized net capitallosses in 2009 on instruments still held at December 31, 2009.
(2) Primarily private equities.
(e) Assets Measured at Fair Value on a Non-Recurring Basis
None of TRH’s assets were written down to fair value on a non-recurring basis during 2010 and 2009.
4. Investments
(a) Statutory Deposits
Investments with carrying values of $574 million and $606 million at December 31, 2010 and 2009,respectively, were deposited with governmental authorities as required by law. The substantial majority ofthese deposits are fixed maturities and common stocks available for sale.
98

TRANSATLANTIC HOLDINGS, INC. AND SUBSIDIARIESNOTES TO CONSOLIDATED FINANCIAL STATEMENTS (Continued)
4. Investments (Continued)
(b) Gross Unrealized Gains and Losses
The amortized cost and fair value of fixed maturities at December 31, 2010 and 2009 are summarizedas follows:
Gross Unrealized
Amortized Cost Gains Losses Fair Value OTTI(1)
(in thousands)
2010Fixed maturities held to maturity and carried
at amortized cost:States, municipalities and political
subdivisions . . . . . . . . . . . . . . . . . . . . . $ 1,189,801 $ 54,641 $ (3,764) $ 1,240,678 $ —
Fixed maturities available for sale and carriedat fair value:U.S. Government and government agencies $ 880,872 $ 12,680 $ (3,327) $ 890,225 $ —States, municipalities and political
subdivisions . . . . . . . . . . . . . . . . . . . . . 4,785,607 119,890 (63,858) 4,841,639 —Foreign governments . . . . . . . . . . . . . . . . 790,710 11,248 (650) 801,308 —Corporate . . . . . . . . . . . . . . . . . . . . . . . . 3,637,033 83,360 (25,041) 3,695,352 (386)Asset-backed:
RMBS . . . . . . . . . . . . . . . . . . . . . . . . . 285,431 525 (41,416) 244,540 (113,820)CMBS . . . . . . . . . . . . . . . . . . . . . . . . . 248,258 7,850 (6,117) 249,991 —Other asset-backed . . . . . . . . . . . . . . . . 99,806 812 (1,337) 99,281 —
Total . . . . . . . . . . . . . . . . . . . . . . . . . $10,727,717 $236,365 $(141,746) $10,822,336 $(114,206)
2009Fixed maturities held to maturity and carried
at amortized cost:States, municipalities and political
subdivisions . . . . . . . . . . . . . . . . . . . . . $ 1,214,238 $ 59,959 $ (2,800) $ 1,271,397 $ —
Fixed maturities available for sale and carriedat fair value:U.S. Government and government agencies $ 528,290 $ 3,414 $ (2,896) $ 528,808 $ —States, municipalities and political
subdivisions . . . . . . . . . . . . . . . . . . . . . 5,513,019 189,987 (34,178) 5,668,828 —Foreign governments . . . . . . . . . . . . . . . . 543,011 18,876 (8,346) 553,541 —Corporate . . . . . . . . . . . . . . . . . . . . . . . . 2,228,438 120,554 (31,951) 2,317,041 (386)Asset-backed:
RMBS . . . . . . . . . . . . . . . . . . . . . . . . . 334,226 707 (76,488) 258,445 (107,107)CMBS . . . . . . . . . . . . . . . . . . . . . . . . . 99,436 6,836 (13,081) 93,191 —Other asset-backed . . . . . . . . . . . . . . . . 35,514 1,006 (1,602) 34,918 —
Total . . . . . . . . . . . . . . . . . . . . . . . . . $ 9,281,934 $341,380 $(168,542) $ 9,454,772 $(107,493)
(1) Represents the non-credit portion of OTTI, not adjusted for subsequent changes in unrealized gains or losses, taken onsecurities still held as of year-end (including the pre-tax CEA, see Note 2(k)), pursuant to accounting guidance adopted onApril 1, 2009. See Note 2(k) for additional information.
99

TRANSATLANTIC HOLDINGS, INC. AND SUBSIDIARIESNOTES TO CONSOLIDATED FINANCIAL STATEMENTS (Continued)
4. Investments (Continued)
At December 31, 2010 and 2009, net unrealized appreciation (depreciation) of equities available forsale included gross gains of $92.5 million and $67.8 million, respectively, and gross losses of ($4.5) millionand ($2.1) million, respectively. (See Note 2(a) of Notes to Consolidated Financial Statements.)
(c) Contractual Maturities of Fixed Maturities
The amortized cost and fair value of fixed maturities at December 31, 2010 by contractual maturityare as follows. Expected maturities may differ from contractual maturities because borrowers may have theright to call or prepay obligations with or without call or prepayment penalties. Investments in fixedmaturities exclude short-term investments.
AmortizedCost Fair Value
(in thousands)
Fixed maturities held to maturity:Due after one year through five years . . . . . . . . . . . . . . . . . . . . . . . . $ 55,500 $ 60,665Due after five years through ten years . . . . . . . . . . . . . . . . . . . . . . . . 254,486 266,205Due after ten years . . . . . . . . . . . . . . . . . . . . . . . . . . . . . . . . . . . . . . 879,815 913,808
Total . . . . . . . . . . . . . . . . . . . . . . . . . . . . . . . . . . . . . . . . . . . . . . . $ 1,189,801 $ 1,240,678
Fixed maturities available for sale:Non-asset-backed:
Due in one year or less . . . . . . . . . . . . . . . . . . . . . . . . . . . . . . . . . . . $ 361,122 $ 363,335Due after one year through five years . . . . . . . . . . . . . . . . . . . . . . . . 3,347,151 3,403,966Due after five years through ten years . . . . . . . . . . . . . . . . . . . . . . . . 2,292,235 2,367,399Due after ten years . . . . . . . . . . . . . . . . . . . . . . . . . . . . . . . . . . . . . . 4,093,714 4,093,824
Asset-backed(1) . . . . . . . . . . . . . . . . . . . . . . . . . . . . . . . . . . . . . . . . . . . 633,495 593,812
Total . . . . . . . . . . . . . . . . . . . . . . . . . . . . . . . . . . . . . . . . . . . . . . . $10,727,717 $10,822,336
(1) Asset-backed fixed maturities by their nature do not generally have single maturity dates.
(d) Net Investment Income
An analysis of net investment income follows:
Years Ended December 31,
2010 2009 2008
(in thousands)
Fixed maturities . . . . . . . . . . . . . . . . . . . . . . . . . . . . . . . . . . . . . . . $449,134 $424,075 $427,620Equities . . . . . . . . . . . . . . . . . . . . . . . . . . . . . . . . . . . . . . . . . . . . . 10,447 14,211 19,735Other invested assets (including alternative investments) . . . . . . . . . . 20,106 20,898 (18,999)Other . . . . . . . . . . . . . . . . . . . . . . . . . . . . . . . . . . . . . . . . . . . . . . . 7,782 19,841 22,056
Total investment income . . . . . . . . . . . . . . . . . . . . . . . . . . . . . . . . 487,469 479,025 450,412Investment expenses . . . . . . . . . . . . . . . . . . . . . . . . . . . . . . . . . . . . (13,922) (11,623) (9,961)
Net investment income . . . . . . . . . . . . . . . . . . . . . . . . . . . . . . . . . $473,547 $467,402 $440,451
100

TRANSATLANTIC HOLDINGS, INC. AND SUBSIDIARIESNOTES TO CONSOLIDATED FINANCIAL STATEMENTS (Continued)
4. Investments (Continued)
(e) Investment Gains and Losses
Realized net capital gains (losses) are summarized as follows:Years Ended December 31,
2010 2009 2008
(in thousands)
Realized net capital gains (losses) resulted from:Total OTTI . . . . . . . . . . . . . . . . . . . . . . . . . . . . . . . . . . . . . . . . . $(14,685) $(96,527) $(317,790)Less: OTTI recognized in OCI . . . . . . . . . . . . . . . . . . . . . . . . . . . 6,713 13,445 —
OTTI charged to earnings . . . . . . . . . . . . . . . . . . . . . . . . . . . . (7,972) (83,082) (317,790)Sales and redemptions of securities . . . . . . . . . . . . . . . . . . . . . . . 61,762 12,794 (99,914)Net foreign currency transaction losses . . . . . . . . . . . . . . . . . . . . . (23,689) (353) (17,837)
Total . . . . . . . . . . . . . . . . . . . . . . . . . . . . . . . . . . . . . . . . . . $ 30,101 $(70,641) $(435,541)
Realized net capital gains (losses) by source:Fixed maturities . . . . . . . . . . . . . . . . . . . . . . . . . . . . . . . . . . . . . $ 32,096 $(41,813) $ (88,478)Equities available for sale . . . . . . . . . . . . . . . . . . . . . . . . . . . . . . 24,822 (23,204) (220,261)Securities lending invested collateral . . . . . . . . . . . . . . . . . . . . . . . — — (105,703)Net foreign currency transaction losses . . . . . . . . . . . . . . . . . . . . . (23,689) (353) (17,837)Other . . . . . . . . . . . . . . . . . . . . . . . . . . . . . . . . . . . . . . . . . . . . . (3,128) (5,271) (3,262)
Total . . . . . . . . . . . . . . . . . . . . . . . . . . . . . . . . . . . . . . . . . . $ 30,101 $(70,641) $(435,541)
The change in net unrealized appreciation (depreciation) of investments is summarized as follows:Years Ended December 31,
2010 2009 2008
(in thousands)
Change in net unrealized appreciation (depreciation) of investments,before deferred income tax effect:
Fixed maturities held to maturity carried at amortized cost . . . . $ (6,282) $ 65,330 $ (38,247)
Fixed maturities available for sale carried at fair value(1) . . . . . . $(78,219) $ 564,687 $(346,256)CEA of adoption of new accounting guidance(2) . . . . . . . . . . . . — (110,107) —Equities available for sale carried at fair value(1) . . . . . . . . . . . . 22,326 124,331 (47,120)Other(3) . . . . . . . . . . . . . . . . . . . . . . . . . . . . . . . . . . . . . . . . . 356 (2,383) 38,310
Total . . . . . . . . . . . . . . . . . . . . . . . . . . . . . . . . . . . . . . . . . $(55,537) $ 576,528 $(355,066)
(1) See Note 2(a) of Notes to Consolidated Financial Statements.(2) See Note 2(k)(1) of Notes to Consolidated Financial Statements.(3) Includes net unrealized appreciation from securities lending invested collateral of $41.2 million in 2008.
Gross realized gains and gross realized losses on sales of TRH’s available for sale securities andsecurities lending invested collateral were as follows:
2010 2009 2008
Gross Gross Gross Gross Gross GrossRealized Realized Realized Realized Realized Realized
Gains Losses Gains Losses Gains Losses
(in millions)
Fixed maturities . . . . . . . . . . . . . . . . . . . . . . $45.2 $(6.8) $47.3 $(49.4) $101.4 $ (62.3)Equities . . . . . . . . . . . . . . . . . . . . . . . . . . . . 28.9 (3.1) 78.4 (58.3) 51.1 (176.6)Securities lending invested collateral . . . . . . . — — — — — (8.0)
101

TRANSATLANTIC HOLDINGS, INC. AND SUBSIDIARIESNOTES TO CONSOLIDATED FINANCIAL STATEMENTS (Continued)
4. Investments (Continued)
Equity securities sold at a loss in 2010, 2009 and 2008 were in a continuous unrealized loss position for12 months or less and did not meet the conditions of TRH’s accounting policy to be considered OTTI atany quarter-end prior to the time of sale. (See Note 4(g) for the criteria TRH uses to evaluate if an equityinvestment is considered OTTI.) TRH’s equity security investment strategy includes the intent to optimizetotal investment return through active management, which can lead to selling securities at a gain or lossdue to changing market conditions and as market opportunities arise.
In 2010, sales of fixed maturity available for sale securities produced pre-tax gross realized losses of$6.8 million. Sales of fixed maturities available for sale were generally the result of (a) TRH’s desire tomanage the duration, credit risk and concentration risk of the investment portfolio as part of its overallview of prudent management of an available for sale fixed maturity investment portfolio; and (b) thedisposition of certain securities that, based on TRH’s judgment, were unlikely to provide on a relative basisas attractive a return as alternative securities entailing comparable risks.
In 2009, sales of fixed maturity available for sale securities, which produced pre-tax gross realizedlosses of $49.4 million, related primarily to corporate, municipalities and asset-backed securities. Grossrealized losses on sales of fixed maturity available for sale securities were generally the result of (a) TRH’sdesire to manage the duration of the investment portfolio as part of its overall view of prudentmanagement of an available for sale fixed maturity investment portfolio; (b) the disposition of certainsecurities that, based on TRH’s judgment, were unlikely to provide on a relative basis as attractive a returnas alternative securities entailing comparable risks; and (c) repositioning of the investment portfolio inlight of the transition to a new investment manager in the third quarter of 2009.
In 2009, securities in the equities available for sale portfolio were sold for a number of reasons,including the repositioning of TRH’s equity portfolio with respect to the continuing changes in theinvestment and credit markets during 2009 and the desire over time to take advantage of tax-basis capitalloss carry-backs to prior years that had capital gains. TRH’s equity security investment strategy includesthe intent to optimize total investment return through active management, which can lead to sellingsecurities at a gain or loss due to changing market conditions and as market opportunities arise.
As discussed in Note 4(g), the OTTI amounts on certain fixed maturities are separated into credit lossand non-credit loss components. The credit loss impairments are recognized in earnings as realized capitallosses, while the non-credit loss impairments are recorded in OCI. The following table sets forth theamount of credit loss impairments on fixed maturities held by TRH as of December 31, 2010 and 2009, forwhich a portion of the OTTI amount was recorded in OCI.
2010 2009
(in millions)
Beginning balance(1) . . . . . . . . . . . . . . . . . . . . . . . . . . . . . . . . . . . . . . . . . . . . . . . . . $ 4.5 $ 21.4New securities subject to credit impairment losses . . . . . . . . . . . . . . . . . . . . . . . . . . 6.3 11.8Credit impaired securities fully disposed for which there was no prior intent or
requirement to sell . . . . . . . . . . . . . . . . . . . . . . . . . . . . . . . . . . . . . . . . . . . . . . — (28.7)
Ending balance . . . . . . . . . . . . . . . . . . . . . . . . . . . . . . . . . . . . . . . . . . . . . . . . . . . . $10.8 $ 4.5
(1) April 1, 2009 for 2009.
102

TRANSATLANTIC HOLDINGS, INC. AND SUBSIDIARIESNOTES TO CONSOLIDATED FINANCIAL STATEMENTS (Continued)
4. Investments (Continued)
(f) Aging of Gross Unrealized Losses
As of December 31, 2010 and 2009, the aging of the gross unrealized losses with respect to all fixedmaturities, including both held to maturity and available for sale, and equities available for sale, groupedby months in a continuous unrealized loss position, was as follows:
Less than 12 Months 12 Months or more Total
Gross Gross GrossUnrealized Unrealized Unrealized
Fair Value Losses Fair Value Losses Fair Value Losses
(in millions)
2010Fixed maturities
U.S. Government and government agencies . $ 185 $ (3) $ — $ — $ 185 $ (3)States, municipalities and political
subdivisions . . . . . . . . . . . . . . . . . . . . . . 1,367 (49) 91 (19) 1,458 (68)Foreign governments . . . . . . . . . . . . . . . . . 162 (1) — — 162 (1)Corporate . . . . . . . . . . . . . . . . . . . . . . . . . 986 (20) 120 (5) 1,106 (25)Asset-backed:
RMBS . . . . . . . . . . . . . . . . . . . . . . . . . . 46 (2) 175 (40) 221 (42)CMBS . . . . . . . . . . . . . . . . . . . . . . . . . . 38 * 49 (6) 87 (6)Other asset-backed . . . . . . . . . . . . . . . . . 32 * 31 (1) 63 (1)
Total fixed maturities . . . . . . . . . . . . . . 2,816 (75) 466 (71) 3,282 (146)Equities available for sale . . . . . . . . . . . . . . . 58 (4) — — 58 (4)
Total . . . . . . . . . . . . . . . . . . . . . . . . . $2,874 $(79) $466 $(71) $3,340 $(150)
2009Fixed maturities
U.S. Government and government agencies . $ 298 $ (3) $ — $ — $ 298 $ (3)States, municipalities and political
subdivisions . . . . . . . . . . . . . . . . . . . . . . 470 (7) 451 (30) 921 (37)Foreign governments . . . . . . . . . . . . . . . . . 227 (5) 16 (3) 243 (8)Corporate . . . . . . . . . . . . . . . . . . . . . . . . . 593 (9) 244 (23) 837 (32)Asset-backed:
RMBS . . . . . . . . . . . . . . . . . . . . . . . . . . 75 (52) 101 (24) 176 (76)CMBS . . . . . . . . . . . . . . . . . . . . . . . . . . 1 * 45 (13) 46 (13)Other asset-backed . . . . . . . . . . . . . . . . . 3 * 13 (2) 16 (2)
Total fixed maturities . . . . . . . . . . . . . . 1,667 (76) 870 (95) 2,537 (171)Equities available for sale . . . . . . . . . . . . . . . 81 (2) — — 81 (2)
Total . . . . . . . . . . . . . . . . . . . . . . . . . $1,748 $(78) $870 $(95) $2,618 $(173)
* Rounds to zero.
103
TRANSATLANTIC HOLDINGS, INC. AND SUBSIDIARIESNOTES TO CONSOLIDATED FINANCIAL STATEMENTS (Continued)
4. Investments (Continued)
At December 31, 2010, the carrying value of TRH’s fixed maturity and equity securities aggregated$12.58 billion with aggregate pre-tax gross unrealized losses of $150 million. Additional information aboutthese securities is as follows:
• Securities with gross unrealized losses were valued, in the aggregate, at approximately 95.7% oftheir current cost or amortized cost.
• Approximately 98.5% of these securities had unrealized losses of less than or equal to 20% of theircurrent cost or amortized cost.
• Approximately 0.9% of the fixed maturity securities had issuer credit ratings which were belowinvestment grade or not rated.
At December 31, 2010, TRH held 387 and 66 individual fixed maturity and equity investments,respectively, that were in an unrealized loss position, of which, 92 individual fixed maturity investmentswere in a continuous unrealized loss position for 12 months or more.
As of December 31, 2010 and 2009, no single issuer accounted for more than 11% and 10%,respectively, of the aggregate gross unrealized losses.
At December 31, 2010 and 2009, the gross unrealized losses for all fixed maturities, including bothheld to maturity and available for sale, and equities available for sale included the followingconcentrations:
Concentration as of
2010 2009
(in millions)
States, municipalities and political subdivisions . . . . . . . . . . . . . . . . . . . . . . . . . . . $ 68 $ 37RMBS . . . . . . . . . . . . . . . . . . . . . . . . . . . . . . . . . . . . . . . . . . . . . . . . . . . . . . . . 41 76Banking and financial institutions . . . . . . . . . . . . . . . . . . . . . . . . . . . . . . . . . . . . . 11 30CMBS . . . . . . . . . . . . . . . . . . . . . . . . . . . . . . . . . . . . . . . . . . . . . . . . . . . . . . . . 6 13Other . . . . . . . . . . . . . . . . . . . . . . . . . . . . . . . . . . . . . . . . . . . . . . . . . . . . . . . . . 24 17
Total . . . . . . . . . . . . . . . . . . . . . . . . . . . . . . . . . . . . . . . . . . . . . . . . . . . . . . . . $150 $173
The fair value of fixed maturities in an unrealized loss position at December 31, 2010 and 2009, bycontractual maturity, is shown below:
2010 2009
(in millions)
Non-asset-backed:Due in one year or less . . . . . . . . . . . . . . . . . . . . . . . . . . . . . . . . . . . . . . . . . . $ 68 $ 116Due after one year through five years . . . . . . . . . . . . . . . . . . . . . . . . . . . . . . . 950 536Due after five years through ten years . . . . . . . . . . . . . . . . . . . . . . . . . . . . . . . 297 515Due after ten years . . . . . . . . . . . . . . . . . . . . . . . . . . . . . . . . . . . . . . . . . . . . . 1,596 1,132
Asset-backed(1) . . . . . . . . . . . . . . . . . . . . . . . . . . . . . . . . . . . . . . . . . . . . . . . . . . 371 238
Total . . . . . . . . . . . . . . . . . . . . . . . . . . . . . . . . . . . . . . . . . . . . . . . . . . . . . . $3,282 $2,537
(1) Asset-backed fixed maturities by their nature do not generally have single maturity dates.
104

TRANSATLANTIC HOLDINGS, INC. AND SUBSIDIARIESNOTES TO CONSOLIDATED FINANCIAL STATEMENTS (Continued)
4. Investments (Continued)
(g) Evaluating Investments for OTTI
Each quarter, TRH evaluates its investments for OTTI such that a security is considered a candidatefor OTTI if it meets any of the following criteria:
• Trading at a significant (25% or more) discount to par, amortized cost (if lower) or cost for anextended period of time (nine consecutive months or longer);
• The occurrence of a discrete credit event resulting in (a) the issuer defaulting on a materialoutstanding obligation; (b) the issuer seeking protection from creditors under the bankruptcy lawsor any similar laws intended for court supervised reorganization of insolvent enterprises; or (c) theissuer proposing a voluntary reorganization pursuant to which creditors are asked to exchange theirclaims for cash or securities having a fair value substantially lower than the par value of their claims;or
• TRH may not realize a full recovery on its investment, regardless of the occurrence of one or moreof the foregoing events.
The determination that a security has incurred OTTI requires the judgment of management andconsideration of the fundamental condition of the issuer, its near-term prospects and all the relevant factsand circumstances. The above criteria also consider circumstances of a rapid and severe market valuationdecline, such as that experienced in credit markets in recent years, in which TRH could not reasonablyassert that the impairment period would be temporary (i.e., severity losses). The analysis of any individualsecurity for OTTI is performed based on its functional currency. Additional criteria considered includes asecurity’s business prospects, the investment’s credit ratings and whether there have been any recentdowngrades, whether the issuer is current on all payments in accordance with the contractual terms of theinvestment and is expected to meet all of its obligations under the terms of the investment, market values,issuer specific financial information and available information from asset managers and rating agencies forindividual securities.
OTTI on all investments other than fixed maturities are recognized through earnings as a realizedcapital loss. OTTI on fixed maturities prior to the second quarter of 2009 were recognized throughearnings as a realized capital loss. Effective in the second quarter of 2009, at each balance sheet date, TRHrecognizes an OTTI on a fixed maturity in an unrealized loss position if (a) TRH intends to sell thesecurity; (b) it is more likely than not TRH will be required to sell the security prior to an anticipatedrecovery in fair value, in order to meet a liquidity, regulatory or other business need; or (c) TRHdetermines it will not recover the entire amortized cost basis of the security.
If TRH intends to sell an impaired fixed maturity security, or if it is more likely than not it will have tobe sold, the total amount of the unrealized loss position is recognized in earnings as a realized capital loss.On a quarterly basis, TRH develops for fixed maturities, a best estimate of the present value of expectedcash flows on a security by security basis. If the results of the cash flow analysis indicate TRH will notrecover the full amount of its amortized cost basis in the investment, TRH recognizes OTTI equal to thedifference between the present value of expected cash flows and the amortized cost basis of the security.This amount is the credit component of the OTTI and is recorded in earnings as a realized capital loss. Thedifference between the total unrealized loss position on the security and the OTTI amount recognized inearnings is non-credit related and is recorded in OCI as ‘‘net unrealized holding losses of fixed maturitieson which other-than-temporary impairments were taken’’.
105

TRANSATLANTIC HOLDINGS, INC. AND SUBSIDIARIESNOTES TO CONSOLIDATED FINANCIAL STATEMENTS (Continued)
4. Investments (Continued)
If a loss is recognized from a sale subsequent to a balance sheet date pursuant to changes incircumstances, the loss is recognized in the period in which the intent to hold the security to recovery nolonger existed.
TRH evaluated the significant categories of fixed maturity investments in an unrealized loss positionfor OTTI. For state, municipality and political subdivision securities, TRH takes into account the taxingpower of the issuer, source of revenue, credit risk and credit enhancements and pre-refunding. For asset-backed securities, TRH discounted its best estimate of future cash flows at an effective rate equal to theoriginal effective yield of the security. Those models included TRH’s assumptions about prepaymentspeeds, default and delinquency rates, and underlying collateral (if any), as well as credit ratings, creditenhancements and other observable market data. For corporate fixed maturities, TRH reviewed businessprospects, credit ratings and available information from asset managers and rating agencies for individualsecurities.
At December 31, 2010, the large majority of fixed maturities in an unrealized loss position consist ofhighly-rated state, municipality or political subdivision, corporate and asset-backed fixed maturities. TRHdid not consider the unrealized losses on these impaired fixed maturities to be credit related. In makingthese determinations, TRH has considered factors specific to the securities that have unrealized lossescoupled with TRH’s history of consistently strong operating cash flows, levels of cash, cash equivalents andliquid investment classes, as well as its short and medium-term cash needs. TRH does not intend to sellthese securities, and will not likely be required to sell these securities before an anticipated recovery in fairvalue. Other considerations included the length of time and extent to which the security has been in anunrealized loss position, observable adverse conditions specifically related to the issuer or industry sectorof the security, conditions in the country of issuance or primary market for the security, historical andimplied volatility of the security’s fair value, defaults on principal or interest payments, and recoveries orfurther declines in fair value subsequent to the balance sheet date.
At December 31, 2010, TRH determined that there was no OTTI on its equity securities as no equitiesmet TRH’s equity security OTTI criteria and TRH has the intent and ability to hold all equities torecovery. In addition, no equities were in an unrealized loss position for over 12 months.
(h) Securities Lending Program
Through 2008, TRH participated in the Securities Lending Program managed by a subsidiary of AIG,whereby certain securities (principally fixed maturities available for sale) from its portfolio were loaned tothird parties. Under such program, TRH loaned securities to counterparties and received collateral,generally cash, which was invested to earn a spread. The collateral received was invested in separateportfolios containing floating rate bonds (i.e., fixed maturities), including asset-backed securities, andinterest-bearing cash equivalents. These portfolios were maintained in segregated accounts for TRH by theprogram manager. The collateral was returned to the counterparties when the loaned securities werereturned to TRH at a future date. In the fourth quarter of 2008, TRH terminated its participation in theSecurities Lending Program.
Prior to the fourth quarter of 2008, the transfers of securities in exchange for collateral under theSecurities Lending Program were accounted for as secured borrowings. Securities lending investedcollateral was shown on the balance sheet at fair value. A liability was recorded in an amount equal to thecollateral received, reflecting TRH’s obligation to return the collateral when the loaned securities werereturned. Income earned on invested collateral, net of interest payable to the collateral provider, was
106

TRANSATLANTIC HOLDINGS, INC. AND SUBSIDIARIESNOTES TO CONSOLIDATED FINANCIAL STATEMENTS (Continued)
4. Investments (Continued)
included in net investment income. As a result of conditions affecting the financial and credit markets, inthe fourth quarter of 2008, counterparties were successful in negotiating significantly reduced collaterallevels (i.e., collateral received as a percentage of the fair value of the security loaned). Due to the lowercollateral levels, during the fourth quarter of 2008, many of such loaned securities were accounted for assales at the time of transfer and as purchases when the securities were subsequently returned. The sale andreturn of such securities resulted in realized net capital losses of $16 million in 2008.
In 2008, TRH repaid certain securities lending payables using cash from sources other than the sale ofsecurities lending invested collateral. In that regard, fixed maturities were transferred from the securitieslending invested collateral portfolio to the fixed maturities available for sale portfolio. Such transferredsecurities included CMBS, RMBS and other asset-backed securities.
5. Income Taxes (Benefits)
The Company files a U.S. consolidated federal income tax return with its domestic subsidiaries, whichincludes foreign operations. TRC will include as part of its taxable income those items of income of thenon-U.S. subsidiary, TRZ, which are subject to U.S. income tax currently, pursuant to Subpart F income rulesof the Internal Revenue Code, and included, as appropriate, in the consolidated federal income tax return.
107

TRANSATLANTIC HOLDINGS, INC. AND SUBSIDIARIESNOTES TO CONSOLIDATED FINANCIAL STATEMENTS (Continued)
5. Income Taxes (Benefits) (Continued)
The U.S. federal income tax rate was 35% for 2010, 2009 and 2008. Actual tax expense (benefit) onincome before income taxes differs from the ‘‘expected’’ amount computed by applying the U.S. federalincome tax rate because of the following:
Years Ended December 31,
2010 2009 2008
Percent of Percent of Percent ofIncome Before Income Before Income Before
Amount Income Taxes Amount Income Taxes Amount Income Taxes
(dollars in thousands)‘‘Expected’’ tax expense . . . . . $165,476 35.0% $208,612 35.0% $ 1,128 35.0%Adjustments:
Tax-exempt interest . . . . . . (86,052) (18.2) (90,928) (15.2) (89,359) (2,772.8)Dividends received
deduction . . . . . . . . . . . (1,888) (0.4) (2,022) (0.3) (4,867) (151.0)Recognition of benefit from
prior year amended taxreturns . . . . . . . . . . . . . (8,906) (1.9) — — — —
Interest on net under (over)payments of taxes . . . . . . 505 0.1 (1,073) (0.2) (3,656) (113.4)
Other . . . . . . . . . . . . . . . . 1,452 0.3 3,782 0.6 (2,277) (70.8)
Actual tax expense(benefit) . . . . . . . . . . . $ 70,587 14.9% $118,371 19.9% $ (99,031) (3,073.0)%
Foreign and domesticcomponents of actual taxexpense (benefit):Foreign . . . . . . . . . . . . . . $ 50,228 $ 29,273 $ 73,814Domestic:
Current . . . . . . . . . . . . . 75,402 67,498 (28,537)Deferred . . . . . . . . . . . . (55,043) 21,600 (144,308)
$ 70,587 $118,371 $ (99,031)
Income (loss) before income taxes from Domestic operations was $354.1 million, $327.1 million and($263.9) million in 2010, 2009 and 2008, respectively. Income before income taxes from foreign operationswas $118.7 million, $269.0 million and $267.1 million in 2010, 2009 and 2008, respectively.
The domestic tax expense for 2010 includes a tax benefit of $8.9 million (excluding interest), recordedin the fourth quarter, resulting from the resolution of prior year tax audits primarily attributable to foreigntax credits that became available as a result of the carryback of tax-basis net operating losses incurred in2001 and 2005. The domestic deferred tax expense for 2010 is net of $5.5 million resulting from minimumtax credit carryforwards. By law, minimum tax credits may be carried forward indefinitely. The domesticcurrent tax expense for 2009 includes the impact of a tax capital loss of $209.2 million. The actual capitalloss included in the 2009 U.S. consolidated tax return was $145.1 million. The 2010 tax expense includes anadjustment to align the amounts reflected in the 2009 tax expense with the amounts in the 2009 tax return.$21.3 million of tax capital loss was carried back to prior years and the remainder can be carried forwardfive years to offset future capital gains. The domestic deferred tax expense for 2009 is net of $56.7 millionresulting from minimum tax credit carryforwards. The domestic current tax benefit for 2008 includes the
108

TRANSATLANTIC HOLDINGS, INC. AND SUBSIDIARIESNOTES TO CONSOLIDATED FINANCIAL STATEMENTS (Continued)
5. Income Taxes (Benefits) (Continued)
tax benefit on $100.3 million of tax capital loss carrybacks to prior years. The actual capital loss included inthe 2008 U.S. consolidated tax return was $114.0 million. The 2009 tax expense includes an adjustment toalign the amounts reflected in the 2008 tax expense with the amounts included in the 2008 income taxreturn. In addition, the 2008 deferred tax benefit includes the reversal of a previously recorded minimumtax credit carryforward in the amount of $15.0 million.
The components of the net deferred income tax asset at December 31, 2010 and 2009 were as follows:
2010 2009
(in thousands)
Deferred income tax assets:Unpaid losses and LAE, net of related reinsurance recoverable . . . . . . . . . . . . $328,951 $329,753Unearned premiums, net of prepaid reinsurance premiums . . . . . . . . . . . . . . . 78,208 78,005Cumulative translation adjustment . . . . . . . . . . . . . . . . . . . . . . . . . . . . . . . . . — 49,655Benefit from amended tax returns . . . . . . . . . . . . . . . . . . . . . . . . . . . . . . . . . — 8,204Minimum tax credit carryforward . . . . . . . . . . . . . . . . . . . . . . . . . . . . . . . . . 107,541 102,025OTTI write-downs for investments held . . . . . . . . . . . . . . . . . . . . . . . . . . . . . 34,811 31,388Foreign tax credit carryforward . . . . . . . . . . . . . . . . . . . . . . . . . . . . . . . . . . . 22,522 10,461Capital loss carryforward . . . . . . . . . . . . . . . . . . . . . . . . . . . . . . . . . . . . . . . 26,459 —Other . . . . . . . . . . . . . . . . . . . . . . . . . . . . . . . . . . . . . . . . . . . . . . . . . . . . . 69,555 48,852
Total deferred income tax assets . . . . . . . . . . . . . . . . . . . . . . . . . . . . . . . . . 668,047 658,343Deferred income tax liabilities:
Deferred policy acquisition costs . . . . . . . . . . . . . . . . . . . . . . . . . . . . . . . . . . 85,935 84,921Net unrealized appreciation of investments . . . . . . . . . . . . . . . . . . . . . . . . . . 67,748 87,190Cumulative translation adjustment . . . . . . . . . . . . . . . . . . . . . . . . . . . . . . . . . 15,263 —Other . . . . . . . . . . . . . . . . . . . . . . . . . . . . . . . . . . . . . . . . . . . . . . . . . . . . . 35,293 31,749
Total deferred income tax liabilities . . . . . . . . . . . . . . . . . . . . . . . . . . . . . . 204,239 203,860Net deferred income tax asset . . . . . . . . . . . . . . . . . . . . . . . . . . . . . . . . . . $463,808 $454,483
No valuation allowance has been recorded as TRH has concluded that it is more likely than not thatTRH will fully realize the deferred tax assets. The most significant deferred tax assets arise from thediscounting of loss reserves, minimum tax credit carryforwards, realized and unrealized losses oninvestments and unearned premiums. TRH’s strong history of operating earnings supports its conclusionthat it has the ability to realize the full benefits associated with all deferred tax assets, particularly theassets associated with the discounting of loss reserves and minimum tax credits, which may be carriedforward indefinitely. In addition to TRH’s strong history of operating earnings, TRH also has a stronghistory of generating capital gains to offset capital losses. During 2007 and 2006, TRH generated$135 million of capital gains on a tax basis that were utilized for carryback of losses generated in 2008 and2009. In addition, while the OTTI write-downs on its fixed maturity securities are reflected as realizedlosses for GAAP purposes, the securities continue to be held in its available for sale portfolio and, as such,the carryforward period for capital losses on a tax basis has not begun to run. Finally, TRH’s strong historyof positive operating cash flow, having generated $3.11 billion over the last three years, supports theconclusion that TRH has the ability to hold until maturity, or until the values recover, those fixed incomesecurities that have been written down, as well as those securities that are in an unrealized loss position.
At December 31, 2010, 2009 and 2008, TRH has no unrecognized tax positions. TRH does notpresently anticipate any material change in unrecognized tax positions during the next twelve months.
109
TRANSATLANTIC HOLDINGS, INC. AND SUBSIDIARIESNOTES TO CONSOLIDATED FINANCIAL STATEMENTS (Continued)
5. Income Taxes (Benefits) (Continued)
Interest and penalties relating to unrecognized tax expenses (benefits) are recognized in income taxexpense, when applicable. There was no liability for interest or penalties accrued as of December 31, 2010.In 2010, $9.6 million of interest, net of tax, was received on tax refunds. As of December 31, 2009, therewas $10.2 million of interest, net of tax, receivable on income taxes. In 2010, current income tax expensewas increased by approximately $0.5 million to align the interest, net of tax, receivable at December 31,2009 with the amount actually received in 2010. Current income tax expense was reduced by $1.1 millionand $3.7 million of interest on net tax refunds in 2009 and 2008, respectively.
The total income taxes recovered in 2010 of $131.1 million consist of a $109.0 million refund offederal income taxes related to amended tax returns for prior tax years and $22.1 million of refund claimsrelated to capital loss carrybacks to certain other prior tax years. Income taxes recovered (paid), net,in 2010, 2009 and 2008 consisted of:
Years Ended December 31,
2010 2009 2008
(in millions)
Income taxes paid . . . . . . . . . . . . . . . . . . . . . . . . . . . . . . . . . . . . . . . . . $(115.6) $(108.7) $(119.5)Income taxes recovered . . . . . . . . . . . . . . . . . . . . . . . . . . . . . . . . . . . . . 131.1 — —
Income taxes recovered (paid), net . . . . . . . . . . . . . . . . . . . . . . . . . . . $ 15.5 $(108.7) $(119.5)
The following table lists the tax years that remain subject to examination by major tax jurisdiction asof December 31, 2010:
Major Tax Jurisdiction Open Tax Years
Canada . . . . . . . . . . . . . . . . . . . . . . . . . . . . . . . . . . . . . . . . . . . . . . . . . . . . . . . . . . . 2006-2009France . . . . . . . . . . . . . . . . . . . . . . . . . . . . . . . . . . . . . . . . . . . . . . . . . . . . . . . . . . . . 2009Switzerland . . . . . . . . . . . . . . . . . . . . . . . . . . . . . . . . . . . . . . . . . . . . . . . . . . . . . . . . 2007-2009United Kingdom . . . . . . . . . . . . . . . . . . . . . . . . . . . . . . . . . . . . . . . . . . . . . . . . . . . . 2008-2009United States . . . . . . . . . . . . . . . . . . . . . . . . . . . . . . . . . . . . . . . . . . . . . . . . . . . . . . . 2004-2009
110

TRANSATLANTIC HOLDINGS, INC. AND SUBSIDIARIESNOTES TO CONSOLIDATED FINANCIAL STATEMENTS (Continued)
6. Liability for Gross Loss Reserves
The activity in gross loss reserves is summarized as follows:Years Ended December 31,
2010 2009 2008
(in thousands)
At beginning of year:Gross loss reserves . . . . . . . . . . . . . . . . . . . . . . . . . . . . . . . . $8,609,105 $8,124,482 $7,926,261Less related reinsurance recoverable . . . . . . . . . . . . . . . . . . . 737,280 775,404 1,026,545
Net loss reserves . . . . . . . . . . . . . . . . . . . . . . . . . . . . . . . . 7,871,825 7,349,078 6,899,716Net losses and LAE incurred in respect of losses occurring in:
Current year . . . . . . . . . . . . . . . . . . . . . . . . . . . . . . . . . . . . 2,738,733 2,718,119 2,907,711Prior years . . . . . . . . . . . . . . . . . . . . . . . . . . . . . . . . . . . . . . (56,959) (38,948) (484)
Total . . . . . . . . . . . . . . . . . . . . . . . . . . . . . . . . . . . . . . . . 2,681,774 2,679,171 2,907,227Net losses and LAE paid in respect of losses occurring in:
Current year . . . . . . . . . . . . . . . . . . . . . . . . . . . . . . . . . . . . 611,746 620,517 565,613Prior years . . . . . . . . . . . . . . . . . . . . . . . . . . . . . . . . . . . . . . 1,595,728 1,800,491 1,550,437
Total . . . . . . . . . . . . . . . . . . . . . . . . . . . . . . . . . . . . . . . . 2,207,474 2,421,008 2,116,050Foreign exchange effect . . . . . . . . . . . . . . . . . . . . . . . . . . . . . . (131,352) 264,584 (341,815)At end of year:
Net loss reserves . . . . . . . . . . . . . . . . . . . . . . . . . . . . . . . . . 8,214,773 7,871,825 7,349,078Plus related reinsurance recoverable . . . . . . . . . . . . . . . . . . . 805,837 737,280 775,404
Gross loss reserves . . . . . . . . . . . . . . . . . . . . . . . . . . . . . . $9,020,610 $8,609,105 $8,124,482
111

TRANSATLANTIC HOLDINGS, INC. AND SUBSIDIARIESNOTES TO CONSOLIDATED FINANCIAL STATEMENTS (Continued)
6. Liability for Gross Loss Reserves (Continued)
2010 includes net catastrophe losses incurred of $203.7 million, principally relating to the earthquakein Chile, the earthquake in New Zealand, storms and flooding in Australia and the Deepwater Horizonexplosion. In addition, in 2010, TRH decreased its estimates of the ultimate amounts of net lossesoccurring in 2009 and prior years by $57.0 million. This net favorable development was comprised of netfavorable development of $216.9 million for losses occurring in 2002 to 2009, offset by net adversedevelopment of $159.9 million relating to losses occurring in 2001 and prior.
Net favorable development was recorded for losses occurring in the fire ($70.1 million), surety andcredit ($54.8 million) and ocean marine ($45.8 million) lines, each arising principally from losses occurringin 2005 to 2009. Significant net adverse development was recorded in 2010 in the other liability line($116.7 million), arising principally from losses occurring in 2002 and prior, partially offset by favorabledevelopment from losses occurring between 2003 and 2006. The other liability line includes certainspecialty casualty classes, such as D&O and E&O, and general casualty classes. In addition, net adversedevelopment was recorded in 2010 for losses occurring in the fidelity ($32.1 million) line, arisingprincipally from losses occurring in 2006 to 2009.
The favorable development in 2005 through 2009 results generally from favorable loss trends. The netadverse development arising from losses occurring in 2001 and prior, generally relates to various excesscasualty lines such as general liability and excess umbrella liability which were impacted by late reportedexcess claims.
TRH writes a significant amount of non-proportional assumed casualty reinsurance as well asproportional assumed reinsurance of excess liability business for such volatile classes as medicalmalpractice, D&O, E&O and general casualty. At the primary level, there are significant risk factors whichcontribute to the variability and unpredictability of the loss trend factor for this business such as juryawards, social inflation, medical inflation, tort reforms and court interpretations of coverage. In addition,as a reinsurer, TRH is also highly dependent upon the claims reserving and reporting practices of itscedants, which vary greatly by size, specialization and country of origin and whose practices can be subjectto change without notice.
There were no significant net catastrophe losses for events occurring in 2009. In addition, in 2009,TRH decreased its estimates of the ultimate amounts of net losses occurring in 2008 and prior years by$38.9 million. This net favorable development was comprised of net favorable development of$219.1 million for losses occurring in 2002 to 2008, offset by net adverse development of $180.2 millionrelating to losses occurring in 2001 and prior.
Significant net favorable development was recorded for losses occurring in the fire ($104.1 million)and allied lines ($42.4 million) lines, each arising principally from losses occurring in 2007 to 2008, and thesurety and credit line ($25.3 million), arising principally from losses occurring in 2004 to 2008. The line ofbusiness with the most significant net adverse development recorded in 2009 was the other liability line($120.4 million), arising principally from losses occurring in 2001 and prior, partially offset by favorabledevelopment from losses occurring between 2004 and 2006. The other liability line includes certainspecialty casualty classes, such as D&O and E&O, and general casualty classes. In addition, significant netadverse development was recorded in 2009 for losses occurring in the fidelity ($30.0 million) line, arisingprincipally from losses occurring in 2007 to 2008.
The favorable development in 2004 through 2008 results generally from favorable loss trends. The netadverse development arising from losses occurring in 2001 and prior, generally relates to various excess
112

TRANSATLANTIC HOLDINGS, INC. AND SUBSIDIARIESNOTES TO CONSOLIDATED FINANCIAL STATEMENTS (Continued)
6. Liability for Gross Loss Reserves (Continued)
casualty lines such as general liability and excess umbrella liability which were impacted by late reportedhigh layer excess claims. Ceding companies and their reinsurers continue to experience increased loss costsrelative to expectations as loss emergence patterns continue to lengthen as regards the soft market years of1997 through 2001.
2008 includes net catastrophe losses incurred of $180.4 million, principally relating to Hurricane Ike.In addition, in 2008, TRH decreased its estimates of the ultimate amounts of net losses occurring in 2007and prior years by $0.5 million. This net favorable development was comprised of net favorabledevelopment of $209.7 million for losses occurring in 2003 to 2007, offset by net adverse development of$209.2 million relating to losses occurring in 2002 and prior.
Significant net favorable development was recorded for losses occurring in the allied lines($43.6 million) and fire ($11.6 million) lines, each arising principally from losses occurring in 2007, and inthe homeowners multiple peril ($17.0 million) and auto liability ($13.2 million) lines, each arisingprincipally from losses occurring in 2005 to 2007. The line of business with the most significant net adversedevelopment recorded in 2008 was the other liability line ($79.6 million), arising principally from lossesoccurring between 1997 and 2002, partially offset by favorable development from losses occurring in 2004to 2006. The other liability line includes certain specialty casualty classes, such as D&O and E&O, andgeneral casualty classes. In addition, significant net adverse development was recorded in 2008 for lossesoccurring in the medical malpractice ($35.4 million) line, arising principally from losses occurring in 1995to 2001 and in 2006.
The favorable development in 2004 through 2007 results generally from favorable loss trends. The netadverse development arising from losses occurring in years 1998 through 2001, which represent the greatmajority of the 2002 and prior development, generally relates to the fact that for many classes within theseyears, ceding companies continue to experience increased loss costs relative to expectations, coupled withan unexpected lengthening of the loss emergence patterns. Generally, loss activity was greater thanexpected from losses occurring in the D&O and E&O classes, although to a lesser extent than in previouscalendar year periods. Also, classes such as medical malpractice and excess umbrella were impacted by latereported high layer excess claims to a greater extent than expected. Contributing to this increase, is the factthat many policies during this period covered underlying contracts that extended over multiple years, whichcontributed to recent reported loss activity exceeding previous expectations. This has led to an increase inboth the frequency and severity of claims entering the reinsured excess-of-loss coverage layers at laterpoints in time than had previously been experienced.
Net development on losses occurring in prior years, for all periods discussed above, includes amountsrelating to catastrophe events. See Note 10 for such amounts.
7. Senior Notes
In December 2005, the Company completed a public offering of $750 million aggregate principalamount of its 5.75% senior notes due on December 14, 2015 (the ‘‘2015 Notes’’). In November 2009, theCompany completed a public offering of $350 million aggregate principal amount of its 8.00% senior notesdue on November 30, 2039 (the ‘‘2039 Notes’’ and together with the 2015 Notes, the ‘‘Senior Notes’’).
113

TRANSATLANTIC HOLDINGS, INC. AND SUBSIDIARIESNOTES TO CONSOLIDATED FINANCIAL STATEMENTS (Continued)
7. Senior Notes (Continued)
In 2010, 2009 and 2008, TRH repurchased portions of the 2015 Notes. No repurchases of the 2039Notes occurred in 2010 or 2009. The impact of the repurchases of the 2015 Notes in 2010, 2009 and 2008are detailed below:
2010 2009 2008
(in millions)
Principal amount repurchased . . . . . . . . . . . . . . . . . . . . . . . . . . . . . . . . . . . . . . . . $3 $30 $25Repurchase price . . . . . . . . . . . . . . . . . . . . . . . . . . . . . . . . . . . . . . . . . . . . . . . . . 3 20 15(Loss) gain on early extinguishment of debt . . . . . . . . . . . . . . . . . . . . . . . . . . . . . . * 10 10
* Loss on early extinguishment of debt rounds to zero.
The balance sheet carrying value, unamortized original issue discount, outstanding principal amountand fair value of the Senior Notes are presented below. The unamortized original issue discount is beingamortized over the term of the notes on the effective interest rate method. The fair values are based onquoted market prices.
As of December 31, 2010 As of December 31, 2009
2015 Notes 2039 Notes 2015 Notes 2039 Notes
(in millions)
Balance sheet carrying amount . . . . . . . . . . . . . $690.1 $340.4 $692.8 $340.3Unamortized original issue discount . . . . . . . . . 1.9 9.6 2.2 9.7Outstanding principal amount . . . . . . . . . . . . . . 692.0 350.0 695.0 350.0Fair value . . . . . . . . . . . . . . . . . . . . . . . . . . . . 736.6 351.1 712.5 359.3
Interest expense incurred and paid in connection with the Senior Notes was as follows:
Years Ended December 31,
2010 2009 2008
(in thousands)
Interest expense incurred . . . . . . . . . . . . . . . . . . . . . . . . . . . . . . . . . . . $68,272 $43,454 $43,359Interest paid . . . . . . . . . . . . . . . . . . . . . . . . . . . . . . . . . . . . . . . . . . . . 68,439 40,394 43,113
8. Common Stock
Common stock activity for each of the three years in the period ended December 31, 2010 was asfollows:
2010 2009 2008
Shares outstanding, beginning of year . . . . . . . . . . . . . . . . . . . . 66,382,621 66,364,358 66,233,570Issued under stock compensation plans . . . . . . . . . . . . . . . . . . . 180,220 77,863 130,788Acquisition of treasury stock . . . . . . . . . . . . . . . . . . . . . . . . . . (4,314,300) (59,600) —
Shares outstanding, end of year . . . . . . . . . . . . . . . . . . . . . . . . 62,248,541 66,382,621 66,364,358
114

TRANSATLANTIC HOLDINGS, INC. AND SUBSIDIARIESNOTES TO CONSOLIDATED FINANCIAL STATEMENTS (Continued)
9. Net Income Per Common Share
Net income per common share has been computed in the following table based upon weightedaverage common shares outstanding.
Years Ended December 31,
2010 2009 2008
(in thousands, except per share data)
Net income (numerator) . . . . . . . . . . . . . . . . . . . . . . . . . . . . . . . . . $402,201 $477,662 $102,254
Weighted average common shares outstanding used in thecomputation of net income per common share:
Average shares issued . . . . . . . . . . . . . . . . . . . . . . . . . . . . . . . . 67,549 67,374 67,259Less: Average shares in treasury . . . . . . . . . . . . . . . . . . . . . . . . (3,457) (993) (989)
Average outstanding shares—basic (denominator) . . . . . . . . . . . . 64,092 66,381 66,270Average potential shares from stock compensation(1) . . . . . . . . . . 838 421 452
Average outstanding shares—diluted (denominator) . . . . . . . . . . 64,930 66,802 66,722
Net income per common share:Basic . . . . . . . . . . . . . . . . . . . . . . . . . . . . . . . . . . . . . . . . . . . . . . $ 6.28 $ 7.20 $ 1.54Diluted . . . . . . . . . . . . . . . . . . . . . . . . . . . . . . . . . . . . . . . . . . . . 6.19 7.15 1.53
(1) 2010 excludes the effect of 2.1 million anti-dilutive shares (from a total of 3.8 million potential shares). 2009 excludes the effectof 2.2 million anti-dilutive shares (from a total of 3.2 million potential shares). 2008 excludes the effect of 1.3 millionanti-dilutive shares (from a total of 3.1 million potential shares).
10. Impact of Catastrophe Costs
Net catastrophe costs represent TRH’s best estimates of the aggregate ultimate costs to be incurredrelating to significant catastrophe events based upon information available at the time the estimate wasmade. These catastrophe cost estimates reflect significant judgment relating to many factors, including theultimate resolution of certain legal and other issues.
Gross and ceded reinstatement premiums serve to increase or decrease, respectively, net premiumswritten and earned by such amounts in their respective periods. Reinstatement premiums may arise onboth assumed and ceded business as a result of contractual provisions found in certain catastropheexcess-of-loss reinsurance contracts that require additional premium to be paid in the event of a loss toreinstate coverage for the remaining portion of the contract period.
Net catastrophe costs in 2010 principally relate to the earthquake in Chile, the earthquake in NewZealand, storms and flooding in Australia and the Deepwater Horizon explosion. There were nosignificant net catastrophe costs for events occurring during 2009. Net catastrophe costs in 2008 principallyrelated to Hurricane Ike. Net catastrophe costs also include estimated changes in net catastrophe costsincurred relating to events occurring in prior years.
115

TRANSATLANTIC HOLDINGS, INC. AND SUBSIDIARIESNOTES TO CONSOLIDATED FINANCIAL STATEMENTS (Continued)
10. Impact of Catastrophe Costs (Continued)
Summaries of the components of pre-tax net catastrophe costs for 2010, 2009 and 2008 are presentedbelow:
Years Ended December 31,
2010 2009 2008
(in millions)
Net losses and LAE incurred from catastrophe events occurring in:Current year . . . . . . . . . . . . . . . . . . . . . . . . . . . . . . . . . . . . . . . . . . . . . . $207.2 $ — $190.8Prior years . . . . . . . . . . . . . . . . . . . . . . . . . . . . . . . . . . . . . . . . . . . . . . . . (3.5) (8.0) (10.4)
Total net losses and LAE incurred from catastrophe events . . . . . . . . . . . 203.7 (8.0) 180.4Net ceded (assumed) reinstatement premiums . . . . . . . . . . . . . . . . . . . . . . . . (1.3) 2.4 (10.7)
Net catastrophe costs . . . . . . . . . . . . . . . . . . . . . . . . . . . . . . . . . . . . . . $202.4 $(5.6) $169.7
Losses and LAE incurred from catastrophe events:Gross . . . . . . . . . . . . . . . . . . . . . . . . . . . . . . . . . . . . . . . . . . . . . . . . . . . $287.4 $(0.9) $187.0Ceded . . . . . . . . . . . . . . . . . . . . . . . . . . . . . . . . . . . . . . . . . . . . . . . . . . . (83.7) (7.1) (6.6)
Net . . . . . . . . . . . . . . . . . . . . . . . . . . . . . . . . . . . . . . . . . . . . . . . . . . . . . 203.7 (8.0) 180.4
Reinstatement premiums:Gross . . . . . . . . . . . . . . . . . . . . . . . . . . . . . . . . . . . . . . . . . . . . . . . . . . . (10.0) 3.1 (11.4)Ceded . . . . . . . . . . . . . . . . . . . . . . . . . . . . . . . . . . . . . . . . . . . . . . . . . . . 8.7 (0.7) 0.7
Net . . . . . . . . . . . . . . . . . . . . . . . . . . . . . . . . . . . . . . . . . . . . . . . . . . . . . (1.3) 2.4 (10.7)
Net catastrophe costs . . . . . . . . . . . . . . . . . . . . . . . . . . . . . . . . . . . . . . $202.4 $(5.6) $169.7
A summary of pre-tax net catastrophe costs by segment for 2010, 2009 and 2008 is presented below:
Years Ended December 31,
2010 2009 2008
(in millions)
Domestic . . . . . . . . . . . . . . . . . . . . . . . . . . . . . . . . . . . . . . . . . . . . . . . . . . $ (1.4) $ 0.8 $147.4International-Europe . . . . . . . . . . . . . . . . . . . . . . . . . . . . . . . . . . . . . . . . . . 112.3 (5.8) 22.1International-Other . . . . . . . . . . . . . . . . . . . . . . . . . . . . . . . . . . . . . . . . . . . 91.5 (0.6) 0.2
Total . . . . . . . . . . . . . . . . . . . . . . . . . . . . . . . . . . . . . . . . . . . . . . . . . . . . . $202.4 $(5.6) $169.7
116
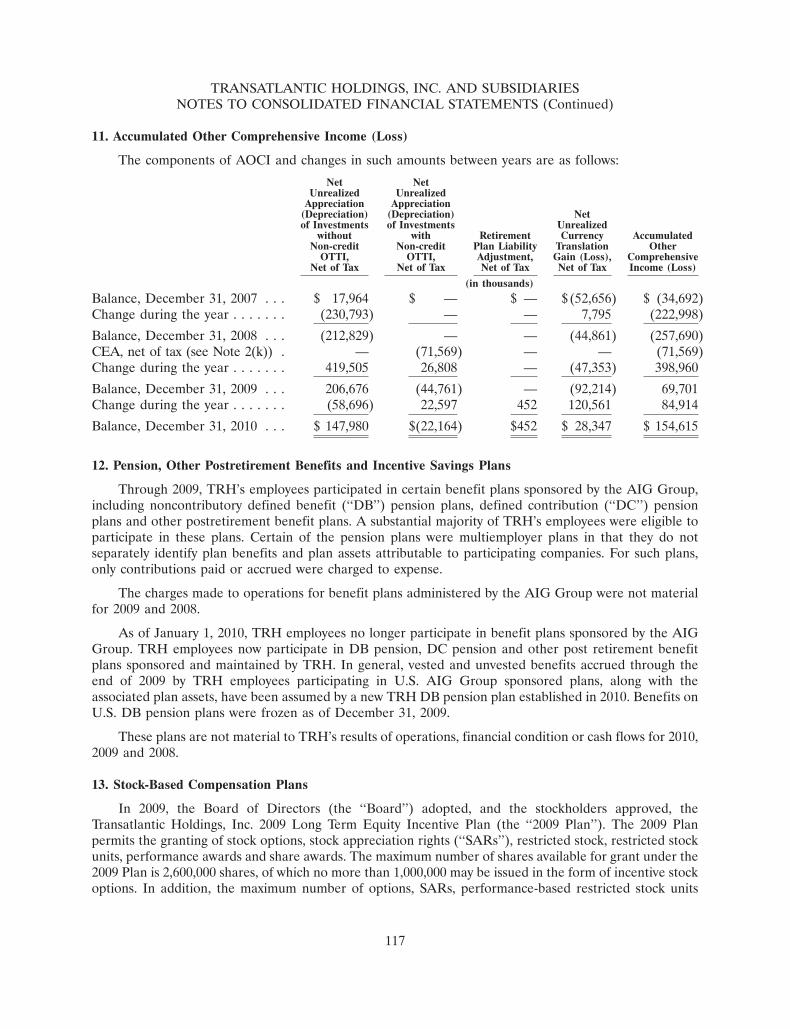
TRANSATLANTIC HOLDINGS, INC. AND SUBSIDIARIESNOTES TO CONSOLIDATED FINANCIAL STATEMENTS (Continued)
11. Accumulated Other Comprehensive Income (Loss)
The components of AOCI and changes in such amounts between years are as follows:
Net NetUnrealized Unrealized
Appreciation Appreciation(Depreciation) (Depreciation) Netof Investments of Investments Unrealized
without with Retirement Currency AccumulatedNon-credit Non-credit Plan Liability Translation Other
OTTI, OTTI, Adjustment, Gain (Loss), ComprehensiveNet of Tax Net of Tax Net of Tax Net of Tax Income (Loss)
(in thousands)
Balance, December 31, 2007 . . . $ 17,964 $ — $ — $(52,656) $ (34,692)Change during the year . . . . . . . (230,793) — — 7,795 (222,998)
Balance, December 31, 2008 . . . (212,829) — — (44,861) (257,690)CEA, net of tax (see Note 2(k)) . — (71,569) — — (71,569)Change during the year . . . . . . . 419,505 26,808 — (47,353) 398,960
Balance, December 31, 2009 . . . 206,676 (44,761) — (92,214) 69,701Change during the year . . . . . . . (58,696) 22,597 452 120,561 84,914
Balance, December 31, 2010 . . . $ 147,980 $(22,164) $452 $ 28,347 $ 154,615
12. Pension, Other Postretirement Benefits and Incentive Savings Plans
Through 2009, TRH’s employees participated in certain benefit plans sponsored by the AIG Group,including noncontributory defined benefit (‘‘DB’’) pension plans, defined contribution (‘‘DC’’) pensionplans and other postretirement benefit plans. A substantial majority of TRH’s employees were eligible toparticipate in these plans. Certain of the pension plans were multiemployer plans in that they do notseparately identify plan benefits and plan assets attributable to participating companies. For such plans,only contributions paid or accrued were charged to expense.
The charges made to operations for benefit plans administered by the AIG Group were not materialfor 2009 and 2008.
As of January 1, 2010, TRH employees no longer participate in benefit plans sponsored by the AIGGroup. TRH employees now participate in DB pension, DC pension and other post retirement benefitplans sponsored and maintained by TRH. In general, vested and unvested benefits accrued through theend of 2009 by TRH employees participating in U.S. AIG Group sponsored plans, along with theassociated plan assets, have been assumed by a new TRH DB pension plan established in 2010. Benefits onU.S. DB pension plans were frozen as of December 31, 2009.
These plans are not material to TRH’s results of operations, financial condition or cash flows for 2010,2009 and 2008.
13. Stock-Based Compensation Plans
In 2009, the Board of Directors (the ‘‘Board’’) adopted, and the stockholders approved, theTransatlantic Holdings, Inc. 2009 Long Term Equity Incentive Plan (the ‘‘2009 Plan’’). The 2009 Planpermits the granting of stock options, stock appreciation rights (‘‘SARs’’), restricted stock, restricted stockunits, performance awards and share awards. The maximum number of shares available for grant under the2009 Plan is 2,600,000 shares, of which no more than 1,000,000 may be issued in the form of incentive stockoptions. In addition, the maximum number of options, SARs, performance-based restricted stock units
117
TRANSATLANTIC HOLDINGS, INC. AND SUBSIDIARIESNOTES TO CONSOLIDATED FINANCIAL STATEMENTS (Continued)
13. Stock-Based Compensation Plans (Continued)
(‘‘Performance RSUs’’) and performance share units granted to an individual in any three year calendarperiod may not exceed 1,000,000 and the maximum dollar amount of cash or the fair market value ofshares that any individual may receive in any calendar year in respect to performance units may not exceed$5 million. As of December 31, 2010, there were 1,019,370 shares of common stock available for issuance(no more than 1,000,000 of which may be incentive stock options) in connection with future grants ofawards under the 2009 Plan. Shares available for future issuance assume participants will earn themaximum number of Performance RSUs until the actual amounts are determined, at which time, suchshares available amount will be adjusted accordingly.
TRH also maintains the Transatlantic Holdings Inc. Partners Plan (the ‘‘Partners Plan’’) and theTransatlantic Holdings, Inc. Senior Partners Plan (the ‘‘Senior Partners Plan’’). Performance RSUsawarded under the Partners Plan and the Senior Partners Plan were granted from the 2009 Plan or, priorto 2009, from the Transatlantic Holdings, Inc. 2003 Stock Incentive Plan, as amended (the ‘‘2003 Plan’’).
The 2009 Plan replaced the Transatlantic Holdings, Inc. 2000 Stock Option Plan, as amended, (the‘‘2000 Plan’’) and the 2003 Plan. No further awards can be granted under the 2000 Plan or the 2003 Plan.
In 2008, the Board adopted, and the stockholders approved, the Transatlantic Holdings, Inc. 2008Non-Employee Directors’ Stock Plan (the ‘‘Non-Employee Directors’ Plan’’). The Non-EmployeeDirectors’ Plan provides that equity-based or equity-related awards can be granted to non-employeedirectors as determined by the Compensation Committee of the Board (the ‘‘Compensation Committee’’).The maximum number of shares available for grant under the Non-Employee Directors’ Plan is 100,000.As of December 31, 2010, there were 53,733 shares of common stock available for issuance in connectionwith future grants of awards under the Non-Employee Directors’ Plan.
At December 31, 2010, TRH had awards outstanding from six stock-based compensation plans:(a) the 2009 Plan; (b) the 2000 Plan; (c) the 2003 Plan; (d) the Non-Employee Directors’ Plan; (e) theTransatlantic Holdings, Inc. 1990 Employee Stock Purchase Plan, as amended (the ‘‘Stock PurchasePlan’’); and (f) the 2010 U.K. Sharesave Plan (the ‘‘Sharesave Plan’’).
Expenses relating to stock-based compensation arrangements totaled $35.3 million, $13.2 million and$18.7 million in 2010, 2009 and 2008, respectively. Income tax benefits recognized related to stock-basedcompensation arrangements totaled $12.3 million, $4.5 million and $6.4 million in 2010, 2009 and 2008,respectively.
Net cash received (paid) from exercises of stock-based compensation was insignificant in 2010 and$1.6 million and ($0.9) million during 2009 and 2008, respectively. The net cash paid from exercises ofstock-based compensation in 2008 is due to the payment of the employee portion of withholding taxes togovernmental tax authorities on vested restricted stock units. TRH has not paid out any cash to settleshare-based payment awards in 2010, 2009 or 2008. Cash savings resulting from excess tax benefits totaled$0.3 million, $0.2 million and $1.8 million in 2010, 2009 and 2008, respectively.
Income tax benefits realized by TRH on stock-based compensation exercises totaled $2.6 million,$0.8 million and $2.5 million in 2010, 2009 and 2008, respectively.
Historically, TRH has settled stock-based compensation exercises through the issuance of new shares.
The impact on the financial statements of the Stock Purchase Plan and the Sharesave Plan was notmaterial to TRH in 2010, 2009 and 2008. A discussion of the more significant stock-based compensationawards follows.
118

TRANSATLANTIC HOLDINGS, INC. AND SUBSIDIARIESNOTES TO CONSOLIDATED FINANCIAL STATEMENTS (Continued)
13. Stock-Based Compensation Plans (Continued)
(a) Stock Options
Options to purchase the Company’s common stock (‘‘TRH shares’’) were granted to certain keyemployees and non-employee directors at prices not less than the New York Stock Exchange (‘‘NYSE’’)closing price on the date of grant under the 2000 Plan. In general, 25% of the options become exercisableon the anniversary date of the grant in each of the four years following the grant and expire 10 years fromthe date of grant.
No options were granted in 2010 or 2009. 197,500 options were granted in 2008. The fair value of eachoption grant is estimated on the date of grant using a binomial option pricing model. The weighted averagegrant date fair value and the weighted average assumptions which were used in the calculation for optionsgranted in 2008 were as follows:
Year EndedDecember 31, 2008
Grant date fair value . . . . . . . . . . . . . . . . . . . . . . . . . . . . . . . . . . . . . . . . . . . . $ 18.82Expected volatility . . . . . . . . . . . . . . . . . . . . . . . . . . . . . . . . . . . . . . . . . . . . . . 20.0%Risk-free interest rate . . . . . . . . . . . . . . . . . . . . . . . . . . . . . . . . . . . . . . . . . . . . 3.5%Dividend yield . . . . . . . . . . . . . . . . . . . . . . . . . . . . . . . . . . . . . . . . . . . . . . . . . 0.93%Expected term . . . . . . . . . . . . . . . . . . . . . . . . . . . . . . . . . . . . . . . . . . . . . . . . . 7.4 years
The expected volatility was based on the historical volatility of TRH shares. The risk-free interest ratewas based on the U.S. treasury yield curve in effect at the time of grant. The dividend yield was based onthe dividend yield over the twelve month period prior to the grant date. The expected term was calculatedbased on historical data on employee exercise behavior.
A summary of the status of options granted as of December 31, 2010 and the changes since January 1,2010 is presented below:
WeightedWeighted Average Aggregate
Number of Average Remaining Intrinsic ValueShares Exercise Price Contractual Life (in thousands)
Outstanding, January 1, 2010 . . . . . . . . . . . . . 2,258,942 $61.77Granted . . . . . . . . . . . . . . . . . . . . . . . . . . . . . — —Exercised . . . . . . . . . . . . . . . . . . . . . . . . . . . . (178,209) 50.80Forfeited or expired . . . . . . . . . . . . . . . . . . . . (55,878) 52.48
Outstanding, December 31, 2010 . . . . . . . . . . . 2,024,855 63.00 3.6 years —(1)
Exercisable, December 31, 2010 . . . . . . . . . . . 1,873,605 62.66 3.4 years —(1)
(1) As of December 31, 2010, all options outstanding and exercisable have aggregate intrinsic values of zero as the exercise price ofthe options exceeded the closing price of TRH shares on the NYSE on December 31, 2010.
The aggregate intrinsic value of options exercised (the aggregate amount by which the market price ofTRH shares at the time of exercise exceeded the exercise price of options exercised) was $0.2 million,$1.6 million and $1.0 million in 2010, 2009 and 2008, respectively. A total of approximately 102,000,167,000 and 190,000 options vested in 2010, 2009 and 2008, respectively, with aggregate grant-date fairvalues of $2.2 million, $3.6 million and $3.8 million in 2010, 2009 and 2008, respectively.
119

TRANSATLANTIC HOLDINGS, INC. AND SUBSIDIARIESNOTES TO CONSOLIDATED FINANCIAL STATEMENTS (Continued)
13. Stock-Based Compensation Plans (Continued)
As of December 31, 2010, there was $1.1 million of total unrecognized compensation costs relating tooptions granted but not yet vested. Compensation expense for options granted is recognized on astraight-line basis. These costs are expected to be recognized over a weighted average period of 1.0 years.
(b) Service-Based Restricted Stock Units (‘‘Service RSUs’’) and Performance RSUs
Service RSUs and Performance RSUs have been granted under the 2009 Plan, the Non-EmployeeDirectors’ Plan and the 2003 Plan to officers, employees and directors of TRH. A summary of the status ofthe Service RSUs and Performance RSUs granted as of December 31, 2010 and the changes sinceJanuary 1, 2010 are presented below:
Weighted AverageNumber of Units Grant Date Fair Value
Service Performance Service PerformanceRSUs RSUs RSUs RSUs
Unvested, January 1, 2010 . . . . . . . . . . . . . . . . . . . . . 606,296 651,310 $48.87 $52.00Granted . . . . . . . . . . . . . . . . . . . . . . . . . . . . . . . . . . 311,640 289,850 47.12 46.92Additional RSUs resulting from satisfaction of
performance condition . . . . . . . . . . . . . . . . . . . . . . — 118,341 — 42.36Vested . . . . . . . . . . . . . . . . . . . . . . . . . . . . . . . . . . . (112,859) (42,960) 61.39 58.51Forfeited or expired . . . . . . . . . . . . . . . . . . . . . . . . . (10,681) (7,181) 47.86 50.44
Unvested, December 31, 2010 . . . . . . . . . . . . . . . . . . 794,396 1,009,360 46.42 49.14
Service PerformanceRSUs RSUs
Unvested RSUs as of December 31, 2010:Weighted average remaining contractual life . . . . . . . . . . . . . . . . . . . . . . . 1.3 years 1.5 yearsAggregate intrinsic value (in thousands) . . . . . . . . . . . . . . . . . . . . . . . . . . $ 41,007 $ 52,103
(1) Service RSUs
Service RSUs have vesting dates ranging from one to four years from the date of grant. As ofDecember 31, 2010, the great majority of Service RSUs will vest on the third anniversary of the date ofgrant for those grantees with continued employment through such date. The Company reserves the right tomake payment for the Service RSUs in TRH shares or the cash equivalent of the fair value of such shareson the date of vesting. The fair values of Service RSUs were estimated on the date of grant based on theclosing market price of TRH shares on the date of grant.
The number of Service RSUs granted and vested in 2010, 2009 and 2008 were as follows:
Years Ended December 31,
2010 2009 2008
Granted . . . . . . . . . . . . . . . . . . . . . . . . . . . . . . . . . . . . . . . . . . . . . . . . 311,640 411,390 103,308Vested . . . . . . . . . . . . . . . . . . . . . . . . . . . . . . . . . . . . . . . . . . . . . . . . . 112,859 21,552 146,150
120

TRANSATLANTIC HOLDINGS, INC. AND SUBSIDIARIESNOTES TO CONSOLIDATED FINANCIAL STATEMENTS (Continued)
13. Stock-Based Compensation Plans (Continued)
As of December 31, 2010, there was $15.1 million of total unrecognized compensation costs relating toService RSUs granted but not yet vested. These costs are expected to be recognized over a weightedaverage period of 1.6 years.
(2) Performance RSUs
Under the Partners Plan, the Compensation Committee awarded to senior executives PerformanceRSUs with a two-year performance period (‘‘Two-Year Performance RSUs’’) that pay out in TRH shares ifperformance goals for a specified period are satisfied. Each Two-Year Performance RSU converts into oneTRH share. Two-Year Performance RSUs operate on the basis of successive overlapping two yearperformance periods, with a new period beginning each year. Recipients earn Performance RSUs based onthe growth in adjusted book value per share of TRH shares (‘‘BVPS Growth’’) during the performanceperiod. Based on the percentage of the BVPS Growth target achieved over the performance period,recipients can earn from 25% to 150% of the awarded number of Performance RSUs. No PerformanceRSUs will be earned if BVPS Growth is less than 25% of target.
A summary of unvested Two-Year Performance RSUs grants as of December 31, 2010 follows:
MaximumNumber of Unvested Earned
Performance PerformancePerformance RSUs Actual RSUs Vests
Year Period Performance Performance Available to Performance EquallyGranted Beginning Period End RSUs Granted be Earned RSUs Earned on January 1,
2006 . . . . January 1, 2006 December 31, 2007 42,925 64,387 64,387 20122006 . . . . January 1, 2007 December 31, 2008 87,683 131,525 100,913 2011 and 20132008 . . . . January 1, 2008 December 31, 2009 92,925 139,388 120,374 2011 and 20122009 . . . . January 1, 2009 December 31, 2010 201,200 301,800 296,925 2012 and 20132010 . . . . January 1, 2010 December 31, 2011 220,850 331,275 N/A(1) 2013 and 2014
(1) Amount undeterminable as of December 31, 2010 as the performance period has not yet ended.
Under the Senior Partners Plan, the Compensation Committee awarded to TRH’s senior-mostexecutives Performance RSUs with a three-year performance period (‘‘Three-Year Performance RSUs’’)that pay out in TRH shares if performance goals for a specified period are satisfied. Each Three-YearPerformance RSU converts into one TRH share. Three-Year Performance RSUs operate on the basis ofsuccessive overlapping three year performance periods, with a new period beginning each year. Recipientsearn Performance RSUs based on BVPS Growth during the performance period. Based on the percentageof the BVPS Growth target achieved over the performance period, recipients can earn from 25% to 200%of the awarded number of Performance RSUs. No Performance RSUs will be earned if BVPS Growth isless than 50% of target.
121

TRANSATLANTIC HOLDINGS, INC. AND SUBSIDIARIESNOTES TO CONSOLIDATED FINANCIAL STATEMENTS (Continued)
13. Stock-Based Compensation Plans (Continued)
A summary of unvested Three-Year Performance RSUs grants as of December 31, 2010 follows:
MaximumNumber of Unvested Earned
Performance PerformancePerformance RSUs Actual RSUs Vests
Year Period Performance Performance Available to Performance Equally onGranted Beginning Period End RSUs Granted be Earned RSUs Earned January 1,
2006 . . . . January 1, 2006 December 31, 2008 12,000 24,000 21,552 20122007 . . . . January 1, 2007 December 31, 2009 27,000 54,000 48,090 2011 and 20132008 . . . . January 1, 2008 December 31, 2010 31,500 63,000 50,866 2011 and 20122009 . . . . January 1, 2009 December 31, 2011 63,300 126,600 N/A(1) 2012 and 20132010 . . . . January 1, 2010 December 31, 2012 69,000 138,000 N/A(1) 2013 and 2014
(1) Amount undeterminable as of December 31, 2010 as the performance period has not yet ended.
The fair values of Performance RSUs are estimated based on the NYSE closing price of TRH shareson the date of grant.
42,960 performance RSUs vested in 2010. No performance RSUs vested in 2009 or 2008.
As of December 31, 2010, there was $25.8 million of total unrecognized compensation costs relating toPerformance RSUs granted but not yet vested. Compensation expense for Performance RSUs isrecognized on a straight-line basis. These costs are expected to be recognized over a weighted averageperiod of 2.0 years.
14. Transactions with AIG
(a) Secondary Public Offerings of the Company’s Common Stock by the AIG Group
Prior to June 10, 2009 and as of December 31, 2008, AIG beneficially owned approximately 59% ofthe Company’s outstanding shares. On June 10, 2009, AIG and AHAC, a wholly owned subsidiary of AIG,consummated the June 2009 Offering of 29.9 million issued and outstanding shares of the common stockof the Company owned by AIG and AHAC. According to the Form 13F filed on February 18, 2010 byAIG, as of December 31, 2009, the AIG Group had sole voting authority over 9.2 million shares of theCompany’s common stock, representing approximately 13.8% of the Company’s outstanding shares as ofDecember 31, 2009.
On March 15, 2010, AHAC consummated the March 2010 Offering of 8.5 million issued andoutstanding shares of the Company’s common stock owned by AHAC. The Company repurchased twomillion shares of its common stock from AHAC in the March 2010 Offering pursuant to a stock offeringagreement for an aggregate purchase price of approximately $105 million. TRH did not receive anyproceeds from the Secondary Offerings. Immediately following the March 2010 Offering, the AIG Group,including AHAC, beneficially owned 0.7 million shares of the Company’s common stock (excluding sharesheld by certain mutual funds that are advised or managed by subsidiaries of AIG), representingapproximately 1.1% of the Company’s then outstanding shares. As a result of its reduced ownershippercentage, the AIG Group was no longer considered a related party after March 15, 2010.
122

TRANSATLANTIC HOLDINGS, INC. AND SUBSIDIARIESNOTES TO CONSOLIDATED FINANCIAL STATEMENTS (Continued)
14. Transactions with AIG (Continued)
(b) Transactions with AIG
After March 15, 2010, the AIG Group ceased to be a related party of TRH, as discussed above. TRHhad service and expense agreements and certain other agreements with the AIG Group which provide forthe reimbursement to the AIG Group of certain administrative and operating expenses which include, butare not limited to, investment advisory, investment recordkeeping, cash management services, office spaceand human resource related activities. Most of these service and expense agreements have ceased onvarious dates in 2009. Under the guidance of TRH’s Finance and Investment Committee of the Board andsenior management, the AIG Group acted as financial advisors and managers of TRH’s investmentportfolio through June 30, 2009. Effective July 1, 2009, TRH employs a third party not affiliated with AIGto provide these services. In 2009 and 2008, $8.9 million and $13.8 million, respectively, of operating andinvestment expenses relate to services provided by the AIG Group under these agreements. There were nomaterial operating or investment expenses related to services provided by the AIG Group in 2010.
Gross premiums written originated by the AIG Group and ceded to TRH from contracts that wereentered into while the AIG Group was a related party totaled approximately $196 million (4.8%),$263 million (6.3%) and $310 million (7.0%) in 2010, 2009 and 2008, respectively. These amounts exclude(a) premiums assumed that initially were insured by AIG subsidiaries as a result of TRH’s marketingefforts and then ceded to TRH by prearrangement; (b) amounts assumed from an AIG subsidiary andceded in an equal amount to other AIG subsidiaries; and (c) all premiums from contracts that wereeffective after March 15, 2010. The amount of premiums assumed that initially were insured by AIGsubsidiaries as a result of TRH’s marketing efforts and then ceded to TRH by prearrangement are notmaterial. (See Note 16 for the amount of premiums assumed from an AIG subsidiary and ceded in anequal amount to other AIG subsidiaries.)
(c) Other
In 2009 and 2008, TRH’s employees participated in certain benefit plans administered by the AIGGroup. (See Note 12.)
15. Dividend Restriction and Statutory Financial Data
The payment of dividends and interest on the Senior Notes by the Company is generally dependent onthe ability of its subsidiaries to pay dividends. The payment of dividends by TRC and its wholly-ownedsubsidiaries, TRZ and Putnam, is restricted by insurance regulations. Under New York insurance law, TRCand Putnam may pay dividends only out of their statutory earned surplus. Such dividends are limited bystatutory formula unless otherwise approved by the New York State Insurance Department (the ‘‘NYSID’’). The statutory surplus of TRC includes the statutory surplus of Putnam since all the capital stock ofPutnam is owned by TRC. Based on statutory surplus of $4.30 billion as of December 31, 2010, TRC wouldbe able to pay dividends of approximately $430 million without regulatory approval by December 31, 2011.
123

TRANSATLANTIC HOLDINGS, INC. AND SUBSIDIARIESNOTES TO CONSOLIDATED FINANCIAL STATEMENTS (Continued)
15. Dividend Restriction and Statutory Financial Data (Continued)
Statutory surplus and net income were as follows:
Years Ended December 31,
2010 2009 2008
(in thousands)
TRCStatutory surplus . . . . . . . . . . . . . . . . . . . . . . . . . . . . . . . . . $4,304,524 $4,016,064 $3,534,148Statutory net income . . . . . . . . . . . . . . . . . . . . . . . . . . . . . . 355,848 415,534 103,448
PutnamStatutory surplus . . . . . . . . . . . . . . . . . . . . . . . . . . . . . . . . . 227,041 203,507 165,888Statutory net income . . . . . . . . . . . . . . . . . . . . . . . . . . . . . . 24,145 33,055 24,719
TRC and Putnam each prepare statutory financial statements in accordance with accounting practicesprescribed or permitted by New York—their state of domicile. Prescribed statutory accounting practicesare discussed in a variety of publications of the National Association of Insurance Commissioners(‘‘NAIC’’), as well as in state laws, regulations and general administrative rules. Permitted statutoryaccounting practices encompass all accounting practices not so prescribed. As required by the State of NewYork, TRC and Putnam use the Codification of Statutory Accounting Principles as primary guidance onstatutory accounting. All material statutory accounting practices of TRC and Putnam are prescribed in theauthoritative literature described above.
16. Reinsurance Ceded
In the normal course of business, TRH generally purchases reinsurance from its retrocessionnaires toreduce the effect of individual or aggregate losses, to reduce volatility in specific lines, to improve riskadjusted portfolio returns and to increase gross premium writings and risk capacity without requiringadditional capital.
TRH’s ceded reinsurance agreements consist of pro rata and excess-of-loss contracts. Under pro ratareinsurance, TRH and its retrocessionnaires share premiums, losses and expenses in an agreed uponproportion. For consideration, generally based on a percentage of premiums of the individual policy orpolicies subject to the reinsurance agreement, excess-of-loss contracts provide reimbursement to TRH forlosses in excess of a predetermined amount up to a predetermined limit.
124

TRANSATLANTIC HOLDINGS, INC. AND SUBSIDIARIESNOTES TO CONSOLIDATED FINANCIAL STATEMENTS (Continued)
16. Reinsurance Ceded (Continued)
Premiums written, premiums earned and losses and LAE incurred are comprised as follows:
Years Ended December 31,
2010 2009 2008
(in thousands)
Gross premiums written . . . . . . . . . . . . . . . . . . . . . . . . . . . . . . $4,132,931 $4,203,777 $4,423,241
Ceded premiums written:Related parties(1) . . . . . . . . . . . . . . . . . . . . . . . . . . . . . . . . . (152,572) (133,625) (188,468)Other . . . . . . . . . . . . . . . . . . . . . . . . . . . . . . . . . . . . . . . . . (98,666) (84,051) (126,681)
(251,238) (217,676) (315,149)
Net premiums written . . . . . . . . . . . . . . . . . . . . . . . . . . . . . . . $3,881,693 $3,986,101 $4,108,092
Gross premiums earned . . . . . . . . . . . . . . . . . . . . . . . . . . . . . . $4,095,795 $4,283,797 $4,365,574
Ceded premiums earned:Related parties(1) . . . . . . . . . . . . . . . . . . . . . . . . . . . . . . . . . (141,165) (156,137) (161,851)Other . . . . . . . . . . . . . . . . . . . . . . . . . . . . . . . . . . . . . . . . . (96,010) (88,578) (136,334)
(237,175) (244,715) (298,185)
Net premiums earned . . . . . . . . . . . . . . . . . . . . . . . . . . . . . . . $3,858,620 $4,039,082 $4,067,389
Gross incurred losses and LAE(2)(3) . . . . . . . . . . . . . . . . . . . . . . $2,863,633 $2,747,213 $3,015,155Reinsured losses and LAE ceded(2)(3) . . . . . . . . . . . . . . . . . . . . (181,859) (68,042) (107,928)
Net losses and LAE incurred . . . . . . . . . . . . . . . . . . . . . . . . . . $2,681,774 $2,679,171 $2,907,227
(1) Premiums written and earned that were ceded to related parties represent amounts from contracts with the AIG Group witheffective dates of March 15, 2010 or earlier. Such ceded premiums principally represent amounts which, by prearrangementwith TRH, were assumed from an AIG subsidiary and then ceded in an equal amount to other AIG subsidiaries. (See Note 14.)
(2) See Note 10 for gross and ceded catastrophe losses.(3) Gross incurred losses and LAE and reinsured losses and LAE ceded include $41 million, $40 million and $62 million in 2010,
2009 and 2008, respectively, related to premiums which, by prearrangement with TRH, were assumed from an AIG subsidiaryand then ceded in an equal amount to other AIG subsidiaries.
Amounts recoverable from retrocessionnaires are recognized in a manner consistent with the claimsliabilities associated with the retrocession and are presented on the balance sheet as reinsurancerecoverable on paid and unpaid losses and LAE. Such balances at December 31, 2010 and 2009 arecomprised as follows:
Paid Unpaid Total
(in thousands)
2010 . . . . . . . . . . . . . . . . . . . . . . . . . . . . . . . . . . . . . . . . . . . . . . . . . $25,897 $793,837 $819,7342009:
Related parties . . . . . . . . . . . . . . . . . . . . . . . . . . . . . . . . . . . . . . . 5,518 261,020 266,538Other . . . . . . . . . . . . . . . . . . . . . . . . . . . . . . . . . . . . . . . . . . . . . . 16,275 464,260 480,535
Ceded reinsurance arrangements do not relieve TRH from its obligations to the insurers andreinsurers from whom it assumes business. The failure of retrocessionnaires to honor their obligationscould result in losses to TRH; consequently, an allowance has been established for estimatedunrecoverable reinsurance on paid and unpaid losses totaling $12.0 million as of December 31, 2010 and2009. During 2010, $0.1 million of reinsurance recoverable on paid and unpaid losses and LAE were
125

TRANSATLANTIC HOLDINGS, INC. AND SUBSIDIARIESNOTES TO CONSOLIDATED FINANCIAL STATEMENTS (Continued)
16. Reinsurance Ceded (Continued)
written off. At December 31, 2010, $8.2 million of the total reinsurance recoverable balance was overdueby more than 90 days, $2.2 million of which was collateralized.
To estimate the allowance for unrecoverable reinsurance on paid and unpaid losses, TRH uses adefault analysis. The primary components of the default analysis are reinsurance recoverable balances byreinsurer, net of collateral, and default factors used to determine the portion of a reinsurer’s balancedeemed uncollectible. Default factors require considerable judgment and are determined using the currentrating, or rating equivalent, of each reinsurer as well as other key considerations and assumptions. AtDecember 31, 2010, the use of different assumptions within our approach could have a material effect onthe provision for unrecoverable reinsurance reflected in our Consolidated Financial Statements. To theextent the creditworthiness of our reinsurers was to deteriorate due to an adverse event, such as a largenumber of major catastrophes, actual uncollectible amounts could be significantly greater than ourprovision for uncollectible reinsurance. Such an event could have a material adverse effect on TRH’sfinancial condition, results of operations, and cash flows.
Under its reinsurance security policy, TRH seeks to cede business to reinsurers generally rated ‘‘A-’’ orbetter. TRH considers reinsurers that are not rated or do not fall within the above rating categories andmay grant exceptions to TRH’s general policy on a case-by-case basis. At December 31, 2010,approximately 89% of total reinsurance recoverable on paid and unpaid losses and LAE balances were duefrom reinsurers rated ‘‘A-’’ or better, 1% were due from reinsurers rated between ‘‘BBB+’’ and ‘‘B’’ while10% were due from reinsurers which were not rated.
With respect to reinsurance recoverable on paid and unpaid losses and LAE, TRH is the beneficiaryof substantial amounts of funds held, trust agreements and letters of credit collateralizing reinsurancerecoverables with respect to certain reinsurers. At December 31, 2010, such funds held, trust agreementsand letters of credit secured $352.1 million of TRH’s reinsurance recoverable on paid and unpaid losses.No uncollateralized amounts recoverable from a single retrocessionnaire are considered material to thefinancial position of TRH.
17. Segment Information
TRH conducts its business and assesses performance through segments organized along geographiclines. The Domestic segment principally includes financial data from branches in the United States exceptMiami, as well as revenues and expenses of the Company (including interest expense on the Senior Notes)and stock-based compensation expense. (See Notes 7 and 13.)
Financial data from the London and Paris branches and from TRZ are reported in the aggregate asInternational-Europe and considered as one segment due to operational and regional similarities. Datafrom the Miami (which serves Latin America and the Caribbean), Toronto, Hong Kong and Tokyobranches are grouped as International-Other and represents the aggregation of segments that are generallynot material. In each segment, property and casualty reinsurance is provided to insurers and reinsurers ona treaty and facultative basis, through brokers or directly to ceding companies.
A significant portion of the assets and liabilities of TRH’s international operations relate to thecountries where ceding companies and reinsurers are located. Most investments are located in the countryof domicile of these operations. In addition to licensing requirements, TRH’s international operations areregulated in various jurisdictions with respect to currency, amount and type of security deposits, amountand type of reserves and amount and type of local investment. Regulations governing constitution of
126

TRANSATLANTIC HOLDINGS, INC. AND SUBSIDIARIESNOTES TO CONSOLIDATED FINANCIAL STATEMENTS (Continued)
17. Segment Information (Continued)
technical reserves and remittance balances in some countries may hinder remittance of profits andrepatriation of assets. International operations and assets held abroad may be adversely affected bypolitical and other developments in foreign countries, including possibilities of tax changes, nationalizationand changes in regulatory policy, as well as by consequences of hostilities and unrest. The risks of suchoccurrences and their overall effect upon TRH vary from country to country and cannot easily bepredicted.
While the majority of premium revenues and assets relate to the regions where particular offices arelocated, a significant portion of such amounts may be derived from other regions of the world.
In addition, three large international brokers, respectively, accounted for assumed premiums equal to25%, 18% and 9% in 2010, 26%, 16% and 8% in 2009 and 28%, 16% and 10% in 2008, of consolidatedrevenues, with a significant portion in each segment. In each year, premiums brokered by companiesacquired are included in the calculated percentages of the acquiror starting in the year of acquisition as ifsuch acquisition had occurred on January 1 of that year.
127

TRANSATLANTIC HOLDINGS, INC. AND SUBSIDIARIESNOTES TO CONSOLIDATED FINANCIAL STATEMENTS (Continued)
17. Segment Information (Continued)
The following table is a summary of financial data by segment:Years Ended December 31,
2010 2009 2008
(in thousands)Domestic:
Net premiums written . . . . . . . . . . . . . . . . . . . . . . . . . . . . . . $ 1,949,520 $ 2,051,053 $ 2,035,661Net premiums earned(1) . . . . . . . . . . . . . . . . . . . . . . . . . . . . . 1,966,543 2,064,778 2,043,053Net investment income . . . . . . . . . . . . . . . . . . . . . . . . . . . . . 320,469 309,747 259,379Realized net capital gains (losses) . . . . . . . . . . . . . . . . . . . . . . 49,568 (54,923) (364,775)Revenues . . . . . . . . . . . . . . . . . . . . . . . . . . . . . . . . . . . . . . . 2,336,465 2,329,471 1,947,907Net losses and LAE . . . . . . . . . . . . . . . . . . . . . . . . . . . . . . . 1,318,584 1,364,082 1,607,543Underwriting expenses(2) . . . . . . . . . . . . . . . . . . . . . . . . . . . . 565,069 565,250 537,379Underwriting profit (loss)(3)(4) . . . . . . . . . . . . . . . . . . . . . . . . . 82,890 135,446 (101,869)Income (loss) before income taxes . . . . . . . . . . . . . . . . . . . . . 354,055 327,070 (263,911)Identifiable assets(6) . . . . . . . . . . . . . . . . . . . . . . . . . . . . . . . . 9,749,420 9,412,298 8,469,294
International-Europe:Net premiums written . . . . . . . . . . . . . . . . . . . . . . . . . . . . . . $ 1,401,884 $ 1,405,209 $ 1,562,118Net premiums earned . . . . . . . . . . . . . . . . . . . . . . . . . . . . . . 1,373,393 1,442,326 1,525,334Net investment income . . . . . . . . . . . . . . . . . . . . . . . . . . . . . 119,414 125,114 146,202Realized net capital losses . . . . . . . . . . . . . . . . . . . . . . . . . . . (7,881) (12,640) (51,848)Revenues . . . . . . . . . . . . . . . . . . . . . . . . . . . . . . . . . . . . . . . 1,484,926 1,554,800 1,619,688Net losses and LAE . . . . . . . . . . . . . . . . . . . . . . . . . . . . . . . 1,035,560 1,066,717 1,051,019Underwriting expenses(2) . . . . . . . . . . . . . . . . . . . . . . . . . . . . 349,731 364,652 400,326Underwriting (loss) profit(3)(4) . . . . . . . . . . . . . . . . . . . . . . . . . (11,898) 10,957 73,989Income before income taxes . . . . . . . . . . . . . . . . . . . . . . . . . . 98,358 123,620 168,283Identifiable assets(6) . . . . . . . . . . . . . . . . . . . . . . . . . . . . . . . . 4,219,417 4,038,126 3,630,496
International-Other(5):Net premiums written . . . . . . . . . . . . . . . . . . . . . . . . . . . . . . $ 530,289 $ 529,839 $ 510,313Net premiums earned . . . . . . . . . . . . . . . . . . . . . . . . . . . . . . 518,684 531,978 499,002Net investment income . . . . . . . . . . . . . . . . . . . . . . . . . . . . . 33,664 32,541 34,870Realized net capital losses . . . . . . . . . . . . . . . . . . . . . . . . . . . (11,586) (3,078) (18,918)Revenues . . . . . . . . . . . . . . . . . . . . . . . . . . . . . . . . . . . . . . . 540,762 561,441 514,954Net losses and LAE . . . . . . . . . . . . . . . . . . . . . . . . . . . . . . . 327,630 248,372 248,665Underwriting expenses(2) . . . . . . . . . . . . . . . . . . . . . . . . . . . . 192,746 168,603 167,520Underwriting (loss) profit(3)(4) . . . . . . . . . . . . . . . . . . . . . . . . . (1,692) 115,003 82,817Income before income taxes . . . . . . . . . . . . . . . . . . . . . . . . . . 20,375 145,343 98,851Identifiable assets(6) . . . . . . . . . . . . . . . . . . . . . . . . . . . . . . . . 1,736,517 1,493,235 1,277,148
Consolidated:Net premiums written . . . . . . . . . . . . . . . . . . . . . . . . . . . . . . $ 3,881,693 $ 3,986,101 $ 4,108,092Net premiums earned(1) . . . . . . . . . . . . . . . . . . . . . . . . . . . . . 3,858,620 4,039,082 4,067,389Net investment income . . . . . . . . . . . . . . . . . . . . . . . . . . . . . 473,547 467,402 440,451Realized net capital gains (losses) . . . . . . . . . . . . . . . . . . . . . . 30,101 (70,641) (435,541)Revenues . . . . . . . . . . . . . . . . . . . . . . . . . . . . . . . . . . . . . . . 4,362,153 4,445,712 4,082,549Net losses and LAE . . . . . . . . . . . . . . . . . . . . . . . . . . . . . . . 2,681,774 2,679,171 2,907,227Underwriting expenses(2) . . . . . . . . . . . . . . . . . . . . . . . . . . . . 1,107,546 1,098,505 1,105,225Underwriting profit(3)(4) . . . . . . . . . . . . . . . . . . . . . . . . . . . . . 69,300 261,406 54,937Income before income taxes . . . . . . . . . . . . . . . . . . . . . . . . . . 472,788 596,033 3,223Identifiable assets(6) . . . . . . . . . . . . . . . . . . . . . . . . . . . . . . . . 15,705,354 14,943,659 13,376,938
(1) Net premiums earned from the AIG Group from contracts with effective dates of March 15, 2010 or prior were approximately$244.6 million, $334.0 million and $386.5 million in 2010, 2009 and 2008, respectively, and are included mainly in Domestic.(See Note 14 of Notes to Consolidated Financial Statements.)
(footnotes continued on next page)
128
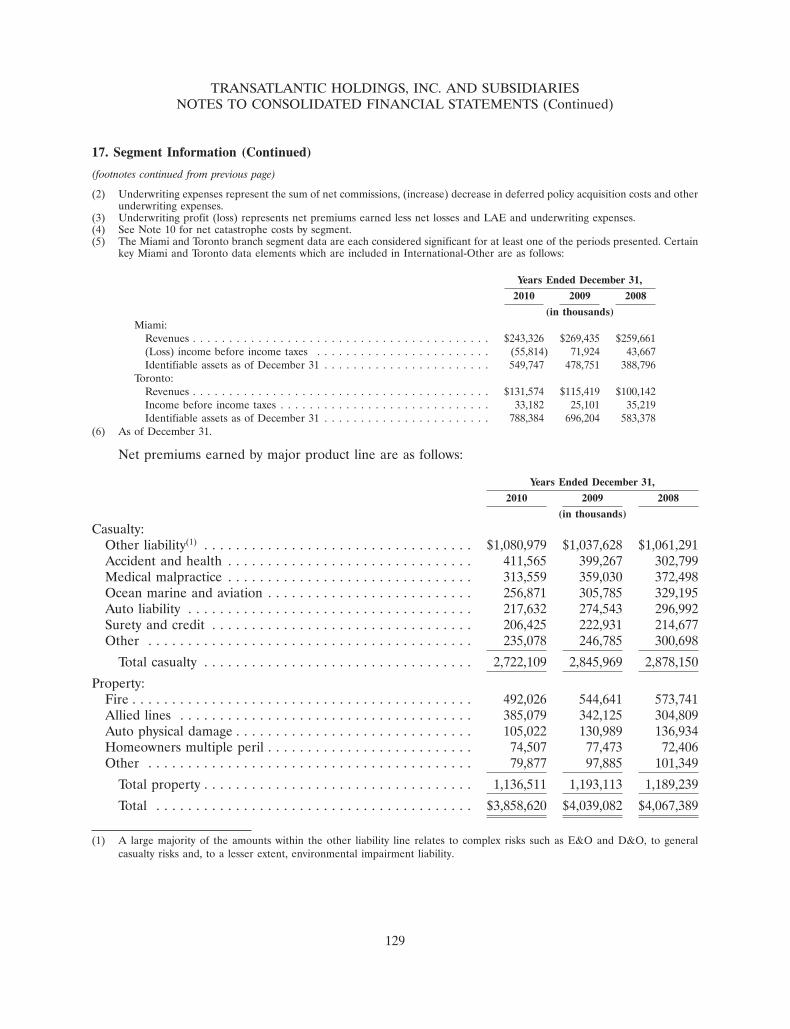
TRANSATLANTIC HOLDINGS, INC. AND SUBSIDIARIESNOTES TO CONSOLIDATED FINANCIAL STATEMENTS (Continued)
17. Segment Information (Continued)
(footnotes continued from previous page)
(2) Underwriting expenses represent the sum of net commissions, (increase) decrease in deferred policy acquisition costs and otherunderwriting expenses.
(3) Underwriting profit (loss) represents net premiums earned less net losses and LAE and underwriting expenses.(4) See Note 10 for net catastrophe costs by segment.(5) The Miami and Toronto branch segment data are each considered significant for at least one of the periods presented. Certain
key Miami and Toronto data elements which are included in International-Other are as follows:
Years Ended December 31,
2010 2009 2008
(in thousands)Miami:
Revenues . . . . . . . . . . . . . . . . . . . . . . . . . . . . . . . . . . . . . . . . . $243,326 $269,435 $259,661(Loss) income before income taxes . . . . . . . . . . . . . . . . . . . . . . . . (55,814) 71,924 43,667Identifiable assets as of December 31 . . . . . . . . . . . . . . . . . . . . . . . 549,747 478,751 388,796
Toronto:Revenues . . . . . . . . . . . . . . . . . . . . . . . . . . . . . . . . . . . . . . . . . $131,574 $115,419 $100,142Income before income taxes . . . . . . . . . . . . . . . . . . . . . . . . . . . . . 33,182 25,101 35,219Identifiable assets as of December 31 . . . . . . . . . . . . . . . . . . . . . . . 788,384 696,204 583,378
(6) As of December 31.
Net premiums earned by major product line are as follows:
Years Ended December 31,
2010 2009 2008
(in thousands)
Casualty:Other liability(1) . . . . . . . . . . . . . . . . . . . . . . . . . . . . . . . . . . $1,080,979 $1,037,628 $1,061,291Accident and health . . . . . . . . . . . . . . . . . . . . . . . . . . . . . . . 411,565 399,267 302,799Medical malpractice . . . . . . . . . . . . . . . . . . . . . . . . . . . . . . . 313,559 359,030 372,498Ocean marine and aviation . . . . . . . . . . . . . . . . . . . . . . . . . . 256,871 305,785 329,195Auto liability . . . . . . . . . . . . . . . . . . . . . . . . . . . . . . . . . . . . 217,632 274,543 296,992Surety and credit . . . . . . . . . . . . . . . . . . . . . . . . . . . . . . . . . 206,425 222,931 214,677Other . . . . . . . . . . . . . . . . . . . . . . . . . . . . . . . . . . . . . . . . . 235,078 246,785 300,698
Total casualty . . . . . . . . . . . . . . . . . . . . . . . . . . . . . . . . . . 2,722,109 2,845,969 2,878,150
Property:Fire . . . . . . . . . . . . . . . . . . . . . . . . . . . . . . . . . . . . . . . . . . . 492,026 544,641 573,741Allied lines . . . . . . . . . . . . . . . . . . . . . . . . . . . . . . . . . . . . . 385,079 342,125 304,809Auto physical damage . . . . . . . . . . . . . . . . . . . . . . . . . . . . . . 105,022 130,989 136,934Homeowners multiple peril . . . . . . . . . . . . . . . . . . . . . . . . . . 74,507 77,473 72,406Other . . . . . . . . . . . . . . . . . . . . . . . . . . . . . . . . . . . . . . . . . 79,877 97,885 101,349
Total property . . . . . . . . . . . . . . . . . . . . . . . . . . . . . . . . . . 1,136,511 1,193,113 1,189,239
Total . . . . . . . . . . . . . . . . . . . . . . . . . . . . . . . . . . . . . . . . $3,858,620 $4,039,082 $4,067,389
(1) A large majority of the amounts within the other liability line relates to complex risks such as E&O and D&O, to generalcasualty risks and, to a lesser extent, environmental impairment liability.
129

TRANSATLANTIC HOLDINGS, INC. AND SUBSIDIARIESNOTES TO CONSOLIDATED FINANCIAL STATEMENTS (Continued)
18. Commitments and Contingent Liabilities
(a) Legal Proceedings
TRH, in common with the reinsurance industry in general, is subject to litigation in the normal courseof its business. TRH does not believe that any pending litigation will have a material adverse effect on itsconsolidated results of operations, financial position or cash flows.
In the ordinary course of business, TRH is involved in lawsuits, arbitrations and other formal andinformal dispute resolution procedures, the outcomes of which will determine TRH’s rights andobligations under reinsurance agreements and other more general contracts. In some disputes, TRH seeksto enforce its rights under an agreement or to collect funds owing to it. In other matters, TRH is resistingattempts by others to enforce alleged rights. Such disputes are resolved through formal and informalmeans, including litigation, arbitration and mediation.
In all such matters, TRH believes that its positions are legally and commercially reasonable. TRH alsoregularly evaluates those positions, and where appropriate, establishes or adjusts loss reserves to reflect itsevaluation. TRH’s aggregate loss reserves take into account the possibility that TRH may not ultimatelyprevail in each and every disputed matter. TRH takes into consideration changes in judicial interpretationof legal liability and policy coverages, changes in claims handling practices and inflation. TRH considersnot only monetary increases in the cost of what it reinsures, but also changes in societal factors thatinfluence jury verdicts and case law, TRH’s approach to claim resolution, and, in turn, claim costs. TRHbelieves its aggregate loss reserves reduce the potential that an adverse resolution of one or more of thesematters, at any point in time, would have a material impact on TRH’s financial condition or results ofoperations. However, there can be no assurance that adverse resolutions of such matters in any one periodor in the aggregate will not result in a material adverse effect on TRH’s results of operations or financialcondition.
On May 21, 2010, the Company and its subsidiaries, TRC and TRZ (collectively, the ‘‘TRH Parties’’),filed a demand for arbitration, with the American Arbitration Association, against AIG, AIG SecuritiesLending Corp. and AIG Securities Lending (Ireland) Ltd. (collectively, ‘‘AIG Securities Lending’’) forlosses in excess of $350 million suffered by TRH arising from its participation in a securities lendingprogram administered and managed by AIG Securities Lending during the period that TRH wascontrolled by AIG. The TRH Parties’ participations in such securities lending program ended in the fourthquarter of 2008. While the final outcome cannot be predicted with certainty, TRH believes this arbitration,when resolved, will not have a material adverse effect on TRH’s results of operations, financial position orcash flows.
On September 30, 2009, TRC initiated arbitration proceedings, with the AIDA Reinsurance andInsurance Arbitration Society, against United Guaranty Residential Insurance Company, United GuarantyMortgage Indemnity Company, United Guaranty Credit Insurance Company and United GuarantyResidential Insurance Company of North Carolina (collectively, ‘‘UGC’’), each a subsidiary of the AIGGroup. The arbitration proceedings involve certain contracts related to subprime mortgages and creditdefault insurance pursuant to which UGC purchased reinsurance from TRC (the ‘‘Disputed Contracts’’).TRC seeks in the proceedings, among other things, to rescind the Disputed Contracts. While the finaloutcome cannot be predicted with certainty, TRH believes these arbitration proceedings, when resolved,will not have a material adverse effect on TRH’s consolidated results of operations, financial position orcash flows.
130

TRANSATLANTIC HOLDINGS, INC. AND SUBSIDIARIESNOTES TO CONSOLIDATED FINANCIAL STATEMENTS (Continued)
18. Commitments and Contingent Liabilities (Continued)
In addition, from time to time, regulators commence investigations into insurance and reinsurance-industry practices. TRH has cooperated, and will continue to cooperate, in producing documents and otherinformation in response to subpoenas and other requests. While TRH does not believe that any of theseinquiries will have a material impact on TRH’s business or financial results, it is not possible to predictwith any certainty at this time what impact, if any, these inquiries may have on TRH’s business or financialresults.
(b) Commercial Commitments
In the normal course of business, TRH has letters of credit outstanding as of December 31, 2010totaling $67.9 million. These letters of credit are provided to secure certain loss reserves and otherbalances due to ceding companies. Where TRH provides a letter of credit, it is generally contractuallyobligated to continue to provide a letter of credit to the ceding company in the future to secure certainreserves and other balances.
(c) Leases
As of December 31, 2010, the future minimum lease payments (principally for leased office space)under various long-term operating leases were as follows:
(in thousands)
2011 . . . . . . . . . . . . . . . . . . . . . . . . . . . . . . . . . . . . . . . . . . . . . . . . . . . . . . . . . . . . . . $12,2922012 . . . . . . . . . . . . . . . . . . . . . . . . . . . . . . . . . . . . . . . . . . . . . . . . . . . . . . . . . . . . . . 11,9292013 . . . . . . . . . . . . . . . . . . . . . . . . . . . . . . . . . . . . . . . . . . . . . . . . . . . . . . . . . . . . . . 9,8842014 . . . . . . . . . . . . . . . . . . . . . . . . . . . . . . . . . . . . . . . . . . . . . . . . . . . . . . . . . . . . . . 9,0502015 . . . . . . . . . . . . . . . . . . . . . . . . . . . . . . . . . . . . . . . . . . . . . . . . . . . . . . . . . . . . . . 8,635Remaining years after 2015 (from 2016 to 2021) . . . . . . . . . . . . . . . . . . . . . . . . . . . . . . 32,445
Total . . . . . . . . . . . . . . . . . . . . . . . . . . . . . . . . . . . . . . . . . . . . . . . . . . . . . . . . . . . . $84,235
Rent expense approximated $12.5 million, $12.9 million and $12.0 million in 2010, 2009 and 2008,respectively.
(d) Funding Commitment
In 2010, TRH entered into a funding agreement with a non-U.S. reinsurer to provide funding by May2011 to serve as collateral against losses on property catastrophe business the reinsurer will underwrite andthen cede to TRH. As of December 31, 2010, TRH had funding commitments of approximately$16 million outstanding relating to this agreement.
19. Employee Retention Plan
In October 2008, TRH adopted a retention program (the ‘‘Retention Plan’’) covering a significantnumber of its employees, including its senior-most management. Salary expenses incurred related to theRetention Plan totaled nil in 2010 and approximately $20 million and $8 million in 2009 and 2008,respectively.
131

TRANSATLANTIC HOLDINGS, INC. AND SUBSIDIARIESNOTES TO CONSOLIDATED FINANCIAL STATEMENTS (Continued)
20. Quarterly Financial Information (Unaudited)
The following is a summary of unaudited quarterly financial data for each of the years endedDecember 31, 2010 and 2009. However, in the opinion of management, all adjustments, consisting ofnormal recurring accruals, necessary for a fair statement of the results of operations for such periods havebeen made. (See Note 5.)
Three Months Ended
March 31, June 30, September 30, December 31,
2010 2009 2010 2009 2010 2009 2010 2009
(in thousands, except per share data)Net premiums written . . $1,026,299 $1,047,102 $947,589 $1,006,340 $1,007,030 $ 972,572 $900,775 $ 960,087Net premiums earned . . 992,595 976,531 973,752 1,028,268 958,291 1,008,082 933,982 1,026,201Net investment income . 112,610 109,818 115,774 111,201 123,840 123,205 121,323 123,178Realized net capital
(losses) gains . . . . . . (1,889) (60,571) 8,277 (25,485) 10,567 6,600 13,146 8,815Total expenses . . . . . . . 1,084,236 945,380 967,208 976,373 928,549 941,808 909,372 986,118Net income . . . . . . . . . 15,875 75,236 110,510 112,284 134,056 153,263 141,760 136,879Net income per
common share:Basic . . . . . . . . . . . . 0.24 1.13 1.72 1.69 2.11 2.31 2.26 2.06Diluted . . . . . . . . . . 0.24 1.13 1.70 1.68 2.08 2.28 2.22 2.04
21. Subsequent Event
During 2011, portions of Australia experienced severe damage from several events, including theBrisbane area floods and Cyclone Yasi. Based on an analysis of preliminary data, TRH expects to incurpre-tax net catastrophe costs (net of reinstatement premiums) of between $50 million and $100 million inthe first quarter of 2011. This range reflects estimated total insured losses from these events of $3 billion to$5 billion. Due to the preliminary nature of the information used to prepare this estimate, among otherfactors, the ultimate costs that TRH will incur related to these events may differ materially from thisestimate.
132

Item 9.
TRANSATLANTIC HOLDINGS, INC. AND SUBSIDIARIESCHANGES IN AND DISAGREEMENTS WITH ACCOUNTANTS ON ACCOUNTING AND
FINANCIAL DISCLOSURE
There have been no changes in nor any disagreements with accountants on accounting and financialdisclosure within the twenty-four months ended December 31, 2010.
Item 9A.
TRANSATLANTIC HOLDINGS, INC. AND SUBSIDIARIESCONTROLS AND PROCEDURES
Conclusion Regarding the Effectiveness of Disclosure Controls and Procedures
As of the end of the period covered by this report, an evaluation was carried out by TRH’smanagement, with the participation of TRH’s Chief Executive Officer and Chief Financial Officer, of theeffectiveness of TRH’s disclosure controls and procedures (as defined in Rule 13a-15(e) under theSecurities Exchange Act of 1934). Based upon that evaluation, TRH’s Chief Executive Officer and ChiefFinancial Officer concluded that these disclosure controls and procedures were effective as of the end ofthe period covered by this report. In addition, no change in TRH’s internal control over financial reporting(as defined in Rule 13a-15(f) under the Securities Exchange Act of 1934) occurred during the fourthquarter of TRH’s fiscal year ended December 31, 2010 that has materially affected, or is reasonably likelyto materially affect, TRH’s internal control over financial reporting.
Management’s Report on Internal Control Over Financial Reporting
Management of TRH is responsible for establishing and maintaining adequate internal control overfinancial reporting. TRH’s internal control over financial reporting is a process designed under thesupervision of TRH’s principal executive and principal financial officers to provide reasonable assuranceregarding the reliability of financial reporting and the preparation of TRH’s financial statements forexternal reporting purposes in accordance with U.S. generally accepted accounting principles.
As of the end of TRH’s 2010 fiscal year, management conducted an assessment of the effectiveness ofTRH’s internal control over financial reporting based on the framework established in Internal Control—Integrated Framework issued by the Committee of Sponsoring Organizations of the Treadway Commission(‘‘COSO’’). Based on this assessment, management has concluded that TRH’s internal control overfinancial reporting as of December 31, 2010 is effective.
TRH’s internal control over financial reporting includes policies and procedures that pertain to themaintenance of records that, in reasonable detail, accurately and fairly reflect transactions and dispositionsof assets; provide reasonable assurances that transactions are recorded as necessary to permit preparationof financial statements in accordance with accounting principles generally accepted in the United States ofAmerica, and that receipts and expenditures are being made only in accordance with authorizations ofmanagement and the directors of TRH; and provide reasonable assurance regarding prevention or timelydetection of unauthorized acquisition, use or disposition of TRH’s assets that could have a material effecton TRH’s financial statements.
The effectiveness of TRH’s internal control over financial reporting as of December 31, 2010 has beenaudited by PricewaterhouseCoopers LLP, an independent registered public accounting firm, as stated intheir report included herein, which expresses an unqualified opinion on the effectiveness of TRH’s internalcontrol over financial reporting as of December 31, 2010.
133
Item 9B.
TRANSATLANTIC HOLDINGS, INC. AND SUBSIDIARIESOTHER INFORMATION
None.
PART III
Item 10.
TRANSATLANTIC HOLDINGS, INC. AND SUBSIDIARIESDIRECTORS, EXECUTIVE OFFICERS AND CORPORATE GOVERNANCE
Except for the information relating to executive officers of Transatlantic Holdings, Inc. (the‘‘Company’’, and collectively with its subsidiaries, ‘‘TRH’’) included in Part I of this Annual Report onForm 10-K under the heading ‘‘Executive Officers of the Registrant’’ and in this paragraph, informationrequired by this item will be included in the Company’s Proxy Statement for the 2011 Annual Meeting ofStockholders, to be filed with the Securities and Exchange Commission (the ‘‘SEC’’) within 120 days afterthe end of the Company’s fiscal year (the ‘‘2011 Proxy Statement’’), and such information is incorporatedherein by reference. TRH has adopted a code of ethics that applies to its principal executive officer andprincipal financial and accounting officer that establishes minimum standards of professional responsibilityand ethical conduct. This code of ethics is available on TRH’s website at http://www.transre.com.
Item 11.
TRANSATLANTIC HOLDINGS, INC. AND SUBSIDIARIESEXECUTIVE COMPENSATION
This item is omitted because a definitive proxy statement which involves the election of directors willbe filed with the SEC not later than 120 days after the close of the fiscal year pursuant to Regulation 14A.
Item 12.
TRANSATLANTIC HOLDINGS, INC. AND SUBSIDIARIESSECURITY OWNERSHIP OF CERTAIN BENEFICIAL OWNERS AND MANAGEMENT AND
RELATED STOCKHOLDER MATTERS
This item is omitted because a definitive proxy statement which involves the election of directors willbe filed with the SEC not later than 120 days after the close of the fiscal year pursuant to Regulation 14A.
134

In addition, summarized information with respect to equity compensation granted by the Company asof December 31, 2010 is as follows:
Number ofSecuritiesRemaining
Available forFuture
Number of IssuanceSecurities under Equity
to be Issued Weighted Average CompensationUpon Exercise Exercise Price Plans (Excludingof Outstanding of Outstanding Securities
Options, Warrants Option, Warrants Reflected inand Rights and Rights(2) Column (a))(3)
Plan Category (a) (b) (c)
Equity compensation plans approved by securityholders:Stock options . . . . . . . . . . . . . . . . . . . . . . . . . . 2,024,855 $63.00Service & performance restricted stock units(1) . . 2,054,816 —
Total equity compensation plans approved bysecurity holders . . . . . . . . . . . . . . . . . . . . . 4,079,671 31.27 2,717,064
Equity compensation plan not approved by securityholders . . . . . . . . . . . . . . . . . . . . . . . . . . . . . . . — — —
Total . . . . . . . . . . . . . . . . . . . . . . . . . . . . . . . . 4,079,671 $31.27 2,717,064
(1) Includes 8,335 vested but unissued restricted stock units.(2) For purposes of calculating the total average weighted exercise price, service and performance restricted stock units are
included at a zero exercise price. Excluding service and performance restricted stock units, the weighted average exercise priceof all outstanding options, warrants and rights from equity compensation plans would be $63.00.
(3) The number of shares available for issuance by equity compensation plan consists of: 1,019,370 shares under the TransatlanticHoldings, Inc. 2009 Long Term Equity Incentive Plan; 53,733 shares under the Transatlantic Holdings, Inc. 2008 Non-EmployeeDirectors’ Stock Plan; 1,543,961 shares under the Transatlantic Holdings, Inc. 1990 Employee Stock Purchase Plan, as amended(to which there were 17,787 shares subject to purchase as of December 31, 2010); and 100,000 shares under the TransatlanticHoldings, Inc. 2010 U.K. Sharesave Plan (to which there were 4,500 shares subject to purchase as of December 31, 2010).
Item 13.
TRANSATLANTIC HOLDINGS, INC. AND SUBSIDIARIESCERTAIN RELATIONSHIPS AND RELATED TRANSACTIONS, AND DIRECTOR
INDEPENDENCE
This item is omitted because a definitive proxy statement which involves the election of directors willbe filed with the SEC not later than 120 days after the close of the fiscal year pursuant to Regulation 14A.
Item 14.
TRANSATLANTIC HOLDINGS, INC. AND SUBSIDIARIESPRINCIPAL ACCOUNTANT FEES AND SERVICES
This item is omitted because a definitive proxy statement which involves the election of directors willbe filed with the SEC not later than 120 days after the close of the fiscal year pursuant to Regulation 14A.
135

PART IV
Item 15.
TRANSATLANTIC HOLDINGS, INC. AND SUBSIDIARIESEXHIBITS AND FINANCIAL STATEMENT SCHEDULES
(a) Financial Statements and Exhibits
1. Financial Statements and Schedules
See accompanying Index to Consolidated Financial Statements in Item 8. Schedules notincluded in the accompanying index have been omitted because they are not applicable.
2. Exhibits
21.1 — Subsidiaries of Registrant.23.1 — Consent of PricewaterhouseCoopers LLP.31.1 — Certification pursuant to Section 302 of the Sarbanes-Oxley Act of 2002, by
Robert F. Orlich, President and Chief Executive Officer.31.2 — Certification pursuant to Section 302 of the Sarbanes-Oxley Act of 2002, by
Steven S. Skalicky, Executive Vice President and Chief Financial Officer.32.1 — Certification pursuant to 18 U.S.C. Section 1350, as adopted pursuant to
Section 906 of the Sarbanes-Oxley Act of 2002, by Robert F. Orlich, Presidentand Chief Executive Officer.
32.2 — Certification pursuant to 18 U.S.C. Section 1350, as adopted pursuant toSection 906 of the Sarbanes-Oxley Act of 2002, by Steven S. Skalicky, ExecutiveVice President and Chief Financial Officer.
See accompanying Exhibit Index for additional Exhibits incorporated by reference.
136

SIGNATURES
Pursuant to the requirements of Section 13 or 15(d) of the Securities Exchange Act of 1934, theregistrant has duly caused this report to be signed on its behalf by the undersigned, thereunto dulyauthorized.
TRANSATLANTIC HOLDINGS, INC.
By: /s/ ROBERT F. ORLICH
Robert F. OrlichTitle: President and Chief Executive Officer
February 22, 2011
Pursuant to the requirements of the Securities Exchange Act of 1934, this report has been signedbelow by the following persons on behalf of the registrant and in the capacities and on the dates indicated.
Signature Title Date
President and Chief Executive Officer/s/ ROBERT F. ORLICH(principal executive officer) and February 22, 2011
Robert F. Orlich Director
Executive Vice President and Chief/s/ STEVEN S. SKALICKYFinancial Officer (principal financial February 22, 2011
Steven S. Skalicky and accounting officer)
/s/ RICHARD S. PRESSChairman February 22, 2011
Richard S. Press
/s/ STEPHEN P. BRADLEYDirector February 22, 2011
Stephen P. Bradley
/s/ IAN H. CHIPPENDALEDirector February 22, 2011
Ian H. Chippendale
/s/ JOHN G. FOOSDirector February 22, 2011
John G. Foos
/s/ REUBEN JEFFERY IIIDirector February 22, 2011
Reuben Jeffery III
/s/ JOHN L. MCCARTHYDirector February 22, 2011
John L. McCarthy
/s/ THOMAS R. TIZZIODirector February 22, 2011
Thomas R. Tizzio
137

(This page has been left blank intentionally.)

SCHEDULE I
TRANSATLANTIC HOLDINGS, INC. AND SUBSIDIARIESSUMMARY OF INVESTMENTS—OTHER THAN INVESTMENTS IN RELATED PARTIES
As of December 31, 2010
Amount atWhich Shown
Cost or in theAmortized Fair Balance
Type of Investment Cost(1) Value Sheet
(in thousands)
Fixed maturities:U.S. Government and government agencies . . . . . . . . . . . $ 880,872 $ 890,225 $ 890,225States, municipalities and political subdivisions . . . . . . . . . 5,975,408 6,082,317 6,031,440Foreign governments . . . . . . . . . . . . . . . . . . . . . . . . . . . . 790,710 801,308 801,308Corporate . . . . . . . . . . . . . . . . . . . . . . . . . . . . . . . . . . . . 3,637,033 3,695,352 3,695,352Asset-backed:
Residential mortgage-backed . . . . . . . . . . . . . . . . . . . . . 285,431 244,540 244,540Commercial mortgage-backed . . . . . . . . . . . . . . . . . . . . 248,258 249,991 249,991Other asset-backed . . . . . . . . . . . . . . . . . . . . . . . . . . . . 99,806 99,281 99,281
Total fixed maturities . . . . . . . . . . . . . . . . . . . . . . . . 11,917,518 12,063,014 12,012,137
Equities:Common stocks:
Public utilities and transportation . . . . . . . . . . . . . . . . . 42,252 51,496 51,496Banking and financial . . . . . . . . . . . . . . . . . . . . . . . . . . 153,306 169,781 169,781All other . . . . . . . . . . . . . . . . . . . . . . . . . . . . . . . . . . . 275,958 338,253 338,253
Total common stocks . . . . . . . . . . . . . . . . . . . . . . . . . 471,516 559,530 559,530Nonredeemable preferred stocks . . . . . . . . . . . . . . . . . . . 5,000 5,000 5,000
Total equities . . . . . . . . . . . . . . . . . . . . . . . . . . . . . . 476,516 564,530 564,530
Other invested assets . . . . . . . . . . . . . . . . . . . . . . . . . . . . . 265,044 275,977 275,977Short-term investments . . . . . . . . . . . . . . . . . . . . . . . . . . . . 120,095 120,095 120,095
Total investments . . . . . . . . . . . . . . . . . . . . . . . . . . . $12,779,173 $13,023,616 $12,972,739
(1) Investments in fixed maturities are shown at amortized cost.
S-1

SCHEDULE II
TRANSATLANTIC HOLDINGS, INC. AND SUBSIDIARIESCONDENSED FINANCIAL INFORMATION OF REGISTRANT
BALANCE SHEETS(Parent Company Only)
As of December 31, 2010 and 2009
2010 2009
(in thousands,except share data)
Assets:Fixed maturities available for sale, at fair value (amortized cost: 2010—
$146,103; 2009—$36,493) . . . . . . . . . . . . . . . . . . . . . . . . . . . . . . . . . . . $ 147,652 $ 36,359Short-term investments, at cost (approximates fair value) . . . . . . . . . . . . . . 50,207 323,734Cash and cash equivalents . . . . . . . . . . . . . . . . . . . . . . . . . . . . . . . . . . . . 52,202 —Investment in subsidiaries . . . . . . . . . . . . . . . . . . . . . . . . . . . . . . . . . . . . 4,915,380 4,640,617Dividend due from subsidiary . . . . . . . . . . . . . . . . . . . . . . . . . . . . . . . . . . 100,000 30,000Other assets . . . . . . . . . . . . . . . . . . . . . . . . . . . . . . . . . . . . . . . . . . . . . . 62,729 50,057
Total assets . . . . . . . . . . . . . . . . . . . . . . . . . . . . . . . . . . . . . . . . . . . . . $5,328,170 $5,080,767
Liabilities:Dividends payable . . . . . . . . . . . . . . . . . . . . . . . . . . . . . . . . . . . . . . . . . . $ 13,200 $ 13,300Senior notes . . . . . . . . . . . . . . . . . . . . . . . . . . . . . . . . . . . . . . . . . . . . . . 1,030,511 1,033,087
Total liabilities . . . . . . . . . . . . . . . . . . . . . . . . . . . . . . . . . . . . . . . . . . . 1,043,711 1,046,387
Stockholders’ equity:Preferred Stock . . . . . . . . . . . . . . . . . . . . . . . . . . . . . . . . . . . . . . . . . . . . — —Common Stock . . . . . . . . . . . . . . . . . . . . . . . . . . . . . . . . . . . . . . . . . . . . 67,611 67,431Additional paid-in capital . . . . . . . . . . . . . . . . . . . . . . . . . . . . . . . . . . . . . 318,064 283,036Accumulated other comprehensive income . . . . . . . . . . . . . . . . . . . . . . . . 154,615 69,701Retained earnings . . . . . . . . . . . . . . . . . . . . . . . . . . . . . . . . . . . . . . . . . . 3,988,891 3,639,200Treasury Stock, at cost: 2010—5,362,800; 2009—1,048,500 shares of
common stock . . . . . . . . . . . . . . . . . . . . . . . . . . . . . . . . . . . . . . . . . . . (244,722) (24,988)
Total stockholders’ equity . . . . . . . . . . . . . . . . . . . . . . . . . . . . . . . . . . . 4,284,459 4,034,380
Total liabilities and stockholders’ equity . . . . . . . . . . . . . . . . . . . . . . . . . . $5,328,170 $5,080,767
See Notes to Condensed Financial Information of Registrant (Parent Company Only)
S-2

TRANSATLANTIC HOLDINGS, INC. AND SUBSIDIARIESCONDENSED FINANCIAL INFORMATION OF REGISTRANT (Continued)
STATEMENTS OF OPERATIONS(Parent Company Only)
For the Years Ended December 31, 2010, 2009 and 2008
2010 2009 2008
(in thousands)
Revenues:Net investment income (principally dividends from subsidiary) . . . . $304,959 $151,907 $ 95,725Realized net capital losses . . . . . . . . . . . . . . . . . . . . . . . . . . . . . . (3,232) (3,941) (3,161)(Loss) gain on early extinguishment of debt . . . . . . . . . . . . . . . . . . (115) 9,869 10,250Equity in undistributed income of subsidiaries . . . . . . . . . . . . . . . . 159,756 366,066 42,767
Total revenues . . . . . . . . . . . . . . . . . . . . . . . . . . . . . . . . . . . . . 461,368 523,901 145,581
Expenses:Operating expenses . . . . . . . . . . . . . . . . . . . . . . . . . . . . . . . . . . . 22,496 19,707 18,189Interest on senior notes . . . . . . . . . . . . . . . . . . . . . . . . . . . . . . . . 68,272 43,454 43,359
Total expenses . . . . . . . . . . . . . . . . . . . . . . . . . . . . . . . . . . . . . 90,768 63,161 61,548
Income before income taxes . . . . . . . . . . . . . . . . . . . . . . . . . . . . . . . 370,600 460,740 84,033
Income tax benefits:Current . . . . . . . . . . . . . . . . . . . . . . . . . . . . . . . . . . . . . . . . . . . . (25,933) (14,309) (15,634)Deferred . . . . . . . . . . . . . . . . . . . . . . . . . . . . . . . . . . . . . . . . . . . (5,668) (2,613) (2,587)
Total income tax benefits . . . . . . . . . . . . . . . . . . . . . . . . . . . . . (31,601) (16,922) (18,221)
Net income . . . . . . . . . . . . . . . . . . . . . . . . . . . . . . . . . . . . . . . . . . . $402,201 $477,662 $102,254
See Notes to Condensed Financial Information of Registrant (Parent Company Only)
S-3
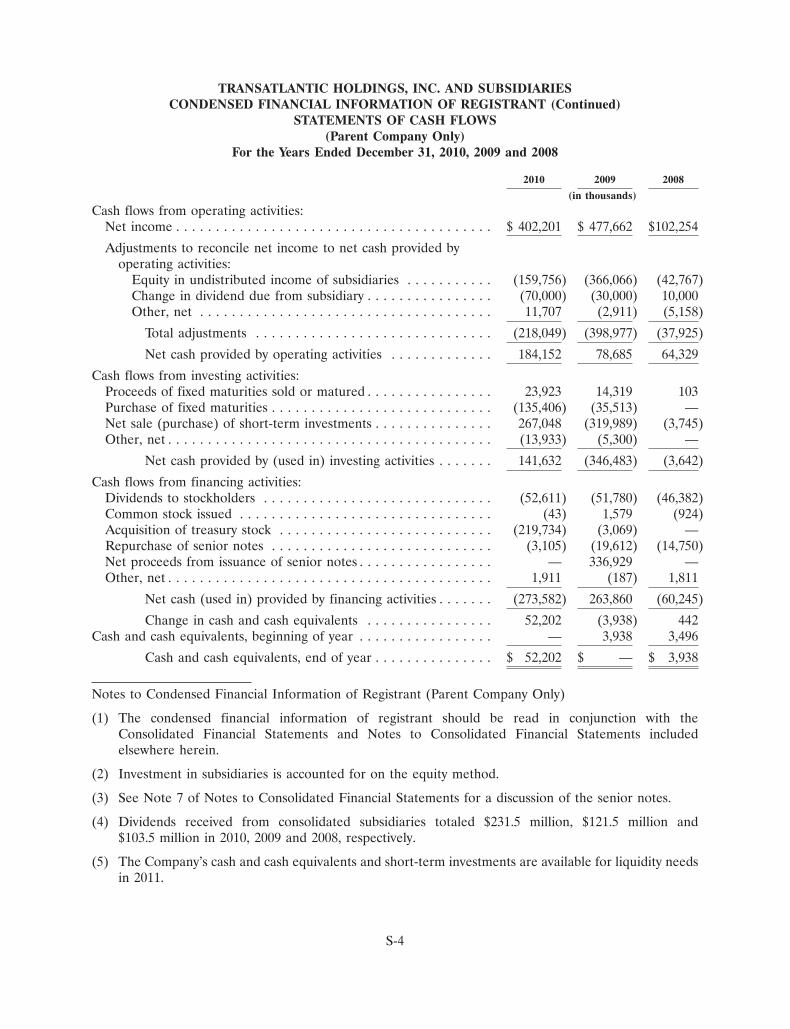
TRANSATLANTIC HOLDINGS, INC. AND SUBSIDIARIESCONDENSED FINANCIAL INFORMATION OF REGISTRANT (Continued)
STATEMENTS OF CASH FLOWS(Parent Company Only)
For the Years Ended December 31, 2010, 2009 and 2008
2010 2009 2008
(in thousands)
Cash flows from operating activities:Net income . . . . . . . . . . . . . . . . . . . . . . . . . . . . . . . . . . . . . . . . $ 402,201 $ 477,662 $102,254
Adjustments to reconcile net income to net cash provided byoperating activities:
Equity in undistributed income of subsidiaries . . . . . . . . . . . (159,756) (366,066) (42,767)Change in dividend due from subsidiary . . . . . . . . . . . . . . . . (70,000) (30,000) 10,000Other, net . . . . . . . . . . . . . . . . . . . . . . . . . . . . . . . . . . . . . 11,707 (2,911) (5,158)
Total adjustments . . . . . . . . . . . . . . . . . . . . . . . . . . . . . . (218,049) (398,977) (37,925)
Net cash provided by operating activities . . . . . . . . . . . . . 184,152 78,685 64,329
Cash flows from investing activities:Proceeds of fixed maturities sold or matured . . . . . . . . . . . . . . . . 23,923 14,319 103Purchase of fixed maturities . . . . . . . . . . . . . . . . . . . . . . . . . . . . (135,406) (35,513) —Net sale (purchase) of short-term investments . . . . . . . . . . . . . . . 267,048 (319,989) (3,745)Other, net . . . . . . . . . . . . . . . . . . . . . . . . . . . . . . . . . . . . . . . . . (13,933) (5,300) —
Net cash provided by (used in) investing activities . . . . . . . 141,632 (346,483) (3,642)
Cash flows from financing activities:Dividends to stockholders . . . . . . . . . . . . . . . . . . . . . . . . . . . . . (52,611) (51,780) (46,382)Common stock issued . . . . . . . . . . . . . . . . . . . . . . . . . . . . . . . . (43) 1,579 (924)Acquisition of treasury stock . . . . . . . . . . . . . . . . . . . . . . . . . . . (219,734) (3,069) —Repurchase of senior notes . . . . . . . . . . . . . . . . . . . . . . . . . . . . (3,105) (19,612) (14,750)Net proceeds from issuance of senior notes . . . . . . . . . . . . . . . . . — 336,929 —Other, net . . . . . . . . . . . . . . . . . . . . . . . . . . . . . . . . . . . . . . . . . 1,911 (187) 1,811
Net cash (used in) provided by financing activities . . . . . . . (273,582) 263,860 (60,245)
Change in cash and cash equivalents . . . . . . . . . . . . . . . . 52,202 (3,938) 442Cash and cash equivalents, beginning of year . . . . . . . . . . . . . . . . . — 3,938 3,496
Cash and cash equivalents, end of year . . . . . . . . . . . . . . . $ 52,202 $ — $ 3,938
Notes to Condensed Financial Information of Registrant (Parent Company Only)
(1) The condensed financial information of registrant should be read in conjunction with theConsolidated Financial Statements and Notes to Consolidated Financial Statements includedelsewhere herein.
(2) Investment in subsidiaries is accounted for on the equity method.
(3) See Note 7 of Notes to Consolidated Financial Statements for a discussion of the senior notes.
(4) Dividends received from consolidated subsidiaries totaled $231.5 million, $121.5 million and$103.5 million in 2010, 2009 and 2008, respectively.
(5) The Company’s cash and cash equivalents and short-term investments are available for liquidity needsin 2011.
S-4

SCHEDULE III
TRANSATLANTIC HOLDINGS, INC. AND SUBSIDIARIESSUPPLEMENTARY INSURANCE INFORMATION
As of December 31, 2010, 2009 and 2008 and for the Years Then Ended
NetUnpaid CommissionsLosses Net Losses and Change
Deferred and Loss Net Net and Loss in Deferred Other NetAcquisition Adjustment Unearned Premiums Investment Adjustment Acquisition Underwriting Premiums
Costs Expenses Premiums Earned Income Expenses Costs Expenses Written
(in thousands)2010
Property-CasualtyDomestic . . . . . $109,827 $4,978,961 $ 592,269 $1,966,543 $320,469 $1,318,584 $465,641 $ 99,428 $1,949,520International:
Europe . . . . . 63,881 2,821,771 308,270 1,373,393 119,414 1,035,560 295,052 54,679 1,401,884Other . . . . . . 64,588 1,219,878 311,996 518,684 33,664 327,630 169,229 23,517 530,289
Consolidated $238,296 $9,020,610 $1,212,535 $3,858,620 $473,547 $2,681,774 $929,922 $177,624 $3,881,693
2009Property-Casualty
Domestic . . . . . $120,061 $5,116,056 $ 600,247 $2,064,778 $309,747 $1,364,082 $478,448 $ 86,802 $2,051,053International:
Europe . . . . . 59,496 2,786,126 306,211 1,442,326 125,114 1,066,717 315,308 49,344 1,405,209Other . . . . . . 57,909 706,923 281,068 531,978 32,541 248,372 146,568 22,035 529,839
Consolidated $237,466 $8,609,105 $1,187,526 $4,039,082 $467,402 $2,679,171 $940,324 $158,181 $3,986,101
2008Property-Casualty
Domestic . . . . . $122,447 $4,949,708 $ 616,700 $2,043,053 $259,379 $1,607,543 $471,575 $ 65,804 $2,035,661International:
Europe . . . . . 63,320 2,551,940 317,820 1,525,334 146,202 1,051,019 354,425 45,901 1,562,118Other . . . . . . 53,843 622,834 285,613 499,002 34,870 248,665 147,670 19,850 510,313
Consolidated $239,610 $8,124,482 $1,220,133 $4,067,389 $440,451 $2,907,227 $973,670 $131,555 $4,108,092
S-5

SCHEDULE IV
TRANSATLANTIC HOLDINGS, INC. AND SUBSIDIARIESREINSURANCE
For the Years Ended December 31, 2010, 2009 and 2008
PercentageCeded to Assumed of Amount
Gross Other from Other Net Assumed toAmount Companies Companies Amount Net
(dollars in thousands)
2010Premiums written:
Property-Casualty . . . . . . . . . . . . . . . . . — $251,238 $4,132,931 $3,881,693 106%2009
Premiums written:Property-Casualty . . . . . . . . . . . . . . . . . — $217,676 $4,203,777 $3,986,101 105%
2008Premiums written:
Property-Casualty . . . . . . . . . . . . . . . . . — $315,149 $4,423,241 $4,108,092 108%
S-6

SCHEDULE VI
TRANSATLANTIC HOLDINGS, INC. AND SUBSIDIARIESSUPPLEMENTARY INFORMATION CONCERNINGPROPERTY/CASUALTY INSURANCE OPERATIONS
As of December 31, 2010, 2009 and 2008 and For the Years Then Ended
Net Lossesand Loss Net Losses Net
Unpaid Adjustment and Loss Commissions Net PaidLosses Expenses Adjustment and Change Losses
Deferred and Loss Discount Net Net Related to Expenses in Deferred and Loss NetAcquisition Adjustment if any Unearned Premiums Investment Current Related to Acquisition Adjustment Premiums
Costs Expenses Deducted Premiums Earned Income Year Prior Years Costs Expenses Written
(in thousands)2010 . . $238,296 $9,020,610 $— $1,212,535 $3,858,620 $473,547 $2,738,733 $(56,959) $929,922 $2,207,474 $3,881,6932009 . . 237,466 8,609,105 — 1,187,526 4,039,082 467,402 2,718,119 (38,948) 940,324 2,421,008 3,986,1012008 . . 239,610 8,124,482 — 1,220,133 4,067,389 440,451 2,907,711 (484) 973,670 2,116,050 4,108,092
S-7

(This page has been left blank intentionally.)

EXHIBIT INDEX
ExhibitNo. Description Location
3.1 — Restated Certificate of Incorporation of Filed as an exhibit to the Company’sTransatlantic Holdings, Inc., dated Current Report on Form 8-K (FileSeptember 8, 2009. No. 1-10545) dated September 8, 2009,
and incorporated herein by reference.
3.2 — Amended and Restated By-Laws of Filed as an exhibit to the Company’sTransatlantic Holdings, Inc., dated Current Report on Form 8-K (FileSeptember 8, 2009. No. 1-10545) dated September 8, 2009,
and incorporated herein by reference.
4.1 — Form of Common Stock Certificate. Filed as an exhibit to the Company’sRegistration Statement (FileNo. 33-34433) and incorporated herein byreference.
4.2.1 — Indenture between Transatlantic Filed as an exhibit to the Company’sHoldings, Inc. and The Bank of New Current Report on Form 8-K (FileYork, dated December 14, 2005. No. 1-10545) dated December 15, 2005,
and incorporated herein by reference.
4.2.2 — First Supplemental Indenture between Filed as an exhibit to the Company’sTransatlantic Holdings, Inc. and The Current Report on Form 8-K (FileBank of New York, dated December 14, No. 1-10545) dated December 15, 2005,2005. and incorporated herein by reference.
4.2.3 — Second Supplemental Indenture by and Filed as an exhibit to the Company’samong Transatlantic Holdings, Inc. and Current Report on Form 8-K (FileThe Bank of New York Mellon, dated No. 1-10545) dated November 23, 2009,November 23, 2009. and incorporated herein by reference.
4.3 — Voting Agreement by and between Filed as an exhibit to the Company’sTransatlantic Holdings, Inc. and Davis Current Report on Form 8-K (FileSelected Advisors L.P., dated June 8, No. 1-10545) dated June 10, 2009, and2009. incorporated herein by reference.
10.1 — Investment Management Agreement Filed as an exhibit to the Company’sbetween Transatlantic Holdings, Inc. and Current Report on Form 8-K (FileBlackRock Financial Management, Inc. No. 1-10545) dated July 2, 2009, anddated June 30, 2009. incorporated herein by reference.
10.2 — Transatlantic Holdings, Inc. 2000 Stock Filed as an exhibit to the Company’sOption Plan*. Registration Statement on Form S-8 (File
No. 333-50298) and incorporated hereinby reference.
10.2.1 — Transatlantic Holdings, Inc. 2003 Stock Filed as an exhibit to the Company’sIncentive Plan*. Registration Statement on Form S-8 (File
No. 333-111513) and incorporated hereinby reference.
10.2.2 — Form of Transatlantic Holdings, Inc. 2000 Filed as an exhibit to the Company’s 2004Stock Option Plan stock option Quarterly Report on Form 10-Q (Fileagreement*. No. 1-10545) for the quarter ended
September 30, 2004, and incorporatedherein by reference.

ExhibitNo. Description Location
10.2.3 — Form of Transatlantic Holdings, Inc. 2003 Filed as an exhibit to the Company’s 2004Stock Incentive Plan RSU award Quarterly Report on Form 10-Q (Fileagreement*. No. 1-10545) for the quarter ended
September 30, 2004, and incorporatedherein by reference.
10.2.4 — Amended Transatlantic Holdings, Inc. Filed as an appendix to the Company’s2000 Stock Option Plan*. Definitive Proxy Statement (File
No. 1-10545) dated April 18, 2008, andincorporated herein by reference.
10.2.5 — Amended Transatlantic Holdings, Inc. Filed as an exhibit to the Company’s2003 Stock Incentive Plan*. Registration Statement on Form S-8 (File
No. 333-135832) and incorporated hereinby reference.
10.2.6 — Transatlantic Holdings, Inc. Partners Filed as an exhibit to the Company’s 2006Plan*. Quarterly Report on Form 10-Q (File
No. 1-10545) for the quarter endedSeptember 30, 2006, and incorporatedherein by reference.
10.2.7 — Transatlantic Holdings, Inc. Senior Filed as an exhibit to the Company’s 2006Partners Plan*. Quarterly Report on Form 10-Q (File
No. 1-10545) for the quarter endedSeptember 30, 2006, and incorporatedherein by reference.
10.2.8 — Transatlantic Holdings, Inc. Annual Filed as an exhibit to the Company’s 2006Bonus Plan*. Quarterly Report on Form 10-Q (File
No. 1-10545) for the quarter endedSeptember 30, 2006, and incorporatedherein by reference.
10.2.9 — Form of Transatlantic Holdings, Inc. Filed as an exhibit to the Company’s 2006Partners Plan Performance RSU Award Quarterly Report on Form 10-Q (FileAgreement*. No. 1-10545) for the quarter ended
September 30, 2006, and incorporatedherein by reference.
10.2.10 — Form of Transatlantic Holdings, Inc. Filed as an exhibit to the Company’s 2006Senior Partners Plan Performance RSU Quarterly Report on Form 10-Q (FileAward Agreement*. No. 1-10545) for the quarter ended
September 30, 2006, and incorporatedherein by reference.
10.2.11 — Transatlantic Holdings, Inc. 2008 Filed as an exhibit to the Company’sNon-Employee Directors’ Stock Plan*. Registration Statement on Form S-8 (File
No. 333-152095) and incorporated hereinby reference.
10.2.12 — Transatlantic Holdings, Inc. Executive Filed as an exhibit to the Company’sSeverance Plan*. Current Report on Form 8-K (File
No. 1-10545) dated May 29, 2008, andincorporated herein by reference.

ExhibitNo. Description Location
10.2.13 — Form of Transatlantic Holdings, Inc. Filed as an exhibit to the Company’s 2008Retention Bonus Letters*. Quarterly Report on Form 10-Q (File
No. 1-10545) for the quarter endedSeptember 30, 2008, and incorporatedherein by reference.
10.2.14 — Amendment No. 1 to the Transatlantic Filed as an exhibit to the Company’s 2008Holdings, Inc. 2003 Stock Incentive Plan*. Quarterly Report on Form 10-Q (File
No. 1-10545) for the quarter endedSeptember 30, 2008, and incorporatedherein by reference.
10.2.15 — Amendment No. 1 to the Transatlantic Filed as an exhibit to the Company’s 2008Holdings, Inc. Partners Plan*. Quarterly Report on Form 10-Q (File
No. 1-10545) for the quarter endedSeptember 30, 2008, and incorporatedherein by reference.
10.2.16 — Amendment No. 1 to the Transatlantic Filed as an exhibit to the Company’s 2008Holdings, Inc. Senior Partners Plan*. Quarterly Report on Form 10-Q (File
No. 1-10545) for the quarter endedSeptember 30, 2008, and incorporatedherein by reference.
10.2.17 — Transatlantic Holdings, Inc. 2009 Long Filed as an exhibit to the Company’sTerm Equity Incentive Plan*. Registration Statement on Form S-8 (File
No. 333-159398) and incorporated hereinby reference.
10.2.18 — Transatlantic Holdings, Inc. 2007 Filed as an appendix to the Company’sExecutive Bonus Plan*. Definitive Proxy Statement (File
No. 1-10545) dated April 8, 2010 andincorporated herein by reference.
10.2.19 — Transatlantic Holdings, Inc. 2010 U.K. Filed as an exhibit to the Company’sSharesave Plan*. Registration Statement on Form S-8 (File
No. 333-168024) and incorporated hereinby reference.
10.3 — Management Agreement between Filed as an exhibit to the Company’s 1995Transatlantic Reinsurance Company and Annual Report on Form 10-K (FilePutnam Reinsurance Company, dated No. 1-10545) and incorporated herein byFebruary 15, 1991. reference.
10.4 — Quota Share Reinsurance Agreement Filed as an exhibit to the Company’s 1995between Transatlantic Reinsurance Annual Report on Form 10-K (FileCompany and Putnam Reinsurance No. 1-10545) and incorporated herein byCompany, dated December 6, 1995. reference.
21.1 — Subsidiaries of the registrant. Filed herewith.
23.1 — Consent of PricewaterhouseCoopers LLP. Filed herewith.
31.1 — Certification pursuant to Section 302 of Filed herewith.the Sarbanes-Oxley Act of 2002, byRobert F. Orlich, President and ChiefExecutive Officer.

ExhibitNo. Description Location
31.2 — Certification pursuant to Section 302 of Filed herewith.the Sarbanes-Oxley Act of 2002, bySteven S. Skalicky, Executive VicePresident and Chief Financial Officer.
32.1 — Certification pursuant to 18 U.S.C. Provided herewith.Section 1350, as adopted pursuant toSection 906 of the Sarbanes-Oxley Act of2002, by Robert F. Orlich, President andChief Executive Officer.
32.2 — Certification pursuant to 18 U.S.C. Provided herewith.Section 1350, as adopted pursuant toSection 906 of the Sarbanes-Oxley Act of2002, by Steven S. Skalicky, ExecutiveVice President and Chief FinancialOfficer.
101 — Interactive data files pursuant to Furnished herewith.Rule 405 of Regulation S-T: (i) theConsolidated Balance Sheets as ofDecember 31, 2010 and December 31,2009; (ii) the Consolidated Statements ofOperations for the years endedDecember 31, 2010, 2009 and 2008;(iii) the Consolidated Statements ofStockholders’ Equity for the years endedDecember 31, 2010, 2009 and 2008;(iv) the Consolidated Statements of CashFlows for the years ended December 31,2010, 2009 and 2008; (v) the ConsolidatedStatements of Comprehensive Income(Loss) for the years ended December 31,2010, 2009 and 2008; and (vi) the Notesto Consolidated Financial Statements,tagged as blocks of text**.
* Management contract or compensatory plan or agreement.** This information is furnished and not filed for purposes of Sections 11 and 12 of the Securities Act of 1933, as amended, and
Section 18 of the Securities Exchange Act of 1934, as amended, and otherwise is not subject to liability under these sections.

EXHIBIT 21.1
TRANSATLANTIC HOLDINGS, INC.SUBSIDIARIES OF REGISTRANT
% of VotingSecurities
Jurisdiction of Owned by itsName of Corporation Incorporation Immediate Parent
Transatlantic Reinsurance Company . . . . . . . . . . . . . . . . . . . . . New York, U.S.A. 100%Putnam Reinsurance Company . . . . . . . . . . . . . . . . . . . . . . . New York, U.S.A. 100*Trans Re Zurich Reinsurance Company Ltd. . . . . . . . . . . . . . Zurich, Switzerland 100*Transatlantic Re (Argentina) S.A. . . . . . . . . . . . . . . . . . . . . . Argentina 100*Transatlantic Re (Brasil) Ltda. . . . . . . . . . . . . . . . . . . . . . . . Brazil 100*Transatlantic Polska Sp. z o.o. . . . . . . . . . . . . . . . . . . . . . . . Warsaw, Poland 100*TransRe Germany GmbH . . . . . . . . . . . . . . . . . . . . . . . . . . . Munich, Germany 100*TRC (PANAMA) S.A. . . . . . . . . . . . . . . . . . . . . . . . . . . . . . Panama 100*
Professional Risk Management Services, Inc. . . . . . . . . . . . . . . Delaware, U.S.A. 100TReIMCo 1 Limited . . . . . . . . . . . . . . . . . . . . . . . . . . . . . . . . England 100Calpe Insurance Company Limited . . . . . . . . . . . . . . . . . . . . . . Gibraltar 100
* The common stock is owned 100% by Transatlantic Reinsurance Company.

EXHIBIT 23.1
CONSENT OF INDEPENDENT REGISTERED PUBLIC ACCOUNTING FIRM
We hereby consent to the incorporation by reference in the Registration Statements on Form S-3(No. 333-155811) and Form S-8 (Nos. 33-99764, 33-41474, 333-50298, 333-111513, 333-135831, 333-135832,333-152095, 333-159398, 333-168024) of Transatlantic Holdings, Inc. of our report dated February 22, 2011relating to the financial statements, financial statement schedules and the effectiveness of internal controlover financial reporting, which appears in this Form 10-K.
/s/ PricewaterhouseCoopers LLPPricewaterhouseCoopers LLPNew York, New YorkFebruary 22, 2011

EXHIBIT 31.1
CERTIFICATION PURSUANT TO SECTION 302 OFTHE SARBANES-OXLEY ACT OF 2002
CERTIFICATION
I, Robert F. Orlich, certify that:
1. I have reviewed this Annual Report on Form 10-K of Transatlantic Holdings, Inc.;
2. Based on my knowledge, this report does not contain any untrue statement of a material fact oromit to state a material fact necessary to make the statements made, in light of the circumstances underwhich such statements were made, not misleading with respect to the period covered by this report;
3. Based on my knowledge, the financial statements, and other financial information included in thisreport, fairly present in all material respects the financial condition, results of operations and cash flows ofthe registrant as of, and for, the periods presented in this report;
4. The registrant’s other certifying officer and I are responsible for establishing and maintainingdisclosure controls and procedures (as defined in Exchange Act Rules 13a-15(e) and 15d-15(e)) andinternal control over financial reporting (as defined in Exchange Act Rules 13a-15(f) and 15d-15(f)) for theregistrant and have:
a) Designed such disclosure controls and procedures, or caused such disclosure controls andprocedures to be designed under our supervision, to ensure that material information relating to theregistrant, including its consolidated subsidiaries, is made known to us by others within those entities,particularly during the period in which this report is being prepared;
b) Designed such internal control over financial reporting, or caused such internal control overfinancial reporting to be designed under our supervision, to provide reasonable assurance regardingthe reliability of financial reporting and the preparation of financial statements for external purposesin accordance with generally accepted accounting principles;
c) Evaluated the effectiveness of the registrant’s disclosure controls and procedures andpresented in this report our conclusions about the effectiveness of the disclosure controls andprocedures, as of the end of the period covered by this report based on such evaluation; and
d) Disclosed in this report any change in the registrant’s internal control over financialreporting that occurred during the registrant’s most recent fiscal quarter (the registrant’s fourth fiscalquarter in the case of an annual report) that has materially affected, or is reasonably likely tomaterially affect, the registrant’s internal control over financial reporting; and
5. The registrant’s other certifying officer and I have disclosed, based on our most recent evaluationof internal control over financial reporting, to the registrant’s auditors and the audit committee of theregistrant’s board of directors (or persons performing the equivalent functions):
a) All significant deficiencies and material weaknesses in the design or operation of internalcontrol over financial reporting which are reasonably likely to adversely affect the registrant’s abilityto record, process, summarize and report financial information; and
b) Any fraud, whether or not material, that involves management or other employees who havea significant role in the registrant’s internal control over financial reporting.
/s/ ROBERT F. ORLICH
Robert F. OrlichPresident and Chief Executive Officer
Date: February 22, 2011

EXHIBIT 31.2
CERTIFICATION PURSUANT TO SECTION 302 OFTHE SARBANES-OXLEY ACT OF 2002
CERTIFICATION
I, Steven S. Skalicky, certify that:
1. I have reviewed this Annual Report on Form 10-K of Transatlantic Holdings, Inc.;
2. Based on my knowledge, this report does not contain any untrue statement of a material fact oromit to state a material fact necessary to make the statements made, in light of the circumstances underwhich such statements were made, not misleading with respect to the period covered by this report;
3. Based on my knowledge, the financial statements, and other financial information included in thisreport, fairly present in all material respects the financial condition, results of operations and cash flows ofthe registrant as of, and for, the periods presented in this report;
4. The registrant’s other certifying officer and I are responsible for establishing and maintainingdisclosure controls and procedures (as defined in Exchange Act Rules 13a-15(e) and 15d-15(e)) andinternal control over financial reporting (as defined in Exchange Act Rules 13a-15(f) and 15d-15(f)) for theregistrant and have:
a) Designed such disclosure controls and procedures, or caused such disclosure controls andprocedures to be designed under our supervision, to ensure that material information relating to theregistrant, including its consolidated subsidiaries, is made known to us by others within those entities,particularly during the period in which this report is being prepared;
b) Designed such internal control over financial reporting, or caused such internal control overfinancial reporting to be designed under our supervision, to provide reasonable assurance regardingthe reliability of financial reporting and the preparation of financial statements for external purposesin accordance with generally accepted accounting principles;
c) Evaluated the effectiveness of the registrant’s disclosure controls and procedures andpresented in this report our conclusions about the effectiveness of the disclosure controls andprocedures, as of the end of the period covered by this report based on such evaluation; and
d) Disclosed in this report any change in the registrant’s internal control over financialreporting that occurred during the registrant’s most recent fiscal quarter (the registrant’s fourth fiscalquarter in the case of an annual report) that has materially affected, or is reasonably likely tomaterially affect, the registrant’s internal control over financial reporting; and
5. The registrant’s other certifying officer and I have disclosed, based on our most recent evaluationof internal control over financial reporting, to the registrant’s auditors and the audit committee of theregistrant’s board of directors (or persons performing the equivalent functions):
a) All significant deficiencies and material weaknesses in the design or operation of internalcontrol over financial reporting which are reasonably likely to adversely affect the registrant’s abilityto record, process, summarize and report financial information; and
b) Any fraud, whether or not material, that involves management or other employees who havea significant role in the registrant’s internal control over financial reporting.
/s/ STEVEN S. SKALICKY
Steven S. SkalickyExecutive Vice President and Chief Financial Officer
Date: February 22, 2011

EXHIBIT 32.1
CERTIFICATION PURSUANT TO 18 U.S.C. SECTION 1350, AS ADOPTEDPURSUANT TO SECTION 906 OF THE SARBANES-OXLEY ACT OF 2002
In connection with the Annual Report on Form 10-K for the year ended December 31, 2010 ofTransatlantic Holdings, Inc. (the ‘‘Company’’), as filed with the Securities and Exchange Commission onthe date hereof (the ‘‘Report’’), I, Robert F. Orlich, President and Chief Executive Officer of the Company,certify, pursuant to 18 U.S.C. Section 1350, as adopted pursuant to Section 906 of the Sarbanes-Oxley Actof 2002, that to my knowledge:
(1) The Report fully complies with the requirements of Section 13(a) or 15(d) of the SecuritiesExchange Act of 1934, as amended; and
(2) The information contained in the Report fairly presents, in all material respects, the financialcondition and results of operations of the Company.
/s/ ROBERT F. ORLICH
Robert F. OrlichPresident and Chief Executive Officer
Date: February 22, 2011
The foregoing is being furnished solely pursuant to 18 U.S.C. Section 1350, as adopted pursuant toSection 906 of the Sarbanes-Oxley Act of 2002, and is not being filed as part of the Report or as a separatedisclosure document.

EXHIBIT 32.2
CERTIFICATION PURSUANT TO 18 U.S.C. SECTION 1350, AS ADOPTEDPURSUANT TO SECTION 906 OF THE SARBANES-OXLEY ACT OF 2002
In connection with the Annual Report on Form 10-K for the year ended December 31, 2010 ofTransatlantic Holdings, Inc. (the ‘‘Company’’), as filed with the Securities and Exchange Commission onthe date hereof (the ‘‘Report’’), I, Steven S. Skalicky, Executive Vice President and Chief Financial Officerof the Company, certify, pursuant to 18 U.S.C. Section 1350, as adopted pursuant to Section 906 of theSarbanes-Oxley Act of 2002, that to my knowledge:
(1) The Report fully complies with the requirements of Section 13(a) or 15(d) of the SecuritiesExchange Act of 1934, as amended; and
(2) The information contained in the Report fairly presents, in all material respects, the financialcondition and results of operations of the Company.
/s/ STEVEN S. SKALICKY
Steven S. SkalickyExecutive Vice President and Chief Financial Officer
Date: February 22, 2011
The foregoing is being furnished solely pursuant to 18 U.S.C. Section 1350, as adopted pursuant toSection 906 of the Sarbanes-Oxley Act of 2002, and is not being filed as part of the Report or as a separatedisclosure document.

At the same time, the ongoing depressed level of interest
rates and markedly lower investment yields required steely
determination in managing the asset side of the balance
sheet to deliver acceptable investment returns.
This company has a long track record of positive cash-
flow, never having had to divest any investment position
to cover claims or operating expenses. Throughout the
year we identified opportunities to deploy our positive
cash flow; we repurchased $220 million of common stock
at an attractive weighted average discount to book value
of 19%.
LOOKING FORWARDWe enter 2011 with a strong belief in the enduring value
of the Transatlantic franchise. We will work hard to deliver
long-term value by focusing on our core specialties and by
taking full advantage of our global network.
For example, in Europe we expect to see continued benefi t
from the trend towards increased syndication as the
implementation of Solvency II approaches. However, and
in keeping with our view that the industry is already well
regulated, we expect increased demand for reinsurance
to be selective rather than wholesale. Having built strong
relationships with regulators around the world, we will be fully
prepared for these and any other changes, while remaining
committed to customers and brokers.
CONCLUSIONWe hope that you are pleased with the performance of the
company in this diffi cult environment. We are proud of the
teams around the world for their consistent delivery of our
mission. We built our plans on their experienced, seasoned,
professional leadership.
With a strong fi nancial position, the right people in the right
positions, and a proven business model, we believe that
the future is bright, as we diligently strive to deliver on our
commitments to you in 2011 and beyond.
Dear Stockholders,
We believe that the global market will be less centralized in the future, and that Transatlantic must have a presence in the regional hubs if it is to maximize its potential.
Richard S. PressChairman
Richard S. PressChairman
Robert F. OrlichPresident and Chief Executive Offi cer
Robert F. OrlichPresident and Chief Executive Offi cer
Transatlantic Reinsurance Company®
80 Pine StreetNew York, NY 10005(212) 365 2200 » [email protected]
Transatlantic Holdings, Inc.80 Pine StreetNew York, NY 10005(212) 365 2200 » [email protected]
Trans Re Zurich Reinsurance Company Ltd.Nüschelerstrasse 32PO Box 14758021 Zurich, Switzerland(41) 44 227 61 00 » [email protected]
Professional Risk Management Services, Inc.1515 Wilson Boulevard Suite 800Arlington, VA 22209(800) 245 3333 » [email protected]
Our Offi ces
BUENOS AIRES
Transatlantic Re (Argentina), S.A.Carlos Pelligrini 10235th FloorC1009ABU Buenos AiresArgentina(5411) 5296 [email protected]
CHICAGO 300 South Riverside Plaza22nd FloorChicago, IL 60606(312) 930 [email protected]
COLUMBUS
1515 West Lane AvenueSuite 18Columbus, OH 43221(614) 488 [email protected]
HAMILTON
Par-La-Ville Place5th Floor14 Par-La-Ville RoadHamiltonBermuda(441) 405 [email protected]
MUNICH
Transatlantic Reinsurance Company (German Branch)Promenadeplatz 880333 MunichGermany(49) 89 1894 2554 [email protected]
OVERLAND PARK
6900 College BoulevardSuite 860Overland Park, KS 66211(913) 319 [email protected]
PANAMA CITY
TRC (PANAMÁ) S.A.Calle 50Edifi cio Torre GlobalSuite 1809Panama City, Republicof Panama(507) 340 [email protected]
PARIS
21 Boulevard HaussmannParis 75009 France(33) 1 4006 [email protected]
HONG KONG
(Asia-Pacifi c Regional Headquarters)3303 The Lee Gardens33 Hysan AvenueCauseway BayHong Kong S.A.R.People’s Republic of China(852) 2574 [email protected]
JOHANNESBURG
MS Upson & Associates c.c.Kildrummy Offi ce ParkBlock 7Cnr Witkoppen Road & Umhlanga CrescentPaulshof, South Africa(27) 11 803 [email protected]
LONDON
Corn Exchange55 Mark LaneLondon, EnglandEC3R 7NE(44) 207 204 [email protected]
MIAMI
(Latin America/Caribbean) 701 N.W. 62nd AvenueSuite 790Miami, FL 33126(786) 437 [email protected]
RIO DE JANEIRO
Transatlantic Reinsurance Company – Representative Offi ceRua da Candelaria 65Sala 2101Rio de Janeiro, Brazil20091-020(55 21) 2127 [email protected]
SAN FRANCISCO
Embarcadero Center West275 Battery StreetSuite 460San Francisco, CA 94111(415) 399 [email protected]
SHANGHAI
Rm 1511 Ruijin BuildingNo. 205 Maoming Road (S)Shanghai 200020People’s Republic of China(86) 21 6473 7681/[email protected]
STAMFORD
1177 Summer StreetSuite 400BStamford, CT 06905(203) 905 [email protected]
STOCKHOLM
NOBAREDanavägen 5BSE-18260 DjursholmSweden(46) 8753 [email protected]
SYDNEY
Level 21, Australia Square264 George StreetSydney NSW 2000Australia(61) 2 9274 [email protected]
TOKYO
New Yurakucho Building,3rd Floor12-1, Yurakucho 1-chomeChiyoda-Ku, Tokyo100-0006Japan(81) 3 3212 [email protected]
TORONTO
145 Wellington Street WestToronto, Ontario M5J 1H8Canada(416) 596 [email protected]
WARSAW
Transatlantic Polska Sp. z o.o.15 Jana Pawla II Street9th fl oor00-828 Warsaw, Poland(48) 22 697 [email protected]
We are pleased to present our latest set of fi nancial results. They are a
graphic demonstration of your company’s ongoing resilience in the face
of challenging economic and market pressures.
OVERVIEWHaving successfully navigated the recent economic crisis, insurance and
reinsurance companies have been able to rebuild their capital positions.
This is a two-edged sword, however, as the industry has created excess
capital at a time when subdued economic activity and low interest rates
have made the achievement of meaningful returns more challenging
than usual.
The confl uence of these factors has applied greater pressure both to our
teams and to customers as they seek to achieve their own objectives.
Despite these challenges, we continue to pursue price discipline and
acceptable ROEs.
DEVELOPMENTSWe believe that reinsurance offers the most fl exible, customizable,
quickly deployed, annually re-priced, contingent capital that insurance
customers can buy. While alternative structures are emerging (which the
company uses when appropriate), we continue to have confi dence in the
enduring strength of this business model, based on customer needs.
Despite current pricing pressures, Transatlantic remains fi rmly committed
to being the best risk partner for its clients. In the past year we have
further developed the global network of local support capabilities:
- We upgraded the Munich offi ce to full branch status. Since opening in
2008, the team, with the support of the Paris offi ce, has become an
important example of the local delivery of the global brand that is such
a key component of the overall value proposition.
- We opened a new offi ce in Hamilton, Bermuda, which is one of the
world’s insurance and reinsurance hubs. We decided that a physical
presence was the best way to access both the fl ow of deals and
the fl ow of market intelligence. We look forward to building out our
platform in this market.
- We established Calpe Insurance Company Limited to assist European
clients. A core of insurance expertise and support has been building
in Gibraltar in recent years. We are excited to join this development,
which fi ts with our world view. We believe that the global
market will be less centralized in the future, and that
Transatlantic must have a presence in the regional hubs if
it is to maximize its returns. We will continue to be vigilant
in monitoring developments and monetizing opportunities.
- We recently completed an investment in Lloyd’s, which
has been an important customer for many years. We see
opportunities to invest in syndicates we already know
well, which will enable us to diversify the portfolio and to
garner reinsurance opportunities as well.
Transatlantic has the fi nancial strength, personnel depth and the
vision to make these investments in the franchise successful
through all stages of the cycle, and we will actively explore
opportunities to expand wherever we believe it will add value.
INDEPENDENCEThis past year we completed our operational independence
from our former majority stockholder. This separation has
had a number of benefi ts:
- An increased fl ow of new business opportunities
- An increased, already demonstrated, fi nancial fl exibility
- An increased fl exibility in corporate strategy
- An increased collaboration between the board and
executive team
On this last point, your board welcomed two new members,
Stephen Bradley from the Harvard Business School, and
Reuben Jeffery III, formerly US Under Secretary of State for
Economic, Energy and Agricultural Affairs. Between them
Stephen and Reuben bring a wide range of experience and
insight to your board’s deliberations.
We thank all the directors and executive leadership team for
their continuing efforts on your behalf, and their inputs and
insights regarding future direction and success.
CREATING STOCKHOLDER VALUETransatlantic benefi ts from both underwriting discipline and
global diversifi cation. We have already noted the continuing
investments made in the global network and the expansion
of the core franchise.
We have also effectively integrated both enterprise risk
management and an economic capital model into the way
we do business every day. This progress has been noted by
the rating agencies. We believe that these tools put us in a
stronger position going forward.
Calpe Insurance Company LimitedGrand Ocean PlazaFirst FloorOcean Village, Gibraltar(00350) 200 74570 » [email protected]

Transatlantic Holdings, Inc.
2010 Annual Report
www.transre.com
Transatlantic Holdings, Inc.
80 Pine StreetNew YorkNY 10005Tel. 212.365.2200
Financial Highlights
Stockholders’ Equity ($ Billions)
Net Income ($ Millions)
Transatlantic Holdings, Inc.
2010
Annual R
eport
0.42 0.50 0.56 0.77 0.76 0.99 1.14 1.36 1.61 1.64 1.86 1.85 2.03 2.38 2.59 2.54 2.96 3.35 3.20 4.03 4.28
90 91 92 93 94 95 96 97 98 99 00 01 02 03 04 05 06 07 08 09 10
62 71 72 133 102 132 155 186 248 187 212 19 169 304 255 38 428 487 102 478 402
90 91 92 93 94 95 96 97 98 99 00 01 02 03 04 05 06 07 08 09 10
($ in millions, except per share data and ratio) 2010 2009 Change %
Net Premiums Written $ 3,882 $ 3,986 (2.6) %
Net Income 402 478 (15.8)
Combined Ratio 98.2% 93.5% 4.7
Net Income Per Common Share - Diluted 6.19 7.15 (13.4)
Investments and Cash $ 13,257 12,511 6.0
Total Assets 15,705 $ 14,944 5.1
Stockholders’ Equity 4,284 4,034 6.2
Book Value Per Common Share 68.83 60.77 13.3