financial globalisation and emerging market capital flows ... · financial globalisation and...
TRANSCRIPT

BIS Papers No 44
Financial globalisation and emerging market capital flows
Monetary and Economic Department
December 2008
JEL classification: F21, F32, F37, G21, G23

Papers in this volume were prepared for a meeting of senior officials from central banks held at the Bank for International Settlements on 31 January and 1 February 2008. The views expressed are those of the authors and do not necessarily reflect the views of the BIS or the central banks represented at the meeting. Individual papers (or excerpts thereof) may be reproduced or translated with the authorisation of the authors concerned.
Requests for copies of publications, or for additions/changes to the mailing list, should be sent to:
Bank for International Settlements Press & Communications CH 4002 Basel, Switzerland
E-mail: [email protected]
Fax: +41 61 280 9100 and +41 61 280 8100
© Bank for International Settlements 2008. All rights reserved. Brief excerpts may be reproduced or translated provided the source is stated.
ISSN 1609-0381 (print) ISBN 92-9131-785-3 (print)
ISSN 1682 7651 (online) ISBN 92-9197-785-3 (online)

BIS Papers No 44 iii
Participants in the meeting
Algeria Ammar Hiouani Deputy Governor Bank of Algeria
Argentina Miguel Angel Pesce Deputy Governor
Norberto Pagani Senior Manager, International Relations
Central Bank of Argentina
Brazil Mário Mesquita Deputy Governor for Special Studies Central Bank of Brazil
Chile Jorge Desormeaux Deputy Governor Central Bank of Chile
China Yi Gang Deputy Governor
Xu Bing Chief Representative, Frankfurt Office
Sun Guofeng Director, Monetary Policy Department
Luo Pei (Ms) Section Chief, International Department
People’s Bank of China
Colombia Hernando Vargas Herrera Deputy Governor Bank of the Republic
Czech Republic Luděk Niedermayer Vice Governor Czech National Bank
Hong Kong SAR Peter Pang Deputy Chief Executive
Yik-Ko Mo Senior Manager, External Department
Hong Kong Monetary Authority
Hungary Júlia Király Deputy Governor Magyar Nemzeti Bank

iv BIS Papers No 44
India Rakesh Mohan Deputy Governor
Amitava Sardar Director, Department of Economic Analysis and Policy
Reserve Bank of India
Indonesia Miranda S Goeltom (Mrs) Senior Deputy Governor
Budiman Kostaman Chief Representative, London Office
A V Hardiyanto Economist
Soliking Juhro Economist
Bank Indonesia
Israel Zvi Eckstein Deputy Governor Bank of Israel
Korea Byung Chan Ahn Director General, International Department Bank of Korea
Malaysia Ooi Sang Kuang Deputy Governor
Azman Mat Ali Chief Representative, London Office
Bank Negara Malaysia
Mexico José Julián Sidaoui Deputy Governor Bank of Mexico
Peru Renzo Rossini General Manager Central Reserve Bank of Peru
Philippines Celia Gonzalez Managing Director International Department Bangko Sentral ng Pilipinas
Poland Zbigniew Hockuba Member of the Board
Anna Trzeckińska Member of the Board
Piotr Szpunar Deputy Director
National Bank of Poland

BIS Papers No 44 v
Saudi Arabia Muhammad Al-Jasser Vice Governor Saudi Arabian Monetary Agency
Thailand Atchana Waiquamdee (Mrs) Deputy Governor
Amara Sriphayak Senior Director, Domestic Economy Department
Bank of Thailand
Turkey Mehmet Yörükoğlu Deputy Governor Central Bank of the Republic of Turkey
Bank for International Settlements
William White Economic Adviser
Már Gudmundsson Deputy Head of Monetary and Economic Department
Philip Turner Head of Secretariat Group
Ramon Moreno Head of Emerging Market Issues
Dubravko Mihaljek Senior Economist
Madhusudan Mohanty Senior Economist
Agustín Villar Senior Economist
Sweta Saxena Economist
BIS Representative Office for Asia and the Pacific
Guonan Ma Senior Economist
BIS Representative Office for the Americas
Camilo Tovar Economist


BIS Papers No 44 vii
Contents
Participants in the meeting................................................................................................... iii
BIS background papers Financial globalisation and emerging market capital flows Philip Turner .............................................................................................................................1
The financial stability implications of increased capital flows for emerging market economies Dubravko Mihaljek ..................................................................................................................11
Pension systems in EMEs: implications for capital flows and financial markets Ramon Moreno and Marjorie Santos......................................................................................45
Hedging instruments in emerging market economies Sweta Saxena and Agustín Villar ...........................................................................................71
Contributed papers Capital flows, economic performance and economic policy: Argentina’s experience during the last decade Miguel Angel Pesce................................................................................................................89
Capital flows to the Brazilian economy: 2003–07 Katherine Hennings and Mário Mesquita..............................................................................103
Financial implications of capital outflows in Chile: 1998–2008 Jorge Desormeaux, Karol Fernández and Pablo García......................................................121
China: the evolution of foreign exchange controls and the consequences of capital flows People’s Bank of China ........................................................................................................143
Capital flows and financial assets in Colombia: recent behaviour, consequences and challenges for the central bank Hernando Vargas and Carlos Varela....................................................................................153
The Czech experience with capital flows: challenges for monetary policy Luděk Niedermayer and Vít Bárta ........................................................................................185
Capital flows into and out of Hong Kong SAR: implications for monetary and financial stability Hong Kong Monetary Authority.............................................................................................207
Retail credit expansion and external finance in Hungary: lessons from the recent past (1998–2007) Júlia Király, Judit Antal, Márton Nagy and Viktor Szabó.......................................................221
Capital flows to India Rakesh Mohan......................................................................................................................235
Capital flows in Indonesia: challenges and policy responses Miranda S Goeltom...............................................................................................................265
Twenty years of financial liberalisation in Israel: 1987–2007 Zvi Eckstein and Tamar Ramot-Nyska .................................................................................289

viii BIS Papers No 44
Capital flows and effects on financial markets in Korea: developments and policy responses Byung Chan Ahn.................................................................................................................. 305
Capital flows and financial assets in emerging markets: determinants, consequences and challenges for central banks: the Malaysian experience Ooi Sang Kuang................................................................................................................... 321
The impact of international financial integration on Mexican financial markets José Sidaoui ........................................................................................................................ 341
Macroeconomic implications of capital inflows: Peru 1991–2007 Renzo Rossini, Zenón Quispe and Rocío Gondo ................................................................ 363
Capital flows and financial assets in the Philippines: determinants, consequences and challenges for the central bank Celia M Gonzalez................................................................................................................. 389
Capital flows and their implications for monetary and financial stability: the experience of Poland Jerzy Pruski and Piotr Szpunar........................................................................................... 403
Capital flows and financial assets in emerging markets: determinants, consequences and challenges for central banks Muhammad Al-Jasser and Ahmed Banafe .......................................................................... 423
Thailand’s experiences with rising capital flows: recent challenges and policy reponses Yunyong Thaicharoen and Nasha Ananchotikul.................................................................. 427
Capital flows to Turkey: financial implications and policy responses Mehmet Yörükoğlu and Ali Çufadar ..................................................................................... 467

BIS Papers No 44 1
Financial globalisation and emerging market capital flows
Philip Turner
The focus of Deputy Governors when they met for their annual meeting at the BIS in January 2008 was on the great expansion of the role of emerging market economies (EMEs) in the international banking and capital markets. One simple measure of that deeper integration is the growth of EME capital movements as measured in the financial account of the balance of payments. In the 1990s, gross non-official inflows averaged around $170 billion a year, of which $100 billion was foreign direct investment. By 2007, gross non-official inflows exceeded $1,400 billion (Table 1). There had been a similar explosion in gross outflows. Net private flows towards the EMEs (ie inflows minus outflows) exceeded $400 billion, more than quadrupling since the 1990s. At the same time, the aggregate annual current account position of EMEs has moved from deficit over the 1980s and 1990s to substantial surplus.
Table 1
Private capital flows and the EMEs1 In billions of US dollars, annual rate
1980–89 1990–99 2000–07 2006 20073
Gross inflows 15.6 173.8 542.6 902.4 1,440.2
Of which: FDI 12.2 102.2 267.3 354.4 530.3
Gross outflows 14.5 86.4 409.7 769.0 1,001.3
Of which: FDI 2.6 24.6 115.6 216.0 261.6
Net flow2 1.1 87.4 132.8 133.5 438.8
Memo: Current account –16.4 –23.3 244.1 451.0 542.7
Increase in reserves 11.6 61.9 364.6 515.2 940.4
Capital inflows to official sector4 54.6 47.3 3.1 –57.3 26.2
Note: This is not a complete balance of payments statement. The memorandum item on capital inflows to the official sector is the sum of government borrowing identified as such in the balance payments (for example, many countries do not separately identify non-resident purchases of locally issued government bonds). Errors and omissions and capital transfers are not included. 1 Argentina, Brazil, Chile, China, Colombia, the Czech Republic, Hungary, Hong Kong SAR, India, Indonesia, Korea, Malaysia, Mexico, Peru, the Philippines, Poland, Russia, Singapore, South Africa, Taiwan (China), Thailand, Turkey and Venezuela. 2 Excluding official flows that can be identified as such. 3 Preliminary figures. 4 Including public sector international debt issuance and bilateral official credit and other borrowing (from international banks, the IFIs etc).
Source: IMF, Balance of Payments Statistics.

2 BIS Papers No 44
Few would have predicted the nature and the scale of these developments a decade or so ago. At that time, the focus of debate was quite different. Most EMEs had current account deficits that had to be financed: at times, international finance became very difficult. Policy analysis at that time therefore concentrated largely on the links between capital flows and financial crises. Such a focus was inevitable after a series of crises in the 1980s and the 1990s had been made worse by volatile short-term capital flows into countries with thin capital markets or poorly supervised banks.
From the 1980s onwards, the importance of improving domestic financial intermediation in the EMEs was increasingly recognised. After the 1982 debt crisis, Lessard and Williamson (1985) argued that the sources of finance in the developing world needed to be broadened and that financial instruments had to achieve a better distribution of risks and rewards. The BIS annual report after the Mexican crisis in 1994–95 drew a similar conclusion (BIS (1995)).
Over the past decade, the development of local financial markets and the greater openness to foreign investors and financial institutions have indeed increased the diversity of capital inflows to the EMEs. Partly because of the growth of local institutional investors (especially pension funds) and partly because regulatory restrictions have largely been relaxed, net foreign asset holdings by the non-official sector in the EMEs have risen substantially. Official holdings of foreign assets, notably forex reserves, have increased even more. This strengthening of external balance sheets across the emerging markets has no doubt increased their resilience to macroeconomic shocks. Nevertheless, the massive accumulation of reserves has given rise to major policy dilemmas.
Both international trading in EME financial assets and trading by EME entities in international assets have risen. Capital is flowing in both directions in larger volumes (see box “Definition of capital flows”). “Real money” foreign investors – pension funds, for example – have increased their holdings of EME financial assets; because such investors have a low degree of leverage, they are less sensitive to changes in borrowing conditions in international markets. In addition, the scope of financial derivatives based on EME exchange rates or other assets has broadened, improving at least the microeconomic aspects of market liquidity. The broadening of the derivatives market has helped some classes of foreign investors to take more highly leveraged exposures to EME assets (as well as to hedge exposures to underlying assets). Such structural changes in EM balance sheets and these enhanced possibilities for leverage make it harder to grasp the scale of underlying exposures and decipher financial market dynamics.
Definition of capital flows
The terms used for the various measures of international capital transactions sometimes cause confusion because such terms are used ambiguously in common parlance. The definitions used here are as follows:
Inflows = Purchases by non-residents of domestic assets less their sales of such assets.
Outflows = Purchases by residents of foreign assets less their sales of such assets.
Hence inflows and outflows can be either positive or negative. For example, a non-resident sale of domestic assets is a negative inflow – not an outflow. The term “net flows” means inflows minus outflows.
A particular question in the background at this meeting was whether these changes have made capital flows to EMEs more or less sensitive to financial developments in the advanced economies. At the time of the meeting, the tumult in global markets that began in August 2007 seemed to have had very little effect on the markets or the exchange rates of emerging economies. If financial globalisation had indeed deepened, why that apparent disconnect? Later in the year, however, the deepening banking crisis in the major economies had a major impact on the EMEs.

BIS Papers No 44 3
The papers written for this meeting – three background papers by BIS staff members and the country-specific papers prepared at the central banks of 19 EMEs – tackle several aspects of these issues.
Broad trends Most of the central bank papers in this volume analyse the historical trends in capital flows over the past 10 to 20 years. The BIS staff paper by Mihaljek summarises the broad trends of capital flows in the main EME areas during the past decade. Of the many aspects he mentions, two are especially worth highlighting.
The first is the increasing importance of capital outflows from EMEs. Mihaljek notes that sovereign wealth funds are playing a greater role in the international investment of the national wealth of the EMEs. He also finds that institutional investors such as pension funds are becoming major players. They now “recycle” the funds generated from the combination of current account surpluses and capital inflows of emerging market economies. He notes that much of these notionally private outflows might originate in the public sector institutions such as state-owned commercial banks. An example of the importance of private capital outflows is Hong Kong. In its contribution to this volume, the Hong Kong Monetary Authority (HKMA) observes that the current account surpluses of Hong Kong SAR have been largely associated with capital outflows by the private sector (as a result, the accumulation of foreign reserves in Hong Kong SAR has been relatively moderate). Another example is given by Chile. Desormeaux, Fernández and García observe that net reductions in capital flows in Chile have recently been based on “sudden starts” in capital outflows as opposed to “sudden stops” in capital inflows observed in the past.
A second key point by Mihaljek is that changes in the volatility of capital flows have been notable. Among the central bank papers, this point is exemplified by Pesce, who notes that, in Argentina, capital flight before 2002 was followed by a sharp resumption in capital inflows once the fixed exchange rate had been abandoned. Likewise, Vargas and Varela observe that the volatility of capital inflows to Colombia does not appear to have increased but that the volatility of outflows has risen, apparently under the influence of position-taking by pension funds.
An important issue raised at the meeting is how to monitor capital flows effectively given the reporting lags in balance of payment statistics. For example Ooi’s paper cites a number of internal reporting systems used by Bank Negara Malaysia to enhance its surveillance of capital flows. The HKMA paper describes how cross-border bank flows between Hong Kong SAR and China are monitored. Several central banks have inherited fairly elaborate monitoring and reporting mechanisms associated with capital controls. But financial innovation has made the data harder to interpret because changing risk exposures (eg through forward exchange markets) may not immediately show up in capital flow statistics.
Exchange rate-sensitive capital flows Many participants argued that the increased importance of capital flows driven by exchange rate expectations had created major implications for EMEs. Local currency debt markets had expanded,1 local corporations were more able to adjust the mix of foreign and local currencies in their borrowing according to such expectations, and local institutional investors were now managing portfolios that contained foreign currency assets.
1 Including issuance in international markets. Sidaoui explains the mechanics of a 20-year euro-peso issue by
Mexico, discussing in particular the calculation of pricing.

4 BIS Papers No 44
The resulting greater integration with international capital markets had several important implications. One was the tighter linkage of long-term debt markets with global debt markets. Such greater integration had been reinforced by declining country risk premia (partly the result of a shift from deficit to surplus in the current accounts of many countries). The greater presence of foreign investors in local currency debt markets has probably contributed to a trend towards lower long-term interest rates in EMEs. Some EME central banks at this meeting expressed worries that such investments could drive long-term rates too low for the needs of the local economy. For that reason, several maintained capital controls on foreign purchases of local currency debt. As a corollary of low long-term rates, asset prices more broadly could be driven too high. In any event, benchmark long-term rates had become more responsive to international influences.
A second implication was that the exchange rate was becoming more responsive to international shifts in asset preferences, which could increase exchange rate volatility. From 2002 to 2007, EME currencies had come under strong appreciation pressures. In addition, many central banks had resisted appreciation by engaging in forex intervention on an unprecedented scale and for far longer than expected. Several central bank papers discuss the various rationales for intervention in forex markets. For example, Mohan stresses that intervention can counter self-fulfilling one-way expectations. It can also help insulate the local economy from external shocks. Apart from highlighting precautionary motives for reserve accumulation, Pesce also cites the need for intervention to prevent cycles of real exchange rate appreciation followed by sudden currency collapse. Rossini, Quispe and Gondo observe that foreign reserve accumulation gives the central bank the ability to smooth exchange rate fluctuations, which can be costly in a highly dollarised economy like Peru’s. Thaicharoen and Ananchotikul cite the need in 2006 to moderate very rapid appreciation of the Thai baht, although the effectiveness of that intervention turned out to be limited.
Appreciation pressures to some extent reflected fundamentals. One participant said that a low-income country in the early stages of development would have an exchange rate that was at a very large discount to its purchasing power parity level. Reforms in the political and legal framework (eg the better protection of property rights), the greater market-orientation of policies, increased total factor productivity and better trained labour and a host of other improvements associated with development would eventually narrow the exchange rate-PPP gap. But how rapidly the narrowing should happen was difficult to judge. According to this participant, the risk that the market would lead to an overshooting of (or too-fast movement in) the exchange rate was all the greater in countries that had just begun to develop rapidly. Such countries would not feel as comfortable with a highly flexible exchange rate as do countries with deep and resilient financial systems.
Nevertheless, several participants noted that crises in their countries had been aggravated by earlier attempts to resist currency appreciation. In her discussion of Indonesia, Goeltom sets out the key dilemmas. Attempting to cope with increased capital inflows, Indonesia widened its intervention band several times between September 1992 and August 1997. But short-term inflows continued to rise because “the intervention band helped the market to predict movement in the nominal exchange rate” and reduced the incentive for local borrowers to hedge their debt exposure. She also examines the issues that can arise when certain classes of non-resident investors dominate price determination in thin forex markets during periods of stress.
In any event, it was clear from several central bank contributions that the rise in exchange-rate-driven capital flows had complicated the setting of monetary policy. A continuing challenge, noted by Mohan, is that raising interest rates to tighten policy could attract additional capital inflows. Niedermayer and Bárta point out that appreciation pressures led to the undershooting of inflation targets in the Czech Republic earlier in this decade. However, cutting interest rates below the level consistent with the inflation target in order to curb capital inflows posed significant macroeconomic risks. Vargas and Varela note that currency appreciation in Colombia may have delayed the tightening of monetary policy in 2004 and

BIS Papers No 44 5
2005. In a number of countries, capital flows also appear to have been associated with fluctuations in domestic credit growth – see the contributions by Király et al on Hungary, by the HKMA (in Hong Kong such fluctuations reflect activities in the stock market by non-residents) and by Yörükoğlu and Çufadar (capital inflows in Turkey were associated with growth in bank credit). In countries that peg their exchange rate, capital flows can more directly affect liquidity conditions in the money market, although the central bank has tools to deal with this (see the paper by Al-Jasser and Banafe).2
Large changes in commodity prices added to these complications. A particular issue of concern in several countries has been how far to respond to increases in food prices. Because food prices have a much higher weight in the consumption basket in EMEs than in more developed market economies, their impact on the consumer price index is greater. In a simple inflation-targeting framework, this would mean that a given percentage rise in food prices would lead to larger increases in nominal interest rates in developing than in developed countries. This could lead to even stronger capital inflows and exchange rate appreciation.
Once the decision has been taken to intervene and buy foreign exchange, central banks (or governments) also need to decide on the nature of the local currency instruments to be issued and on possible measures to limit the consequent growth of banks’ balance sheets (“sterilisation”, in a word)3. Several of the central bank papers explore in some detail the challenges for domestic liquidity management of growing foreign exchange reserves. Possible policies include money market borrowing, issuance of central bank or government debt, repo or forex swap operations, and changes in reserve requirements. Mohan argues that weighing the pros and cons of various instruments depends on the nature and size of the capital inflow and on the financial market context. Ooi also argues that longer-term paper was needed when the amount of liquidity to be sterilised was large relative to the size of the economy. Sterilisation is most effective when it involves the issuance of long-term paper to the non-bank sector.
The issuance by the state of local currency debt to finance the acquisition of foreign exchange reserves creates a currency mismatch for the official sector. This could prove costly. Several papers attempt to quantify the costs of building up reserves (eg Rossini, Quispe and Gondo). Mohan explains how the use of government-issued bonds ensures that the costs are borne transparently by the government, not the central bank. Both India and China have also sought to limit the growth of money and credit by raising bank reserve requirements. Although raising the requirements imposes costs on domestic banks, it can make the banking system more resilient to liquidity shocks. This is because increasing reserve requirements in the expansion phase of a cycle (eg when capital inflows are boosting the liquidity of the banking system) can provide the authorities with a liquidity cushion that can be released when banks face greater funding difficulties (eg because of a reversal of earlier inflows). This proved to be unexpectedly useful for many EM central banks during the period of extreme stress in October 2008. Furthermore, variations in bank reserve requirements could avoid some of the disadvantages of official debt issuance. Several noted that attempting to sterilise large and persistent inflows by issuing paper of very short term maturity would have a “snowball” effect as increasing volumes of sterilisation papers fall due and have to be rolled over.
2 However, Sidaoui points out that financial integration has facilitated the conduct of monetary policy in Mexico
by improving transparency and contributing to a deeper financial sector. For example, financial markets provide information to the central bank on inflation or exchange rate expectations of market participants. In their discussion of Poland, Pruski and Szpunar argue that inflation targeting is an effective framework for coping with capital flows.
3 And on the composition of central bank balance sheets.

6 BIS Papers No 44
Increased bank flows: liquidity risks Another important development is the revival of cross-border banking flows, which could have several implications for financial stability. The banking systems in several EMEs have become in recent years more dependent on wholesale foreign funding. This has sometimes involved borrowing by affiliates of foreign banks from their parents. In other cases, foreign currency lending to residents (often in derivative contracts) was financed by borrowing in wholesale markets in the major financial centres. The liquidity risks of such dependence were demonstrated when such markets became dysfunctional in September and October 20084.
Currency mismatches from bank lending in the household and corporate sectors were a potential problem in several countries. Király et al explain that, in Hungary, households are taking forex risk because they borrow from banks heavily in foreign currencies; the banks then balance their direct forex exposure by borrowing abroad in foreign currency. In other countries, prolonged upward pressure on local currencies led exporters to overhedge future foreign currency receipts.5
Mihaljek argues that the foreign ownership of local banks has tended to reduce the risk of a traditional banking solvency crisis because foreign owners are generally large, well-capitalised financial institutions. And their start-up costs are such that they tend to take a long-term view of the growth opportunities in the markets where they set up operations. Once they have established a local presence, they have consistently sought to protect their franchises. They also tend to focus on traditional commercial banking activities and not on trading securitised products. But foreign-owned banks may well underestimate the accumulation of credit risk arising from rapid credit growth in EMEs. Foreign-owned banking systems might also be more exposed to the risk of a sharp reversal in capital flows, triggered by problems either in the local market or in the parent bank’s home market. Mihaljek discusses both sets of problems.
A heavy presence of foreign banks may also accentuate the risk of monetary or financial contagion. There is evidence that monetary policy shocks at home prompt global banks to change flows to their affiliates overseas. Once the recognition or materialisation of credit risk in one country triggers a broader reassessment of risk in a particular region, close financial linkages between home and host country institutions could also serve as channels for contagion. The danger is greater when financial institutions pursue common strategies across the region, which tends to result in banks having similar exposures across countries. The need for more effective cooperation between host and home country supervisors, an issue that presents particular difficulty in countries with a large presence of foreign-owned banks, was also discussed during the meeting.
Financial and capital account reforms The evolving structure of capital flows described earlier has been much influenced by financial reforms in the emerging markets. Some insights are provided by Desormeaux, Fernández and García, who provide an overview of the liberalisation of capital movements worldwide before examining the case of Chile. (See also papers by Eckstein and Ramot-Nyska on Israel, by the People’s Bank of China, and by Niedermeyer and Bárta on the Czech Republic.) Apart from the relaxation of restrictions on cross-border capital movements, reforms in EMEs have included widening the range of market-based instruments to deal with
4 See the report of the Deputy Governors meeting in 1999 on policies to manage the liquidity risks that are often
created by strong capital inflows (BIS 2000). 5 Firms in Brazil and Korea suffered losses from these strategies when the exchange rate fell sharply in 2008.

BIS Papers No 44 7
capital inflows, improving public debt management, and removing the constraints on local institutions investing in foreign assets. Ahn outlines the measures taken by Korea to promote capital outflows.
The overwhelming trend over the past decade regarding controls on capital inflows has been liberalisation. Even in countries that retain capital account controls, the authorities have become more discerning and flexible for reasons of both financial stability and monetary policy. Mohan notes that India’s comparatively strict regulation of short-term debt flows and preference for flows that do not create debt (such as FDI and equity investment) reflect financial stability concerns. This is consistent with the clear cross-country evidence that equity flows are beneficial to growth; the evidence about debt flows is more ambiguous. He also argues that restrictions on foreign currency borrowings of domestic corporations prevented such entities from “annulling the effects of monetary tightening”.
In the past few years, several countries have attempted to limit appreciation pressures by limiting inflows. For example, Pesce explains that controls on capital inflows were introduced in Argentina to make the flexible exchange rate regime more resilient. Both Thailand (December 2006) and Colombia (May 2007), aiming to deter capital inflows attracted in part by monetary tightening, introduced controls on short-term capital inflows (see the contributions by Vargas and Varela and Thaicharoen and Ananchotikul).6
Several papers review the effectiveness and implications of capital controls. Instances of capital controls “working” – that is, instances in which they are the least bad policy – are well documented. Participants nonetheless noted that even when capital controls seem to be well designed, they tend to run the risk of sending an unintended signal to foreign investors that they are unwelcome in the local markets. Furthermore, although capital controls can provide a temporary breathing space (and restore some independence to monetary policy), they tend to lose effectiveness over time. Some participants said they had resisted the temptation of imposing such controls, fearing that such controls would be considered a policy reversal in their processes for financial development and liberalisation and thus affect policy credibility. It was on those grounds that, on several occasions, Israel had considered but rejected Chilean-type capital controls.7 In 2008 both Colombia and Thailand completely eliminated controls on capital inflows, which they had imposed only within the preceding two years.
Several central banks (eg see contributions by the People’s Bank of China; Desormeaux, Fernández and García; Gonzalez; and Thaicharoen and Ananchotikul) reported that measures to liberalise capital outflows may have eased appreciation pressures. The Philippines, for instance, has lifted most limits on foreign exchange purchases by individuals; pension funds and some mutual funds have been encouraged to make deposits in special accounts at the central bank. However, Thaicharoen and Ananchotikul note that to the extent that capital outflow positions were hedged, the impact on the exchange rate may have been limited. In addition, as Mohan notes, liberalisation of outflows can make the country appear more “market friendly” and so attract further inflows.
Pension funds, demographic trends and capital flows Moreno and Santos focus on demographic trends and the recent development of funded pension systems. They note that populations in many EMEs are beginning to age, a trend that could become quite rapid in some countries, including China. Other things equal, the
6 Goeltom notes that in the early 1990s, Indonesia also introduced controls on foreign borrowing and that, in the
aftermath of its crisis in the late 1990s, it imposed restrictions on rupiah transfers to non-residents and derivative transactions not supported by underlying transactions.
7 Thaicharoen and Ananchotikul discuss the benefits and costs of the capital controls that were recently imposed in Thailand in more detail.

8 BIS Papers No 44
ageing trend should contribute to lower national saving rates (as the retired draw on the savings built up during their working life). If investment rates do not fall as much, this should help move current account positions from surplus toward deficit. But a strengthening precautionary motive for saving (to provide for rising health and education costs) plus related fiscal and asset accumulation policies may offset the impact of demographic developments, at least for a time.
In addition, trends in national saving rates could be affected by how pension benefits are financed. Recent reforms have moved away from defined benefit and pay-as-you-go plans toward those based on defined contributions and prefunding. With a few exceptions, however, no clear evidence exists that such pension system reforms have increased saving. This could be due to a number of factors, such as a lack of financial literacy, transitional fiscal costs associated with pension reforms, and the problems with low or declining pension fund coverage.
The rapid growth in pension fund assets appears to be associated with some deepening of financial markets. But the impact in many countries has been limited because EME pension funds still allocate a significant proportion of their assets to domestic liquid assets such as bank deposits. The funds, especially in Latin America, have also made large allocations to government bonds. EME pension funds typically allocate small amounts to equities or foreign assets.
Moreno and Santos provide examples of how a greater allocation of funds to equities and foreign assets would increase returns and could provide diversification benefits. Desormeaux, Fernández and García suggest that such benefits could be significant; which may partly account for the growing investment abroad by Chilean pension funds. Nevertheless, for reasons related to a lack of familiarity or technical difficulties, pension funds may still be too reluctant to invest abroad, even when restrictions on such investments have been eased. Even when they invest abroad, they often hedge forex risks – and so the country loses a potential gain when the currency depreciates very sharply in a crisis. The prospect of high short-term returns at home has doubtless been a factor too. Such high returns are to some extent transitional (eg reflecting greater success at lowering inflation than many had expected in 2000).
More liquid local markets A recurrent theme of the meeting was the deepening of local money and capital markets. By the usual measures, market liquidity had increased; because non-resident investors tend to trade more frequently, they have contributed in an important way to improving market liquidity. The development of derivative markets had been associated with this improved liquidity (regarding development of financial or derivatives markets see contributions by Desormeaux, Fernández and García; Ahn; Ooi; Sidaoui; and Pruski and Szpunar).
In their background paper on hedging instruments, Saxena and Villar note that the development of derivatives markets in the EMEs has been helped by the very strong growth in two cash markets. First, total trading in EME currencies in the foreign exchange market rose from $98 billion in 2001 to $247 billion in 2007. As the volume of spot transactions rises, the share traded on derivatives markets tends to rise relative to the spot market. Second, local currency domestic bonds outstanding increased from about $1 trillion in 1998 to more than $4 trillion now. As issuance has become more market oriented and trading has increased, yield curves in many countries have lengthened significantly. The lengthening should in principle help the pricing of interest rate derivatives.
The size of the derivatives market in EMEs has grown annually by 28% since 2004, with the average daily turnover in OTC derivatives reaching $516 billion in 2007 and accounting for 12% of the global market. Hedging opportunities in EMEs, however, are still concentrated in foreign exchange risk: foreign exchange contracts make up more than 80% of OTC

BIS Papers No 44 9
derivatives market trading. In contrast, the market share of OTC interest rate contracts in EMEs is just 10%.
Saxena and Villar examine hedging instruments for the three types of risk:
• Foreign exchange risk: The banking sector is the biggest user of OTC forex derivatives and keeps the largest open position in most EMEs. Its net position is generally concentrated in foreign exchange swaps, the most significant OTC derivative product in EMEs. Such swaps are commonly used by foreigners that do not have access to the money market. Forward markets are important in Korea and Taiwan. Although they are liquid in only a handful of other jurisdictions (India, Hong Kong SAR, Singapore, Chile, Russia and South Africa), forex derivatives markets are growing in a number of countries, including Argentina, Colombia, Chile and Mexico (see contributions by Pesce; Vargas and Varela; Desormeaux, Fernández and García; Sidaoui; and Peru). Most trading activity takes place between banks and other financial institutions. For example, since 2002, pension funds in Chile have diversified their exposure to foreign assets and have hedged foreign exchange risk by selling long forward positions in foreign exchange to the local banks. To close their positions, local banks in turn sell long forward positions in foreign exchange to their clients, notably corporations. FX options have relatively large trading volumes in Singapore, Hong Kong SAR and India.
• Interest rate risk: The OTC derivatives market for hedging interest rate risk is rather underdeveloped in EMEs and is concentrated predominantly in interest rate swaps (rather than in forward rate agreements). The reason that the market for interest rate derivatives has remained small is that interest rate risk is relatively low in EME and mostly remains with the banking sector. In particular, interest rates are less volatile and high spreads compensate financial intermediaries for interest rate exposures. Regulatory restrictions, inadequate accounting rules for non-financial corporations and lack of expertise in the valuation of derivative products have also played a role (see the paper by Vargas and Varela). Trading volumes are very low in most currencies, with the exceptions of contracts denominated in the HK dollar and the Mexican peso. But trading is growing in the Indian rupee, Korean won and Singapore dollar. In some cases, the presence of foreign banks has helped the development of derivatives markets as well as financial markets more generally (see the contributions by Pruski and Szpunar and by Ooi). For example the share of foreign banks in net turnover on the market for domestic interest rate instruments exceeds 50% (that in the FX swap market exceeds 90%). Foreign banks have large positions in off-balance sheet interest rate instruments.
• Credit risk: Credit default swaps (CDS) are the most important financial products for managing exposure to credit risk in EMEs. The CDS market has been one of the fastest growing global financial markets in recent years. Most CDS have been arranged on corporate entities in global financial markets, but the market value issued out of EMEs is concentrated on sovereign entities. For EMEs, the most liquid tranche of the market is around five years, but there is also a market up to 10 years.
Epilogue on financial stability A number of contributors to this volume discuss the implications of capital flows for financial stability (eg Mihaljek; Ooi; and Yörükoğlu and Çufadar), and the meeting concluded by inquiring whether central banks are doing enough to discharge their responsibilities in this area.
EMEs have adopted a number of measures to address financial stability concerns. Most have sought to bring prudential and regulatory frameworks in line with international best practices. They have given greater regulatory and supervisory flexibility to institutions that

10 BIS Papers No 44
are seen as having strong governance and risk-management capacity. For example, in Turkey, special attention is paid to capital adequacy. In some cases improvements in the banking sector have allowed the lifting of certain prudential restrictions (eg on the foreign currency net open positions or on equity-related activities) even as other prudential measures are maintained. Supervisory practices have adapted to the rapid evolution of the financial system and the risks of contagion.
Echoing a common theme, Ooi notes that, with the growing maturity of the market and the capabilities of the players, supervision and regulation have evolved from being predominantly “rule based” (ie reliant on administrative controls and prescriptive rules) towards a more “principle based” approach that is more adaptive to changing market circumstances and business practices. Under the evolving regime, he argues, both the regulatory and supervisory perspectives accord greater flexibility to those institutions with strong risk management and corporate governance practices.
One major challenge is dealing with complex financial conglomerates. As Ooi points out, a balance has to be struck between allowing group synergy and efficiency on the one hand and, on the other, preventing the conglomerate from introducing excessive risks into the domestic system. Cooperation between home and host supervisors is important and is not easy. The sharp turbulence in markets worldwide in the second half of 2008 demonstrated the need for central banks to monitor the risk of contagion from global financial markets.
Several participants reported that they took a multidimensional approach to assessing and dealing with potential vulnerabilities. One participant put the issue memorably when he said that, “when driving downhill (strong demand) on a curved road (markets volatile), one had to use not just the brakes (monetary policy) but also the gears (prudential regulations)”. Exposure to short-term volatility remains a fact of life in many EMEs. Yörükoğlu and Çufadar explain that Turkey has found the best responses to be tight fiscal and monetary policies, a floating exchange rate, and financial market development with the strong participation of foreign investors. They stressed that there was no fear of floating. Foreign participation in domestic financial markets had increased substantially, helping to improve liquidity and extend debt maturities.
Many participants noted that they imposed more strict and explicit liquidity and prudential measures on their financial firms (including by issuing warnings) than was common in advanced countries. The measures include: rules on open foreign exchange positions; rules on leverage ratios as well as on the orthodox international capital ratios; significant reserve requirements; and clearly defined liquidity ratios. The supervisory authorities had also intensified banking supervision to cope with their more dynamic financial system.
Finally, several participants said that one aspect of a multidimensional approach to vulnerability was that shocks came from major countries in the industrial world. Were current international arrangements up to coping with these? Some argued that the major emerging market countries should play a more active part within the global community of central banks and regulatory and other authorities to improve the international financial architecture.
References
Bank for International Settlements (1995): “Capital flows and policy in the emerging markets”, 65th Annual Report, Basel.
Bank for International Settlements (2000): “Managing foreign debt and liquidity risks”, BIS Policy Papers, no 8, Basel.
Lessard, D, and J Williamson (1985): “Financial intermediation beyond the debt crisis”, Institute for International Economics, Policy analyses in international economics, no 12, Washington.

BIS Papers No 44 11
The financial stability implications of increased capital flows for emerging market economies
Dubravko Mihaljek1
Introduction
Deepening economic and financial integration between emerging and advanced economies has become one of the salient features of global economic developments over the past decade. It has manifested itself, among other ways, in the recent surge in private capital flows from advanced economies to emerging markets, but also in the reverse flows of capital from emerging market countries running large external surpluses to some advanced economies and developing countries. Along with many economic and financial benefits, increased capital flows have brought with them considerable policy challenges.
This paper examines some key financial stability challenges of increased capital flows for emerging market economies. It focuses in particular on the implications of, and policy responses to, increased cross-border banking flows. These financial stability issues have received less attention than the macroeconomic implications of capital flows (such as exchange rate appreciation and internal and external imbalances) and standard policy responses to these challenges (greater exchange rate flexibility, sterilisation, etc).
To set the stage for the subsequent discussion of financial stability issues, Section 1 examines some stylised facts on recent trends in capital flows to emerging market countries. The trends in gross inflows and outflows of private capital clearly point to growing financial integration of emerging market economies with the rest of the world. The trends in net inflows suggest a build-up of moderate macroeconomic pressures in Asia and Latin America, and very large pressures in central and eastern Europe. Of particular interest to financial stability are the large increases in gross inflows of investments to banks and the non-bank private sector, and in gross outflows to debt securities. The latter have been part of the recent phenomenon of “recycling” of capital inflows by emerging market economies, in which institutional investors such as pension funds and sovereign wealth funds are increasingly playing an important role.
Section 2 examines how cross-border banking flows affect some key risks to financial stability in emerging markets. The analysis is selective rather than exhaustive. First, the risks stemming from cross-border banking flows in the emerging markets with a significant presence of foreign-owned banks are examined. It is argued that the solvency risk is generally lower in such markets, but the credit risk and the potential for capital flow volatility and cross-border contagion are higher. Second, financial stability risks emanating from increased investment by non-residents and foreign-owned financial institutions in foreign exchange and money markets of selected EMEs are examined.
Section 3 concludes with a review of policy responses to these risks. These responses have involved not only general macroeconomic and financial market reforms, but also the strengthening of a whole range of prudential regulations and banking supervision in general.
1 The author thanks Marjorie Santos and Jimmy Shek for excellent research assistance, and Byung Chan Ahn,
Michael Chui, Már Gudmundsson, Hoe Ee Khor, Ramon Moreno, Ilhyock Shim, Philip Turner, Bill White, and participants of the Deputy Governors’ Meeting and a joint seminar at Singapore Management University and IMF’s Singapore Regional Training Institute for valuable comments on an earlier draft of this paper.

12 BIS Papers No 44
1. Recent trends in emerging market capital flows
Definitions and data Most of the literature on capital flows to emerging market countries analyses net flows, which indicate how large the balance of external funds that enter or leave an economy is. While the composition of net capital flows matters for financial stability, net flows per se are primarily important from the macroeconomic (ie demand) management perspective rather than the financial stability perspective.
As this paper discusses the financial stability consequences of capital flows it will focus mainly on gross inflows and outflows of capital. Gross capital flows are important on at least three grounds: first, as a measure of financial integration between emerging and advanced economies; second, as a source of information for macroeconomic analysis; and third, as a key source of information for financial stability analysis. For instance, gross inflows and outflows could be more or less balanced in terms of size, leading one to conclude that capital flows raise no major macroeconomic or financial stability issues. However, whether gross inflows and outflows are each equivalent to 1% or to 20% of GDP is not inconsequential for macroeconomic and financial stability. The flows of private capital of 20% of GDP are bound to affect the domestic financial system and the economy, even though in net terms the funds that stay in the country might not appear exceptionally large. Balanced net flows might also conceal major discrepancies in terms of the composition (eg, FDI vs portfolio and other investments; debt vs equity flows) and other characteristics of capital flows (eg maturity and currency composition). Therefore, from the financial stability perspective it is essential to analyse gross and not just net capital flows.
The paper will focus on private as opposed to official flows of capital. Over the past decade, private capital flows have clearly come to dominate official flows in all emerging markets (Appendix Table A3), including those with less developed financial markets such as Africa.
The period examined is mostly 2001–07, with some comparisons made to capital flows in the 1990s. The country groupings used in the paper are emerging Asia (China, India, Indonesia, Korea, Malaysia, the Philippines, Singapore and Thailand); Latin America (Argentina, Brazil, Chile, Colombia, Mexico, Peru and Venezuela); and central and eastern Europe (CEE: Bulgaria, Croatia, the Czech Republic, Estonia, Hungary, Latvia, Lithuania, Poland, Romania, Slovenia and Turkey). The aggregate for all emerging market economies also includes, in addition to these countries, Russia, Saudi Arabia and South Africa.
The main data source is detailed country balance of payments data in IMF’s International Financial Statistics (IFS). Gross private capital inflows and outflows are added up item by item (rather than derived as a difference between current account balances, change in reserves and official flows, as is often the case in the literature) and flows involving the official sector (government and monetary authorities) are excluded.2 Data for 2007 are mainly estimates from the IMF’s April 2008 World Economic Outlook. Data on cross-border loans come from the BIS locational banking statistics.
The data are mostly analysed by emerging market regions rather than by individual countries. Because of the focus on financial stability issues, the paper considers not only total regional capital flows but also averages for countries within each region (equation 1). The former is useful from the global economy (or global investment) perspective, for instance, when considering global flows of capital (or opportunities for diversification) and associated imbalances. The latter is useful as an indicator of the effects of capital flows on
2 Because of limited availability of data in the IFS, Slovakia is not included in the CEE aggregate.

BIS Papers No 44 13
an average country in the region. For this reason, regional averages are not weighted by the size of the economy.3
Total regional capital flows (as a percentage of regional GDP) ∑
∑
=
=n
ii
n
ii
Y
KF
1
1 vs ∑=
n
i i
i
YKF
n 1
1
Average capital flows for countries within a region (as a percentage of GDP)
(1)
Size and composition of gross capital inflows The recent wave of gross inflows of private capital to the emerging market economies started around 2002 and accelerated in the past two to three years (Graph 1). In emerging Asia, gross private capital inflows averaged almost 15% of GDP in 2007 (top right-hand panel). This was 5 percentage points higher than before the 1997–98 crisis, even though the region is now running a large current account surplus. In Latin America, gross private inflows picked up from 1% of GDP in 2002 to almost 6% on average in 2007 (bottom left-hand panel), about 3 percentage points below the historical peaks from the early 1990s. In CEE, opportunities created by accession to the European Union have boosted gross private capital inflows to over 20% of GDP on average in recent years (bottom right-hand panel), an unprecedented level for EMEs in recent history. As a result, this region now receives around 26% of gross private capital inflows to emerging markets (compared with around 11% in the mid-1990s); Latin America receives around 12% (against 29%); emerging Asia 47% (against 51%); and other emerging markets around 19% (against 9%).
The latest surge in gross private capital inflows has been for the most part due to FDI and other investment inflows, which increased by a cumulative $1.5 trillion and $1.2 trillion, respectively, between 2002 and 2007 (Graph 2). Portfolio inflows increased by a cumulative of $0.9 trillion over the same period. As a result, the share of FDI in gross inflows has dropped since the start of the decade to around 30% of the total in 2007, while the shares of portfolio and other investment inflows have increased considerably, to 32% and 38%, respectively (Graph 3).
What is special about the current wave of gross capital inflows to EMEs, compared to the previous ones, is that it is taking place against the background of much stronger external current account positions (with the exception of CEE) and the accompanying substantial accumulation of official foreign exchange reserves. For instance, the aggregate current account balance of EMEs switched from a deficit of around $60 billion per year on average during 1990–97 to a surplus of over $500 billion in 2007 (Appendix Table A1). During 1990–97, EMEs accumulated on average around $55 billion per year in official reserves, while in 2007 alone their reserves increased by over $1 trillion. One consequence of this huge increase in reserves has been a sharp increase in gross capital outflows from EMEs.
3 Hong Kong SAR is not included in the emerging Asia region because of extremely large flows relative to the
size of the economy, which would distort country averages for this region. While capital flows relative to the size of the economy are also very large in Singapore, they are smaller than in the case of Hong Kong SAR.

14 BIS Papers No 44
Graph 1 Inflows and outflows of private capital
Unweighted country averages, as a percentage of GDP
All emerging markets
-4
0
4
8
12
16
1990 1994 1998 2002 2006
Gross inflows Gross outflows
Asia
-4
0
4
8
12
16
1990 1994 1998 2002 2006
Latin America
0
2
4
6
8
10
1990 1994 1998 2002 2006
Central and eastern Europe
-2
4
10
16
22
1990 1994 1998 2002 2006
Sources: IMF, International Financial Statistics and World Economic Outlook; author’s estimates.
Graph 2 Gross private capital inflows to emerging market economies
In billions of US dollars, emerging market totals
-50
50
150
250
350
1990 1994 1998 2002 2006
Other investment inflows- to banks
Other investment inflows- to other sectors
-50
50
150
250
350
450
1990 1994 1998 2002 2006
FDI inflows
Inflows to debt securities
Inflows to equity securities
Sources: IMF, International Financial Statistics and World Economic Outlook; author’s estimates.

BIS Papers No 44 15
Graph 3
Composition of gross private capital inflows In percent of gross private capital inflows, emerging market totals
FDI inflows115
94
52 49 4540
30
0
20
40
60
80
100
120
2001 2002 2003 2004 2005 2006 2007
Portfolio inflows
0
4
911
108
14
12
5
16
12 12 11
18
0
5
10
15
20
2001 2003 2005 2007
DebtEquity
Other investment inflows1
-13
-3
13 12 13
2117
-13
1
11
16
2118
21
-20
-10
0
10
20
30
2001 2003 2005 2007
To banks
To other sectors
1 Negative numbers indicate a decrease in foreign ownership of domestic assets classified as other investment inflows.
Sources: IMF, International Financial Statistics and World Economic Outlook; author’s estimates.
Size and composition of gross capital outflows As in the case of private capital inflows, the surge in private capital outflows started around 2002 and accelerated in the past two to three years (Graph 1). The change has been particularly pronounced in emerging Asia, where gross capital outflows increased by a cumulative $1 trillion in the past three years alone, reaching over $500 billion in 2006 (Appendix Table A2). In Latin America and CEE, gross outflows increased by a cumulative $260 billion and $180 billion, respectively, since 2005, reaching around $105 billion and $55 billion, respectively, in 2007 (Appendix Table A2). Relative to GDP, gross capital outflows now exceed previous historical peaks in all three regions; they range from 3% of GDP on average in Latin America and CEE, to almost 8% of GDP in emerging Asia (Graph 1).
The surge in gross capital outflows has been mostly due to outflows to foreign debt securities, which increased by a cumulative $800 billion since 2002 (Graph 4, left-hand panel). FDI outflows increased by a cumulative $520 billion over this period; other investment outflows to banks by a cumulative $350 billion and to the non-bank private sectors by $630 billion; and outflows to equities by a cumulative $190 billion. Private investors from Asia accounted for most of the increase in all categories of private capital outflows from EMEs.
Unlike gross capital inflows, the composition of gross capital outflows has become less balanced over time. The share of FDI fell to less than a quarter of gross outflows, from close to 40% in 2001 (Graph 5, left-hand panel); the share of equity fell to around 8% of the total (centre panel); and that of other investment outflows to banks to 15% (right-hand panel). The share of portfolio debt outflows increased at the same time to 40% of gross outflows from EMEs. From the financial stability perspective, the more balanced composition of other investment outflows is probably a positive development, given how skewed toward the non-bank sectors these outflows were in the past (Graph 5, right-hand panel). The growing imbalance between debt and equity portfolio outflows might be more of a mixed blessing, however, as it may reflect the use of capital controls and an increase in quasi-official flows (discussed below).

16 BIS Papers No 44
Graph 4
Gross private capital outflows from emerging market economies In billions of US dollars, emerging market totals
-100
0
100
200
300
400
1990 1994 1998 2002 2006
FDI outf low s
Outflow s to debt securities
Outflow s to equity securities
-50
0
50
100
150
1990 1994 1998 2002 2006
Other investment outf low s - to banks
Other investment outf low s - to othersectors
Sources: IMF, International Financial Statistics and World Economic Outlook; author’s estimates.
The regional distribution of capital outflows has not changed as much as that of inflows since the mid-1990s. Emerging Asia still accounts for roughly one half of total private capital outflows from EMEs, Latin America for 13%, CEE for 9% and other EMEs in this sample for 28%.
All in all, trends in gross inflows and outflows of private capital over the past few years clearly point to growing financial integration of emerging market economies. What merits attention from the financial stability viewpoint is especially the large increase in inflows to emerging market banks and the non-bank private sector, and the large increase in outflows to foreign debt securities.
Graph 5
Composition of gross private capital outflows As a percentage of gross private capital outflows, emerging market totals
FDI outflows
38
22
18
23
16
23 22
0
15
30
45
2001 2003 2005 2007
Portfolio outflows
19
1410
7 6 7 8
33
23 22
15
30
34
40
0
15
30
45
2001 2003 2005 2007
Equity
Debt
Other investment outflows1
-9
-26
917 17 17 15
22
65
40 3732
20 15
-40
0
40
80
2001 2003 2005 2007
To banks
To other sectors
1 Negative numbers indicate a decrease in domestic ownership of foreign assets classified as other investment outflows.
Sources: IMF, International Financial Statistics and World Economic Outlook; author’s estimates.

BIS Papers No 44 17
Trends in net capital inflows As noted above, what matters for macroeconomic management is primarily trends in net capital inflows, ie any balance of gross inflows and outflows of capital that influences aggregate demand. With the exception of central and eastern Europe, the broad picture of recent trends appears reasonably reassuring in this regard: relative to GDP, net capital inflows to emerging Asian and Latin American countries were on average close to zero in recent years (Graph 6). In CEE countries, however, net inflows of private capital reached 14% of GDP on average in 2007 (Graph 6, right-hand panel), generating massive pressures in local financial markets and the real economy.
Graph 6
Net inflows of private capital to emerging market economies Unweighted country averages, as a percentage of GDP
-8
-4
0
4
8
1990 1994 1998 2002 2006
All emerging markets
Asia
-3
0
3
6
9
12
15
1990 1994 1998 2002 2006
Latin America
Central and eastern Europe
Sources: IMF, International Financial Statistics and World Economic Outlook; author’s estimates.
That net inflows in emerging Asia are close to balance despite very large gross inflows is mainly the consequence of record high outflows of portfolio capital. In 2007, emerging Asian countries thus had on average a “surplus” of 1.6% of GDP in net FDI inflows, offset by “deficits” of –0.8% each in net portfolio and other investment inflows (Graph 7, left-hand panel). Latin American countries also had positive net FDI inflows (2.4% of GDP on average), offset by negative net inflows of portfolio and other investment capital (Graph 7, centre panel). In CEE countries, net inflows of FDI amounted to 5.6% of GDP on average in 2007, and net other investment inflows to as much as 9.7% of GDP on average (Graph 7, right-hand panel). Only net portfolio inflows were negative (around –1.4% of GDP on average).
Net inflows of FDI have been relatively stable in all three emerging market regions since 2001 (Graph 7). However, net portfolio inflows have been subject to reversals. Net other investment inflows decreased over time in Asia and Latin America, but increased significantly in CEE, raising a number of financial stability issues that are discussed below.
In sum, recent trends would suggest that macroeconomic pressures stemming from net inflows of private capital are low in Asia and Latin America, but very large in CEE. However, as noted above, behind the low net flows in Asia and Latin America are often hidden very large gross flows, which do raise a number of macroeconomic and financial stability issues. Of particular interest would seem to be large net inflows of other investment to banks and the non-bank private sectors in emerging Asia and in particular in CEE, and huge portfolio debt

18 BIS Papers No 44
and equity outflows from emerging Asia. The next two subsections examine developments in cross-border banking flows and in portfolio outflows from emerging market countries.
Graph 7
Composition of net inflows of private capital Unweighted country averages, as a percentage of GDP
Asia
-4
-2
0
2
4
2001 2003 2005 2007
Latin America
-4
-2
0
2
4
2001 2003 2005 2007
FDI
PortfolioOther
Central and eastern Europe
-4
0
4
8
12
2001 2003 2005 2007
Sources: IMF, International Financial Statistics and World Economic Outlook; author’s estimates.
Cross-border banking flows The balance of payments data on capital flows are highly aggregated and include, among items that are of interest for this paper, money market and negotiable instruments as part of portfolio debt flows; and cross-border loans, trade credit and transactions in currency and deposits as part of other investment flows. In addition, financial derivatives assets and liabilities are shown as a separate item. However, given their limited statistical coverage in EMEs, the financial derivatives flows will not be analysed separately in this paper.
Money market instruments comprise a small and relatively stable proportion of portfolio flows in Asia and CEE (around 2% of gross portfolio inflows, respectively outflows, in the past few years). In Latin America, however, they accounted for 20–50% of gross portfolio inflows (respectively, outflows). This issue is potentially important for financial stability; however, it is not pursued in this paper because it would need to be analysed at a disaggregated country level.
Other investment flows consist for the most part of trade credit and cross-border loans on the gross inflows side (Graph 8, left-hand panel), and trade credit and currency and deposits on the gross outflows side (right-hand panel). To obtain better insight into trends in cross-border banking flows over time, it is useful to look at the BIS locational banking statistics.4
Cross-border claims of BIS reporting banks on EMEs considered in this paper were estimated at $2.3 trillion in 2007 (Table 1), an increase of $1.4 trillion over the past five years. While emerging Asia and CEE secured the bulk of these inflows, relative to GDP they were much more important in the latter case, with the ratio of cross-border claims to GDP doubling to 32% between 2002 and 2007. The CEE countries are thus exposed to significant risks from a possible reversal in bank-intermediated capital flows. By contrast, cross-border loans decreased in Latin America by 4% of regional GDP in the past five years. While in Asia these flows increased slightly (by 2% of regional GDP), relative to the 1990s they were significantly lower.
4 For an introduction to the BIS banking statistics, see Wooldridge (2002).

BIS Papers No 44 19
Graph 8
Composition of other investment flows As a percentage of gross inflows/gross outflows of other investment
Unweighted country averages for 2004–06
Gross inflows of other investment
-20
0
20
40
60
80
Trade credit Loans Currency anddeposits
Otherliabilities
EME total Asia Latin America CEE
Gross outflows of other investment
-20
0
20
40
60
80
Trade credit Loans Currency anddeposits
Other assets
EME total Asia Latin America CEE
Source: IMF, International Financial Statistics.
Table 1 External positions of BIS reporting banks
vis-à-vis emerging market countries
Amount outstanding
USD billions Per cent of GDP
1998 2002 2007 1998 2002 2007
Emerging markets1 Vis-à-vis all sectors 1,017 865 2,290 19.3 14.6 17.3 Vis-à-vis non-bank private sector 366 354 914 6.9 6.0 6.9
Asia2 Vis-à-vis all sectors 574 442 1,068 26.6 14.7 16.9 Vis-à-vis non-bank private sector 105 87 270 4.9 2.9 4.3
Latin America3 Vis-à-vis all sectors 263 233 350 13.9 15.1 11.1 Vis-à-vis non-bank private sector 170 156 213 9.0 10.1 6.8
Central and eastern Europe4 Vis-à-vis all sectors 82 118 579 12.1 16.5 32.4 Vis-à-vis non-bank private sector 44 70 289 6.5 9.8 16.2
Assets of BIS reporting banks vis-à-vis individual emerging market countries; end of period. Totals for positions in US dollars; simple averages for positions as a percentage of GDP. 1 Sum of the regions below, plus Russia, Saudi Arabia and South Africa. 2 China, India, Indonesia, Korea, Malaysia, Singapore and Thailand. 3 Argentina, Brazil, Chile, Colombia, Mexico, Peru and Venezuela. 4 Bulgaria, Croatia, the Czech Republic, Estonia, Hungary, Latvia, Lithuania, Poland, Romania, Slovenia and Turkey.
Sources: IMF; BIS locational banking statistics.

20 BIS Papers No 44
Very large external positions of BIS reporting banks vis-à-vis CEE countries clearly represent a potential source of external vulnerability. Not surprisingly, some analysts (eg Sorsa et al (2007)) have started to draw parallels with the experience of Latin American and emerging Asian countries, which had also run up large bank-intermediated external debt in the 1980s. An important difference is that, unlike that of Latin America in the 1980s and emerging Asia in the 1990s, the external borrowing of CEE countries is taking place against the background of a process of rapid economic and financial integration with the European Union, which acts as a “convergence club” for this region (see Herrmann and Winkler (2008)). In addition, as discussed in Section 2, banking systems in CEE are for the most part foreign-owned and highly competitive. By contrast, in Latin America and emerging Asia, the expansion of cross-border credit was taking place in an environment of, for the most part, financially repressed banking systems (and, in Latin America, as part of import-substitution development policies).
The split of cross-border claims between bank and non-bank sectors differs across EME regions. In CEE, the BIS reporting banks have roughly equal claims vis-à-vis banks and the non-bank private sector (Table 1). In Latin America, claims against the non-bank sector are somewhat higher (60% vs 40%), while in emerging Asia 75% of cross-border claims are held against banks. In all three regions, cross-border claims vis-à-vis banks increased over the past three years, in CEE by a cumulative of 7.5% of GDP (Graph 9, left-hand panel). The increase in cross-border claims vis-à-vis the non-bank private sector was not as pronounced (Graph 9, right-hand panel).
Graph 9
Cross-border claims of BIS reporting banks vis-à-vis emerging markets
Changes in amounts outstanding at end-period, as a percentage of GDP
Vis-à-vis banks
-0.7
-0.2
0.0
-0.8
0.1
1.7
0.0
-0.5-0.9
-0.5-0.2
1.5
0.7
1.4
0.7
1.2
2.9
3.4
-2.0
-1.0
0.0
1.0
2.0
3.0
4.0
2002 2003 2004 2005 2006 2007
AsiaLatin AmericaCEE
Vis-à-vis non-the bank private sector
-0.4-0.2
0.2 0.10.3
1.01.2
-0.8
-1.6 -1.6
0.50.1
0.4 0.4 0.3
1.2
3.0
1.5
-2.0
-1.0
0.0
1.0
2.0
3.0
4.0
2002 2003 2004 2005 2006 2007
Source: BIS, Locational Banking Statistics; IMF, World Economic Outlook.
Cross-border loans play an important role in total bank credit in emerging market countries. In 2007, cross-border loans accounted for 15% of total bank credit (ie, domestic and external bank loans) in emerging Asia, 22% in Latin America and as much as 37% in CEE (Graph 10). In Latin America, the importance of cross-border loans has decreased significantly since 2002, while in emerging Asia and CEE it has been relatively stable.

BIS Papers No 44 21
Graph 10
Cross-border and domestic bank credit in emerging market economies As a percentage of total bank credit
13 1532 22
39 37
87 8568
7861 63
0
25
50
75
100
2002 2007 2002 2007 2002 2007
Asia Latin America CEE
Cross-border loans Domestic bank credit
Sources: IMF; national data; BIS locational banking statistics.
Foreign assets of emerging market economies Faced with macroeconomic pressures resulting from very large net capital inflows, many emerging market countries have started “recycling” the inflows more actively in recent years by acquiring foreign assets. The gross foreign assets of the EMEs considered in this paper were estimated at about $5.8 trillion at the end of 2006, equivalent to about 54% of their combined GDP (Table 2). They have increased by $4 trillion (11% of combined GDP) since 2001, with Asian economies accounting for two thirds of the increase. Gross foreign assets of EMEs were almost equally split between official foreign exchange reserves (47%) and private sector assets (53%) in 2006.
Gross foreign assets increased at a measured pace over the past five years, while gross foreign liabilities declined significantly between 2001 and 2004, and subsequently levelled off (Graph 11, left-hand panel). This resulted in net foreign liabilities of 12% of GDP in 2006, compared with 27% in 2001.
On a regional level, emerging Asia became a net holder of foreign assets (to the tune of 7% of regional GDP in 2006, compared with –19% in 2001), and Latin America significantly reduced its net foreign liabilities (to 29% of regional GDP in 2006), while CEE increased its net foreign liabilities to almost 50% of GDP (Table 2).
Excluding official foreign reserve assets (for which no breakdown by type of asset is available), the bulk of foreign assets of EMEs were other investment assets (ie, investments in foreign banks and the non-bank private sector) and outward FDI (Graph 11, right-hand panel). As suggested by the data in Graph 8 (right-hand panel), the former comprise for the most part currency and deposits held in banks abroad and trade credit extended to non-residents.

22 BIS Papers No 44
Table 2
Foreign assets of emerging market economies1
USD billions Per cent of GDP
2001 2004 2006 2001 2004 2006 Emerging market countries2
Gross foreign assets 1,828 3,768 5,794 43 49 54 Official FX reserves 605 1,737 2,689 14 23 25 Private sector assets 1,221 2,024 3,095 29 26 29
Direct investment abroad 294 541 898 7 7 8 Portfolio investment abroad 152 383 755 4 5 7
Debt securities 75 241 479 2 3 5 Equity securities 77 142 276 2 2 3
Other investments abroad 775 1,100 1,442 18 14 14 Banks3 186 219 315 4 3 3 Other sectors3, 4 278 346 438 7 4 4
Net foreign assets (net IIP) –1,126 –1,136 –1,232 –27 –15 –12 Asia5
Gross foreign assets 784 2,201 3,370 56 56 64 Official FX reserves 324 1,224 1,839 23 31 35 Private sector assets 460 975 1,528 33 25 29
Direct investment abroad 115 226 327 8 6 6 Portfolio investment abroad 72 229 487 5 6 9
Debt securities 39 169 359 3 4 7 Equity securities 33 60 128 2 2 2
Other investments abroad 273 520 714 19 13 14 Banks3 74 76 98 6 4 4 Other sectors3, 4 20 28 35 2 2 2
Net foreign assets (net IIP) –274 66 353 –19 2 7 Latin America6
Gross foreign assets 512 657 925 29 35 34 Official FX reserves 144 204 284 8 11 11 Private sector assets 368 452 640 21 24 24
Direct investment abroad 106 141 220 6 8 8 Portfolio investment abroad 39 64 117 2 3 4
Debt securities 26 32 61 1 2 2 Equity securities 13 32 57 1 2 2
Other investments abroad 222 247 302 13 13 11 Banks 34 22 30 2 1 1 Other sectors4 177 210 253 10 11 9
Net foreign assets (net IIP) –660 –686 –786 –37 –37 –29 Central and eastern Europe7
Gross foreign assets 220 389 611 36 36 43 Official FX reserves 93 170 237 15 16 17 Private sector assets 126 215 368 20 20 26
Direct investment abroad 11 28 90 2 3 6 Portfolio investment abroad 10 35 68 2 3 5
Debt securities 8 28 43 1 3 3 Equity securities 2 7 25 0 1 2
Other investments abroad 105 152 210 17 14 15 Banks 56 80 105 9 7 7 Other sectors4 32 58 92 5 5 6
Net foreign assets (net IIP) –212 –469 –694 –34 –44 –49
1 Based on international investment position data. 2 Sum of the regions below, plus Russia and South Africa (IIP data for Saudi Arabia are not available). 3 Excluding China, Malaysia and Singapore, for which no breakdown of other investment assets is available (only the totals). 4 Comprises non-financial corporations (private and public), insurance companies, pension funds, other non-depository financial intermediaries and households. 5 India, Indonesia, Korea, Malaysia, Singapore, Thailand and, from 2004, China. 6 Argentina, Brazil, Chile, Colombia, Mexico, Peru and Venezuela. 7 Bulgaria, Croatia, Czech Republic, Estonia, Hungary, Latvia, Lithuania, Poland, Romania, Slovenia and Turkey.
Source: IMF, International Financial Statistics.

BIS Papers No 44 23
Graph 11
Net international investment position of EMEs Including off icial foreign exchange reserves
As a percentage of GDP
43 49 54
-27 -15 -12
-70-64 -66
-120
-100
-80
-60
-40
-20
0
20
40
60
80
2001 2004 2006Gross assets Net IIP Gross liabilities
Composition of foreign assets of EMEs Other than off icial foreign exchange reserves
In billions of US dollars
294541
898241
479142
276
775
1,100
1,442
7577
0
500
1,000
1,500
2,000
2,500
3,000
3,500
2001 2004 2006
Outward FDI of EMEs Foreign debt securitiesForeign equities Other investments abroad
Source: IMF, International Financial Statistics.
The share of FDI in gross foreign assets of the private sector increased to 29% in 2006 (from 24% in 2001), that of portfolio assets doubled to 24%, and the share of other investment outflows decreased to 47% (from 63%). The composition of the foreign asset portfolio seems to be most balanced in Asia (Graph 12). In Latin America and CEE, it is skewed towards outward FDI investments in foreign banks.
Graph 12
Composition of foreign assets by EME regions As a percentage of private sector foreign assets, 2006
21 23
8
31
15
34
10 9
31
16
24
127
38
19
0
10
20
30
40
FDI
Deb
t
Equ
ity
Ban
ks
Oth
erse
ctor
s
FDI
Deb
t
Equ
ity
Ban
ks
Oth
erse
ctor
s
FDI
Deb
t
Equ
ity
Ban
ks
Oth
erse
ctor
s
Asia Latin America CEE
Source: IMF, International Financial Statistics.
Of particular interest for financial stability is the increase in EME private sector holdings of foreign debt securities, which totalled about $400 billion since 2001 (Table 2 and Graph 11, right-hand panel). Private investors from Asia, and China in particular, accounted for the bulk of this increase (almost $140 billion in the case of China). A notable feature of this development is that a large share of these “private” investors are actually state-controlled entities – in China, for instance, such investors include large commercial banks which, while classified as private investors in official statistics, remain majority state-owned.

24 BIS Papers No 44
Another class of notionally “private” investors from emerging market economies who have contributed to capital outflows are sovereign wealth funds (SWFs), which can be defined as all government-owned asset pools except traditional monetary reserves and pension funds (Rozanov (2008)). SWFs can be grouped according to several criteria, including motives for their establishment, sources of funding and uses of their resources (see Mihaljek (2008)). Because relatively little is known about some funds (especially the largest ones), there are no reliable estimates of their size, let alone their growth. Moreover, it is not clear how these funds are classified in official statistics – as official or private investors.
While the combined size of sovereign wealth funds from EMEs can be estimated at around $2.3 trillion in 2007 (Appendix Table A4), how large a part of “reverse” flows from EMEs to advanced economies originate in sovereign wealth funds, and thus the public sector of EMEs, can only be guessed. One well documented figure is that on commitments made by SWFs from China, Singapore and several Middle East countries to recapitalise troubled financial institutions from Europe and the United States in late 2007 and early 2008. That figure – around $80 billion in total – would represent roughly 10% of estimated private sector capital outflows from emerging market countries in 2007. If all assets managed by SWFs from emerging markets were invested abroad, they would account for 40% of foreign assets held by the public and private sectors of EMEs in 2006 (or 74% of foreign assets held by the private sector of EMEs).5
The increase in (notionally) private capital outflows into debt securities has come on top of substantial official capital outflows in the form of increases in foreign exchange reserves. In emerging Asia, official reserves rose by an average of 4–6% of GDP annually in recent years; in Latin America by slightly under 2% of GDP per year; and in CEE by 2–3% of GDP per year (Table 2).
As foreign reserves are also believed to be mainly invested in debt securities, particularly those of advanced economies, the combined private and official outflows into foreign debt securities probably account for three quarters of gross capital outflows from emerging markets. In view of the recent volatile exchange rate movements and in particular the sharp depreciation of the US dollar, the large holdings of foreign debt securities denominated in depreciating currencies expose the emerging market investors – including central banks and SWFs – to considerable valuation losses. While this is an important issue from the financial stability perspective, it will not be pursued further in this paper. The focus of the remaining discussion will be instead on bank-intermediated capital flows.
2. Financial stability challenges of increased capital flows
Following the crises of the 1980s and the 1990s, the literature has devoted considerable attention to the macroeconomic challenges of increased capital flows to emerging market economies. These challenges include, among others, currency appreciation pressures; rapid growth of domestic bank credit; the expansion of domestic demand and the risk of overheating; pressures on consumer prices, wages and asset prices (especially equity and property prices); and, in some cases, widening external current account deficits.
The financial stability consequences of increased capital flows have received less attention so far. This section first looks at some risks related to the growth of cross-border banking
5 Calculated as total SWF assets held by EMEs ($2.3 trillion), divided by gross foreign assets of EMEs
($5.8 trillion for the public and private sectors, or $3.1 trillion for the private sector only). As data on international investment positions are not available for most Middle Eastern countries, these estimates probably exaggerate the share of SWFs in foreign assets of EMEs.

BIS Papers No 44 25
flows in EMEs with large presence of foreign-owned financial institutions. Second, it examines the risks related to increased capital flows intermediated through foreign exchange and money markets of selected EMEs.
Cross-border banking flows in EMEs with a large foreign bank presence The development of financial systems and the growing presence of foreign financial institutions in EMEs have greatly expanded the scope of financial intermediation and lowered the cost of financial services in emerging markets, particularly in Latin America and central and eastern Europe (see Chopra (2007) and Mihaljek (2006)). At the same time, they have altered the nature of risks to financial stability by generally lowering the solvency risk but increasing the credit risk and the potential for capital flow volatility and cross-border contagion.
The main reason foreign ownership has so far tended to reduce the risk of a traditional banking solvency crisis is that foreign owners are generally large, reputable financial institutions from advanced economies. These institutions tend to be relatively well managed and supervised, and usually have a strong regulatory capital base. Concern about reputation risk and relatively centralised management suggest that these institutions are likely to support their emerging market subsidiaries with capital or liquidity injections, should these run the risk of insolvency or become subject to a bank run (IMF (2007c)).
One supporting piece of evidence is the absence of any significant bank failure in CEE following privatisations to foreign strategic partners in the late 1990s and early 2000s. These foreign-owned banks have so far shown resilience in the face of, at times, considerable volatility in local financial markets, and despite numerous “early warnings” from various macroprudential indicators devised for detecting banking system vulnerabilities. Swedish, Austrian and Italian banks with a large presence in the region tend to take a long-term view of the growth opportunities in CEE, and have consistently sought to protect their franchises. They also tend to focus on traditional commercial banking activities – as a result, they have not been affected by the fallout from the latest financial crisis originating in the United States.
While foreign-owned banking systems might be less prone to a traditional solvency crisis, their tendency to underestimate the build-up in credit risk arising from rapid credit growth in emerging market economies might be more pronounced than in predominantly domestically owned banking systems.
One set of factors that explain this tendency includes institutional weaknesses such as inadequate accounting, auditing, financial reporting and disclosure; the lack of an adequate credit bureau or register; and opaque ownership structure of emerging market corporate borrowers. For instance, the poor quality of economic and financial data on borrowers in many EMEs means that the foreign-owned institutions’ risk management and measurement systems, which have been designed for mature financial markets, might not work well in many emerging markets. This makes it difficult for parent institutions to estimate reliably credit risk or risk-adjusted returns in their subsidiaries, and forces them to rely largely on the judgment of local managers. The resulting information asymmetry creates scope for local managers to report estimates of credit risk that are too low, so as to make lower provisions and report higher return on equity (Craig (2006)).6
6 One should also mention that the increased volume of loans can easily overstretch the credit assessment and
monitoring capacity of foreign-owned financial institutions, because experienced bank officers are often in short supply in EMEs, and might be particularly hard to find on the labour market during credit booms.

26 BIS Papers No 44
The lack of adequate credit risk data might lead creditors to rely more heavily on collateral to mitigate risk. However, weaknesses in the legal system can make it difficult to recover collateral. This can result, in turn, in an underestimation of expected loss-given-default.
Another incentive problem specific to foreign-owned institutions that might lead to an underestimation of the build-up in credit risk is the structure of managerial compensation. Top managers of foreign-owned subsidiaries or branches are often expatriate professionals working on fixed-term contracts. During their limited term in a given EME, they have an incentive to boost the volume of lending, which is typically used as a criterion for assessing the size of their bonus payments. Rapid credit growth can conceal deterioration in credit quality because the increase in the share of new loans temporarily depresses reported non-performing loans. And by the time most of these loans mature and some (or sometimes many) turn out to be non-performing, the manager who oversaw the credit expansion in country A might be already busy repeating the task in country B or C.
There are indications that in EMEs with competitive domestically owned banks (such as Brazil), local banks can make better judgments about credit risk and provisioning than foreign-owned banks (Mihaljek (2006)). They may also face fewer asymmetries with respect to incentives for loan growth.
Foreign-owned banks also tend to engage more readily in carry trades in the presence of interest rate differentials and appreciating exchange rates in emerging markets, typically channelling foreign currency loans to consumer and mortgage credit so long as the uncovered interest rate parity holds. This practice is widespread at the moment in central and eastern Europe, and was common in the past in many Asian countries. When borrowers lack a hedge against the foreign exchange risk, either because the market for hedging instruments is not developed or because of a perception that an exchange rate peg will not be allowed to fail, foreign currency lending can result in underpricing of, and/or underprovisioning for, foreign exchange risk. Foreign-owned banks also lend in foreign currency because the parent bank, or its supervisor, wants to limit the size of the exchange rate risk it bears directly. However, this risk is not eliminated by extending foreign currency loans; it is merely transformed into indirect credit risk that will materialise if a country is forced to devalue as a result of domestic macroeconomic or international financial disturbances.
More generally, greater presence of foreign-owned banks increases the scope for regulatory arbitrage between lending via subsidiaries, branches, non-bank financial institutions owned by foreign banks or direct-cross border loans. As regulations tend to lag behind the sophistication of banks (especially foreign-owned ones), it is very difficult for central banks and regulators in EMEs with a large presence of foreign banks to prevent the emergence of a credit boom, or, once the boom is under way, to bring it under control on their own, ie without the help of foreign bank regulators (discussed below).
Foreign-owned banking systems might also be more exposed to the risk of a sharp slowdown or reversal in bank-intermediated capital flows. This risk could be triggered by problems in either the emerging economy host markets or the parent banks’ home market.
Problems in the host market. Once the underestimation of credit risk in an EME home market is recognised, banks have to increase their provisioning. In banking systems dominated by foreign-owned banks, the increase in provisioning – and any resulting decrease in credit growth – might turn out to be more pronounced. One reason is that foreign financial institutions, based on past performance, typically set high targets for return on equity (ROE) in emerging markets, usually about 20–25%, thus offsetting the relatively low ROE usually earned by parent institutions in their home markets (Table 3). This strategy exploits foreign banks’ competitive advantage arising from their strong reputation, technical and operational capabilities and relatively low funding costs. However, the ambitious ROE targets often assume relatively low provisioning rates, which could reflect an underestimation of credit risk or, equivalently, an overestimation of risk-adjusted ROE. When the extent of that

BIS Papers No 44 27
underestimation is recognised and provisioning has to be increased, management could conclude that their ambitious ROE targets cannot be met, and that lending growth in a given market (or group of EMEs) must be sharply curtailed.
Table 3
Return on equity for banks in major host and home countries, 2005
Host countries ROE
(%) Major home countries
ROE (%)
Asia Indonesia 24.0 Canada 25.4 Korea 19.1 Netherlands 16.0 Malaysia 14.1 United Kingdom 17.3 Philippines 6.8 United States 17.7 Singapore 11.0
Latin America Brazil 27.7 Spain 16.0 Chile 17.3 United Kingdom 17.3 Colombia 33.9 United States 17.7 Mexico 24.4
Central Europe Czech Republic 32.1 Austria 14.8 Hungary 27.0 Belgium 19.2 Poland 20.6 France 14.4 Slovakia 13.7 Germany 13.9 Slovenia 17.0 Italy 14.0
Baltic states Estonia 19.4 Denmark 18.9 Latvia 25.1 Sweden 20.7 Lithuania 16.0 Finland 9.4
South-eastern Europe Bulgaria 21.4 Austria 14.8 Croatia 20.2 Greece 15.3 Romania 14.9 Italy 14.0 Turkey 17.8
Other EMEs Israel 19.4 Russia 24.1 South Africa 20.1
For host countries, ROE refers in most cases to domestic consolidation basis; for home countries, to cross-border and cross-sector consolidation basis for domestically incorporated banks. For details, see www.imf.org/external/np/sta/fsi.
Source: IMF, Financial Soundness Indicators database.
This happens frequently when an asset price boom comes to an end. For instance, banks operating in EMEs often face risks from large exposures to the property market. If the quality of mortgage loans deteriorates because house prices begin to decline, internal risk controls at banks could force a sharp reduction in new loans to protect bank capital.
The impact on capital inflows in such an event would depend on the extent to which credit is funded from abroad and the cost of home relative to host market funding. While the extent of

28 BIS Papers No 44
foreign funding of domestic credit is fairly large in many emerging markets, particularly in CEE (Graph 10), it is considerably lower today in the presence of foreign-owned bank subsidiaries than in the past, when reliance on “pure” cross-border credit was much higher, particularly in Latin America.
The cost of medium- and long-term host market funding varies considerably across countries, but is often higher than the cost of funding of subsidiaries from their parents, or the cost of funding in international wholesale markets. For instance, in CEE the cost of funding from parent banks is around Euribor plus 150–200 basis points. Even when interest rates on demand and time deposits in host countries are low, their maturity may be too short to allow the subsidiaries to satisfy the maturity matching requirements of supervisors, or the requirements of their parent banks’ risk management systems. In contrast, parent bank treasuries can more easily tailor the maturity of the funding to their subsidiaries’ needs. Parent banks may also prefer to fund their subsidiaries because lending margins in host country markets tend to be wider than those in home markets.
Problems in the home market. In view of the turmoil engulfing banks in advanced economies since the summer of 2007, the sustainability of bank-intermediated capital inflows would seem to be a particularly pronounced vulnerability at the current juncture. A classic example is the large-scale withdrawal of Japanese banks from emerging Asia during the 1997–98 crisis. When Japanese banks experienced problems in their home market as a result of declines in equity and real estate prices, they had to shrink their balance sheets to maintain their capital adequacy requirements. The resulting pull-back provided a major impetus to the crisis that was unfolding in emerging Asia at the time.
Although the main parent banks in CEE have so far not experienced major losses on US subprime mortgages or structured products, they obtain a substantial part of their funding in foreign currencies in international wholesale markets. Thus, Swedish banks borrow euros and onlend these funds to their subsidiaries in the Baltic states, while Austrian and Italian banks borrow in Swiss francs and onlend these funds to their subsidiaries in central and southeastern Europe. If these wholesale markets dried up, the main suppliers of external financing to emerging Europe would come under funding pressure.7
Finally, banking flows to EMEs could diminish because parent banks face liquidity problems at home and, in a reversal of the normal pattern of flows, turn to their emerging market subsidiaries for funding. There is some anecdotal evidence that parent banks from advanced economies used funding from their subsidiaries in emerging markets such as the Czech Republic, Mexico and Russia to obtain liquidity in August and September 2007.
A third set of financial stability risks associated with the large presence of foreign banks is the risk of financial contagion. Once the recognition or materialisation of credit risk in one country triggers a broader reassessment of risk in the whole region, close financial linkages between home and host country institutions can serve as channels for contagion. The potential for contagion is greater if financial institutions pursue common strategies across the region, as this tends to result in similar types of exposure across countries (see Geršl (2007)).
The potential for contagion partly reflects the centralisation of risk and treasury operations in foreign-owned financial groups. Most large international banks operating in emerging markets typically monitor risk on a group-wide basis and take strategic decisions in the head office. They delegate day-to-day operational decisions to local management in their
7 Alternative sources of bank funding in CEE are currently scarce: domestically owned banks have limited
capacity to raise funds externally, and even those that do (eg Russian banks) have seen their funding reduced since August 2007. Locally, the growth of the deposit base has lagged behind credit growth in most CEE countries for several years now, which was why CEE banks started to seek external funding in the first place.

BIS Papers No 44 29
subsidiaries and branches to varying degrees, depending on the bank and country. While this centralisation helps ensure efficient allocation of capital and may improve the quality of risk management, it also increases the likelihood that the parent company might reduce exposures in one country in response to losses at home or elsewhere in the region. This effect would be mitigated to the extent that banks have well diversified sources of funding.
Another factor increasing the probability of contagion risk is the large asymmetry in the importance of bilateral credit exposures to host countries and to parent institutions. Compared to the host country’s exposure to a particular parent bank, the parent institution’s exposure to a host country is typically a much smaller fraction of its regional – not to mention worldwide – loan portfolio. Changes in lending policies that are modest from the perspective of the parent institution can thus have a major macroeconomic and financial stability impact on the host country.
For instance, Austrian banks’ exposure to individual CEE countries never exceeds 13% of their total regional exposure in the aggregate, but for individual countries it can represent well over half of total domestic borrowing (Graph 13). This asymmetry exposes small host countries to a potentially large decrease in credit supply, even in the case of a relatively moderate slowdown of credit growth by parent institutions.
Graph 13
0
10
20
30
40
0
10
20
30
40
0 10 20 30 40 50 60 70 80 90
●
●
●
●●
●
●●
●
●●
●●
●
● ●
●●
●
●
●
●
●●
●
●
●
●●
●
●
●
●
●
●●
●●
●
●
●
●●
●
●
●
●
●
●
●
●
●●●
●
FI-LV
FI-EE
DK-EE
NL-PL
DE-BG
AT-CZ AT-SK
AT-HR
DE-HU
SE-LV SE-EE
Exp
osur
e of
ban
ks in
hom
e co
untr
ies
to a
ll se
ctor
s
in C
EE
hos
t cou
ntrie
s2
Exposure of all sectors in CEE countries to banks from key home countries1
Each point describes the bilateral exposure of all banks from a home country to all sectors in a CEE host country. For instance, the point AT-CZ indicates that the exposure of all sectors in the Czech Republic to Austrian banks represents 27% of total borrowing from foreign banks by all sectors in the Czech Republic (horizontal axis), while the Austrian banks’ exposure to all sectors in the Czech Republic represents 10% of Austrian banks’ total exposure to CEE (vertical axis). The line represents estimated regression with an intercept of 7.5, coefficient of 0.33 and R2 of 0.28. 1 As a percentage of CEE countries’ total borrowing from foreign banks. 2 As a percentage of home country’s total lending to the CEE region.
Source: BIS consolidated banking statistics.
Relative sizes of selected home and host country exposures, June 2007
Relative sizes of selected home and host country exposures, June 2007
Each point describes the bilateral exposure of all banks from a home country to all sectors in a CEE host country. For instance, the point AT-CZ indicates that the exposure of all sectors in the Czech Republic to Austrian banks represents 27% of total borrowing from foreign banks by all sectors in the Czech Republic (horizontal axis), while the Austrian banks’ exposure to all sectors in the Czech Republic represents 10% of Austrian banks’ total exposure to CEE (vertical axis). The line represents estimated regression with an intercept of 7.5, coefficient of 0.33 and R2 of 0.28. 1 As a percentage of CEE countries’ total borrowing from foreign banks. 2 As a percentage of home country’s total lending to the CEE region.
Source: BIS consolidated banking statistics.

30 BIS Papers No 44
At the same time, Graph 13 shows that banks from Nordic countries in particular have fairly concentrated exposures in the Baltic region. Disturbances in any single host country could therefore affect both the home country banks and, through possible contagion, other neighbouring host countries.8
Cross-border flows to EME foreign exchange and money markets Transactions with non-residents in foreign exchange and money markets are difficult to track at aggregate EME or regional levels, so this section illustrates the risks that could arise from such flows in a few selected country examples.
Korean banks, in particular the foreign-owned ones, have been actively engaged in covered interest parity arbitrage in the past two years.9 Given the apparently persistent deviation in covered interest parity, local branches of foreign banks in Korea have borrowed dollars short-term, sold these dollars for won to domestic banks on the swap market, and then bought domestic bonds, thus generating profits without incurring significant risk. This contributed to the rapid increase in short-term external debt and to the fivefold increase, to 16 trillion won (about $17 billion), in net buying of Korean treasury bonds and central bank monetary stabilisation bonds by local branches of foreign banks in 2006 (IMF (2007b)).
The hedging activity by Korean shipbuilders and by asset management companies making overseas portfolio investments with residents’ funds has significantly contributed to the surge in capital inflows. With Korea home to seven of the world’s 10 largest shipbuilding companies, it is benefiting greatly from a surge in global trade, oil prices and energy demand. Korean shipbuilders only began to hedge their foreign exchange exposure in 2004, and have recently increased their hedging ratio to around 60% in anticipation of continued won appreciation. Asset management companies meanwhile increased their hedging ratio to around 80% in 2007.
Typically, exporters and asset management companies sell expected dollar receipts forward, for the most part to domestic banks, but also to foreign bank branches in Korea. Banks raise dollars through buy and sell swap transactions with foreign bank branches or head offices, and then sell these dollars on the local spot market to match their own currency exposure, thereby creating a capital inflow. Such transactions do not have lasting effects on financial stability, however: once exporters have achieved their desired hedging ratios, further hedging activity and associated capital inflows are bound to slow. In the short term, however, they may have adverse effects such as appreciation of the Korean currency and lowering domestic bond yields.
Foreign investors, foreign-owned banks and the domestic corporate sector in Hungary have also generated large capital flows associated with exchange rate arbitrage. Foreign investors are active on both the spot and swap markets; they take forward positions using a combination of these two markets (as liquidity in the swap market is much greater than that in the forward market) and actively use derivative instruments. They are capable of taking on large foreign exchange exposure in a short period of time. For instance, in early 2003 foreign investors bought more than €5 billion worth of forints in two days, speculating that the exchange rate would be officially revalued. In July–August 2007, they sold €5.5 billion worth of Hungarian currency as liquidity evaporated in advanced economies.
8 Recent stress tests of the Austrian banking sector’s resilience to shocks suggest that credit risk is adequately
provided by existing risk provisions in all scenarios examined (Austrian National Bank (2007b)). The stress test for indirect credit risk of foreign currency loans yields a reduction of the consolidated capital ratio by 0.17 percentage points for the Swiss franc and 0.02 percentage points for the Japanese yen loans.
9 According to covered interest parity, the interest rate difference between two countries should equal the difference between the forward and the spot exchange rate between the two currencies.

BIS Papers No 44 31
Hungarian (as well as many other CEE) banks have been actively offering foreign currency loans to households and small and medium-sized enterprises, thus significantly changing the currency denomination of transactions on the foreign exchange market. For instance, structural changes in Hungary’s foreign trade or investment flows cannot explain the increase in Swiss franc-denominated transactions from 2% of total spot market turnover in 2001, to 13% in mid-2007, with a similar change occurring on the swap market.10 In addition, Hungarian exporters have regularly taken on large foreign exchange exposures. Typically, they would open long forint forward positions when the forint weakened, and close those positions when the currency appreciated.
In Thailand, foreign-owned banks have historically accounted for the dominant share of foreign exchange transactions. Though most firms in the real sector carry out their spot and hedging transactions with Thai banks, the size of these transactions is overwhelmed by foreign exchange flows intermediated by foreign-owned banks. These flows include derivative products such as structured notes and non-deliverable interest rate swaps. Given the absence of a foreign exchange futures market, these products allow foreign investors to take positions on the direction of change in Thai interest rates. The growing size of the non-deliverable interest rate swap market has also affected the prices of bonds, which are used to cover investors’ positions. Another concern has been the increase in concentration risk, which could develop into liquidity risk, given that foreign institutions frequently take similar positions to profit from their views on the exchange rate or the interest rate.
In Chile, capital outflows have been to a large extent driven by portfolio diversification on the part of pension funds, which have been allowed to increase gradually their exposure to foreign assets. This has helped develop the market for hedging instruments, as pension funds face separate limits on their exposure to exchange rate risk and foreign market risk, and are required by law to hedge their foreign exchange risk in the local capital market. Pension funds for the most part sell their long forward positions in foreign exchange to the local banking system. As banks aim to keep their foreign exchange exposure close to zero, they sell the pension funds’ long forward positions to Chilean corporations with future foreign exchange commitments. One concern, however, is that hedging instruments are for the most part intermediated by foreign-owned banks. Although they represent less than 4% of the total assets and less than 10% of the total capital of the Chilean banking sector, foreign banks play a large role in the intermediation of capital flows and the provision of hedging instruments (Desormeaux et al (2008)). For instance, the derivative position held by foreign banks represents more than 70% of the system's total (over $5 billion as of mid-2007).
3. Policy responses
Responses to the macroeconomic challenges of capital inflows The emerging market countries have responded to the macroeconomic challenges of the recent wave of capital inflows in a variety of ways, depending on the monetary policy framework and the specific policy objectives of the authorities. Given that most countries maintained some form of exchange rate and/or monetary target, the policy response to the inflows aimed in general at addressing the impossible trinity dilemma. As the countries liberalised the capital account while integrating with global capital markets, attempts to achieve simultaneously (explicit or implicit) inflation and exchange rate targets put a strain on
10 See Király et al (2008). The latest product that has emerged on the retail market is the yen-denominated
mortgage-backed consumption loan. It accounts for around 10% of new loans, and is being promoted mostly by the largest, predominantly domestically owned, commercial bank.

32 BIS Papers No 44
the existing mix of monetary and exchange rate policies. Combined with predictable exchange rates, the high interest rates needed to reduce inflation attracted capital inflows, putting appreciation pressures on the currencies and exchange rate targets. Faced with these trade-offs, the policymakers had to choose between affecting the inflows themselves or coping with their implications. In many cases, a mix of both approaches was followed.
One policy response recently adopted by a number of countries has been to allow greater exchange rate flexibility. Over the past few years, there has been substantial exchange rate appreciation of the currencies in Brazil, Korea, Thailand and much of central Europe. Greater exchange rate flexibility can help resolve the tension between various policy targets by letting the appreciation absorb the impact of the inflows. In some countries (eg Poland, South Africa and Turkey), more flexible rates have also discouraged short-term speculative inflows by making sure that market participants face two-way exchange rate risks. However, in some other countries (including the Czech Republic, Indonesia and Slovakia), currency appreciation seems to have been associated with additional capital inflows, presumably on the expectation that the exchange rate would continue to appreciate.
The adverse implications of exchange rate appreciation for external competitiveness have made many emerging market authorities reluctant to allow a significant strengthening of domestic currency. Some emerging market countries have also maintained fixed or quasi-fixed exchange rate regimes, allowing little short-term movement in the exchange rate. To support these policies, several central banks intervened on a major scale for several years. The consequence has been a substantial increase in foreign exchange reserves in a number of countries over the period from 2000 to 2007 (Table 4).
Table 4
Capital flows and intervention In billions of US dollars
Net capital flows Current account balance Change in reserves
1990–93 1995–96 2000–07 1990–93 1995–96 2000–07 1990–93 1995–96 2000–07
China 35 79 368 20 9 970 4 53 1,374
India 20 16 230 –17 –12 –20 7 0 235
Other Asia1 124 125 –79 –53 –64 510 76 47 441
Brazil 25 62 144 0 –42 –8 23 21 145
Other Latin America2
134
58
64
–85
–26
70
48
28 118
1 Indonesia, Korea, Malaysia, the Philippines, Singapore and Thailand. 2 Argentina, Chile, Colombia, Mexico, Peru and Venezuela.
Sources: IMF; CEIC; national data.
Other things equal, foreign reserve accumulation tends to increase the monetary base and ease monetary conditions. In order to prevent such easing, central banks take steps to limit or “sterilise” the monetary impact of foreign exchange intervention. Many EMEs have done this by issuing debt securities of various maturities (and in some cases, notably in China and India, by raising the reserve requirements on banks). Sterilisation is rarely complete, however, and some easing in money or credit conditions usually still occurs. During early years when they were building reserves, many central banks were deliberately seeking to ease monetary policy, given the environment of low inflation and large excess capacity. Real short-term interest rates fell significantly, particularly in Asia. In effect, such intervention was

BIS Papers No 44 33
then partly unsterilised, in the sense that central banks tolerated the downward pressure on interest rates and monetary expansion.
But the longer inflows continued, and as inflation risks increased, the degree of sterilisation tended to increase. The scale of required domestic liability creation, measured in relation to several aggregate yardsticks of the financial economy, has grown substantially as a result (Graph 14). Intervention on this scale over many years has had a major impact on the balance sheets of central banks and of the banking sectors. The balance sheets of domestic commercial banks in many EMEs have expanded dramatically; the liquidity of bank balance sheets has increased as bank holdings of government paper have risen, and significant financial sector distortions have been created (see Mohanty and Turner (2005)). These developments have contributed to the substantial growth of bank credit to the private sector, which has begun to expand rapidly in some countries (Table 5).
Graph 14
–50
0
50
100
150
200
250
1999 2001 2003 2005 2007–10
0
10
20
30
40
50
1999 2001 2003 2005 2007
China India Other Asia1, 2
Brazil Other Latin America1, 3
–25
0
25
50
75
100
1999 2001 2003 2005 200775
100
125
150
175
200
–30
0
30
60
90
120
1999 2001 2003 2005 2007
Other Asia (lhs)1, 2
M1 M2
Domestic credit to the private sector Public sector debt securities
This updates Graphs 1 and 2 in Mohanty and Turner (2005), which contains further discussion of this calculation. 1 Simple average of the economies listed. 2 Indonesia, Korea, Malaysia, the Philippines, Singapore, and Thailand. 3 Argentina, Chile, Colombia, Mexico, Peru and Venezuela.
Sources: IMF; national data; BIS.
As a percentage of:Foreign reserves minus currency held by the public

34 BIS Papers No 44
Table 5
Domestic bank credit to the private sector In real terms, in per cent per annum
1990–995 2000–04 2005 2006 2007
Emerging Asia1 10.0 11.4 10.1 13.0 12.9 China 13.9 12.5 7.4 11.2 12.0 India 4.5 12.5 20.2 18.5 14.7 Indonesia 1.1 10.0 2.4 6.3 16.7 Korea 11.2 5.6 5.7 13.8 10.7
Latin America1 10.3 –0.5 18.1 26.3 21.0 Argentina 7.7 –15.6 19.7 26.0 27.4 Brazil 14.6 3.8 21.0 26.6 25.0 Mexico 5.6 –0.6 13.7 26.2 13.6
Central and eastern Europe1 2.7 14.4 27.6 25.4 24.4 Central Europe2 6.6 4.0 17.7 18.2 19.7 Baltic states3 10.4 27.6 46.5 39.4 23.4 Southeastern Europe4 –7.8 17.6 25.7 23.8 30.9
Other emerging1 4.3 17.1 26.1 30.2 24.7 Russia 3.7 26.0 21.9 36.1 34.9 Saudi Arabia 7.0 14.3 37.2 6.1 14.0 South Africa 4.2 6.5 15.8 18.8 11.6 Turkey 3.8 5.6 33.7 40.6 17.3
1 Weighted average of the economies shown based on 2000 GDP and PPP exchange rates. For CEE, simple average of countries listed. 2 The Czech Republic, Hungary, Poland, Slovakia and Slovenia. 3 Estonia, Latvia and Lithuania. 4 Bulgaria, Croatia, Serbia and Romania. 5 For CEE, changes from 1994–99 except for Romania and Serbia (1997–99).
Source: IMF, International Financial Statistics.
Countries with more flexible exchange rates, often complemented by inflation targeting regimes, have in some cases reduced interest rates in an effort to discourage capital inflows (see Niedermayer and Barta (2008)). In practice, this policy option has been limited by concerns about undermining the inflation target. Another constraint has been the adverse implication of low interest rates for credit growth – the resulting credit expansion could not only fuel inflation pressures, but also lead to other financial imbalances.
Fiscal tightening has not been actively used in response to capital inflows in countries with more flexible exchange rates: in fact, real government expenditure growth accelerated over the past few years, especially in Latin America and central and eastern Europe (IMF (2007a)). However, in countries operating fixed exchange rate regimes (including currency board arrangements), fiscal tightening has of necessity been the main policy tool to mitigate the macroeconomic consequences of large capital inflows. Several commodity-exporting countries have also relied on fiscal consolidation to curb appreciation pressures and capital inflows. For example, in Chile public spending increases have followed a fiscal rule which targets a structural fiscal surplus and requires that all surplus funds (which can be substantial when copper prices are high) be invested abroad. Similarly, several oil-exporting countries have relied on oil stabilisation funds to cope with rising oil revenues.

BIS Papers No 44 35
Available evidence indicates that public expenditure restraint during periods of strong inflows has contributed to both lower real exchange rate appreciation and higher long-term growth (Ötker-Robe et al (2007)). One should note, however, that tighter fiscal policy may produce two opposing effects on the exchange rate. On the one hand, as aggregate demand slows in response to fiscal consolidation, interest rates could fall, which would discourage capital inflows. On the other hand, in countries where the fundamentals are not particularly strong, fiscal tightening might reduce country risk premia, thus strengthening the currency and attracting further capital inflows.
Finally, most emerging market countries relaxed controls on capital inflows as well as outflows. For example, China, India and Russia further liberalised their rules on residents’ investment in foreign securities in 2006 and 2007. The recent surge in China’s private sector investments in foreign debt securities discussed in Section 1 appears to be partly related to this move. CEE countries have relaxed capital controls the most, with larger Asian emerging economies remaining relatively restrictive, and Latin America maintaining capital controls at more or less unchanged levels since the mid-1990s (IMF (2007a)).
Responses to the financial stability challenges of capital flows After the Asian financial crisis of 1997–98, national authorities and international financial institutions distilled a number of lessons for banks and supervisors in home and host countries (see eg Basel Committee on Banking Supervision (2001)). The resulting improvements in banking supervision and prudential regulation have since helped strengthen the capacity of most emerging market economies to address some key structural weaknesses. These included poor lending standards, inadequate risk management systems, weak capital bases, ineffective bank governance, poor supervisory and reporting frameworks, and ineffective licensing, competition and bankruptcy arrangements. This process of improvement has been gradual in Asia, but rather more rapid in central and eastern Europe as a result of harmonisation with EU legislation during EU accession.
Most countries also took steps to promote the development of their financial markets and increased the range of market-based instruments to deal with the inflows. In addition, many countries used a variety of public debt management measures to cope with the implications of the inflows for the liquidity in the financial system.11
Reflecting these structural reforms, most emerging market banking systems today exhibit fairly robust financial soundness indicators.12 However, responding to the challenges of the recent wave of capital inflows has required new policy approaches, which in some cases have yet to be fully implemented.
The potential for underestimation of a build-up in credit risk has been addressed through policies that strengthen oversight of banks’ management of credit risk. In Asia and central Europe, for instance, a number of specific supervisory and prudential measures have helped improve banks’ capacity to evaluate credit risk.13
11 These measures included shifting from foreign to domestic borrowing sources, buying back outstanding Brady
discount bonds, using the inflows to “over-borrow” and move to medium and long-term domestic borrowing, and using part of the privatisation receipts to repay international financial organisations.
12 Notable exceptions are some large emerging market countries, where inefficient – though not necessarily unsound – state-owned institutions still dominate the commercial banking landscape.
13 Details of these measures can be found in Ötker-Robe et al (2007) and Borio and Shim (2007), as well as in financial stability reports and banking supervision reports of CEE central banks published during 2005–07; see also the financial stability reports of the Austrian National Bank and Sveriges Riksbank.

36 BIS Papers No 44
• Closer monitoring and enforcement of provisioning and loan evaluation needs, aimed at ensuring that banks hold sufficient regulatory capital consistent with the underlying risks (including in CEE indirect credit risk from foreign currency lending to unhedged borrowers). Adequate provisioning for expected losses is also expected to contribute to more accurate (and presumably lower) parent bank ROE projections, discouraging overambitious credit expansion plans.
• Improving the quality of creditor information in response to signs of an unsustainable build-up in credit risk. Specific measures include requiring corporate borrowers to provide accurate financial reports; extending the credit registry to cover households as well as corporations; and tightening various limits on debt-to-income and/or debt service-to-income ratios for households, eg by requiring banks to use household debt and income data that are more reliable (eg based on personal income tax returns). Better data on borrowers’ and guarantors’ debt, debt repayment and income facilitate a more realistic assessment of credit risk, while the improvement in parent bank risk measurement helps reduce the scope for subsidiaries to underprovision in order to report higher ROE.
The potential for volatility in bank-intermediated capital inflows has been addressed in the first place through regulatory measures to diversify funding sources and to foster a shift from foreign (or foreign exchange) financing to local (or domestic currency) financing of credit growth. Such measures have been justified by the failure of foreign bank groups to fully internalise the risks associated with reliance on cross-border funding of foreign currency loans in host countries. As noted above, this failure reflects the fact that foreign banks’ exposure to these countries represents a small share of their overall exposure.
In addition, measures aimed at reducing the segmentation in financial institutions’ balance sheets are being considered in some countries. One proposal is to relax tight limits on maturity and currency mismatches and adopt instead a capital charge for market and other risks that arise from such mismatches. Tight limits on maturity and currency mismatches are sometimes seen as unnecessary because they force banks to be highly liquid by holding substantial excess reserves and deposits abroad, despite their access to liquidity from their parents. This may lead banks to rely on foreign funding of credit, which may unintentionally contribute to external vulnerabilities. Replacing these limits with capital charges provides banks with a buffer against the risks of maturity and currency mismatches, and an incentive to limit them. It also gives foreign banks more flexibility to rely on local funding.
Going in the same direction is a proposal to allow banks to treat a proportion of sight and savings deposits that are statistically very stable as “core deposits”. Through such “mapping” banks obtain an alternative source of funding medium- and long-term loans, which can be cheaper than the cost of foreign funding. The recent failure of the UK bank Northern Rock provides, however, a cautionary lesson on the difficulty of calibrating such regulations.
In addition to these measures, several countries in Latin America and CEE have retained the possibility of imposing new capital controls under their foreign exchange laws, although they have not done so in practice. The countries in general fear that such measures would be considered a significant step back in their economic development and liberalisation process, and would be largely circumvented. The Israeli authorities, for instance, considered Chilean-type capital controls on various occasions, but eventually ruled them out in order to avoid policy reversals that could damage their credibility (Eckstein and Ramot-Nyska (2008)). Similarly, the authorities in Turkey have resisted the use of capital or credit controls given their EU aspirations and the realisation that controls would be easily circumvented in the presence of a significant offshore market for the lira (Yörükoğlu and Çufadar (2008)).These fears have been partly justified by the negative experience of Thailand, which in March 2008 lifted the controls on capital inflows it had introduced in 2006.

BIS Papers No 44 37
Supervisory issues The importance of cross-border banking flows has also required closer cooperation between home and host country supervisors. Supervisory authorities have long been aware of the regulatory challenges associated with banks’ foreign establishments (see Chopra (2007) and Turner (2008)). In 1975, the Basel Committee on Banking Supervision set out for the first time a series of principles and standards to establish effective prudential supervision of cross-border banking activities, which are commonly referred to as the Basel Concordat. These principles were subsequently updated and elaborated on several occasions (see Song (2004)). A key objective of these principles is to ensure that no activity of internationally active banks escapes effective supervision and that coordinated remedial action can be taken when necessary. Nevertheless, on several issues a consensus on the best approach is yet to be achieved, and even where there is consensus implementation can be complex. For example, the Concordat has not sought to establish an international framework for the cross-border coordination of intervention to respond to bank distress.
The fundamental problem is the mismatch between the international scope of banking institutions and the national scope of frameworks for banking supervision and crisis management. A particular dimension of this problem is the conflict between macroeconomic and financial stability concerns in small countries hosting large global banks, and microeconomic concerns for safety and soundness of parent banks in their home countries. For instance, host authorities may be concerned about boom-bust cycles in domestic asset prices, or about more general demand and external balance pressures resulting from rapid credit growth, and may find it difficult to address these concerns with the policy tools available. Host country authorities may also be uncertain how well foreign banks are managing risks in local markets, especially if these markets are very competitive, which is often the case in the initial phase of financial liberalisation. In other words, the authorities that bear most of the financial instability risks may not be the ones in the best position to mitigate them. These problems are complicated by the institutional responsibilities that have evolved in many countries, with the central bank primarily responsible for financial stability and macroeconomic policies, while a financial supervisory authority is concerned with the safety and soundness of financial institutions.
Not surprisingly, progress in resolving these conflicts has been slow. On the EME domestic side, judging by reports of the Financial Stability Assessment Programme of the IMF and the World Bank, much has been done to upgrade the knowledge and skills of the supervisory authorities. This includes their capacity to acquire and analyse information on the use of complex financial products by foreign and domestic banks.
A more difficult challenge has been to develop mechanisms to monitor effectively the operations of large international and regional banks that operate across different jurisdictions. The basis for memoranda of understanding (MoUs) between banking supervisory authorities in different countries was elaborated by the Basel Committee in a 2001 document on Essential elements of a statement of cooperation between banking supervisors, and updated in a 2006 document on Home-host information sharing for effective Basel II implementation. The MoUs have helped establish a large number of bilateral relationships, but are not legally binding. And although they seem to be working well to strengthen cooperation, they have not yet been tested in a distress situation. In particular, Bollard (2004) pointed out that MoUs created too much uncertainty to be useful in a crisis. Moreover, they could in the end prove to be of little practical help because of barriers to the exchange of information that arise due to political, legal or tax-related issues.
Accordingly, some countries – most notably New Zealand – have required systemically important banks to be incorporated in the country. This policy has three main objectives (see Bollard (2004)). First, it provides a higher degree of certainty over the balance sheet of the bank, enabling more efficient resolution in the event of distress or failure. Second, local incorporation enables the imposition of minimum capital requirements and risk limits, and

38 BIS Papers No 44
provides some separation between the subsidiary and parent, thus reducing intragroup contagion risk. Furthermore, it makes it more difficult, legally and practically, for assets to be removed from the local operation to the parent bank (which is not the case for a branch). Third, local incorporation establishes a basis for sound bank governance in the host country, including a board of directors with responsibility to act in the interests of the local bank.
Cooperation between supervisors at the moment seems to go farthest in central and southeastern Europe and the Nordic-Baltic region. As noted above, by lending in foreign currencies, either directly or through their subsidiaries in emerging market countries, foreign banks avoid a direct mismatch on their balance sheets. But such borrowing does create a credit risk when directed to borrowers without foreign currency assets or earnings. Recognising this risk, home country banks from Austria and Nordic countries and their supervisors have started to monitor whether such exposures are being taken into account. One approach has been regular cooperation at the working level, irrespective of MoUs, to foster the exchange of information and analysis between home and host supervisors (see Austrian National Bank (2007a) and Wajid et al (2007)).
In addition, joint inspections of host country banks are reportedly being increasingly organised. Separately, home country supervisors have developed special tools for analysing the exposures of their banking groups (Würz (2006)). Another approach, still under consideration, would be the calibration of prudential tools at the disposal of the home supervisors. This approach would entail, inter alia, the incorporation of macroeconomic risks in the assessment of the appropriateness of regulatory cushions corresponding to exposures in host country credit markets.
The most difficult issue relates to resolution and associated questions, such as: What would happen if a foreign-owned subsidiary or branch that was systemically important locally ran into problems? Is there adequate clarity on key issues and responsibilities to ensure that the central bank and supervisory authorities in the host country deal transparently with the evaporation of liquidity and disruptions to the payment system in such a case? Work on these issues has only just begun (see Goodhart and Schoenmaker (2006), Ingves (2006), Srejber (2006)), and it will be important to involve in it all major stakeholders from both home and host countries.
In this context, the incentive effects flowing from crisis resolution arrangements play a key role. As pointed out by Rosengren (2006), during times of acute problems, politicians often seek to use financial institutions to mitigate the impact of the crisis on depositors, borrowers or investors. This results in the host supervisor having different incentives from the parent, and often from the home supervisor. The primary concern of the home supervisor is to prevent a situation where problems from the subsidiary bring into question the solvency of the entire firm. In the host country, the concern is not only to find ways to mitigate immediate liquidity and solvency problems at the troubled subsidiary, but also to maintain overall lending and capital inflows to the country. From the perspective of financial integration, it is interesting to note that these incentive problems seem to be recognised most clearly in countries which are at the same time important home and host to financial institutions, as is currently the case in Austria, Benelux, Hong Kong SAR, Scandinavia, Singapore and, more recently, Italy.

BIS Papers No 44 39
Appendix
Table A1 Gross private capital inflows to emerging market economies
In billions of US dollars
Annual averages
1990–97 2002–06 2005 2006 2007
Emerging market economies1 Total inflows 210 456 599 824 1,347
Direct investment 81 220 270 332 400 Portfolio investment 70 94 127 164 432
Equity 24 54 71 95 193 Debt 47 40 57 69 239
Other investment 60 142 202 328 515 Banks 27 67 77 176 231 Other sectors 33 75 124 152 284
Memo: Current account balance –58 252 349 453 507 Change in reserves 2 –54 –382 –470 –603 –1,040 Official inflows –20 –24 –28 –45 …
Asia3 Total inflows 102 221 270 375 681
Direct investment 46 106 130 145 154 Portfolio investment 20 55 66 90 350
Equity 10 38 46 60 … Debt 11 17 20 30 …
Other investment 36 61 74 140 177 Banks 16 30 21 88 … Other sectors 20 31 53 51 …
Memo: Current account balance –13 170 202 319 445 Change in reserves 2 –34 –247 –264 –353 –641 Official inflows 4 –5 –5 –2 …
Latin America4 Total inflows 77 54 82 102 194
Direct investment 25 53 63 60 86 Portfolio investment 40 5 20 16 50
Equity 12 6 12 11 … Debt 28 –1 8 5 …
Other investment 12 –4 –1 26 58 Banks 6 –4 –4 –5 … Other sectors 7 0 3 31 …
Memo: Current account balance –32 23 39 49 24 Change in reserves2 –13 –24 –27 –44 –126 Official inflows –16 –4 –6 –5 …
Central and eastern Europe5 Total inflows 19 116 153 211 214
Direct investment 7 46 57 94 85 Portfolio investment 4 24 36 27 0
Equity 1 3 5 3 … Debt 3 22 31 24 …
Other investment 8 46 60 91 130 Banks 3 23 34 43 … Other sectors 5 22 27 48 …
Memo: Current account balance –6 –51 –57 –88 –119 Change in reserves2 –7 –21 –45 –23 –37 Official inflows –4 –2 –5 –3 …
“Other sectors” is comprised of non-financial corporations (private, public and quasi-corporations), insurance companies, pension funds, other non-depository financial intermediaries, private non-profit institutions and households. 1 Comprises the regions below plus Russia, Saudi Arabia and South Africa. 2 A minus sign indicates an increase. 3 China, India, Indonesia, Korea, Malaysia, the Philippines, Singapore and Thailand. 4 Argentina, Brazil, Chile, Colombia, Mexico, Peru and Venezuela. 5 Bulgaria, Croatia, the Czech Republic, Estonia, Hungary, Latvia, Lithuania, Poland, Romania, Slovenia and Turkey. Source: IMF, International Financial Statistics.

40 BIS Papers No 44
Table A2
Gross private capital outflows from emerging market economies In billions of US dollars
Annual averages
1990–97 2002–06 2005 2006 2007
Emerging market economies1
Total outflows 76 327 435 681 830 Direct investment 16 68 71 157 182 Portfolio investment 17 118 159 283 400
Equity 8 25 28 48 69 Debt 9 93 131 235 331
Other investment 40 143 212 251 248 Banks 20 44 73 116 124 Other sectors 17 99 140 135 124
Memo: Official outflows 0 –3 –6 2 … Asia Total outflows 51 139 177 316 502
Direct investment 10 26 30 54 77 Portfolio investment 9 57 58 166 335
Equity 6 15 17 31 … Debt 3 42 42 135 …
Other investment 29 58 97 105 90 Banks 13 21 44 47 … Other sectors 13 38 53 59 …
Memo: Official outflows 1 1 0 2 … Latin America Total outflows 17 46 53 102 105
Direct investment 3 18 18 42 20 Portfolio investment 5 9 9 21 16
Equity 1 5 6 6 … Debt 4 4 4 15 …
Other investment 8 19 25 39 68 Banks 4 2 9 11 … Other sectors 4 17 16 28 …
Memo: Official outflows 0 3 6 0 … Central and eastern Europe Total outflows 5 37 36 86 54
Direct investment 0 10 9 31 15 Portfolio investment 1 11 13 21 12
Equity 0 4 5 9 … Debt 1 8 9 12 …
Other investment 4 16 14 34 28 Banks 3 8 7 19 … Other sectors 1 8 7 15 …
Memo: Official outflows –1 –1 –1 –1 …
“Other sectors” is comprised of non-financial corporations (private, public and quasi-corporations), insurance companies, pension funds, other non-depository financial intermediaries, private non-profit institutions and households. 1 Comprises the regions below plus Russia, Saudi Arabia and South Africa. 2 A minus sign indicates an increase. 3 China, India, Indonesia, Korea, Malaysia, the Philippines, Singapore and Thailand. 4 Argentina, Brazil, Chile, Colombia, Mexico, Peru and Venezuela. 5 Bulgaria, Croatia, the Czech Republic, Estonia, Hungary, Latvia, Lithuania, Poland, Romania, Slovenia and Turkey.
Source: IMF, International Financial Statistics.

BIS Papers No 44 41
Table A3
Net inflows of private capital to emerging market economies1
In billions of US dollars
Annual averages
1990–97 2002–06 2005 2006 2007
Emerging market economies1
Total flows 146 198 252 232 605 Direct investment 74 206 260 250 310 Portfolio investment 42 –48 –19 –104 49 Other investment 31 25 13 86 249
Memo: Current account balance –75 375 517 698 738
Change in reserves2 –64 –483 –595 –753 –1,236 Official flows 12 –86 –110 –160 –149
Asia Total flows 58 72 91 48 194
Direct investment 36 80 104 97 91 Portfolio investment 14 –39 –9 –111 18 Other investment 10 33 –4 61 85
Memo: Current account balance –10 213 235 360 486
Change in reserves2 –36 –279 –288 –372 –669 Official flows 3 –14 –21 –23 –38
Latin America Total flows 50 19 37 10 100
Direct investment 23 42 51 28 77 Portfolio investment 31 –5 5 –14 32 Other investment –4 –18 –20 –4 –9
Memo: Current account balance –37 18 35 45 16
Change in reserves2 –14 –27 –33 –50 –133 Official flows 3 –7 –31 –19 1
Central and eastern Europe Total flows 12 84 118 120 171
Direct investment 7 39 52 65 73 Portfolio investment 4 12 22 10 –7 Other investment 1 31 45 46 104
Memo: Current account balance –7 –54 –61 –91 –122
Change in reserves2 –6 –23 –46 –23 –43 Official flows 1 –7 –8 –5 –3
1 This table has broader country coverage than Appendix Tables A1 and A2. In particular, it also includes Africa, the Commonwealth of Independent States and the Middle East. 2 A minus sign indicates an increase.
Source: IMF, World Economic Outlook.

42 BIS Papers No 44
Table A4
Sovereign wealth funds of emerging market economies
Country Fund name Assets
managed1 USD billions
Inception year
Source of funds
United Arab Emirates Abu Dhabi Investment Council 650 1976 Oil
Singapore Government Investment Corporation 350 1981 Other
China China Investment Corporation 200 2003 Other
Kuwait Future Generation Fund 174 1976 Oil
Singapore Temasek Holdings2 168 1974 Other
Hong Kong SAR Investment Portfolio (HKMA) 140 1998 Other
Russia Reserve Fund 130 2008/2004 Oil
Qatar Qatar Investment Authority 60 2005 Oil
Libya Libyan Arab Foreign Investment Co 50 1981 Oil
Algeria Fonds de Régulation des Recettes 43 2000 Oil, gas
Kuwait General Reserve Fund 39 1960 Oil
Russia National Wealth Fund 33 2008/2004 Oil
Brunei Brunei Investment Authority 30 1983 Oil
Kazakhstan National Oil Fund2 25 2000 Oil, gas
Korea Korea Investment Corporation 20 2005 Other
Dubai Investment Corporation of Dubai 19 2006 Other
Venezuela National Development Fund/FIEM 18 2006/1998 Oil
Malaysia Khazanah Nasional BHD 18 1993 Other
Chile Economic and Social Stabilisation Fund/Pension Reserve Fund
17
2006/1985
Copper
Iran Oil Stabilisation Fund 13 1999 Oil
Nigeria Excess Crude Account 11 2004 Oil
Botswana Pula Fund 7 1966 Diamonds
Oman State General Reserve Fund 6 1980 Oil
Saudi Arabia Public Investment Fund 5 2008 Oil
Mexico Oil Income Stabilisation Fund 3 2000 Oil
Bahrain Mumtalakat Holding Company 3 2006 Oil
Azerbaijan State Oil Fund 2 1999 Oil
Timor Leste Petroleum Fund 2 2005 Oil
Total3, 4 ≈2,250 1 Estimates based on official sources and references cited in Mihaljek (2008); end-2007 or the most recent date available (up to May 2008). 2 A portion of holdings is in domestic assets or is intended for domestic investment. 3 The total uses the midpoint of the range of estimates for the United Arab Emirates.
Sources: IMF; Deutsche Bank; Morgan Stanley; Standard Chartered; SWF Institute; national data; author’s estimates.

BIS Papers No 44 43
References
Ahn, B C (2008): “Capital flows and effects on financial markets in Korea: developments and policy responses”, this volume.
Austrian National Bank (2007a): Financial stability report 13, June, www.oenb.at.
——— (2007b): Financial stability report 14, December, www.oenb.at.
Basel Committee on Banking Supervision (1975): Report on the supervision of banks' foreign establishments – Concordat, September, www.bis.org.
——— (2001): “Essential elements of a statement of cooperation between banking supervisors”, May, www.bis.org.
——— (2006): Home-host information sharing for effective Basel II implementation, June, www.bis.org.
Bollard, A (2004): “Being a responsible host: supervising foreign-owned banks”, address to the Federal Reserve Bank of Chicago Conference on systemic financial crises – resolving large bank insolvencies, www.rbnz.govt.nz.
Borio, C and I Shim (2007): “What can (macro-)prudential policy do to support monetary policy?”, BIS Working Papers, no 242, December, www.bis.org.
Chopra, A (2007): Opening up to foreign banks: harnessing the benefits and avoiding the pitfalls, International Monetary Fund, December.
Craig, S (2006): “The expansion of foreign-owned banks in emerging Europe: implications for surveillance”, in Regional financial market and financial stability, proceedings of the sixth annual conference of the Bank of Albania.
Desormeaux, J, K Fernández and P García (2008): “Financial implications of capital outflows in Chile: 1998–2008”, this volume.
Eckstein, Z and T Ramot-Nyska (2008): “Twenty years of financial liberalisation in Israel: 1987–2007”, this volume.
Enoch, C and I Ötker-Robe, eds (2007): Rapid credit growth in central and eastern Europe: endless boom or early warning? London: Palgrave Macmillan.
Geršl, A (2007): “Foreign banks, foreign lending and cross-border contagion: evidence from the BIS data”, Czech journal of economics and finance, Vol 57, No 1–2, pp 27–40.
Goodhart, C and D Schoenmaker (2006): Burden sharing in a banking crisis in Europe, London School of Economics, March, http://ssrn.com.
Herrmann, S, and A Winkler (2008): “Financial markets and the current account – emerging Europe versus emerging Asia”, Deutsche Bundesbank Economic Studies Discussion Paper No 05/2008, www.bundesbank.de.
IMF (2007a): “Managing large capital inflows”, Chapter 3 in World economic outlook, October, www.imf.org.
——— (2007b): Republic of Korea: 2007 Article IV Consultation – Staff Report, October, www.imf.org.
——— (2007c): “The globalisation of financial institutions and its implication for financial stability”, Chapter III in Global financial stability report, April, www.imf.org.
Ingves, S (2006): “Cross-border banking regulation – a way forward: the European case”, speech at a conference in Chicago, 16 October, www.riksbank.se.
Király, J, J Antal, M Nagy and V Szabó (2008): “Retail credit expansion and external finance in Hungary: lessons from the recent past (1998–2007)”, this volume.

44 BIS Papers No 44
Mihaljek, D (2006): “Privatisation, consolidation and the increased role of foreign banks”, in The banking system in emerging economies: how much progress has been made?, BIS Papers, no 28, August. www.bis.org.
——— (2008): “Sovereign wealth funds: implications for monetary policy and capital flows”, paper prepared for the 27th SUERF Colloquium New trends in asset management: exploring the implications, Munich, 12 June.
Mohanty, M S and P Turner (2005): “Intervention: what are the domestic consequences?”, in Foreign exchange market intervention in emerging markets: motives, techniques and implications, BIS Papers, no 24, May, www.bis.org.
Niedermayer, L and V Bárta (2008): “The Czech experience with capital flows: challenges for monetary policy”, this volume.
Ötker-Robe, I, Z Polanski, B Topf and D Vavra (2007): “Coping with capital inflows: experiences of selected European countries”, IMF Working Paper No 07/190, July, www.imf.org.
Rozanov, A (2008): “A liability-based approach to sovereign wealth”, Central banking, vol 18, no 3, February.
Rosengren, E (2006): “An overview of cross-border bank policy issues”, in G Caprio, D Evanoff and G Kaufman, eds, Cross-border banking: regulatory challenges. Singapore: World Scientific Studies in International Economics.
Song, I (2004): “Foreign bank supervision and challenges for emerging market supervisors”, IMF Working Paper No 04/82, www.imf.org.
Sorsa, P, B Bakker, C Duenwald, A Maechler and A Tiffin (2007): “Vulnerabilities in emerging southeastern Europe: how much cause for concern?”, IMF Working Paper No 07/236, October, www.imf.org.
Srejber, E (2006): “Are we ready to deal with a cross-border banking crisis in Europe?”, speech at a seminar in Gdansk, 12 May, www.riksbank.se.
Turner, P (2008): “Banking consolidation in the emerging market economies: foreign and domestic” paper presented at the G20 workshop on Competition in the financial sector, Bali, 15–17 February 2008.
Wajid, K, A Tieman, M Khamis, F Haas, D Schoenmaker, P Iossifov and K Tintchev (2007): Financial integration in the Nordic-Baltic region: challenges for financial policies, Washington: IMF.
Wooldridge, P (2002): “Uses of the BIS statistics: an introduction”, BIS Quarterly Review, March, www.bis.org.
Würz, M (2006): “Austria’s perspective as a home and host country”, in Regional financial market and financial stability, proceedings of the sixth annual conference of the Bank of Albania.
Yörükoğlu, M and A Çufadar (2008): “Capital flows to Turkey: financial implications and policy responses”, this volume.

BIS Papers No 44 45
Pension systems in EMEs: implications for capital flows and financial markets
Ramon Moreno and Marjorie Santos1
Introduction and summary
Pension systems can influence capital flows by affecting saving and investment. At the same time, the growth of pension fund assets has implications for the depth of financial markets. This paper seeks to shed light on these effects, by highlighting three relevant aspects.
First, the stage in the demographic transition. Since around the mid-1960s, lower EME fertility rates have meant lower dependency ratios, which has tended to boost saving, and also a rise in the working-age population, which has tended to boost investment. The transition has worked out as predicted in some countries but not in others. In particular, in the aftermath of crises (eg Asia in the late 1990s), saving and investment have tended to fall, and current account balances to rise. Nevertheless, current account surpluses are expected to fall or turn to deficits as populations age in coming decades. In some countries, this process has already begun.
Second, pension system design. National saving could be affected by how pension benefits are financed. Recent reforms have favoured plans based on defined contribution and prefunding, moving away from defined benefit and pay-as-you-go plans. However, with a few exceptions, it is not clear that such pension system reforms have helped increase saving. This could be due to lower precautionary saving, transitional fiscal costs associated with pension reforms, problems with low or declining pension fund coverage, and high costs.
Third, pension fund asset accumulation and financial deepening. Rapid growth in pension fund assets appears to be associated with deeper financial markets in a number of EMEs. This could also influence capital flows by affecting saving and current account balances, as well as the pattern of gross capital flows.
Stages in the demographic transition
The demographic transition in EMEs over the past 40 years may be described as follows. In a first stage, which began around the mid-1960s, declining fertility rates2 resulted in an increase in the working-age population and a decline in the share of the dependent young,
1 Bank for International Settlements (BIS). The views expressed in this paper are those of the authors and do
not necessarily reflect those of the BIS. The authors thank, without implicating, Már Gudmundsson, Philip Turner and William White for valuable comments. Contributions by Pablo García-Luna and Jimmy Shek to this paper are also gratefully acknowledged.
2 Lee (2003) Figure 2, observes that fertility rates in developing countries began to fall in the 1960s. This reflects factors that raise the opportunity costs of bearing children. Such factors include increased productivity of labour, which raises the value of time for parents, increased investment in children because of higher incomes and higher returns on education (due to longer life spans and greater demand for more skilled workers) and higher rates of urbanisation. Certain developments reduce the value of children, such as government provision of a safety net or the availability of pensions.

46 BIS Papers No 44
with only a gradual increase in the share of the elderly population (Table 1).3 The result has been declines in overall dependency ratios (the ratio of dependent young plus elderly to the working-age population) from around the mid-1960s to the present. (Annex Graph A1). However, this stage of the demographic transition is over or will end in the next couple of decades in some EMEs. Many countries are entering a second stage in which child dependency ratios are falling more gradually or have stabilised while elderly dependency ratios are rising more steeply (three right-hand columns in Table 1). As a result, projections up to 2050 indicate that overall dependency ratios will generally tend to rise. The implications of these trends for rates of investment and saving are discussed below.
Table 1
Changes in population shares1
In percentage points
1950–65 1965–2010 2010–50
Young2 Work-ing3 Elderly4 Young2 Work-
ing3 Elderly4 Young2 Work-ing3 Elderly4
China 6.6 –6.1 –0.5 –20.6 15.0 5.5 –4.3 –14.3 18.6
India 4.0 –3.9 –0.1 –10.8 8.1 2.7 –12.5 0.2 12.3
Other Asia5 2.7 –1.9 –0.8 –17.5 12.6 5.0 –9.1 –7.4 16.4
Latin America6
2.8
–3.4
0.6 –16.5
12.2
4.3 –9.6
–5.6
15.3
CEE7 0.9 –2.6 1.8 –14.6 7.2 7.5 –0.5 –15.1 15.6
Other EMEs8 2.9 –3.1 0.2 –13.8 12.1 1.8 –9.4 –2.7 12.1
Memo:
United States
3.3
–4.3
1.0 –10.2
5.6
4.6 –2.9
–5.9
8.8
Japan –9.5 7.6 1.9 –12.6 –8.1 20.7 –2.1 –11.6 13.7
Western Europe9
1.0
–3.6
2.6 –7.8
1.8
6.0 –0.9
–8.5
9.3
Aggregates are weighted averages based on total population data for 2000. 1 Population in each age group as a share of total population. 2 Population aged 14 or less. 3 Population aged 15–59. 4 Population aged 60 and above. 5 Hong Kong SAR, Indonesia, Malaysia, the Philippines, Singapore and Thailand. 6 Argentina, Brazil, Chile, Colombia, Mexico, Peru and Venezuela. 7 The Czech Republic, Hungary, Poland and Russia. 8 Saudi Arabia, South Africa and Turkey. 9 France, Germany, Switzerland and the United Kingdom.
Source: United Nations, World Population Prospects.
3 The population forecasts are taken from the United Nations World Population Prospects, the most widely used
source for population forecasts. The forecasts assume medium fertility.

BIS Papers No 44 47
Implications for saving, investment and capital flows To see how the demographic transition would affect capital flows, it is worth recalling that a country’s net capital flows, or net financing requirements, depend on the current account balance tCAB , which in turn reflects the behaviour of saving ( tSav ) and investment ( tInv ). That is4
ttt InvSavCAB −= (1)
The implications of demographic changes for saving and investment would depend on the stage in the demographic transition. When populations are relatively young, increases in the labour force would tend to raise the marginal product of capital, supporting higher rates of investment spending. At the same time, the falling overall dependency ratios resulting from lower fertility and child dependency would allow households to increase their rates of saving. (This is sometimes described in the literature as the first demographic dividend.)5 Conversely, when populations are relatively old, the declining labour force would tend to lower rates of investment while the increases in overall dependency associated with ageing populations would tend to lower saving.
To shed some light on these demographic effects, Table 2 summarises trends in saving and investment over the past quarter century, with more details in Annex Graph A2.
Table 2 covers the period 1981–2006, for which data on saving and investment in EMEs are more readily available. As working-age populations tended to increase during this period, investment would have been expected to rise. At the same time, declining overall dependency ratios would tend to increase saving rates. However, Table 2 gives a much more mixed impression. In line with expectations, both saving and investment in China and India increased sharply over the period as overall dependency ratios fell, while declining in Japan where (reflecting a rapidly ageing population) dependency ratios have risen for some time now. However, contrary to expectations, increases in saving in the remaining EMEs have generally been modest, and investment ratios have generally declined. One reason is the effect of crises which appear to have persistent effects in dampening national saving and investment. In particular, the Asian crisis of 1997–98 obscures the very large increases in investment and saving that occurred in the region until 1996 (see footnote 3 in Table 2). Indeed, Bloom and Williamson (1998) find that increases in investment and saving rates (with the former exceeding the latter) were apparent in East Asia up to the first half of the 1990s as overall dependency ratios fell (Annex Graph A2). They conclude that the increase in working-age relative to dependent population contributed to East Asia’s so-called economic miracle. The effects of earlier crises also appear to have dampened saving and investment growth in Latin America. In the case of the United States, the sharp decline in saving appears in part to reflect perceived increases in wealth associated with rising asset prices, and the emergence of a financing technology (home equity financing) that increased the liquidity of the wealth held by households.
4 In this paper, current account and investment data are used to estimate national saving. 5 The ultimate effects on national saving would depend on a variety of other factors. For example, the growth in
output associated with higher investment and embedded total factor productivity growth could further increase household saving, corporate and government saving. However, household saving would tend to fall at higher levels of wealth. In line with this, empirical studies find that growth is associated with higher household saving, but higher real per capita income is associated lower household saving. (see eg Loayza et al (2000) and Bulíř and Swiston (2006)).

48 BIS Papers No 44
Table 2
Saving, investment and current account1
Change from 1980–2006 (pct pt)2 Level in 2006 (per cent)
Saving Investment Current account Saving Investment Current
account
China 19.5 10.1 9.4 54.1 44.6 9.4
India 15.0 14.8 0.2 33.8 34.9 –1.1
Other Asia3 3.5 –5.3 8.8 30.8 25.6 5.2
Latin America4 0.9 –4.1 5.0 21.9 20.1 1.8
CEE5 2.2 –2.6 4.8 25.9 21.1 4.8
Other EMEs6 –11.4 –2.5 –9.0 25.8 21.2 4.7
Memo:
United States –7.0 –0.7 –6.2 13.9 20.0 –6.2
Japan –3.8 –8.7 4.9 28.0 24.1 3.9
Western Europe7 –1.8 –3.8 2.0 20.3 19.0 1.3 1 As a percentage of GDP. 2 For CEE, change from 1992–2006. 3 Hong Kong SAR, Indonesia, Malaysia, the Philippines, Singapore and Thailand. For this group, saving and investment increased by about 7 percentage points from 1980–96. 4 Argentina, Brazil, Chile, Colombia, Mexico, Peru and Venezuela. 5 The Czech Republic, Hungary, Poland and Russia. 6 Saudi Arabia, South Africa and Turkey. 7 France, Germany, Switzerland and the United Kingdom.
Source: IMF, World Economic Outlook.
The ambiguity of the results in Table 2 highlights the extent to which factors other than demographics can play an important role in influencing national saving and investment.
As for current accounts, there appears to have been an extended cycle in which a number of EMEs started with current account deficits but more recently – often in the aftermath of crises – have experienced current account surpluses.6 Demographics would predict that over time, EME current account surpluses would turn to deficits again. For example, a recent study (IMF (2004)) covering 115 countries found that investment tended to exceed saving on average over the sample period. However, a rise in the share of the working-age population tended to increase the saving to GDP ratio more than it increased the investment ratio (by 0.72 and 0.31 respectively).7 A rise in the share of the elderly population tended to reduce the saving ratio more than it reduced the investment ratio (by –0.35 and –0.14 respectively). This implies that the current account balance would tend to rise with a larger share of the working-age population, and fall in response to ageing in the population.8
6 In the aftermath of the Asian crisis, these surpluses reflected declines in investment that exceeded declines in
national saving. See Moreno (2007). 7 IMF (2004), Table 3.1, page 143, estimates that in a panel of 115 countries over the period 1960–2000 a rise
in the share of the working-age population was associated with an increase in real GDP per capita, while a rise in the share of the elderly population was associated with a decline.
8 Additional perspective is provided by a study by Bulíř and Swiston (2006), Table 2, who estimate the effects of changes in overall dependency ratios on private saving in a cross-section analysis of 44 developed and

BIS Papers No 44 49
Looking ahead, a question of interest is to what extent ageing is already affecting saving and investment or might do so in the near future. Table 1 (three right-hand columns) indicates that particularly sharp declines in the shares of working-age population and increases in the shares of the elderly are projected for CEE and China. The declines in shares of working-age population and increases in elderly population are roughly comparable to those already observed in Japan. In CEE and China, and some other countries, the projected rise in elderly dependency is comparatively steep (Annex Graph A1).
This implies that saving and investment might be expected to fall and current accounts tend to deficit in CEE and China sooner than in other countries. However, as discussed earlier, there is considerable uncertainty about the timing of these effects because of the influence of other factors on saving and investment. For example, Singapore’s population has been ageing for some time now, and elderly and overall dependency ratios are projected to rise more steeply than in other countries (Annex Graphs A1 and A2). However, while saving and investment ratios have fallen, Singapore’s saving remains well above the average for EMEs, while investment ratios are somewhat above average.
Graph 1
10
20
30
40
50
–20 0 20 40
● ●
●
●
●●
●
●
●●●
●
●
●
●
●
●
●
●
●
●
●
●CN
HK
IN
ID
KR
MY
PH
SG
TH
AR
BR
CL
COMXPE
VE
CZ
HUPL
RU
SA
ZATR
10
20
30
40
50
–20 0 20 40
●●●●●
●
●
●●●●
●
●●
●●
●
●
●
●
●
●
●CN
HK
IN
ID
KR
MYPH
SGTH
ARBR
CL
CO
MX
PEVE
CZHU
PLRU
SA ZATR
–10
0
10
20
30
–20 0 20 40
●●
●
●
●
●●
●
●●●
●●
●●
●
●
●
● ●●
●
●CN
HK
INID
KR
MY
PH
SG
THAR
BRCLCOMXPE
VE
CZ
HU
PL
RU
SA
ZATR
Saving/GDP (y-axis)1 Investment/GDP (y-axis)1 Current account/GDP (y-axis)1
Years to trough in overall dependency2
AR = Argentina; BR = Brazil; CL = Chile; CN = China; CO = Colombia; CZ = Czech Republic; HK = Hong Kong SAR; HU = Hungary; ID = Indonesia; IN = India; KR = Korea; MX = Mexico; MY = Malaysia; PE = Peru; PH = Philippines; PL = Poland; RU = Russia; SA = Saudi Arabia; SG = Singapore (not included in the regression, but the data points are shown in the graph); TH = Thailand; TR = Turkey; VE = Venezuela; ZA = South Africa.1 Average of 2002–06. 2 Where 2006 = year 0. Overall dependency ratio is defined as the population less than 15 years of age plus population 60 years or older divided by the population of 15–59 year-olds.
Sources: IMF; United Nations.
In per centSaving, investment, current account and years to trough in dependency ratios
Additional perspective can be gained from Graph 1, which relates saving, investment and current account balances to the years to trough in overall dependency in a small cross-section of EMEs. In each graph, countries on the right side of the x-axis are younger, implying higher overall dependency ratios (because of high child dependency). Moving left
emerging market economies. They find that in this decade, a 1 point increase in the overall dependency ratio is associated with a 0.3 percentage point decline in the ratio of private saving to GDP. The association is higher (0.63) in industrial countries, and has risen compared to the 1990s (see also Loayza et al (2000)). Furthermore, Asian economies are found to save more than is predicted in the model, and until the end of the 1990s, Latin American countries tended to save less than predicted. These regressions explain between two thirds and three fourths of the cross-country variance of the private saving rate.

50 BIS Papers No 44
on the x-axis towards zero, overall dependency ratios are low (reflecting higher working-age populations and lower child dependency ratios). Dependency ratios then rise again in response to a rising share of elderly population and lower share of working-age populations. Focusing first on saving (left-hand panel), we would expect a non-linear relationship in which saving is low in countries where the population is young (right side of the axis), tends to rise towards the middle of the graph and then declines when approaching the zero point of the x-axis or past it. A quadratic regression line broadly reveals such a relationship in saving and in the current account. (The regression line for investment turns out to be linear.) Again, caution is needed in interpreting these results because of wide dispersion in the data. In particular, Singapore is a significant outlier with an older population and very high rates of saving.9
Pension system design
A key challenge faced by pension authorities is to generate enough resources to meet pension liabilities given a desired level of coverage and replacement income while minimising the burden on the working-age population. In this connection, there has been much discussion of how to fund pension benefits, and specifically on the extent to which countries should rely on income transfers or (alternatively) accumulated assets to finance retirement spending. National practices appear to vary considerably. Drawing on research by the National Transfers Account project, Lee and Mason (2007) estimate that reliance on assets has been comparatively high in Thailand and the United States, and comparatively low in Japan and Taiwan, China (Graph 2).10
Graph 211
0
25
50
75
100
0
25
50
75
100
United States (2000) Japan (1999) Thailand (1998) Taiwan, China (1998)
Public transfers Familial transfers
Work Asset-based (income or sales)
1 As a percentage of total consumption.
Source: Lee and Mason (2007).
Financing of old-age consumption1
9 Singapore is such an outlier that it was not included in the regression analysis. However, all other countries
shown in the graph were included in the regression. 10 At the same time, however, there appears to be significant reliance on familial transfers in Thailand and
Taiwan. 11 We thank Ronald Lee for permission to use this graph.

BIS Papers No 44 51
Some of these differences could reflect different institutional arrangements for financing old-age consumption, including differences in pension design and coverage. Traditionally. pension systems have relied on defined benefit (ie guaranteed incomes) pay-as-you-go systems, in which taxes on workers fund the pension incomes of the elderly. However, these systems tended to create very large implicit pension debts that, since they were not fully funded, raised concerns about the adequacy of replacement incomes and potential fiscal burdens. In particular, unfunded systems in which payments have to be implemented via transfers from the working-age population (eg traditional pay-as-you-go systems) raised concerns about increasing burdens on a declining pool of workers. Projected declines in the share of workers and increases in the share of elderly dependents in the population (Table 1, three right-hand columns) imply increases in elderly and overall dependency ratios. The issue is of particular interest in countries where populations are ageing more rapidly (eg CEE, Korea and China).
The potential financing problems that can arise in more traditional pension systems are illustrated by the experience of Korea, where the pension system is a partially funded defined benefit system managed by the government.12 Holzmann et al (2004) note that reserves accumulated through the public pension system were low compared to the estimated implicit pension debt (IPD), respectively 10% and 47% of GDP, 10 years after the scheme was introduced. It was estimated that the fund would be completely exhausted within the first half of the 21st century.13 One difficulty is that payment promises in a defined benefit plan do not depend on a pension system’s performance or ability to accumulate assets. Another difficulty pertains to incentives to save under these arrangements discussed below.
Recent pension legislation (eg in Latin America) has instead sought to encourage wealth accumulation via personal saving to fund retirement consumption. In particular, there has been more emphasis on defined contribution, rather than defined benefit, which reduces the implicit pension debt. For example, Chile’s pension system (introduced in 1981) is a fully funded defined contribution system of mandatory individual accounts managed by private pension fund administrators (AFPs). In the 1990s, eight emerging market economies implemented pension reforms similar to Chile’s.14
In assessing the extent to which pension reforms of this latter type could reduce the burden on the working-age population, it is worth noting that in a closed economy, consumption by the old would always involve some transfer of resources away from the young. In a pay-as-you-go system, the transfer would involve the payment of taxes (eg for social security, as in the United States). In a fully funded system with private accounts (eg as in Latin America) the transfer would involve the payment of rent, interest income or dividends to, or purchases of assets from, retirees. Nevertheless, a fully funded defined contribution system can still reduce the burden on the working-age population if over time it increases saving and the stock of capital of the economy. Higher capital/labour ratios would raise worker productivity, making it easier to sustain any given level of elderly consumption out of current income. In an open economy, burdens on the working-age population could also be reduced via the accumulation of foreign assets, which can result from additional saving, or
12 However, in 2007, the National Pension Service (NPS) mandated several investment banks (Morgan Stanley,
Credit Suisse) to manage part of its assets. See Song Jung-a, “S Korea turns to global banks on pensions”, Financial Times, 25 July 2007.
13 The precise estimated dates vary (by 2031 according to Moon (2002) and 2047 according to the Ministry of Health and Welfare (Bateman (2007)).
14 These are Peru (1993), Argentina and Colombia (1994), Uruguay (1995), Mexico and Bolivia (1997), El Salvador (1998) and Poland (1999). In contrast, Brazil has not adopted individual accounts and recently introduced a notional defined contribution system, which links contributions to benefits, but the contributions are not placed in individually funded accounts (Matijascic and Kay (2008)).

52 BIS Papers No 44
the diversification of pension fund portfolios (see below). This would reduce claims on domestically produced goods and services at the time of retirement (compared to the case of pay-as-you-go financing or domestic investment only).
Reformed pension systems could increase the incentive to save and reduce evasion because pension contributions are not transfers to others but are savings explicitly accruing to the individual.15 However, the impact on saving rates of pension reforms similar to those adopted in Chile does not appear to be large.16 Saving ratios in countries listed earlier as having adopted these reforms have generally not increased markedly over time (Annex Graph A2). In Poland, for example, sharp increases in saving rates pre-date the 1999 pension reforms, and national saving rates have by and large drifted downwards since the reforms were adopted. In Latin America, saving rates are still comparatively low, and increases in some cases have only offset earlier declines.17 An exception is Chile, where national saving rates have risen since the adoption of pension reforms in the 1980s.
Several factors may have limited the impact of pension reforms on national saving.
• Lack of financial literacy. Pension reforms will not increase saving if contributors are not aware of the possible returns from saving. Some recent survey data from Chile suggests that many pension contributors (up to around 60%) probably lack such awareness as they cannot provide estimates of the balances on their pension accounts. It also appears that contributors with lower awareness have smaller balances (Arenas de Mesa et al (2008)).
• Reduced precautionary saving. Precautionary household saving outside the pension system may have been reduced to the extent to which fully funded defined contribution plans are seen as more credible than defined benefit plans that are not fully funded. This effect may be accentuated if pension funds also contribute to financial deepening (see below). The impact on overall saving would then be small and could even be negative. In a number of countries, there has also been a decline in private saving offsetting increases in government saving. Indeed, Bulíř and Swiston (2006) find that the private saving offset to public saving has increased considerably in this decade; a 1 point rise in the ratio of public saving to GDP is offset by a 0.9 point decline in private saving (up from 0.4 to 0.6 in the 1990s). This may reflect lower precautionary saving, due not only to pension reforms but also to more credible macroeconomic policies.
• Transitional costs. While pension reforms have increased assets to cover implicit pension debts, explicit recognition of such debts has resulted in larger fiscal deficits over a relatively extended transition period. Roldos (2007) notes that “the loss of contributions to individual accounts and the payment of recognition bonds to those who moved to the new partially or fully funded systems added in some cases more than 10 percentage points of GDP to public debt ratios”. It may also be noted that in some cases, such as Peru, reforms were implemented in such a way that workers
15 Indeed, in Korea, the contributions tend to be low due to a relatively large self-employed sector, where plan
participants tend to underreport their income. A less developed infrastructure for enforcement and collection also plays a role. Reforms adopted in 2007 seek to improve the sustainability of the system by gradually reducing the income replacement rate from 60% to 50% in 2008 and then to 40% by 2028.
16 The same could be said for current accounts. In Graph 1, the largest surpluses appear to be in countries that are export-oriented (ie Singapore and Malaysia) or are commodity exporters (eg Venezuela). The extent to which mandatory contributions to provident funds might help explain the large current account surpluses in Singapore and Malaysia remains to be determined.
17 OECD (2007) reaches a similar conclusion. It also notes that empirical work on the impact of pension reforms on national saving is not conclusive.

BIS Papers No 44 53
had an incentive to stay with the traditional pay-as-you-go system, although this was later modified (Carranza and Morón (2008)).
• Declining pension coverage of workers. OECD (2007, Box 2.1, pp 69–70) estimates that the weighted average of coverage for the Latin American region fell from 63% before the pension reforms to 26% in 2006 (however, the initial coverage could be an overestimate). In particular, while membership in pension funds has increased as a proportion of the registered workforce, the share of members who actually contribute has fallen in every country.18 Research is needed to uncover the reasons, but an important factor appears to be whether a pension plan is mandatory, or the default is set to automatic enrolment (Beshears et al (2008)). Given that pension plan contributions are mandatory in a number of EMEs, a large informal sector may also play a role. High administrative costs of pension systems (see next item) may also be partly responsible.19
• High administrative costs. Reforms that have forced workers to channel savings to fund their own retirement through private financial institutions have resulted in high fees.20 Costs in these systems average 1% to 2% in the long run, which can have the effect of lowering future pensions 20–30%. Against this it has been argued that that high operating costs largely reflect marketing expenditures in retail-oriented pension fund systems and institutional reforms could reduce them (James, et al (2001)). It is also argued that government-run pension systems deliver much lower returns than private systems.21
Asset accumulation and financial deepening
Pension funds: asset growth and composition Experience suggests that pension funds can contribute to financial sector deepening. As pension fund assets grow, they can help diversify the investor base and provide stable demand for fixed income securities as well as for new financial instruments (eg high-yield bonds, mortgage-backed securities (MBS), and foreign exchange and interest rate derivatives). The process is potentially symbiotic, as this in turn supports pension fund growth by increasing the availability of longer-maturity assets for pension fund investments.
Since 2000, pension fund assets have grown rapidly in a number of EMEs. As shown in Graph 3, as a percentage of GDP these assets have risen by more than 8 percentage points in Chile, Colombia, Peru and Poland. (In contrast, partly reflecting their initially greater size, pension fund assets have grown only moderately in Singapore and declined in Malaysia over the same period.) However, there is still ample scope for further growth, as pension fund assets are generally still small in EMEs. In 2006, eight out of 13 EMEs shown in Graph 7 had assets of less than 20% of GDP. Among EMEs, only in Chile, Singapore and Malaysia did pension fund assets exceed 50% of GDP. Although this is comparable in size to some developed economies, it is still small compared to the 100% of GDP recorded in the United States.
18 The percentage of registered workers who contribute ranges from 11% in Peru to 31% in Mexico and 58% in
Chile. 19 In line with some of these developments, the success of recent (three-pillar) pension systems in achieving
their social goals is being questioned, notably in Chile (Kay and Sinha (2008)). Efforts to address this could have effects on saving and investment as well.
20 For a more severe critique, see Kotlikoff (2006). 21 See James (2004) and Roldos (2007).

54 BIS Papers No 44
Graph 3
0
20
40
60
80
100
0
20
40
60
80
100
SG CL MY KR BR PE CO HU AR PL MX CZ CN US GB JP
2000 20061
AR = Argentina; BR = Brazil; CL = Chile; CN = China; CO = Colombia; CZ = Czech Republic; GB = United Kingdom; HU = Hungary; JP = Japan; KR = Korea; MX = Mexico; MY = Malaysia; PE = Peru; PL = Poland; SG = Singapore; US = United States. 1 Or latest available.
Sources: OECD; Association of Pension Fund Administrators; national data.
Pension fund assets (as a percentage of GDP)
Composition of pension fund portfolios The impact of pension fund accumulation on the domestic financial sector depends in part on the composition of pension fund portfolios. The following aspects may be highlighted.
First, the share of assets held in financial institutions has tended to decline in a number of EMEs (see Chan et al (2006) for Latin America). This may reflect less reliance on bank deposits as investments, which could enhance demand for other financial instruments and financial deepening. However, in some countries, bank deposits remain significant. According to OECD statistics, in 2005 the share of cash and deposits in total pension fund assets in Thailand, Brazil and Indonesia was 40%, 44% and 71% respectively.
Second, the portfolio composition of pension fund assets in some EMEs, Latin America in particular, is highly weighted towards government bonds. Indeed, as reported by Chan et al (2006), in the majority of Latin American countries they sampled pension funds held more than half of their portfolios in government debt (in Mexico and El Salvador it was more than four fifths). Of particular interest is that in five Latin American countries (Argentina, Bolivia, El Salvador, Peru and Uruguay) pension fund assets became more concentrated in government debt between 1999 and 2005. By way of comparison, the share of pension fund assets invested in bonds (both public and private) in the United States and Japan tended to fall (between 1995 and 2005, from 26% to 19% and from 46% to 30%, respectively; see Committee on the Global Financial System (2007)).
Third, some pension funds (eg Korea or Mexico, Table 3) tend to allocate a relatively small amount of their portfolios to equities, even if relatively young populations (eg in India) suggest that there is scope for increasing allocation to equities.22 By way of comparison, in the United States, 41% and 24% of pension fund assets are invested in equities and mutual funds, respectively.
22 Some research suggests that it would be optimal to have portfolios that are more heavily skewed towards
equities in economies where populations are younger (Gollier (2005)). However, this is a contentious issue.

BIS Papers No 44 55
Table 3
Restrictions on portfolio composition and actual asset composition % of total assets (2006 or 2007)
Domestic equities Foreign assets
Maximum limits Actual composition Maximum limits Actual
composition
India
Korea 12 11 20 9
Singapore PPR 0 PPR …
Argentina 50 13 20 10
Chile 39 17 30 32
Colombia 30 15 20 14
Mexico 15 0.4 20 8
Peru 35 42 10.5 8
Hungary 50 8 30 5
Poland 40 32 5 2
Memo:
United States PPR 41 PPR
United Kingdom PPR 40 PPR
Japan 30 30
PPR = “prudent person rule”.
Sources: Poirson (2007); OECD, Global Pension Statistics; OECD, Latin American Economic Outlook, 2008; Korea National Pension Service.
Fourth, with some exceptions (eg Chile), the allocation to foreign assets by EME pension funds also tends to be small.
The lack of diversification in pension fund portfolios is in a number of cases the result of restrictions on pension fund investments in equities and foreign assets (Table 3). A major reason for these restrictions is that expanding pension fund portfolios to include assets with returns exhibiting very high volatility (domestic equities and foreign assets) is believed to create an unacceptable risk of losses that could impoverish pension fund participants.
There are two arguments for liberalising restrictions on pension fund investments, both of which have to do with the gains from diversification. First, liberalisation can reduce concentration in a portfolio and consequently lower the risk of very large losses. This can be particularly important in emerging market economies which, in the past, have been vulnerable to sharp downturns or even financial crises. For example, a pension fund investing in domestic bank deposits avoids market and liquidity risk but retains counterparty risk to the domestic banking system. This risk can be reduced (at the cost of assuming some exchange rate risk) by adding foreign assets to its portfolio.
Second, liberalisation increases the set of investable instruments and potential gains from diversification. The recent performance of a variety of financial instruments suggests that these gains can be very large. For example, in this decade domestic Latin American government securities (GBI-Latin America) earned a shade over 10% annualised return

56 BIS Papers No 44
(in US dollars) with an annualised volatility of 10% (Graph 4). However, roughly triple those returns could have been earned by investing in Latin American equities, at the cost of more than doubling volatility.
Graph 4
0
10
20
30
40
0
10
20
30
40
0 5 10 15 20 25 30
●
●
●●
●
●
●
●
●
●
● ●
●
●●
●
●
●
●
●
●
● GBI Global
US Treasuries
Euro Gov
US high-yield
GBI Emerging markets
GBI Asia
GBI Emerging Europe
GBI Latin America EMBI Global
EMBI Asia EMBI Latin America
EMBI Europe
MSCI World
MSCI US
MSCI Europe
MSCI-EM
MSCI EM Asia
MSCI EM Latin America
MSCI EM Europe
MSCI China
MSCI East Asia
MSCI South East Asia
Ann
ualis
ed r
etur
ns
Annualised volatility2
The line represents the efficient portfolio frontier. EM = Emerging Markets; EMBI = Emerging Markets Bond Index; GBI = Government Bond Index; MSCI = Morgan Stanley Capital International. 1 Unhedged returns in US dollars; in per cent. 2 Standard deviation of returns, calculated using daily percentage changes in the return index.
Sources: JPMorgan Chase; Merrill Lynch; Datastream.
Returns and volatility, 2002–071
Returns can be improved not only by diversifying into equities (at home or abroad), but also by diversifying into foreign bonds. For example, adding domestic bonds from other regions to an investment portfolio could be associated with increased returns with less than proportional increases in volatility; indeed, the GBI-EM index has higher returns and lower volatility than the GBI-Latin America index. This reflects diversification benefits resulting from combining assets in a portfolio whose returns have low or negative correlations (see below).
Berstein and Chumacero (2005) provide more precise estimates of the gains from easing specific restrictions on pension fund asset allocations in Chile. Their analysis suggests that by mid-2002, in the absence of the specific pension fund restrictions applied in Chile, pension fund assets could have been higher by between 10% (for a quadratic preference or an efficient value-at-risk portfolio) and 30% (for a minimum variance portfolio) without increasing the volatility of returns (see their Figure 3). Put differently, for a minimum variance portfolio, with the same volatility of returns, returns to the unrestricted portfolio averaged 0.85% a month, compared to 0.67% per month for the restricted portfolio.23 This is because
23 The authors estimate the restricted portfolio by (where applicable) calibrating parameters in the objective
function so as to replicate the ex post pension fund portfolio returns and volatilities. The unrestricted portfolio is selected so that in each period it is exposed to the same volatility as the restricted portfolio. The return corresponding to that volatility is then estimated. These results vary somewhat with differing assumptions about transaction costs, but the basic conclusions hold; see Berstein and Chumacero (2005), Table 3.

BIS Papers No 44 57
the unrestricted optimal portfolio implied a larger allocation to foreign bonds and equities (about a ⅓ share for the minimum variance model) than would have been the case for the restricted portfolio. Thus, for the minimum variance model, the probability of hitting the investment limit for foreign fixed income and equity instruments was estimated at about 62% and 90%, respectively.
How much would pension funds invest abroad? While steps are being taken to liberalise pension fund investments abroad in a number of EMEs, it is not clear how much pension funds will increase their investments abroad in response. On the one hand, in the case of Chile, or other EMEs, the returns from moving to an optimum share of foreign assets (and corresponding gross outflows channelled via pension funds) could be even higher than suggested by Berstein and Chumacero’s (2005) estimates. In their analysis, they only consider developed country fixed and variable income instruments as alternatives to domestic assets,24 while recent experience suggests that EME pension funds could earn even higher-risk adjusted returns by investing in assets issued in other EMEs. As can be seen in Graph 4, a number of regional (EMBI, GBI and MSCI) indices dominate their developed country counterparts in terms of risk-adjusted returns. Against these advantages is the possibility that EMEs might be more vulnerable to crises, so that a pension fund that is very concerned about the risk of large losses might be less inclined to invest in EME instruments. Much depends on the diversification benefits provided by EME instruments on average and during episodes of financial stress. As can be seen in Graph 5, equities are not fully correlated across regions over a longer period (2001–07). This highlights the opportunities for diversification benefits from EME pension fund investments in both developed market and other emerging market equities. However, an important concern is that correlations in cross-country equity returns tend to rise during episodes of financial stress. Nevertheless, EM pension funds may be in a better position to manage the risks of diversification (than, say, EM banks) because pension fund liabilities tend to be longer-term. Also, bond investments do not appear to raise such concerns, as correlations in some cases have actually fallen during episodes of financial stress. On the other hand, diversification could be limited by a number of factors.25 Even in the absence of restrictions, there is evidence that investors prefer to invest in their own domestic markets (home bias). This is reflected in the fact that pension fund investment abroad is below the ceiling in a number of countries (Table 3).26 An important reason is that developing monitoring and management capacity to invest abroad is costly, particularly for pension funds in EMEs having little experience with investments in global financial markets. For example, as pension fund liabilities are denominated in domestic currency pension funds
24 They assume that there are four types of assets: domestic fixed, domestic variable, foreign fixed and foreign
variable income (as proxied for, respectively, by promissory notes of the Central Bank of Chile of eight-year maturity, an index of all Chilean variable return instruments, an index based on all US indices, and the Dow Jones Industrial Average).
25 Limited diversification of pension portfolios has also been observed in countries with higher incomes per capita. Gudmundsson (2001) describes stages in which pension funds in Iceland first invested in domestic bonds, lending directly to members (for housing), and then increased the share of foreign assets and equity in their portfolios over a short period of time (from low single digits to 19–26% between the mid-1990s and 2000), resulting in large increases in returns on assets. In part, this reflected liberalisation, but also awareness by pension fund managers of the need to increase returns.
26 Actual limits could also turn out to be below the ceiling because the ceiling applies to each fund individually and there are significant penalties for breaching the ceiling (eg forced sales). Under those conditions, fund managers would want to stay well below the ceiling to avoid breaches because fluctuations in market prices and mark to market accounting can push restricted asset holdings above the ceiling without any trade taking place.

58 BIS Papers No 44
need to develop the capacity to manage currency risks;27 There is also limited availability of instruments to hedge risks, including those arising from currency or interest rate fluctuations.28
Graph 5
0
0.2
0.4
0.6
0.8
1.0
0
0.2
0.4
0.6
0.8
1.0
World-EM World-Asia World-LatAm World-Europe Asia-LatAm Asia-Europe LatAm-Europe
–1.0
–0.5
0
0.5
1.0
–1.0
–0.5
0
0.5
1.0
Global-EM Global-Asia Global-LatAm Global-Europe Asia-LatAm Asia-Europe LatAm-Europe
2001–07 May–Oct 20022
May–Jun 20062
Feb–Mar 20072
Aug–Dec 20072
Equities (MSCI)
Bonds (GBI)
1 Calculated on daily unhedged returns in US dollars. 2 Period of increased global market volatility.
Sources: Datastream; JPMorgan Chase.
Correlations in asset markets1
There is growing awareness of the need to provide such hedging instruments. For example, in India market participants are now allowed to use foreign exchange forwards, swaps and options. While this is usually only against “crystallised foreign currency exposures”, the range of hedging tools available is now to be expanded (Mohan (2007)). However, it is still not clear to what extent pension funds would engage in hedging even were the appropriate instruments to be made available, because hedging would be costly. An additional concern is whether pension funds could contribute to increased volatility of capital flows (Vargas and
27 With regard to monitoring investments abroad, pension funds could draw on the risk management capacity of
global financial institutions by investing in vehicles such as mutual funds. 28 See Moreno (2006), Table A6 and Mohan (2007).

BIS Papers No 44 59
Varela (2008)), which could reduce risk-adjusted returns or raise broader risk management concerns.
Deeper financial markets As pension fund assets have grown, emerging securities markets have deepened in recent years. Domestic debt markets, which are largest in Asia, South Africa and Turkey, have generally grown in this decade. However, they have not grown in central Europe, (Graph 6 and Annex Graph A3). There has also been a tendency for stock market capitalisation to rise in EMEs in this decade, reflecting steep increases in equity prices.
Graph 6
0
30
60
90
120
150
2000 2002 2004 20060
30
60
90
120
150
2000 2002 2004 20060
30
60
90
120
150
2000 2002 2004 2006
Asia3 Latin America4 Central Europe5
Others6
1 As a percentage of GDP. 2 Covers domestic (lower portion of bars) and international (upper portion of bars) debt securities. 3 China,Hong Kong SAR, India, Indonesia, Korea, Malaysia, Philippines, Singapore, Taiwan (China) and Thailand. 4 Argentina, Brazil, Chile,Colombia, Mexico, Peru and Venezuela. 5 Czech Republic, Hungary, Poland and Russia. 6 South Africa and Turkey.
Sources: IMF; Standard & Poor’s; BIS.
Broad money1 Total debt securities1, 2 Stock market capitalisation1
Size of financial market
However, financial markets in EMEs are still not as deep as in developed countries. This is broadly reflected in (i) still low ratios of market capitalisation in securities to GDP; (ii) high ratios of bank deposits to GDP; (iii) lack of liquidity in securities markets; and (iv) low reliance on securities markets for financing.
Low ratio of securities to GDP. As illustrated in Graph 6, the ratio of debt securities to GDP ranged from less than 30% for CEE to 60% or higher in Asia and Latin America. (Annex Graph A3 provides country details.) However, this ratio was around 200% in the United States and Japan (Annex Graph A4). With the recent run-up in EME equity prices, stock market capitalisation ratios are more comparable with the 100% and 150% observed in Japan and the United States respectively, although they remain at a comparatively low 50% in Latin America.
Relatively high bank deposits. M2/GDP has recently averaged around 140% in Asian EMEs and 45–60% in other EMEs. Bank deposits are thus relatively more important in EMEs than in the US, where the M2/GDP ratio averaged 50%. However, M2/GDP ratios are about as high in Japan (nearly 150%) as they are in Asian EMEs.29
29 One implication is that in countries where pension funds hold a significant proportion of bank assets, bank
interest rate liberalisation could significantly increase pension fund returns, particularly where rising inflation is a concern. Bank interest rates have been liberalised in many EMEs, although restrictions are still relevant in certain countries, like China or India. See Mohanty and Turner ((2008), Tables A4 and A5) for information on the liberalisation of bank interest rates between 1997 and 2006. In some cases, pension funds could help

60 BIS Papers No 44
Low liquidity. The rate of turnover in financial instruments tends to be lower in EMEs than in developed markets. This can present problems for risk management (and eventual wealth accumulation), by making it difficult for investors to change their positions. As can be seen in Graph 7, debt trading volume as a percentage of GDP ranged from a low of around 10% of GDP in Asia to a high of around 150% in Latin America. By way of comparison, the corresponding ratios for Japan and the US were respectively about 500% and nearly 2000%. As for equity markets, turnover tends to be lower in Latin America (around 10% of GDP) and around 80% in Asia and “other”. By way of comparison, the corresponding turnover ratios for Japan and the United States are 150% and 280% respectively (Annex Graph A5).
Graph 7
0
40
80
120
160
2000 2001 2002 2003 2004 2005 20060
40
80
120
160
2000 2001 2002 2003 2004 2005 2006
Asia1 Latin America2 Central Europe3
Others4
1 China, India, Indonesia, Korea, Malaysia, Philippines, Taiwan (China) and Thailand. 2 Argentina, Brazil, Chile, Colombia, Mexico,Peru and Venezuela. 3 Czech Republic, Hungary, Poland and Russia. 4 South Africa and Turkey.
Sources: IMF; EMTA; Standard & Poor’s.
Debt trading volume as a percentage of GDP Stock market turnover as a percentage of GDP
Liquidity indicator
Limited reliance on equities for financing. To illustrate, in China stock market capitalisation as a percentage of GDP is quite high (90%), but flow of funds data indicate that between 2003 and 2005 equities accounted for only about 4% of total increases in liabilities, with bank loans and bond financing accounting for much larger shares (61% and 35% respectively). The reasons why higher share prices do not lead to more share issuance warrant further examination.
Role of pension funds in financial deepening The developments highlighted above suggest that further pension fund development could contribute to the deepening of financial markets. One indication is that the correlation between financial deepening and pension fund growth is comparatively strong in a number of EMEs. As shown in Table 4, stock market capitalisation is positively correlated with pension
promote interest rate liberalisation. In the case of India, pension funds could help eliminate distortions in interest rates caused by existing arrangements to support small savers (Mohan (2007)). To compensate for the lack of a social security system, the government gives small savers access to saving instruments (administered through post offices and commercial banks) that benefit from tax incentives and favourable interest rates set by the government. However, to attract deposits, banks competing with these small saving schemes tend to set rates on long-term deposits at levels higher than those which would have been obtained under competitive market conditions. This has been seen as contributing to downward stickiness of lending rates (with implications for the effectiveness of monetary policy). Improvements in the social safety net (including pensions) could address this issue. (A proposed interim solution is to benchmark these administered interest rates to market determined rates.)

BIS Papers No 44 61
fund asset growth in Korea, Argentina, Chile, Colombia, Peru and Poland. In contrast, the correlation is negative in Malaysia and Singapore. As for domestic debt securities, the correlation is positive (in either levels or changes) in most EMEs listed.
Table 4
Correlations with pension fund assets/GDP1
Stock market capitalisation/GDP
Outstanding domestic debt securities/GDP
Time period
Ratio Change in ratio Ratio Change in
ratio
China 2000 2006 0.27 0.04 0.81 –0.60
Korea 1990 2006 0.76 0.41 0.92 0.40
Malaysia 2000 2006 –0.38 –0.09 –0.28 0.65
Singapore 2000 2006 –0.20 –0.65 0.82 0.61
Argentina 1995 2006 0.48 0.34 0.94 0.85
Brazil na na na na
Chile 1982 2006 0.68 0.79 0.30 0.71
Colombia 1995 2006 0.72 0.38 0.98 0.74
Mexico 1998 2006 0.39 –0.23 0.96 0.54
Peru 1994 2006 0.72 0.44 0.90 0.20
Czech Republic na na na na
Hungary na na na na
Poland 2000 2006 0.86 0.33 0.96 0.91
United States 2001 2006 0.96 0.94 0.59 0.11
Japan 2001 2006 0.98 0.86 0.64 –0.58 1 Based on annual data covering the time period shown.
Sources: OECD; FIAP; S&P Emerging Markets Database; national data; BIS.
The results in Table 4 are broadly in line with Roldos (2007) and OECD (2007), who note that institutional investment (including by pension funds) has been associated with increases in market capitalisation of stocks and bonds. This relationship is particularly apparent in Chile. In line with this, the share of pension funds in government debt markets in a set of Latin American countries rose from 18% in 1998 to 29% in 2005 (Roldos (2007), Table 4). Pension fund demand is also believed to have helped stimulate the development of new financial instruments. There is also evidence of lengthening maturities in fixed income markets in Chile and Mexico, and institutional investors, including pension funds, are believed to have played an important role in this. Research also suggests that the growth of institutional investors such as pension funds can lower the cost of capital and encourage the creation of new financial instruments (Walker and Lefort (2002)). A pension fund portfolio reallocation to equities could thus boost investment and growth as well as returns for pension

62 BIS Papers No 44
fund investors. The importance of this effect would depend in part on the extent to which firms rely on equity for their financing (which as noted earlier, can be relatively little in some EMEs).30
Implications for saving and capital flows The implications of greater financial depth for capital flows are uncertain, but some research suggests it could affect capital flows by lowering precautionary saving and current account balances. A recent study by Chinn and Ito (2007) finds that a larger financial sector could lower current account balances under certain conditions.31 This is an issue of interest in a number of EMEs, notably China.
The effects of pension fund portfolio liberalisation on net or gross capital flows are also uncertain. However, the experience of Chile since 1998, reported by Desormeaux et al (2008) suggests that pension fund investments abroad can have a large impact on gross outflows. This impression is reinforced by evidence they cite that an increase of 10% in foreign investment limits on Chilean pension funds is associated with an accumulated depreciation of 2% of the Chilean peso against the US dollar (see Cowan et al (2008)). To illustrate orders of magnitude, at the limit of 30% that prevailed until recently, Chilean pension fund assets invested abroad would be equivalent to nearly 20% of Chilean GDP. Pending legislation contemplates significant easing of these limits which could mean large cumulative gross outflows over time in the pension fund sector. By way of comparison, foreign reserves to GDP in Latin America averaged about 10% in 2006 (13% in Chile) and 35% in Asia.
An issue of interest is whether outflows channelled via pension funds could help offset large gross capital inflows, thus reducing the incentives for foreign exchange market intervention and reserve accumulation in some countries. While they are not perfect substitutes for foreign reserves, pension fund accumulation of foreign assets could provide a channel for intermediating capital inflows abroad, thus providing some of the benefits that have been sought from foreign exchange market intervention and foreign reserve accumulation without the associated disadvantages. In particular, as pension fund foreign asset accumulation would be financed by domestic saving, it does not raise the issues typically associated with the financing of foreign reserve accumulation, such as the possible loss of monetary control or the carrying costs associated with sterilisation of intervention in foreign exchange markets.
30 On the other hand, some commentary suggests that the relationship between pension asset growth and
market capitalisation has been weak in some countries over certain periods. Possible explanations include inadequate regulatory and financial infrastructure and a lack of a critical mass in pension fund assets under management.
31 The conditions are that the economy be less open (ie restrictions on capital flows) and the legal system be less developed (not in the top decile).

BIS Papers No 44 63
Annex I
Graph A1
0
25
50
75
100
1960 1980 2000 2020 2040
China India Korea Malaysia PhilippinesSingapore
0
25
50
75
100
1960 1980 2000 2020 2040
ArgentinaBrazil Chile Colombia Mexico Peru
0
25
50
75
100
1960 1980 2000 2020 2040
Czech RepublicHungary Poland Russia South Africa Turkey
0
25
50
75
100
1960 1980 2000 2020 2040
China India Korea Malaysia PhilippinesSingapore
0
25
50
75
100
1960 1980 2000 2020 2040
ArgentinaBrazil Chile Colombia Mexico Peru
0
25
50
75
100
1960 1980 2000 2020 2040
Czech RepublicHungary Poland Russia South Africa Turkey
40
60
80
100
120
1960 1980 2000 2020 2040
China India Korea Malaysia PhilippinesSingapore
40
60
80
100
120
1960 1980 2000 2020 2040
ArgentinaBrazil Chile Colombia Mexico Peru
40
60
80
100
120
1960 1980 2000 2020 2040
Czech RepublicHungary Poland Russia South Africa Turkey
Child dependency ratios1
Elderly dependency ratios2
Overall dependency ratios3
1 Population less than 15 years of age / population 15–59 years old. 2 Population 60 years or older / population 15–59 years old. 3 Population less than 15 years of age plus population 60 years or older / population 15–59 years old.
Source: United Nations, World Population Prospects.
In per centDependency ratios by country

64 BIS Papers No 44
Graph A2
10
20
30
40
50
60
1980 1990 2000 1980 1990 2000 1980 1990 200040
50
60
70
80
90
1980 1990 2000
10
20
30
40
50
60
1980 1990 2000 1980 1990 2000 1980 1990 200040
50
60
70
80
90
1980 1990 2000
10
20
30
40
50
60
1980 1990 2000 1980 1990 2000 1980 1990 200040
50
60
70
80
90
1980 1990 2000
10
20
30
40
50
60
1980 1990 2000 1980 1990 2000 1980 1990 200040
50
60
70
80
90
1980 1990 2000
Saving (lhs)1
Investment (lhs)1
Dependency (rhs)2
China Korea India Philippines
Indonesia Malaysia Thailand Singapore
Argentina Brazil Chile Mexico
Czech Republic Hungary Poland Russia
1 Relative to GDP; three-year moving averages. 2 Population less than 15 years of age plus population 60 years or older / population 15–59 years old.
Sources: IMF; United Nations, World Population Prospects.
In per centSaving, investment and dependency ratios

BIS Papers No 44 65
Graph A3
0
60
120
180
240
300
CNHK IN KRTWID MYPHTHSGZATR0
60
120
180
240
300
CNHK IN KRTWID MYPHTHSGZATR
InternationalDomestic
0
60
120
180
240
300
CNHK IN KRTWID MYPHTHSGZATR
0
60
120
180
240
300
AR BR CL COMXPE VE CZ HU PL RU0
60
120
180
240
300
AR BR CL COMXPE VE CZ HU PL RU0
60
120
180
240
300
AR BR CL COMXPE VE CZ HU PL RU
AR = Argentina; BR = Brazil; CL = Chile; CN = China; CO = Colombia; CZ = Czech Republic; HK = Hong Kong SAR; HU = Hungary; ID = Indonesia; IN = India; KR = Korea; MX = Mexico; MY = Malaysia; PE = Peru; PH = Philippines; PL = Poland; RU = Russia; SG = Singapore; TH = Thailand; TR = Turkey; TW = Taiwan (China); VE = Venezuela; ZA = South Africa.1 As a percentage of GDP. 2 End-2006 figures. 3 345% for Hong Kong SAR. 4 904% for Hong Kong SAR.
Sources: IMF; Standard & Poor’s; BIS.
Broad money3 Debt securities Stock market capitalisation4
Size of financial market1, 2

66 BIS Papers No 44
Graph A4
0
50
100
150
200
250
2000 2002 2004 20060
50
100
150
200
250
2000 2002 2004 20060
50
100
150
200
250
2000 2002 2004 2006
United States3
Japan3 United StatesJapan
1 As a percentage of GDP. 2 Covers domestic and international debt securities. 3 International.
Sources: IMF; World Federation of Exchanges; BIS.
Broad money1 Total debt securities1, 2 Stock market capitalisation1
Size of financial market
Graph A5
0
500
1,000
1,500
2,000
2000 2001 2002 2003 2004 2005 20060
100
200
300
400
2000 2001 2002 2003 2004 2005 2006
Japan United States
1 Estimates of the annual value of secondary transactions in equities and bonds.
Source: National data.
Debt trading volume as a percentage of GDP Stock market turnover as a percentage of GDP
Liquidity indicator1

BIS Papers No 44 67
References
Arenas de Mesa, A, D Bravo, J R Behrman, O S Mitchell and P Todd (2008): “The Chilean pension reform turns 25: lessons from the social protection survey”, in S J Kay and T Shinha (eds), Lessons from pension reform in the Americas, Oxford University Press.
Bateman, H (2007): Pension reform and the development of pension systems: an evaluation of World Bank assistance, World Bank.
Batini, N, T Callen and W McKibbin (2006): “The global impact of demographic change”, IMF Working Paper WP/06/9, January.
Beshears, J, J J Choi, D Laibson and B C Madrian (2008). “The importance of default options for retirement saving outcomes: evidence from the USA”, in S J Kay and T Shinha (eds), Lessons from pension reform in the Americas, Oxford University Press.
Berstein, S and R Chumacero (2005): “Cuantificación de los costos de los límites de inversión para los fondos de pensiones chilenos”, Documento de Trabajo no 3, Superintendencia de Administradoras de Fondos de Pensiones, April.
Bloom D E and J G Williamson (1998): “Demographic transitions and economic miracles in East Asia”, World Bank Economic Review, vol 12, no 3, pp 419–55.
Bulíř, A and A Swiston (2006): “What explains private saving in Mexico?”, IMF Working Paper WP/06/191, August.
Carranza, E and E Morón (2008): “The Peruvian pension reform: ailing or failing?”, in S J Kay and T Shinha (eds), Lessons from pension reform in the Americas, Oxford University Press.
Chan, L, J A Santaella and J E Suh (2006): How does developing domestic financial markets affect asset allocation in emerging market economies, www.bis.org/publ/wgpapers/cgfs27chan.pdf.
Chinn, M and H Ito (2007): “East Asia and global imbalances: saving, investment, and financial development”, NBER Working Paper, no 13364, September.
Cogley, T (1998): “The baby boom, the baby bust, and asset markets”, FRBSF Economic Letters, 98-20, 26 June, www.frbsf.org/econrsrch/wklyltr/wklyltr98/el98-20.html.
Committee on the Global Financial System (2007): “Institutional investors, global savings and asset allocation”, CGFS Publications, no 27, February.
Cowan, K, D Rappoport and J Selaive (2008): “Tipo de cambio y límites de inversión en el extranjero de los fondos de pensiones”, in Central Bank of Chile, Informe de Estabilidad Financiera, Segundo Semestre 2007.
Davis, E P (2005): “The role of pension funds as institutional investors in emerging markets”, paper presented at the Korean Development Institute Conference, Seoul, March.
Desormeaux J, J, K Fernández D and P García S (2008): “Financial implications of capital outflows in Chile: 1998–2008”, this volume.
Dunaway, S and V Arora (2007): “Pension reform in China: the need for a new approach”, IMF Working Paper WP/07/109.
Espinosa-Vega, M A and T Sinha (2000): “A primer and assessment of social security reform in Mexico”, Federal Reserve Bank of Atlanta Economic Review, first quarter, pp 1–23, available at www.frbatlanta.org/filelegacydocs/Espinosa-Sinha.pdf.
Gollier, C (2005): “Optimal portfolio management for individual pension plans”, manuscript, University of Toulouse (GREMAQ, IDEI), 7 November.
Gudmundsson, M (2001): “The Icelandic pension system”, Central Bank of Iceland Monetary Bulletin, 2001/1.

68 BIS Papers No 44
Holzmann, R, R Palacios and A Zviniene (2004): “Implicit pension debt: issues, measurement and scope in international perspective”, World Bank Discussion Papers, no 403.
HSBC Global Research (2006): “Asia invests more in itself”, Global Insights, May.
James, E (2004): “Reforming social security: what can Indonesia learn from other countries?”, paper prepared for USAID conference, June.
James, E, J Smalhout and D Vittas (2001): “Administrative costs and the organization of individual account systems: a comparative perspective”, in R Holzmann and J Stiglitz (eds), New ideas about old age security, World Bank. Revised version published in: OECD, Private pensions systems: administrative costs and reforms, 2001.
Kay, S J and T Sinha (2008): Lessons from pension reform in the Americas, Oxford University Press.
Kotlikoff L (2006): “Pensions reform - the triumph of form over substance?”, lecture presented to the Latin American meeting of the Econometric Society and the annual meeting of Latin American and Caribbean Economic Association, Mexico City, 2 November.
Lee, R (2003): "The demographic transition: three centuries of fundamental change", Journal of Economic Perspectives, Vol 17, number 4, Fall.
Lee, R and A Mason (2007): “Age, aging and economic growth”, paper presented at a workshop on Population Aging and Economic Growth, Cambridge MA, 18–19 May.
Levine, R (2004): “Finance and growth: theory and evidence”, NBER Working Papers, no 10766, September.
Loayza, N, K Schmidt-Hebbel and L Servén (2000): “What drives private saving across the world?”, Review of Economics and Statistics, vol 82, May, pp165–81.
Matijascic, M and S J Kay (2008): “Pensions in Brazil: reaching the limits of parametric reforms in Latin America”, in S J Kay and T Shinha (eds), Lessons from pension reform in the Americas, Oxford University Press.
Mohan, R (2007): “Capital account liberalisation and conduct of monetary policy – the Indian experience”, paper presented at an International Monetary Seminar on Globalisation, Inflation and Financial Markets, organised by the Bank of France, Paris, 14 June.
Mohanty, M and P Turner (2008): “Transmission mechanisms for monetary policy in emerging market economies: what is new?”, in BIS Papers, no 35.
Moon, H (2002): “The Korean pension system: current state and tasks ahead”, paper presented at the OECD/INPRS/KOREA Conference on Private Pensions in Asia, Seoul, 24–25 October.
Moreno, R (2006): “The changing nature of risks facing banks”, in BIS Papers, no 28, August.
——— (2007): “Experiences with current account deficits in Southeast Asia,” Central Bank of Chile Working Papers, no 452, December.
OECD (2007): Survey of investment regulations of pension funds, July.
Poirson, H K (2007): “Financial market implications of India’s pension reform”, IMF Working Paper WP/07/85, April.
Reyes, G (2006): “Development of pension reform in Chile”, presentation in Poland.
Roldos, J (2007): “Pension reform and macroeconomic stability in Latin America”, IMF Working Paper WP/07/108.

BIS Papers No 44 69
Vargas, H and C Varela (2008): “Capital flows and financial assets in Colombia: recent behavior, consequences and challenges for the central bank”, this volume.
Walker, E and F Lefort (2002): “Pension reform and capital markets: are there any (hard) links?”, Social Protection Discussion Paper Series, no 0201.


BIS Papers No 44 71
Hedging instruments in emerging market economies
Sweta Saxena and Agustín Villar
Introduction
The financial crises of the 1990s in many emerging market economies (EMEs) created massive disruption and imposed huge costs of lost output on these economies.1 One lesson was that these crises were particularly painful because local firms and households had to face large exchange rate or interest rate risk, with inadequate hedging possibilities. At the same time, even the massive undervaluation of local assets failed to attract foreign investors because markets were very illiquid or because it was difficult to hedge certain market risks. For these reasons, the potential benefits of global financial market integration – eg funding for profitable activities and risk-sharing – were not fully exploited.
Over the past few years, however, the size and scope of markets for hedging have expanded. The development of bond and spot foreign exchange (FX) markets and derivative products has helped advance the hedging process. The notional amounts outstanding globally of over-the-counter (OTC) derivatives have grown at an annual rate of 25% since 1998. EMEs account for 12% of this global derivatives market.2 This allows business in EMEs to hedge against various risks; at the same time it also makes it easier for foreign investors to acquire exposure to specific EME risks. The purpose of this note is to examine the extent and nature of developments in derivative instruments in three main risks (namely, foreign exchange, interest rate and credit) in EMEs.
Hedging and financial markets
Hedging is defined here as risk trading carried out in financial markets. Businesses do not want market-wide risk considerations – which they cannot control – to interfere with their economic activities. They are, therefore, willing to trade the risks that arise from their daily conduct of business. Whether in industrial, commercial or financial businesses, the financial assets – loans, bonds, shares, stocks, derivatives – they trade allow them to hedge the risks that accumulate in their balance sheets in the course of business. From the point of view of the corporates and other firms trading in these risks has been also very much at the centre of financial developments.3
Investors’ holdings of securities – or long positions in shares and stocks, bonds or loans – expose them to the sort of risks with which the securities are associated. Part of this risk stems from the unique features of the security, but part is related to more common characteristics shared across securities. Two common macroeconomic risks are those
1 See Cerra and Saxena (2008) and Kaminsky and Reinhart (1999) for measures of the economic costs of such
crises. 2 BIS (2007b). 3 Modern courses in financial economics stress both functions of financial markets and intermediaries. See, for
example, Kohn (2004) or Tirole (2006).

72 BIS Papers No 44
associated with the exchange rate and the interest rate risk in a given economy. These risks can often be traded separately (see below). Pooling securities together in portfolios takes advantages of the idiosyncratic nature of the risks they bear to reduce the overall risk that investors face. For example, including the shares of exporting companies and non-tradable services in an equity portfolio helps to reduce the overall risk of the portfolio to a fall in external demand. From the economy’s point of view, portfolio pooling spreads risk across investors.
Opening portfolios to foreign securities offers a good opportunity to trade risks in financial markets. Cross-border trading in securities facilitates the exchange of the idiosyncratic risks embedded in them. The differences in economic structure and macroeconomic fundamentals across countries make the payoffs from foreign securities differ from the ones existing in the domestic economy. Lower price correlation between domestic and foreign securities provides opportunities for reducing risk in investors’ portfolios.4 From the point of view of the national economy, many of these risks are systemic in nature (eg they cannot be eliminated through portfolio diversification into domestic assets); they are intrinsic to the economy and are shared by most domestic securities. Improving risk-sharing between the national economy and the rest of the world can help in making the national economy more resilient to specific shocks that might hit from time to time.
Two cash markets typically help in the development of derivatives markets. The first is the foreign exchange market. Table 1 summarises developments in the FX market since 2001. Total trading in EME currencies has risen from $98 billion in 2001 to $246.9 billion in 2007. Daily trading in no fewer than 10 EME currencies now exceeds $10 billion. One conclusion for BIS cross-country comparison is that as the volume of spot transactions rises, the share traded on the derivatives market relative to the spot market rises.
A second market is the local currency bond market. As documented more fully in CGFS (2007), local currency debt markets have developed in several EMEs over the past decade. Table A1 shows the development of domestic bonds outstanding: from just over $1 trillion in 1998, the total outstanding now exceeds $4 trillion. As issuance has become more market-oriented and secondary market trading has increased, yield curves have reached out in some countries. The development of such markets has helped the pricing of interest rate derivatives.
Hedging took a gigantic step forward with the development of derivative products in global financial markets. The growth in depth and breadth of these markets has made derivatives one of the most important instruments to trade risk in financial markets. In fact, a narrower definition of hedging associates it solely with the trade in risk that is carried out using derivatives.5
Derivatives are financial contracts that commit counterparties to exchange cash payments related to the value of a commodity or financial asset (underlying asset) with no actual delivery of the underlying asset (Kohn (2004)). They allow investors to deal with individual sources of risks, or a more limited set of risks than other financial assets. There are four main financial contracts: futures, forwards, swaps and options.6 Futures are exchange-traded contracts for the sale or purchase of an asset at a future date. They are written over a large range of underlying assets such as commodities, foreign currency or interest rates. Forwards are also contracts that trade an underlying asset at a future date but differ from futures in that
4 The overall portfolio volatility tends to fall. 5 See Kohn (2004). 6 Forward contracts are a purchase/sale of an asset for delivery at a future date. However, they are often settled
without physical delivery but with a final payment.

BIS Papers No 44 73
they are traded in OTC markets rather than on exchanges. A swap is a contract in which the parties agree to a stream of payments determined with reference to the price of an asset over time. In the case of all three contracts, payments are netted and settled in cash. Finally, options are contracts where one party buys/sells (for the payment of a fee) the counterparty the right to trade in the underlying asset.
Table 1
Foreign exchange spot markets Daily average turnover – developing countries, in billions of US dollars
2001 2004 2007
Asia 100.5 181.9 China … 0.6 8.3 Hong Kong SAR 18.9 35.6 37.9 India 1.6 3.4 14.3 Indonesia 3.3 1.0 1.7 Korea 5.8 10.3 17.4 Malaysia 0.5 0.8 1.7 Philippines 0.5 0.3 1.1 Singapore 34.5 42.5 89.2 Taiwan, China 3.2 4.8 8.8 Thailand 0.6 1.1 1.4
Latin America 16.3 14.6 Argentina … 0.7 1.1 Brazil 3.6 2.5 5.1 Chile 1.7 1.5 2.0 Colombia 0.3 0.6 1.3 Mexico 4.4 10.7 4.5 Peru 0.2 0.3 0.6
Central Europe 5.4 3.6 6.0 Czech Republic 0.8 0.9 1.4 Hungary 0.4 0.7 2.2 Poland 4.2 1.9 2.4
Others Israel 0.3 2.7 3.5 Russia 9.4 23.6 34.0 Saudi Arabia 1.2 1.3 2.7 South Africa 2.1 1.8 3.4 Turkey 0.4 0.2 0.8
Total 98.0 151.1 246.9
Sources: Various national sources, eg central banks, national statistical offices, securities registers.

74 BIS Papers No 44
Derivatives were almost non-existent 30 years ago, but since then they have been growing very rapidly. According to the Triennial Central Bank Survey of Foreign Exchange and Derivatives Activity (Triennial Survey), the notional amount outstanding of OTC derivatives reached $516.4 trillion in June 2007.7, 8 Since 1998, the notional amount outstanding has grown at an annual rate of 25%.9 The Triennial Survey also shows that almost 75% of total derivatives are interest rate contracts, while foreign exchange and credit contracts have a market share of 10% each. The remaining contracts correspond to commodity- and equity-related derivatives.
Daily OTC derivatives market turnover in global markets averaged $4,193 billion in April 2007.10 The share of interest rate derivatives in total turnover was only 55%. Turnover data are available with greater disaggregation and can be of particular help in analysing the derivatives market in EMEs. The Triennial Survey is the main source of the figures used in this paper.
One question dealt with here is whether the need for hedging is driving the growth and deepening of derivative product markets in EMEs. In particular, we look into the issue of whether patterns that have been observed in global financial markets are present in EMEs. Finally, we ask what the implications of the growth in derivatives markets are for central bank policies.
The derivatives market in EMEs
The size of the derivatives market in EMEs has grown. Table 2 indicates the growth in the average daily turnover in OTC derivatives trading between 2001 and 2007. In 2007 it reached $516 billion, up 28% annually since 2004. By this metric, the OTC derivatives market in EMEs is about 12% of the global market.11 Remsperger (2007) puts the size of the derivatives market turnover at one tenth of the global derivatives market.
These figures also show that hedging opportunities in EMEs are concentrated in foreign exchange risk. Contrary to what is observed in more mature markets, foreign exchange contracts make up more than 80% of OTC derivatives market trading in EMEs. That the need for hedging of foreign exchange risk is high in EMEs rests on good macroeconomic and financial grounds.
7 Notional amounts outstanding are not a good measure for the amount of risk traded. The low level and
volatility of interest rates determines a reduced value of risk traded. Gross market values (the sum of the market value of all positions) were $11 trillion as of June 2007. See BIS (2007b), Table C5 on page 21.
8 The notional outstanding amount of exchange-traded derivatives stood at $96 trillion. 9 See BIS (2007b), page 20. 10 This includes an estimate of $193 billion in transactions that were not fully reported in the Triennial Survey. 11 This calculation may overestimate the size of the OTC derivatives market in EMEs. The figures shown in
Table 2 do not net out the transactions that might take place between residents in two emerging market economies. The total amount of the transactions between EMEs that have not been netted out is $120 billion, so the overestimation could be as high as 23%. Daily average trading in OTC derivatives market in the world was $4,004 billion in 2007.

BIS Papers No 44 75
Table 2
Geographical distribution of reported OTC derivatives market activity1
Daily average turnover, in billions of US dollars
Total Foreign exchange2 Interest rate3
2001 2004 2007 2001 2004 2007 2001 2004 2007
Emerging Asia 137 207 438 130 183 355 6 24 83 China … … 1 … … 1 … … ... Hong Kong SAR 52 82 160 49 70 143 3 11 17 India 2 4 27 2 3 24 0 1 3 Indonesia 1 1 1 1 1 1 0 0 0 Korea 4 11 23 4 10 18 0 1 5 Malaysia 1 1 2 1 1 2 0 0 0 Philippines 1 0 1 1 0 1 0 0 0 Singapore 73 100 210 69 91 153 3 9 57 Taiwan (China) 2 6 8 2 5 7 0 2 1 Thailand 1 2 5 1 2 5 0 0 0
Latin America 8 9 18 7 7 15 0 2 3 Argentina … … 0 … … 0 … … ... Brazil 2 2 1 2 1 1 0 1 0 Chile 1 1 2 1 1 2 0 0 0 Colombia 0 0 1 0 0 1 0 … 0 Mexico 5 6 14 4 5 11 0 1 3 Peru 0 0 0 0 0 0 0 … 0
Central Europe 5 10 19 4 8 16 1 2 5 Czech Republic 1 2 4 1 1 4 0 1 1 Hungary 0 2 5 0 2 5 0 0 1 Poland4 4 6 10 3 5 7 1 1 3
Israel 0 2 5 0 2 5 0 … ... Russia 0 6 16 0 6 16 0 … ... Saudi Arabia 1 1 2 1 1 2 0 0 0 South Africa 8 11 15 8 8 11 1 3 4 Turkey 1 2 3 1 2 3 0 0 0
Total 160 248 516 151 217 423 8 31 95 1 Adjusted for local double-counting (“net-gross”). 2 Including outright forwards and foreign exchange swaps. 3 Single currency contracts only. 4 Revised for 2001.
Source: 2007 Triennial Central Bank Survey.
There are several reasons why foreign exchange risk has traditionally been a prominent source of market risk in financial markets in EMEs. First, macroeconomic instability and external vulnerabilities have caused EMEs to suffer a disproportionate number of episodes of balance of payment crises. Successes in economic stabilisation and the reduction of

76 BIS Papers No 44
vulnerabilities have recently lowered the probability of such a crisis.12 Second, structural reforms and trade liberalisation have contributed to trade and financial integration, and exchange rate volatility has gained importance in determining market risk.13 Third, foreign exchange controls – and capital controls – have lost relative importance although they still remain in place in several economies. Fourth, governments have drifted away from fixed exchange rates, allowing for a more flexible exchange rate regime.
There are also financial grounds for foreign exchange risk being of particular concern in EMEs. Financial assets issued by EMEs have become part of international investors’ portfolios. Since 2002 pension funds in the United States and other advanced economies have sought to increase their investments abroad and many EMEs have been the main beneficiaries.
Table 3, for example, shows the changes observed in the balance sheet of a large pension fund in the United States. The exposure to foreign securities has risen fast, and investments in EMEs have been the main source of the added exposure: between 2006 and 2007, almost 90% of the increased exposure to foreign securities was in EME currencies. More generally, investments from equity and bond funds in advanced economies also recorded increased allocations to bonds and equities issued by EMEs.
Table 3
California employees pension fund (CalPERS) In billions of US dollars
2000 2003 2006 20071
Total assets 172.2 144.8 208.2 247.7
Foreign securities … … 52.0 59.8 Equity 26.9 27.6 44.2 52.6 Bonds … … 5.5 7.2 Emerging market currencies 6.2 Hong Kong dollar 1.0 Korean won 1.0 Taiwan dollar 0.8 South African rand 0.6 Brazilian real 0.5 Singapore dollar 0.4 Mexican peso 0.3 Indian rupee 0.3 1 At 30 September.
Source: CalPERS financial statements.
12 See Rossini et al (2008) for how political uncertainty affects the volatility in the forward market. 13 Until 2002, the domestic futures and options markets in Argentina were basically limited to agricultural
commodities. However, the abandonment of the currency board in 2002 and the adoption of a flexible exchange and monetary system required instruments for hedging against risks (Central Bank of Argentina (2008)).

BIS Papers No 44 77
The growing investment of foreign investors in EME financial markets provides another reason for concern about FX risk in EME currencies.14 Buying foreign securities denominated in local currency brings new risks to the purchasers. The volatility of returns on the new securities is generally higher and depends in part on changes in the exchange rate. Investors might like to shy away from some of these risks, and derivatives are a useful tool for this purpose. Overlay currency strategies provide an example. This investment strategy seeks to manage the exchange rate risk in an investment portfolio through the creation of a synthetic portfolio made up of FX derivatives. This strategy was developed in the second half of the 1990s to deal with the growing exchange rate risk exposure of large US pension funds. During the 1980s, pension funds in the United States started to overtake other market participants in asset growth, and their returns became more correlated with the market. In response to this implied increase in the market risk of their domestic portfolio, many pension funds sought to diversify through investment in EME liabilities denominated in domestic currency.
There is also a presumption that trading in derivatives markets in EMEs might rise in response to increased demand from residents. Financial market deepening and wealth creation are pushing greater financial integration and residents of EMEs are broadening their portfolio holdings of foreign securities. Desormeaux et al (2008) describe how the growth in pension funds has offered opportunities for the deepening of the OTC derivatives market in Chile.15
Dealers and other financial institutions account for the largest share of the OTC derivatives markets in EMEs. In particular, cross-border trading between dealers has a clear dominant position in OTC derivatives markets in central and eastern European economies, Hong Kong SAR and Singapore, as well as Taiwan (China), Mexico and South Africa.16
The non-financial corporate sector has a relatively greater share of more complex and long-lived FX derivatives. There are many opportunities for the use of FX derivatives to increase among the corporate non-financial sector in many EMEs. However, even in advanced economies the corporate non-financial sector does not hedge a great deal of the risks in their balance sheet in the derivatives market.
The local derivatives market for foreign exchange risk is also affected by the amount of trading that takes place in the local currency in offshore markets. The volume of trading in EME currencies in world markets exceeds the local trading in the case of many countries. The channels of communication between onshore and offshore derivatives markets are very fluid. In the absence of capital controls, arbitrage leads to efficiency in pricing with similar prices in both markets. In a sense, onshore and offshore markets can complement each other in accommodating the changes in demand and supply for hedge.
Interest derivatives are not as well known in EMEs. These contracts in the global derivatives market have a share roughly similar to that of FX derivative products.17 In contrast, the market share of OTC interest rate contracts in EMEs is just 18%. Remsperger (2007) also makes this point. There seem to be only two large economies among EMEs – Brazil and Korea – where exchange-traded derivatives, especially interest rate or government bond futures, have a dominant position in the derivatives markets (CGFS (2007)).
14 The presence of foreigners helps in the development of derivatives market, as in the case of Poland (see
Pruski and Szpunar (2008)). 15 On the issue of pension funds in EMEs, see the accompanying note “Pension systems in EMEs: implications
for capital flows and financial asset markets”. 16 See BIS (2007b), Table E27. 17 See BIS (2007b), Table C1.

78 BIS Papers No 44
Hedging foreign exchange risk in EMEs Foreign exchange hedging opportunities have grown pari passu with the increased demand. The pace of change has not been uniform across EMEs, with markets developing faster in some economies than others. Table 2 shows that Hong Kong SAR and Singapore have the lion’s share – about 60% – of OTC FX derivatives activity in EMEs. The next five economies – India, Korea, Mexico, Russia and South Africa – have a combined share of only 15%.
Table 4
Foreign exchange turnover1
Daily average turnover in April 2007, in billions of US dollars
OTC derivatives turnover
Spot Total Outright
forwards FX
swaps Currency
swaps Options
Emerging Asia China 8.3 0.9 0.0 0.9 0.0 0.0 Hong Kong SAR 37.9 143.0 14.7 122.0 0.6 5.7 India 14.3 24.0 6.3 13.4 0.5 3.8 Indonesia 1.7 1.4 0.5 0.6 0.1 0.1 Korea 17.4 17.8 5.1 10.8 1.2 0.6 Malaysia 1.7 1.8 0.4 1.4 0.0 0.0 Philippines 1.1 1.3 0.2 1.0 0.0 0.0 Singapore 89.2 152.5 25.2 116.1 1.2 10.1 Taiwan (China) 8.8 6.7 1.7 4.0 0.1 0.9 Thailand 1.4 4.9 0.7 4.1 0.1 0.0
Latin America Argentina 1.1 0.0 0.0 0.0 0.0 0.0 Brazil 5.1 0.7 0.3 0.0 0.3 0.0 Chile 2.0 2.0 1.5 0.4 0.0 0.0 Colombia 1.3 0.6 0.5 0.1 0.0 0.0 Mexico 4.5 10.8 0.4 10.2 0.0 0.1 Peru 0.6 0.2 0.2 0.0 0.0 0.0
Central Europe Czech Republic 1.4 3.6 0.9 2.7 0.0 0.1 Hungary 2.2 4.7 0.2 4.3 0.0 0.1 Poland4 2.4 6.8 0.5 5.9 0.1 0.3
Israel 3.5 4.8 0.0 4.4 0.0 0.4 Russia 34.0 16.2 1.1 15.1 0.0 0.0 Saudi Arabia 2.7 1.8 0.1 1.3 0.3 0.1 South Africa 3.4 10.6 0.9 9.5 0.0 0.1 Turkey 0.8 3.3 0.7 1.9 0.6 0.2
Total 247.0 420.4 62.2 330.3 5.1 22.8 1 Adjusted for local inter-dealer double-counting (ie “net-gross” basis). Data may differ slightly from national survey data owing to differences in aggregation procedures and rounding.
Source: 2007 Triennial Central Bank Survey.

BIS Papers No 44 79
FX derivatives markets have developed faster in economies where the spot market has gained depth (Table 4) and where pricing is more efficient. Singapore and Hong Kong have particularly large and liquid spot markets. Spot markets have expanded rapidly in several EMEs. In the last three years, trading in EME currencies in the spot market grew at almost 18% annually. Trading in spot markets grew even faster in countries with relatively deep spot markets, such as in Singapore (28% annual), India (61%), Hungary (47%) and Brazil (25%), and among countries with shallower markets, like China (139%) and the Philippines (47%).
Efficient spot markets are indispensable for market-makers and financial intermediaries that wish to hedge exposures arising from their activities in the derivatives market. In efficient FX spot markets, market demand and supply for foreign exchange determine market dynamics. Market failures due to the exercise of monopoly power or government interference can not only alter market dynamics but can hinder the development of spot and derivatives markets as well.
Two other trends should be noted. First, the banking sector is the biggest user of OTC derivatives and keeps the largest open position in most EMEs. Its net position is generally concentrated in foreign exchange swaps, the most significant OTC derivative product in EMEs. Second, other OTC FX derivatives are beginning to develop in response to increased demand from other sectors in the economy.
The central role of foreign exchange swaps Foreign exchange swaps dominate the OTC derivatives market in EMEs. Their market share in many EMEs is extremely high: 80% or more of the average daily transactions. FX swaps dominate the OTC derivatives market in Hong Kong, Hungary, Mexico, Poland, Singapore and South Africa, all countries that have a high level of financial integration. Foreign banks and other foreign financial intermediaries have a relatively large market share in financial markets in these jurisdictions.
One explanation for pre-eminence of the foreign exchange swap in the EME derivatives market is its widespread use for funding financial market operations in the domestic financial market instead of the money market. Because many foreign investors do not have access to the money market, they obtain the local currency through a foreign exchange swap. The high proportion of foreign exchange swaps that are written cross-border and at a maturity of one week or less supports this assertion.18
There are a few implications from this market development. First, the spot sale of FX and the simultaneous FX forward purchase suggest that financial inflows are hedged. Perhaps “carry trades” are less common than sometimes thought. It is also unlikely that changes in the exchange rate are due to changes in the “technical position” or the dynamics of the foreign exchange markets. This does not preclude the possibility that shocks to the exchange rate have implications for the economy.
Second, foreign exchange swaps are a cost-efficient way to fund financial market operations across jurisdictions. To keep a balance sheet in different jurisdictions that grants access to the money market/interbank market raises the cost of trading. In bond and credit markets where margins are relatively narrow, this can have a big impact. Even if a financial institution keeps a balance sheet in a jurisdiction, there is an agency problem arising from the decentralised managerial structure of international banks’ business that the foreign currency swap helps to overcome. The manager of the local balance sheet would like to charge the marginal cost of funding to the unit carrying out the investment. The internal trading unit
18 See BIS (2007), Tables E20 and Table C1.

80 BIS Papers No 44
carrying out the investment might get a cheaper funding in another jurisdiction or even locally.
Other OTC FX derivatives Forwards are important in several EMEs and available in many more. They are sometimes considered not to be a derivative instrument because settlement might involve the actual delivery of the foreign exchange. Indeed, it is most often the case that the transaction is settled in cash. The main reason is that market participants seek to hedge market risk through the forward contract – eg the risk that the exchange rate fluctuates – without increasing their exposure to credit risk (eg counterparty risk).
Forwards have a dominant market position in Korea and Taiwan. In Korea, a very deep market for interest rates futures contracts (see more below) provides an important vehicle for investing or a source of funding for investors in the domestic financial markets. CGFS (2007) found that investors might prefer to gain exposure to interest rates because of taxation considerations. In the case of foreign investors, the outright forwards provide a hedge for part or even the whole of their exchange rate risk. Forward markets are liquid in only a handful of jurisdictions, eg India, Hong Kong, Singapore, Chile; Russia and South Africa. Most trading activity takes place cross-border between banks and other financial institutions. Contracts with a maturity of up to one year but not less than seven days have the largest market share, well ahead of any other segment.19
Currency swaps have a small market share in the OTC FX derivatives market in EMEs.20 The figures available show that they are generally traded between two dealers or financial institutions in cross-border deals.21 One reason may be that FX swaps offer a superior solution to the hedging needs of market participants. In India, a country where the product has a relatively high share in the OTC derivatives market, a large share of currency swaps are undertaken on behalf of the corporate sector. Other countries with relatively high trading volumes are Korea and, to some extent, Brazil. In general, these are jurisdictions where the banking sector is relatively large and investors face some regulatory hurdles in gaining access to the foreign exchange market.
FX options have relatively large trading volumes in Singapore, Hong Kong and India.22 In Singapore it is a relatively concentrated market, made up predominantly of market dealers; about half of their trades are cross-border. In Hong Kong and India, the volume of FX options traded is about half those in Singapore, and a larger percentage is traded with non-financial customers in the country. There is also a relatively large volume traded cross-border between market-makers. India is also a jurisdiction with a high turnover in FX options, most of it to satisfy the demands of non-financial customers.
Offshore and onshore trading in FX derivatives Hedging opportunities for exchange rate risk are not restricted to domestic derivatives markets. Table 5 shows an estimate of the offshore OTC FX derivatives trading in EME currencies. A strikingly large share of transactions does not involve a counterparty in the
19 See BIS (2007), Table E20. 20 The currency swap should not be confused with a foreign exchange swap. Currency swaps are contracts
where the parties exchange payments over a period of years in two different currencies. They are cross-market trades: the interest rates are those that prevail in the money market of each currency. Foreign exchange swaps are a combination of spot and forward transactions in the same currency market.
21 See BIS (2007), Table E28. 22 See BIS (2007), Table E29.

BIS Papers No 44 81
domestic market. Offshore trading is concentrated in the forward market and in options. For forwards, this reflects the well developed offshore non-deliverable forward (NDF) market (CGFS (2007)). The offshore market in options is a by-product of the relative sophistication of such products – they are relatively complex to use – as well as the “niche” character of those providing the supply.
Table 5
OTC foreign exchange derivatives turnover by currency offshore ratio1 Daily average in April 2007, in billions of US dollars
Total Outright forwards FX swaps Currency
swaps Options
Emerging Asia Chinese renminbi 84.4 99.1 16.4 … … Hong Kong dollar 9.1 65.0 … 38.3 86.5 Indian rupee 29.8 59.3 2.6 3.5 34.9 Indonesian rupiah 53.9 75.1 13.0 31.1 49.5 Korean won 33.9 49.9 3.1 10.5 80.2 Malaysian ringgit 44.6 77.5 1.8 0.0 87.8 Philippine peso 46.2 82.9 5.5 12.4 92.5 Singapore dollar 41.9 72.6 38.6 72.9 33.9 New Taiwan dollar 63.6 81.4 9.1 16.3 61.3 Thai baht 25.7 28.2 25.2 4.0 41.5
Latin America Argentine peso 49.3 29.5 … … … Brazilian real 92.5 95.5 91.7 13.1 97.7 Chilean peso … … 0.3 … 98.5 Colombian peso … … … … 15.1 Mexican peso 62.7 91.5 48.7 95.4 97.0 Peruvian new sol … … … … …
Central Europe Czech koruna 49.0 45.8 48.3 79.3 76.7 Hungarian forint 47.5 91.5 31.9 99.5 75.8 Polish zloty 74.0 82.7 73.0 66.9 67.5
Israeli new shekel 8.9 … 9.7 … 0.4 Russian rouble 8.5 19.3 5.0 … 85.5 Saudi riyal 3.8 59.4 1.6 … … South African rand 66.0 79.2 61.1 92.8 95.2 Turkish lira 25.7 9.3 13.7 … 83.4
Total 39.8 71.6 26.0 28.4 77.8 1 OTC foreign exchange derivatives turnover in any country minus turnover in the country of the currency as a percentage of the total in any country.
Source: 2007 Triennial Central Bank Survey.
Two points about offshore derivatives markets deserve mention. First, there is a high degree of communication between the domestic and offshore markets in many economies. Some participants in the global NDF market keep close ties with participants in the domestic

82 BIS Papers No 44
forward market. As pointed out in the analysis of the domestic forward market above, cross-border trades represent a large proportion of all trades in the domestic forward market (see section on “Other OTC FX derivatives”). Second, the NDF market distributes its hedging products to global investors. This may involve some leverage of positions to the extent that participants in offshore market keep open positions. The nature of the final demand for NDF is important in this regard. Some observers fear that the availability of derivatives markets increases opportunities for speculation against emerging market currencies (Dodd (2001)). However, as has already been shown, the holdings of EME securities in international investors’ portfolios have grown and are the source of an increased demand for FX hedging instruments.
The examples of Hong Kong and Singapore also indicate that the development of the derivatives markets does not mean that such markets will be restricted to advanced economies. Moreover, there is a significant share of transactions in both places that does not involve trading in domestic financial assets. In Singapore, less than one tenth of FX transactions involve the local currency. In Hong Kong, about half of the FX transactions involve the local currency. Some of the trading in other currencies also involves other EM currencies.
Hedging interest rate risk The OTC derivatives market for hedging interest risk is rather underdeveloped in EMEs (Table 6) and is concentrated predominantly in interest rate swaps. Interest rate swaps are contracts whereby the counterparties agree to exchange payments of interest that are determined by two different interest rates, usually one fixed and another floating. Another interest rate derivative is the forward rate agreement (FRA). In an FRA, the parties to the contract agree to an interest rate for payments in the future. These products are ideal for managing interest rate risk arising from business. Financial intermediaries are their main users.
Interest rate derivatives have expanded over the years, but remain notably small. One explanation is that interest rate risk is still relatively low in EMEs. Financial markets have grown but remain relatively small in terms of the size of the overall economy. Moreover, interest rate risk remains with the banking sector, the main lender in EMEs, which can easily manage interest rate risk in its funding needs. Another possible explanation resides in the level of real interest rates: while nominal interest rates have fallen sharply in EMEs, real interest rates are comparatively high but also less volatile. In this way, they may compensate financial intermediaries for the high-risk stake.
Trading volumes are very low in most currencies, with the exceptions of contracts denominated in the Hong Kong dollar and the Mexican peso.23 Instruments denominated in the Korean won, Indian rupee and Singapore dollar have a somewhat high trading volume, but still less than the previous two markets. While interest rate swaps dominate the derivatives market in most of these economies, the FRA is the dominant instrument for interest rate hedging in central European economies.
The OTC interest rate swap stronghold in the Korean won is worth mentioning. Korea has successfully developed an exchange-traded 10-year government bond future contract. More recently, a future on a short-maturity bond has started trading. It is clear that the banking sector has been the main player in the government bond futures market and has made use
23 Virtually non-existent in the late 1990s, exposure to Mexican interest rates is now possible, with liquid swaps
up to 10 years and transactions up to 20 years becoming more common. Many foreign participants favour this market because of its high liquidity and flexibility (Bank of Mexico, 2008).

BIS Papers No 44 83
of its competitive advantage. It trades most swap contracts cross-border at maturities of less than one year.
Table 6
Reported interest rate turnover in OTC derivatives markets by currency1 Daily average in April, in billions of US dollars
Of which Total
FRAs Swaps
April 2001
April 2004
April 2007
April 2001
April 2004
April 2007
April 2001
April 2004
April 2007
Emerging Asia 1.86 8.23 22.93 0.47 1.12 0.65 1.38 6.50 19.57Chinese renminbi … … 0.18 … … – … … 0.15Hong Kong dollar 1.45 4.35 9.19 0.42 0.07 0.05 1.03 3.82 8.78Indian rupee 0.03 0.42 3.49 0.00 0.02 – 0.03 0.40 3.33Indonesian rupiah 0.00 0.01 0.02 … 0.00 – 0.00 0.01 0.02Korean won 0.04 0.34 4.80 … … 0.25 0.04 0.30 3.94Malaysian ringgit 0.00 0.03 0.27 0.00 … – 0.00 0.03 0.17Philippine peso … 0.00 0.00 … … – … 0.00 0.00Singapore dollar 0.32 2.68 3.69 0.05 1.02 0.35 0.27 1.59 2.29New Taiwan dollar 0.02 0.40 1.28 0.00 … – 0.02 0.35 0.89
Latin America 0.43 2.61 7.06 0.17 0.71 0.16 0.25 1.90 6.38Argentine peso … … – … … – … … –Brazilian real 0.18 0.85 1.75 0.01 0.11 – 0.15 0.74 1.74Chilean peso … … 0.00 … … – … … 0.00Colombian peso … … 0.00 … … 0.00 … … 0.00Mexican peso 0.26 1.76 5.31 0.16 0.61 0.16 0.09 1.16 4.63Peruvian new sol … … 0.00 … … 0.00 … … 0.00
Central Europe 0.35 0.97 3.64 0.30 0.73 2.22 0.05 0.23 1.41Czech koruna 0.10 0.24 0.56 0.07 0.23 0.39 0.03 0.01 0.17Hungarian forint 0.00 0.10 1.22 0.00 0.06 0.89 … 0.04 0.33Polish zloty 0.25 0.63 1.85 0.23 0.45 0.94 0.02 0.18 0.90
Israeli new shekel … … 0.00 … … – … … 0.00Russian rouble … … 0.02 … … – … … 0.02Saudi riyal 0.03 0.02 0.04 0.00 0.00 0.00 0.03 0.01 0.04South African rand 0.40 1.56 1.66 0.32 1.08 0.74 0.07 0.42 0.27Turkish lira … … 0.04 … … – … … 0.00
Total 3.08 13.39 35.40 1.26 3.65 3.77 1.78 9.06 27.691 Adjusted for local and cross-border double-counting. Single currency contracts only.
Source: 2007 Triennial Central Bank Survey.

84 BIS Papers No 44
Hedging credit risk Several products are available for investors to manage their exposure to credit risk in EMEs.24 Credit default swaps (CDS) are the most prominent financial products for the purpose of managing credit risk in EMEs (see Dages et al (2005)). In part, this reflects a global trend in financial markets: the CDS market has been one of the fastest growing global financial markets in recent years. According to the Triennial Survey, CDS made up 88% of the credit derivatives in global positions of OTC markets as of June 2007, and had been the fastest growing segment of the credit derivatives market (BIS 2007b). The notional value of global OTC credit derivatives positions was then $51 trillion, up from $4.5 trillion at the time of the previous survey in 2004. CDS in global markets are also concentrated in single names.
In a credit default swap, the seller commits herself to repay an obligation (eg bond) underlying the contract at par in the event of a default. For producing this guarantee, a regular premium is paid by the buyer. The simple structure and flexible conditions of the CDS contract make it an efficient financial instrument for managing credit risk. This also explains, in part, its rapid growth and pre-eminent position in the global capital markets. The contract flexibility is based on several features. First, the contract structure allows any obligation with a certain cash flow to be used as the underlying asset. This is usually defined as the referenced entity and can encompass loans or bonds issued by corporations, financial institutions or governments (usually referred to as sovereigns); it can also extend to a portfolio of referenced entities. In the latter case, the buyer can seek cover against any combination of default events or loss-given-default that he might want to avoid.
Single-name CDS account for about three fifths of the global positions in the market. While most CDS have been arranged on corporate entities in global capital markets, the market value issued out of EMEs is concentrated in sovereign entities (Packer and Suthiphongchai (2003)).25 Consistent with the predominant share of corporate entities in CDS markets in the global financial markets, the average maturity of CDS is five years (not far from the most frequent duration for corporate bonds). In the case of EMEs, the most liquid tranche of the market is around five years, but there is also a market up to 10 years.
Four crucial characteristics of the contract are its legal structure, settlement, liquidity and valuation. The legal structure involves two issues: legal framework and event definition. The CDS market in EMEs is structured on global/international bonds and is not written with reference to domestic bonds. Therefore, the legal provisions are in general alien to the legal systems of EMEs. The second legal issue is the definition of a default event. When such an event occurs, the seller buys the bond at par and the buyer stops making payments. An important issue has been the development of standard documentation, which has helped to deepen the market26 and has also been important in defining a credit event. Until 2002, credit events comprised: (i) bankruptcy, (ii) obligation acceleration, (iii) obligation default, (iv) failure to pay, (v) repudiation or moratorium and (vi) restructuring. Owing to the Argentine government’s protracted credit deterioration in 2001, which included two attempts to restructure its outstanding debt, restructuring was eliminated as a trigger for the contract. Since then, a “credit event” has been considered to be related solely to a lack of service of the debt. It is often argued that the relatively smooth settlement of contracts in the wake of
24 Firms might also seek to unload some components of the economic risks, in particular those associated with
their counterparties failing or government action that might cause economic losses related to their operations in EMEs. However, this section will concentrate on the case of financial investors.
25 Packer and Suthiphongchai (2003) also note that many CDS in EMEs are issued on obligations from quasi-sovereign entities such as state owned companies or financial institutions.
26 The standard contract is produced by the International Swaps and Derivatives Association. See www.isda.org.

BIS Papers No 44 85
the Argentine government debt default raised the standing of the CDS as an adequate way of managing risk exposures in EMEs.
Settlement is conceptually a straightforward operation in any CDS. Yet, given the reality of a multibillion OTC market, a few cases have arisen of a bilateral fast build-up in exposures. In exchange-traded contracts, margins limit leverage and overall exposures. There have been attempts to try to introduce netting between market-makers in OTC markets, and to mitigate the problem by having meetings between market-makers to exchange information. Ledrut and Upper (2007) provide a summary of these initiatives. Indeed, the relative concentration of the market in the hands of a few dealers might be motivated by the difficulties in keeping such exposures under control.
The issue of valuation is related to the previous point. OTC markets permit market-makers to tailor contracts to clients’ needs. In doing so, contract heterogeneity becomes greater due to heterogeneity in demand. In the case of CDS contracts, the main issue is the bond incorporated in the contract. In general, issuers can keep different bonds outstanding and the option to fulfil the contract with any bond (“cheapest to deliver”) which contributes to the liquidity of derivative products.
Conclusions
This note has examined the development of hedging instruments in EMEs over the last decade. Of all such markets, the FX derivatives market is the most important and most developed in EMEs. The demand for hedging in the FX market is driven by investors’ desire to invest in emerging market bonds and equities. FX derivatives markets are most developed in countries with deep and efficient spot markets (eg Hong Kong and Singapore). However, they have also developed in some other EMEs (namely Brazil, India, Korea, Mexico, Russia and South Africa). The banking sector is the biggest user of OTC derivatives in EMEs. Among FX derivatives, FX swaps dominate the OTC derivatives market in EMEs as they enable foreign investors to access the local money market. FX forwards are dominant in Korea and Taiwan and are fairly liquid in a few other EMEs (eg Chile, Hong Kong, India, Russia, Singapore and South Africa). Currency swaps constitute a very small share of FX derivatives and are traded mainly in Brazil and Korea. FX options have relatively large trading volumes in Hong Kong, India and Singapore. Offshore trading of many EME currencies is quite significant, with NDFs and options being the main hedging instruments traded in this way.
While the FX derivatives market is quite developed in EMEs, the OTC derivatives market for hedging interest rate risk is rather underdeveloped and mostly concentrated in interest rate swaps. Some reasons for their underdevelopment may include the low level of interest rate risk, which in any event mostly resides with the banking sector and can be handled in other ways. CDS provide a hedge against credit risk, but for EMEs they are mostly concentrated on sovereign entities instead of corporations.
The benefits of hedging exchange rate risks with derivative products come at the price of some risks. In the absence of derivatives markets, speculative attacks channelled through the spot markets can be resisted by the central banks, provided they have sufficient reserves and a banking sector strong enough to withstand high interest rates. However, with derivatives markets, speculators can take virtually unlimited positions in forward and swap markets and reduce the effectiveness of central bank’s intervention (Dodd (2001). Furthermore, as markets become one-sided, dynamic hedging in the derivatives market can amplify market movements. Authorities should bear these risks in mind, even while fostering the development of the derivatives market (Chan-Lau (2005)).

86 BIS Papers No 44
Annex I
Table A1
Domestic bonds and notes Amounts outstanding – developing countries, in billions of US dollars
1998 2000 2006 2007 Q3
Latin America 228.1 260.8 521.4 660.4 Argentina 36.7 41.9 63.7 62.3 Brazil 111.8 89.6 157.1 261.7 Chile 32.3 32.1 35.8 39.6 Colombia 2.1 4.6 6.4 6.8 Mexico 42.4 80.2 242.9 271.1 Peru 2.6 5.8 10.5 14.3 Venezuela 0.3 6.6 5.1 4.6
Asia 679.0 957.4 2,508.3 2,926.2 China 125.1 202.3 735.8 945.4 Hong Kong SAR 10.7 14.7 24.9 26.3 India 80.8 107.9 282.8 359.8 Indonesia 1.8 47.3 53.1 60.7 Malaysia 41.4 64.0 116.4 128.5 Pakistan 14.9 14.8 19.4 20.8 Philippines 10.5 11.5 31.4 36.2 Singapore 18.7 25.5 49.2 55.3 South Korea 299.7 371.3 924.2 999.8 Taiwan, China 51.5 68.7 167.6 167.4 Thailand 23.8 29.4 103.6 125.9
Central Europe 43.8 54.2 225.9 261.0 Croatia 2.1 1.9 6.3 7.2 Czech Republic 5.8 7.1 42.0 50.9 Hungary 12.7 13.6 50.0 58.3 Poland 20.7 29.6 114.3 129.3 Slovakia 2.5 2.0 13.3 15.4
Others 93.8 114.8 304.9 354.0 Russia 7.5 7.7 33.3 41.4 South Africa 67.4 55.5 97.2 101.3 Turkey 19.0 51.6 174.4 211.4
Total 1,044.7 1,387.2 3,560.6 4,201.7
Sources: Various national sources, eg central banks, national statistical offices, securities registers.

BIS Papers No 44 87
References
Bank of Mexico (2008): “The impact of international financial integration on Mexican financial markets”, paper prepared for the Deputy Governors’ Meeting on “Capital flows and financial assets in emerging markets: determinants, consequences and challenges for central banks”, Basel, 31 January–1 February.
BIS (2007a): 77th Annual Report.
BIS (2007b): “Foreign exchange and derivatives market activity”, Triennial Central Bank Survey, December, www.bis.org/publ/rpfxf07t.pdf?noframes=1.
Central Bank of Argentina (2008): “Argentine experience on capital flows during the last decade”, paper prepared for the Deputy Governors’ Meeting on “Capital flows and financial assets in emerging markets: determinants, consequences and challenges for central banks”, Basel, 31 January–1 February.
Cerra, V and S C Saxena (2008): “Growth dynamics: the myth of economic recovery”, American Economic Review, vol 98, no 1, pp 439–57, March.
Chan-Lau, J (2005): “Hedging foreign exchange risk in Chile: markets and instruments”, IMF Working Paper, WP/05/37.
CGFS (2007): “Financial stability and local currency bond markets”, CGFS Publications, no 28.
Dages, G B, D Palmer and S Turney (2005): “An overview of the emerging market credit derivatives market”, Federal Reserve Bank of New York, mimeo, May, www.bis.org/publ/cgfs22fedny4.pdf.
Desormeaux J J, K Fernández D and P García S (2008): “Financial implications of capital outflows in Chile: 1998–2008”, this volume.
Dodd, R (2001): “The role of derivatives in the East Asian financial crisis”, Special Policy Report 1, Derivatives Study Center.
Ledrut, E and C Upper (2007): “Changing post-trading arrangements in OTC derivatives”, BIS Quarterly Review, December, http://www.bis.org/publ/qtrpdf/r_qt0712i.pdf.
Kaminsky, G and C Reinhart (1999): “The twin crises: the causes of banking and balance-of-payments problems”, American Economic Review, June, pp 473–500.
Kohn, M (2004): Financial institutions and markets, second edition, Oxford University Press.
Packer, F and C Suthiphongchai (2003): “Sovereign credit default swaps”, BIS Quarterly Review, December, www.bis.org/publ/qtrpdf/r_qt0312g.pdf.
Pruski, J and P Szpunar (2008): “Capital flows and their implications for monetary and financial stability: the experience of Poland”, this volume.
Remsperger, H (2007): “Developing bond markets in emerging market economies: conclusions and political recommendations”, speech delivered at the High-Level Workshop “Developing bond markets in emerging market economies”, Deutsche Bundesbank (Eurosystem), Frankfurt, 10 May.
Rossini, R, Z Quispe and R Gondo (2008): “Macroeconomic implications of capital inflows: Peru 1991–2007”, this volume.
Tirole, J (2006): The theory of corporate finance, Princeton University Press.


BIS Papers No 44 89
Capital flows, economic performance and economic policy: Argentina’s experience during the last decade
Miguel Angel Pesce
1. From the mid-1970s to the end of the 1990s, Argentina showed a strong dependence on foreign savings. As a result, frequent shifts in financial capital flows have had a huge impact in terms of macroeconomic volatility, characterised by stop-and-go processes. This situation has worsened over the last 20 years due to different changes both in the size and direction of financial capital flows which, in turn, caused huge changes in the levels of activity, output and employment, and the financial sector as well. During this period, capital flows in international financial markets recorded procyclical fluctuations with large inflows at peak periods and abrupt outflows in the phase of recession.
The last recession in Argentina, which started in the second half of 1998 and lasted until the second half of 2002, and the abandonment of the convertibility system in early 2002 were the most recent episodes in which capital flow fluctuations had a particularly severe impact on economic performance. For this reason and as one of its economic pillars, from 2002 onwards economic policy has focused on stabilising the foreign exchange market and addressing the problems related to the volatility of short-term financial capital flows. The crisis showed once again that, given the size of international financial capital flows and the low degree of domestic capital and financial deepening, in a highly indebted economy, it was particularly important to implement policies to regulate and manage such flows, as other emerging countries have already been doing.
The impact of capital flows on the Argentine economy from 2001 to 2007 may be summarised as follows: (i) in a context of open capital account movements, there was a strong capital flight in the period prior to the abandonment of the convertibility regime; (ii) at the end of 2001, before the convertibility collapse, regulations on foreign exchange transactions were introduced and then, in early 2002, the peso was devalued, regulatory scheme on the capital account were enlarged and a floating exchange rate regime was introduced. All these factors caused short-term financial capital outflows to begin to decline rapidly during the first months of 2002; (iii) from 2003 to mid-2005, in the wave of larger capital inflows with the economic recovery under way, economic policy, on the one hand, continued to relax strict general regulations on capital outflows introduced during the crisis and, on the other hand, began to strengthen capital account regulations on short-term financial inflows; and (iv) in an international financial framework characterised by high levels of liquidity and low interest rates (that lasted until mid-2007), the economy continued to grow rapidly, as did short-term financial capital inflows.
2. Table 1, Balance of payments, shows the high volatility of capital flows that Argentina faced. It further shows that during 1992–2000 an annual average current account deficit of US$ 9.3 billion was financed by inflows in the capital and financial accounts. That situation changed in 2001, when the US$ 4.5 billion current account deficit could no longer be financed because of a massive reversal in capital inflows and, as a result, international reserves were significantly reduced by US$ 12 billion. During that year, net inflows came only from multilateral organisations (US$ 11.14 billion), particularly the IMF, and were comparable to the reduction of international reserves. This high volatility of capital flows affected the evolution of the real economy: GDP grew by 8.1% in 1997, declined by 4.4% and 10.9% in 2001 and 2002, respectively, and then rebounded to grow by 8.9% and 9.02% in 2003 and 2004.
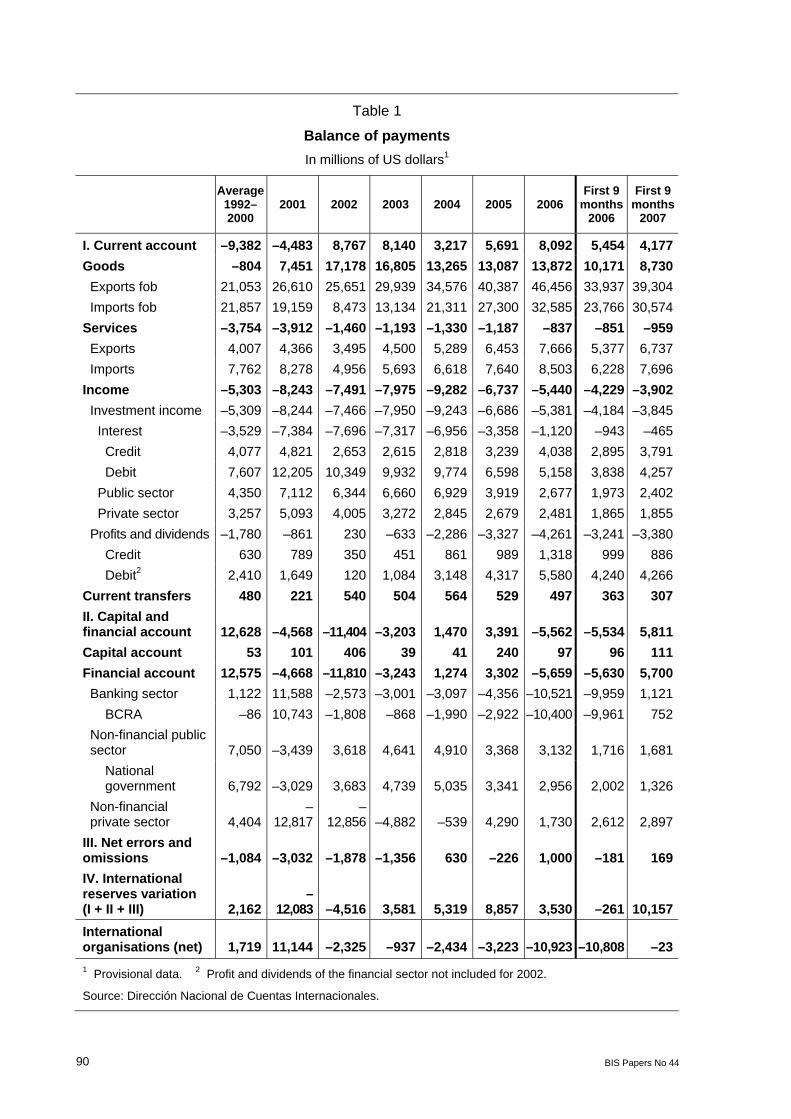
90 BIS Papers No 44
Table 1
Balance of payments In millions of US dollars1
Average 1992–2000
2001 2002 2003 2004 2005 2006 First 9
months 2006
First 9 months
2007
I. Current account –9,382 –4,483 8,767 8,140 3,217 5,691 8,092 5,454 4,177Goods –804 7,451 17,178 16,805 13,265 13,087 13,872 10,171 8,730
Exports fob 21,053 26,610 25,651 29,939 34,576 40,387 46,456 33,937 39,304Imports fob 21,857 19,159 8,473 13,134 21,311 27,300 32,585 23,766 30,574
Services –3,754 –3,912 –1,460 –1,193 –1,330 –1,187 –837 –851 –959Exports 4,007 4,366 3,495 4,500 5,289 6,453 7,666 5,377 6,737Imports 7,762 8,278 4,956 5,693 6,618 7,640 8,503 6,228 7,696
Income –5,303 –8,243 –7,491 –7,975 –9,282 –6,737 –5,440 –4,229 –3,902Investment income –5,309 –8,244 –7,466 –7,950 –9,243 –6,686 –5,381 –4,184 –3,845
Interest –3,529 –7,384 –7,696 –7,317 –6,956 –3,358 –1,120 –943 –465Credit 4,077 4,821 2,653 2,615 2,818 3,239 4,038 2,895 3,791Debit 7,607 12,205 10,349 9,932 9,774 6,598 5,158 3,838 4,257
Public sector 4,350 7,112 6,344 6,660 6,929 3,919 2,677 1,973 2,402Private sector 3,257 5,093 4,005 3,272 2,845 2,679 2,481 1,865 1,855
Profits and dividends –1,780 –861 230 –633 –2,286 –3,327 –4,261 –3,241 –3,380Credit 630 789 350 451 861 989 1,318 999 886Debit2 2,410 1,649 120 1,084 3,148 4,317 5,580 4,240 4,266
Current transfers 480 221 540 504 564 529 497 363 307II. Capital and financial account 12,628 –4,568 –11,404 –3,203 1,470 3,391 –5,562 –5,534 5,811Capital account 53 101 406 39 41 240 97 96 111Financial account 12,575 –4,668 –11,810 –3,243 1,274 3,302 –5,659 –5,630 5,700
Banking sector 1,122 11,588 –2,573 –3,001 –3,097 –4,356 –10,521 –9,959 1,121BCRA –86 10,743 –1,808 –868 –1,990 –2,922 –10,400 –9,961 752
Non-financial public sector 7,050 –3,439 3,618 4,641 4,910 3,368 3,132 1,716 1,681
National government 6,792 –3,029 3,683 4,739 5,035 3,341 2,956 2,002 1,326
Non-financial private sector 4,404
–12,817
–12,856 –4,882 –539 4,290 1,730 2,612 2,897
III. Net errors and omissions –1,084 –3,032 –1,878 –1,356 630 –226 1,000 –181 169IV. International reserves variation (I + II + III) 2,162
–12,083 –4,516 3,581 5,319 8,857 3,530 –261 10,157
International organisations (net) 1,719 11,144 –2,325 –937 –2,434 –3,223 –10,923 –10,808 –231 Provisional data. 2 Profit and dividends of the financial sector not included for 2002.
Source: Dirección Nacional de Cuentas Internacionales.

BIS Papers No 44 91
Since the abandonment of the convertibility regime (a fixed and convertible exchange rate one-to-one to the US dollar), and the peso devaluation that changed relative prices in favour of the tradable goods sector, economic policy has sought to stabilise the foreign exchange market and restore basic macroeconomic equilibria. Thus, in 2002, the drop in international reserves, which plunged to US$ 9 billion, was significantly reduced by an improvement in the current account emerging due, predominantly, to a trade balance surplus. As a result of the economic policy stance, since the third quarter of 2002 onwards the Argentine economy has expanded continuously, with surpluses on its current account and higher international reserves reaching US$ 46 billion in December 2007.
Table 1 also shows trends of different items of the balance of payments both in the period following the collapse of the convertibility regime and during the recovery. The following major changes should be highlighted: (i) unlike the previous decade, from 2002 onwards Argentina has made net payments of US$ 19.8 billion to multilateral organisations; (ii) there was a continuous reduction in the services account deficit, which has also contributed to the current account improvement; (iii) net payments of profits and dividends, which had declined due to the 1998–2002 recession and the implementation of capital regulations in 2002, recovered and reached US$ 4.3 billion in 2006, reflecting the economic recovery and the flexible handling of those capital regulations; (iv) during the period 2002–04, before the conclusion of the Argentine debt swap process, there were high levels of accrued interest that have been paid since 2005; (v) the non-financial private sector reduced financial capital outflows, which amounted to US$ 12 billion during 2001–02, and private capital inflows started to return in 2005.
Table 2, Foreign exchange balance, shows the evolution of the main items with a direct effect on the single free exchange market (MULC) following the abandonment of the convertibility system. Current account surpluses were achieved thanks to a permanent surplus on the trade balance, which has been greater than US$ 10 billion since 2003. In addition, the services item (including, among others, technical and professional assistance, tourism and transport) went from a slightly negative result to a positive one, whereas profits and dividends – as shown in Balance of payments – showed a negative result basically due to the interest payments accrued after the default on the external debt (the table also shows a decrease in interest payments to the IMF after the full repayment in January 2006).
Profits and dividends showed an increasingly negative result due to continuous economic growth. Furthermore, the components of the capital account showed a continuous increase in net income from non-residents as a result of foreign direct investments that reached US$ 1.6 billion in early 2007, twice as much as the amount recorded in 2003. Until 2005 portfolio investment explained the strong financial capital inflows that were later interrupted by the aforementioned implementation of regulatory measures on inflows, particularly on short-term financial inflows. The lines of credit related to international trade have shown a continuous increase with a negative net result until 2005 and a positive result since that year. The IMF and multilateral organisations item clearly shows that from 2003 to 2007 Argentina made net payments of US$ 22 billion.
During the period 2003–05 the domestic demand for foreign currency from the non-financial private sector remained virtually unchanged, reaching US$ 12 billion with a slight upward trend in the next two years. Since July 2007 the international financial markets have been characterised by higher instability. This situation generated a greater domestic demand for foreign assets, which was supplied by the sale of Central Bank foreign reserves in the spot market and Central Bank positions in the futures market. These measures were successful as they decreased the pressure on the foreign exchange market and proved how suitable a policy of precautionary reserve accumulation can be to deal with financial volatility in the absence of a lender of last resort. Foreign asset accumulation inflows were close to US$ 13 billion in 2005, fell to nearly US$ 11.5 billion in 2006 and rose again in 2007.

92 BIS Papers No 44
Table 2 Foreign exchange balance
In millions of US dollars
2003 2004 2005 2006 2007
Total Total Total Total 9 months 9 months
Foreign exchange current account 8,731 10,144 9,313 10,834 8,239 10,302 Goods trade balance 12,595 12,778 12,689 13,303 10,435 12,086 Services –337 –234 341 776 493 701 Income –3,752 –2,756 –4,187 –3,826 –3,110 –3,170
Interest –2,883 –1,914 –2,895 –2,686 –1,931 –1,754 Inflows 247 373 709 1,247 913 1,754 Outflows 3,130 2,288 3,604 3,933 2,844 3,508
Interest payments to the International Monetary Fund 745 572 525 90 86 15 Interest payments to other international agencies 820 543 646 712 583 617 Other interest payments 1,565 1,173 2,433 3,131 2,176 2,876
Profits and dividends and other income –869 –842 –1,292 –1,140 –1,179 –1,416 Inflows 90 89 125 447 61 135 Outflows 959 931 1,416 1,586 1,240 1,551
Other current transfers 225 356 471 580 421 685 Inflows 680 1,034 1,320 1,357 970 1,241 Outflows 455 678 849 777 550 555
Foreign exchange capital and financial account –5,149 –4,825 –465 –7,420 –8,617 –182 Non-resident direct investment 809 976 1,451 1,504 1,031 1,608
Inflows 902 991 1,548 1,526 1,050 1,660 Outflows 93 16 97 23 19 53
Non-resident portfolio investment 509 579 1,125 171 67 58 Inflows 549 657 1,170 213 101 88 Outflows 40 78 45 42 33 30
Financial loans and credit lines –1,184 –1,279 –1,855 1,310 471 2,146 Inflows 1,493 2,491 3,411 6,128 3,509 6,691 Outflows 2,677 3,771 5,266 4,818 3,037 4,545
International Monetary Fund loans –19 –2,050 –3,595 –9,530 –9,530 0 Other international agencies’ loans –1,354 –468 520 –1,415 –1,233 –7 Non-financial private sector foreign asset accumulation –3,808 –2,837 1,206 –2,939 –2,026 –6,088
Inflows 7,735 9,728 12,968 11,427 8,164 10,525 Outflows 11,543 12,565 11,762 14,366 10,190 16,612
Financial sector foreign asset accumulation (GEP) –276 465 –356 51 242 –168 Financial sector securities transactions 0 0 –95 398 230 227 Other public sector transactions (net) –274 –297 640 2,106 1,611 1,469 Other net movements 448 87 493 924 519 574 Changes in international reserves arising from transactions 3,581 5,319 8,847 3,414 –378 10,120 Note: Temporary data. Source: BCRA.

BIS Papers No 44 93
Finally, in the item “Other public sector transactions”, since the Argentine debt swap finished in 2005, financing has been obtained by the Treasury in market operations. As a result, there was a continuous increase in international reserves even in 2006, when Argentina made an early and full repayment of its debt to the IMF.
3. Given the high and persistent macroeconomic volatility experienced by the Argentine economy, the change in economic policy introduced in 2002 sought to generate conditions for achieving sustained economic growth and preventing foreign volatility from passing through to the domestic economy. As shown by other successful cases of economic development, the avoidance of recurring episodes of real exchange rate appreciation, usually followed by sharp nominal devaluations, is considered an essential requirement for the economy to follow the path of sustained development. The policies and measures designed to regulate short-term financial capital flows (both inflows and outflows) and precautionary reserve accumulation should be analysed within this framework. Such regulations are tools of countercyclical policy that cushion the effects of shifts in financial flows over the economic cycle and help to reduce volatility in domestic financial markets.
Higher short-term financial capital inflows give rise, via both domestic credit and aggregate demand expansion, to a process of real exchange rate appreciation, a phenomenon that occurs in emerging economies favoured by a much better export performance and/or terms of trade. In fact, the management of short-term financial capital inflows involves a short-term macroeconomic threat: (i) if exchange rate flexibility is limited, capital inflows may create a sudden rise in domestic credit and in prices of domestic assets, generating demand pressures and inflation (where aggregate supply does not react); (ii) alternatively, if the domestic currency appreciates, the external sector suffers a loss of competitiveness, adversely affecting aggregate demand, the industrial sector and employment.
Argentina’s precautionary reserve accumulation policy that led to an endogenous expansion of monetary aggregates, domestic credit and finally aggregate demand. The policy has been accompanied by a series of direct regulations that were implemented following the abandonment of the convertibility system. First, the aim of such regulations was to discourage short-term speculative financial capital inflows (attracted by appreciation expectations combined with positive interest rate differentials between domestic and foreign financial assets) by imposing a minimum maintenance period for funds channelled to Argentina’s single free exchange market (MULC). In 2002 the Central Bank implemented an exchange regulation by imposing a 90-day floor, later increased to 180 and 365 days by the Ministry of Economy. Subsequently, other regulations of an indirect nature were adopted under Executive Order 616/2005, which required a 30% non-accruing mandatory deposit of financial capital inflows designed to discourage speculative hot money that could eventually lead to future incidents of abrupt outflows.
The regulations in the foreign exchange market were aimed at increasing transparency in the operations and to make sustainable the stabilisation of the MULC in the medium and long term. Additionally, it is important to mention that goods imports may be wholly paid in advance, whether by cash or deferred payment, regardless of the type of good. There are no restrictions whatsoever to the payment abroad of services rendered by nonresidents, regardless of the kind of services (freight, insurance, royalties, technical advice, fees, etc.). Related to income, interest, profits and dividends, access to the Single Free Exchange Market is allowed in order to pay financial sector and nonfinancial private sector interest services.
With the same aim at stabilising medium and long term exchange market, resident individuals and legal entities (as per the definition provided in chapter IV of the IMF's fifth edition of the Balance of Payments Manual) outside the financial sector may access the Single Free Exchange Market to purchase foreign exchange with a monthly ceiling (originally US$ 100, set at US$ 2.000 per month, later increased to US$ 2 million) was imposed on residents’ demand for.000 in cases like: real estate investment abroad, loans to

94 BIS Papers No 44
nonresidents, residents' external direct investment contributions, individuals' portfolio investment abroad, other unspecified residents' investment abroad, legal entities' portfolio investment abroad, foreign currency in order to stabilise the MULC.purchases to be held in the country, mutual fund portfolio investment, mutual fund bill purchases and grants.
4. In January 2002, after 10 years of a currency board, in the middle of foreign exchange and banking crises, one of the main goals of economic policy was to establish a single free exchange market (MULC) aimed at stabilising the foreign exchange market. The first regulations were implemented in November 2001, before the convertibility collapse. With the change of the exchange rate regime and after the devaluation, it became mandatory to convert to domestic currency, through the MULC, 100% of foreign exchange receipts from goods and services exports (FOB, CIF, DDP, EXW, FAS or FCA, as appropriate) and some transitory regulations were also implemented in order to restrain short-term financial flows.
The economy rapidly showed a foreign exchange surplus that remained at relatively high levels mainly because of the positive balance of trade, which was only offset in part by a larger net demand for foreign currency to pay for services, net income, capital transactions and private demand for foreign currency.
By early 2003, most regulations on foreign transactions were lifted, including restrictions on principal and interest payments on financial debt as well as on profit and dividend payments (just after the devaluation, in order to stop the depletion of international reserves, Central Bank approval was required for some capital income transactions). In addition, monthly limits on portfolio investment, direct investment and other external assets were relaxed. Simultaneously, the limit on foreign asset holdings by financial institutions and the non-financial private sector was gradually increased.
However, as short-term financial capital inflows continued to grow rapidly, other regulatory measures were introduced on the capital account. First, minimum stay requirements were imposed. New financial borrowing traded in the domestic foreign exchange market and rollovers of non-financial private sector and financial sector residents’ external liabilities had to be made and kept for at least 365 consecutive days. They could not be repaid before the maturity date, regardless of the settlement modality and whether or not that modality involved access to the domestic foreign exchange market. The above did not apply to correspondent balances of institutions authorised to trade in foreign exchange, insofar as they are not financial credit lines, or to primary issues of debt instruments listed and traded in self-regulated markets.
Second, according to Executive Order 616/2005, Central Bank Communication “A” 4359 regulated interest-free deposits with local financial institutions meeting the requirements set forth in Communication “A” 4360. Deposits were to be made in US dollars with 30% of the equivalent of the total sum when there were foreign exchange inflows into the MULC. Both measures, established by the Ministry of Economy, proved to be appropriate in terms of reducing short-term financial capital inflows.
The regulations did not affect regular commercial and financial transactions. In addition: (i) there are no restrictions whatsoever on payment abroad for services provided by non-residents, regardless of the item (freight, insurance, royalties, technical advice, fees, etc); (ii) for income (interest and profits and dividends), access to the MULC is allowed in order to pay for financial sector and non-financial private sector interest services; (iii) non-residents (as defined in Chapter IV of the fifth edition of the IMF’s Balance of Payments Manual) may access the MULC to purchase foreign exchange to be transferred to their accounts in foreign banks with funds collected domestically from: cash import, services, income and other current transfers receipts, principal instalments of national government debt issued in foreign currency (provided that foreign currency received has been converted to domestic currency through the foreign exchange market), residents’ external liabilities from Argentine goods and services imports and non-residents’ financial liabilities from foreign loans, validated by the external debt statement; (iv) some operations are exempt from the 30% mandatory deposit

BIS Papers No 44 95
stipulated in Executive Order 616/2005, such as: primary issues of debt instruments listed and traded in self-regulated markets; income from non-resident investment applied to purchasing real estate; foreign financial lending that is agreed on and settled at an average life of no less than two years, taking principal and interest payments into account for the calculation; and the foreign inflows used by the private sector to invest in non-financial assets.1
5. In recent years, the foreign reserve accumulation policy, combined with the sterilisation policy, both implemented by the Central Bank, have allowed monetary aggregates to remain within the programme bands. Thus, reserve accumulation is sustainable over time and compatible with a stable, robust and predictable monetary-financial policy. The results obtained reveal the consistency that both mechanisms have been exhibiting (persistent accumulation and deep sterilisation). In the past five years the Central Bank has accumulated US$ 35.7 billion in reserves and the monetary aggregates have consistently remained within the bands foreseen by the monetary programme, helping to preserve the equilibrium in the monetary market.
The reserve accumulation strategy did not have negative repercussions on monetary growth: M2 (cash held by the public, deposits in current accounts and deposits in savings accounts in pesos) growth (year-on-year) showed a continuous decline. The control of the growth of monetary aggregates is a direct reflection of the sterilisation policy carried out by the Central Bank. Table 3 shows that during the period 2005–07 the Central Bank absorbed 66% of the monetary growth generated by purchases of foreign exchange coming from the external sector.
Table 3
Foreign currency purchases and sterilisation Average flows in millions of pesos
Period Foreign currency
purchases at the MULC1
Increment of monetary base2 Sterilisation (total)
Sterilisation/ foreign currency
purchases
2005 41,170 5,290 35,879 87%
2006 42,491 16,181 26,309 62%
2007 37,398 19,533 17,865 48%
2005–07 121,059 41,005 80,054 66% 1 Includes the Treasury (single free exchange market). 2 2006 data do not include the effect of the raising of minimum liquidity requirements.
Source: BCRA.
The sterilisation policy consists of financial transactions that the Central Bank carries out to compensate for the purchase of foreign currency where there is an excess supply of foreign exchange. By this policy in order to neutralise its impact on domestic interest rate and inflation, the Central Bank absorbs the pesos that issues for the purchase of foreign exchange. When the Central Bank buys dollars it issues pesos, and tis issuance of pesos increases the supply of base money, and if this supply exceeds the amount that is voluntarily
1 More detailed information on foreign exchange regulation is available at: www.bcra.gov.ar.

96 BIS Papers No 44
demanded, it has to be absorbed in a prudent manner to avoid, as I mentioned, possible effects on inflation. The Central Bank therefore reduces the money supply through sterilisation, or absorbs the pesos it issues (theoretically, in the extreme case the Central Bank absorbs the increase in the monetary base and sells LEBAC and NOBAC by exactly the same amount as the initial excess demand for domestic assets, restoring the interest rate to its original level. In such a case, the excess supply of foreign exchange is in fact an excess demand for domestic assets).2
Sterilisation has been carried out through different mechanisms including: (i) early cancellation of rediscounts granted by the Central Bank during the 2001–02 crisis (this was one of the main monetary contraction factors in 2005 and one of the most significant contraction factors in 2006); (ii) issuance of non-monetary short- and medium-term debt (LEBAC and NOBAC); (iii) net issuance of reverse repos; (iv) sale of sovereign bonds held in the Central Bank portfolio (undertaken occasionally); and (v) changes in the minimum reserve requirement.
6. The Central Bank has been fully aware that the joint application of reserve accumulation and sterilisation policies could eventually involve costs, where the interest paid on LEBAC and NOBAC exceeds that of the international reserves. The economic literature usually cites at least three possible costs resulting from the upward pressure on domestic interest rates often associated with the sterilisation of international reserves: (i) the risk of a negative impact on investment and growth; (ii) the possibility of excessive stimulation of the inflow of short-term capital; and (iii) the possible quasi-fiscal losses.
In Argentina the trend and level of domestic interest rates, whether nominal or real, at historically low levels (especially for loans), the evolution of the nominal exchange rate, the low level of international interest rates, the strong economic growth and the role of investment in the current expansion, on the one hand, allowed the sterilisation policy to be sustainable. On the other hand, what is really of interest for a monetary market like the one in Argentina today is not how many pesos the Central Bank issues daily in order to purchase foreign currency, but the extent to which these pesos are sterilised. As mentioned earlier, the sterilisation policy allows the Central Bank to satisfy the demand for money in an adequate manner because it withdraws the surplus pesos from the economy and neither the accumulation of reserves nor the sterilisation has affected the level of activity. Regarding item (ii), as well as the low interest rates, there are still regulatory restrictions to cushion any incentive for short-term financial capital inflows. With regard to item (iii), there are factors that make the cost-benefit equation favour the current policy: the continuous quasi-fiscal surpluses exhibited by the Central Bank are concrete evidence that the revenues earned as the yield on both external assets (reserves) and domestic assets (bonds and rediscounts) are more than compensating for the financial costs incurred by the issuance of LEBAC and NOBAC. Table 4 shows that the total amount of LEBAC and NOBAC outstanding was US$ 52.9 billion at the end of 2007. The Table also shows that, from its peak in June 2007, the stock of LEBAC and NOBAC outstanding fell by US$ 8.5 billion as the Central Bank has
2 A macroeconomic inconsistency that is much discussed in the economic literature is summed up as the well
known “Impossible Trinity” postulate of open economy macroeconomics (the trilemma). According to this postulate, in the presence of free mobile capital it is not possible to have a fixed exchange rate and at the same time adopt an independent monetary policy. However, some authors argue that under certain circumstances it is possible to address those objectives simultaneously. They maintain that if there is an excess supply of foreign exchange at some policy rate, the monetary authority can help equilibrate the market by buying the excess supply in the foreign exchange market, and can then control the domestic interest rate by sterilising the monetary effects of the previous exchange market intervention by some of the instruments mentioned above. It is argued that, in doing this, the monetary authority intervention in the exchange market helps to achieve the exchange rate policy objective and the intervention in the monetary market, through sterilisation, allows it to control the domestic interest rate.

BIS Papers No 44 97
used these instruments, among others, to provide liquidity to the domestic money market since mid-2007 when the international financial turbulence began.
Table 4
Stock of outstanding LEBAC and NOBAC End of quarter, in millions of pesos
Period LEBAC $
LEBAC US$
NOBAC $
Total $
Total $ + US$
Exchange rate
March 2002 180 52 0 180 330 2.85
June 2002 474 221 0 474 1,316 3.80
September 2002 1,793 237 0 1,793 2,678 3.73
December 2002 3,049 185 0 3,049 3,671 3.36
March 2003 4,423 188 0 4,423 4,980 2.96
June 2003 6,176 125 0 6,176 6,528 2.81
September 2003 8,264 137 0 8,264 8,661 2.91
December 2003 9,839 85 178 10,018 10,266 2.93
March 2004 11,658 77 506 12,164 12,383 2.86
June 2004 12,749 60 826 13,574 13,751 2.96
September 2004 12,827 44 982 13,808 13,940 2.98
December 2004 13,337 54 1,335 14,673 14,834 2.97
March 2005 15,369 52 1,888 17,256 17,408 2.92
June 2005 20,172 32 2,924 23,097 23,189 2.89
September 2005 22,280 31 4,595 26,875 26,965 2.91
December 2005 19,539 48 6,777 26,315 26,462 3.03
March 2006 11,765 37 16,299 28,064 28,179 3.08
June 2006 10,458 38 21,801 32,259 32,377 3.08
September 2006 10,210 18 28,050 38,260 38,317 3.10
December 2006 13,126 18 27,676 40,802 40,859 3.07
March 2007 15,328 19 35,858 51,185 51,244 3.10
June 2007 25,860 19 35,565 61,425 61,483 3.09
September 2007 24,699 0 33,982 58,681 58,681 3.15
November 2007 20,942 0 31,992 52,934 52,934 3.13
Source: BCRA.
As theoretically acknowledged “… The sustainability of the [sterilisation] policy depends on the interest earned by the foreign reserves, the domestic interest rate, the exchange rate trend and the evolution of the variables that determine the demand and supply of monetary

98 BIS Papers No 44
base … there is a maximum level for the domestic interest rate that allows the sterilisation policy to be sustainable.”3
The sterilisation policy has favourable prudential implications, because it imposes a quantitative limit on the growth of the monetary aggregates. From the Central Bank point of view, a policy that combines both reserve accumulation and monetary sterilisation increases confidence in the domestic economy and makes Argentina less vulnerable. This is one of the specific assurances that an economy which has been systematically battered by the events of the international economy can have: the protection needed to face possible external shocks and thus guarantee exchange rate and financial stability and predictability, not only over the short term but also the medium- and long-term.
7. During the 2001–02 crisis, the behaviour of foreign financial institutions differed from that of national banks, both public and private. In the 1990s, there was a significant increase in foreign financial institutions’ share in the domestic market, through both the purchase of domestic banks and the incorporation of new ones. Table 5 shows that in 2000, before the crisis broke out, foreign private banks accounted for around 50% of both total credit granted to the private sector and private deposits. This percentage fell dramatically during the crisis, and by 2003 both shares were reduced by around 10%. Table 5 also shows that in recent years foreign banks’ lending and deposits participation continued to decline, reaching 36% and 38%, respectively.
Table 5
Financial intermediation, by group of financial institutions In millions of pesos and percentages
Private sector loans Private sector deposits
2000 2003 2006 2000 2003 2006
Public banks 16,680 26.5 9,662 29.8 19,259 25.1 22,092 28.2 27,653 36.9 37,229 30.2
Private national banks 12,811 20.4 9,433 29.1 26,939 35.1 14,799 18.9 17,025 22.7 38,496 31.2
Private foreign banks 31,441 50.0 12,772 39.4 28,059 36.5 41,118 52.4 30,072 40.1 47,218 38.3
Non-bank financial inter-mediaries 1,952 3.1 511 1.6 2,597 3.4 389 0.5 201 0.3 488 0.4
Total 62,884 100 32,378 100 76,853 100 78,397 100 74,951 100 123,431 100
Source: BCRA.
The financial system was able to restore normality to its balance sheets and consolidate the recovery of its traditional financial intermediation activity sooner than expected following the 2001–02 crisis. In that scenario, the strong recovery of domestic credit and deposits was not significantly linked either to international markets’ new lending or to the capitalisation of foreign liabilities. This trend reflects certain differences compared with the development of
3 Roberto Frenkel, “The Sustainability of Sterilization Policy”, Center for Economic and Policy Research,
September 2007.

BIS Papers No 44 99
the financial system before and during the crisis. Positive prospects for the local economy and for the financial services business in particular encouraged financial institution shareholders to recapitalise their banks. In the case of foreign banks, they contributed 54% (US$ 3.1 billion) of the capitalisation that took place following the collapse of the convertibility regime (the total amount for the period 2002–07 was US$ 5.7 billion). Of that amount, 75% was capitalisation of outstanding debts and earnings, while the remaining 25% was through fresh capital. It is important to stress that, as a result of the consolidation of the sector, the ratio of capital to risk assets reached 17%, surpassing local and international minimum recommended levels.
Banks led the recovery of funding from the domestic market, mainly through deposits. They have shown dynamism in the issuance of corporate bonds (ON) and share subscriptions, showing significant progress compared with the early years of the decade (although market funding remains low in international terms). Though in an incipient stage, some financial entities have marginally increased their longest-term funding through corporate bonds. During the first half of 2007, five banks placed corporate bonds (genuine, not linked to restructuring processes), virtually all of them denominated in pesos, for US$ 620 million, compared with US$ 400 million during 2006 (accounted for by two financial institutions). Similarly, a domestic private bank placed IPOs abroad for around US$ 150 million. Foreign capital inflows therefore allowed a gradual consolidation of banks’ funding, even though such liabilities still represent a low percentage in terms of banks’ liabilities, at 5%.
Additionally, banks have generated trust funds in the last few years, particularly for improving their risk management of both lending and liquidity. Banks placed their assets in trust funds for around US$ 3.2 billion in 2005, US$ 3 billion in 2006 and US$ 2.7 billion in 2007.
In an economic scenario characterised by high volatility and uncertainty, economic agents usually prefer to keep their savings in foreign currency and, should banks be allowed to raise deposits in foreign currency, they are encouraged to furnish loans in a currency other than the domestic legal tender. As shown in the last financial crisis, such preference for foreign assets and the resulting currency mismatches make the financial system vulnerable to shocks to the exchange rate, which can lead banks to suffer liquidity and solvency problems. Bearing in mind the lessons learnt from the crisis, the Central Bank designed a series of measures to reduce currency risk, establishing that dollar-denominated deposits should only be allocated to lending in dollars, and credit in dollars to companies and households should only be granted when income and wages are tied to dollar receipts. In addition, dollar-denominated deposits and credits are subject to ceilings and capital requirements to limit currency mismatches. As a result, banks have reduced the active mismatch from dollar-denominated items from a post-crisis high of 69% of net worth to a current level of 23% (measured as assets in foreign currency minus liabilities in foreign currency over total net worth). Indeed, in the post-crisis period, while loans and deposits denominated in local currency were gradually expanding, their shares in total assets and liabilities showed an extraordinary improvement vis-à-vis the dollarised picture shown pre-crisis.
8. Until 2002, the domestic futures and options markets were basically confined to agricultural commodities. The abandonment of the currency board entailed designing a new strategy for improving risk management. By mid-2002, ROFEX (Rosario Foreign Exchange) was licensed by the National Exchange Commission to negotiate futures (with the notable participation of the Central Bank) and foreign exchange (US dollar) options. Thus, the markets broadened the existing market for agricultural derivative instruments to include financial derivatives, which allowed the participation of agents other than those from the agricultural sector by incorporating the Central Bank as counterparty. Regarding dollar-denominated futures, the number of agreements executed amounted to 2.7 billion for US$ 1 each, ie US$ 2.7 billion as a whole in 2003, rising to around US$ 23.6 billion. Financial agreements (the majority of which are futures denominated in US dollars) represented 99% of the total amount of agreements signed by ROFEX during 2007, whereas the remaining 0.94% comprised agricultural agreements. In addition, the Electronic Open Market (MAE) started to conduct transactions in

100 BIS Papers No 44
2004, showing a remarkably dynamic performance: from around 24,000 negotiated agreements (for US$ 100,000 each, ie US$ 2.4 billion) in 2005, and during 2007 the number increased to 105,500 (US$ 10.55 billion).4 Other risk hedge markets like those related to interest rates (which involve the highest degree of activity throughout the world, whether via markets or OTC) are as yet little developed. In relation to global turnover, the derivatives market in Argentina is still small. The Central Bank has been a vital player in both markets, Rofex and MAE, signing futures contracts on foreign exchange (US dollar/peso). 5
9. In spite of the current expansion, Argentine capital markets still show limited growth. In particular, the depth of the stock market is low (the stock exchange capitalisation ratio of domestic companies to GDP is almost 30%), as is liquidity (the four sectors with the highest market value conduct most of the transactions, absorbing a great portion of the liquidity of the marketplace). The stock markets are extremely vulnerable to external shocks, are highly volatile (due to recurrent crises) and show a remarkable concentration of stock exchange capitalisation and turnover with little diversification of sectors (oil, iron and steel, telecommunications and finance account for over 80% of the domestic stock exchange capitalisation, with oil/natural gas predominating). The market for corporate bonds is small compared to those of the main regional economies (below 10% of GDP), and thus even smaller compared to those of the developed economies. Furthermore, the issuance of corporate bonds, measured in US dollars, has not recovered the nominal values observed prior to the 2001–02 crisis.
Since the crisis, primary market issuance of corporate bonds on the BCBA (Buenos Aires Stock Exchange) has fallen in absolute terms (measured in dollars) and relative to GDP. After the crisis, corporate financing from markets was restricted to small amounts for the short term, except for debt restructuring transactions which accounted for most of the transactions during the period 2002–2005. The sector began to recover in 2003, and more so after the process of renegotiation of the public debt in default was closed in early 2005. There was also a change from the end of 2006, when over 90% of the issuance of corporate bonds was linked to new funding. From 2006 through 2007 corporate bonds issued in Argentina amounted to US$ 3 billion, below the peak of over US$ 5 billion each year reached before the crisis in both 1997 and 1998.
From another point of view, the issuance of peso-denominated debt, either government or corporate, has been lower than that of foreign currency debt, even though since 2007 there has been growing issuance in pesos at a fixed rate (though for shorter terms). It is worth mentioning that before the 2001–02 crisis broke out, the BCBA had issued negotiable obligations on account of new funding, whereas, as mentioned above, from 2002 to 2005 most local and international issuance by national corporates involved debt restructuring.
Lastly, the strong economic recovery and the changes in corporate structures – with mergers and acquisitions involving a diversification at a global level – that have taken place over the last few years have led domestic companies to expand into other regional economies and have attracted foreign companies to settle in or purchase companies in Argentina. With regard to foreign direct investment, a growing number of international companies have been investing in sectors such as tourism, real estate, beverages and foodstuffs, as well as the supply of metals and building materials. At the same time, domestic companies from the agricultural and metallurgy sectors have made heavy investments abroad.
4 In 2007 the ROFEX daily average turnover of financial agreements was US$ 104 million compared to
US$ 50 million traded throughout the MAE. 5 The future contracts on foreign exchange are settled in pesos on a net basis, where the principal amounts are
not exchanged.

BIS Papers No 44 101
10. To sum up, the Argentine economy has been characterised by a strong dependence on external savings, and has shown recurrent current account deficits. For this reason, the frequent shifts in international financial capital flows have had a huge impact in terms of higher macroeconomic volatility.
The economic recession that began in 1998 and the collapse of the convertibility system in early 2002 were the most recent serious episodes in which capital flow fluctuations had a severe impact on the performance of the Argentine economy. For this reason, from 2002 onwards, one of the main pillars supporting economic policy has been focused on stabilising the foreign exchange market and addressing the problems linked to the volatility of short-term financial capital flows.
Under this policy, the economy has shown a remarkable recovery, with fiscal and external equilibria key characteristics. At the same time, the economy has achieved financial and exchange market stabilisation, while international reserves have been growing continuously. The favourable economic environment, combined with a positive external context in terms of high liquidity and low international interest rates, attracted international investors. As a result, demand for peso-denominated assets rose and short-term financial flows became much larger than expected. In order to face this situation, some transitory rules on the capital account were introduced by the Ministry of Economy, particularly aimed at discouraging short-term financial flows (the first regulations on foreign exchange transactions were actually established prior to the collapse of the convertibility system). These temporary rules have been reduced and do not interfere with investment or consumption decisions. Additionally, the Central Bank has been implementing a sterilisation policy in order to keep monetary aggregates under control. Argentina’s experience shows that, under certain circumstances, this policy is consistent with one of international reserve accumulation.


BIS Papers No 44 103
Capital flows to the Brazilian economy: 2003–071
Katherine Hennings2 and Mário Mesquita3
The Brazilian economy has long been open to foreign capital. As a country with inadequate levels of domestic savings (less than 20% of GDP), it has recurrently tapped external resources to fund its development. That pattern has not changed much in recent years: as Brazilian growth accelerated, from 3.2% in 2005 to 6% in the four quarters up to June 2008, its current account position as a percentage of GDP shifted from a surplus of 1.6% to a deficit of 1.2%. But in that case, unlike in past episodes, the composition of external liabilities shifted as the balance moved to a deficit – debt instruments were largely replaced by equity stakes (Graph 1). The change has had two important implications for balance of payments dynamics: exchange rate risk now predominantly lies with foreign investors rather than Brazilian borrowers; and returns on foreign capital invested in Brazil tend to be more highly correlated with domestic economic conditions than with monetary policy in the mature economies (Graph 2).
After the debt crisis, which began in 1982, Brazil did not return to international financial markets until the 1990s, after successfully completing a restructuring agreement with its creditors. Brazil’s macroeconomic framework then improved considerably, with the end of hyperinflation in 1994 and the introduction of a wide-ranging privatisation programme in the latter part of the decade. Moreover, Brazil removed legal restrictions on participation by non-residents in some sectors of the economy (for instance, oil and gas, and telecommunications). With that liberalisation plus privatisation, foreign direct investment (FDI) in Brazil increased, but debt instruments still dominated. Within the set of portfolio flows, equity flows dominated briefly, but otherwise, until the past few years, flows mainly consisted of fixed income instruments, mostly in the form of public debt.
As this note will discuss, the recent increase in flows to and from the Brazilian economy and the recent trend towards the participation of direct investors have been supported by the cycle of abundant international liquidity, but they have also been stimulated by the improving fundamentals of the Brazilian economy.
1. Recent trends in capital flows to Brazil
Foreign direct investment Flows of non-resident direct investment to Brazil were small and reasonably stable, at around USD 1.6 billion per year, when the country was in default (1982–92). This performance reflected a high degree of macroeconomic uncertainty plus the presence of legal restrictions on FDI in selected sectors. After the 1992 agreement on external debt, which was approved by Congress in 1994, and after the introduction of the Real plan, which ended hyperinflation,
1 We thank Altamir Lopes, Fernando Alberto Rocha, Maria do Carmo Vieira Feres, Renato Jansson Rossek and
João Henrique de Paula Freitas Simão for comments and data. The views expressed in the paper are those of the authors and do not necessarily reflect those of the Banco Central do Brasil (BCB).
2 Senior Advisor to the Board, Banco Central do Brasil. E-mail: [email protected] 3 Deputy Governor for Economic Policy, Banco Central do Brasil. E-mail: [email protected]

104 BIS Papers No 44
GDP growth increased, reaching 5.9% in 1994 and 4.2% in 1995. Likewise, inflows began an upward trend, and some sort of accelerator effect seemed to be at work: net FDI inflows, which were USD 2.1 billion in 1994 and USD 4.4 billion in 1995, shot up to an annual average of USD 15.7 billion in the 1995–98 period. Of that new amount, which was roughly 10 times the average inflow in the debt crisis period, only about 10% was in the form of intercompany loans (Table 1).4 Moreover, inflows were speeding up at the margin, reaching USD 28.8 billion in 1998.
Graph 1
Capital flows to Brazil In billions of US dollars
Graph 2
Ratio of income remittances to exports Twelve-month accumulation, in billions of US dollars
4 Net FDI inflows are the gross inflows deducted from the repatriation of FDI previously made, accumulated
from 1991 to 2002.
0
10
20
30
40
50
60
70
Jan96
Jan 97
Jan98
Jan99
Jan00
Jan01
Jan02
Jan03
Jan04
Jan05
Jan06
Jan07
Jan08
0
50
100
150
200
250
300
350
Credit FDI Portfolio investment (rhs)
0.00 0.05 0.10 0.15 0.20 0.25 0.30 0.35 0.40
Jan96
Jan97
Jan98
Jan99
Jan00
Jan01
Jan02
Jan03
Jan04
Jan05
Jan06
Jan07
Jan08
Profit and dividend remittances/exports Interest payments/exports

BIS Papers No 44 105
Table 1
Direct investment flows to and from Brazil In millions of US dollars
2005 2006 2007 20081 1995–98 1999–2002 2003–07
Foreign direct investment2 15,066 18,823 34,584 24,576 15,761 25,102 19,352
Equity capital 15,045 15,373 26,074 17,670 14,107 23,971 16,876
Intercompany loans 21 3,450 8,510 6,906 1,654 1,131 2,476
Brazilian direct investment abroad2 2,517 28,202 7,067 12,374 1,149 1,049 9,568 1 Up to August. 2 Net of returns.
Inflows in those years were strongly influenced by the privatisation and deregulation programmes, which allowed foreign participation in new fields like energy, gas, rail transportation, telecommunications and financial services. Although FDI in privatised enterprises reached USD 42.1 billion5 and, with the exception of 1999, was never more than one third of the annual inflow, the favourable environment it created stimulated FDI in other sectors.
During the financial crises of the 1990s – Mexico in 1994–95, Asia in 1997, Russia in 1998, Argentina and the 9/11 attacks in 2001, and Brazil’s pre-election confidence crisis in 2002 – FDI annual inflows continued to be robust. They averaged USD 25.1 billion, equivalent to about 4.3% of GDP, in 1999–2002, and financed almost all of the current account deficit.6 From 2003 on, after a small decline, the upward trend continued, and FDI, with no privatisation-related inflows, reached USD 34.6 billion in 2007.
Until privatisation and deregulation in the 1990s, FDI used to be concentrated in manufacturing (66.8% of the stock), while the services sector received 29.3% and agriculture and mining just 3.9%.7 Within the manufacturing sector, the chemical products industry received some 15.3% of total FDI, followed by the automotive sector (13%), basic metallurgy and food and beverages (8% each) and machinery and equipment (6.3%). However, since then, around 50% of gross FDI inflows have been directed to the services sector, specially telecommunications (20.2% of FDI in the services sector), financial and auxiliary services (20.4%), retail trade (15.5%), gas and energy (11.2%) and real estate (9.3%). This trend reflected the privatisation programme – whereby the state divested itself of large public utilities in the energy and telecommunications sectors – as well as the somewhat slow growth of manufacturing in the second half of the 1990s.8
5 Share of total foreign resources in privatisation processes, federal and regional government levels. 6 In 2001, FDI was equivalent to 4.1% of GDP, while the current account deficit was 4.2% of GDP. In the other
years, FDI inflows were enough to finance the current account deficit. 7 Early 20th century FDI used to flow towards the services sector, as was the case in most of the region,
particularly the infrastructure of the largest cities and the main ports. Post-WWII FDI, in contrast, went mostly into the manufacturing sector.
8 In 2007 and the first half of 2008, a pickup in FDI in metal and mining led the increase in the inflow to USD 11.7 billion, some 14% of total inflow for the period.

106 BIS Papers No 44
Net FDI liabilities in 2007 reached USD 328.5 billion, one third of gross external liabilities. FDI inflows have mostly been in the form of equity stakes rather than intercompany loans, which constituted 12% of total net inflows from 2002 to 2007.
The increase in the inflows of FDI has been accompanied by an increase in the outflows of income remittances linked to previous non-resident investments. Those outflows grew especially from 2005, when they almost doubled compared with previous years, reaching USD 11 billion. The upward trend has continued (Table 2). This behaviour reflected the cyclical upswing in Brazil as well as the appreciation of the Brazilian real (BRL).
Table 2
Direct investment income remittances In millions of US dollars
2005 2006 2007 20081 1995–98 1999–2002 2003–07
Income remittances 11,036 13,899 19,692 19,158 4,319 5,086 11,502
Profits and dividends 9,783 12,373 17,898 18,045 3,772 3,980 10,148
Interest on intercompany loans 1,253 1,526 1,794 1,113 547 1,106 1,354
Profits and dividends received 733 1,073 2,202 1,059 890 955 1,201 1 Up to August.
Importantly, and in line with what happened in other large emerging economies, the outflow of Brazilian direct investment (BDI) has also increased in the past few years. To some extent, this too resulted from deregulation: until 2005, direct foreign investment by residents needed to be approved by the authorities. In this context, the annual average of BDI grew from USD 1 billion in 1999–2002 to USD 9.6 billion in 2003–07. Given that the stock of BDI is still relatively small, inflows of profits and dividends have also been limited, reaching an annual average of just USD 1.2 billion between 2003 and 2007.
The UNCTAD World Investment Report (2008) stated that global FDI inflows increased 30% in 2007, reaching USD 1,833 billion. Latin America and the Caribbean received USD 126 billion of these resources, a rise of 36% over the 2006 figure. For South America, the increase was 66%, with USD 72 billion of inflows targeting the extractive industries and natural resource-based manufacturing (which is the industry that processes the raw material produced in the host country). Brazil was the top destination among Latin American and Caribbean countries, followed by Mexico (USD 24.7 billion ) and Chile (USD 19.3 billion ). As a share of GDP (2.6%), however, inflows to Brazil were less significant than those to Chile (11.8%), albeit larger than to Mexico (2.4%).

BIS Papers No 44 107
Foreign portfolio investment9 The size and magnitude of portfolio investment flows to Brazilian capital markets have changed substantially, especially in the past five years. Net inflows in the 1995–98 period were directed mainly to public securities, at an annual average of USD 11.2 billion, while investment in equities reached an annual flow of USD 4.3 billion.10 Rising uncertainty following the exchange rate crisis in early 1999, as well as the domestic energy crisis in 2001 and the election crisis in 2002, heavily impacted these flows, which were just USD 2.1 billion (net) in those years – gross inflows were significant in those years, but so were outflows.
Beginning in 2005, with lower inflation and the start of a cyclical upswing, net inflows into the local equity market increased substantially, from USD 5.4 billion to USD 24.6 billion in 2007. Also from 2005 to 2007, gross inflows grew from USD 32.3 billion to USD 116.6 billion while the outflows rose from USD 26.9 billion to USD 92.0 billion. Be it in net or gross terms, these inflows are unprecedented in the post-World War II Brazilian experience.
In fact, non-resident investors have taken on a key role in the increase in the number of initial public offerings in the local equity market, which rose from nine in 2004 to 59 in 2007. The capital market in Brazil has finally emerged as a source of financing for investment, partially replacing the domestic credit market and taking over some of the burden placed on the state-owned development bank (BNDES). Unlike the local buy-and-hold institutional investors, foreign investors, who owned some 12% of total market capitalisation as of December 2007, often are the marginal buyers and sellers of securities and as such play a pivotal role in price setting.
In December 2006, the government exempted foreign investors from paying withholding tax on long-dated holdings of fixed income instruments. As a result, net inflows directed at purchasing fixed income securities rose from USD 0.7 billion in 2005 to USD 20.5 billion in 2007 – the gross inflow in this market in 2007 being USD 61.3 billion and the gross outflow USD 40.8 billion. As of December 2007, foreigners held about 6% of total fixed income securities traded in the domestic market and accounted for 35% of market turnover.
Net investment in long-term assets was USD 13.5 billion, but the amount invested in short-term fixed income securities was also relevant, with gross inflows reaching USD 20.3 billion in 2007, while gross outflows were USD 13.8 billion (Table 3).
Foreign investors have contributed in important ways to the development of Brazilian debt markets, particularly by providing demand for long-dated government bonds. In fact, the combination of macroeconomic stabilisation and the interest of foreigners in long-term public securities allowed the Treasury to lengthen the maturity of domestic public debt, which at the time of writing had an average tenor of nearly 38 months, compared with nine months a decade ago.
Brazilian portfolio investment abroad grew substantially in the last few years, especially due to removal of some regulatory impediments, but also thanks to rising profitability of local corporate. Still, outflows are substantially smaller than inflows (Tables 3 and 4).
9 Portfolio investment refers to flows directed to equities and public securities traded in Brazilian domestic
markets. 10 The data used in the analysis are mainly from the balance of payments, compiled through information
gathered from exchange rate contracts. In Brazil, all foreign exchange transactions should be made through an exchange rate contract that is registered in the central bank’s database.

108 BIS Papers No 44
Table 3 Portfolio investment flows to Brazilian markets
In millions of US dollars
2005 2006 2007 20081 1995–98 1999–2002 2003–07
Equities2 5,421 5,859 24,613 –256 1,799 –760 7,844 Inflows 32,332 48,511 116,581 170,500 24,709 9,281 44,339 Outflows 26,911 42,652 91,968 170,756 22,910 10,041 36,495
Securities, long-term 413 6,971 13,548 13,610 –1,434 –487 4,226 Inflows 2,450 17,776 40,987 26,124 1,263 1,202 12,610 Outflows 2,037 10,805 27,439 12,514 2,697 1,689 8,384
Securities, short-term 275 4,070 6,934 2,051 53 –32 2,290 Inflows 1,633 10,400 20,337 5,430 111 328 6,719 Outflows 1,358 6,330 13,403 3,379 58 360 4,429
1 Up to August. 2 Traded in domestic markets.
In December 2007, the portfolio of foreign investors in the Brazilian capital market reached USD 214.11 billion: almost 77% in equities, 19% in fixed-yield government notes, 0.8% in derivatives, 0.05% in corporate notes and 2.7% in other financial instruments.
Table 4
Brazilian portfolio investment abroad In millions of US dollars
2005 2006 2007 20081 1995–98 1999–2002 2003–07
Equities 831 916 1,414 –75 213 1,082 708
Outflows 901 1,322 1,976 1,244 267 1,790 936
Inflows 70 406 562 1,319 54 708 228
Securities, long-term 519 –342 –1,789 –487 –136 –444 –283
Outflows 3,607 4,372 3,084 1,470 1,319 1,286 3,146
Inflows 3,088 4,714 4,873 1,957 1,455 1,730 3,429
Securities, short- term 421 –579 90 –121 –1 0 –14
Outflows 421 325 390 0 14 0 227
Inflows 0 904 300 121 15 0 241 1 Up to August.

BIS Papers No 44 109
The increase in portfolio investments, the appreciation of Brazilian asset prices (including the currency) and faster economic growth led to an increase in the remittances of dividends, from an annual average of USD 1.3 billion in 1999–2002 to USD 3.6 billion in 2003–07, while remittances of interest paid by securities remained basically stable at USD 15 billion (Table 5).
Table 5
Portfolio income In millions of US dollars
2005 2006 2007 20081 1995–98 1999–2002 2003–07
Equities (dividends) 3,554 4,945 5,702 6,734 1,345 1,274 3,635
Fixed income (interest) 14,461 14,877 15,342 10,503 12,362 15,667 14,619 1 Up to August.
Credit flows11 The nature of lending inflows changed substantially from the 1980s as banks embraced the originate-to-distribute business model. Thus, syndicated loans were replaced by the issuance of private commercial paper and notes, which became the main credit sources. However, direct loans, suppliers and trade credits are still important, especially for trade finance (Table 6).
The nature of external credit to the government also changed. After the restructuring of the external debt, in the beginning of the 1990s, the government’s debt management strategy focused on building a yield curve that could be a benchmark for private sector issuance. This process was intensified after the prepayment of the debt held by the IMF and the Paris Club in 2004–05.12
Regarding the private sector, there was substantial deleveraging, especially until 2006. Despite the abundance of liquidity in international markets and the generally low level of global interest rates, the search for credit abroad was limited. Thus, in paying down their external debt, private sector debtors as well as the public sector benefited from international conditions, which led to small or negative net credit flows and reduced the Brazilian external debt.
The strongest increase in credit inflows has been related to international trade, in line with the strong growth of exports and imports since the beginning of the new century. Large trade surpluses since 2003 resulted in an abundance of foreign currency in domestic exchange markets, contributing to the appreciation trend of the domestic currency.
11 For credit flows, we take the capital raised by bonds, notes and commercial paper issued abroad, plus long-
term and short-term commercial credit, direct loans and financing. These statistics are not directly shown in the balance of payments accounts because bonds, notes and commercial paper are registered in portfolio investments.
12 In 2006, to cover the buyback of external public bonds, the call of Brady bonds, tender offers and exchange offers, the government paid USD 17.5 billion. In 2007, buybacks reached USD 1.3 billion. In 2005, prepayments of IMF debt reached USD 20.8 billion. In October, a call of C-bonds (capitalisation bonds) amounted to USD 1 billion.

110 BIS Papers No 44
Table 6
Private credit flows to Brazil In millions of US dollars
2005 2006 2007 20081 1995–98
1999–2002
2003–07
Bonds (public and private) 2,208 –13,223 –7,880 –2,659 –79 2,441 –3,303
Inflows 12,490 5,575 2,883 538 2,834 8,432 6,893
Outflows 10,282 18,798 10,763 3,197 2,913 5,991 10,196
Notes and commercial paper –3,126 3,450 5,633 1,596 12,613 –2,489 –183
Inflows 7,337 10,244 15,434 5,640 16,855 6,979 8,566
Outflows 10,463 6,794 9,801 4,044 4,242 9,468 8,749
Short-term securities traded abroad 435 91 3,651 571 5 106 975
Inflows 1,434 4,084 10,862 2,637 130 836 4,305
Outflows 999 3,993 7,211 2,066 125 730 3,330
Trade finance (suppliers) 3,585 12,789 17,210 6,752 483 –1,930 7,000
Long-term –941 –841 134 548 86 –2,165 –799
Disbursements 740 812 1,618 1,744 378 2,657 1,029
Amortisation 1,681 1,653 1,484 1,196 292 4,822 1,828
Short-term2 4,526 13,630 17,076 6,204 397 235 7,799
Loans, long-term3 –2,291 10,505 64 10,188 –1,836 –911 –243
Disbursements 7,976 27,250 16,076 15,299 –129 14,705 13,957
Amortisation 10,267 16,745 16,012 5,111 1,707 15,616 14,200
Loans, short-term3, 4 –1,059 –516 13,768 2,099 –755 –1,854 1,913
Total –248 13,096 32,446 18,547 10,431 –4,637 6,159 1 Up to August. 2 Disbursement net of amortizations. 3 Includes international organisations, agencies, buyers’ credit and direct credit. 4 Inflows net of amortisation payments.
The combined data on investment and debt flows from 2001 to 2007 show that FDI is equivalent to about 33–40% of total net external liabilities, while the ratio of external debt to total liabilities decreased from 56% in 2001 to 35% in 2007, which clearly indicates the change of financing sources.
In sum, capital flows to and from the Brazilian economy grew substantially in the past five years, and more intensely from 2006 on. But the trend was concentrated in portfolio investments, with less reliance on credit and more on investment funding.
Abundant international liquidity during the recent period was an important determinant of the rise in flows and the shift towards investment funding, but one must look also at the domestic causes of those trends.

BIS Papers No 44 111
2. Explaining capital flows to Brazil
Brazil’s achievement of macroeconomic stability and its success in strengthening its resilience to external shocks help explain the growth of the country’s attractiveness as a destination for foreign capital flows.
Macroeconomic stability is a key precondition for sustainable growth. In that regard, the performance of monetary policy under the inflation targeting (IT) framework plays an important role. Brazil adopted IT in 1999 and has managed to keep inflation within its specified tolerance band during the past five years.13 That success has allowed relative prices to function as effective signals for economic decisions, including for long-term planning. In this context, by using IT rather than a nominal exchange rate anchor, Brazil’s monetary policy has become increasingly more efficient in controlling inflation. That is, smaller increases in the policy rate have had stronger effects on expectations and pricing behaviour (see Graph 3 for the decrease in overnight interest rates and Graph 4 for the reduction in 12-month accumulated inflation).
Graph 3
Basic short-term interest rate target (Selic) In per cent per year
13 For recent developments, see A Bevilaqua, M Mesquita and A Minella (2008): “Brazil: taming inflation
expectations”, BIS Papers, no 35, Basel, January 2008.
10
30
50
70
90
Aug 94
Aug96
Aug98
Aug00
Aug02
Aug04
Aug06
Aug08

112 BIS Papers No 44
Graph 4
Evolution of inflation (Ample consumer price index) In per cent per year
Note: the red lines are the inflation target (middle) and the limits of the tolerance band. In Brazil the IT is currently at 4.5% +/–2pp.
Lower risk premia also reflect a fiscal policy committed to paring down net public indebtedness as a share of GDP. To that end, the government has been announcing and delivering primary fiscal surpluses since the end of the 1990s. Thus, net public sector debt peaked at 56% of GDP in 2002 and fell to 43% by December 2007 (Graph 5). Market projections suggest that it will fall to 35% by 2012.
Graph 5
Ratio of net public sector debt to GDP As a percentage of GDP
0
3
6
9
12
15
18
Jan99
Jan00
Jan01
Jan02
Jan03
Jan04
Jan05
Jan06
Jan07
Jan08
Jan09
40
44
48
52
56
Jan01
Jul01
Jan02
Jul02
Jan03
Jul03
Jan04
Jul04
Jan05
Jul05
Jan06
Jul06
Jan07
Jul07
Jan08
Jul08

BIS Papers No 44 113
These measures paved the way for a sustained acceleration of growth. Up to June 2008, the Brazilian economy had been growing at an average annual rate of 4.6% for 11 quarters (quarter over quarter, seasonally adjusted). The trend was supported essentially by external demand until 2005. Since then, domestic demand, reflecting strong increases in consumption and investment, has become the major driver of the economy. That changeover happened without any decrease in exports, which continued to grow at an annual rate of 18.5%.
Although export growth has been stimulated by the rise in commodity prices, especially for grains and metals, about half of Brazilian exports are manufactured goods. That, in turn, should mitigate the impact of swings in commodity prices on the value of total exports. Moreover, the destinations of Brazil’s exports are fairly diverse: Latin America buys 22.7% of the country’s exports, while Asia buys 15.7%, the United States 15.8% and the European Union 25.2%. However, despite the strong growth in international trade in the past few years, Brazil is still a very closed economy, as imports and exports are equivalent to just 21.4% of GDP. This feature of the economy has long been seen as an impediment to faster economic growth, but it should mitigate the impact of a global slowdown on aggregate demand.
Robust growth of domestic demand has been supported by rising income levels and fast credit expansion. Unemployment rates have been on a downward trend and reached 7.6% (seasonally adjusted) in August 2008, the lowest level since 2002; average real income growth in the past 12 months has been 6%. Moreover, since 2005, credit to households has been growing at an average annual rate of 31.3%, while bank lending to enterprises has been expanding at a rate of 28.4%.
One aspect that should be stressed is the resilience of the Brazilian financial sector since the restructuring of the system in the second half of the 1990s. Macroeconomic stabilisation, and consequently the end of high inflation, induced a rapid overhaul of the system. The banks that were unable to adjust, especially three large private sector banks, became the core of PROER (the Programme of Incentives for Restructuring and Strengthening the Financial System). Moreover, two federal banks and two federal development banks were placed under enhanced supervision by the central bank, which showed the need for larger provisions and adjustments for capital adequacy. Finally, banks owned by the states were streamlined through PROES (the Programme of Incentives for the Reduction of the Role of the State in Banking), restructured and privatised.14
The growth of the domestic market, combined with the increased predictability of policies and of the domestic economy, has made Brazil more attractive for international investors and favoured the increase in foreign capital flows. But the upswing in commodity prices has also played an important role: 38.7% of gross FDI inflows in 2007–08 have been in commodity or commodity-related sectors.
Moreover, the government has actively pursued policies aimed at reducing the economy’s vulnerability to shocks. The Treasury, which is responsible for managing the federal public debt, has been implementing a programme to withdraw exchange rate linked securities, increase the share of fixed rate instruments and lengthen the tenor of the public debt (Graph 6). As of the beginning of 2000, public debt indexed to exchange rate variation increased substantially, reaching 38% of total public sector domestic debt in October 2001.15
14 A longer explanation is available in I Goldfajn, K Hennings and H Mori, “Financial system in Brazil: resilience
to shocks, preserving real value, and struggling to promote growth”, Central Bank of Brazil Working Paper Series, no 75, June 2003; and in G Maia, “Restructuring the banking system – the case of Brazil”, BIS Policy Papers, no 6, Basel, August 1999, pp 106–23.
15 The impact of the public securities linked to exchange rate variation on the net public sector debt to GDP ratio is explained in I Goldfajn, “Are there reasons to doubt fiscal sustainability in Brazil”, BIS Papers, no 20, Basel, October 2003.

114 BIS Papers No 44
Since 2003, the government has bought back all these securities, totalling USD 81.3 billion. In 2002, in the context of the confidence crisis, the central bank sold foreign exchange swaps, in which the monetary authority was long domestic currency and short US dollars. The appreciation path of the domestic currency after the overshooting in 2002 favoured the exchange of the swap contracts for reverse swap contracts, in which the central bank was long US dollars. As a result, a depreciation of the real, say in a global stress scenario, would lead to an improvement in public finances rather than a deterioration (Graph 7).16
Graph 6
Composition of federal public debt securities In per cent
Graph 7
Effects on federal public debt of a 1% change in the exchange rate
In basis points
16 Thus, the net debt to GDP ratio has improved 1.5 percentage points since end-August 2008 thanks to BRL
depreciation.
–12
–8
–4
0
4
8
12
16
20
24
28
32
Jan01
Jul01
Jan02
Jul 02
Jan03
Jul03
Jan04
Jul04
Jan05
Jul05
Jan06
Jul06
Jan07
Jul07
Jan08
Jul08
0 1020 3040
50
6070 80 90
100
Jan00
Jan01
Jan02
Jan03
Jan04
Jan05
Jan06
Jan07
Jan08
Exchange rate Fixed income Selic rate Inflation-linked Others

BIS Papers No 44 115
Another important improvement was the extension of the domestic public debt yield curve through the issuance of longer-dated securities and the creation of markets for those assets. The lengthening of the maturity of the debt implies lower rollover risk, hence lower overall macroeconomic risk. At the end of 2002, the average tenor of domestic public debt was 21.8 months. By December 2007, it was 33.1 months (Graph 8).
Graph 8
Maturity structure of federal public securities debt In billions of reais
In addition to domestic debt restructuring, the government and the central bank adopted a policy to increase the resilience of the economy to external shocks. This policy included prepaying of the IMF and Paris Club debt, buying back external public securities issued in the context of the early 1990s rescheduling of debt, increasing international reserves via the purchase of foreign currency in the domestic market, and acquiring foreign currency for debt service purposes in domestic markets instead of using international reserves.
The policy for accumulating foreign exchange reserves was announced in January 2004. Under the policy, through fully sterilised intervention, the central bank bought USD 139.7 billion in the domestic market over the next four years; at the end of 2007, international reserves were USD 180.3 billion. The policy did not impinge on exchange rate flexibility: at the inception of the policy, the exchange rate was BRL 2.93 to the dollar, and it fell, not monotonically, to BRL 1.78 to the dollar by the end of 2007. US dollar purchase auctions have been undertaken at current market prices so as not to influence the exchange rate path. The central bank has also managed the process so as not to add to market volatility.
These measures influenced the behaviour of capital flows: amortisation outflows increased in 2004 and 2005, and the build-up of foreign exchange reserves contributed materially to Brazil’s achievement of investment grade status. Gross external debt fell from more than 30% of GDP in 2004 to 14% in 2007 (Graph 10). With the decline of external debt and the increase in international reserves, the ratio of net external debt to GDP moved from 20.4% in 2004 to –0.9% at the end of 2007. The ratio of international reserves to short-term debt, considering payments due within 12 months, grew from 99% in 2004 to 290% in 2007 (Graph 9).
0
200
400
600
800
1,000
1,200
1,400
Jan04
Jul04
Jan05
Jul05
Jan06
Jul06
Jan07
Jul07
Jan08
Jul08
Up to 1 year 1 to 2 years 2 to 5 years > 5 years

116 BIS Papers No 44
Graph 9
Indicators of external vulnerability
Graph 10
Net external debt and S&P ratings In billions of US dollars
3. Conclusion
The capital and financial accounts of Brazil’s balance of payments have changed in important ways in the past few years. FDI, private equity and equity portfolio inflows have increased in relative importance, whereas debt has declined – FDI, as shown in Table 7, has historically been more resilient in crisis periods than other sources of funding. The country as a whole has deleveraged through a process led by the public sector. Outflows have also increased, especially of FDI, as large Brazilian corporations developed their overseas operations, mostly through mergers and acquisitions.
Overall, these developments should make the economy more resilient to external shocks. primarily because its external funding needs are smaller – 2.8% of GDP at end-2007, compared with 10.6% at the end of 2001. Moreover, within the set of net external liabilities, the dominance of equity capital (both FDI and portfolio) means that profit and dividend remittances replace debt service payments as key drivers of the current account balance.
BB–
B+
BB–
BB
BB+
BBB– –30
–10
10
30
50
70
90
110
130
150
170
Q 1 02
Q 3 02
Q 1 03
Q 3 03
Q 104
Q 304
Q 105
Q 305
Q 106
Q 306
Q 107
Q 307
Q 108
0
1
2
3
4
5
6
95 96 97 98 99 00 01 02 03 04 05 06 07 080
50
100
150
200
250
300
Reserves as a percentage of short-term debtRatio of reserves to debt service

BIS Papers No 44 117
Profit remittances are much more sensitive to the state of the domestic business cycle and to exchange rate movements than are interest payments. These outflows increased from an annual average of USD 3.8 billion in 1995–2002 to USD 10.1 billion in 2003–07 and reached USD 17.9 billion in 2007. This behaviour can be attributed to the high level of corporate profits in Brazil – thanks to the economic upswing – combined with appreciation of the Brazilian real. It is reasonable to expect, on the other hand, that in periods of economic difficulty, domestic currency weakness or both, profit remittances will tend to be smaller. It pays, in this sense, to tap foreign savings in the form of equity rather than debt.
Table 7
Capital flows in periods of stress Monthly averages, in millions of US dollars
Crisis Time period FDI Portfolio Credit
Mexican Jan–Jun 1995 258.32 –392.49 1,541.12
Asian Jan–Jun 1997 1,297.96 1,027.24 225.15
Jul–Dec 1997 1,867.53 –150.95 236.57
Russian Feb–Jul 1998 2,038.83 1,456.71 3,722.58
Aug 1998– Jan 1999 3,134.33 –2,281.84 438.33
Brazilian Jan–Jun 1999 2,215.00 130.00 –1,843.00
9/11 Mar–Aug 2001 1,856.92 235.67 1,296.55
Sep 2001– Jan 2002 1,832.61 58.47 508.47
Confidence Apr–Oct 2002 1,316.42 –89.11 1,158.50
Subprime Jan–Jun 2007 3,475.38 3,349.30 5,921.78
Jul–Dec 2007 2,288.77 4,433.88 –434.04
The Brazilian economy has faced at least five international and domestic shocks in the past decade: the Asian crisis, the Russian crisis, the devaluation of the real, 9/11, the Argentine crisis, the pre-electoral crisis in confidence, and now the subprime crisis. All of them led to an increase in the risk aversion of international investors and the sell-off of public bonds in international markets, which in turn led to sudden stops in capital flows. Those stops were magnified within Brazil by the foreign exchange exposure of the public sector.
In the past few years, the authorities have managed, chiefly through the accumulation of foreign exchange reserves, to take advantage of the favourable external environment to address the issue of foreign exchange exposure. Nowadays, in contrast to the 1990s, the public sector is a structural net creditor in foreign exchange. This means that a turn to unfavourable conditions – say, a worldwide increase in risk aversion, which may lead to depreciation of the Brazilian real – would result in a falling ratio of net public debt to GDP. Thus, the public sector can act as a shock absorber rather than a multiplier. In fact, as seen in Table 8, the economy has indeed become more resilient in the past few years and was relatively unaffected by the global financial turmoil during 2007.

Table 8
Macroeconomic and financial variables in periods of stress
Exchange rate (BRL/USD) (% change)
Interest rate (Selic) (change, in basis points)
Share Equity Price Index (IBOVESPA) (% change)
International reserves (change in USD billion)
EMBI (change in basis points)
Period
Max Six
months after
Max Six
months after
Max Six
months after
Max Six months after Max Six months
after
Mexico Jan–Apr 1995 8.2 7.1 3,557 3,557 –46.8 –26.5 –6.91 –5.29 832 249
Asia Jul–Dec 1997 3.6 3.6 1,994 2,549 –35.7 –21.0 –5.58 –5.44 377 130
Russia Aug 1998–Dec 19991 3.8 3.8 2,308 933 –55.6 –34.5 –29.02 –25.65 1,042 923
Brazil Jan–Jun 1999 77.1 46.9 803 –800 –26.9 60.0 –10,708 –3,210 549 –240
9/11 Sep 2001–Feb 2002 12.0 –4.41 10 –21 –23 1.2 –0.433 –0.393 301 –116
Confidence Apr–Oct 20022 68.6 63.5 221 221 –39.3 –32.5 –3.83 –0.866 1,731 1,742
Subprime Jul–Dec 2007 5.0 –7.6 75 75 –10.9 16.7 33,233 33,233 97 56 1 Window of five months because the exchange rate regime in Brazil was changed from a managed exchange rate to a floating regime. 2 Window of seven months because the crisis peaked in October.
118
BIS P
apers No 44

BIS Papers No 44 119
Brazil is a commodity-producing and -exporting economy (although exports of manufactured goods are sizeable). Commodity-related capital flows are also large; historically, they have been correlated positively with the terms of trade and thus have magnified the impact of commodity price shifts on the balance of payments. Under these circumstances, there are clear benefits from having an adequate stock of foreign assets, in the form of central bank reserves or in alternative vehicles, so as to buffer the effects of commodity price swings on the economy. Thus, accumulating foreign reserves – while preserving foreign exchange flexibility – is prudent not only from a fiscal viewpoint but also in a wider macroeconomic sense.


BIS Papers No 44 121
Financial implications of capital outflows in Chile: 1998–20081
Jorge Desormeaux, Karol Fernández and Pablo García
I. Introduction
Over the past decade, the Chilean economy has continued with a gradual process of increasing financial integration with the world, reflected in increased stocks of both foreign assets and foreign liabilities held by domestic residents. This, along with a significant reduction in net foreign liabilities, is probably the main structural external financial development of the past decade (Graph 1).
Graph 1
Net international investment position, by institutional sector As a percentage of GDP1
1 GDP at a constant real exchange rate (base index December 2005 = 100). 2 Estimated from capital account flows.
Source: Central Bank of Chile.
This process has been driven by several factors. Regulatory, normative and legal/tax changes have reduced the wedges that used to constrain the financial relationships between residents and non-residents. The adoption of an inflation targeting framework with flexible exchange rates and a solid commitment to fiscal prudence has helped import the great
1 The authors thank José Matus and Carmen Gloria Silva for their help in obtaining the relevant data.
–100
–80
–60
–40
–20
0
20
40
60
97 98 99 00 01 02 03 04 05 06 Mar 072 Sep 072
Banks Institutional investorsHouseholds and firms General governmentCentral bank Net international investment
position

122 BIS Papers No 44
moderation in inflation and interest rates we have observed in the global economy in the last 20 years. A system of prudential regulation has been a key factor for the development of a sound and stable banking and financial system.
This paper focuses on certain specific issues associated with this process, namely the financial implications arising from increasing holdings of foreign assets by pension funds and the evolving correlation of local and external financial asset prices. Section II of the paper presents the main policy changes implemented in the past 10 years and briefly discusses the issue of capital controls. Section III addresses the role of pension funds in the development of the market for hedging instruments, while Section IV shows the evolving links between local and external interest rates and equity prices. Section V concludes with an exploration of some of the challenges that lie ahead with regard to achieving deeper financial integration with the rest of the world.
II. Structural policy measures since 1999
The outcome of the turbulent period between 1997 and 1998 led to a substantial revision of the policy framework in practically all the relevant dimensions. One of the most important lessons derived from the management of the consequences of the Asian and Russian crises was that there was a need for a significant upgrade in the coordination of macroeconomic policies and a clarification of the relative importance of the different objectives that had been pursued in the previous period.
A list of the measures undertaken since then contains the following:
Suspension of the exchange rate band and adoption of inflation targeting In September 1999, the exchange rate band was finally suspended in favour of a free float after a brief period in which it was quickly widened. The central bank, however, announced that it still held the right to intervene in forex markets, but would do so only under exceptional circumstances, making a public statement regarding the characteristics of the intervention. Later, in 2005, it actually stated that the norm in these circumstances (which coincided with the actual episodes in 2001 and 2002) would be sterilised intervention. This can be understood as the intention by the central bank to sharply distinguish between the use of an extraordinary instrument, intervention, and monetary policy, in such a way as to further shield the inflation targeting regime from the suspicion that it could have an implicit exchange rate target.
Increased financial integration During the first half of this decade the central bank and the government implemented a number of measures that can be interpreted as aiming to strengthen the credibility of the floating exchange rate regime. These consisted in the reduction to 0% of the unremunerated reserve requirement and its subsequent elimination, along with the free trade agreement with the United States (with some restrictive provisions). Additionally, the central bank revamped its whole regulatory framework for foreign exchange rate transactions, in essence eliminating all regulatory burdens except for the information required for balance of payments statistics. The minimum holding period for profits from foreign investment was also lifted, while non-residents were exempted from capital gains taxes in the local stock market as long as they invested in liquid shares.
These measures were also complemented by a gradual but significant increase in the foreign exposure allowed for pension funds. Pension funds in Chile currently hold more than USD 100 billion in assets (around two thirds of GDP), and have a cap on investments abroad of 40%. This is up from a legal limit of 10% in the mid-1990s, which nevertheless was not

BIS Papers No 44 123
binding, given the more profitable investment opportunities offered by the domestic market, which was one of the overall implications of the policy framework in place at that time. The current cap in the law is set to be extended to 45% by April 2007, while the authorities have pledged to further increase this figure to 60% by September 2007 and 80% by September 2008.2
Fiscal policy reforms and statistical consolidation The institutional backing for a floating exchange rate regime, with fully fledged inflation targeting and a widely open capital account, resides in prudent fiscal policy management. Since 2000, fiscal policy has been anchored by a commitment to set annual budgetary expenses in line with long-term fiscal revenues, targeting a small structural surplus. Thus, current fiscal revenues are cyclically adjusted and copper-related earnings are adjusted for deviations from long-term copper prices. As a result, the government was able to run moderate deficits in the early part of this decade (from 2000 to 2003), which then turned into significant surpluses from 2004 onwards, thanks to a large increase in copper prices. The commitment to a fiscal rule was further enhanced in 2005 after a Fiscal Responsibility Law was enacted, detailing the requirements for the annual calculation of the structural surplus implicit in the budget, and also creating specific sovereign wealth funds to save the significant resources accumulated in recent years. It moreover earmarked part of the surplus (in case the fiscal situation allows for it) for the capitalisation of the central bank, by up to 0.5% of GDP per year and up to a cumulative total of 2.5% of GDP by 2010.
Capital controls since 1990 The discussion about capital controls – being understood as specific restrictions on capital inflows or outflows – is part of a long theoretical and empirical debate about the optimal level of openness of the capital account. On one hand, capital account openness should promote economic growth, help to smooth consumption, foment technological spillovers, and even discipline domestic economic players.3 On the other, it may increase output and consumption volatility because of major exposure to an international financial crisis, or because of a loss of independence of monetary policy.4 The optimal level of capital account openness, ie the optimal degree of capital controls, will depend on the estimated magnitude of these potential gains and costs.
This complex debate is influenced by how gains and costs of capital controls are affected by: (i) the type of restriction under consideration (quantitative restrictions, taxes, restrictions on inflows or outflows) and the expected horizon of application; (ii) the interactions between capital flows and the rest of the country’s macroeconomic policies, regulatory policies (especially those related to the financial system) and degree of institutional development; (iii) the degree of commitment, credibility and severity of the implementation process by the authorities.5
2 It should be noted that the law that governs pension fund investments determines maximum and minimum limits
for foreign exposure, giving the central bank the mandate to determine the specific limit within these ranges. In the past few years the central bank has always chosen a limit equal to the maximum stated in the law.
3 For a detailed account of the effects of capital account openness on economic growth see Eichengreen (2001), Edison et al (2002) and Klein (2005). A complete discussion about the effects of capital account openness on financial integration and consumption smoothing is presented in Sheffrin and Woo (1990), Montiel and Reinhart (1999) and Cashin and McDermott (2002).
4 See Krugman (1998), Rodrick (1998), Stiglitz (2000). For a recent and opposite view see Edwards (2005) and Glick et al (2006).
5 Another complication arises from the empirical difficulty of incorporating the endogeneity of decisions about capital account openness or lack thereof (for example the imposition of outflow controls during a crisis).

124 BIS Papers No 44
Table 1 Evolution of capital controls in the world in the 1990s
Characteristics Declared policy objectives Countries Effects of capital controls
Ex ante controls
Gradual, focused and indirect controls (or market controls).
To limit the instability that short-term capital flows may cause.
To change capital flows’ composition to achieve more stable flows, avoiding volatile flows that exacerbate the vulnerability of the domestic financial system.
To preserve monetary policy independence.
Brazil (1993–97)
Chile (1991–98)
Colombia (1993–98)
Malaysia (1994)
Thailand (1995–97)
Some initial effects were accomplished, but no country fulfilled all objectives.
Almost all the countries were able to maintain a spread between local and foreign interest rates.
An appreciation of the local currency was observed in all countries, with different impacts on their current accounts.
Only Malaysia and Thailand were able to reduce the magnitude of capital inflows.
All countries had to resort to sterilisation.
Some evidence indicates that Chile and Colombia were able to reduce short-term capital inflows, and to introduce a wedge between local and international financial markets.
Capital controls in Brazil seem to have been ineffective.1
Ex ante controls
Widespread, and combined with administrative and indirect controls.
To reduce financial vulnerability by imposing extensive and long-term restrictions on international financial transactions.
China (since 1990)
India (since 1990)
These restrictions seem to have limited the exposure of these economies to the Asian crisis, and helped to change the composition of capital inflows in favour of long-term flows.
Other factors that explain these results may be: strong foreign financial position, large size of domestic markets, fewer commercial and financial links with the rest of the world, weak financial development (low financial intermediation of banks); floating exchange rate (India); good management of capital controls.2
Ex post controls
Focused on outflows, combined with administrative and indirect controls.
To limit capital outflows during banking and/or currency crises.
To encourage a more flexible and less contractionary monetary policy.
Malaysia (1998–2001)
Spain (1992)
Thailand (1997–98)
Ideally, capital controls must be employed as a transitory measure while reforms are being implemented (Malaysia), and not as a substitute for reforms. If the incentive to evade capital controls is high (high yield spread) or if controls are less restrictive (Thailand), the capital controls may be less durable and effective (Krugman (1998)).
Ex post controls
Widespread, combined with administrative and indirect controls.
To impose massive currency restrictions on current and capital account transactions.
Romania (1996–97)
Russia (1998–2001)
Venezuela (1994–96)
Controls provided transitory alleviation of pressures on the current account, but did not protect against the fundamental causes of the imbalances.
Controls seem to have reduced access to international financial markets, and this eventually forced the removal of restrictions and persuaded authorities to focus on solutions to the macroeconomic and financial imbalances (Romania and Venezuela).
Extensive liberalisation of capital account
To rapidly suppress capital controls, as a sign of commitment with the implementation of structural reforms and to correct domestic imbalances. To stimulate favourable conditions for capital inflows.
Argentina (1991)
Kenya (1991–95)
Peru (1990–91)
Foreign investment increased in Argentina and Peru, while in Kenya the effect was practically nil.
Timely complementary reforms in Argentina and Peru helped to prevent a recession.
When adequate macroeconomic and financial policies are not implemented, rapid liberalisation of the capital account may increase domestic vulnerabilities to international shocks (Kenya).
1 Cardoso and Goldfajn (1997). 2 Cardoso and Goldfajn (1997). Source: Table prepared by authors

BIS Papers No 44 125
International experiences of capital controls since 1990 During the 1990s, a set of countries employed capital controls in spite of the global tendency towards greater capital account openness.6 Table 1 describes those episodes, distinguishing between ex ante and ex post restrictions. The experience of three countries where a rapid opening-up of the capital account was implemented as a response to an internal crisis is also included in Table 1.
Capital controls in Chile in the 1990s The unremunerated reserve requirement (URR) imposed by the Central Bank of Chile on selective (mostly short-term or financial) capital inflows during 1991–98 represented a tax on inflows. The objectives of the URR were: (i) to avoid currency appreciation; (ii) to enhance the independence of monetary policy; and (iii) to reduce the vulnerability that an increase in external indebtedness – particularly in the short term – might cause.
Empirical evidence suggests that the effects of the URR on the interest rate differential, the appreciating trend, and total capital inflows were limited.7 Additionally, there is no consensus about the role that capital controls played in insulating the economy from external shocks, such as the Asian crisis. Baghwati (1998) argues that capital controls may help prevent contagion, while Cowan and De Gregorio (2006) hold that it is difficult to argue that the URR was an important element behind the relative resiliency of the Chilean economy in the late 1990s. Moreover, Edwards (1998) points out that Chile also had capital controls during the late 1970s and early 1980s and the country could not avoid a deep crisis.
Finally, a large number of studies have emphasised the microeconomic costs of the URR on the Chilean economy. Edwards (1998) argues that the URR affected the domestic financial services industry, and discriminated against small and medium-sized firms, which were not able to access long-term financing to reduce the burden of the tax.8 Cowan and De Gregorio (2006) maintain that the URR may have had some influence on the low intermediation of foreign capital observed by domestic banks.
III. Pension funds’ financial outflows and their financial implications
Graphs 2 and 3 present capital account flows to emerging market economies and to Chile in particular.9 A cursory glance at the main shapes of these flows shows a high degree of coincidence. The pre-Asian crisis situation was characterised by a striking absence of outflows, and hence the current account, the net inflows and gross inflows all coincided. This has changed dramatically in the present decade. Outflows are of the same order of magnitude as inflows, and therefore a sharp fall in the availability of financing to the current account cannot necessarily be attributed to capital flow reversals. Moreover, Chile has not shown a qualitatively different pattern of net inflows, or larger outflows and inflows, when compared to other emerging economies.
6 See Edwards (2005) and Miniane (2004). 7 See Valdés-Prieto and Soto (1996), Larraín et al (1997), Edwards (1999), Gallego et al (1999) and
De Gregorio et al (2000). 8 Forbes (2007) measures this point. 9 See Ahumada et al (2006b) for a detailed look at these patterns.

126 BIS Papers No 44
Graph 2
Capital account flows to emerging market economies1 In billions of US dollars
1 By convention, inflows are registered with a positive sign and outflows with a negative sign. A positive (negative) inflow indicates an increase (decrease) of inflows, while a positive (negative) outflow indicates a decrease (increase) of outflows. Countries included in the sample are Brazil, Chile, China, the Czech Republic, Hungary, India, Korea, Malaysia, Mexico, Poland, Russia, South Africa, Thailand and Turkey.
Source: Authors’ calculations, based on Ahumada et al (2006b).
Graph 3
Capital account flows to Chile In billions of US dollars
Source: Authors’ calculations, based on Ahumada et al (2006b).
–20
–15
–10
–5
0
5
10
15
93 94 95 96 97 98 99 00 01 02 03 04 05 06
FDI outflows Equity securities outflows Debt outflows FDI inflowsEquity securities inflows Debt inflowsNet inflows
–400 –300 –200 –100
0
100 200 300 400 500 600
93 94 95 96 97 98 99 00 01 02 03 04 05 06
FDI outflows Equity securities outflows Debt outflows FDI inflows Equity securities inflows Debt inflows Net inflows

BIS Papers No 44 127
In the case of Chile this point was forcefully made by Cowan et al (2007), by showing that the usual interpretation of a sudden stop in capital inflows was an inadequate rendering of the Chilean balance of payments evolution in 1997 and 1998. Indeed, the reduction in net inflows from 1997 to 1999 was driven by a sudden start (their expression) in outflows, mostly in debt but also on equity instruments. This stands in sharp contrast with the overall experience of emerging economies which did suffer a dramatic reversal in capital account debt inflows over this period.
What were the drivers of this sharp increase in outflows in Chile in 1998 and 1999? It is readily apparent from official data (including both the balance of payments and the international investment position) that local banks as well as pension funds played a large role in shifting the capital account situation.
Graph 4 presents the foreign exposure of pension funds since the mid-1990s. As noted previously, early on pension funds did not hold many foreign assets, given that the policy mix of an exchange rate band and high local interest rates made local investment opportunities more attractive. However, starting with the turmoil that the Asian crisis provoked in 1997 and 1998, and following the relaxation of controls on capital flows and the floating of the peso from 1998 to 2001, pension funds rapidly reached their regulatory limit. This amounted to a substantial capital outflow, reaching a cumulative total of USD 3,325.3 million in the period from 1997 to 2000.
Graph 4 Net foreign currency exposure of pension funds, 1996–20071
As a percentage of total assets
1 As of August 2007. 2 Each fund’s limit is weighted by size.
Source: Authors’ calculations, based on data from the Superintendencia de Administradoras de Fondos de Pensiones.
The second source of capital outflows was the banking system. Graph 5 shows foreign currency assets and liabilities of the banking sector. Some patterns can also be related to the changing macroeconomic policy framework of these years. A reduction in both foreign assets and liabilities under the exchange rate band regime was followed by a rapid increase in the foreign asset position from 1997 to 2000, which coincided with the Asian and Russian crises
0
5
10
15
20
25
30
35
40
96 97 98 99 00 01 02 03 04 05 06 07
Maximum foreign investment limit
Assets in foreign currency
Foreign currency exposure
Maximum uncovered limit2

128 BIS Papers No 44
and the regime shift. The cumulative net change in the foreign exchange position held by the financial sector reached around USD 1,700 million between 1997 and 2000.
Graph 5 Bank assets and liabilities in foreign currency, 1989–20071
As a percentage of total assets
1 As of October 2007.
Source: Superintendencia de Bancos e Instituciones Financieras.
Therefore, a case could be made that the policy regime changes led to some stress-inducing capital outflows from the last part of the 1990s to the early part of this decade. However, a full appraisal has to take into account more recent developments and the structural implications of the new circumstances.
Prominent among these is the sustained increase in the holdings of external assets by pension funds. From 2001 to 2007, the share of the portfolio that could be allocated abroad rose from a little over 15% to 40%. The central bank moved in tandem with these shifts and pension funds also quickly kept pace with the new regulatory limits.
A significant change occurred in 2002, when foreign asset exposure was legally separated from foreign currency exposure, while also introducing a multi-fund structure to pension funds’ portfolios that allows contributors to the system to decide the overall risk profile of their pension allocation. In macroeconomic terms, the first modification has had significant implications. As Graph 4 shows, although pension funds have diversified their exposure to foreign assets up to the legal limit, they have not fully hedged their currency exposure. The latter has increased but has remained well below the legal limit.10 A rough calculation shows that on average the unhedged foreign currency exposure of pension funds is only 20% of the maximum allowed by law.
10 The legal limit allows pension funds to hold up to 25% of their foreign currency exposure unhedged.
0
10
20
30
Loans Financial investments Other Disposable
-30
-20
-10
0
89 91 93 95 97 99 01 03 05 07
Deposits Credit lines Fixed rate Contingencies

BIS Papers No 44 129
What are the financial implications of this situation? On the one hand, pension funds are hedging a substantial part of their exposure to foreign exchange rate risk, although in the future the degree to which they undertake this will be determined by the actual portfolio decisions of pension contributors. How much exchange rate fluctuations affect the perceived wealth of contributors and therefore their current financial and real decisions is open to question. Pension funds are in this sense the proper vehicle to bear market risk, and are not subject to liquidity risk. On the other hand, one important structural implication of pension funds hedging their exchange rate risk, ie selling long forward positions in foreign exchange to the local banking system, is that local banks, by aiming to keep their foreign exchange exposure close to zero, intermediate this position by also selling long forward positions in foreign exchange to their clients. Thus, the clients of the banking system (most notably corporations faced with future foreign exchange commitments, for instance related to external debt) find a ready counterpart to buy long forward positions in foreign exchange in the banking system and thus hedge their balance sheet exposure to exchange rate risk.
Regulations in place imply that pension funds have to hedge their foreign exchange exposure locally. Thus, there is a significant stock supply of foreign currency which is sold forward and intermediated in the over-the-counter (OTC) market by banks.11 Concurrently, market and liquidity risk regulations put in place by the central bank in 2004 and 2005 have further increased the role of banks in the intermediation of this hedging supply, as the capital requirements for bank holdings of unhedged foreign currency positions have remained high. This explains why the net foreign currency exposure of banks is very low, as shown in Graph 5.
Graph 6 shows the counterparties for banks’ foreign currency derivatives transactions, as of June 2007. As can be readily seen, pension funds are a large participant in the long forward forex positions of banks. The counterpart to this situation is a substantial short forward forex position held by banks with firms and non-residents. Thus, pension funds are indirectly providing forex hedging opportunities to Chilean firms.
Table 2 shows a view of the demand for hedging from manufacturing firms. Clearly only large and very large firms are important players in this market, although this might be related to the fact that small firms are not prominent in the export sector.
From the financial sector side, it is also the case that the hedging supply from pension funds is intermediated through specific banks. Table 3 displays the foreign exchange section of the balance sheet of specific groups of banks.12 Over time, it shows that the notional size of derivatives only increased after 1999, coinciding with the policy measures mentioned earlier. Moreover, the net mismatch is low in all groupings, and has remained so over time, reflecting the fact that the pattern in Graph 5 is relevant to different groups of banks. However, the most striking feature of recent developments is the disproportionate participation of “treasury banks”, essentially branches of large international investment banks. Although they only represent 3.6% of total assets and 9.6% of total capital of the banking sector, as of September 2007 they provided 37.3% of the total notional forward short position in forex currency.
11 Due to a number of issues, exchange-traded derivatives are very scarce, if not inexistent. 12 Due to the size of the economy, the Chilean banking sector comprises only 26 banks.

130 BIS Papers No 44
Graph 6
Counterparties in banks’ foreign currency derivatives operations1
As a percentage of notional value
1 As of June 2007.
Source: Central Bank of Chile.
The significant size of pension funds has also implied that large shifts in their demand for foreign exchange hedging have had a significant impact on inshore dollar markets. Due probably to tax wedges and the small size of the market, pension fund portfolio shifts have led to significant changes in the premia in the forward market. However, from an overall macroeconomic perspective, the implications of pension funds’ portfolio shifts for the main financial prices, such as the exchange rate, stock prices, or long-term interest rates, have been muted, small and transitory at best. As the next section shows, these have broadly moved in tandem with global and local macroeconomic developments.
Long position
Intermediaries 5%
Foreign22% Pension funds
25%
Firms6%
Life insurance companies
2%
Banks39%
Short position
Intermediaries 7%
Banks40%
Life insurance companies
0.2%
Pension funds2% Firms
16%
Foreign 35%

BIS Papers No 44 131
Table 2
Financial debt and use of derivatives
Size1 Units2 [USD thousands]
Small3 (0,960]
Medium(92,960]
Large (960, 3.839]
Mega (3.839, 23.032]
Total [0, °)
Total domestic bank debt4
Firms [number] 1,713 1,113 688 330 3,844 [% of the group] 72.3% 83.7% 87.4% 90.4% 79.3%
Amount of debt [% of the total] 2.6% 5.8% 19.4% 72.2% 100.0% [% of group sales] 17.4% 15.4% 17.6% 8.7% 10.1%
Domestic debt in foreign currency
Firms [number] 110 326 421 265 1,122 [% of the group] 4.6% 24.5% 53.5% 72.6% 23.1% Amount of debt [% of the total] 0.4% 1.6% 14.0% 84.0% 100.0%
[% of group sales] 1.2% 2.0% 5.9% 4.7% 4.7%
External debt Firms [number] 8 16 41 76 141 [% of the group] 0.3% 1.2% 5.2% 20.8% 2.9% Amount of debt [% of the total] 0.1% 0.3% 1.7% 98.0% 100.0%
[% of group sales] 0.3% 0.4% 0.8% 6.6% 5.6%
Currency derivatives market (long and short positions)
Firms [number] 2 15 81 65 163 [% of the group] 0.1% 1.1% 10.3% 17.8% 3.4%
Notional amount5 [% of the total] 0.6% 0.3% 11.6% 87.5% 100.0% [% of group sales] 0.5% 0.1% 1.4% 1.4% 1.3%
1 Of the firms in the ENIA manufacturing survey, 67 have FECUs (standardised financial statements), and 55 of these are “mega firms”. 2 [% of total] refers to the percentage that the size group represents in the total. [% of group] is the fraction of firms in the size group presenting values different from zero for the variable in question. [% of group sales] is the percentage that the variable in question represents in the total sales of the group. 3 Small firms include 134 “micro firms” (sales < USD 92,000). 4 The simple average of bank debt over sales for the FECU firms in the sample is 18%. The same average, using bank liabilities and operating income of the FECU firms, is 20%. For this same group of firms, the simple average of the ratio of the notional amount of derivatives (short and long positions) and the sales reported in the ENIA is 3.6%. The same ratio using operating income from the FECUs is 3.6%, and it falls to 1.8% if total assets from the FECUs are used instead of operating income. 5 The value of the notional amount over total sales for small firms is determined by a firm that has a ratio of the notional amount to sales of 600%.
Source: Cowan et al (2006).

132 BIS Papers No 44
Table 3
Foreign currency mismatches, by type of bank, 1989–20071 As a percentage of total assets
Private multibanks2
State-owned bank
Medium-sized banks3 Treasury banks4
Pre- 1999
1999–2004
Post- 2004
Pre- 1999
1999–2004
Post- 2004
Pre- 1999
1999–2004
Post- 2004
Pre- 1999
1999–2004
Post- 2004
Assets 19 17 19 14 4 11 17 13 15 33 29 25 Loans 14 11 11 8 4 4 13 10 11 19 14 9 Financial investments
2
3
2
3
2
2
1
2
1
3
2
3
Liabilities 19 17 20 11 6 12 18 14 14 27 27 25 Fixed-term deposits
4
5
6
0
1
6
3
5
4
6
9
11
Credit lines 9 4 7 8 2 2 8 4 4 11 4 1
Gross mismatch
–1
0
–1
2
–3
–1
0
–2
1
6
2
0
Long position 3 13 10 2 11 6 8 23 9 24 213 159 Short position 4 16 9 2 15 6 9 29 10 25 226 163
Net mismatch 1 2 –3 2 1 –2 1 4 1 6 15 4
1 As of October 2007. 2 Private multibanks include: Banco de Chile, Santander Santiago and BCI. 3 Medium-sized banks include: BBVA, Corpbanca, Banco BICE, Itaú, Citibank, Banco Internacional, Security, Rabobank, Scotiabank, Banco del Desarrollo, Falabella, Ripley and Paris. 4 Treasury banks include: JPMorgan Chase, HSBC, ABN Amro, Deutsche Bank, Tokyo, Banco Nación Argentina, Banco do Brasil, Monex and Penta.
Source: Authors’ calculations, based on Figueroa and Jara (2006).
IV. Asset prices over the period of higher financial integration
Following Cifuentes and Desormeaux (2003), we look at various measures of financial integration in the Chilean economy, in order to asses its extent and evolution since the early 1990s. We analyse the case of the stock and fixed income markets, correlating the returns of domestic and US instruments. In order to capture the evolution of financial integration over time, two-year moving windows were used for the estimations.
Stock exchange Graph 7 shows the domestic stock market index (IPSA) compared with the Dow Jones index from January 1990 to October 2007.

BIS Papers No 44 133
Graph 7
Stock market indexes In local currency
Source: Bloomberg.
Since the data series are stationary, we can estimate the following equation on returns:
))1(log()log()log( −β+α+= IPSAdDowJonesdcIPSAd
where the log differences correspond to the returns of the series. Coefficient α measures the degree of correlation between the IPSA and Dow Jones returns in US dollars, and coefficient β captures the importance of returns in the previous period in explaining today’s return.
Graph 8
Correlation of daily returns between IPSA and Dow Jones
-0.20
0.00
0.20
0.40
0.60
0.80
1.00
Jan.92 Jan.95 Jan.98 Jan.01 Jan.04 Jan.07-4
-2
0
2
4
6
8
10
12
14
16Coefficient t-statistic
Source: Authors’ calculations, based on data from Bloomberg.
0
2,000
4,000
6,000
8,000
10,000
12,000
14,000
Jan 90 Jan 94 Jan 98 Jan 02 Jan 06 0
500
1,000
1,500
2,000
2,500
3,000
3,500 Dow Jones IPSA

134 BIS Papers No 44
Graph 8 shows the values of the coefficient α in the left-hand axis and its significance on the right-hand axis. A band between the values –2 and 2 shows the area where the estimated coefficient is not significantly different from zero. Correlation between the domestic and foreign stock markets became significant by mid-1994 and has remained so throughout the sample. Given our two-year windows, this suggests that financial integration at the level of stock markets became a significant phenomenon by mid-1992. The estimated values of α fluctuate between 0.2 and 0.8, reaching peaks in 2000 and 2007. These correspond to episodes of strong co-movements across markets that are captured by the moving window. The first episode corresponds to the bursting of the technology bubble in 2000 and the second to the recent turbulence in financial markets derived from the subprime crisis.
Stock market volatility, measured in Graph 9 by the standard deviation of a two-year window of daily returns, shows a decreasing trend, particularly after the bursting of the dotcom bubble in 2000, with a small reversal at the end of the sample period, when the turbulence derived from the subprime crisis ensued. In theory, integration should lead to lower volatility, as a larger investor base and more liquid markets should help to diffuse the effect of local shocks. But at the same time, external shocks will be transmitted more easily to the domestic market, which is also clear in Graph 9 for the 1995–97 and 1998–2000 periods.
Graph 9
Daily IPSA returns: average and standard deviation In per cent
Source: Authors’ calculations, based on data from Bloomberg.
Interest rates For fixed income instruments we explore evidence about financial integration on the money market and the market for long-term bonds (see Graphs 10 and 11). As in Cifuentes and Desormeaux (2003), we use the money market as our test of monetary independence, as it is the market used by the central bank to target interest rates.
0.00
0.20
0.40
0.60
0.80
1.00
1.20
1.40
1.60
1.80
Jan 92 Jan 95 Jan 98 Jan 01 Jan 04 Jan 07–0.20
–0.10
0.00
0.10
0.20
0.30
0.40 Standard deviation Average

BIS Papers No 44 135
Graph 10
Short-term domestic and foreign interest rates In per cent
Sources: Central Bank of Chile; Bloomberg.
Graph 11
Correlation between domestic (inflation-adjusted) and foreign short-term rates
Source: Authors’ calculations.
–1
–0.8
–0.6
–0.4
–0.2
0
0.2
0.4
0.6
0.8
1
Jan 95 Jan 96 Jan 97 Jan 98 Jan 99 Jan 00 Jan 01 –2.5
–2
–1.5
–1
–0.5
0
0.5
1
1.5
2
2.5 Coefficient t-statistic
0
2
4
6
8
10
Jan 90 Jan 94 Jan 98 Jan 02 Jan 06 0
5
10
15
20
25
US 90-day deposit rateChilean 90-day indexed deposit rateChilean 90-day nominal deposit rate

136 BIS Papers No 44
The estimated equation13 uses the expected depreciation of the peso against the US dollar and sovereign risk premium as controls, specifically:
ρβ+⎟⎟⎠
⎞⎜⎜⎝
⎛β+α+= +
21
1* log
t
et
EE
ici
where coefficient α measures the partial correlation between the domestic and foreign interest rates, and coefficients β1 and β2 capture the importance of the expected depreciation of the peso and the sovereign risk premium, respectively, in explaining the level of the domestic interest rate. The real exchange rate is employed in the estimation for inflation-adjusted interest rates.
First we compare the US three-month deposit rate with the domestic 90-day indexed deposit rate, using two-year moving windows. After July 2001, when the Central Bank of Chile started targeting nominal interest rates, we compare nominal rates over a six-month moving window, because we have a smaller number of observations.
Graph 12
Correlation between nominal domestic and foreign short-term rates
Source: Authors’ calculations.
When indexed domestic rates are employed, the coefficient that captures the partial correlation between domestic and foreign short-term rates is not significant in any period (Graph 11). This can be interpreted as evidence of independence of monetary policy, an expected result. The same result applies when nominal short-term rates are used to test financial integration, after July 2001. However, during two brief periods, at the end of 2004 and in mid-2006, the correlation between domestic and foreign short-term rates becomes significant, positive in the first episode and negative in the second (Graph 12). This may be
13 This is a first-order approximation of the uncovered interest rate parity equation.
–8
–6
–4
–2
0
2
4
6
8
Mar 02 Mar 03 Mar 04 Mar 05 Mar 06 Mar 07–4
–3
–2
–1
0
1
2
3
4Coefficient t-statistic

BIS Papers No 44 137
the result of similar shocks that affected short-term rates or their determinants both domestically and abroad. We have no clear explanation for the first episode, but the second (mid-2006) corresponds with the financial market turbulence of May–June 2006, which gave rise to a flight to quality and an increase in sovereign spreads. As a result, domestic and foreign short-term rates moved in opposite directions. Except for these two brief episodes, our results suggest that domestic and foreign short-term nominal rates are not correlated, which confirms our previous result in favour of monetary independence.
The longer-term market will give us a better idea of financial integration, since it is less influenced by monetary policy. In Graph 13 we compare the rates on a five-year US TIP bond with those of a five-year bullet and eight-year coupon bond issued by the Central Bank of Chile (CBCh), which have similar durations. Next, in Graph 14 we compare five-year nominal bond rates. We used daily data for domestic and foreign interest rates, using six-month moving windows to evaluate the evidence due to the small number of observations. When we employed inflation-adjusted rates, the estimated coefficient, in Graph 15, does not differ significantly from zero for most of the sample. This result is not surprising, as the rates on inflation-adjusted instruments seem to be affected mostly by idiosyncratic elements, such as the capital gains associated with changes in expected future inflation, and are held almost exclusively by domestic institutional investors. However, when nominal rates are employed, correlation is significant for most of the sample, and pass-through coefficients show an upward trend, an unequivocal sign of an increasing degree of financial integration (Graph 16).
Graph 13
Long-term domestic and foreign inflation-adjusted interest rates
In per cent
Sources: Central Bank of Chile; Bloomberg.
0
2
4
6
8
10
12
Apr 92 Apr 94 Apr 96 Apr 98 Apr 00 Apr 02 Apr 04 Apr 06
Eight-year indexed CBCh bond
Five-year indexed CBCh bond
Five-year indexed US Treasury Bond

138 BIS Papers No 44
Graph 14
Long-term domestic and foreign nominal interest rates In per cent
Sources: Central Bank of Chile; Bloomberg.
Graph 15
Correlation between local and foreign inflation-adjusted long-term rates
Source: Authors’ calculations.
1
2
3
4
5
6
7
8
9
10
Jan 90 Jan 94 Jan 98 Jan 02 Jan 06
Five-year nominal CBCh bondFive-year US Treasury bond
–0.3
–0.2
–0.1
0
0.1
0.2
0.3
Oct 4 Apr 05 Oct 05 Apr 06 Oct 06 Apr 07 Oct 07 –3
–2
–1
0
1
2
3Coefficient t-statistic

BIS Papers No 44 139
Graph 16
Correlation between local and foreign nominal long-term rates
Source: Authors’ calculations.
Impact of changes in foreign investment limits of pension funds There is evidence that shifts in foreign investment limits of pension funds have a limited impact on asset prices. Using a monthly stock return model, Silva (2007) finds no evidence that pension fund stock transactions affect aggregate market returns in Chile. The author proposes that Chile’s growing integration with international financial markets reduces the effect of pension funds on local stock market prices. Additionally, there is evidence that changes in investment limits of pension funds have a limited effect on interest and exchange rates. On the one hand, Silva and Selaive (2008) find that a rise of 5% in the foreign investment limit causes an increase of only 1 basis point on inflation-adjusted interest rates. On the other hand, Cowan et al (2008) demonstrate that an increase of 10% in investment limits is associated with an accumulated depreciation of 2% of the Chilean peso against the US dollar.
V. Conclusions and challenges ahead
The process of financial integration undergone by the Chilean economy in the past decade has not involved a significant increase in financial volatility, has allowed enhanced risk-sharing for domestic investors, and has contributed to the development of the local derivatives market (Graph 17).
–2
–1.5
–1
–0.5
0
0.5
1
1.5
2
Feb 03 Oct 03 Jun 04 Feb 05 Oct 05 Jun 06 Feb 07 Oct 07 –20
–15
–10
–5
0
5
10
15
20 Coefficient t-statistic

140 BIS Papers No 44
Graph 17
Spot and derivatives transactions in Chile1 In billions of US dollars
1 Corresponds to the total actual buy and sell transactions realised in the calendar year.
Source: Central Bank of Chile.
Although this process of integration has been impressive, some challenges and developments remain for a further deepening of the financial links between Chile and the rest of the world. We tentatively explore some of these avenues below.
First, cross-border flows of spot peso transactions are practically non-existent. This explains the significant role of the non-deliverable forward market as the derivatives market of choice for non-residents aiming to shift their exposure to the Chilean peso. This is probably linked to several aspects. Although participation by non-residents in local equity markets has been widespread after the waiver of capital gains tax in the case of transactions in liquid stocks, this has not been implemented in practice for fixed income transactions. Other related tax initiatives that could help in this direction are the administration of the withholding tax of 4% on interest income and enhanced clarity in the legal treatment of derivatives. Most of these aspects are currently under consideration by the Ministry of Finance.
Second, although our payment and settlement infrastructure for securities has been sharply revamped thanks to the adoption of real-time gross settlement for central bank money, steps need to be undertaken to reduce settlement risk in foreign currency payments, as well as in local securities. Both the Ministry of Finance and the central bank are currently actively looking into these issues.
Finally, the main challenge when aiming at further financial integration with the world is to closely monitor the financial stability implications of this integration. The tension between efficiency and security is probably the sharpest for an emerging economy in the area of external integration. Even financial systems where regulatory best practices and a generally sound macroeconomic framework are in place have been recently subject to sharp bouts of financial turbulence. Avoiding costly and disruptive financial crises, by timely policy actions and proper coordination, is probably the main challenge ahead for the Chilean economy, as well as for other emerging economies around the world.
241292
596
0
100
200
300
400
500
600
1998 1999 2000 2001 2002 2003 2004 2005 2006
External derivatives market Local derivatives market Local spot market

BIS Papers No 44 141
References
Ahumada, L A, F Alarcón, J Selaive and J M Villena (2006a): “The Development of the Currency Derivatives Market in Chile”, in Central Bank of Chile, Financial Stability Report, First Half 2006.
Ahumada, L A, C Echeverría, S Godoy and N Silva (2006b): “Characterization of Financial Account Asset and Liability Flows: Chile, 1993–2004”, in Central Bank of Chile, Financial Stability Report, First Half 2006.
Bhagwati, J (1998): “The Capital Myth: The Difference between Trade in Widgets and Dollars”, Foreign Affairs, vol 77, no 3, pp 7–12.
Cardoso, E and I Goldfajn (1997): “Capital Flows to Brazil: The Endogeneity of Capital Controls”, IMF Working Paper WP/97/115, International Monetary Fund.
Cashin, P and J McDermott (2002): “Intertemporal Consumption Smoothing and Capital Mobility: Evidence from Australia”, Australian Economic Papers, vol 41, no 1, pp 82–98.
Cifuentes, R and J Desormeaux (2003): “Monetary policy and financial integration: the case of Chile”, in BIS Papers, no 23, “Globalisation and monetary policy in emerging markets”, May, pp 109–23.
Cowan, K and J De Gregorio (2006): “International Borrowing, Capital Controls and the Exchange Rate: Lessons from Chile”, NBER Working Papers, no 11382, National Bureau of Economic Research.
Cowan, K, J De Gregorio, A Micco and C Neilson (2007): “Financial Diversification, Sudden Stops and Sudden Starts”, Central Bank of Chile Working Papers, no 423.
Cowan, K, A Micco and A Yáñez (2006): “Currency Mismatches in Chilean Manufacturing Firms”, in Central Bank of Chile, Financial Stability Report, First Half 2006.
Cowan, K, D Rappoport and J Selaive (2008): “Tipo de cambio y límites de inversión en el extranjero de los fondos de pensiones”, in Banco Central de Chile, Informe de Estabilidad Financiera, Segundo Semestre 2007.
De Gregorio, J, S Edwards and R Valdés (2000): “Controls on capital inflows: Do they work?”, NBER Working Papers, no 7645, National Bureau of Economic Research.
Edison, H, R Levine, L Ricci and T Sløk (2002): “International financial integration and economic growth”, Journal of International Money and Finance, vol 21, November, pp 749–76.
Edwards, S (1998): “Capital Flows, Real Exchange Rates, and Capital Controls: Some Latin American Experiences”, NBER Working Papers, no 6800, National Bureau of Economic Research.
——— (1999): “How Effective are Capital Controls?”, Journal of Economic Perspectives, vol 13, no 4, pp 65–84.
——— (2005): “Capital Controls, Sudden Stops and Current Account Reversals”, NBER Working Papers, no 11170, National Bureau of Economic Research.
Eichengreen, B (2001): “Capital account liberalization: what do cross-country studies tell us?”, The World Bank Economic Review, vol 15, no 3, pp 344–65.
Figueroa, L and A Jara (2006): “Currency Mismatch in the Chilean Banking System”, in Central Bank of Chile, Financial Stability Report, Second Half 2006.
Forbes, K (2007): “One cost of the Chilean capital controls: increased financial constraints for smaller traded firms”, Journal of International Economics, vol 71, issue 2, pp 294–323.

142 BIS Papers No 44
Gallego, F, L Hernández and K Schmidt-Hebbel (1999): “Capital Controls in Chile: Effective? Efficient?”, Central Bank of Chile Working Papers, no 59, December.
Glick, R, X Guo and M Hutchison (2006): “Currency Crises, Capital Account Liberalization, and Selection Bias”, The Review of Economics and Statistics, vol 88, issue 4, November, pp 698–714.
Klein, M W (2005): “Capital account liberalization, institutional quality and economic growth: theory and evidence”, NBER Working Papers, no 11112, National Bureau of Economic Research.
Krugman, P (1998): Bubble, boom, crash: theoretical notes on Asia’s crisis, manuscript.
Labán, R and F Larraín (1997): “Can a Liberalization of Capital Outflows Increase Net Capital Inflows?”, Journal of International Money and Finance, vol 16, issue 3, pp 415–31.
Larraín, F, R Labán and R Chumacero (1997): “What determines capital inflows?: an empirical analysis for Chile,” Faculty Research Working Paper Series, Kennedy School of Government, Harvard University, 97-09, April.
Miniane, J (2004): “A New Set of Measures on Capital Account Restrictions”, IMF Staff Papers, vol 51, no 2, International Monetary Fund, August.
Montiel, P and C Reinhart (1999): “Do capital controls and macroeconomic policies influence the volume and composition of capital flows? Evidence from the 1990s”, Journal of International Money and Finance, vol 18, issue 4, pp 619–35.
Prasad, E and S J Wei (2005): “The Chinese Approach to Capital Inflows: Patterns and Possible Explanations”, NBER Working Papers, no 11306, National Bureau of Economic Research.
Rodrik, D (1998): “Who Needs Capital-Account Convertibility?”, in Essays in International Finance, no 207, “Should the IMF pursue capital-account convertibility?”, International Finance Section, Department of Economics, Princeton University, May.
Shah, A and I Patnaik (2005): “India’s Experience with Capital Flows: The Elusive Quest for a Sustainable Current Account Deficit”, NBER Working Papers, no 11387, National Bureau of Economic Research.
Silva, C G (2007): “Impact of pension fund transactions on the local stock market”, in Central Bank of Chile, Financial Stability Report, First Half 2007.
Silva, C G and J Selaive (2008): “Fondos de pensiones y tasas de interés de instrumentos del Banco Central de Chile”, in Banco Central de Chile, Informe de Estabilidad Financiera, Segundo Semestre 2007.
Sheffrin, S and Woo, W T (1990) "Present value tests of an intertemporal model of the current account." Journal of International Economics, 29(3-4), pp 237-53.
Stiglitz, J (2000): “Capital Market Liberalization, Economic Growth, and Instability”, World Development, vol 28, no 6, pp 1075–86.
Valdés-Prieto, S and M Soto (1996): “¿Es el Control Selectivo de Capitales Efectivo en Chile? Su efecto Sobre el Tipo de Cambio Real”, Cuadernos de Economía, vol 33, no 98, pp 77–108.

BIS Papers No 44 143
China: the evolution of foreign exchange controls and the consequences of capital flows
People’s Bank of China
I. Introduction
With the adoption of market-oriented economic system reforms and the opening-up policy since 1978, China’s economy has become increasingly integrated in the world economy. Under the guidance of the opening-up policy, foreign exchange administration controls have gradually been eased. These reforms have fuelled the expansion of foreign trade and capital inflows. Between 1994 and 2006, China’s trade volume increased eightfold and, during the same period, the foreign trade to GDP ratio increased from 45.7% to 65.7%, a 20 percentage point growth, and the country’s share in world trade increased from 0.8% in 1978 to 7.7% in 2005. China has also become the largest recipient of foreign direct investment (FDI) among developing countries. Economic and financial integration have made remarkable contributions to China’s rapid economic growth, but have also had a dragging effect on the adjustment of the country’s structural imbalances, posing great challenges to China’s monetary policy in recent years.
II. The evolution of China’s foreign exchange administration policy since 1994
In November 1993 the Third Plenum of the Fourteenth CPC Central Committee approved a comprehensive reform strategy in which foreign exchange management reforms were highlighted as a key element for a market-oriented economy. A market-based unified floating exchange regime and RMB convertibility were seen as the ultimate goals of the exchange reform. A foreign exchange surrender and purchase system (FESPS) was put in place. Firms were to surrender their foreign exchange earnings from current account transactions and purchase foreign exchange from a foreign exchange designated bank (FEDB) when a payment in foreign currency was needed. The RMB thereby achieved so-called conditional convertibility under the current account. In 1996 foreign-funded enterprises were included in the system and China officially announced its acceptance of Article VIII of the IMF Articles of Agreement.
In recent years, quotas for enterprises holding their foreign exchange earnings under the current account have been raised several times; enterprises with authentic trade activities have been allowed to purchase foreign exchange in advance to pay foreign counterparties; enterprises' foreign exchange accounts under the current account have been managed on a recording basis; and foreign exchange purchase and payment procedures for trade in services have been simplified. Since 2007, annual foreign exchange purchases and sales quotas for individuals have been set at US$ 50,000 to meet their needs for holding and using foreign exchange.
In sequencing the liberalisation of the capital account, China has followed an “FDI first” policy. After 1994, significant progress was made in opening up to FDI. More regions were opened to foreign investment, and ownership requirements for FDI in most industries were relaxed. The authority to approve FDI projects was assigned to local governments. From 1995, foreign-funded enterprises (FFEs) could engage in state-owned enterprise (SOE) reform by purchasing equity or injecting capital.

144 BIS Papers No 44
Except for FDI, all capital account transactions were to be approved by the People’s Bank of China (PBC). The receipts from capital account transactions, including external borrowing, IPO and bond issuance, had to be deposited in a specified account and used for specified expenditures. Conversion of receipts into RMB was generally not allowed.
In December 2001 China joined the World Trade Organization (WTO). This event marked a new era for China’s external sector liberalisation. In addition to tariff cuts, China promised to eliminate over the next few years most restrictions on foreign entry and ownership, as well as most forms of discrimination against foreign firms. A large number of key services were to be opened up to foreign competition, including important business services, courier services, wholesale trade, franchising, tourism services, rail and road transport, and freight forwarding services. In many other services, substantial foreign entry was to be allowed, including in telecommunications, audiovisual services, construction, retail trade, insurance, banking, securities, and maritime transport.
Since China’s accession to the WTO, significant progress has been made. In the banking sector, more cities have been opened to foreign banks to conduct business in RMB; China has also made a breakthrough in capital market liberalisation. Since 2001, domestic investors, including individual residents, have been allowed to invest their own foreign exchange in B-shares. Starting from 2002, qualified foreign institutional investors (QFII) have been allowed to invest in the domestic capital market. Since 2004, insurance companies have been allowed to use their own foreign exchange to invest in the international capital market. In 2005, the first foreign company was listed on the Shanghai Stock Exchange, and in the same year, domestic firms were allowed to set up special purpose corporations abroad to facilitate overseas listing, mergers and acquisitions.
Since China joined the WTO, the country has experienced a sharp increase in both current account surplus and capital inflows. By end-2007, the foreign exchange reserves had increased to USD 1,528.2 billion. The rapid build-up of foreign exchange reserves has complicated monetary policy and increased pressure for RMB appreciation.
In response to these developments, the authorities have taken measures to promote balanced capital inflows and outflows. The measures include: (i) enhancing the verification of export receipts to stop disguised capital inflows; (ii) expanding the right of firms to hold foreign exchange earnings abroad or in bank accounts; the qualifications for domestic firms retaining foreign exchange in a bank account were lowered and the ceiling on the account was raised several times during the period; and (iii) imposing limits on FFEs and foreign banks’ external borrowing, etc.
In 2003, the provisional regulation on external debt further limited capital inflows. The long-term external debt quota was extended to foreign banks in China. In 2005, import payments overdue six months or amounting to over USD 200,000 had to be registered as external debt. Ceilings were imposed on the scale of the external debt of foreign invested companies. Measures introduced to facilitate capital outflows included: (i) in October 2002, a pilot programme was launched in six coastal provinces to allow provincial authorities to approve firms’ purchase of foreign exchange for overseas investment; this policy was eventually extended nationwide in 2005; (ii) the ceilings on residents’ carrying of foreign exchange in cash across the border and on residents’ purchase of foreign exchange for purposes of tourism and overseas study were raised several times and, in 2004, the restriction on transferring assets overseas was further relaxed; (iii) the ceiling on firms’ settlement account balance was abandoned; and (iv) in 2007, overseas financial investments were expanded by broadening the commercial banks’ overseas investment instruments and including trust and investment companies to develop qualified domestic institutional investors (QDII) businesses.

BIS Papers No 44 145
III. Capital flow conditions since 2000
Under the opening-up policy, together with the current account convertibility of RMB and the FDI-led financial integration, China has seen a vast expansion of foreign trade and FDI inflows. Since the 1990s, China has recorded twin surpluses on current and capital accounts. Since 2001, China has undergone a new round of foreign currency inflows due to twin surpluses in balance of payments (BOP) accounts. The current account surplus was USD 12 billion in 1990 and USD 249.9 billion in 2006. Since 2004, China has received annual FDI in excess of USD 60 billion, one of the highest levels in the world.
Graph 1
The structure of foreign currency inflows, 1990–2006 In USD 100 millions
Source: CEIC.
Since 1990, the current account surplus has come mainly from the trade surplus. The trade surplus rose from USD 25.5 billion in 2003 to USD 262.2 billion in 2007, up more than 90% annually. The share of the trade surplus in the current account surplus was 87.1% in 2006. The main source of the trade surplus is processing trade. During the period 1999–2006, the surplus from processing trade exceeded the total trade surplus. In 2006, the share of processing trade in the total trade surplus stood at 105%.
Net FDI inflow is the main source of China’s large capital account surplus. Around 50% of FDI flows into the processing trade industry, which means that the capital and current account surpluses are mutually reinforcing.
Long-term capital accounts for the bulk of China’s capital inflows, contributing to domestic productivity growth and reflect the comparative advantage of China, its high-saving, low-consumption structure and the global imbalance in the productivity distribution and economic structure.
–500
0
500
1,000
1,500
2,000
1990
1992
1994
1996
1998
2000
2002
2004
2006
Capital account Net errors and omissionsCurrent account
1991
1993
1995
1997
1999
2001
2003
2005

146 BIS Papers No 44
Graph 2
The structure of current account surplus 1990–2006 In USD 100 millions
Source: CEIC.
Graph 3
The structure of trade surplus 1993–2007 In USD 100 millions
Source: CEIC, after adjustment and calculation.
Capital inflows go hand in hand with the persistent rapid economic growth and optimistic expectations for the economy. Since 2003 the economy has entered a new round of expansion. The average annual GDP growth rate was 10.3% with the pace accelerating in recent years as it increased to 11.1% in 2006 and 2007 Q1, and 11.9% in 2007 Q2. Meanwhile, non-trade capital inflows have increased. The non-trade current account surplus increased from USD 1.2 billion in 2003 to USD 3.21 billion in 2006, the result of structural imbalances.
–500
0
500
1,000
1,500
2,000
2,500
3,000 1
990
1991
1992
199
4
199
5
199
6
1997
1998
1999
2000
2001
2002
2003
2004
2005
2006
Current account surplus
Trade surplus 1
993
–500
0
500
1,000
1,500
2,000
2,500
3,000
1993
1994
1995
1996
1997
1998
1999
2000
2001
2002
2003
2004
2005
2006
Nov
07
Processing trade surplus
Common trade surplus
Trade surplus

BIS Papers No 44 147
Graph 4
Capital account surplus structure 1997–2006 In USD 100 millions
Source: CEIC, after adjustment and calculation.
China’s long-term capital inflows contribute to the trade pattern. China’s trade surplus has its origin in the division of labour in the global production chain, which is also the factor that attracts FDI. While China has a trade surplus, mainly with the United States and the European Union, it has a relatively large trade deficit with some Asian countries and regions – the main origin of its FDI. In 2006 China’s trade deficit with Korea was as high as USD 45.3 billion, that with Japan as high as USD 20.5 billion, and its trade surplus with ASEAN countries was around USD 18.2 billion. The reasons for this combination relate to the structure of China’s foreign trade. The processing trade takes about 50% of China’s foreign trade volume, in which China imports capital goods mainly from Japan, the European Union and the United States, and the components mainly from Japan, Korea and Southeast Asia. After processing, the goods are mainly exported to the United States and Europe, demonstrating that China actually imports trade surplus from neighbouring countries. China has become an important link in the global production chain.
IV. Monetary policy in the face of foreign currency inflows
Persistent twin surpluses add to RMB appreciation pressures and many believe that large RMB appreciation is a way to correct the trade imbalance. However, the cause of economic imbalance is multifaceted, and systematic solutions are justified. Appreciation alone could not solve the problem and its outcomes are uncertain.
Capital inflows and the persistent BOP surplus in China are structural problems. They relate to the lack of saving in the United States and other developed countries and the fact that the international currency and financial system centre around the US dollar and are influenced by fiscal policy, income distribution, the trade system, price mechanisms etc. The exchange rate has its role to play, but coordination among different economies and macro-management policies, such as fiscal, monetary, industrial and investment policies, are needed. China has made consistent efforts in that regard. In its 11th Five-Year Plan, the Chinese government pointed out that economic growth would be rebalanced towards focusing on domestic demand, and to a balanced pattern driven both by consumption and investment and by internal as well as external demand. The Chinese government attaches much importance to the role of the exchange rate in the economic structural adjustment and rebalancing of
–800–600–400
–2000
200400600
8001,0001,200
1997
1998
1999
2000
2001
2002
2003
2004
2005
2006
Capital account surplus Net FDI
Portfolio investment Other investment

148 BIS Papers No 44
international payments. The exchange rate has its role to play, considering the time lag of the structural adjustment measures.
Structural and exchange rate regime reform need time, and liquidity management is an important part of monetary policy operations. In recent years, the PBC has employed sterilisation instruments such as open market operations and reserve requirements to withdraw excess liquidity.
During the period 2003–06, the annual growth rate of foreign exchange reserves was near 38.3% (Table 1) but the PBC managed to keep the annual average growth of M2 around 17%, which was generally in line with the annual economic growth rate.
Table 1
China’s FX reserves
Balance (USD 100 millions)
Amount increase (USD 100 millions)
Growth rate (%)
1993 212 18 9.28
1994 516 304 143.40
1995 735 219 42.44
1996 1,050 315 42.86
1997 1,399 349 33.24
1998 1,450 51 3.65
1999 1,547 97 6.69
2000 1,656 109 7.05
2001 2,122 466 28.14
2002 2,864 742 34.97
2003 4,033 1,169 40.82
2004 6,099 2,066 51.23
2005 8,189 2,090 34.27
2006 10,663 2,474 30.21
2007 15,282 4,619 43.32
Source: State Administration of Foreign Exchange (SAFE).
In the future, China will use different monetary policy instruments to further enhance liquidity management, and will gear up economic structural adjustment. In order to have balanced capital flows, China has implemented a reform of the foreign exchange management system and moved towards capital account convertibility, accelerated the pace of “going out” and promoted outbound FDI and portfolio investment by enterprises and individuals. China will further implement the reform of the foreign exchange management system, facilitate foreign investment and trade, and establish a multi-layered external investment system, so as to promote non-governmental external investment, further improve foreign exchange reserve management and enrich its modes. China will further strengthen the monitoring and management of capital inflows into the capital market, and improve short-term external debt management and the monitoring system of cross-border capital flows.

BIS Papers No 44 149
Graph 5
Money aggregates and foreign exchange reserve growth (yoy) 1990–2006
Source: PBOC.
V. RMB exchange rate regime reform
The Chinese government attaches due importance to the role played by the exchange rate regime in external rebalancing. On 1 January 1994 China adopted a unified managed floating exchange rate regime based on market supply and demand. After 1997, in the wake of the Asian financial crisis, China, as a responsible country in the world, voluntarily narrowed the RMB exchange rate band so as to prevent competitive currency depreciation in the region and a worsening of the crisis. In 2005, when the external environment and internal conditions improved, China made the decision to reform the RMB exchange rate regime. On 21 July 2005 China adopted a managed floating exchange rate regime based on market supply and demand with reference to a basket of currencies. The RMB/USD rate was adjusted to 8.11 at 19:00 on 21 July 2005.
Since this reform, the PBC has endeavoured to improve the managed floating exchange rate regime in line with the principles of pushing forward the reform in a self-initiated, controllable and gradual manner; as a result, the flexibility of the RMB exchange rate has been greatly strengthened, with the currency steadily appreciating in real effective terms.
First, efforts have been made to promote the development of the foreign exchange market so as to provide institutional support for the new RMB exchange rate formation mechanism. Following the introduction of the over-the-counter (OTC) transaction mode and of the market-maker system, and the improvement in the formation of the RMB central parity, the interbank spot foreign exchange markets developed rapidly, including the interbank RMB forward and swap markets. Second, under the managed floating exchange rate regime, the RMB exchange rate indirect adjustment system and the primary dealer system in the foreign exchange market were established. Third, the RMB exchange rate band was enlarged to enhance its flexibility.
0%
10%
20%
30%
40%
50%
60%Ja
n 98
Ju
l 98
Jan
99
Jul 9
9
Jan
00
Jul 0
0
Jan
01
Jul 0
1
Jan
02
Jul 0
2
Jan
03
Jul 0
3
Jan
04
Jul 0
4
Jan
05
Jul 0
5
Jan
06
Jul 0
6
Jan
07
Jul 0
7
M1 growth rate
M2 growth rate
Growth rate ofFX reserve

150 BIS Papers No 44
The flexibility of the RMB floating exchange rate was continuously improved. After the reform of the RMB exchange rate formation mechanism, the RMB exchange rate was no longer pegged to the US dollar; rather, it was adjusted with reference to a basket of currencies. In the two years since the reform of the exchange rate regime, the RMB has generally appreciated, fully reflecting the fundamental role of market supply and demand in the exchange rate formation process. The RMB exchange rate against the Japanese yen witnessed the largest appreciation, with a cumulative appreciation of 14% since the foreign exchange regime reform; the second largest appreciation was recorded against the US dollar, with a cumulative appreciation of 13.3%. The RMB appreciated in effective terms as well, indicating that the Chinese currency against the currencies of China’s main trading partners had appreciated. According to the BIS statistics, as of end-2007, the real effective exchange rate index had risen by 11% since the reform, representing an appreciation larger than that of major currencies, such as the euro, pound sterling, and Singapore dollar. Over the longer term, against the background of the “twin surpluses” in the BOP, the RMB has in general continued to appreciate in real effective terms on a large scale since the exchange rate reform in 1994. From the beginning of 1994 until end-2007, according to the BIS calculations, the nominal and real effective exchange rate indices of the RMB rose by 26.6% and 43.8% respectively, commensurate with supply and demand in the foreign exchange market. Market participants, after many efforts, have gradually adapted to the managed floating exchange rate regime and have enhanced their ability to avoid exchange rate risks; and the profits of enterprises have increased. In terms of the macroeconomy, the reform of the RMB exchange rate formation mechanism has promoted economic restructuring, industrial upgrading and transformation of the economic growth mode, cultivating financial institutions’ pricing and risk management capacities and boosting the flexibility of the macroeconomy.
Graph 6
The evolution of China’s exchange rate regime 1979–2007
Source: People’s Bank of China.
The PBC will closely monitor the potential risk of worsening structural imbalances and excess liquidity, considering the time lag in the adopted adjustment measures. In addition, the PBC will adhere to the policy of relying on a basket of structural adjustment measures, centring on
0
2
4
6
8
10
12
1979
.01
1980
.01
1981
.01
1982
.01
1983
.01
1984
.01
1985
.01
1986
.01
1987
.01
1988
.01
1989
.01
1990
.01
1991
.01
1992
.01
1993
.01
1994
.01
1995
.01
1996
.01
1997
.01
1998
.01
1999
.01
2000
.01
2001
.01
2002
.01
2003
.01
2004
.01
2005
.01
2006
.01
Internal Settlement Rate Official Exchange Rate Retention Market Rate Unified Market Exchange Rate
1979–85 Internal dual rates,
fixed Official rate:
1USD = 1.5 Yuan RMB Internal Settlement
Rate: 1USD = 2.8 Yuan RMB
Dual exchange rates unified in 1994, managed floating exchange rate regime established based on market supply and demand. During 1994–97, RMB/USD appreciated by 4.8%. After the Asian crisis, RMB/USD stabilised at 8.28.
1985–93 Dual exchange rate
regimes with crawling peg and free float
Crawling peg rate as official rate
Free float on the retention market
Starting from 19:00 on 21 July 2005, managed floating exchange rate regime based on market supply and demand with reference to a basket of currencies. RMB/USD was adjusted to 8.11 at 19:00 on 21 July 2005.
Effective on 4 Jan 2006, OTC transaction mode was introduced in the interbank spot foreign exchange market while at the same time retaining the automatic price-matching transaction mode. Meanwhile, market-makers were introduced.
.

BIS Papers No 44 151
expanding domestic consumption and using the exchange rate as a complementary measure to promote external balance.
The PBC will implement tight monetary policy to strengthen macroeconomic management, address the excess liquidity in the banking system, ease the pressures on money and credit expansion, and strike a balance at the aggregate level. The market-based interest rate reform will be further advanced. It will also enhance the leveraging role of prices in macroeconomic adjustments and duly manage credit growth. The PBC will further reform foreign exchange management, guide balanced capital flows, monitor and manage short-term capital inflows, and further strengthen the financial market infrastructure and financial institution reform. Close attention will continue to be paid to the potential risks in the rise of asset price and general price levels caused by both capital inflows and outflows.
Last but not least, global capital flows closely relate to global integration and economic imbalances, which pose new challenges to monetary policy in all economies. Joint efforts and policy coordination are needed to realise an orderly adjustment of global imbalances and a stable and sustainable development of the world economy.
References
State Administration of Foreign Exchange, (http://www.safe.gov.cn/model_safe_en/index.jsp).
People’s Bank of China, Monetary Policy Report, various issues.
Prasad, Eswar and Shang-jin Wei, “The Chinese approach to capital inflows: patterns and possible explanations”, IMF Working Paper, April 2005.
Xin Wang, “China as a net creditor: an indication of strength or weaknesses?” China and World Economy, vol 15, no 6 (Nov-Dec) 2007, pp 22–36.
Zhao, Min, “External liberalization and the evolution of China’s exchange system: an empirical approach”, World Bank China Office, Research Paper no 4, 2005.


BIS Papers No 44 153
Capital flows and financial assets in Colombia: recent behaviour, consequences
and challenges for the central bank
Hernando Vargas and Carlos Varela1
1. Introduction
Since the early 1990s Colombia has experienced two prolonged episodes of strong capital inflows separated by an episode of capital flight. The first episode in the 1990s ended with the “sudden stop” crisis of 1998–99. This event was characterised by the reliance on external borrowing as the primary source of external financing, followed by foreign direct investment (FDI) and portfolio inflows. The sudden stop of 1998–99 was the consequence of the international crisis in the capital markets and resulted in the loss of access to foreign debt markets. This forced a drastic adjustment in the current account, which registered a surplus in 1999, after several consecutive years of increasing deficits.
After 2000, the Colombian economy experienced a renewal of capital inflows, especially public debt and portfolio inflows, as the economy regained access to the international capital markets. This process was interrupted in the second half of 2002, with the emerging market crisis arising from the Brazilian elections. The most recent episode of capital inflows started in 2004 and has been characterised by a lessened dependence on external borrowing, and a significant increase in FDI.
This paper analyses the evolution and impact of capital flows in Colombia over the past five years. The following section characterises the nature and composition of capital flows. Next, the repercussions of capital flows for the financial system are discussed. Finally, some implications of capital flows for the conduct of monetary and exchange rate policies are presented.
2. Characterisation of capital flows in Colombia
a. The current account deficit Unlike other emerging market economies (EMEs) in the region, Colombia has registered an increasing current account deficit over the past years (Table 1). This evolution is related to sizeable increases in investment ratios (to GDP), despite rising saving ratios. Both public and private saving have increased, while private investment explains the growth of total investment (Table 2). Since 2002, corporate saving explains a large fraction of the increase of the saving ratio (Graph 1). In other Latin American EMEs, investment and saving ratios have been more stable, and current account surpluses have been produced by slight decreases in investment and increases in saving (Tables 3 and 4). Like Colombia, central
1 Banco de la República Colombia. Deputy Governor and Director of the Technical Unit of Economic Research,
respectively. This document does not necessarily reflect the official position of the Banco de la República (the central bank) or its Board of Directors. We are grateful to Alejandro Revéiz for his valuable comments and insight regarding the effects of capital flows on the financial system. Help with data processing and analysis from the staff of the External Sector, Financial System Sector and Market Development Operations departments at Banco de la República is gratefully acknowledged.

154 BIS Papers No 44
and eastern European EMEs have recorded growing current account deficits, but in this case saving ratios have remained stable while investment ratios have risen (Tables 3 and 4).
b. The funding of the current account The financing of the current account deficit in recent years has increasingly relied upon FDI net inflows, although foreign indebtedness remains an important source of external financing. Portfolio flows have stayed at low levels and only recently became a significant source of foreign funds (Table 5).
The importance of FDI gross flows in the funding of the current account deficit may also be appreciated by comparing it to other countries (Graph 2). At the beginning of the decade FDI represented 2.9% of GDP, one of the lowest among the largest Latin American economies. Between 2004 and 2006, FDI in Colombia surged and reached ratios of GDP among the highest in the region (around 6% of GDP).
The recent behaviour of FDI flows is different from that of the 1990s. There has been a considerable rise in FDI in the oil and mining sectors, with the share in total FDI rising from 19.6% in the 1990s to 41% in the present decade. FDI in the manufacturing sector has increased from 22.7% of total FDI in the 1990s to 27.4% in the 2000s. However, this number includes the purchases of large Colombian firms by foreign investors (close to 40% of total FDI inflows in the last three years). Conversely, FDI in the electricity sector, which represented 21.4% of total FDI in the 1990s, has declined to –0.9% in this decade. In the remaining sectors (non-tradables), FDI has slipped from 36.3% of total FDI in the 1990s to 32.5% in the 2000s.
The large increase in FDI for the oil and mining sectors is partly related to the rising international prices of these commodities (Table 6). Also, the more favourable contractual conditions for foreign firms to explore and exploit oil fields may have attracted additional FDI into that sector. It should be noted that a large share of FDI in these sectors takes the form of imported capital goods. For example, in 2006 the “imported component” of FDI amounted to 20.6% in the oil sector, and 38% in the mining sector. In addition, the sizeable inflows of FDI have implied increased profit remittances.
Over the past five years FDI by Colombian residents abroad has fluctuated between 0% and 1.5% of GDP, except for 2005, when the former owners of Bavaria, the largest brewery in the country, received stocks from SAB-Miller as partial payment for the sale of the corporation (Graph 3). Other outflows of Colombian FDI have gone to the electricity, beverages, banking and cement sectors.
Public debt inflows increased at the beginning of the decade, but were reduced after 2004, within a strategy of decreasing the FX exposure of the public sector. In fact, in 2005 there were net foreign debt repayments by the government, in an effort to help the central bank sterilise the monetary effects of FX intervention and alleviate the appreciation of the currency. The private sector made net repayments of long-term foreign debt between 1999 and 2004, to reduce its FX exposure. Private foreign indebtedness increased again in 2005 and 2007, in response to interest rate differentials and the expectation of a currency appreciation (Graph 4). Since public debt inflows are mostly of a long-term nature, the recently observed reduction in the average maturity of external debt is explained by a rise in short-term private debt (Table 7).
As mentioned earlier, portfolio investment has not been a significant source of external funding. Net inflows by non-residents are low and include the resources brought in by local investment funds. These do not incorporate indirect position-taking by offshore institutions through derivatives markets. Net flows by residents mainly comprise movements by pension fund managers. These flows are loosely associated with interest rate differentials (Graph 5). In the first part of 2007 there was a surge in portfolio investment that was explained by the

BIS Papers No 44 155
increasing interest rate differential and a non-credible discretionary FX intervention by the central bank, as will be discussed later.
c. Volatility of capital flows It is difficult to assert that capital flows are now more volatile than in the 1990s. With the exception of the acquisitions of Colombian firms in 2005, net capital inflows by non-residents do not seem to have become more volatile (Graphs 6 and 7). On the other hand, net outflows by private residents have shown larger volatility since 2000, because of portfolio movements of pension funds and the effect on Colombian FDI of payments received as equity for the sale of Colombian companies to foreign investors (Graphs 8 and 9). As mentioned earlier, there have been episodes of high volatility (“sudden stops”) in 1998–99 and 2002–03. Lately, in 2007, the level and volatility of portfolio investment rose, as explained above.
The Colombian peso’s volatility has been increasing since 2005 (Graph 10). Before, it was below average for a sample of floating exchange rate economies. Also, the Colombian peso exhibits episodes of high conditional volatility (based on a GARCH model), although on average it is as volatile as the yen or the Chilean peso (Lega et al (2007), p 13). However, the volatility of the peso is highly persistent and positively related to the EMBI (Lega et al (2007), p 14, and Kamil (2007), Table 4). FX intervention by the central bank may have reduced the volatility of the Colombian currency between 2004 and 2006, but not afterwards, when intervention lost its credibility and effectiveness (Kamil (2007)). Lower bound restrictions on the net FX cash position by banks seem to diminish the volatility of the currency (Lega et al (2007)).
The episodes of heightened volatility are associated with situations in which many players in the FX market tend to take the same position. This may be due in part to the incentives faced by large market participants such as pension fund managers. Although these institutions are supposed to hold stable, structural positions in several asset markets, Graph 11 shows that their FX exposure follows closely the behaviour of the exchange rate. In addition, Gómez et al (2006) found that these market players engage in very active daily trading in the FX market. More generally, Suárez (2007) presents some measures of herding behaviour on the part of pension funds and links it to regulatory minimum returns.
d. Role of financial intermediaries in capital flows Most capital flows are not intermediated by domestic financial institutions (Table 8). FDI and most foreign debt transactions are effected directly by non-financial corporations or the government. Financial intermediaries play a role in the case of portfolio investment (pension funds) and some private debt.
e. Foreign participation in asset and derivative markets In Colombia, foreigners may participate in asset markets (public debt, stocks, bank liabilities) by setting up local investment funds (on-shore). These funds are relatively small and show a loose relationship with interest rate differentials (Graph 5). However, non-residents (off-shore) may have indirect exposure to Colombian assets through the use of derivatives, eg through non-deliverable forward sales/purchases of Colombian pesos. This is estimated by means of the FX net exposure of financial intermediaries, which act as counterparties of offshore investors in the forward market. The latter has experienced substantial growth in recent years (Graph 12). There are no other significant derivatives markets in Colombia due to regulatory restrictions, inadequate accounting rules for non-financial corporations and lack of expertise in the valuation of derivative products.
Restrictions on the participation of non-residents in real estate markets through local investment funds were eased in 1998. Since then, their participation has increased, but it is still very small. The largest figures relate to 2005 and 2006, when FDI in construction and

156 BIS Papers No 44
acquisition of real estate property amounted to US$ 150 million per year, less than 2% of total FDI in those years.
f. Other sources of information on capital flows Besides quarterly balance of payments information, in Colombia there is a weekly “Foreign exchange cash balance”, released with a lag of two weeks. All capital account transactions that involve FX movements in the domestic peso-dollar market are recorded in this statement. It provides a good approximation to some capital flows (especially portfolio investment, debt flows and some FDI flows). However, it excludes the flows that do not involve FX transactions, most importantly a large part of oil-related FDI. In addition, the central bank calculates the net external asset position of financial intermediaries, which includes all cash and derivative FX transactions of the financial institutions.
3. Implications of capital flows for the depth of the financial system and its resilience
a. Financial markets Portfolio investment channelled through onshore firms (local investment funds) represents a small fraction of the outstanding stock of securities in both the public bond and the stock markets (Graph 13). However, it has gained participation over the past three years. It is difficult to assess the impact of these funds on the liquidity of the capital markets, since, despite its relatively small size, trading activity may be important and there are no readily available data on this.
The effects of external factors on some domestic asset prices are illustrated in Graph 14. Since 2002 there is an apparent inverse relationship between the prices of Colombian foreign debt bonds (“Yankees”), determined by external interest rates and sovereign risk premia, and the exchange rate (measured as pesos per US dollar). Also, there was a positive relationship between the prices of domestic and foreign Colombian public bonds (TES) until July 2006. After that, the relationship broke down because Colombian financial institutions realised market risk losses on their domestic public bond holdings and started reducing their exposure to this risk. This will be described in some detail in the next section. In some sub-periods, there seems to be an inverse relationship between the central bank policy rate and the price of domestic public bonds.
For their part, stock prices exhibited sustained growth between 2003 and 2006. Their relationship with the prices of foreign Colombian public bonds (Yankees) became closer after 2004, while there has been a clear inverse relation with the exchange rate in the same period (Graph 15).
In terms of volatility, the coefficient of correlation between the conditional variances (GARCH) of the daily returns on Yankees and the returns on domestic public bonds (TES) is around 30% for the period 2000–07. A similar coefficient is obtained for the case of Yankees and stock prices. The correlation of conditional volatilities of the returns on the exchange rate and Yankees is much lower (6.6%). In sum, there is a significant influence of external factors on the level of domestic asset prices and, in some cases, on their volatility. There have been no new hedging instruments linked to capital flows in Colombia due to regulatory restrictions.
Domestic asset markets are integrated. Graph 16 shows the correlation coefficients between the daily returns on TES and stock prices (positive), and TES and the exchange rate (negative). After July 2002 those correlations became stronger. The negative relationship between the exchange rate and stock prices has already been noted. In terms of volatility, the correlation between the conditional variances of TES and stock price returns is 23%. The

BIS Papers No 44 157
value of this coefficient is 12.9% for the conditional variances of TES and the exchange rate, while a coefficient around 32% is obtained for the conditional variances of stock prices and exchange rate returns.
The experience of the current decade shows that Colombian financial markets are vulnerable to external shocks. During the second half of 2002 there was a regional emerging market crisis related to the elections in Brazil that led to a disruption of domestic asset markets. The crisis caused a rise in the sovereign risk premium, a depreciation of the local currency and a flight away from domestic assets (TES) by both financial intermediaries and other agents. The changes in market sentiment affected in particular brokerage firms that were leveraging their purchases of TES with bank credit, using the same securities as collateral. When commercial banks saw their access to external credit lines curtailed and the value of their collateral (Yankees) reduced, they cut the credit supply to brokerage firms and increased the demand for dollars. This exacerbated the plunge in the prices of TES and the rise of the dollar, as brokers had to realise their losses by liquidating their TES holdings.
After the crisis subsided, the market recovered its appetite for TES and, between 2004 and 2005, financial intermediaries accumulated large holdings of TES originated in the efforts by the government and the central bank to reduce the FX exposure of the government and to sterilise the monetary expansion resulting from FX intervention. As a consequence, there was a large increase in the exposure of the financial system to market risk, amidst the lack of instruments for individual agents to hedge it. Against this background, in the second quarter of 2006 two events prompted the realisation of possible large losses associated with the drop in TES prices. First, the central bank modified its policy stance in the face of inflationary risks, and second, external turbulences reappeared, producing increases in the sovereign risk premium. Stock prices also suffered heavy losses, which were compounded by the highly leveraged positions of some agents.
These episodes show that the vulnerability of capital markets to external events stems in part from their structure. In particular, in such situations it may be hard to find a substantial group of agents that are willing to take opposite positions to market sentiment. This forces the central bank or the government to assume this role. As mentioned above, pension fund managers, for example, sometimes act as traders with a short-term time frame, and not as long-term investors holding stable, structural positions. Also, the low participation of foreigners in domestic asset markets may hinder the possibility of having diverse, heterogeneous participants in those markets. However, this potential benefit depends on the assumption that foreign investors are more diverse and less procyclical than domestic ones.
b. Financial institutions Capital inflows do not seem to have an impact on the size of assets and liabilities of financial institutions. However, the balance sheets of these intermediaries expanded between 2004 and 2007 (Graph 17). This can be explained by the large increases in the demand for local assets by residents. Monthly portfolio investment outflows by residents went down from US$ 160 million on average between 2000 and 2003 to outflows of US$ 70 million on average between 2004 and 2007. Broad money demand grew rapidly in the face of large expectations of currency appreciation and lower external interest rates and sovereign risk premium. Deposits in the financial system increased from 31.2% of GDP in December 2003 to 38.2% in December 2006. Estimations of broad money demand equations indicate a significant response of this aggregate to shifts in interest rate differentials.2
2 Quarterly VEC estimations of real broad money demand (M3D/P) for the period 1986–2007 produce the
following long-term equation:

158 BIS Papers No 44
Regarding the role of onshore foreign banks in the intermediation of capital flows, there is no strong evidence that they are more active than domestic banks. Not only do depository institutions intermediate a small fraction of capital flows, but also the share of total assets represented by external loans intermediated by foreign banks is similar to that of domestic banks (Graph 18). The only significant difference occurred during the “sudden stop” of the late 1990s, when domestic banks saw their lines of credit reduced, while foreign banks were able to maintain their foreign loan intermediation activities.
c. Non-financial institutions Restrictions on the foreign exchange cash position of financial intermediaries imposed in 1999 and 2004 limited the extent to which these institutions could bring in foreign capital to exploit interest rate arbitrage opportunities. The purpose of these restrictions was to curb the size of the appreciation or depreciation of the currency. As a result, non-financial institutions (not subject to the restrictions) stepped in and took advantage of those opportunities. In most cases, they worked jointly with a commercial bank and provided the liquidity required to arbitrage the interest rate differentials.
However, the FX and forward operations done through this arrangement are small relative to size of these markets (Graph 19), and the restrictions on the foreign exchange cash position of financial intermediaries are sometimes binding or close to it. When this happens, financial institutions are not able to take positions on the forward market and the forward premium deviates from the interest rate differential3 (Graph 20).
d. Foreign investors It is possible for foreign investors to take positions in the forward market (non-deliverable) to bet on the appreciation (or depreciation) of the peso. This, apparently, does not involve any capital inflow. However, the counterparty, usually a financial intermediary, seeks to hedge its forward position and there is in the end an inflow (outflow) corresponding to the initial position in the forward market. The FX risk, in the case of inflows, has sometimes landed with the central bank through FX intervention.
)(016.0016.0830.23 ^* eiiInflationGDP
PM D
−−⋅+⋅−⋅=
where i corresponds to the nominal return on the financial liabilities included in M3, i* is the US nominal 90-day
CD rate and ^e is the annualised quarterly depreciation rate of the peso. Note that the coefficient of the interest
differential term implies that a 1 percentage point increment in the differential is associated with a 1.6% increase in the real demand for money in the long run.
3 When the restrictions on the banks´ FX net cash position (FNCP) get closer to regulatory limits (eg around zero after 2004), banks are unable to buy forward US dollars. Hence, the forward price falls below the level implied by the interest rate differential. For this reason, at times we can expect an inverse relation between FNCP and the deviation of the forward price from the interest rate differential.

BIS Papers No 44 159
4. Implications of capital flows for the conduct of monetary and exchange rate policies
a. Effects of capital flows on the exchange rate and the monetary and FX policy stance
As indicated above, the nature of the capital inflows into the Colombian economy in the past five years shows a large “long-term” component (Graph 21). Elbadawi and Soto (1994) and Alper and Saglam (2000) suggest that “permanent” capital flows affect both the real and the nominal exchange rate. Hence, it can be posited that the real and nominal appreciation trend of the Colombian peso over the past four years can be explained to some extent by the long-term capital inflows and the declining trend of the country risk premium (EMBI). In this sense it should be noted that the peso appreciated after 2004, while US short-term interest rates were increasing relative to domestic rates (Graph 22).
Although part of the appreciation may be due to the direct effect on foreign currency inflows of the increase in the terms of trade, the latter also influences capital flows by inducing larger FDI (as shown in the first section) and reducing the probability of default of commodity-producing economies.
Monetary policy in Colombia follows an inflation targeting strategy, whereby the exchange rate is a key indicator of monetary conditions and inflationary pressures. Thus the monetary policy stance was influenced by the appreciation induced by the capital flows. Specifically, the appreciation may have delayed the start of the tightening cycle by the central bank. In fact, between 2004 and 2005 short-term interest rates were reduced by 125 basis points, reaching real levels as low as 0.7% by October 2005, even though capacity utilisation was growing throughout this period (Graph 23).
Later, since April 2006, the monetary policy stance has been tightened in spite of the continuing appreciation of the currency, due to the strength of aggregate demand and large increases in the supply of credit. The latter were also influenced by capital flows. The increased demand for domestic deposits by residents, resulting from lower capital outflows, pushed the credit supply by financial intermediaries.
Capital flows also had an impact on the stance of FX policy. Concern about the level of reserves, the permanence of the appreciation and its effects on some tradable sectors led to increased central bank FX intervention. To moderate the magnitude of the appreciation, the central bank introduced discretionary intervention in the FX market in 2004. This intervention was relatively successful until 2006 (Kamil 2007), to the extent that it was not inconsistent with current and expected monetary policy actions (Graph 24).
In 2007, rising inflation due to strong aggregate demand pressures and food price shocks made it clear that the central bank would have to continue raising interest rates. The credibility of the central bank’s commitment to inflation targeting hampered the credibility and effectiveness of FX intervention, and as result, portfolio investment flows shot up, discretionary intervention had to be abandoned and some capital account measures were taken to isolate the exchange rate from movements in domestic interest rates, as will be discussed below.
b. Sterilisation mechanisms and consequences The intervention of the central bank through different mechanisms led to a considerable increase in the supply of primary liquidity in the domestic money market. In spite of the large increase in real money demand (related to capital flows), between 2004 and 2007 the accumulated monetary effects of the FX intervention (Col$ 30.3 trillion) surpassed the growth of the demand for monetary base (Col$ 12.1 trillion). Without sterilisation, this would have pushed short-term interest rates below the policy rate set by the monetary authorities.

160 BIS Papers No 44
Hence, the central bank had to sterilise these excesses of liquidity using the following mechanisms:
• Sale of international reserves to the government, which were used to service and/or prepay public foreign debt.
• Outright sales of government bonds held by the central bank.
• Reduction of the amount of short-term liquidity supplied through repo auctions.
• Increase of government deposits in the central bank.
• Non-reserve deposits of financial institutions at the central bank.
The central bank used a combination of the above-mentioned mechanisms because since 1999 it has not been allowed, by law, to issue its own securities. Thus, it was forced to adjust the monetary base through transitory and permanent sales/purchases of government debt. At the time of the largest FX intervention, the outstanding stock of government paper held by the central bank was not enough to mop up the excesses of liquidity.
The use of the first two mechanisms implied an expansion of the public bond supply, which was willingly absorbed by the financial intermediaries, particularly commercial banks. At the time, the intermediaries expected high capital gains caused by declining inflation, stable or decreasing short-term interest rates and strong capital inflows. As a result, exposure to market risk jumped. In the second quarter of 2006, the central bank shifted its policy stance and turbulence in the international capital markets pushed up sovereign risk premia. Domestic bond prices fell sharply, commercial banks suffered losses and reduced their holdings of government securities in favour of loans. Throughout the second half of 2006, credit supply skyrocketed and lending rates declined at the same time as the central bank was raising its interest rate (Graphs 25, 26 and 27).
The cost of sterilisation has not been a pressing issue because the central bank generates large profits and the opportunity cost of reserve accumulation was not sizeable, at least in the first years of intervention, because the interest rate differential was relatively low. In addition, the expansion in the demand for monetary base reduced the need for sterilisation.
c. Other measures used for managing capital flows After discretionary FX intervention was abandoned in April 2007, some measures were taken in May to mitigate the impact on the exchange rate from the increases of the policy interest rates. First, the reserve requirement on external debt, widely used in the 1990s, was reactivated in an effort to discourage short-term foreign indebtedness. It requires agents to deposit in the central bank 40% of external loans for a period of six months. The deposit can be denominated in US dollars or Colombian pesos and may be withdrawn at a discount determined by the central bank.
Second, the government put in place a similar requirement on portfolio investment. Third, since the first two measures did not prevent other agents, like pension fund managers, from exploiting arbitrage opportunities in interest rate differentials through forward operations with commercial banks, a cap on the ratio of the gross amount of FX derivatives to the commercial banks’ net worth was established.
So far, the measures seem to have worked, as the evidence shows a halt in portfolio investment and a decrease in net debt inflows, and there do not seem to be compensating flows coming through other channels, such as FDI (Table 9). However, the experience of Colombia and other countries with capital controls indicates that their effectiveness wears off the longer the measure is in place.

BIS Papers No 44 161
d. Effect of a more open capital account on the central bank’s influence over market interest rates
There is evidence that external factors play an important role in the determination of domestic market interest rates, in addition to the impact of the short-term policy rate. For example, Betancourt et al (2006) show that the EMBI affects deposit interest rates. Therefore, the transmission of monetary policy may be dampened or reinforced by shifts in the sovereign risk premium. Also, Arango et al (2006) find that the domestic public bond yield curve responds to lagged movements in the foreign yield curve and future changes in the policy interest rate, for weekly data sets. However, the effect of an increase of the policy rate on the slope of the yield curve is positive, contrary to the impact predicted by the expectations theory. This is attributed by the authors to a lack of transparency of monetary policy. Nevertheless, it is also consistent with the fact that, for years, only the long end of the curve was liquid, so increases in short rates raised the cost of borrowing short-term and buying long-term bonds.
e. Financial stability issues The Colombian experience has shown that capital flows may change abruptly and that domestic financial markets are vulnerable to this kind of shock. In fact, after the “sudden stop” of 1998–99, a financial crisis developed that was related, among other things, to regulatory failures and an inadequate structure of some financial institutions (Uribe and Vargas (2003)). Despite recent improvements in financial regulation (regarding market and credit risks), vulnerabilities remain:
• During some episodes of external shocks, many agents tended to take the same position, leading to heightened volatility of flows and prices. As a consequence, financial stability may be weakened by the increased fluctuations of the prices of some assets and liabilities held by financial intermediaries.4 Further opening of the capital account could help solve this problem, as long as foreign investors are less procyclical than domestic ones. Allowing the exchange rate to float may also help prevent rapid increases in money and credit that may fuel asset price bubbles.
• The reporting and valuation of new financial products and practices is lagging in Colombia. This, in addition to the presence of special purpose vehicles, may hide some risks assumed by the financial sector. These concerns could be more serious if further opening of the capital account were considered.
5. Concluding remarks
• In the last several years Colombia has seen a widening of the current account deficit, associated with large increases in investment, despite rising saving ratios.
• This has been reflected in a surge of capital inflows, especially foreign direct investment flows. In this way, this episode is different from that in the 1990s, which had a strong external debt component. The rise in FDI is particularly strong in the mining and oil sectors and is associated with the high external prices for these products and with an improvement in the conditions for FDI into these sectors. The increase in FDI can also be explained by the purchase of Colombian companies (in other sectors) by foreign investors.
4 Tenjo et al (2007) show that asset price fluctuations in Colombia have been associated with movements of
external variables, such as the terms of trade and capital flows.

162 BIS Papers No 44
• Even though portfolio investment both onshore and offshore is not very large compared to other flows, domestic capital markets show vulnerability to external events due to their structure. This forces the central bank and the government to try to re-establish some order in the markets.
• Capital flows do not seem to have an impact on the size of the assets and liabilities of financial institutions. A large portion of capital flows are not intermediated by the financial institutions, and even in that case there is no evidence that foreign-owned banks are more active in the intermediation of foreign capital flows.
• Capital flows have affected the stance of monetary policy to the extent that the appreciation of the exchange rate has helped reduce inflationary pressures. This, added to the presence of a negative output gap, made it possible for the central bank to engage in FX intervention at the same time that it was easing its monetary stance between 2004 and 2005. However as the output gap closed and inflationary pressures began to emerge, sterilised intervention lost effectiveness. In addition, the sterilisation of the monetary effect of intervention in the FX market increased the exposure of the financial system to market risk. In this context, the management of capital flows became a source of concern for the monetary authorities. Hence in the last year discretionary sterilised intervention was abandoned and restrictions were imposed on capital inflows originating in debt and portfolio flows.
• Financial stability has been weakened by the increased fluctuations in the prices of some assets and liabilities held by financial intermediaries as a consequence of shocks to capital flows. Further opening of the capital account could help solve this problem, as long as foreign investors are less procyclical than domestic ones. Allowing the exchange rate to float may also help prevent rapid increases in money and credit that may affect financial stability.

BIS Papers No 44 163
Graph 1
Saving ratios of households and corporations As a percentage of GDP
1 p = preliminary data.
Calculations based on nominal aggregates. Corporations include both public and private firms.
Source: DANE.
Graph 2
Foreign direct investment for selected countries As a percentage of GDP
1 Data from January to June only.
Source: Balance of Payments, Banco de la República.
–1
1
3
5
7
9
2000 2001 2002 2003 2004 2005 2006 20071
Chile Brazil Argentina Mexico Colombia
4
5
6
7
8
9
10
11
12
2000 2001 2002 2003 2004 2005p1
Households
Corporations

164 BIS Papers No 44
Graph 3
Colombian investment abroad As a percentage of GDP
Source: Balance of Payments, Banco de la República.
Graph 4
External and internal interest differential vs net private debt flows
Source: Research Dpt, Banco de la República.
0.0
0.5
1.0
1.5
2.0
2.5
3.0
3.5
1994 1995 1996 1997 1998 1999 2000 2001 2002 2003 2004 2005 2006
–800
–600
–400
–200
0
200
400
600
800
1000
1200
2000I
2000 III
2001 I
2001III
2002I
2002III
2003I
2003III
2004I
2004III
2005I
2005III
2006I
2006III
2007I
Quarter
Flow
s (U
SD
billi
ons)
–20
–15
–10
–5
0
5
10
15
20
25
30
Diff
. (%
)Flow Differential
Diff = (1+i) / ((1+i)*(1+e)); e = Col peso depreciation YoY
8

BIS Papers No 44 165
–600
–400
–200
0
200
400
600
Apr
02
Jul 0
2 O
ct 0
2
Jan
03
Apr
03
Jul 0
3 O
ct 0
3
Jan
04
Apr
04
Jul 0
4 O
ct 0
4
Jan
05
Apr
05
Jul 0
5 O
ct 0
5
Jan
06
Apr
06
Jul 0
6 O
ct 0
6
Jan
07
Apr
07
Jul 0
7 O
ct 0
7
US
D m
illio
ns
–30
–20
–10
-
10
20
30
40Colombian investment abroad
Foreign investment in Colombia
Int. rate differential
Graph 5
Portfolio investment: foreign investment in Colombia and Colombian investment
abroad1 and interest differential2
1 Data from Balance of Foreign Exchange Cash Transactions. 2 Interest rate differential = (1+i)/[(1+i*)(1+e)]–1; 90-day CD rates in Colombia and the United States.
Source: Banco de la República.
Graph 6
Financial account – liabilities (net of government assets) USD millions
Source: Balance of Payments, Banco de la República.
–3000
–1000
1000
3000
5000
7000
9000
11000
1994 1995 1996 1997 1998 1999 2000 2001 2002 2003 2004 2005 2006
Total external liabilities Foreign direct investment
Portfolio investment External debt

166 BIS Papers No 44
Graph 7
Net capital inflows volatility (excl government assets) Standard deviation, in USD millions
Source: Balance of Payments, Banco de la República.
Graph 8
Financial account – assets (excl government assets) USD millions
Source: Balance of Payments, Banco de la República.
–3,000
–2,000
–1,000
0
1,000
2,000
3,000
4,000
5,000
6,000
7,000
1994 1995 1996 1997 1998 1999 2000 2001 2002 2003 2004 2005 2006
Total investments abroad Direct investment
Portfolio investment External debt
0
500
1000
1500
2000
2500
3000
3500
1994–2006 1994–1999 2000–2006
Total external liabilities Foreign direct investment Portfolio investment External debt

BIS Papers No 44 167
Graph 9
Net capital outflows volatility (excl government assets) Standard deviation, in USD millions
Source: Balance of Payments, Banco de la República.
0
500
1000
1500
2000
2500
1994–2006 1994–1999 2000–2006
Total investments abroad Direct investment Portfolio investment External debt

Graph 10
Volatility of exchange rate standard division
Source: Lega et al (2007).
–0.2
0.3
0.8
1.3
1.8
2001 2002 2003 2004 2005 2006 2007*
Colombia
Brazil
Chile
Mexico
Peru
Turkey
Philippines
N. Zealand
Czech Rep.
Poland
Euro
Japan
Value 2001 for Turkey: 3.13%
168 B
IS Papers N
o 44

BIS Papers No 44 169
Graph 11
FX exposure of pension funds and the exchange rate
FX exposure: value of the net FX position of pension funds as a share of the pension fund portfolio.
Source: Banco de la República.
Graph 12
Outstanding amounts of forwards bought and sold by financial intermediaries to and from agents
and subsidiaries1 USD millions
-
1,000
2,000
3,000
4,000
5,000
31 D
ec 0
101
Mar
02
06 M
ay 0
205
Jul
02
04 S
ep 0
205
Nov
02
06 J
an 0
305
Mar
03
02 M
ay 0
301
Jul
03
28 A
ug 0
327
Oct
03
24 D
ec 0
320
Feb
04
20 A
pr 0
417
Jun
04
17 A
ug 0
414
Oct
04
13 D
ec 0
407
Feb
05
04 A
pr 0
501
Jun
05
02 A
ug 0
530
Sep
05
02 D
ec 0
503
Feb
06
05 A
pr 0
606
Jun
06
10 A
ug 0
610
Oct
06
13 D
ec 0
614
Feb
07
18 A
pr 0
720
Jun
07
22 A
ug 0
722
Oct
07
BOUGHT TO OFFSHORE AND SUBSIDIARIES
SOLD TO OFFSHORE AND SUBSIDIARIES
1 Includes local and offshore subsidiaries.
Source: Banco de la República.
0
5
10
15
20
25Ja
n 02
May
02
Sep
02
Jan
03
May
03
Sep
03
Jan
04
May
04
Sep
04
Jan
05
May
05
Sep
05
Jan
06
May
06
Sep
06
Jan
07
May
07
Sep
07
FX e
xpos
ure
of p
ensi
on fu
nds
1,600
1,800
2,000
2,200
2,400
2,600
2,800
3,000
Exc
hang
e ra
te
Exp. FPO Exchange rate (TRM)
Bought to offshore and subsidiaries
Sold to offshore and subsidiaries

170 BIS Papers No 44
Graph 13
Proportion of outstanding public debt bonds and equities1 in the hands of local investment funds
1 Up to September of 2004, shares were valued at the average price of acquisition. Afterwards, they are valued at market prices. Dollar values are obtained at end-month market exchange rates.
Source: Banco de la República.
Graph 14
Colombian financial asset market indices and central bank interest rate
Source: Banco de la República.
0.0 0.5 1.0 1.5 2.0 2.5 3.0 3.5 4.0 4.5
Jan
00
May
00
Sep
00
Jan
01
May
01
Sep
01
Jan
02
May
02
Sep
02
Jan
03
May
03
Sep
03
Jan
04
May
04
Sep
04
Jan
05
May
05
Sep
05
Jan
06
May
06
Sep
06
Jan
07
May
07
Sep
07
Debt Equity
4
5
6
7
8
9
10
11
12
13
Jan
00
Apr
00
Jul 0
0
Oct
00
Jan
01
Apr
01
Jul 0
1 O
ct 0
1 Ja
n 02
A
pr 0
2 Ju
l 02
Oct
02
Jan
03
Apr
03
Jul 0
3 O
ct 0
3 Ja
n 04
A
pr 0
4 Ju
l 04
Oct
04
Jan
05
Apr
05
Jul 0
5 O
ct 0
5 Ja
n 06
A
pr 0
6 Ju
l 06
Oct
06
Jan
07
Apr
07
Jul 0
7 O
ct 0
7
CB
rate
60
80
100
120
140
160
180
Inde
xes
CB rate TES Yankee COFX

BIS Papers No 44 171
Graph 15
Colombian financial markets Indices
Source: Banco de la República.
Graph 16
Domestic market return correlation
Source: Banco de la República.
70
80
90
100
110
120
130
140
150
160
170
Jan
00
Mar
00
Jun
00
Aug
00
Nov
00
Jan
01
Apr
01
Jun
01
Aug
01
Nov
01
Jan
02
Apr
02
Jun
02
Sep
02
Nov
02
Feb
03
Apr
03
Jul 0
3 S
ep 0
3 D
ec 0
3 Fe
b 04
M
ay 0
4 Ju
l 04
Oct
04
Dec
04
Mar
05
May
05
Aug
05
Oct
05
Jan
06
Mar
06
Jun
06
Aug
06
Nov
06
Jan
07
Apr
07
Jun
07
Aug
07
Nov
07
Yan
kee,
CO
LFX
0
200
400
600
800
1000
1200
IGB
C
Yankee COFX IGBC
–100
–80
–60
–40
–20
0
20
40
60
80
Jan
00
Apr
00
Jul 0
0
Oct
00
Jan
01
Apr
01
Jul 0
1
Oct
01
Jan
02
Apr
02
Jul 0
2
Oct
02
Jan
03
Apr
03
Jul 0
3
Oct
03
Jan
04
Apr
04
Jul 0
4
Oct
04
Jan
05
Apr
05
Jul 0
5
Oct
05
Jan
06
Apr
06
Jul 0
6
Oct
06
Jan
07
Apr
07
Jul 0
7
Oct
07
Cor
rela
tions
TES vs COFX TES vs IGBC
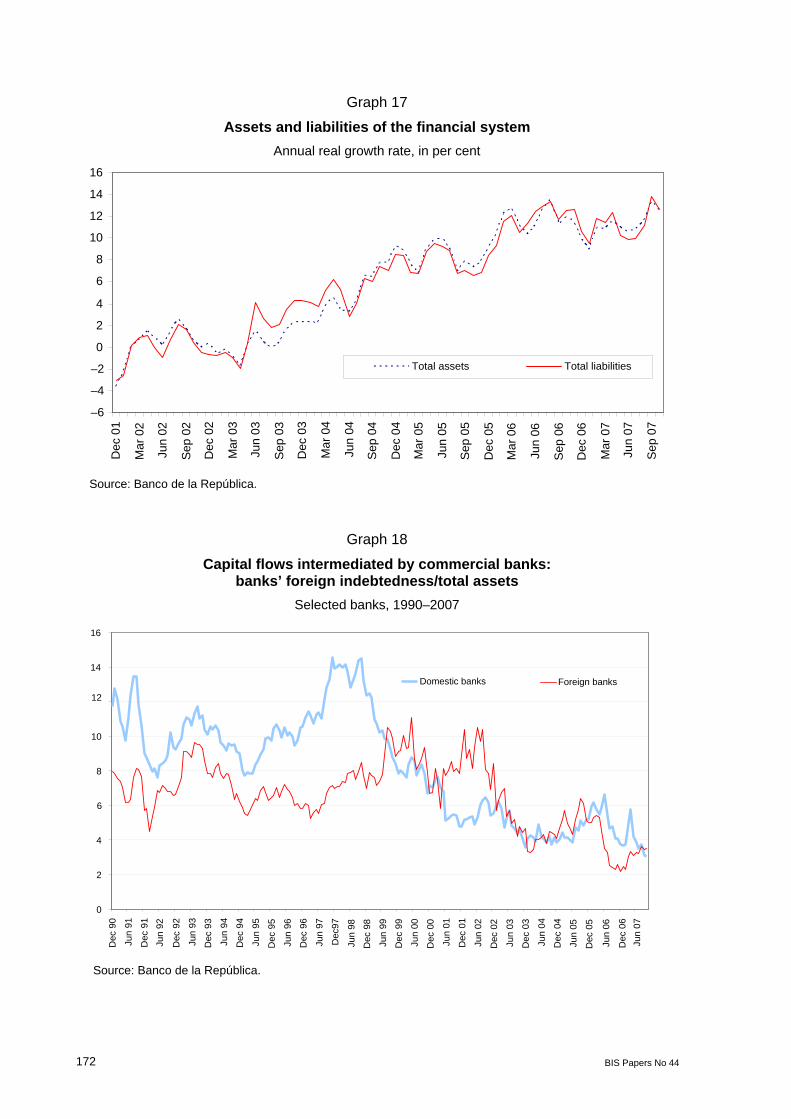
172 BIS Papers No 44
–6 –4 –2 0 2 4 6 8
10 12 14 16
Dec
01
Mar
02
Jun
02
Sep
02
Dec
02
Mar
03
Jun
03
Sep
03
Dec
03
Mar
04
Jun
04
Sep
04
Dec
04
Mar
05
Jun
05
Sep
05
Dec
05
Mar
06
Jun
06
Sep
06
Dec
06
Mar
07
Jun
07
Sep
07
Total assets Total liabilities
Graph 17
Assets and liabilities of the financial system Annual real growth rate, in per cent
Source: Banco de la República.
Graph 18
Capital flows intermediated by commercial banks: banks’ foreign indebtedness/total assets
Selected banks, 1990–2007
Source: Banco de la República.
0
2
4
6
8
10
12
14
16
Dec
90
Jun
91
Dec
91
Jun
92
Dec
92
Jun
93
Dec
93
Jun
94
Dec
94
Jun
95
Dec
95
Jun
96
Dec
96
Jun
97
Dec
97
Jun
98
Dec
98
Jun
99
Dec
99
Jun
00
Dec
00
Jun
01
Dec
01
Jun
02
Dec
02
Jun
03
Dec
03
Jun
04
Dec
04
Jun
05
Dec
05
Jun
06
Dec
06
Jun
07
Domestic banks Foreign banks

BIS Papers No 44 173
Graph 19
Monthly amount of forward turnover: financial intermediaries with non-financial SPVs
USD millions
Source: Banco de la República.
Graph 20
Banks’ FX net cash position and deviations of forward peso/dollar from interest rate differentials
Source: Banco de la República.
–500
0
500
1000
1500
2000
Jan
03
Feb
03
Apr
03
Jun
03
Jul 0
3 S
ep 0
3 O
ct 0
3 D
ec 0
3 Fe
b 04
M
ar 0
4
May
04
Jul 0
4 S
ep 0
4 O
ct 0
4 D
ec 0
4 Ja
n 05
M
ar 0
5 M
ay 0
5 Ju
n 05
A
ug 0
5 O
ct 0
5 N
ov 0
5 Ja
n 06
M
ar 0
6
Apr
06
Jun
06
Aug
06
Sep
06
Nov
06
Jan
07
Mar
07
Apr
07
Jun
07
Aug
07
Sep
07
Nov
07 –6
–4
–2
0
2
4
6
8
Banks FX net cash position
MA5 (interest rate differential – Fwd. implicit depreciation)
0
100
200
300
400 A
pr 0
0
Jul 0
0O
ct 0
0
Jan
01A
pr 0
1Ju
l 01
Oct
01
Jan
02A
pr 0
2Ju
l 02
Oct
02
Jan
03A
pr 0
3Ju
l 03
Oct
03
Jan
04A
pr 0
4Ju
l 04
Oct
04
Jan
05A
pr 0
5Ju
l 05
Oct
05
Jan
06A
pr 0
6Ju
l 06
Oct
06
Jan
07A
pr 0
7Ju
l 07
Oct
07
Bought to SPV Sold to SPV
Jan
00

174 BIS Papers No 44
Graph 21
Colombia: B-o-p total gross capital inflows Structure by term, in per cent
Source: Banco de la República.
Graph 22
Real depreciation,1 EMBI+ Colombia2 and interest rate differential3
1 Annual change of ITCR-IPP(NT). 2 Defined in percentage points, not basis points. 3 Calculated as {(1+i)/[(1+i*)]–1}, where i is the interest rate on 90-day deposit certificates (monthly average) and i* is the average rate on three-month negotiable certificates of deposit (secondary market).
Sources: Federal Reserve; Bloomberg; Banco de la República.
0
10
20
30
40
50
60
70
80
90
100
1994
1995
1996
1997
1998
1999
2000
2001
2002
2003
2004
2005
2006
Hal
f I 2
007
Short term Long term
–20 –15 –10 –5 -
5 10 15 20 25 30
Jan
00
Apr
00
Jul 0
0 O
ct 0
0 Ja
n 01
A
pr 0
1 Ju
l 01
Oct
01
Jan
02
Apr
02
Jul 0
2 O
ct 0
2Ja
n 03
A
pr 0
3 Ju
l 03
Oct
03
Jan
04
Apr
04
Jul 0
4 O
ct 0
4Ja
n 05
A
pr 0
5 Ju
l 05
Oct
05
Jan
06
Apr
06
Jul 0
6 O
ct 0
6Ja
n 07
A
pr 0
7 Ju
l 07
Oct
07
Rea
l dep
reci
atio
n
0
2
4
6
8
10
12 E
MB
I+, I
nter
est r
ate
diffe
rent
ial Real depreciationEMBI + ColombiaInterest rate differential

BIS Papers No 44 175
Graph 23
GDP gap, real depreciation1 and intervention rate1
1 Average of monthly data.
Source: Banco de la República.
Graph 24
Net purchase of international reserves (monthly data) and central bank interest rate
Source: Banco de la República.
–14 –12 –10 –8 –6 –4 –2 -
2 4 6 8
Mar
04
Jun
04
Sep
04
Dec
04
Mar
05
Jun
05
Sep
05
Dec
05
Mar
06
Jun
06
Sep
06
Dec
06
Mar
07
Jun
07
Sep
07
GD
P ga
p an
d re
al d
epre
ciat
ion
-
1
2
3
4
5
6
7
8
9
10
Inte
rven
tion
rate
GDP gap Real depreciation Intervention rate
–900
–600
–300
-
300
600
900
1,200
1,500
1,800
2,100
Jan
00A
pr 0
0Ju
l 00
Oct
00
Jan
01A
pr 0
1Ju
l 01
Oct
01
Jan
02A
pr 0
2Ju
l 02
Oct
02
Jan
03A
pr 0
3Ju
l 03
Oct
03
Jan
04A
pr 0
4Ju
l 04
Oct
04
Jan
05A
pr 0
5Ju
l 05
Oct
05
Jan
06A
pr 0
6Ju
l 06
Oct
06
Jan
07A
pr 0
7Ju
l 07
Oct
07
USD millions
5
6
7
8
9
10
11
12
13
Net purchase of international reserves
Intervention interest rate

176 BIS Papers No 44
–25
–15
–5
5
15
25
35
Dec
99
Jun
00
Dec
-00
Jun
01
Dec
01
Jun
02
Dec
02
Jun
03
Dec
03
Jun
04
Dec
04
Jun
05
Dec
05
Jun
06
Dec
06
Jun
07
Graph 25
Investments of the financial system in government securities and gross loan portfolio
Share of total assets, in per cent
Sources: Banco de la República; Superintendencia Financiera de Colombia.
Graph 26
Financial system loan portfolio Annual real growth rate, in per cent
Sources: Banco de la República; DANE; Superintendencia Financiera de Colombia.
50 52 54 56 58 60 62 64 66 68
Jan
02
May Se
p
Jan
03
May Se
p
Jan
04
May Se
p
Jan
05
May Se
p
Jan
06
May Se
p
Jan
07
May Se
p
Loan
s
10
12
14
16
18
20
22
24
26
Gov
ernm
ent s
ecur
ities
Loans Government securities

BIS Papers No 44 177
11 12 13 14 15 16 17 18 19 20
01/0
7/20
05
01/0
8/20
05
01/0
9/20
05
01/1
0/20
05
01/1
1/20
05
01/1
2/20
05
01/0
1/20
06
01/0
2/20
06
01/0
3/20
06
01/0
4/20
06
01/0
5/20
06
01/0
6/20
06
01/0
7/20
06
01/0
8/20
06
01/0
9/20
06
01/1
0/20
06
01/1
1/20
06
01/1
2/20
06
Lend
ing
rate
5.0
5.5
6.0
6.5
7.0
7.5
8.0
Inte
rven
tion
rate
Lending rate BR intervention rate
Graph 27
Nominal interest rates: financial system lending rate and central bank intervention rate
Sources: Banco de la República; DANE; Superintendencia Financiera de Colombia.

178 BIS Papers No 44
Table 1
Current account As a percentage of GDP
Colombia Peru México Chile Brazil Turkey NIAE CEE
2000 0,9 –2,9 –3,2 –1,2 –3,8 –5,0 3,5 –5,3
2001 –1,3 –2,2 –2,8 –1,6 –4,2 2,3 4,7 –2,7
2002 –1,7 –2,0 –2,2 –0,9 –1,5 –0,8 5,1 –3,5
2003 –1,2 –1,6 –1,3 –1,0 0,8 –3,4 6,9 –4,5
2004 –0,9 0,0 –1,0 2,2 1,8 –5,2 6,5 –5,9
2005 –1,5 1,4 –0,6 1,1 1,6 –6,2 5,5 –5,2
2006 –2,2 2,8 –0,2 3,6 1,3 –7,9 5,6 –6,6
2007 (June) –3,9 0,9 –0,8 8,0 0,7 n.a. 5,4 –7,3
NIAE = newly industrialised Asian economies: Hong Kong SAR, Korea, Singapore, Taiwan (China).
CEE = central and eastern Europe.
Sources: IMF; central banks; national institutes of statistics.
Table 2
Colombia: current account balance, saving and investment As a % of GDP
2000 2001 2002 2003 2004 2005 2006
Saving – investment = current account balance 0,9 –1,3 –1,7 –1,2 –0,9 –1,5 –2,2
A. Total saving 14,6 13 13,6 16,0 18,3 19,3 21,2
Public 4,2 3,5 2,9 4,2 5,3 6,7 6,2
Private 10,4 9,5 10,7 11,7 13,0 12,6 14,9
B. Total investment 13,7 14,3 15,3 17,2 19,2 20,8 23,4
Public 7,3 6,7 6,5 7,0 6,6 6,7 7,2
Private 6,4 7,6 8,7 10,2 12,6 14,1 16,3
Sources: Banco de República; Ministry of Finance; DNP.

BIS Papers No 44 179
Table 3
Total investment As a percentage of GDP
Colombia Peru México Chile Brazil Turkey NIAE CEE
2000 13,7 20,2 23,8 21,9 18,3 24,5 28,4 25,0
2001 14,3 18,8 20,8 22,1 18,0 16,8 25,3 22,0
2002 15,3 18,8 20,6 21,7 16,2 21,3 24,7 22,5
2003 17,2 18,8 20,5 21,1 15,8 22,8 24,7 22,9
2004 19,2 18,9 22,0 20,1 17,1 25,7 26,4 24,5
2005 20,8 18,6 21,7 22,4 16,0 24,8 25,8 23,9
2006 23,5 21,0 22,0 20,4 16,8 23,9 25,9 24,6
NIAE = newly industrialised Asian economies: Hong Kong SAR, Korea, Singapore, Taiwan (China).
CEE = central and eastern Europe.
Sources: IMF; central banks; national institutes of statistics.
Table 4
Saving As a percentage of GDP
Colombia Peru México Chile Brazil Turkey NIAE CEE
2000 14,6 17,3 20,7 20,7 14,5 19,5 31,9 19,7
2001 12,9 16,6 18,0 20,5 13,8 19,1 30,0 19,2
2002 13,6 16,8 18,4 20,8 14,7 20,5 29,8 19,0
2003 16,0 17,3 19,2 20,1 16,5 19,4 31,6 18,4
2004 18,3 19,0 21,0 22,2 18,9 20,5 32,9 18,7
2005 19,3 20,0 21,1 23,5 17,6 18,6 31,6 18,7
2006 21,2 23,7 21,8 24,0 18,0 16,0 31,6 18,2
NIAE = newly industrialised Asian economies: Hong Kong SAR, Korea, Singapore, Taiwan (China).
CEE = central and eastern Europe.
Sources: IMF; central banks; national institutes of statistics.

Table 5 Financing of the current account
Colombia: balance of payments
USD millions 1994 1995 1996 1997 1998 1999 2000 2001 2002 2003 2004 2005 2006 20071
Current account –3.674 –4.528 –4.642 –5.751 –4.858 671 770 –1.088 –1.357 –974 –906 –1.881 –3.057 –6.500 % of GDP –4.4 –4.9 –4.8 –5.4 –4.9 0.8 0.9 –1.3 –1.7 –1.2 –0.9 –1.5 –2.2 –3.8 1. Financial account (A + B + C + C) 3.393 4.560 6.683 6.587 3.314 –555 59 2.447 1.304 657 3.205 3.230 2.799 10.888 A. Net foreign direct investment 1.298 712 2.784 4.753 2.033 1.392 2.111 2.526 1.277 783 2.873 5.578 5.365 6.762 Assets –149 –256 –328 –809 –796 –116 –325 –16 –857 –938 –142 –4.662 –1.098 –946 Liabilities 1.446 968 3.112 5.562 2.829 1.508 2.436 2.542 2.134 1.720 3.016 10.240 6.463 7.708 B. Net external debt 1.871 4.389 4.240 2.499 2.027 –934 –876 1.734 –579 –60 –80 –3.206 –2.221 3.655 Public sector –1.251 1.372 737 73 1.899 901 452 1.433 350 346 –286 –3.006 –908 2.284 Private sector 3.122 3.017 3.504 2.425 128 –1.835 –1.329 301 –929 –406 206 –200 –1.314 1.371 Long-term 2.756 2.070 3.282 2.712 902 –505 –1.150 –397 –1.341 –1058 –986 50 –277 898 Short-term 366 947 222 –286 –774 –1.330 –179 699 412 652 1.193 –250 –1.037 473 C. Portfolio investment 247 –305 208 358 –277 –773 –896 –1.912 415 –1.137 –74 87 –400 471 Assets –231 –470 –84 –234 –12 –746 –913 –1.872 399 –1.117 –454 –27 –845 471 Liabilities 478 165 292 593 –265 –27 17 –41 16 –20 380 114 445 0 D. Other private assets –24 –236 –549 –1.022 –469 –241 –280 99 191 1.071 486 771 56 0 2. Errors and omissions 480 –30 –321 –559 154 –430 41 –140 191 133 242 380 280 227 3. Change in international reserves 199 2 1.721 277 –1.390 –315 870 1.218 138 –184 2.541 1.729 23 4.615 1 Forecast. Source: Banco de la República.
180
BIS P
apers No 44

BIS Papers No 44 181
Table 6
Oil and mining investment and international prices
Oil sector Mining sector
FDI1 Price2 FDI1 Price (coal)3
2000 –383,9 28,2 506,7 26,3
2001 520,8 24,3 523,7 32,3
2002 449,1 25,0 466,2 27,1
2003 277,9 28,9 627,4 28,0
2004 494,9 37,8 1.246,4 56,7
2005 1.124,6 53,4 2.157,2 51,0
2006 1.801,9 64,3 1.782,5 52,6
2007 (June) 1.848,2 61,7 65,54 62,6 1 In millions of US dollars. 2 US dollars per barrel. 3 US dollars per MT. 4 Includes USD 1.2 billion corresponding to capital reimbursement.
Sources: Balance of Payments – Banco de la República; IMF.
Table 7
Stock of Colombian external debt by sector (public and private) USD millions
Private Public Total
Short-term
Long-term Total Short-
term Long-term Total Short-
term Long-term Total
2000 2.315 13.207 15.522 199 20.409 20.608 2.514 33.616 36.130
2001 2.802 12.826 15.628 320 23.148 23.468 3.122 35.974 39.096
2002 3.063 11.481 14.544 429 22.352 22.781 3.492 33.833 37.325
2003 3.095 10.386 13.481 224 24.303 24.527 3.319 34.689 38.008
2004 4.332 9.331 13.663 391 25.388 25.779 4.722 34.719 39.441
2005 4.957 9.366 14.322 399 23.733 24.132 5.356 33.099 38.455
2006 4.508 9.395 13.903 254 25.997 26.251 4.763 35.391 40.154
2007 June 5.349 10.112 15.461 328 27.4631 27.792 7.137 36.116 43.253
1 USD 1.5 billion corresponds to a credit disbursed by the electricity sector.
Source: Banco de la República.

182 BIS Papers No 44
Table 8
Colombia: external debt intermediated by resident financial institutions
USD millions
External debt Year
Financial (a) Total (b) (a)/(b) %
2000 3.244 36.130 9,0
2001 2.664 39.096 6,8
2002 2.287 37.325 6,1
2003 1.652 38.008 4,3
2004 2.201 39.441 5,6
2005 2.889 38.455 7,5
2006 2.098 40.154 5,2
2007 June 3.608 43.253 8,3
Source: Banco de la República.

Table 9
Evolution of private net capital inflows (balance of cash foreign exchange transactions)
USD millions
Jan 07 Feb 07 Mar 07 Apr 07 May 07 Jun 07 Jul 07 Aug 07 Sep 07 Oct 07 Nov 07
Net loans 110 10 33 394 –135 –144 –26 54 –104 –74 –129
Net loans to non-residents 79 –31 –34 –9 –7 –34 –11 –4 –1 –18 –19
External net indebtedness 31 41 68 402 –128 –110 –15 58 –103 –56 –110
Disbursement 168 249 300 594 221 50 110 225 92 69 24
Amortisations –138 –208 –233 –192 –349 –160 –125 –167 –195 –125 –133
Foreign investment in Colombia 526 272 1.393 477 1.133 634 900 322 547 571 472
Oil and mining 290 345 310 252 562 551 410 351 310 360 344
Other sectors 227 –19 685 72 266 80 177 81 244 174 108
Portfolio1 10 –55 398 154 305 2 312 –110 –8 36 20
Colombian investment abroad –87 –122 188 –49 –14 –115 –301 132 129 –88 –191
Direct investment –29 –11 –21 –4 –36 –28 –17 –30 –33 –17 –20
Portfolio –58 –111 209 –45 22 –87 –284 162 162 –71 –171
Net reimbursements from foreign deposit accounts2 479 857 –260 328 453 129 –380 –294 –39 –111 –224
International agencies – – –4 – – –4 – –6 –14 –1 –8
Others 479 857 –257 328 453 133 –380 –288 –24 –110 –216 1 In July, it includes USD 314 million of ADRs of Bancolombia, which are not subject to deposit at Banco de la República. 2 Cuentas de Compensación.
Source: Banco de la República.
BIS P
apers No 44
183

184 BIS Papers No 44
References
Alper, C Emre and Ismail Saglam (2000): “The equilibrium real exchange rate: evidence from Turkey”, Topics in Middle Eastern and North African Economies, No. 1–2.
Arango, L A, A González, J León and L F Melo (2006): “Cambios en la tasa de intervención y su efecto en la estructura a plazo de Colombia”, Borradores de Economía No. 424, Banco de la República.
Betancourt, R., Vargas, H. and Rodríguez, N (2006): “Interest rate pass-through in Colombia: a micro-banking perspective”, Borradores de Economía No. 407, Banco de la República.
Elbadawi, Ibrahim and Raimundo Soto (1994): “Capital flows and long-term equilibrium real exchange rates in Chile”, Policy Research Working Paper No 1306, World Bank, June.
Gómez, C, D Jara and A Murcia (2006): “Impacto de las operaciones de los fondos de pensiones obligatorias en los mercados financieros colombianos”, Borradores de Economía No. 406, Banco de la República.
Kamil, Herman (2007): “Is central bank intervention effective under inflation targeting regimes? The case of Colombia”, mimeo, IMF.
Lega, P F, A Murcia, D Vásquez and T Venegas (2007): “Volatilidad de la tasa de cambio en Colombia y su relación con algunas variables”, Borradores de Economía No. 473, Banco de la República.
Suárez, J C (2007): “Efecto manada en los portafolios de los fondos de pensiones obligatorias en Colombia: causas y medición”, thesis, Industrial Engineering Department, Universidad de los Andes, Bogotá.
Tenjo, F, L Charry, M López and J M Ramírez (2007): “Acelerador financiero y ciclos económicos en Colombia: un ejercicio exploratorio”, Borradores de Economía No. 451, Banco de la República.
Uribe, J and H Vargas (2003): “Financial reform, crisis and consolidation in Colombia” in Regional Integration in Europe and Latin America: Monetary and Financial Aspects, edited by P Van der Hagen and J Viñals, Ashgate.

BIS Papers No 44 185
The Czech experience with capital flows: challenges for monetary policy
Luděk Niedermayer and Vít Bárta1
1. Introduction
Capital flows are a crucial factor in macroeconomic and monetary development. Especially in a small open economy, they usually have a direct and sizeable impact on the exchange rate and, through it, on inflation, competitiveness and economic growth. Should the overall macroeconomic framework become internally inconsistent, capital flows become a typical channel through which the necessary correction materialises. They thus constitute both the channel through which a given macroeconomic setting could be damaged or undermined and a useful adjustment mechanism of re-establishing the economic order.
In this paper, we discuss the experience of the Czech economy with capital flows since the beginning of its transformation, which started in 1991. We deal with three different periods characterised by substantial volumes of capital flows with significant implications for the way monetary policy was implemented. Three different developments were occurring within different macroeconomic frameworks, thus having different monetary policy implications. Namely, we deal with: (1) the period 1991–95, when the fixed exchange rate and monetary targeting were maintained; (2) 1996–99, when the Czech National Bank (CNB) widened the fluctuation margin for the koruna and when a speculative attack ultimately led the CNB to abandon the fixed exchange rate regime, with negative implications for exchange rate volatility; and (3) 2002–03, when the CNB, against the background of a steady appreciation trend, faced an appreciation bubble and its subsequent burst. We also briefly discuss a potential future challenge for monetary policy consisting in a high share of repatriated profits in the current account deficit. This is followed by some remarks concerning the period from March to summer 2007, when the Czech foreign exchange market was influenced by “carry trades”. Finally, we summarise the Czech experience with capital flows and derive some lessons.
2. Capital flows under the fixed exchange rate regime: 1991–95
2.1. Macroeconomic and monetary background
2.1.1. Beginning of economic reform and split of the former Czechoslovakia Economic reforms in the Czech Republic started in 1991 after the collapse of the former centrally planned system and the disintegration of the former CMEA trade regime. Initial reform steps involved: (a) the devaluation of the Czechoslovak koruna in several steps and its fixing vis-à-vis a basket of five currencies; (b) the introduction of so-called internal convertibility of the koruna (see below); (c) the liberalisation of prices; and (d) the liberalisation of foreign trade. In the initial phases of the economic transformation, direct
1 Vít Barta did final editing and made important contributions to a previous version of the article, which was
based on Ludek Niedermayer’s presentation at a workshop of the National Bank of Romania at the end of 2006.

186 BIS Papers No 44
policy tools were frequently applied, but these were phased out and replaced by indirect market-conforming measures.
As in other transformation economies, output dropped substantially during 1991–92, but started to recover afterwards. During this period, the privatisation process started with the aim of generally overhauling property rights in the economy. In 1992, a general tax reform introduced a market-conforming tax structure. After the split of former Czechoslovakia, the Czech Republic came into being in January 1993 and the Czech koruna in February. In subsequent years, the economy recovered and embarked on a path to accelerated growth.
2.1.2. Overheating and the emergence of external imbalance At first sight, the Czech economy was reasonably healthy2 in the mid-1990s. Economic growth reached almost 7% in 1995 (Figure 1), unemployment was around 4% and inflation was around 9% and stable.
Figure 1
GDP in the Czech Republic (1994–H1 2006)
Source: Czech Statistical Office.
As mentioned above, the exchange rate was fixed with the currency peg delivering much needed stability to the economy. The overall prospects were considered quite promising.
However, a closer look showed worrying signs of demand overheating. Growth in real wages was exceeding productivity growth, and the gap between both variables reached almost 12 percentage points in 1995 and was still substantial in 1996 (Figure 2).
2 The problems of the Czech economy during the 1990s related to the inadequacy of its institutional framework,
the weakness of its law enforcement mechanisms and the consequences of delayed privatisation of the banking sector are not discussed in this paper. However, there is no doubt that they negatively influenced the performance of the economy during the second half of the 1990s.
8
2.2
6.9
4
–0.7 –0.8
1.3
3.6
2.5
1.9
3.6
4.2
6.1 6.6
–2
–1
0
1
2
3
4
5
6
7
1994 1995 1996 1997 1998 1999 2000 2001 2002 2003 2004 2005 H1 2006
Yea
r-on
-yea
r cha
nge
in %

BIS Papers No 44 187
Figure 2
Real wages and labour productivity in the Czech Republic (1995–2004)
Source: Czech National Bank.
An unfavourable relationship also existed between domestic demand and supply. Stimulated by the fast growth of wages, household demand started to boom and loans to the newly fledged private sector expanded robustly. This was partly a consequence of what has been called “banking socialism”: government expenditures were directed towards large infrastructure projects (many of them in the area of environmental protection) with typically low returns. Also, private investments recovered after the decline during the transformation recession. The investment boom which took place during 1995–96 implied an exceptionally high ratio of gross fixed capital formation to GDP.
The resulting mismatch between domestic demand and supply led to the emergence of an external imbalance: the current account deficit reached 6.6% of GDP in 1996 and 6.2% in 1997 (Figure 3), thus exceeding the level generally considered critical (5% of GDP).
Figure 3
Trade and current account balance/GDP (1995–2005)
Source: Czech National Bank, own computations.
1995 1996 1997 1998 1999 2000 2001 2002 2003 2004–4
–2
0
2
4
6
8
10
12 ye
ar-o
n-ye
ar c
hang
es in
%Real wages Labour productivity
1995 1996 1997 2001 2002 2003 2004 2005–12
–10
–8
–6
–4
–2
0
2
1998 1999 2000
% o
f GD
P
Trade balance/GDP
Current account balance/GDP

188 BIS Papers No 44
Unfortunately, the macroeconomic policies at the time did not respond to mounting external imbalances. The overheating was partly (and mistakenly) considered as the correction of previous economic decline. In addition, policymakers believed that the performance in the mid-1990s reflected the strengths of the newly formed market economy. Overall, there was insufficient understanding of the risks related to a continuing fixed exchange rate regime. The consequences of this neglect became obvious when capital flows started to play a more important role.
2.2. Capital account liberalisation: an invitation to capital inflow
2.2.1. From internal to external convertibility in five years The internal convertibility of the koruna introduced at the beginning of 1991 was based on the following elements:3
– free access of domestic firms to convertible currencies used for trade transactions
– obligatory sales of foreign currencies obtained as export revenue
– limited access of households to foreign currencies used for individual tourism
These measures were adopted to cope with the very low level of foreign exchange reserves with which the Czechoslovak (Czech) economy was starting its economic transformation. In other words, in the light of this low endowment with reserves, internal convertibility was the only way to maintain the currency peg.
While the approach to current account transactions was relatively liberal, capital account transactions were more strictly regulated, especially on the outflows side. Although repatriation of investment gains (profits, dividends and interest payments) was guaranteed, free outflow of short-term portfolio investment by residents was restricted. Some other capital account transactions (both outflows and inflows) were either explicitly forbidden or subject to a licence system (see Dědek (2000) for more details). A general reason for different outflow restrictions was to stimulate inflows of FDI (to support the restructuring and privatisation of the government-owned sector) and portfolio investment (to support the development of the capital market). The inflow of bank credit was also welcomed due to the fear that domestic banks were unable to meet the requirements of the under-invested and growing economy.
Although the Foreign Exchange Act remained unchanged for several years, the overall legal environment and everyday practices were developing towards much higher capital mobility. An important interference with the desired framework stemmed from bilateral agreements on the protection of foreign investments. These international agreements were superior to domestic legal norms and thus undermined the discriminatory approach towards outflows of short-term capital as intended by the Foreign Exchange Act. Another channel of erosion of capital mobility restrictions was rooted in the banking sector. With the expansion of foreign banks (and their branches) and the increasing weight of their transactions (between both residents and non-residents), the initial scheme (or “straitjacket”) tailored for taming the capital flows was weakening.
In October 1995, a new Foreign Exchange Act was adopted4 which confirmed de jure the situation which existed de facto in many areas. In other areas it represented significant
3 See Dědek (2000) for more details. 4 Further liberalisation of capital flows was stimulated by the Czech Republic’s politically driven entry into the
OECD (in October 1995).

BIS Papers No 44 189
progress towards the liberalisation of capital flows even in the capital account.5 With just a bit of simplification, we can conclude that the overall shift from the internal convertibility of the koruna to its external convertibility was finished in about five years.
2.2.2. Emergence of the “impossible trinity” The completion of capital account liberalisation and the maintenance of the fixed exchange rate led to the emergence of the impossible trinity (or the open economy trilemma), the extremely problematic parallel existence of: (a) free capital flows, (b) a fixed exchange rate and (c) an independent monetary policy.
The mechanics of the impossible trinity worked ruthlessly in the Czech case, especially when the currency obtained the “investment approved” status for more investors:6 a high interest rate differential (see Figure 4) (due to a high inflation differential) in combination with the stable exchange rate invited sizeable capital inflows (Figure 5).
Figure 4
One-month Pribor and Deutsche Bundesbank official rate during 1993–96
Sources: Eurostat, Czech National Bank.
Figure 4 shows that the interest rate differential narrowed somewhat during between the second half of1993 and 1994 but widened again at the end of 1994, remaining quite substantial during 1995–96. Unsurprisingly, the inflow of capital (Figure 5) was very strong during this period, thus contributing to an overheating of the economy.
5 Two major remaining restrictions were those on the purchase of real estate by non-residents and the opening
of banking accounts by residents abroad. 6 In 1993, the Czech Republic was designated as investment grade. The credibility of the economy (and
currency) was boosted later on by several factors, such as a stronger reserve position, the above-mentioned capital account liberalisation and OECD membership.
20
%
0
2
4
6
8
10
12
14
16
18
Jan
1993
M
ar 1
993
May
199
3
Jul 1
993
Sep
199
3
Nov
199
3
Jan
1994
Mar
199
4
May
199
4
Jul 1
994
Sep
199
4
Nov
199
4
Jan
199
5
Mar
199
5
May
199
5
Jul 1
995
Sep
199
5
Nov
199
5
Jan
1996
Mar
199
6
May
199
6
Jul 1
996
Sep
199
6
Nov
199
6
Bundesbank official rate
One-month Pribor

190 BIS Papers No 44
Figure 5
Capital flows during 1993–98 (in billions of koruna)
In terms of GDP, net FDI inflows reached 6% in 1998.
Source: Czech National Bank.
Maintaining the currency peg required interventions in the forex market (purchase of foreign currency for koruna), which led to an increase in the monetary base and monetary aggregates. The resulting sterilisation by the central bank led to a steady accumulation of foreign exchange reserves (Figure 6) and pushed the interest rates further upwards.
Figure 6
“Sources” of foreign exchange reserves of the Czech National Bank (in US dollars)
Source: Czech National Bank.
mn
US
D
–2,000
3,000
8,000
13,000
18,000
23,000
28,000
Jan
1993
Jul 1
993
Jan
1994
Jul 1
994
Jan
1995
Jul 1
995
Jan
1996
Jul 1
996
Jan
1997
Jul 1
997
Jan
1998
Jul 1
998
Jan
1999
Jul 1
999
Jan
2000
Jul 2
000
Jan
2001
Jul 2
001
Jan
2002
Jul 2
002
Jan
2003
Jul 2
003
Jan
2004
Jul 2
004
Jan
2005
Jul 2
005
Jan
2006
Reserve revenue and other factorsSale of FX reserve revenue Interventions – absorption of privatisation revenueCNB interventionsFX reserves adjusted for EUR/USD exchange rate
16.4 21.6
67
34.6 40.5
115.9
23.431.9
89.4 84.4
12.9
–64.1
1.619 25.8
–25.2
–53.5
8.1
–80
–60
–40
–20
0
20
40
60
80
100
120
140
1993 1994 1995 1996 1997 1998
FDI Portfolio investmentOther long-term investment Other short-term investment

BIS Papers No 44 191
Figure 6 shows a very steep increase in foreign exchange reserves (in USD terms) until the end of 1995 (the blue shaded area denotes the amount of reserves acquired through interventions; later on, specifically in 2002 and 2005, the amount of reserves also increased due to absorption of privatisation of revenue). Higher interest rate differentials provided further stimuli for capital inflow and completed the vicious circle (Figure 7).
Figure 7
Vicious circle of monetary policy during 1993–96
2.3. Implications of capital flows during 1991–95 The amount of capital flows was insignificant at the very beginning of transformation when the economy was declining and far from being stable. This was irrespective of the fact that policymakers adopted some measures to attract foreign capital. The situation stared to change after 1993, when growth resumed and the uncertainties related to the split of former Czechoslovakia vanished. While FDI and portfolio capital were attracted by newly emerging profit opportunities in the real sector, interest-sensitive forms of capital were stimulated by the parallel existence of: (a) a high interest rate differential (due to higher domestic inflation than abroad); (b) the increasing cross-border mobility of capital (due to a partly spontaneous and party intended process of current and capital account liberalisation); (c) the fixed exchange rate of the koruna; and (d) a relatively liquid foreign exchange market. Although the monetary framework was transforming the capital inflows into foreign exchange reserves, it was not efficient enough to prevent further stimulation of domestic demand. Macroeconomic tightening and a change of the framework to address the issue of the impossible trinity were greatly needed.
Higher domestic interest rates
Capital inflow
Appreciation pressures
Interventions: purchase of
foreign currenciesPressures: increase of
monetary base and monetary aggregates
Sterilisation: sales of
securities to domestic
banks
Pressures: increase of domestic
interest rates

192 BIS Papers No 44
Appreciation boundary Depreciation boundary
–10
–5
0
5
10
15
20
%
Exchange rate of the koruna (basket: 65% DEM, 35% USD)
27 May 1997 Cancellation of fluctuation
band, introduction of free float
28 February 1996 Fluctuation band
extended to +/- 7.5%
27 September 1992 Setting of the band for the fluctuation of the exchange rate of the
koruna +/- 0.5%
3. From the widening of the fluctuation band towards the speculative attack: 1996–97
At the end of 1995, the macroeconomic and monetary situation was on the verge of unsustainability. The economy was overheating, the current account was in deficit and rapidly deteriorating, and the costs of maintaining the currency peg were growing substantially. Stabilisation of the economy (possibly coordinated) became inevitable.
3.1. Isolated attempts of the CNB to deal with imbalances As the government at the time did not consider the macroeconomic imbalances to be a matter for concern, the CNB implemented restrictive policies without any support from government policies. As a consequence, the policy response was one-sided and insufficient. Although the CNB increased interest rates several times during 1996, overall monetary tightening was limited. At the end of February 1996, the CNB widened the fluctuation band of the koruna to ±7.5% (from ±0.5%) to impede the inflow of speculative capital. Although widening the band introduced more uncertainty to foreign investors and halted the accumulation of reserves, the overall stabilisation impact was only partial and the fiscal-monetary mix remained too loose (or not restrictive enough).
Figure 8 shows that after the widening of the band, the koruna started to appreciate (vis-à-vis the basket of US dollars and Deutsche marks valid until May 1997).7
Figure 8
Exchange rate of the koruna vis-à-vis a basket of currencies (% fluctuations)
Source: Czech National Bank.
7 After the abolishment of the fluctuation band (in line with an overall orientation of the Czech Republic towards
the EU), the CNB declared the Deutsche mark (and later the euro) to be the reference currency.

BIS Papers No 44 193
The monetary development clearly had negative side effects on the real economy. The appreciation of the currency started to undermine the country’s competitiveness, thus leading to the highest trade deficit (in terms of GDP) during the whole transformation period (see Figure 3 above). Although the appreciation helped to decrease inflation temporarily, the situation was fragile and the economy’s vulnerability increased.
3.2. Currency crisis: fast capital outflows and subsequent stabilisation policies In early spring 1997, the sentiment on foreign exchange markets started to reverse. In February, the koruna reached its appreciation peak, and policymakers’ inability to adopt the necessary corrective measures pushed it towards depreciation. The economic prospects were deteriorated by sudden worsening of public finances in April. Although the government adopted a certain stabilisation package, its credibility and adequacy was questioned by the market.
The koruna came under pressure on the foreign exchange markets during May and was exposed to an attack triggered by the problems in Asian foreign exchange markets. The foreign exchange regime was not sustained, despite sizeable foreign exchange and money market interventions. On 27 May, the CNB abandoned the currency peg and switched to a managed float. During June, the koruna depreciated by about 12% against the former central parity.
To stabilise the domestic currency, the CNB increased interest rates dramatically for a short period. Although this helped to keep the koruna from further depreciating, it dented economic performance by sharpening existing problems in the banking sector (bad loans) and the enterprise sector (inter-enterprise arrears) in subsequent months.
In June, the government adopted the second stabilisation package. It addressed two areas: in the macroeconomic area it implemented a fiscal tightening, a wage freeze in the public sector and the adoption of an import surcharge to restrict imports. In addition to this short-term stabilisation, the package addressed the legal, institutional and microeconomic bottlenecks of the economy with the aim of boosting supply side performance over the long run.
The macroeconomic restriction (both fiscal and monetary) combined with the restructuring of the banking sector8 was rather robust, and the economy slipped inevitably into recession in 1997 and 1998 (see Figure 1 above). The subsequent period brought a mixture of bad and good news. On the positive side, the external imbalance started to shrink during 1998 and 1999, reaching substantially lower levels than before 1997. Supply side performance (due to intensified competition and progress in the institutional and legal spheres) was improving over time, which was reflected in an acceleration of potential output growth after 2000 (Figure 9).
8 The largest partly state-owned banks were privatised during 1998–2001. New owners started the restructuring
soon after, but it took some years before the competition in the market increased.

194 BIS Papers No 44
Figure 9
Growth of potential output according to different methodologies (1996–2005)
Source: Czech National Bank.
In the monetary policy area, a new monetary regime had to be found soon after the abolishment of the currency peg. After some discussion, the CNB decided to adopt inflation targeting from the beginning of 1998. The rather untidy monetary discretion which prevailed in the aftermath of a speculative attack was thus replaced by a consolidated monetary framework with transparent and well defined decision-making. In other words, the earlier currency anchor was replaced by the inflation anchor which corresponded much better to the almost fully liberalised economy. Inflation targeting also improved the transparency of the CNB and gradually contributed to the credibility of the currency.
The post-crisis uncertainty and the negative output gap9 were the key challenges for the conduct of monetary policy. Figure 10 shows the output gap, which reached about 4% of GDP in 1999.
The size of the output gap indicates that the adjustment of the (preceding) disequilibria was rather costly. The recessionary pattern of the Czech economy was even more striking because no similar development had occurred in the neighbouring transformation economies.10 Also, unemployment started to increase, reaching around 8% Although it was not very favourable for those who became unemployed, the macroeconomic development benefited from the fact that the higher level of unemployment helped keep wages in check for many following years.
9 Obviously, given the way in which the output gap is constructed, this comment reflects an ex post analysis. 10 For example, Hungary (whose economy slowed in 1995 due to the adoption of an austerity package by Prime
Minister Bokros) was growing by 2.9% in 1997 and even by 5.7% in 1998.
Jan
2006
0
1
2
3
4
5
6
Jan
1996
Mar
199
6
Jan
1997
Mar
199
7
Jan
1998
Mar
199
8
Jan
1999
Mar
199
9
Jan
2000
Mar
200
0
Jan
2001
Mar
200
1
Jan
2002
Mar
200
2
Jan
2003
Mar
200
3
Jan
2004
Mar
200
4
Jan
2005
Mar
200
5
year
-on-
year
cha
nge
in %
Production function (CNB)Kalman filter Production function (MF)

BIS Papers No 44 195
Figure 10
Output gap (as a percentage of GDP)
Source: Czech National Bank.
The abolition of the FX rate peg and post-crisis macroeconomic stabilisation led to an increase in exchange rate volatility. As can be seen in Figure 11, after depreciating throughout 1997 the koruna appreciated quite strongly, supported by the high interest rate differential during 1998, but depreciated again in early spring 1999. The relatively fast and robust pass-through was thus transformed into more volatile inflation, complicating the formation of inflation expectations and the implementation of stabilisation policy based on inflation targeting.
Figure 11
Exchange rate of the koruna vis-à-vis the euro (pre-1999 data obtained from the conversion rate
between DEM and EUR)
Source: Eurostat.
26
28
30
32
34
36
38
40
2.1.
1995
2.5.
1995
2.9.
1995
2.1.
1996
2.5.
1996
2.9.
1996
2.1.
1997
2.5.
1997
2.9.
1997
2.1.
1998
2.5.
1998
2.9.
1998
2.1.
1999
2.5.
1999
2.9.
1999
2.1.
2000
2.5.
2000
2.9.
2000
2.1.
2001
2.5.
2001
2.9.
2001
2.1.
2002
2.5.
2002
2.9.
2002
2.1.
2003
2.5.
2003
2.9.
2003
2.1.
2004
2.5.
2004
2.9.
2004
2.1.
2005
2.5.
2005
2.9.
2005
2.1.
2006
2.5.
2006
2.9.
2006
Speculative capital inflow
Speculative attack
Political crisis
Exchange rate
bubble
Post-crisis volatility
Trend appreciation
Burst of thebubble
Trend appreciation
Post-crisis volatility
–5
–4
–3
–2
–1
0
1
2
Q1
1996
Q3
1996
Q1
1997
Q3
1997
Q1
1998
Q3
1998
Q1
1999
Q3
1999
Q1
2000
Q3
2000
Q1
2001
Q3
2001
Q1
2002
Q3
2002
Q1
2003
Q3
2003
Q1
2004
Q3
2004
Q1
2005
Q3
2005

196 BIS Papers No 44
3.3. Implications of capital flows during 1996–99 As Figure 11 clearly shows, capital inflows and outflows played a substantial role in the exchange rate volatility during 1996–99. The widening of the fluctuation band in February 1996 was followed by an appreciation which persisted until February 1997. As mentioned above, the worsening of market sentiment (driven by macroeconomic disequilibria) turned into capital outflows, which implied a depreciation of the koruna. To prevent further capital outflows and stabilise the currency after May 1997, interest rates were increased dramatically. The combination of a high interest rate differential and a recovery of the credibility of the koruna promoted capital inflows, and the currency steadily appreciated throughout 1998 until February 1999.11
As inflation plummeted during 1998–99, interest rates declined accordingly, implying a narrowing of the interest rate differential. The earlier appreciation was followed by a correction in February 1999, which partly reflected a declining (but still positive) carry on the koruna. In other words, the koruna exchange rate was on a roller coaster during 1996–99, with most of the volatility attributable to capital inflows and outflows. For monetary policy, this was a new experience.
Considering the rather high volatility of the currency and the remarkable openness of the economy, the stabilisation of inflation became a difficult and challenging task. Figure 12 indicates a rather close relationship between the koruna exchange rate and adjusted inflation (which refers to CPI inflation minus administered prices and food prices) during 1996–98.
Figure 12
The exchange rate of the koruna vis-à-vis the euro and adjusted inflation during 1994–2006
Sources: Eurostat, Czech National Bank.
11 As Figure 11 shows, the koruna did not reach its pre-crisis level, but was stronger than in the period which
preceded the widening of the fluctuation band to ± 7.5%.
CZK
/EU
R
0
2
4
6
8
10
12
Dec
199
4M
ay 1
995
Oct
199
5
Mar
199
6
Aug
199
6 Ja
n 19
97
Jun
1997
Nov
199
7
Apr
199
8
Sep
199
8
Feb
1999
Jul 1
999
Dec
199
9
May
200
0
Oct
200
0
Mar
200
1
Aug
200
1
Jan
2002
Jun
2002
Nov
200
2
Apr
200
3 S
ep 2
003
Feb
2004
Jul 2
004
Dec
200
4
May
200
5
Oct
200
5
Mar
200
6
Aug
200
6
Adj
uste
d in
flatio
n yo
y (%
)
25
27
29
31
33
35
37
39Adjusted inflationCZK/EUR

BIS Papers No 44 197
4. Appreciation bubble in 2001–02
Figures 11 and 12 show that a steady appreciation of the koruna during 2000–06 was interrupted by an appreciation bubble in 2002 and its subsequent burst. First, we deal briefly with the trend towards appreciation and then with the exchange rate bubble. We investigate the role of capital flows in each case.
4.1. Trend appreciation and the sterilisation scheme The appreciation trend starting around 2000 was driven by steadily increasing productivity gains (the Balassa-Samuelson effect) related to an advanced stage of microeconomic restructuring. As illustrated by Figure 9, productivity growth translated into an acceleration of sustainable growth.
In addition, the appreciation of the koruna was fostered by future appreciation expectations derived from accelerating sales of many large government-owned companies (announced by the government to occur from 2000 onwards). In order to offset potentially damaging appreciation pressures stemming from the sales of big blocks of government assets, the government adopted a special sterilisation scheme (developed by the CNB) which was supposed to isolate the impact of these sales on the foreign exchange market.12 The adoption of the scheme in January 2002 was justified by the fact that the observed appreciation was occurring at a time when no inflow of short-term debt capital was registered. Thus, the expectations of future capital flows, rather than actual flows, were behind part of the appreciation. Policymakers’ intention to adopt the sterilisation scheme (to face current expectations and future capital flows) was also justified by the assumption that the standard tool (interest rates) would hardly be efficient when dealing with flows unrelated to interest rate differentials.
4.2. Exchange rate “bubble” The appreciation bubble starting at the end of 2001 and peaking in July 2002 was driven by both expectations and actual capital flows. Below, we examine the sentiment in the foreign exchange market and the capital flows as recorded by the capital account of the balance of payments.
4.2.1. Development in the foreign exchange market During the first four months of 2002, the koruna steadily appreciated as a consequence of persisting investment inflows and positive market sentiment. The rate of appreciation, however, was out of step with economic fundamentals, so the CNB decided to intervene in the market several times, both verbally and via forex interventions. With the fall in expected inflation, the Bank also lowered interest rates multiple times (see Figure 13). The appreciation sentiment in the market was fairly strong at the time, however, and the CNB’s interventions failed to have any long-term effect on the koruna. There was moderate stabilisation in the middle of the year, when the appreciation trend halted, after the koruna hit a historical high of EUR/CZK 28.9.13 This was attributable to covert interventions, through
12 The purpose of the scheme was to counteract the underlying market expectations that a sizeable increase in
privatisation proceeds will sooner or later be converted on the foreign exchange market. The proposed approach was based on the assumption that the best solution is to keep the privatisation revenues (and other foreign exchange revenues of the government, eg from the de-blocking of its foreign receivables) to the maximum extent possible on a foreign exchange account at the CNB or to use them without the need for conversion into koruna. See www.cnb.cz/en/monetary_policy/strategic_documents/download/vlada_cnb_kurz_en.pdf for details.
13 The level was not reached before end-2005.

198 BIS Papers No 44
which the central bank succeeded in keeping the market in suspense. A sharp reduction in key rates (of 75 basis points in July) also had a psychological effect. This took the rates below those of the ECB.
Figure 13
Two-week repo rates of the ECB and the CNB
Source: Eurostat.
After a swing in August linked to the uncertain impacts of floods, the exchange rate of the koruna set off on a downward course. Acting against the domestic currency were large foreign trade deficits (reported by the Czech Statistical Office), a negative interest rate differential against other central European currencies (bolstered by a further 25 basis point reduction in CNB rates at the end of October) and, at the end of the year, a sharp weakening of the dollar. Owing to the action of market forces and an easing of speculative pressures, in October the CNB stopped intervening directly in the foreign exchange market. Looking at the year as a whole, then, the koruna started 2002 at EUR/CZK 31.65 and with a strong appreciation trend, but a turnaround in that trend in the second half meant that it ended the year essentially unchanged, at EUR/CZK 31.60.
4.2.2. Financial account of the balance of payments The financial account for 2002 recorded a net inflow of foreign capital of CZK 340.3 billion (EUR 11.0 billion), almost twice the previous year’s figure. The largest inflow was traditionally from foreign direct investment. The total volume of FDI increased by around CZK 60 billion to a record CZK 276.1 billion (EUR 9.0 billion), thanks to high privatisation revenues. The ratio of FDI to GDP exceeded 10%. The year-on-year increase of 22.3% was due in particular to the sale of Transgas, to RWE of Germany. Adjusted for the state’s sale of Transgas and the purchase of 40% of Česká spořitelna’s14 shares, the investment inflow was fairly even across the individual quarters of the year (between CZK 25 billion and CZK 28 billion), apart from in
14 Česká spořitelna’s is part of the three biggest commercial bank in the Czech Republic.
Inte
rest
rate
(%)
0
1
2
3
4
5
6
7
8
9
10
1.1.
1999
1.5.
1999
1.9.
1999
1.1.
2000
1.5.
2000
1.9.
2000
1.1.
2001
1.5.
2001
1.9.
2001
1.1.
2002
1.5.
2002
1.9.
2002
1.1.
2003
1.5.
2003
1.9.
2003
1.1.
2004
1.5.
2004
1.9.
2004
1.1.
2005
1.5.
2005
1.9.
2005
1.1.
2006
1.5.
2006
1.9.
2006
ECB
CNB

BIS Papers No 44 199
the third quarter, when there was an increase in purchases of corporate interests by foreign investors.
Portfolio investment recorded a net outflow of CZK 46.7 billion (EUR 1.5 billion) in 2002. Compared to 2001, when a net inflow of CZK 34.9 billion had been recorded, that means a turnaround in financial flows of CZK 81.6 billion. This was chiefly due to domestic banks, which converted a large proportion of their assets held in the form of short-term deposits into portfolio investment holdings. The largest outflow of portfolio investment occurred in Q4 2002 (CZK 53.5 billion) (see Figure 14), when domestic banks on balance invested CZK 34.8 billion in foreign bonds and there was a simultaneous decline in investment by foreign investors in domestic bonds. In the third and fourth quarters, the interest of foreign investors in Czech debt securities steadily waned. Foreign investors’ behaviour was arguably linked to the evolution of the interest rate differential and the expected exchange rate of the koruna, as well as to the availability of more lucrative investments in neighbouring countries such as Poland and Hungary,15 on a cost of carry basis.
Figure 14
Financial account during 2001–03
Source: Czech National Bank.
Other investment showed a net inflow of funds of CZK 122.0 billion (around EUR 4 billion). As compared to the previous year, when this item had recorded a net outflow of around CZK 67.1 billion, this represents a sharp change in the direction of financial flows. The inflow of capital into the Czech Republic started in the first quarter and steadily gathered pace, especially in Q4 (see Figure 14). Domestic banks accounted for much of this inflow (CZK 115.5 billion). During the course of the year they gradually withdrew their short-term assets from foreign banks (total fall in short-term deposits: CZK 97.9 billion) and steadily decreased their short-term credit exposure to non-residents.
15 There was also anecdotal evidence that some of the investors used the koruna as a financing currency for
purchases of positive carry currencies.
CZK
billi
ons
–60
–10
40
90
140
190
Q1
2001
Q2
2001
Q3
2001
Q4
2001
Q1
2002
Q2
2002
Q3
2002
Q4
2002
Q1
2003
Q2
2003
Q3
2003
Q4
2003
Foreign direct investmentPortfolio investment Financial derivatives Other investment

200 BIS Papers No 44
4.3. Implications of capital flows during 2001–02 Capital flows became an important factor in exchange rate development during 2001–02. The combination of: (a) an unprecedented inflow of FDI related to large sales of government assets; (b) expectations of further inflows; and (c) speculative flows of capital driven by expectations of koruna appreciation inflated the exchange rate bubble during the first half of 2002. The adoption of the sterilisation scheme by the government and the CNB in combination with a series of exchange rate cuts (supplemented by other negative news from the real economy) probably supported a gradual reversal of sentiment in the foreign exchange market and brought the koruna’s exchange rate back towards its fundamentals. However, it took some time before the correction depreciated the currency, so the costs of this episode for the economy were not negligible. Appreciation of the currency translated into deflation in 2003, which lasted about eight months. An unexpected decline in inflation led to an increase in real wages, which implied an increase in household consumption and somewhat higher volatility in the GDP during 2003.
5. 2007 experience with carry trades
As seen in Figure 15, short-term interest rates have become significantly lower than those in other markets. The gap was widened by the start of the monetary tightening by many central banks. As result, investments in koruna-denominated fixed income instruments lost their attraction, but at the same time, financing in the currency became “cheap” in nominal terms.
Figure 15
Three-month interest rates
Source: Eurostat.
0
1
2
3
4
5
6
Jan
2007
Feb
2007
Mar
200
7
Apr
200
7
May
200
7
Jun
2007
Jul 2
007
Aug
200
7
Sep
200
7
Oct
200
7
Nov
200
7
Dec
200
7
Euro area Czech Republic Poland Slovakia Japan

BIS Papers No 44 201
Since 2006, many market participants have started to talk about the growing use of the koruna as a financing currency in carry trades. There was rather weak evidence of this from statistics, which were not showing any large swings in the position of the domestic banks with non-residents, or from the forex market, where the currency kept its trend and maintained a positive correlation with the regional currencies.
Figure 16
Exchange rates of selected currencies in 2007
Source: Eurostat.
As seen in Figure 16, since March 2007 there has been a significant change in trends, and the koruna has started to depreciate slowly but continuously. Instead of being positively correlated with currencies from the region, the koruna has begun to follow other “nominally cheap” currencies like the yen or the Swiss franc. The abrupt end of this trend was clearly related to the closing of carry trade positions in the summer of 2007, when overall risk aversion and risk assessment changed. Over a very short period, the Czech currency offset all its losses and got back to its “usual” appreciation path.
Backward checking of the data does not reveal the whole story or the size of the carry trade market in koruna. The change of the net position of domestic banks vis-à-vis non-residents was not large enough to account for the move. It was partly due to the off-balance sheet nature of many carry trade deals. Indeed, the growth of derivatives, which could be used for carry trades, was much higher in the spring of 2007 (20% versus 6.5% a year earlier), but still it does not give a clear evidence of the size of the money flow (or rather exposure flow) that took place during this period.
90
92
94
96
98
100
102
104
106
108
2.1.
2007
15.1
.200
7
26.1
.200
7
8.2.
2007
21.2
.200
7
6.3.
2007
19.3
.200
7
30.3
.200
7
16.4
.200
7
27.4
.200
7
11.5
.200
7
24.5
.200
7
6.6.
2007
19.6
.200
7
2.7.
2007
13.7
.200
7
26.7
.200
7
8.8.
2007
21.8
.200
7
3.9.
2007
14.9
.200
7
27.9
.200
7
10.1
0.20
07
23.1
0.20
07
5.11
.200
7
16.1
1.20
07
29.1
1.20
07
12.1
2.20
07
Czech koruna Hungarian forintPolish zloty Slovak korunaJapanese yen

202 BIS Papers No 44
6. Challenges ahead – dealing with a floating currency in a liberalised market?
Over the last two years, the koruna enjoyed a period of a relatively low volatility and a continuation of the former appreciation trend. On average, the currency appreciated by almost 5% in 2006. In this environment, the CNB repeatedly undershot its inflation target, with interest rates well bellow those of the ECB. Understandably, this situation is challenging for monetary policy. Should there be reasonable certainty that the average yearly appreciation will be around 3–4%, it would be possible to incorporate this assumption into the inflation forecast.16 This would reduce the risk that the interest rates set by the CNB would be too high in the future. Surprises on the appreciation side and undershooting of the inflation target would be less likely.17
There are several ways to deal with this problem. First, the equation can be changed in such a way as to reflect future developments to a great extent. This places less weight on economic theory (UIP, etc) and more on past experience. Obviously, in the case of successful incorporation of the trend appreciation into the model, the problem is how to distinguish short-term deviations of the currency from the trend (like the episode mentioned in Section 5) from a possible “appreciation bubble”, which could lead to a large forecasting error and a possible surge in inflation. The second way is to focus more on the forecast of risks related to uncertainty concerning the future path of the exchange rate. This is easier, but depending on a variety of scenarios it could lead to very unclear signals being derived from the forecast.
At the end of the day, the likelihood of continued appreciation matters very much for monetary policy. And was shown above, in recent years this has been more a question of market expectations than of capital flows. The question therefore arises as to how robust those expectations are.
From the point of view of stability of expectations, the balance of payments is one of the key variables. Despite the recent improvement of the trade balance, there is an issue of consistency of appreciation expectations with the balance of payment forecast, especially from the point of view of the investment position of the Czech Republic.
Foreign assets account for around 25% of GDP, and liabilities are in the range of 50%. But while the assets are mainly in the form of foreign exchange reserves at the CNB (yielding a low rate of interest),18 FDI (which represents the majority of debit items) generates returns in multiples of yields on assets.19
16 Within the current forecasting framework, the main problem stems from the equation based on both UIP and
the equilibrium speed of appreciation, which systematically underestimate the pace of appreciation in recent years.
17 Estimates for FX pass-through are around ⅓, so the impact of the stronger currency on inflation can be substantial.
18 Reserves are invested mainly in high-grade government bonds and bank deposits. As a consequence, yields depend on market conditions in the range of 2–5%.
19 Return on equity often exceeds 20%.

BIS Papers No 44 203
Figure 17
Structure of the current account of the balance of payments
Source: Czech National Bank.
Figure 18
Investment position of the Czech Republic
Source: Czech National Bank.
EU
R b
illion
s
1993 1994 1995 1996 1997 1998 1999 2000 2001 2002 2003 2004 2005–60
–50
–40
–30
–20
–10
0
10
20
30
Other (net) Portfolio inv (net) FDI (net) CNB reserves
1999 2000 2001 2002 2003 2004 2005–6
–5
–4
–3
–2
–1
0
1
2
Trade balances ServicesIncome balances Transfers
EU
R b
illion
s

204 BIS Papers No 44
The data show that despite an impressive improvement in the trade balance and surpluses in other components, the growing negative balance of income (currently 5% of GDP) will be pushing the current account towards a deficit in the future.
It could be argued that the part of the income balance deficit is “going back” through reinvested earnings of the financial account (between ⅓ and ⅔ in recent years), but this simply means that the negative investment position will further deteriorate, and the problem in income balance will be shifted into the future.
7. Lessons
Since the beginning of its transformation, the Czech economy has accumulated a large body of experience with capital flows. During 1990–93, capital flows were still unsignificant due to relatively strict regulation of capital mobility and low overall credibility of the economy. However, step by step deregulation, accompanied by a spontaneous erosion of regulatory arrangement, enhanced capital flow volumes. The macroeconomic and monetary framework in the first half of the 1990s was highly conducive to large capital inflows. A fixed exchange rate combined with high interest rate differentials became irresistible for foreign investors, and in the middle of the 1990s the economy was trapped by the impossible trinity. Although the sizeable capital inflows were sterilised by the CNB, they contributed to the overheating of the economy and the emergence of large current account deficits. The maintenance of the fixed exchange rate thus translated the capital inflows into domestic demand and the expansion of the central bank’s foreign currency reserves.
The widening of the exchange rate band partially helped to solve the puzzle of the impossible trinity. Although the risks of investing in domestic assets increased, ongoing capital inflows translated into an appreciation of the koruna (rather than to an accumulation of reserves under the previous regime). This undermined the competitiveness of exporters and contributed to the slowdown of economic growth. A quite alarming worsening of economic fundamentals at the beginning of 1997 reversed market sentiment, and the assessment of the Czech economy by foreign investors. Earlier capital inflows turned to outflows partly as a consequence of the South Asian currency crises in 1997.
The currency attack of May 1997 terminated the fixed exchange rate period and initiated the period of managed float (and inflation targeting since 1998) characterised at first by increased exchange rate volatility (and inflation). During 1997–99, the koruna depreciated (1997), appreciated (1998) and depreciated (1999), by around 10% on a year-on-year basis in each case.
The overall assessment of the developments during the 1990s is that Czech policymakers underestimated the impact of capital flows in a gradually liberalised economy, the trends towards overheating and external imbalance, and the risks related to the impossible trinity. The fixed exchange rate regime in 1996 was not supported by other policies (when the economy was facing growing imbalances), and the very abolishment of the peg was the consequence of the currency crisis rather than of a wise policy decision.
The managed float regime has brought new challenges: while high exchange rate volatility20 makes inflation more volatile (than was the case under the fixed exchange rate), the trend appreciation of the koruna has tended to keep the level of inflation below the CNB inflation target over time.
20 By maintaining that low exchange rate volatility should be a focus of policymakers, we do not mean that
currency floating should be restricted, or even replaced, by any kind of fixed exchange rate regime.

BIS Papers No 44 205
Conducting monetary policy in such an environment is not an easy task. Based on standard know-how, the exchange rate forecast would often be too weak, the inflation forecast too high and interest rates thus higher than optimal. Undershooting the inflation target is the likely outcome. Incorporating more currency appreciation, empirically observed most of the time, into the forecast is not a trivial matter either, if transparency is required. Among other problems, this approach could be considered by market participants as a support for the central bank for the “hard currency policy”, and can thus bring even more currency appreciation and eventually more volatility of the economy.
References
Bárta, V (2006): “Interactions between monetary policy and financial stability: the Czech experience”, in Regional Financial Market and Financial Stability, Sixth annual conference of the Bank of Albania, Central Bank of Albania.
Bárta, V and M Singer (2006):. “The banking sector after 15 years of restructuring: Czech experience and lessons”, BIS Papers, no 28.
Czech National Bank (2000): Transformation costs of the recovery and consolidation of the banking sector, www.cnb.cz.
——— (2003): Report on Balance of Payments in 2002, www.cnb.cz.
——— (2004): Financial Stability Report.
Dědek, O (2000): “Měnový otřes 97”, Výzkumná publikace č. 15., CNB.


BIS Papers No 44 207
Capital flows into and out of Hong Kong SAR: implications for monetary and financial stability
Hong Kong Monetary Authority
I. Introduction
This paper describes how the Hong Kong Monetary Authority (HKMA) monitors capital flows in Hong Kong SAR, and analyses the implications of such flows for monetary and financial stability. It makes the following two main arguments: first, while capital inflows and outflows have been large and volatile in recent years, Hong Kong has not been subject to an inundation of heavy net inflows. In fact, there have been large net outflows, which offset much of the inflows associated with the recent current account surpluses, and as a result, the overall balance of payments positions have been small and the scale of reserve accumulation modest. This reflects portfolio choices of the private sector, and the robustness of the Linked Exchange Rate System (LERS) linking the Hong Kong dollar to the US dollar.
Second, increasing financial integration between Hong Kong and mainland China has become an important determinant of capital flows into and out of Hong Kong. While such flows increase the demand for financial sector services in Hong Kong and help strengthen its status as an international financial centre, they may also introduce volatilities in the local monetary conditions. Nevertheless, our rule-based monetary policy framework in the form of the LERS has proved its resilience in dealing with volatile capital flows and has enjoyed market credibility in recent years. Efforts are also under way to strengthen the efficiency and effectiveness of our payment system in handling very large and volatile payment flows, and to improve banks’ risk management systems to guard against credit risks that may be associated with volatile asset prices driven by capital flows.
II. Capital flow patterns in the balance of payments
According to balance of payments (BOP) statistics, changes in liabilities of Hong Kong residents to non-residents (capital inflows), and changes in claims of Hong Kong residents against non-residents (capital outflows), have been both large and volatile in recent years.1 In the past decade, inflows have ranged from a net reduction of close to 90% of GDP in 1998 to a net increase of more than 70% of GDP in the first three quarters of 2007; outflows have ranged from a net reduction of more than 80% of GDP in 1998 to a net increase of more than 90% of GDP in the first three quarters of 2007.2 However, the overall BOP positions have been small, with small net increases in official foreign reserves, averaging less than 3% of GDP. Given Hong Kong’s relatively large current account balances, averaging 8.5% of GDP in the past decade, non-reserve financial account balances have been negative, averaging
1 In Hong Kong the first set of BOP statistics, for the year 1997, was published in 1999. Statistics with more
detailed breakdowns of capital flows start from 1998 and the first set of quarterly data starts from the first quarter of 1999.
2 In the BOP statistics, capital inflows measure net purchases (+) or sales (–) by non-residents of domestic assets while capital outflows measure net purchases (–) or sales (+) of foreign assets by residents. From this definition, it should be clear that capital inflows and outflows can take both positive and negative values. For example, in 1998, when non-residents were net sellers of domestic shares, capital inflows were negative.

208 BIS Papers No 44
7.5% of GDP over this period. In other words, net capital outflows have been significantly larger than net capital inflows.
The patterns of direct investment, portfolio investment and other investments are examined in more detail below.3 We also take a closer look at the fund flows between Hong Kong and mainland China by making use of statistics for external banking transactions.
Direct investment Direct investment flows in both directions have been important and sizeable in recent years, underpinned by favourable economic growth and a stable macroeconomic environment across the globe (Graph 1). Direct investment flows occur when an investor acquires a long-lasting interest in an enterprise operated in another economy. According to surveys, a favourable and simple tax system, political stability and security, free flow of information, corruption-free government, and rule of law and independent judiciary are the five most important factors in making direct investment in Hong Kong attractive.
Graph 1
Direct investment flows
Source: Census and Statistics Department.
Direct investment flows associated with mainland China have been generally growing, reflecting increasing economic and financial integration between the two economies (Graph 2). In fact, mainland China has been the most important recipient of Hong Kong’s outward direct investment (HKD 167 billion in 2006) and the largest source of inward direct investment in Hong Kong (HKD 109 billion in 2006) in recent years. Among all the economic
3 This paper does not discuss financial derivatives as these represent only a small portion of total private capital
flows in Hong Kong.
2001 2002 2003 2004 2005 Q1 2006 Q2 2006 Q3 2006 Q4 2006 Q1 2007 Q2 2007 Q3 2007
14.3 5.9 8.6
20.5 18.9
32.0
13.2
19.8
29.332.2
24.0 24.6
–6.8 –10.7
–3.5
–27.6
–15.3
–24.7 –25.0 –24.8–20.6
–31.9
–17.7 –19.2
–40
–30
–20
–10
0
10
20
30
40
50 % of GDP
Direct investment in Hong Kong SARDirect investment abroadNet direct investmentInflows
Outflows

BIS Papers No 44 209
sectors, investment holdings, real estate and various business services are the most important direct investment activities in both directions.
Graph 2
China-related direct investment flows
Source: Census and Statistics Department.
Portfolio investment In recent years, outward portfolio investments have become more important, recording occasionally large outflows (Graph 3). Recent net total capital outflows (total capital inflows minus total capital outflows) have been primarily driven by net portfolio investment outflows (Graph 4). Both equity and debt portfolio investment outflows (eg bonds, notes, negotiable certificates of deposit) have been sizeable.
The large portfolio outflows in recent years in part reflect Hong Kong’s growing role as a fund-raising centre for mainland Chinese firms.4 According to the IMF’s Coordinated Portfolio Investment Surveys, Hong Kong’s equity portfolio investment in mainland China was around HKD 271 billion (or USD 34.8 billion) in 2005, more than six times that in 2001 (Table 1).5 Equity initial public offerings (IPOs) of mainland companies, accompanied by strong local demand for these investments, have supported this rapid rate of increase, with the amount of equity funds raised by the H-share companies increasing sharply from HKD 6 billion in 2001 to HKD 290 billion in 2006 (Graph 5).
4 When an H-share company is listed on the Hong Kong Stock Exchange, it is classified as a non-resident
company because its business activities are not based in Hong Kong. Transactions in which Hong Kong residents buy H-shares are recorded as capital outflows because Hong Kong residents have purchased foreign assets.
5 Apart from offshore financial centres (OFCs), the United Kingdom is the largest recipient of Hong Kong residents’ equity portfolio investments because some major stocks in Hong Kong are domiciled in the United Kingdom.
2001 2002 2003 2004 2005 2006 0
20
40
60
80
100
120
140
160
180
HKD billion Direct investment from mainland China to Hong Kong SAR
Direct investment from Hong Kong SAR to mainland China
Inflows
Outflows

210 BIS Papers No 44
Graph 3
Portfolio investment flows
Source: Census and Statistics Department.
Graph 4
Contributions to net capital outflows
Source: Census and Statistics Department.
0.9 2.3 5.2 13.2 15.1
2.6 2.0
31.123.0
6.6
–22.3 –26.1 –22.9
4.3
–27.1
–10.2
–51.5
–28.3
–3.7
–29.5
–80
–60
–40
–20
0
20
40
2003 2004 2005 Q1 2006 Q2 2006 Q3 2006 Q4 2006 Q1 2007 Q2 2007 Q3 2007
% of GDP
Portfolio investment inflows
Portfolio investment outflows
Net portfolio investment
Inflows
Outflows
1998 1999 2000 2001 2002 2003 2004 2005 2006 200–40
–30
–20
–10
0
10
20
30
40 % of GDP Direct investment Portfolio investment
Financial derivatives Other investment
Net capital flowsNet
inflows
Net outflows
1.4 1.8 0.0
–14.1

BIS Papers No 44 211
Table 1
Equity portfolio investment from Hong Kong SAR to other economies
In billions of US dollars
2001 2002 2003 2004 2005
Offshore financial centres 37.6 47.4 73.5 90.2 94.2
United Kingdom 22.7 21.8 30.7 43.7 48.1
United States 11.5 5 8 12.7 11.9
Australia 0.6 0.6 1.1 1.4 1.4
China 5.4 5.4 15.7 22.7 34.8
Japan 2.1 2 3.3 4.4 9.1
Total (rest of world) 94.6 95.7 152.8 199.7 227.8
Source: IMF, Coordinated Portfolio Investment Survey.
Graph 5
Equity funds raised by China-related companies (main board)
Source: Hong Kong Exchanges and Clearing Limited website.
Other investment “Other investment” mainly consists of banking sector capital flows in the form of currency and deposits. These flows have been large and volatile in recent years, reflecting Hong Kong’s
0
50
100
150
200
250
300
1993 1994 1995 1996 1997 1998 1999 2000 2001 2002 2003 2004 2005 2006
HKD billion
H-share IPO
Red chip IPO

212 BIS Papers No 44
role as an international banking and financial centre (Graph 6). Vibrant H-share IPO activity may have also strengthened these flows of currency and deposits, as well as loans, between mainland China and Hong Kong recently. Subscription money for H-shares is usually placed in interest bearing fixed deposits in the week before the refund day and may be temporarily parked in the Hong Kong banking system afterwards.6 This can lead to substantial capital inflows until they are later offset by a repatriation of funds out of the domestic banking system.
Graph 6
Other investment flows
The negative figures for “other investment inflows” in Q1 2006 and Q1 2007 indicate that non-residents were net sellers of domestic other investment assets in these periods.
Source: Census and Statistics Department.
Cross-border fund flows between Hong Kong and mainland China Anecdotal evidence suggests that cross-border fund flows between Hong Kong and mainland China have been increasing rapidly in view of financial integration between the two economies, but bilateral BOP statistics are not available for analysing this issue. To understand how capital flows between Hong Kong and mainland China have evolved, statistics on external banking transactions may be useful. If it is assumed that all cross-border transactions between Hong Kong and the mainland are effected via the banking system, then changes in external claims and liabilities between Hong Kong banks and mainland China can be used to gauge the cross-border fund flows relating to goods and services trades, investment incomes, direct investments and portfolio investments.7 Specifically, Hong Kong’s imports from the mainland and its direct and portfolio investment
6 The IPO money involved can be substantial due to large amounts of funds being raised and/or high
oversubscription ratios, which can reach as large as several hundred times. 7 Since formal fund flows in most cases are reflected in banks’ external liabilities and claims positions, it is
justified to assume all cross-border transactions are effected via the banking system.
14.8 34.8
10.3
–27.3
46.0 51.7
–16.7
64.975.4
–18.0 –19.6 –10.5
–1.8
–32.6 –27.1
–3.2
–79.1
–104.4
53.9
–60.0
–120
–100
–80
–60
–40
–20
0
20
40
60
80
100
2003 2004 2005 Q1 2006 Q2 2006 Q3 2006 Q4 2006 Q1 2007 Q2 2007 Q3 2007
% of GDP Other investment inflowsOther investment outflowsNet other investmentInflows
Outflows

BIS Papers No 44 213
outflows to the mainland will result in a rise in the gross liabilities (or a decrease in claims) of Hong Kong banks vis-à-vis the mainland. Conversely, mainland China’s imports from Hong Kong and its direct investment and portfolio investment outflows to Hong Kong will lead to a rise in claims of Hong Kong banks vis-à-vis the mainland (or a decline in Hong Kong banks’ liabilities).
Table 2 provides a summary of the stocks as well as the changes in external claims and liabilities of Hong Kong banks vis-à-vis mainland China, compared with the data on bilateral trade and financial activities between Hong Kong and mainland China during the past few years. The first panel of Table 2 shows the stock of net liabilities and the year-on-year change in this stock, with the latter taken as an indicator of net flows of funds between Hong Kong and the mainland. The second panel shows the estimated bilateral BOP components.8
Table 2
Possible factors explaining changes in net external transactions of Hong Kong SAR banks vis-à-vis mainland China
In billions of Hong Kong dollars
1998 1999 2000 2001 2002 2003 2004 2005 2006
Net liabilities (+)/net claims (–)
Level –34 17 172 136 162 147 140 151 130
Change 68 51 155 –36 26 –15 –7 11 –21
Possible factors explaining changes in net external transactions of Hong Kong SAR banks vs mainland China
Due to goods accounts1, 2 –139 –94 –113 –137 –147 –196 –245 –267 –323
Due to services accounts1, 3 –3 –4 –9 –17 –34 –44 –51 –57 –69
Due to investment income4 –3 –1 –4 –8 –14 –26 –27 –21 –39
Due to direct investment5 123 88 10 92 108 100 86 67 64
Due to portfolio investment6 4 4 52 7 18 48 60 159 289
Residuals 87 57 219 27 95 103 170 130 581 Some data on goods and services accounts for 2004 and 2005 are estimates based on available information. 2 Exports and imports were adjusted to exclude outward processing trade. 3 Data on trade in services between Hong Kong SAR and mainland China are from the Report on Hong Kong Trade in Services Statistics. 4 From survey data. 5 Data for Hong Kong SAR’s foreign direct investment (FDI) flows to mainland China are based on data from the mainland, while data for mainland FDI in Hong Kong SAR are from the balance of payments statistics. 6 Data refer to funds raised by mainland companies on the Hong Kong Stock Exchange, while data on mainland portfolio investment in Hong Kong SAR are not available.
Sources: HKMA; Census and Statistics Department.
8 Shi and Tsang (2005) provide more details on the methodology for estimating the bilateral BOP components.

214 BIS Papers No 44
Analysis based on Table 2 shows that Hong Kong has run a widening current account surplus with mainland China in the past few years, thereby contributing to a rise in claims by Hong Kong banks on the mainland (or a decline in liabilities). On the other hand, Hong Kong has had a net capital outflow to mainland China in terms of direct and portfolio investment, implying an increase in the liability of Hong Kong banks vis-à-vis mainland China. In particular, liabilities relating to portfolio investment increased substantially in 2005 and 2006, in line with vibrant activity in H-share trading and IPOs. In terms of size, these flows vis-à-vis the mainland appear to have dominated the overall movements of the financial accounts of Hong Kong’s balance of payments in recent years.
Some commentators have raised the concern that further capital account liberalisation by mainland China, for example in the forms of a significant expansion of the Qualified Domestic Institutional Investor (QDII) scheme and the launch of the plan to allow individuals to invest directly in Hong Kong’s stock market, would subject Hong Kong to an inundation of capital inflows that would overwhelm its financial system, create asset price bubbles, and pose material risks to its monetary and financial stability. Such concerns are, however, overblown, for several reasons. First, while mainland investors may be enthusiastic towards investing in the Hong Kong stock market, it is unlikely that their portfolio choice will be irrational. Research conducted at the HKMA shows that, based on characteristics such as the size of financial markets, and investors’ understanding of and familiarity with host markets, Hong Kong would be able to attract 10% of capital outflows from mainland China, while close to 50% of such outflows would be invested in the United States, Japan and the United Kingdom (Cheung et al (2006)). Second, the track record in the past several years has showed that Hong Kong’s monetary and financial system has been capable of dealing with temporary volatilities of capital flows, and this capacity is also being further strengthened, as discussed below.
III. Capital flows and foreign exchange market developments
Although BOP statistics are useful for monitoring the broad patterns of capital flows, they may not fully capture changes in Hong Kong’s foreign exchange flows for two reasons. First, BOP data do not provide a complete picture on the total amount of two-way capital flows. For example, when non-residents buy H-shares from Hong Kong residents in the secondary market, the transactions are recorded as decreases in portfolio investment assets in BOP statistics, representing lower capital outflows from Hong Kong residents instead of more capital inflows from the rest of the world. Second, BOP data are ex post records of accounting relationships, and they are typically released with a time lag. This implies that relying on BOP data may not be appropriate for a proper analysis of the impact of capital flows on domestic monetary and financial conditions.
In order to understand the implications of capital flows for domestic monetary and financial stability in Hong Kong, it is necessary to analyse timely information on fund flows between the Hong Kong dollar and foreign currencies, using financial market price data such as exchange rates, interest rates and asset prices. An outflow of funds from the Hong Kong dollar into foreign currencies may arise from a foreign investor exiting the Hong Kong stock market; a speculator squaring a long position in Hong Kong dollars; a foreign issuer switching IPO proceeds into foreign currencies; or an exporter repatriating its export earnings. If there is greater pressure on the selling side than on the buying side of Hong Kong dollars, then the exchange rate will weaken. Conversely, if there is greater pressure on the buying side than on the selling side, the exchange rate will strengthen.
Under the LERS, which encompasses a target zone regime after the “three refinements” introduced in May 2005, fund flows between the Hong Kong dollar and other currencies will most often be reflected in changes in the exchange rate, and occasional foreign exchange

BIS Papers No 44 215
operations by the HKMA. When the pressure on the selling side is so much greater than on the buying side that the market exchange rate is pushed to a level that triggers the weak-side Convertibility Undertaking (CU), then the HKMA will buy Hong Kong dollars and sell US dollars without any limit at the rate of 7.85 Hong Kong dollars per US dollar. Conversely, when the pressure on the buying side is so much greater than on the selling side that the strong-side CU is triggered, the HKMA will buy US dollars and sell Hong Kong dollars without any limit at the rate of 7.75 Hong Kong dollars per US dollar.
Financial market data indicate that two-way flows between the Hong Kong dollar and foreign currencies have been roughly balanced in the past five years, although there were episodes of strong inflow pressures. For example, while BOP data showed net private capital outflows during heavy IPO activity in the second and third quarters of 2006, price data point to consistent appreciation pressures on the Hong Kong dollar exchange rate, which stayed around the strong side of the Convertibility Zone (Graph 7). Meanwhile short-term interest rates were also depressed as the IPO proceeds stayed in the banking system, increasing the supply of interbank liquidity (Graph 8). Despite sizeable capital flows associated with fund-raising activities by mainland firms in Hong Kong during June 2005 to September 2007, there were no foreign exchange interventions by the HKMA. A confluence of factors, including in particular bunching of IPOs over an extended period, resulted in stronger inflow pressures in late October 2007 and prompted the HKMA to sell Hong Kong dollars against US dollars. Overall, there have been no persistent one-way flows in the past several years.
Graph 7
Hong Kong dollar exchange rate
Source: HKMA.
7.60
7.65
7.70
7.75
7.80
7.85
7.90
HKD/USD
Hong Kong dollar spot exchange rate
Weak-side Convertibility Undertaking
Strong-side Convertibility Undertaking
Q1 Q2 Q3 Q4 Q1 Q2 Q3 Q4 Q1 Q2 Q3 Q4 Q1 Q2 Q3 Q4 Q1 Q2 Q3 Q4 2003 2004 2005 2006 2007

216 BIS Papers No 44
Graph 8
Hong Kong dollar and US dollar interest rates
Libor = London interbank offered rate; Hibor = Hong Kong interbank offered rate.
Source: HKMA.
IV. Implications of capital flows for monetary and financial stability
Under the LERS, Hong Kong dollar interbank interest rates should track the corresponding US interest rates closely, but capital flows into and out of Hong Kong may cause deviation from time to time, creating room for potentially sharp adjustments of interest rates. There have been a number of occasions in the past several years when deviations of Hibor rates from Libor rates became sizeable (Graph 9). However, with the introduction of the three refinements to the LERS in May 2005, the Hibor-Libor spread should now be bounded inside a band that reflects the width of the Convertibility Zone of the LERS.9 Empirical evidence shows that this has largely been the case and the LERS has enjoyed a high degree of market credibility (Genberg et al (2007); Fung and Yu (2007)).
As capital flows relating to mainland China have become more important in recent years, it follows that macroeconomic developments on the mainland might also exert greater influence on monetary conditions in Hong Kong. The response of Hibor to a particular shock relating to the mainland is theoretically ambiguous, depending on the relative impact on the demand for and supply of Hong Kong dollars that reflect the prevailing macroeconomic and market conditions, as well as investor sentiment. For example, a positive output shock could
9 Genberg et al (2007) argue that the spread should be no larger than 127 basis points, if the transaction cost is
assumed to be zero, given the 1,000 pip width of the Convertibility Zone.
0
1
2
3
4
5
6
% pa
Q1 Q2 Q3 Q4 Q1 Q2 Q3 Q4 Q1 Q2 Q3 Q4 Q1 Q2 Q3 Q4 Q1 Q2 Q3 Q4
2003 2004 2005 2006 2007
Three-month LIBOR
Three-month HIBOR

BIS Papers No 44 217
be indicative of improved earnings of mainland companies. This may induce increased investments in their stocks on the Hong Kong market and the resultant higher demand for Hong Kong dollars relative to supply could raise the short-term Hibor. On the other hand, a positive output shock on the mainland could signal a build-up of overheating pressure and affect market sentiment negatively. This could lead to reduced investments in mainland-related stocks on the Hong Kong market and a lower demand for Hong Kong dollars relative to supply, prompting a decrease in the short-term Hibor.
Graph 9
Movements of three-month Hibor and Libor
Month-end data.
Source: HKMA.
Empirical analysis using a vector auto-regression (VAR) model suggests that, after controlling for the influences of US variables, an unexpected rise in the mainland policy interest rate or higher than expected growth in mainland output or money supply in general produces a positive and hump-shaped effect on the three-month Hibor (He et al (2007)). This analysis also shows that US shocks still dominate, but mainland shocks have become more important in accounting for the unexpected fluctuations in Hibor in recent years. Thus, while the Hibor-Libor spread is expected to be bounded inside a band that reflects the width of the Convertibility Zone of the LERS, mainland-related shocks could exert a significant influence on the actual size of the spread.
When there is a sizeable negative interest rate spread between Hibor and Libor rates, the lower Hong Kong dollar interest rates should in theory bring arbitrage activities and hence lead to outflows of funds, pushing the spot exchange rate towards the weaker side of the Convertibility Zone. Should the weak-side CU be triggered, the clearing balance of the banking system held with the HKMA would shrink, leading to higher interest rates. However, it is also possible that the arbitrage activities might not be sufficiently strong to counteract the strong demand for Hong Kong dollars because of equity-related inflows. As a result, the weak-side CU would not be triggered and the low short-term interest rates could persist. On the other hand, if there are drastic changes in market sentiment, due for example to a sharp
–2
0
2
4
6
8
10
12
14
16
18 % pa
1990 1991 1992 1993 1994 1995 1996 1997 1998 1999 2000 2001 2002 2003 2004 2005 2006 2007
Three-month HIBOR
Three-month LIBOR

218 BIS Papers No 44
deterioration of the global economic environment, then the spot exchange rate could move rather quickly towards the weaker side, triggering the weak-side CU in an abrupt manner and leading to an overshooting of interest rates.
The HKMA is, however, well equipped to deal with such a potential disruptive scenario. The three refinements of the LERS introduced in May 2005 allow the HKMA to conduct discretionary monetary operations within the Convertibility Zone should it consider such action appropriate. The HKMA can either conduct foreign exchange operations (ie sell/buy Hong Kong dollars against US dollars) or issue/redeem Exchange Fund bills and notes.10 While intra-zone operations have not been necessary to deal with scenarios of disruptive capital flows, there have been two discretionary intra-zone foreign exchange operations by the HKMA since the introduction of the three refinements, which were conducted to alleviate liquidity pressure associated with IPO activities of mainland firms in Hong Kong.
Equity market activities could affect Hong Kong dollar interest rates in two major ways. First, concentration of IPO subscription money in the receiving banks may reduce the supply of interbank liquidity in the banking system and cause abrupt fluctuations in overnight Hibor. Second, funding requirements for the settlement of equity trades by mainland-related companies may fluctuate sharply given the volatile nature of equity transactions, posing challenges for banks to manage their liquidity position. The settlement of share trades usually takes place in the morning, but reversal of overnight interbank lending can take place at any time during the day, causing a mismatch in the timing of intraday cash outlay and inflow. In response to the uncertainties, banks purchase Exchange Fund papers to obtain temporary liquidity through intraday repos. The liquidity pressure on banks to settle share trades has been so great that Exchange Fund papers have been in keen demand lately, driving down yields of short-term Exchange Fund papers into negative territory in recent months. As a result, the HKMA conducted a tap issue of Exchange Fund paper in January 2008 to satisfy the increasing demand for such paper in the banking system. In addition, the HKMA is introducing infrastructural enhancements in early 2008, by adopting a new payment code in the real-time gross settlement (RTGS) system and the central clearing and settlement system (CCASS) to allow reversal of overnight lending operations at the time of settlement of share trades, reducing the mismatch in the timing of cash flows.
Stock market activities relating to mainland-related companies also affect deposits and loans in the banking system in Hong Kong. The growth paths of Hong Kong dollar M3 and domestic credit have exhibited occasional sharp spikes attributable to such activities (Graph 10). Sharp spikes in M3 growth occur when heavily subscribed IPOs are present around the end of a calendar month. Demand deposits increase notably as investors use cheques for IPO subscription, while time deposits also rise markedly in the week to the refund day because the subscription money is temporarily placed in interest bearing time deposits in local banks. Such sharp movements in deposits pose challenges for banks to manage their liquidity positions.
In respect of credit growth, sharp rises usually occur because of a significant increase in margin lending for IPO subscriptions. Reflecting buoyant stock market activity, lending to stockbrokers rose by 35.6% and 11.9% respectively in the second and third quarters of 2007. While the strong growth in such lending benefits bank earnings, the asset quality of these loans is highly associated with stock market movements. Banks may suffer in the event of a significant market correction, as the value of the collateral for these loans, which comprises mainly stocks, would decrease significantly. Given the increasing contribution of share-
10 Exchange Fund papers are essentially liabilities of the HKMA and are defined as part of the Hong Kong dollar
monetary base. This type of operation would be consistent with the currency board principle as it represents only a shift of one component of the monetary base (the aggregate balance) to another (the Exchange Fund paper).

BIS Papers No 44 219
related lending and income to banks’ loan portfolios and earnings, the HKMA has reminded banks that they should be vigilant with regard to the possible risk of a sharp correction in the stock market. The HKMA has also recently launched a major review by an external consultant of its work in the area of banking stability. The aim of the review is to make recommendations on how the HKMA can best discharge its functions in promoting the general stability and effective working of the banking system, taking into account recent and likely future developments and the changing nature of the risks facing the system, including those associated with large and volatile capital flows.
Graph 10
Money and credit growth
Month-end data.
Source: HKMA.
References
Cheung, L, K Chow, J Chang and U Li (2006): “Outward portfolio investment from mainland China: how much do we expect and how large a share can Hong Kong expect to capture?”, HKMA Research Memorandum 13/2006, Hong Kong Monetary Authority.
Fung, L and I Yu (2007): “Assessing the credibility of the Convertibility Zone of the Hong Kong dollar”, HKMA Working Paper 19/2007, Hong Kong Monetary Authority.
Genberg, H, D He and F Leung (2007): “The ‘Three Refinements’ of the Hong Kong dollar Linked Exchange Rate System two years on”, Hong Kong Monetary Authority Quarterly Bulletin, no 51, June.
He, D, F Leung and P Ng (2007): “How do macroeconomic developments in mainland China affect Hong Kong’s short-term interest rates?”, HKMA Working Paper 17/2007, Hong Kong Monetary Authority.
Shi, J and A Tsang (2005): “Cross-border fund flows and Hong Kong banks’ external transactions vis-à-vis mainland China”, HKMA Research Memorandum 07/2006, Hong Kong Monetary Authority.
–30
–20
–10
0
10
20
30
40
50
60
–15
–10
–5
0
5
10
15
20
25
30
2002 2003 2004 2005 2006 2007
M3
% yoy
Loans for use in Hong Kong SAR
% yoy


BIS Papers No 44 221
Retail credit expansion and external finance in Hungary: lessons from the recent past (1998–2007)
Júlia Király, Judit Antal, Márton Nagy and Viktor Szabó
Introduction
Rapid credit growth is a concern in many European countries. In recent years, credit to the private sector has been growing very rapidly from a very low initial level in a number of central, eastern and southeastern European countries. This credit expansion has been largely a result of increased mortgage loans to households, denominated in foreign currency in some countries. On the one hand, rapid credit growth can be justified by the very low initial level of intermediation and the convergence towards levels observed in developed EU countries. On the other, both empirical and theoretical arguments imply that too rapid credit growth, or a credit boom, can have serious macroeconomic consequences, especially if accompanied by sizeable external imbalances, which can also be observed in the region. Undoubtedly, the risk of having excess credit expansion mainly denominated in foreign currency has become a key issue for policy discussion.
A credit boom can be identified in several countries. Using econometric techniques, a number of papers have found that current credit growth in the region cannot be fully justified by rapid economic growth, declining real interest rates, inflation or other fundamentals. According to a World Bank survey (2007), a credit boom was identified by Backé et al (2005) in Estonia, Latvia, Croatia and Bulgaria; by Boissay et al (2006) in Bulgaria, Latvia and to a lesser extent Lithuania, Estonia, Hungary and Croatia; by Kiss et al (2006) in Estonia and Latvia; and by Duenwald et al (2005) in Bulgaria and Romania.
Credit booms can lead to asset price bubbles and growing external debt. Regarding the possible consequences, the IMF (2004), Schellekens et al (2007) and the World Bank (2007) found that credit booms often lead to large current account deficits and external debt. Investment and consumption booms led by a credit boom can boost imports, resulting in large current account deficits. At the same time, strong foreign capital inflows constitute an important source of domestic credit growth, which can, in turn, finance increasing current account deficits. Thus, credit booms and high external debt may reinforce each other’s adverse effects. The consequences of a credit boom are clearly visible in Bulgaria, Romania, Croatia and the Baltic countries. Spectacular economic expansion in southeastern Europe and the Baltic states has come at the cost of asset price inflation1 and a current account deficit of more than 10% of GDP.
Credit growth in Hungary has had unique features. Hungary has shown dynamics similar to those of other countries in the region, as rapid credit growth has contributed to the development of a large current account deficit. However, there has been a major difference between Hungary and its neighbours: in Hungary, strong household investment and consumption alone have boosted the private sector’s external financing needs, while the corporate sector has shown low investment activity. Another difference is that weak fiscal discipline has created large fiscal and current account deficits, as well as alarming debt dynamics in recent years. Finally, credit expansion has been mainly denominated in foreign
1 Égert and Mihaljek (2007) suggested that Bulgaria, Estonia and Lithuania might experience potential
overshooting in house prices.

222 BIS Papers No 44
currency in Hungary, which has caused serious mismatches in the economy. The main causes of foreign currency lending have been carry trades and intense competition in the credit market, as well as the high foreign ownership in the banking system. Rapid credit growth, coupled with the twin deficit problem, declining competitiveness and the mismatches in the economy, has posed risk ultimately for Hungary’s endeavours to keep its economy on a fast “catch-up” growth path vis-à-vis the European Union.
This paper aims to describe the causes and consequences of retail credit expansion. Accordingly, the structure of the study is as follows: Section 1 presents major trends in external financing needs and financing structure; Section 2 briefly summarises the main tendencies of credit expansion in Hungary; Section 3 investigates the issue of who bears the exchange rate risk; and Section 4 concludes.
1. External financing: needs and structure
Loose fiscal policy significantly increased the external financing needs of the government. Whereas the 1995 consolidation gradually improved the government’s financial position, the cyclical loosening starting from 2001 significantly worsened it, and by 2006 the public sector’s financing needs were approaching 10% of GDP (Chart 1). Meanwhile, the corporate and household sectors were following quite different financing paths, due to a consumption/investment shift.
Chart 1
Net financing capacity by sector (as a percentage of GDP)
Source: Magyar Nemzeti Bank (the central bank of Hungary).
Household saving dropped while liquidity constraints eased. The strong decrease in the corporate sector’s borrowing requirement was not reflected in any improvement in the external balance, as at the same time household saving fell dramatically (Chart 2). As a result of a structural change in the consumption/saving behaviour of households, that sector’s net saving declined from 10% to around 3% of GDP over the past 10 years. This change was due to several factors. First, with the nominal and real convergence of wealth and wages, households were eager to increase their consumption (the “catch-up effect”). Second, borrowing conditions eased and credit supply rose. In 2001, the government introduced a subsidised housing loan scheme (widely available, domestic currency denominated mortgage loans at below market interest rates and with caps), paving the way
–14–12–10–8 –6 –4 –2 02468
10
1998
1999
2000
2001
2002
2003
2004
2005
2006
–14–12–10–8–6–4–20246810
Corporate sector Households Government Net external financing requirement

BIS Papers No 44 223
for fast credit growth. Despite the tightening of the subsidised loan scheme, household demand for cheap credit remained high, and demand shifted towards foreign currency denominated housing and consumer loans, with general purpose mortgage loans gaining ground from 2004.
Chart 2
Household consumption, investment and net saving as a ratio of disposable income
Source: Magyar Nemzeti Bank.
A slowdown in investment reduced the financing needs of the corporate sector. While the borrowing needs of the public sector showed a rather stable, cyclical pattern over the past decade, the saving behaviour of the private sector changed significantly. Following the corporate sector’s dynamic fixed asset accumulation in the second half of the 1990s, the sector’s net borrowing requirement increased to 10% of GDP by the end of the century. Weakening external demand in 2000–01 put a brake on investment activity. Despite the recovery in foreign demand and export performance in 2002–03, corporate sector investment remained sluggish, with firms’ financing needs stabilising at a relatively low level of around 3% of GDP (Chart 1).
Strong FDI inflows financed corporate investment. In the second half of the 1990s, privatisation, the reassuring growth outlook and anticipated EU accession attracted a large amount of foreign direct investment (FDI). Apart from privatisation proceeds, there was a strong correlation between net FDI inflows and the financial position of the corporate sector. High fixed asset accumulation, which entailed an increase in firms’ financing requirement, was mirrored by a rise in FDI inflows of similar magnitude.
Financing structures moved towards debt-type instruments. At the end of the 1990s, the intensive privatisation period came to an end, and in subsequent years corporate investment activity slowed, leading to a substantial decrease in FDI inflows. In the last three to four years, the declining role of non-debt generating financing (ie net FDI and portfolio equity inflows) has also been amplified by an increase in the foreign direct investment and foreign portfolio equity holdings of Hungarian financial and non-financial companies. As a result, since 2003, debt generating inflows have covered the greater part of the external financing requirement (Chart 3).
74
76
78
80
82
84
86
88
90
92
1998 1999 2000 2001 2002 2003 2004 2005 2006
%
0
2
4
6
8
10
12
14
16
18 %
Consumption expenditure Net saving (right-hand scale)Investment (right-hand scale)

224 BIS Papers No 44
Chart 3
The financing structure of external borrowing requirements
The substantial difference between net external financing requirements and the sum of net financing stems from the fact that, from 2004, the item “Net errors and omissions” in the balance of payments statistics has increased considerably, reaching 3.3% of GDP in 2006.
Source: Magyar Nemzeti Bank.
A high current account deficit and a slowdown in FDI accelerated debt growth. While net non-debt generating inflows have decreased almost continuously over the past three years, external equilibrium has shown only a minor improvement. The high public deficit and the growing indebtedness of the household sector have been accompanied by an increase in debt financing. As the private sector borrows primarily from the domestic banking sector, banks’ external debt has increased. At the same time, the general government external debt position has also deteriorated, contributing to a sharp rise in total external debt (Chart 4).
Chart 4
External debt dynamics and sectoral breakdown (as a percentage of GDP)
Source: Magyar Nemzeti Bank.
–4
–2
0
2
4
6
8
10
12
1998
1999
2000
2001
2002
2003
2004
2005
2006
%
–4
–2
0
2
4
6
8
10
12%
Reinvested earnings Other non-debt generating financing Privatisation revenue Debt generating financing
0
5
10
15
20
25
30
35
1998
1999
2000
2001
2002
2003
2004
2005
2006
0
5
10
15
20
25
30
35
General government Corporate sector Banks Net external debt
Net external financing requirement

BIS Papers No 44 225
Weak fundamentals led to a high risk premium. The combination of loose fiscal policy, high and repeatedly overshot budget deficit targets, a high current account deficit and its unfavourable financing structure, and growing external debt contributed to a rise in the required risk premium. Since 2000, Hungarian short-term (three-month interbank) interest rates have surpassed euro rates by 600 and Swiss franc rates by 760 basis points on average. The interest rate differential was even higher in 2003–04, the period when household foreign currency borrowing picked up strongly.
Summarising the macro trends, we can say that external financing needs were mainly generated by an expansionary fiscal policy, while the slowdown in corporate investment mitigated this effect and the rapid increase in consumption fostered it. As a consequence, the structure of external finance shifted from FDI towards external debt.
2. Retail credit expansion in Hungary
Hungary experienced a rapid increase in private sector indebtedness, which was typical in central and eastern Europe. Within the private sector, and in the household sector in particular, borrowing has been rising continuously over the last decade.
Households faced liquidity constraints and postponed spending before 1998. In Hungary, household borrowing activity was insignificant during the 1990s, with loan portfolios showing a steady decline relative to GDP. Credit institutions did not regard households as their target market and did not offer household credit products. In the second half of the 1990s, the outlook for household income improved in the wake of economic consolidation, while there was a degree of household impatience due to a period of deferred consumption, resulting in substantial excess demand. Significant liquidity constraints, ie strictness on the supply side, were the main obstacle to growth in household indebtedness. Credit supply reacted with a delay to the improving creditworthiness of households; however, from 1998 there was a dynamic increase in consumer lending by banks and non-bank financial intermediaries alike. Car loans denominated in foreign currency comprised the greatest part of the consumer credit market.
Improvements in economic and legal conditions encouraged household borrowing. High and volatile inflation and interest rates, low real incomes, and insufficient legal background hindered the evolution of mortgage loans, and there was no market for new housing loans for several years. From 1997, the gradual decrease in long-term yields and the inflation rate, associated with the establishment of a legal framework, created the necessary conditions for a functioning mortgage market by the end of the decade. The government’s interest rate subsidy scheme for housing loans, introduced in 2001, was the first main driver of mortgage lending. From 2001, Hungarian forint-denominated subsidised housing loans increased rapidly, and consumer lending also continued to accelerate, led by car loans.
Foreign currency lending increased rapidly. Since 2004, foreign currency denominated mortgage lending has dominated, in the form of both housing finance and home equity withdrawals. In December 2003, the government tightened the conditions of the house purchase subsidy scheme. Accordingly, the amount of government subsidy, subject to market rates and granted for purchasing new and used homes, was reduced. As a consequence, the cost of borrowing increased for customers, with a simultaneous decline in the banking sector’s margin. These factors led to a new situation in the mortgage loan market, which directed the attention of both borrowers and lenders to foreign currency based products. The increase in foreign currency denominated loans had three main driving forces.
(1) “Catch-up effect”. As a result of the nominal and real convergence of wealth and wages, households were ready to increase their spending. The favourable growth outlook and improving prospects for household disposable income, as well as low foreign interest rates, made it easier for households to finance their expenditure and service their debt.

226 BIS Papers No 44
(2) “Carry trades”. The high forint risk premium and low historical exchange rate volatility made foreign currency denominated loans attractive. Due to the high premium on Hungarian assets, the difference between local and foreign currency denominated loans in terms of nominal costs was significant. In addition, although the Hungarian monetary policy regime had no explicit exchange rate target, the official intervention band, together with the inflation targets, resulted in a rather stable exchange rate. This meant that local borrowers rationally expected to gain on the interest rate differential (“carry trade”), without paying for it in terms of either higher exchange rate volatility or an exchange rate loss.
(3) Hungarian banks were willing and able to meet credit demand. The majority owners of almost all systemically important Hungarian banks are foreign financial institutions; moreover, most of them are EU (euro area) resident financial holdings with widespread presence in central, eastern and southeastern Europe. These parent institutions typically employ a “search for yield” strategy, as they want to maximise their net income in each market and always seek to exploit the more profitable markets and segments, even if these segments also involve higher risk. In their efforts to gain market share and increase profits, they do not hesitate to provide foreign currency lending.
Chart 5
Growth and composition of household loans in Hungary (as a percentage of GDP)
Sources: Magyar Nemzeti Bank; national accounts.
Household indebtedness increased at a fast rate. In 2004, foreign currency housing loans started to grow, followed by general purpose mortgages and other consumer loans. This surge in home equity withdrawal was also supported by the relatively high proportion of home ownership of the housing stock and households’ consumption-smoothing behaviour. With the increase in foreign currency loans and housing mortgages within the overall loan portfolio, there was a significant change in portfolio composition. By 2007, half the entire household portfolio and 80% of newly granted loans were comprised of foreign currency loans (typically in Swiss francs), and the lion’s share was secured by mortgages. The household credit to GDP ratio exceeded 25% in June 2007 (Chart 5).
Foreign currency mortgage lending has several important consequences from a financial stability perspective. The most important is that it causes three kinds of mismatches to emerge in the different sectors of the economy: overindebtedness, and currency and maturity mismatches.
0
5
10
15
20
25
30
Dec
99
Mar
00
Jun
00S
ep 0
0D
ec 0
0M
ar 0
1Ju
n 01
Sep
01
Dec
01
Mar
02
Jun
02S
ep 0
2D
ec 0
2M
ar 0
3Ju
n 03
Sep
03
Dec
03
Mar
04
Jun
04S
ep 0
4D
ec 0
4M
ar 0
5Ju
n 05
Sep
05
Dec
05
Mar
06
Jun
06S
ep 0
6D
ec 0
6M
ar 0
7Ju
n 07
Consumer and other loans – FX Consumer and other loans – HUFHousing loans – FXHousing loans – HUF

BIS Papers No 44 227
(1) Overindebtedness. The most important feature of overindebtedness involves the sustainability of a rapid increase in household sector indebtedness. As the results of a Magyar Nemzeti Bank study show,2 the level of indebtedness proxied by the credit to GDP ratio is still moderate in Hungary, but it grew significantly faster than the equilibrium pace after 2002, and the dynamics accelerated further in 2006. This, in turn, may pose financial stability risks. In addition, the debt service burden of households reached the euro zone average (Chart 6). The debt service burden can be explained by, on the one hand, fast indebtedness and, on the other, high forint interest rates, the still relatively large share of shorter-term credits and low disposable income levels. Although the rate of growth in indebtedness is high, it still has scope for further growth if average maturity is extended, preferential conditions are offered, and the share of foreign currency denominated loans continues to grow.
Chart 6
Debt service of households as a percentage of disposable income
Source: Magyar Nemzeti Bank.
(2) Currency mismatch. The increase in indebtedness also entails a currency mismatch through external financing in foreign exchange. In the event of a shock, the high stock of foreign currency denominated loans can be a source of vulnerability, particularly in the household sector. When a currency depreciates sharply, borrowers experience large balance sheet losses. Investment and consumption decelerate, and financial institutions can be wiped out if any debtor burdened by large net foreign currency liabilities becomes insolvent.
(3) Maturity mismatch. Growth in foreign currency mortgage lending increases imbalances in the asset-liability structure of the banking sector. The growth in long-term mortgage loans, coupled with the change in the funding structure (a decrease in the share of stable household deposits and an increase in the importance of more volatile external and market funding), increases rollover risk. The reliance on funds from parent financial institutions is high, which raises the question of how the parents would allocate funds among
2 Kiss et al (2006).
0
2
4
6
8
10
12
14
16
2002
Q1
Q2
Q3
Q4
2003
Q1
Q2
Q3
Q4
2004
Q1
Q2
Q3
Q4
2005
Q1
Q2
Q3
Q4
2006
Q1
Q2
Q3
Q4
2007
Q1
Q2
Q3 0
2
4
6
8
10
12
14
16
Euro zone (2006)
USA (2006)
Interest payment/Disposable income Principal payment/Disposable income

228 BIS Papers No 44
their various subsidiaries in liquidity stress situations. This leaves banks exposed to the risk that customer or counterparty behaviour will alter suddenly and radically (the risk of a “run on the bank”). This, in turn, may lead to reputational risk and contagion risk.
3. Who bears the exchange rate risk?
The boom in foreign currency denominated lending had an impact on the denomination structure of the Hungarian foreign exchange market. Net external debt equals the net exchange rate exposure of all sectors.3 Therefore, the rise in foreign debt means an increase in the open foreign exchange position of one or more sectors. The sectors’ different objectives and risk profiles determine their market selection and behaviour, as well as their contribution to the determination of the foreign exchange market equilibrium.
Non-residents took over the public sector’s currency exposure. As the public sector turned towards domestic financing in 1999–2000, foreign investors increased their forint exposure through buying large amounts of domestic currency denominated assets, mainly government bonds, without hedging their currency exposure. By 2001–02, the non-resident sector’s long forint position amounted to half of total net external debt (Chart 7). However, non-residents’ forint exposure did not keep pace with the growth in external debt, which accelerated from 2003. The increase in non-residents’ domestic currency exposure was just enough to keep their exposure to GDP ratio stable. This means that, despite the favourable global investment sentiment of the last couple of years, the Hungarian risk premium (the highest in the region) was not high enough for non-residents to further increase their domestic currency exposure. It can be assumed that a higher premium (weaker exchange rate, higher nominal interest rates) would have occurred had the domestic sectors not taken on increased forint exposure.
Chart 7
Net external debt and foreign exchange exposure by sector (as a percentage of GDP)
Source: Magyar Nemzeti Bank.
3 On the assumption that non-residents’ equity holdings do not represent a foreign exchange exposure, as
equities represent a claim on real assets.
–10
–5
0
5
10
15
20
25
30
35
40
1998
Q1
Q2
Q3
Q4
1999
Q1
Q2
Q3
Q4
2000
Q1
Q2
Q3
Q4
2001
Q1
Q2
Q3
Q4
2002
Q1
Q2
Q3
Q4
2003
Q1
Q2
Q3
Q4
2004
Q1
Q2
Q3
Q4
2005
Q1
Q2
Q3
Q4
2006
Q1
Q2
Q3
Q4
2007
Q1
Q2 –10
–5
0
5
10
15
20
25
30
35
40
Households External sector Public sector Corporate sector Net external debt

BIS Papers No 44 229
Foreign investors can quickly change their currency position. Foreign investors are heterogeneous with respect to their investment time horizon and risk tolerance; nevertheless, they have the same single objective – to make a profit on their investment. They are capable of taking on large foreign exchange exposure over a short period (as evidenced, for example, during the speculative attack in early 2003, when foreigners bought forints for more than EUR 5 billion in two days, or when they sold Hungarian currency worth EUR 5.5 billion in July–August 2007). In calm periods, they have shown negative feedback behaviour on the spot market, but during periods of volatility they have followed positive feedback strategies, exacerbating exchange rate fluctuations. Foreign investors are active on both the spot and the swap markets (taking forward positions by combining these two markets, as the liquidity of the swap market is much greater than that of the forward), and actively use derivative instruments (mostly options) as well. Foreigners are supposed to be price-setters on the market, and hence the change in their required return is reflected in the exchange rate.
The private sector is taking on increasing currency risk. As non-residents were not willing to take on large additional forint exposure after 2001–02, residents stepped in. Domestic households and the domestic corporate sector generated significant domestic currency demand through foreign currency denominated borrowing. Foreign currency corporate borrowing has a long history, but foreign currency denominated household and corporate loans have become widespread only since 2002–03. The corporate sector holds a significant part of total forint currency risk, but its exposure has lagged behind the rapid increase in external debt. Anecdotal evidence suggests that, while in the past foreign currency corporate borrowing partially reduced the corporate sector’s currency risk, as it matched its existing or expected foreign currency position (ie hedged natural exposure), in the last couple of years borrowing flows have shifted towards companies (especially small and medium-sized enterprises) with no natural exposure.
The corporate sector is displaying different behaviours on the spot and on the forward foreign exchange markets. The corporate sector’s truly exchange rate-sensitive activity is concentrated on the forward foreign exchange market. Here we find primarily companies willing to hedge their natural foreign exchange exposure from net exports and/or profit from a high interest rate differential or exchange rate movements. The carry trade feature of the forward market makes it impossible to separate hedging from speculative activity. There is clear evidence from bank transaction data that companies are highly exchange rate-sensitive on this market. They opened long forint forward positions as the exchange rate weakened, and closed positions when the forint appreciated (the corporate sector never took short forint positions on aggregate). As companies have a high degree of discretion over taking on exposure, they are supposed to be price-setters; their exchange rate expectations are therefore important components of the exchange rate determination process. If they expected a large depreciation, they would step in only if a much weaker exchange rate is negotiated, and vice versa. It is thus unsurprising to see the strong co-movement of the corporate sector’s forward stock and the exchange rate (Chart 8). Companies can take on large foreign currency exposure; their negative feedback behaviour usually counterbalances the larger swings in foreign investors’ positions, thereby smoothing the exchange rate movements. Looking back, this strategy seems to have been highly profitable. The reason is that the EUR/HUF exchange rate has fluctuated within a relatively narrow range in the last couple of years, returning to levels of around 250 after each period of appreciation or depreciation. Foreigners and domestic individuals rarely enter the forward foreign exchange market.
Corporate sector spot market trading is primarily linked to foreign trade, as evidenced by the strong correlation between monthly net trade data and spot market transaction volume. The seasonality of these transactions suggests that companies are not particularly sensitive to exchange rate changes; they may be price takers. However, anecdotal information from commercial banks suggests that exchange rate movements strongly

230 BIS Papers No 44
influence the timing of the drawdown of corporate credit lines. This means that some exchange rate sensitivity may appear on the spot market.
Chart 8
Net forint forward stock of residents and the exchange rate
Source: Magyar Nemzeti Bank.
Households’ currency exposure has been growing steadily. Households’ foreign exchange risk exposure has changed considerably in the past decade. In the late 1990s, households had a large stock of foreign currency deposits, built up earlier to hedge against high inflation and exchange rate depreciation (the latter having been facilitated by the crawling peg exchange rate regime). They therefore held a net short forint position. After reducing their forint-denominated savings, households tapped their foreign currency deposits to finance increasing consumption. Foreign currency borrowing accelerated the change in their currency position, and by the beginning of 2004 households on aggregate moved to a long forint position (Chart 9). Between 2001 and 2007, households’ exchange rate exposure changed by almost 10% of GDP, as they assumed the majority of the foreign exchange exposure arising from the growth in external debt. In fact, they are the real foreign currency risk-takers.
Households’ structural demand for foreign currency denominated loans provides broad-based support for the exchange rate. Households’ consumption and investment are denominated predominantly in local currency. Therefore, their growing foreign currency indebtedness signifies increasing foreign exchange exposure and continuous demand for local currency. The rather steady rate of increase indicates that their forint demand has little or no sensitivity to changes in the spot exchange rate. This can be explained either by their acceptance or ignorance of foreign exchange risks, or by their limited ability to determine the precise timing of loan-granting. As households take a huge foreign exchange risk exposure over a longer time horizon, they have an important role in exchange rate determination. They might not smooth out sudden shifts in other sectors’ forint demand, but in the long run they support the exchange rate. It can be assumed that, without the large and steady demand for local currency on the part of households, the increase in the required premium due to the fundamental imbalances would have resulted in foreign exchange market equilibrium at a significantly weaker exchange rate. It should be mentioned, however, that there has been no great or prolonged depreciation of the domestic currency since foreign currency borrowing
0
100
200
300
400
500
600
700
800
900
1,000
05 J
an 2
004
05 F
eb10
Mar
15 A
pr19
May
23 J
un27
Jul
31 A
ug04
Oc t
08 N
ov10
Dec
13 J
an 2
005
16 F
eb23
Mar
27 A
pr01
Jun
05 J
ul08
Aug
09 S
ep13
Oct
17 N
ov21
Dec
25 J
an 2
006
28 F
eb04
Apr
10 M
ay14
Jun
18 J
ul21
Aug
22 S
ep27
Oct
01 D
ec09
Jan
200
712
Feb
19 M
a r21
Apr
29 M
ay02
Jul
03 A
ug07
Sep
11 O
ct
HUF bn 235
240
245
250
255
260
265
270
275
280
285
HUF/EUR
Net forint forward stock of residents HUF/EUR exchange rate (rhs)

BIS Papers No 44 231
picked up; the resilience of household borrowing to large exchange rate shocks has therefore not been tested.
Chart 9
Total net external debt and the foreign exchange exposure of
households (as a percentage of GDP)
Source: Magyar Nemzeti Bank.
Hungarian banks aim to limit their total balance sheet foreign exchange exposure, in compliance with banking regulations. The banks counterbalance the growth of foreign currency denominated assets on their balance sheets by (i) obtaining external funds from the parent bank, (ii) raising finance directly on the market, or (iii) changing the foreign position on domestic funds through foreign exchange swaps. While keeping their total foreign currency position close to zero, banks transfer the exchange rate risk to the other sectors. Data show that there is a strong correlation between the transactions of the Hungarian interbank market and those of foreigners (the “hot potato effect”) – that is, banks try to hedge their exposure with other banks until the banking system finally finds an external (domestic non-bank or foreign) partner to close it. Apart from a short period in 2006, the total foreign exchange exposure of the banking system as a whole has remained well below EUR 1 billion.
Credit growth has changed the denomination structure of the foreign exchange market as well. The growth of Swiss franc-denominated loans to households and the corporate sector significantly increased the volume of franc-related transactions on the Hungarian spot foreign exchange market. Structural changes in foreign trade or investment flows cannot explain this increase (from around 2% in 2001 to 13% of total spot market turnover by mid-2007; Chart 10). A rather similar denomination shift occurred in the swap market.
A new product has just emerged on the retail market: yen-denominated mortgage-backed consumption loans. The future effect of the volatile currency involved may modify the “equilibrium” structure described above.
–10
–5
0
5
10
15
20
25
30
35
40
Q2
Q3
Q4
1999
Q1
Q2
Q3
Q4
2000
Q1
Q2
Q3
Q4
2001
Q1
Q2
Q3
Q4
2002
Q1
Q2
Q3
Q4
2003
Q1
Q2
Q3
Q4
2004
Q1
Q2
Q3
Q4
2005
Q1
Q2
Q3
Q4
2006
Q1
Q2
Q3
Q4
2007
Q1
Q2
–10
–5
0
5
10
15
20
25
30
35
40
Net external debt Exchange rate exposure of households
1998
Q1

232 BIS Papers No 44
Chart 10
Ratio of CHF-based1 turnover on the Hungarian spot foreign exchange market
1 HUF/CHF, EUR/CHF and USD/CHF turnover as a ratio of total Hungarian spot foreign exchange market turnover. Calculations based on reports by Hungarian resident credit institutions.
4. Conclusion
At the end of the 1990s, Hungary was on an equilibrium growth path, with strong FDI inflows financing corporate sector investment activity, and household saving covering the public sector’s financing needs. In 2001–03, a structural break occurred. Corporate investment and FDI inflows slowed down, the budget deficit increased rapidly, and household saving continued to decline, while consumption accelerated. The banking sector was eager to ease households’ liquidity constraint, but the fundamental imbalances resulted in a high forint risk premium, which pushed both credit demand and credit supply towards foreign currency denominated loans. As external balances showed no improvement and debt generating inflows dominated external financing, total external debt increased steadily. The greater part of the resulting foreign exchange exposure was assumed by households, whose forint demand supported the exchange rate. Households thus entered a carry trade position, taking on exchange rate risk, which was historically low due to the monetary policy regime. Even though households are supposed to be price takers, they played a key role in establishing foreign exchange market equilibrium, as they replaced those price-setting foreign investors who would have required a much higher risk premium to accept the large additional forint exposure. While increased foreign currency borrowing facilitated consumption growth, it also increased households’ foreign currency exposure and created overindebtedness and currency and maturity mismatches in the Hungarian banking sector.
0
2
4
6
8
10
12
14
1620
01 M
ay Jul
Sep
Nov
2002
Jan Mar
May Ju
lS
epN
ov20
03 J
an Mar
May Ju
lS
epN
ov20
04 J
anM
arM
ay Jul
Sep
Nov
2005
Jan Ma r
May Ju
lS
epN
ov20
06 J
anM
a rM
ay Jul
Sep
Nov
2007
Jan
Ma r
May Ju
lS
ep
%

BIS Papers No 44 233
References
Backé, P, B Égert and T Zumer (2006): “Credit growth in central and eastern Europe: new (over)shooting stars?”, Focus on European Economic Integration, 1/06, Oesterreichische Nationalbank, pp 112–39.
Bems, R and P Schellekens (2007): “Finance and convergence: what’s ahead for emerging Europe?”, IMF Working Paper WP/07/244, October.
Boissay, F, O Calvo-González and T Kozluk (2005): “Is lending in central and eastern Europe developing too fast?”, ECB, mimeo.
Duenwald, C, N Gueorguiev and A Schaechter (2005): “Too much of a good thing? Credit booms in transition economies: the cases of Bulgaria, Romania, and Ukraine”, IMF Working Paper WP/05/128, June.
Égert, B and D Mihaljek (2007): “Determinants of house prices in central and eastern Europe”, BIS Working Papers, no 236, Basel, September.
Kiss, G, M Nagy and B Vonnak (2006): “Credit growth in central and eastern Europe: trend, cycle or boom?”, MNB Working Paper, 2006/10.
Terrones, M and E Mendoza (2004): “Are credit booms in emerging markets a concern?”, World Economic Outlook, IMF, Washington DC, April, pp 147–66.
World Bank (2007): EU8+2 Regular Economic Report, Special Topic: credit expansion in emerging Europe: a cause for concern?


BIS Papers No 44 235
Capital flows to India
Rakesh Mohan1
Introduction
In most of the period since the mid-1990s, external sector developments in India have been marked by strong capital flows. Capital inflows, which were earlier mainly confined to small-scale official concessional finance, gained momentum from the 1990s after the initiation of economic reforms. As well as increasing in size, capital inflows have undergone a compositional shift from predominantly official and private debt flows to non-debt-creating flows in the post-reform period. Private debt flows have begun to increase again in the more recent period. Though capital flows are generally seen to be beneficial to an economy, a large surge over a short span of time in excess of domestic absorptive capacity can be a source of stress, leading to upward pressure on the exchange rate, overheating of the economy and possible asset price bubbles. In India, capital flows in the past few years increased sharply and have been well above the current account deficit, which has largely remained modest. This has posed new challenges for monetary and exchange rate management.
This paper elaborates on various aspects of capital flows to India and their policy implications. The sections have been arranged as follows: Section I provides a historical backdrop to the evolution of capital inflows. Section II analyses their trend, magnitude and composition. Section III examines the management of capital inflows and their implications for the conduct of monetary and exchange rate policies. Section IV highlights some of the major issues and challenges for the central bank, and Section V concludes with the future outlook.
I. Historical backdrop
For the first four decades after independence in 1947, the economic policies of the Indian government were characterised by planning, control and regulation. Until the 1980s, India’s development strategy was focused on self-reliance and import substitution. There were periodic attempts at market-oriented reform, usually following balance of payments pressures, which induced policy responses that combined exchange rate depreciation and an easing of restrictions on foreign capital inflows. However, these controls were relatively narrow in scope and had little impact on actual inflows, which remained small. The situation changed dramatically with the onset of reform programmes introduced in the early 1990s in the aftermath of the balance of payments crisis of 1991.
Broadly speaking, India’s approach towards external capital flows can be divided into three main phases. In the first phase, starting at the time of independence and spanning up to the early 1980s, India’s reliance on external flows was mainly restricted to multilateral and bilateral concessional finance. Subsequently, however, in the context of a widening current account deficit during the 1980s, India supplemented this traditional external source of financing with recourse to external commercial loans, including short-term borrowings and
1 Deputy Governor, Reserve Bank of India. The assistance of Dr R K Pattnaik, Ms Atri Mukherjee and
Mr Harendra Behera in preparing this paper is gratefully acknowledged.

236 BIS Papers No 44
deposits from non-resident Indians (NRIs). As a result, the proportion of short-term debt in India’s total external debt had increased significantly by the late 1980s. The third phase was marked by the balance of payments crisis of 1991 and the initiation of the reform process. The broad approach to reform in the external sector was based on the recommendations made in the Report of the High Level Committee on Balance of Payments (Chairman: C Rangarajan), 1991. The objectives of reform in the external sector were conditioned by the need to correct the deficiencies that had led to payment imbalances in 1991. Recognising that an inappropriate exchange rate regime, unsustainable current account deficit and a rise in short-term debt in relation to official reserves were amongst the key contributing factors to the crisis, a series of reform measures were put in place. They included a swift transition to a market-determined exchange rate regime, dismantling of trade restrictions, a move towards current account convertibility and a gradual opening-up of the capital account. While liberalising private capital inflows, the Committee recommended, inter alia: a compositional shift away from debt to non-debt-creating flows; strict regulation of external commercial borrowings, especially short-term debt; discouragement of the volatile element of flows from NRIs; and a gradual liberalisation of outflows.
Among the components, since the 1990s, the broad approach towards permitting foreign direct investment has been through a dual route, ie automatic and discretionary, with the ambit of the automatic route being progressively enlarged to almost all the sectors, coupled with higher sectoral caps stipulated for such investments. Portfolio investments are restricted to institutional investors. The approach to external commercial borrowings has been one of prudence, with self-imposed ceilings on approvals and a careful monitoring of the cost of raising funds as well as their end use. In respect of NRI deposits, some modulation of inflows is exercised through specification of interest rate ceilings and maturity requirements. In respect of capital outflows, the approach has been to facilitate direct overseas investment through joint ventures and wholly owned subsidiaries, and through the provision of financial support to exports, especially project exports from India. Ceilings on such outflows have been substantially liberalised over time. The limits on remittances by domestic individuals have also been eased. With the progressive opening-up since the early 1990s, the capital account in India today can be considered as the most liberalised it has ever been since the late 1950s.
The process of capital account liberalisation is managed by keeping in view the elasticities of supply and other responses in the economy, and vulnerabilities or potential shocks. The issue is handled with extreme caution given the potential for sudden capital reversals. The 1997 Report of the Committee on Capital Account Convertibility (Chairman: S S Tarapore) provided the initial framework for the liberalisation of capital account transactions in India. The Committee recommended a phased implementation of capital account convertibility, to be completed by the year 1999/2000. Drawing on international experience, the Committee suggested a number of preconditions needed to be met for the capital account liberalisation programme to succeed: fiscal consolidation, lower inflation and a stronger financial system were seen as crucial signposts. It is interesting to note that the Committee did not recommend unlimited opening-up of the capital account, but preferred a phased liberalisation of controls on outflows and inflows over a three-year period. Even at the end of the three-year period, the capital account was not to be fully open and some flows, especially debt flows, would continue to be managed.
The issue of capital account liberalisation was re-examined by the Committee on Fuller Capital Account Convertibility (Chairman Shri S S Tarapore) (2006), which made several recommendations on the development of financial markets in addition to addressing issues related to interaction of monetary policy and exchange rate management, regulation/supervision of banks and the timing and sequencing of capital account liberalisation measures (for details, see Section III.3). The Committee recommended that at the end of the five-year period ending in 2010/11, there should be a comprehensive review to chalk out the future course of action.

BIS Papers No 44 237
II. Trend, magnitude and composition of capital flows to India
II.1 Trend Since the introduction of the reform process in the early 1990s, India has witnessed a significant increase in cross-border capital flows, a trend that represents a clear break from the previous two decades. Net capital inflows increased from $7.1 billion2 in 1990/91 to $45.8 billion in 2006/07, and further to $108.0 billion during 2007/08 (Graph 1). India has one of the highest net capital flows among the emerging market economies (EMEs) of Asia.
II.2 Magnitude Net capital inflows, which increased from 2.2% of GDP in 1990/91 to around 9% in 2007/08, do not, however, reflect the true magnitude of capital flows to India. Gross capital inflows, as a percentage of GDP, have undergone a more than fivefold increase from 7.2% in 1990/91 to 36.6% in 2007/08. Much of this increase has been offset by corresponding capital outflows, largely on account of foreign institutional investors’ (FIIs) portfolio investment transactions, Indian investment abroad and repayment of external borrowings. Capital outflows increased from 5.0% of GDP in 1990/91 to 27.4% of GDP in 2007/08. The gross volume of capital inflows amounted to $428.7 billion in 2007/08 as against an outflow of $320.7 billion.
Graph 1 Net capital flows to India
0.020.040.060.080.0
100.0120.0
1990
/91
1991
/92
1992
/93
1993
/94
1994
/95
1995
/96
1996
/97
1997
/98
1998
/99
1999
/00
2000
/01
2001
/02
2002
/03
2003
/04
2004
/05
2005
/06
2006
/07
2007
/08
0.02.04.06.08.010.0
Net capital flows ($ billions, lhs)Net capital flows/GDP (in per cent, rhs)
Source: Reserve Bank of India.
Strong capital flows to India in the recent period reflect the sustained momentum in domestic economic activity, better corporate performance, the positive investment climate, the long-term view of India as an investment destination, and favourable liquidity conditions and interest rates in the global market. Apart from this, the prevailing higher domestic interest rate along with a higher and stable growth rate have created a lower risk perception, which has attracted higher capital inflows.
The large excess of capital flows over and above those required to finance the current account deficit (which is currently around 1.5% of GDP) resulted in reserve accretion of $110.5 billion during 2007/08. India’s total foreign exchange reserves were $308.4 billion as of 4 July 2008.
2 Dollar amounts are US dollars.

238 BIS Papers No 44
II.3 Composition As regards the composition of capital flows, the thrust of the policy reform in India in the aftermath of the balance of payments crisis was to encourage non-debt-creating flows and discourage short-term debt flows. Accordingly, the composition of capital inflows to India clearly reflects a shift towards non-debt-creating flows. The substantial contribution of external aid towards the capital account in the 1950s, 1960s, 1970s and 1980s has dwindled steadily since the 1990s (excluding IMF loans in 1991 and 1992) as the official flows started to be replaced by private equity flows and external commercial borrowing (Table 1). Although non-debt flows, particularly private foreign investments, have gained in importance, there has also been a significant rise in debt-creating flows in last two years, mainly on account of a rise in external commercial borrowings by Indian corporates (Table 2).
Table 1 External financing in India
In millions of US dollars
1990/91 2000/01 2003/04 2005/06 PR 2006/07 P 2007/08 P
Current account balance –9,680 –2,666 14,083 –9,902 –9,766 –17,407 As a percentage of GDP –3.1 –0.6 2.3 –1.2 –1.1 –1.5
Net capital flows 7,056 8,840 16,736 25,470 45,779 108,031 of which 1. Foreign direct investment
Inflows 107 4,101 4,464 9,178 22,959 34,924 Outflows 10 829 2,076 6,144 14,480 19,379 Net 97 3,272 2,388 3,034 8,479 15,545
2. Foreign portfolio investment Inflows 6 13,619 28,218 68,120 109,622 235,630 Outflows 0 11,029 16,862 55,626 102,560 206,369 Net 6 2,590 11,356 12,494 7,062 29,261
3. External assistance Inflows 3,397 2,941 3,350 3,607 3,747 4,241 Outflows 1,193 2,531 6,208 1,841 1,960 2,127 Net 2,204 410 –2,858 1,766 1,787 2,114
4. External commercial borrowings Inflows 4,282 9,621 5,228 14,343 20,973 29,851 Outflows 2,028 5,318 8,153 11,835 4,818 7,686 Net 2,254 4,303 –2,925 2,508 16,155 22,165
5. NRI deposits Inflows 7,348 8,988 14,281 17,835 19,914 29,321 Outflows 5,811 6,672 10,639 15,046 15,593 29,142 Net 1,537 2,316 3,642 2,789 4,321 179
PR = partially revised; P = preliminary. Figures for foreign direct investment and foreign portfolio investment include gross inflows and gross outflows on account of foreign investments in India as well as Indian investment abroad. Similarly, figures for external assistance and external commercial borrowings include gross inflows and gross outflows on account of foreign borrowings as well as overseas lending by Indian entities. Large outflows under external commercial borrowings during 2005/06 reflect the one-off effect of the principal repayment of $5.2 billion on account of redemption of India Millennium Deposit bonds. Source: Reserve Bank of India.

BIS Papers No 44 239
Table 2
Composition of capital inflows to India
1990/91 2000/01 2003/04 2005/06 2006/07 P 2007/08P
Net capital flows (US$ millions) 7,056 8,840 16,736 25,470 45,779 108,031 of which (in per cent) 1. Non-debt-creating flows 1.5 66.3 82.1 73.6 34.5 41.5
a) Foreign direct investment 1.4 37.0 14.3 20.2 18.8 14.4
b) Foreign portfolio investment 0.1 29.3 67.9 53.4 15.7 27.1
2. Debt-creating flows 71.1 30.3 7.7 29.6 51.2 49.6 a) External assistance 31.2 4.6 –17.1 7.2 3.9 1.9 b) External commercial
borrowings1 31.9 48.7 –17.5 11.6 35.8 20.5 c) Short-term credits 15.2 6.2 8.5 7.3 7.3 16.4 d) Banking capital 9.7 –22.2 36.0 5.9 4.6 10.9
of which NRI deposits 21.8 26.2 21.8 11.9 8.7 0.2
e) Rupee debt service –16.9 –7.0 –2.2 –2.4 –0.4 –0.1 3. Other capital2 27.4 3.3 10.2 –3.2 14.2 8.9 Total (1 + 2 + 3) 100.0 100.0 100.0 100.0 100.0 100.0 P = provisional. 1 Medium- and long-term borrowings. 2 Includes leads and lags in exports (difference between the custom and the banking channel data), Indian investment abroad and India's subscription to international institutions and quotas.
Source: Annual Report, Reserve Bank of India, 2006/07.
Non-debt flows Equity flows under foreign direct investment (FDI) and foreign portfolio investments constitute the major forms of non-debt-creating capital flows to India. There has been a marked increase in the magnitude of FDI inflows to India since the early 1990s, reflecting the liberal policy regime and growing investor confidence. India’s share in global FDI flows increased from 2.3% in 2005 to 4.5% in 2006. Inflows under FDI were particularly high during the last two years, though a large part was offset by significant outflows on account of overseas investment by Indian corporates.
In a major break from the past, the spurt in FDI flows to India in the recent period has been accompanied by a jump in outward equity investment as Indian firms establish production, marketing and distribution networks overseas to achieve global scale along with access to new technology and natural resources. Investment in joint ventures (JV) and wholly owned subsidiaries (WOS) abroad has emerged as an important vehicle for facilitating global expansion by Indian companies. Overseas direct equity investment from India jumped from $3.8 billion in 2005/06 to $11.3 billion in 2006/07, and rose further to $12.5 billion during 2007/08. Overseas investment, which started with the acquisition of foreign companies in the IT and related services sector, has now spread to other areas such as non-financial services.

240 BIS Papers No 44
A marked feature of FDI flows to India is that they have been concentrated in the services sector, in contrast to the dominance of manufacturing in the East Asian economies. This reflects the service-led growth of the economy and its comparative advantage in international trade in services. It may be mentioned that IT has enabled greater tradability of a number of business and professional services. With greater potential for growth in such services, FDI has also emerged as a vehicle to delivery of services to the international markets. Moreover, within the services sector, financing, insurance, real estate and business services witnessed a large increase in their share in FDI flows to India between 2002/03 and 2007/08. Computer services also remains a key sector for FDI as captive BPO/subsidiaries have been principal instruments for facilitating offshore delivery of computer services and IT enabled services.
Like FDI, India’s share in net portfolio flows to emerging market and developing countries has expanded. India has witnessed a dominance of portfolio flows over FDI flows during various periods of time, which is in contrast to developing and emerging market economies in most parts of the world, where FDI constituted the main source of equity flows (Graph 2). However, unlike FDI flows, which have exhibited a more or less steady upward trend over the years, portfolio flows are more volatile, moving in tandem with domestic and international market sentiments. Accordingly, a sharp rise in portfolio investment into India in the recent period reflects both global and domestic factors. The search for yield in view of very low real long-term rates in advanced economies has been an important factor driving portfolio flows to EMEs as a group, and India also has attracted such flows. Domestic factors, such as strong macroeconomic fundamentals, a resilient financial sector, a deep and liquid capital market, the improved financial performance of the corporate sector and attractive valuations also attracted large portfolio flows. Consistent with the principle of the hierarchy of capital flows, India has been making efforts towards encouraging more inflows through FDI and enhancing the quality of portfolio flows by strict adherence to the “know your investor” principle (Reddy (2005)).
Graph 2
Foreign investment inflows to India In millions of US dollars
-5000
0
5000
10000
15000
20000
25000
30000
35000
1990
/91
1991
/92
1992
/93
1993
/94
1994
/95
1995
/96
1996
/97
1997
/98
1998
/99
1999
/00
2000
/01
2001
/02
2002
/03
2003
/04
2004
/05
2005
/06
2006
/07
2007
/08
FDI Foreign portfolio investment
Source: Reserve Bank of India.

BIS Papers No 44 241
Debt-creating flows External assistance, external commercial borrowings (ECBs), trade credits and the non-repatriable component of NRI deposits constitute the major portion of the external debt in India.
External assistance, which consists of external aid flows from bilateral and multilateral sources, constituted the major source of external financing for India in the 1950s and 1960s. Its importance has declined steadily during the last three decades as it gave way to private capital flows, with the share in India’s total capital flows falling from 31.2% in 1990/91 to 1.9% in 2007/08. Conversely, India has started extending assistance to other countries, mainly grants and loans for technical cooperation and training. The grant component dominates external aid with a share of over 90%; the major beneficiaries during 2006/07 were Bhutan, Nepal and Sri Lanka.
The recourse to ECBs by Indian corporates, though initiated in the early 1970s, remained modest due to the dominance of concessional, non-market-based finance in the form of external assistance from bilateral sources and multilateral agencies. Towards the end of the 1970s, the concessionality in the aid flows dwindled. Thus, with the rising external financing requirements beginning in the 1980s and the recognition that reliance on external assistance was not favourable, commercial borrowings from international capital markets were preferred. After experiencing some slowdown in the aftermath of the balance of payments crisis, ECBs rose significantly in the latter half of the 1990s, responding to the strong domestic investment demand, favourable global liquidity conditions, the upgrade of India’s sovereign credit rating, lower risk premia on emerging market bonds, and an upward phase of the capital flow cycle to the EMEs. During this period, ECBs constituted about 30% of the net capital flows to India. In the late 1990s and the early 2000s, the demand for ECBs remained subdued due to a host of factors such as the global economic slowdown, the downturn in capital flows to developing countries and lower domestic investment demand. The period beginning 2003/04 marked the resumption of debt flows to developing countries, the combined outcome of the higher interest rate differential emanating from ample global liquidity and the robust growth expectations and low risk perception towards the emerging markets. Net inflows under ECBs increased from $2.5 billion in 2005/06 to $16.2 billion in 2006/07 and further to $22.2 billion during 2007/08. ECBs contributed to about 20.5% of the net capital flows to India in 2007/08. Higher ECB drawals during the past few years reflect sustained domestic investment demand, import demand, the hardening of domestic interest rates and also the greater risk appetite of global investors for emerging market bonds. The policy on ECBs is kept under constant review and changes are made as needed.
In the 1970s, the two oil shocks shifted substantial resources towards oil-exporting countries, which provided investment and employment opportunities in the oil-rich countries. The Reserve Bank devised specific deposit schemes to tap the savings of NRIs employed in these countries. Non-Resident Indians/Overseas Corporate Bodies were allowed to open and maintain bank accounts in India under special deposit schemes, both rupee- and foreign currency denominated. NRI deposits were a generally stable source of support to India’s balance of payments through the 1990s, although the external payment difficulties of 1990/91 demonstrated the vulnerability that can be associated with these deposits in times of difficulty and drastic changes in perceptions. Since the 1990s, the Reserve Bank has aligned the interest rates on these deposits with international rates and fine-tuned the reserve requirements, end use specifications and other concomitant factors influencing these deposits in order to modulate these flows consistent with overall macroeconomic management.
As a whole, India’s external debt stock stood at $221.2 billion at the end of March 2008. Consolidation of India’s external debt position is reflected the steady improvement in India’s debt sustainability and liquidity indicators. While the ratio of India’s external debt to GDP has declined over the years from 38.7% in 1991/92 to 18.8% in 2007/08, the debt service ratio

242 BIS Papers No 44
declined from 30.2% to 5.4% during the same period (Graph 3). At the end of March 2008, India’s foreign exchange reserves, at $309.7 billion, provided a cover of 140% to total external debt, though there has been a increase in the short-term debt in recent years. As regards the composition of external debt, there has been a distinct decline in the share of government debt in total external debt, which fell from 43.4% to 26.3% of total external debt between end-March 2001 and end-December 2007, giving way to non-government private external borrowings (Graph 4).
Graph 3 External debt indicators
In per cent
05
1015202530354045
1990
/91
1991
/92
1992
/93
1993
/94
1994
/95
1995
/96
1996
/97
1997
/98
1998
/99
1999
/00
2000
/01
2001
/02
2002
/03
2003
/04
2004
/05
2005
/06
2006
/07
2007
/08
External debt to GDP Debt service ratio
Source: Reserve Bank of India.
Graph 4
Government and private external debt outstanding In billions of US dollars
020406080
100120140160
1991 1996 2001 2006 2007 2007(end-Dec)End-March
Government Non-Government
Source: Reserve Bank of India.

BIS Papers No 44 243
On account of large capital inflows, India’s international investment position (IIP) has deteriorated over the years. Net international liabilities increased from $47.2 billion at end-March 2004 to $73.9 billion at end-December 2007, as the increase in international liabilities ($222.5 billion) exceeded the increase in international assets ($195.7 billion) during the period (Graph 5). While the increase in the liabilities was mainly due to large capital flows under portfolio investment, FDI and external commercial loans, the increase in international assets mainly reflected a rise in reserve assets, followed by direct investment abroad. A major part of the liabilities, such as direct and portfolio investment, reflects cumulative inflows, which are provided at historical prices. The value of the liabilities would be much higher if marked to market at current prices. The ratio of non-debt liabilities to total external financial liabilities has witnessed an increasing trend since end-June 2006, rising from 42.3% at end-June 2006 to 50.8% at end-December 2007 due to large capital inflows under direct and portfolio equity investments. On the other hand, debt liabilities, which include portfolio investment in debt securities and other investment (trade credits, loans, currency and deposits and other liabilities) declined from 57.7% to 49.2% during the same period.
Graph 5
India’s external liabilities In billions of US dollars
050
100150200
250300350400450
2003 2004 2005 2006 2007 Dec-07
End-March
Direct investment Portfolio investment Other investment
Source: Reserve Bank of India.
III. Management of capital flows in India
The recent episode of capital flows, which has occurred against the backdrop of current account surpluses in most of the emerging Asian economies, highlights the importance of the absorption of capital flows. A large surge in capital flows over a short span of time in excess of domestic absorptive capacity can lead to upward pressure on the exchange rate, possible overheating of the economy and asset price bubbles. It can also pose the risk of an abrupt reversal, which may have potential negative real economic effects. The absorption of capital flows is limited by the size of the current account deficit, which has traditionally been low in

244 BIS Papers No 44
India, and seldom above 2% of GDP. Given this situation, large capital inflows are a stress on the real economy through exchange rate appreciation and sterilisation. This not only affects exporters, but also affects the profitability of domestic producers through pressures on domestic prices, unless productivity goes up commensurately. Real appreciation of the exchange rate leading to a widening of the trade deficit could also result in a slowdown in economic and industrial growth. Thus, the combination of low domestic absorption and high capital inflows has posed new challenges for monetary and exchange rate management in India.
In the medium term, a continued focus on financial market development would mitigate the challenge of capital flows. However, it is important to recognise that maturation of financial markets takes time. Hence, capital flows have to be managed through other tools in the short term, while continuing work on the development of financial markets (Reddy (2008a)). In response to net capital flows remaining well in excess of the current account financing need, a multi-pronged approach has been followed in India to deal with such flows. The policy responses have included, inter alia, phased liberalisation of the policy framework in relation to current as well as capital account outflows; foreign exchange market intervention and subsequent sterilisation; lowering interest rate ceilings on NRI deposits; management of external debt through prepayment and moderation in the access of corporates and intermediaries to additional external debt; and greater flexibility in exchange rate movements.
III.1 Capital flows and exchange rate management In India, with the gradual removal of restrictions on international capital flows and greater integration of domestic with global financial markets, understanding the precise nature of the causal relationship among capital flows, the exchange rate, interest rates and reactions of monetary policy has certainly become more complex. The response lag of the exchange rate and domestic liquidity to monetary policy actions in the form of direct intervention in the exchange market as well as changes in the short-term policy rates has important implications for the stability of foreign exchange markets and external price competitiveness. The importance of capital flows in determining exchange rate movements has increased considerably, rendering some of the earlier guideposts of monetary policy formulation possibly anachronistic (Mohan (2007a)). On a day-to-day basis, it is capital flows which influence the exchange rate and interest rate arithmetic of the financial markets. Instead of the real factors underlying trade competitiveness, it is expectations and reactions to news which drive capital flows and exchange rates, often out of alignment with fundamentals. Capital flows have been observed to cause overshooting of exchange rates as market participants act in concert while pricing information. In the Indian case, notwithstanding the persistence of a large trade deficit, capital flows have led to appreciation of the exchange rate, indicating the dominance of capital inflows in determining exchange rate movements (Graph 6).
The experience with capital flows has important lessons for the choice of the exchange rate regime. The advocacy of corner solutions – a fixed peg without monetary policy independence or a freely floating exchange rate retaining discretionary conduct of monetary policy – is distinctly on the decline. The weight of experience seems to be tilting in favour of intermediate regimes with country-specific features, without targets for the level of the exchange rate and exchange market interventions to fight extreme market turbulence. In general, EMEs have accumulated massive foreign exchange reserves as a circuit breaker for situations where unidirectional expectations become self-fulfilling (Mohan (2006)).

BIS Papers No 44 245
Graph 6
Merchandise trade, capital flows and exchange rate movements
-10.0
-8.0-6.0
-4.0
-2.0
0.0
2.0
4.0
6.08.0
10.0
12.0
2000
/01
2001
/02
2002
/03
2003
/04
2004
/05
2005
/06
2006
/07
2007
/0885.0
90.0
95.0
100.0
105.0
110.0
115.0
120.0
Merchandise trade balance/GDP (in per cent, lhs)
Net capital flows/GDP (in per cent, lhs)
Real equilibrium exchange rate (1993/94 = 100, rhs) Source: Reserve Bank of India.
In India, since a market-determined exchange rate system was set in place in March 1993, the exchange rate has been largely determined by demand and supply conditions in the market. The exchange rate policy in recent years has been guided by the broad principles of careful monitoring and management of exchange rates with flexibility, without a fixed target or a preannounced target or band, while allowing the underlying demand and supply conditions to determine the exchange rate movements over a period in an orderly way. Subject to this predominant objective, the exchange rate policy is guided by the need to reduce excess volatility, prevent the emergence of destabilising speculative activities, maintain an adequate level of reserves and develop an orderly foreign exchange market. The Indian foreign exchange market, like other developing country markets, is not yet very deep and broad, and can sometimes be characterised by an uneven flow of demand and supply over different periods. In this situation, the Reserve Bank has been prepared to make sales and purchases of foreign currency in order to even out lumpy demand and supply in the relatively thin forex market and to smooth jerky movements. However, such intervention is not governed by a predetermined target or band around the exchange rate.
Over the years, transactions in the Indian foreign exchange market have experienced tremendous growth. The increase in foreign exchange market turnover in India between April 2004 and April 2007 was the highest amongst the 54 countries covered in the Triennial Central Bank Survey of Foreign Exchange and Derivatives Market Activity conducted by the BIS in 2007. According to the survey, the daily average turnover in India jumped almost fivefold from $7 billion in April 2004 to $34 billion in April 2007, whereas global turnover over the same period increased by only 69%, from $1.9 trillion to $3.2 trillion. Reflecting these trends, the share of India in global foreign exchange market turnover trebled from 0.3% in April 2004 to 0.9% in April 2007. The average daily turnover in Indian foreign exchange market almost doubled from $25.8 billion in 2006/07 to $48.0 billion in 2007/08 (Table 3).

246 BIS Papers No 44
Component-wise, the share of the spot market in total foreign exchange market turnover has declined marginally in recent years due to a pickup in turnover in the derivatives segment. The merchant segment of the spot market is generally dominated by the Government of India, select public sector units, such as Indian Oil Corporation (IOC), and the FIIs. As the foreign exchange demand from public sector units and FIIs tends to be lumpy and uneven, resultant demand-supply mismatches entail occasional pressures on the foreign exchange market, warranting market interventions by the Reserve Bank. However, as noted earlier, such intervention is not governed by a predetermined target or band around the exchange rate.
Table 3
Average daily volume of transactions in the Indian forex market In billions of US dollars
Year Spot Derivatives1 Total
1997/98 2.6 2.4 5.0
2000/01 2.8 3.0 5.8
2003/04 4.3 4.4 8.7
2004/05 5.8 5.8 11.6
2005/06 8.9 8.7 17.6
2006/07 13.4 12.4 25.8
2007/08 23.8 24.2 48.0 1 Includes swap and forward transactions.
Source: Reserve Bank of India.
The public sector oil companies are among the important participants in the financial markets in India. Therefore, the liquidity and other related issues currently faced by these entities arising from the unprecedented escalation in international crude prices have systemic implications for the smooth functioning of financial markets and for overall financial stability in India. Accordingly, in order to minimise the potential adverse consequences for financial markets, the Reserve Bank has since end-May 2008 put in place Special Market Operations (SMOs) under which it (i) conducts open market operations (outright or repo at the discretion of the Reserve Bank) in the secondary market through designated banks in oil bonds held by public sector oil marketing companies in their own accounts, currently subject to an overall ceiling of Rs. 15 billion on any single day; and (ii) provides equivalent foreign exchange through designated banks at market exchange rates to the oil companies. The SMOs constitute only a fraction of the total turnover in the money and foreign exchange markets in India but are designed to reduce volatility. Further, the SMOs are likely to improve the access of public sector oil companies to domestic liquidity and alleviate the lumpy demand in the foreign exchange market in the current extraordinary situation.
Despite interventions by the Reserve Bank in the face of large capital flows, the exchange rate in the recent period has been marked by significant bidirectional movement, implying greater flexibility (Table 4). The IMF has observed in its Article IV Consultation Paper: “since the start of 2007, the BRICs (Brazil, Russia, India and China) have experienced significant REER appreciation. Most of the real appreciation in 2007 for India and Brazil came from nominal appreciation, whereas China and Russia had inflation-led appreciation”. Moreover, the volatility of the rupee exchange rate has become quite similar to the volatilities of exchange rates observed in the countries with a managed float exchange rate regime over the years.

BIS Papers No 44 247
Table 4
Exchange rate movements In rupees per US dollar
Year Range Average Standard deviation
1993/94 31.21/31.49 31.37 0.05
1994/95 31.37–31.97 31.40 0.12
1995/96 31.37–37.95 33.45 0.56
1996/97 34.14–35.96 35.50 0.21
1997/98 35.70–40.36 37.16 0.37
1998/99 39.48–43.42 42.07 0.24
1999/00 42.44–43.64 43.33 0.10
2000/01 43.61–46.89 45.68 0.15
2001/02 46.56–48.85 47.69 0.13
2002/03 47.51–49.06 48.40 0.07
2003/04 43.45–47.46 45.92 0.19
2004/05 43.36–46.46 44.95 0.31
2005/06 43.30–46.33 44.28 0.22
2006/07 43.14–46.97 45.28 0.27
2007/08 39.26–43.15 40.24 0.38
Source: Reserve Bank of India.
III.2 Capital flows and monetary management
Capital flows and liquidity management In the recent period, in India, one of the most serious challenges to the conduct of monetary policy emerges from capital flows in view of their significantly higher volatility as well as the fact that capital flows in gross terms are much higher than those in net terms. Swings in capital flows can have a significant impact on exchange rates, domestic monetary and liquidity conditions and overall macroeconomic and financial stability (Mohan (2007a)). This has warranted appropriate monetary operations to obviate wide fluctuations in market rates and ensure reasonable stability consistent with the monetary policy stance. In fact, the Indian experience illustrates the tight link between external sector management and domestic monetary management (Mohan (2006)).
With a view to neutralising the impact of excess forex flows on account of a large capital account surplus, the Reserve Bank has intervened in the foreign exchange market at regular intervals. But unsterilised forex market intervention can result in inflation, a loss of competitiveness and attenuation of monetary control. The loss of monetary control could be steep if such flows are large. Therefore, it is essential that the monetary authorities take measures to offset the impact of such foreign exchange market intervention, partly or wholly, so as to retain the efficacy of monetary policy through such intervention. Most techniques to offset the impact of forex inflows can be classified as either market-based or non-market-based. The market-based approach involves financial transactions between the central bank and the market, which leads to withdrawal or injection of liquidity, as the case may be. The

248 BIS Papers No 44
non-market-based approach involves the use of quantitative barriers, rules or restrictions on market activity, which attempt to keep the potential injection of liquidity outside the domestic financial system. The market-based approach aimed at neutralising part or whole of the monetary impact of foreign inflows is termed sterilisation.
In India, the liquidity impact of large capital inflows was traditionally managed mainly through the repo and reverse repo auctions under the day-to-day Liquidity Adjustment Facility (LAF). The LAF operations were supplemented by outright open market operations (OMOs), ie outright sales of the government securities, to absorb liquidity on an enduring basis. In addition to the LAF and OMOs, excess liquidity from the financial system was also absorbed through the building-up of surplus balances of the government with the Reserve Bank, particularly by raising the notified amount of 91-day Treasury bill auctions, and forex swaps.
Box 1
Introduction of MSS
In view of the finite stock of government securities available with the Reserve Bank for sterilisation, particularly as the option of issuing central bank securities is not permissible under the RBI Act, the Working Group on Instruments of Sterilisation (2004) recommended that the central government issue a special variety of bills/bonds for sterilisation purposes. Unlike in the case of central bank securities, where the cost of sterilisation is borne indirectly by the fisc, the cost of issuance of such instruments by the government would be directly and transparently borne by the fisc. The Committee recommended that to operationalise such a new instrument of sterilisation and ensure fiscal transparency, the central government consider setting up a Market Stabilisation Fund (MSF) to be created in the Public Account. This Fund could issue new instruments called Market Stabilisation Bills/Bonds (MSBs) for mopping up enduring surplus liquidity from the system over and above the amount that could be absorbed under the day-to-day repo operations of the LAF.
Based on the above recommendation, a new instrument named the Market Stabilisation Scheme (MSS) has been made operational from April 2004. Under this scheme, which is meant exclusively for sterilisation purposes, the Reserve Bank has been empowered to issue government Treasury bills and medium-duration dated securities for the purpose of liquidity absorption. The scheme works by impounding the proceeds of auctions of Treasury bill and government securities in a separate identifiable MSS cash account maintained and operated by the RBI. The amounts credited into the MSS cash account are appropriated only for the purpose of redemption and/or buyback of the Treasury bills and/or dated securities issued under the MSS. MSS securities are indistinguishable from normal Treasury bills and government dated securities in the hands of the lender. The payments for interest and discount on MSS securities are not made from the MSS account, but shown in the Union budget and other related documents transparently as distinct components under separate subheads. The introduction of MSS has succeeded broadly in restoring the LAF to its intended function of daily liquidity management.
Since its introduction in April 2004, the MSS has served as a very useful instrument for medium-term monetary and liquidity management. It has been unwound at times of low capital flows and built up when excess capital flows could lead to excess domestic liquidity (Mohan (2006)).
MSS balances In billions of rupees
2004/05 2005/06 2006/07 2007/08
Interest payments 20.6 34.2 26.1 83.5
Outstanding amount 642.1 290.6 629.7 1,683.9
MSS outstanding balance as of 11 July 2008 was Rs. 1,714.8 billion.
Source: Union Finance Accounts; Union Budget Documents; Reserve Bank of India.

BIS Papers No 44 249
The market-based operations led to a progressive reduction in the quantum of securities with the Reserve Bank. This apart, as per those operations, the usage of the entire stock of securities for outright open market sales was constrained by the allocation of a part of the securities for day-to-day LAF operations as well as for investments of surplus balances of the central government, besides investments by the state governments in respect of earmarked funds (CSF/GRF) while some of the government securities were also in non-marketable lots. In the face of large capital flows coupled with a declining stock of government securities, the Reserve Bank introduced a new instrument of sterilisation, the Market Stabilisation Scheme (MSS) to sustain market operations (Box 1). Since its introduction in April 2004, the MSS has served as a very useful instrument for medium-term monetary and liquidity management.
In addition to various market-based instruments of sterilisation, such as the LAF, OMOs, the MSS, balances of the Government of India with the Reserve Bank, forex swaps and private placements for prepayment of external loans, the RBI has also had recourse to increasing the cash reserve ratio for banks to withdraw excess liquidity from the system. In recognition of the cumulative and lagged effects of monetary policy, pre-emptive monetary tightening measures have also been put in effect since September 2004 and continued during 2006/07, 2007/08 and 2008/09, in part to manage monetary effects of excess capital flows. Since September 2004, the repo rate and the reverse repo rate have been increased by 250 and 150 basis points, respectively, while the cash reserve ratio (CRR) has been raised by 400 basis points. In the context of large capital inflows and implications for liquidity and monetary management, the interest rate ceilings on various non-resident deposit schemes have been reduced by 75–100 basis points since January 2007 to discourage greater inflows into these accounts.
Cost of sterilisation In the choice of instruments for sterilisation, it is important to recognise the benefits and costs of sterilisation in general and the relative costs/benefits in the usage of a particular instrument. The various instruments differ in their impact on the balance sheets of the central bank, the government and the financial sector. For example, in the case of OMO sales, the differential between the yield on government securities and return on foreign exchange assets is the cost to the Reserve Bank. Sales of government securities under OMOs also involve a transfer of market risks to the financial intermediaries, mostly banks. The repo operations under the LAF have a direct cost to the Reserve Bank. In the context of an increase in the CRR, the cost is borne by the banking sector if CRR balances are not remunerated. However, if they are, the cost could be shared between the banking sector and the Reserve Bank. The extent of capital flows to be sterilised and the choice of instruments thus also depend upon the impact on the balance sheets of these entities.
The cost of sterilisation in India is shared by the central government (the cost of the MSS), the Reserve Bank (sterilisation under the LAF) and the banking system (in the case of an increase in the reserve requirements). Since surpluses of the Reserve Bank are transferred to the central government, on a combined balance sheet basis, the relative burdens of cost between the government and Reserve Bank are not of great relevance. However, the direct cost borne by the government is transparently shown in its budget accounts. Owing to the difference between international and Indian interest rates, there is a positive cost of sterilisation, but the cost has to be traded off against the benefits associated with market stability, export competitiveness and possible crisis avoidance in the external sector. Sterilised interventions and interest rate policy are generally consistent with the overall monetary policy stance that is primarily framed on the basis of the domestic macroeconomic outlook.
III.3 Capital account liberalisation It is interesting to note that a number of empirical studies do not find evidence that greater openness and higher capital flows lead to higher growth (eg Prasad et al (2007)). These authors find that there is a positive correlation between current account balances and growth

250 BIS Papers No 44
among non-industrial countries, implying that a reduced reliance on foreign capital is associated with higher growth. Alternative specifications do not find any evidence of an increase in foreign capital inflows directly boosting growth. The results could be attributable to the fact that even successful developing countries have limited absorptive capacity for foreign resources, either because their financial markets are underdeveloped, or because their economies are prone to overvaluation caused by rapid capital inflows. Thus, a cautious approach to capital account liberalisation would be useful for macroeconomic and financial stability (Mohan (2008)).
Henry (2007) argues that the empirical methodology of most of the existing studies is flawed since they attempt to look for permanent effects of capital account liberalisation on growth, whereas the theory posits only a temporary impact on the growth rate. Once such a distinction is recognised, empirical evidence suggests that opening the capital account within a given country consistently generates economically large and statistically significant effects, not only on economic growth, but also on the cost of capital and investment. The beneficial impact is, however, dependent upon the approach to the opening of the capital account, in particular the policies in regard to liberalisation of debt and equity flows. Recent research demonstrates that liberalisation of debt flows – particularly short-term, dollar-denominated debt flows – may cause problems. On the other hand, the evidence indicates that countries derive substantial benefits from opening their equity markets to foreign investors.
India has cautiously opened up its capital account since the early 1990s as policymakers realised that to meet the country’s huge investment needs domestic savings needed to be supplemented with foreign savings. However, in liberalising its capital account, India has adopted a discriminatory approach towards various forms of capital flows. The Ministry of Finance, in its review of the trends in receipts and expenditures at the end of the second quarter of the financial year 2007/08, mentioned that FDI is the most preferred form of foreign capital flow. Investments in Indian firms through the stock market and by venture capital firms in unlisted companies are also potentially beneficial. External commercial borrowings and other short-term flows are areas where one can introduce an element of control to moderate sudden surges. Accordingly, the thrust of policy reform in India was in favour of a compositional shift in capital flows away from debt to non-debt-creating flows, viz FDI and foreign portfolio investment; strict regulation of ECBs, especially short-term debt; discouraging the volatile element of flows from NRIs; and gradual liberalisation of outflows. The present status of the various policy measures taken in India to manage the capital account is given at Annexes 1A and 1B.
India has followed a gradualist approach to liberalisation of its capital account. The status of capital account convertibility in India for various non-residents is as follows: for foreign corporate and financial institutions, there is a substantial degree of convertibility; for (NRIs) there is an approximately equal degree of convertibility, but accompanied by some procedural and regulatory impediments. For non-resident individuals other than NRIs there is near-zero convertibility. Movement towards fuller capital account convertibility (FCAC) implies that all non-residents (corporate and individuals) should be treated equally. As mentioned earlier, recognising the merits in moving towards fuller capital account convertibility, the Reserve Bank, in consultation with the government, appointed the Committee on Fuller Capital Account Convertibility in March 2006. The Committee has set out the preconditions for moving towards FCAC. The Committee has made several recommendations on the development of financial markets in addition to addressing issues related to interaction of monetary policy and exchange rate management, regulation/supervision of banks and the timing and sequencing of capital account liberalisation measures. Measures towards FCAC as recommended by the Committee are provided at Annex 2.
Accordingly, the Reserve Bank has implemented a number of measures, eg raising the limit on remittances, liberalisation of Exchange Earners' Foreign Currency Accounts, liberalisation of procedures for project and service exports, raising the limit on banks' overseas

BIS Papers No 44 251
borrowings, increasing the access to ECBs, establishment of corporate offices abroad, allowing increased FII investment in government securities, raising the ceiling on mutual funds’ overseas investment, and liberalisation of forward contract regulations, etc based on the recommendations made by the Committee.
In view of the large capital flows during the last few years, the government and the Reserve Bank have recently taken some additional capital account measures aimed at limiting the implications of forex flows for the conduct of domestic monetary policy. In February 2003, the government prepaid part of its high-cost external debt amounting to $3.03 billion to the Asian Development Bank and the World Bank by privately placing marketable securities with the Reserve Bank. This apart, relaxations were effected in regard to outflows, under both the current and capital accounts (Box 2). At the same time measures were taken to manage debt inflows, especially ECBs and NRI deposits.
Box 2
Recent measures towards liberalisation of capital outflows from India
• Investments in overseas joint ventures (JV) / wholly owned subsidiaries (WOS) by Indian companies have been permitted up to 400% of the net worth of the Indian company under the Automatic Route.
• Indian companies have been allowed to invest in energy and natural resources sectors such as oil, gas, coal and mineral ores in excess of the current limits with the prior approval of the Reserve Bank.
• Listed Indian companies have been allowed to undertake portfolio investment abroad up to 50% of the net worth (up from the earlier limit of 35%).
• The earlier limit for prepayment of ECBs without Reserve Bank approval has been increased from $400 million to $500 million, subject to compliance with the minimum average maturity period as applicable to the loan.
• The aggregate ceiling for overseas investments by mutual funds registered with SEBI has been increased from $5 billion to $7 billion.
• The earlier limit under the Liberalised Remittance Scheme (LRS) has been raised from $100,000 to $200,000 per financial year.
In addition, changes in policies are made from time to time to modulate debt-creating capital flows depending on the financing needs of the corporate sector and the vulnerability of the domestic economy to external shocks. Recently, to facilitate easy access by Indian corporates to foreign funds, the Reserve Bank has increased the limit on ECBs for rupee expenditure for permissible end uses under the Approval Route to $100 million for borrowers in the infrastructure sector and $50 million for other borrowers from the earlier limit of $20 million per financial year, with effect from 29 May 2008. The all-in-cost interest rate ceiling for ECBs and trade credits for imports into India have been raised. Effective 2 June 2008, entities in the services sector, viz hotels, hospitals and software companies, are allowed to avail themselves of ECBs up to $100 million per financial year, for the purpose of importing capital goods under the Approval Route. The limits on FII investment in the Indian debt market have been revised upwards from $4.7 billion ($3.2 billion in government securities and $1.5 billion in corporate bonds) to $8.0 billion ($5.0 billion and $3.0 billion respectively).

252 BIS Papers No 44
IV. Issues and challenges
The management of capital flows is a complex process encompassing a spectrum of policy choices, which inter alia include the appropriate level of reserves, monetary policy objectives related to liquidity management, and the maintenance of healthy financial market conditions with financial stability. The intensified pressures due to large and volatile capital flows in the recent period in an atmosphere of global uncertainties make the task significantly more complex and critical (Reddy (2008b)). India’s Finance Minister, referring to “Managing Capital Flows” in the Mid-Year Review of 2007/08 dated 7 December 2007 stated that: “While there are international experiences in this regard with some successful and painful adjustment process, the specific Indian context requires innovative policy responses. Going forward, this would be a major challenge”.
In view of the above, some of the major issues as well as emerging challenges in respect of management of capital flows to India include the following:
• In the face of large and volatile capital flows, the problem for monetary management is twofold. First, it has to distinguish implicitly between durable flows and transient flows. If capital flows are deemed to be durable and indefinite, questions arise regarding foreign exchange management. If the flows are deemed to be semi-durable, essentially reflecting the business cycle, the task of monetary and liquidity management is to smooth out their impact on the domestic economy, finding means to absorb liquidity in times of surplus and to inject it in times of deficit. Second, in the short term, daily, weekly or monthly volatility in flows needs to be smoothed to minimise the effect on domestic overnight interest rates. In practice, ex ante, it is difficult to distinguish what is durable, what is semi-durable and what is transient. Hence policy and practice effectively operate in an environment of uncertainty and a variety of instruments have to be used to manage liquidity in this fluid scenario.
• The challenges for monetary policy with an open capital account are exacerbated if domestic inflation rises. In the event of demand pressures building up, increases in interest rates might be advocated to sustain growth in a non-inflationary manner, but such action increases the possibility of further capital inflows if a significant part of these flows is interest sensitive and explicit policies to moderate flows are not undertaken. These flows could potentially reduce the efficacy of monetary policy tightening by enhancing liquidity. Such dilemmas complicate the conduct of monetary policy in India if inflation exceeds the indicative projections. During 2006/07, 2007/08 and 2008/09 so far, as domestic interest rates in India hardened on the back of withdrawal of monetary accommodation, external foreign currency borrowings by domestic corporates witnessed a significant jump, leading to even higher flows. Where there are no restrictions on overseas borrowings by banks and financial institutions, such entities could also annul the efforts of domestic monetary tightening.
• As far as the exchange rate is concerned, the large inflow of remittances and major and sustained growth in software exports coupled with capital inflows have the potential for possible overvaluation of the currency and the resultant erosion of long-term competitiveness of other traditional and goods sectors – a problem popularly known as Dutch disease. Given the fact that more people are in the goods sector, the human aspects of exchange rate management should not be lost sight of. The Dutch disease syndrome has so far been managed by way of reserves build-up and sterilisation, the former preventing excessive nominal appreciation and the latter preventing higher inflation. However, the issue remains how long and to what extent such an exchange rate management strategy would work given the fact that India is faced with large and continuing capital flows apart from strengthening current receipts on account of remittances and software exports. This issue has assumed increased importance over the last year with increased capital flows arising from the

BIS Papers No 44 253
higher sustained growth performance and significant enhancement of international confidence in the Indian economy (Mohan (2007a)).
• A related issue is whether there should be sterilised intervention and if so, the timing and quantum of such interventions. There is usually a cost attached to sterilisation operations. At the same time, it is also necessary to assess the indirect cost of not sterilising if there are signs of a Dutch disease caused by flows in the capital account. Most often, it is not a question of whether to sterilise or not, but how much to sterilise. That is an important issue of judgment that needs to be made in conjunction with domestic monetary and liquidity conditions.
• Even when capital flows are sterilised through open market operations, the costs could be large when sterilisation operations raise domestic interest rates and result in the trap of even greater capital flows. The fiscal impact of sterilisation also needs to be factored in, especially when a large stock of securities has to be issued for the purpose.
• Another issue relates to the choice and an appropriate mix of instruments for sterilisation. Each of the instruments (MSS, LAF and CRR) has different features and interactions. Utilisation of each of these will also depend on the permanency of the components of the flows and how they should be sterilised in the aggregate. Further, each instrument can be used in different ways. The LAF is able to take care of very short-period flows. The MSS handles the longer-term flows slightly better than the LAF, and the CRR is more appropriate for addressing fairly long-term flows. However, the effectiveness of the MSS will depend more on the initiatives of the market participants than on the decisions of the Reserve Bank. Operationally, the issue is often not which instrument but how much each instrument needs to be utilised, with due regard to the capital flows, market conditions and monetary as well as credit developments.
• While interventions are carried out with the objective of containing volatility in the forex market, intervention over a long period, especially when the exchange rate is moving in one direction, could make interventions less effective. However, a critical question is what would be the impact on expectations about future movements in forex markets if no intervention takes place. The challenges of intervention and management of expectations will be particularly daunting when financial contagion occurs, since such events are characterised by suddenness, high speed and large magnitudes of unexpected flows, in either direction. The quintessence for a relevant monetary policy is the speed of adjustment of the policy measures to rapidly changing situations.
• A further challenge for policy in the context of fuller capital account openness will be to preserve the financial stability of the system as further deregulation of capital outflows and debt inflows proceeds. This will require market development, enhancement of regulatory capacity in these areas, as well as human resource development in both financial intermediaries and non-financial entities.
• Another aspect of greater capital market openness concerns the presence of foreign banks in India. With fuller capital account convertibility and a greater presence of foreign banks over time, a number of issues will arise. First, if these large global banks have emerged as a result of real economies of scale and scope, how will smaller national banks compete in countries like India, and will they themselves need to generate a larger international presence? Second, there is considerable discussion today on overlaps and potential conflicts between home country regulators of foreign banks and host country regulators: how will these be addressed and resolved in the years to come? Third, given that operations in one country such as India are typically small relative to the global operations of these large banks, the attention of top management devoted to any particular country is typically low.

254 BIS Papers No 44
Consequently, any market or regulatory transgressions committed in one country by such a bank, which may have a significant impact on the banking or financial market of that country, are likely to have a negligible impact on the bank's global operations. It has been seen in recent years that even relatively strong regulatory action taken by regulators against such global banks has had a negligible market or reputational impact on them in terms of their stock price or similar metrics. Thus, there is a loss of regulatory effectiveness as a result of the presence of such financial conglomerates. Hence, there is inevitably a tension between the benefits that such global conglomerates bring and some regulatory and market structure and competition issues that may arise.
V. Outlook
Recent global developments have considerably heightened the uncertainty surrounding the outlook for capital flows to India, complicating the conduct of monetary policy and liquidity management. In view of the strong fundamentals of the economy and massive injections of liquidity by central banks in advanced economies, there could be sustained inflows, as in the recent past. If the pressures intensify, it may necessitate stepped-up operations in terms of capital account management and more active liquidity management with all instruments at the command of the Reserve Bank. At the same time, it is necessary in the context of recent global events not to exclude the possibility of reversals of capital flows due to abrupt changes in sentiment or global liquidity conditions. In this scenario, it is important to be ready to deal with potentially large and volatile outflows along with spillovers. In this context, there is room for manoeuvre for the Reserve Bank to deal with both scenarios in terms of the flexibility in the deployment of instruments such as the MSS, CRR, SLR and LAF for active liquidity management in both directions, complemented by prudential regulations and instruments for capital account management.

BIS Papers No 44 255
Annex 1A: Measures to manage capital inflows
Current regulations
Foreign direct investment
FDI is permitted under the Automatic Route in items/activities in all sectors up to the sectoral caps except in certain sectors where investment is prohibited. Investments not permitted under the Automatic Route require approval from the Foreign Investment Promotion Board (FIPB). The receipt of remittance has to be reported to the RBI within 30 days from the date of receipt of funds and the issue of shares has to be reported to the RBI within 30 days from the date of issue by the investee company.
Advance against equity An Indian company issuing shares to a person resident outside India can receive such amount in advance. The amount received has to be reported within 30 days from the date of receipt of funds There is no provision on allotment of shares within a specified time. The banks can refund the amount received as advance, provided they are satisfied with the bona fides of the applicant and are satisfied that no part of remittance represents interest on the funds received.
Foreign portfolio investment: FIIs
Investment by non-residents is permitted under the Portfolio Investment Scheme to entities registered as FIIs and their sub-accounts under SEBI (FII) regulations. Investment by individual FIIs is subject to a ceiling of 10% of the PUC of the company and aggregate FII investment is subject to a limit of 24% of PUC of the company. This limit can be increased by the company subject to the sectoral limit permitted under the FDI policy.
The transactions are subject to daily reporting by designated ADs to the RBI for the purpose of monitoring adherence to the ceiling for aggregate investments.
Foreign portfolio investment: NRIs
Investment by NRIs under the Portfolio Investment Scheme is restricted to 5% by individual NRIs/OCBs and 10% in aggregate (which can be increased to 24% by the company concerned).
Issue of ADRs/GDRs Indian companies are allowed to raise resources through issue of ADRs/GDRs and the eligibility of the issuer company is aligned with the requirements under the FDI policy.
The issue of Sponsored ADRs/GDRs requires prior approval of the Ministry of Finance.
A limited Two-way Fungibility scheme has been put in place by the government for ADRs/GDRs. Under this Scheme, a stock broker in India registered with SEBI can purchase shares of an Indian company from the market for conversion into ADRs/GDRs based on instructions received from overseas investors. Reissuance of ADRs/GDRs would be permitted to the extent of ADRs/GDRs which have been redeemed into underlying shares and sold in the Indian market.
Investment in mutual funds
FIIs and NRIs are allowed to invest in units of mutual funds without any limit.

256 BIS Papers No 44
Current regulations (cont)
Investments in government securities and T-bills
FIIs are eligible to invest in these instruments within an overall limit of $5 billion.
NRIs are allowed to invest in these instruments without any limit (on both a repatriation and non-repatriation basis).
Multilateral institutions which have been allowed to float rupee bonds can invest in these instruments.
Investment in corporate debt
FIIs are permitted to invest in corporate debt within an overall limit of $3 billion.
Investment in commercial paper (CP)
FIIs are allowed to invest in CP subject to the limit applicable to corporate debt.
NRIs are allowed to invest in CP on a non-repatriation basis.
Investments in Upper Tier II instruments by Indian banks
Investment by FIIs in Upper Tier II instruments raised in Indian rupees is allowed subject to a separate ceiling of $500 million.
Investment in other debt instruments
NRIs are allowed to invest in non-convertible debentures floated by Indian companies by way of a public issue. There is no limit on investment by NRIs in these instruments.
Foreign venture capital investors (FVCIs)
FVCIs registered with SEBI are allowed to invest in units of venture capital funds without any limit.
FVCI investment in equity of Indian venture capital undertakings is also allowed. The limit for such investments would be based on the sectoral limits under the FDI policy.
FVCIs are also allowed to invest in debt instruments floated by the IVCUs. There is no separate limit stipulated for investment in such instruments by FVCIs.
External commercial borrowings (ECBs)
Under the Automatic Route, ECBs up to $500 million per borrowing company per financial year are permitted only for foreign currency expenditure for permissible end uses.
Borrowers in the infrastructure sector may undertake ECBs up to $100 million for rupee expenditure for permissible end uses under the Approval Route. In case of other borrowers, the limit for rupee expenditure for permissible end uses under the Approval Route has been raised to $50 million from the earlier limit of $20 million.
Entities in the services sector, viz hotels, hospitals and software companies, have been allowed to undertake ECB up to $100 million per financial year for the purpose of importing capital goods under the Approval Route.
The all-in-cost interest ceiling for borrowings with maturity of three to five years has been increased from 150 basis points to 200 basis points over six-month Libor. Similarly, the interest ceiling for loans maturing after five years has been raised to 350 basis points from 250 basis points over six-month Libor.

BIS Papers No 44 257
Current regulations (cont)
Trade credit Import linked short-term loans (trade credit) up to $20 million per import transaction for all permissible imports with a maturity of one year is allowed under the Automatic Route. Trade credit up to $20 million per import transaction with maturity of less than three years is allowed for import of capital goods under the Automatic Route.
Delayed import payments
In case of delayed import payments due to disputes or financial difficulties, ADs can remit the amount subject to an all-in-cost ceiling of Libor plus 50 basis points for a period up to one year and Libor plus 125 basis points for periods of less than three years. However, interest payment for delayed payment of trade credit can be made for periods of less than three years.
Export advance Export advance can be obtained for 12 months. The rate of interest for export advance up to one year is Libor plus 100 basis points.
Bank borrowing overseas
Restricted to 25% of Tier I or $10 million, whichever is higher. Borrowings for export finance and subordinated debt are outside this ceiling.
Investments by NRIs in immoveable property
NRIs are permitted to freely acquire immoveable property (other than agricultural land, plantations and farmhouses). There are no restrictions regarding the number of such properties to be acquired. The only restriction is that where the property is acquired out of inward remittances, the repatriation is restricted to the principal amount for two residential properties. [There is no such restriction in respect of commercial property.]
NRIs are also permitted to obtain housing loans for acquiring property in India and repayment of such loans by close relatives is also permitted.

258 BIS Papers No 44
Annex 1B: Measures to manage capital outflows
Current regulations
Direct investment overseas by corporates and registered partnerships
Allowed up to 400% of the net worth under the Automatic Route.
With a view to providing greater flexibility to Indian parties for investment abroad, it has been decided to allow Indian companies to invest in excess of 400% of their net worth, as on the date of the last audited balance sheet, in the energy and natural resources sectors such as oil, gas, coal and mineral ores with the prior approval of the Reserve Bank.
AD Category I banks may allow remittance up to 400% of the net worth of the Indian entities to invest in overseas unincorporated entities in the oil sector after ensuring that the proposal has been approved by the competent authority and is duly supported by a certified copy of the Board Resolution approving such investment.
Direct investment overseas by exporter proprietorships
Specific approval subject to conditions.
Portfolio investment by Indian listed companies
Allowed up to 50% of the net worth in listed shares and rated and listed debt instruments.
Individuals
(i) LRS Foreign security acquisition
(i) $200,000 for permissible capital and current accounts during a financial year.
(ii) Qualification shares (ii) 1% of share capital with remittance restricted to $20000.
(iii) Shares of JV/WOS abroad by director of Indian employee/ parent (software only)
(iii) $10,000 per employee in block of five years.
(iv) ADR/GDR of Indian company in knowledge based sector by employees/working directors
(iv) $50,000 in block of five years.
(v) ESOP, inheritance (v) Permitted.
Domestic mutual funds in various overseas instruments
Mutual funds can now invest overseas up to $7 billion in a wide range of instruments.

BIS Papers No 44 259
Current regulations (cont)
Venture capital funds in venture capital undertakings
$500 million.
ECBs Prepayment of ECBs up to $500 million can be allowed by AD Category I banks without prior approval of the Reserve Bank subject to compliance with the minimum average maturity period as applicable to the loan.
Lending by Indian subsidiary to overseas parent
Case by case.
Bank lending overseas subsidiaries of Indian companies
Restricted to 20% of net worth and to JV/WOS of Indian companies with at least 51% Indian shareholding.

260 BIS Papers No 44
Annex 2: Measures towards fuller capital
account convertibility
Recommendations by Tarapore Committee (2006)
(i) The Committee recommends that the overall ECB ceiling as also the ceiling for automatic approval should be gradually raised. Rupee denominated ECB (payable in foreign currency) should be outside the ECB ceiling.
(ii) The Committee has concerns about the volume of trade credit as there could be sudden changes in the availability of such credit. Furthermore, there are concerns as to whether the trade credit numbers are fully captured in the data even while noting that suppliers’ credit of less than 180 days are excluded from these data. Import-linked short-term loans should be monitored in a comprehensive manner. The per transaction limit of $20 million should be reviewed and the scheme revamped to avoid unlimited borrowing.
(iii) Recognising that Indian industry is successfully building up its presence abroad, there is a strong case for liberalising the present limits for corporate investment abroad. The Committee recommends that the limits for such outflows should be raised in phases from 200% of net worth to 400% of net worth. Furthermore, for non-corporate businesses, it is recommended that the limits should be aligned with those for corporates.
(iv) EEFC Account holders should be provided foreign currency current/savings accounts with cheque writing facility and interest bearing term deposits.
(v) Project exports should be provided greater flexibility and these facilities should be also provided for service exports.
(vi) FIIs should be prohibited from investing fresh money raised through PNs. Existing PN-holders may be provided an exit route and phased out completely within one year.
(vii) The Committee recommends that non-resident corporates should be allowed to invest in the Indian stock markets through SEBI-registered entities including mutual funds and Portfolio Management Schemes who will be individually responsible for fulfilling Know your Customer (KYC) and Financial Action Task Force (FATF) norms. The money should come through bank accounts in India.
(viii) At present, only multilateral institutions are allowed to raise rupee bonds in India. To encourage, selectively, the raising of rupee denominated bonds, the Committee recommends that other institutions/corporates should be allowed to raise rupee bonds (with an option to convert into foreign exchange) subject to an overall ceiling which should be gradually raised.
(ix) The banks’ borrowing facilities are at present restrictive though there are various special facilities which are outside the ceiling. The Committee recommends that the limits for borrowing overseas should be linked to paid-up capital and free reserves, and not to unimpaired Tier I capital, as at present, and raised gradually to 100% by 2010/11. Ultimately, all types of external liabilities of banks should be within an overall limit.

BIS Papers No 44 261
(x) At present, only mutual funds are permitted to invest overseas subject to stipulations for each fund. The Committee recommends that the various stipulations on individual fund limits and the proportion in relation to NAV should be abolished. The overall ceilings should be raised from the present level of $2 billion to $3 billion in Phase I (2006/07), to $4 billion in Phase II (by 2008/09) and to $5 billion in Phase III (by 2010/11). The Committee further recommends that these facilities should be available, apart from Mutual Funds, to SEBI registered portfolio management schemes.
(xi) The present facility for individuals to freely remit $25,000 per calendar year enables individuals to open foreign currency accounts overseas. The Committee recommends that this annual limit be successively raised to $50,000 in Phase I, $100,000 in Phase II and $200,000 in Phase III. Difficulties in operating this scheme should be reviewed. Since this facility straddles the current and capital accounts, the Committee recommends that where current account transactions are restricted, ie gifts, donations and travel, these should be raised to an overall ceiling of $25,000 without any sub-limit.
(xii) At present only NRIs are allowed to maintain FCNR(B) and NR(E)RA deposits. The Committee recommends that non-residents (other than NRIs) should also be allowed access to these deposit schemes. Since NRIs enjoy tax concessions on FCNR(B) and NR(E)RA deposits, it would be necessary to provide FCNR(B)/NR(E)RA deposit facilities as separate and distinct schemes for non-residents (other than NRIs) without tax benefits. In Phase I, the NRs (other than NRIs) could be first provided the FCNR(B) deposit facility, without tax benefits, subject to KYC/FATF norms. In Phase II, the NR(E)RA deposit scheme, with cheque writing facility, could be provided to NRs (other than NRIs) without tax benefits after the system has in place KYC/FATF norms. The present tax regulations on FCNR(B) and NR(E)RA deposits for NRIs should be reviewed by the government.
(xiii) At present, only NRIs are allowed to invest in companies on the Indian stock exchanges subject to certain stipulations. The Committee recommends that all individual non-residents should be allowed to invest in the Indian stock market through SEBI registered entities including mutual funds and Portfolio Management Schemes who will be responsible for meeting KYC and FATF norms and that the money should come through bank accounts in India.

262 BIS Papers No 44
References
Bank for International Settlements (2007): Triennial Central Bank Survey of Foreign Exchange and Derivatives Market Activity.
Government of India (1993): High Level Committee on Balance of Payments (Chairman: C Rangarajan), Ministry of Finance.
——— (2007): Mid-Year Review 2007/08.
Henry, P B (2007): “Capital account liberalization: theory, evidence, and speculation”, Journal of Economic Literature, Vol. XLV, December.
Mohan, Rakesh (2005): “Some apparent puzzles for contemporary monetary policy”, paper presented at the Conference on China’s and India’s Changing Economic Structures: Domestic and Regional Implications, Beijing, China, RBI Bulletin, December.
——— (2006): “Monetary policy and exchange rate frameworks: the Indian experience”, paper presented at the Second High Level Seminar on Asian Financial Integration organised by the International Monetary Fund and Monetary Authority of Singapore, Singapore, 25 May, RBI Bulletin.
——— (2007a): “Capital account liberalization and conduct of monetary policy: the Indian experience”, paper presented at an International Monetary Seminar organised by Banque de France on Globalisation, Inflation and Financial Markets, Paris, 14 June.
——— (2007b): “Monetary management in emerging market economies: concerns and dilemmas”, comments made at Policy Panel at the NBER Conference on International Dimensions of Monetary Policy, S’Agaro, Catalino, Spain, 12 June.
——— (2008): “The growth record of the Indian economy, 1950-2008: a story of sustained savings and investment”, keynote address at the Conference on “Growth and Macroeconomic Issues and Challenges in India” organised by the Institute of Economic Growth, New Delhi, 14 February.
Prasad, E S, R G Rajan and A Subramanian (2007): “Foreign capital and economic growth”, Brookings Papers on Economic Activity, 1.
Reddy, Y V (2005): “Overcoming challenges in a globalising economy: managing India’s external sector”, lecture delivered at the Indian Programme of The Foreign Policy Centre, London, 23 June.
——— (2007): “Monetary policy developments in India – an overview”, address at Sveriges Riksbank, Stockholm, 7 September.
——— (2008a): “Financial globalisation, growth and stability: an Indian perspective”, lecture delivered at the International Symposium of the Banque de France on Globalisation, Inflation and Monetary Policy, Paris, 7 March.
——— (2008b): “Management of the capital account in India: some perspectives”, inaugural address delivered at the Annual Conference of the Indian Econometric Society, Hyderabad, 3 January.
Reserve Bank of India (1997): Report of the Committee on Capital Account Convertibility (Chairman: S S Tarapore).
——— (2004): Report of the Working Group on Instruments of Sterilisation (Chairman: Smt Usha Thorat).

BIS Papers No 44 263
——— (2007a): Annual Report for 2006-07.
——— (2007b): Handbook of Statistics on the Indian Economy, 2006-07.
——— (2006): Report of the Committee on Fuller Capital Account Convertibility (Chairman: S S Tarapore).
——— (2008): Annual Policy Statement for the Year 2008-09.


BIS Papers No 44 265
Capital flows in Indonesia: challenges and policy responses
Miranda S Goeltom1
1. Introduction
Experience across many different countries indicates that international financial liberalisation not only offers benefits but also poses risks (McLean and Shrestha (2002)). Financial liberalisation will stimulate foreign capital inflows of benefit in stabilising consumption levels and funding productive investment. Foreign capital, and especially foreign direct investment, also facilitates transfer of technology and managerial knowledge. Portfolio investment and offshore borrowing can contribute to the growth of the domestic financial market. Studies have found that, provided there is legal certainty, capital inflows can improve macroeconomic policy discipline (Grilli and Milesi-Ferretti (1995)).
Besides the benefits, financial liberalisation also involves risks. Capital inflows can put upward pressure on the recipient country’s currency, which will in turn adversely affect the trade balance. High-volume capital inflows can lead to rapid consumption growth, triggering a rise in inflation and the likelihood of a persistent current account deficit. Liberalisation of capital flows in a country with an inadequately developed financial system can render that country more vulnerable to crisis. For instance, credit expansion funded by foreign capital can put pressure on bank balance sheets in the event of exchange rate turmoil, exacerbating the fragility of the financial system (Calvo et al (1993)).
The past few years have seen intensified debates on the advantages of liberalising capital flows, particularly since the round of balance of payments crises among developing countries during the 1990s. The financial and economic crises in Mexico and Asia, and of course the 1997–98 crisis in Indonesia, demonstrate that even a country with high economic growth and sound macroeconomic policies still faces the risk of rapid capital outflows. This paper describes Indonesia’s experience in managing capital flows before, during and after the nation’s economic crisis.
2. Development and impact of capital flows
2.1 Development of capital flows Over the last three decades, in line with a greater degree of economic openness, the Indonesian economy has expanded impressively. Against this propitious backdrop, average annual economic growth from 1981 to 2007 reached 5.5%. This growth rate, however, falls below growth during the pre-crisis period, which averaged 6.7%. Improved macroeconomic stability was also evidenced by relatively controlled inflation, except during the crisis in 1997–98 and in 2005 due to the reduction in fuel subsidies. Meanwhile, several external sector indicators demonstrated similar tendencies, such as: growth of the current account,
1 Senior Deputy Governor of Bank Indonesia and Professor of Economics, University of Indonesia. The author
would like to thank Solikin M Juhro and A V Hardiyanto for stimulating discussions, estimations and their valuable assistance in drafting this paper.

266 BIS Papers No 44
which ran a surplus during the last decade; the debt service ratio, which dropped below 20%; the threefold increase in international reserves over the past decade; and the competitive real exchange rate.
Satisfactory external sector performance is evident from the agreeable developments in Indonesia’s balance of payments structure over the past decade. Principally from 1998, the current account began to run a surplus, while the capital and financial account experienced excessive outflows during the economic crisis. The positive trends that supported the overall balance surplus continued up to 2007. This success was partially attributable to the government’s role in actively supporting non-oil/gas exports by promulgating several conducive policies, but also due in part to the soaring global oil price that quickly boosted foreign exchange revenues stemming from the oil sector.
Indeed, the financial account in Indonesia has not always generated a surplus. From 1980 to 1996, the financial account ran a surplus, with an average of USD 4,886 million per year. However, from 1997 until 2003, the financial account recorded an average annual deficit of USD 5,017 million. There are many causal factors for this. First, waning government capital inflows, primarily due to less foreign grants for projects, both bilateral and multilateral. For instance in 2000, grants from the ADB, the IBRD and Japan fell 59% to USD 1.6 billion. In addition, food assistance decreased by 73% to a value of USD 73 million, which further exacerbated the shrinking government net capital inflow surplus.
Graph 1
Net capital flows In millions of US dollars
Source: Bank Indonesia.
Second, ebbing private capital inflows, mainly due to the increased servicing of private foreign debt (outflows), typically from the banking sector. This included capital outflow with its apogee during the economic crisis period of 1997–98, which compounded the deficit of private capital flows (Graph 1).
The capital flows phenomenon has thus become an important issue requiring further observation, especially in the context of and given the relevance of government endeavours to promote sustainable economic activities. In terms of the players, up to the early 1980s, capital inflows to Indonesia were dominated by government capital because at that time the government had a domineering influence in economic development. Besides, the domestic
–15,000
–10,000
–5,000
0
5,000
10,000
15,000
1980 1983 1986 1989 1992 1995 1998 2001 2004 2007
Government Private sector

BIS Papers No 44 267
financial market was underdeveloped, so did not attract the domestic private sector or foreign private sector to participate. In 1990, as a result of the financial reform programme and supported by the expanding role of the private sector in the economy, private capital began to dominate capital flows to Indonesia. Noteworthy growth has been reported over the last six years since the crisis, with a significant upsurge in net private capital flows (eg portfolio investment, foreign debt) being recorded, peaking at USD 8,247 million in 2007. Meanwhile, foreign direct investment (FDI) recommenced in 2004 after a downturn during the 1997–98 economic crisis (Graph 2).
Graph 2
Composition of net capital flows In millions of US dollars
Source: Bank Indonesia.
On the inflow side, the dominance of other investment inflows (external debt, loan repayment, etc, from both the private and the public sector) in the 1990s was somewhat eroded by FDI and portfolio investment flows after 2005 (Graph 3). Post-crisis portfolio investment inflow was initially recorded in 2002. Although FDI inflows started to grow in 2004 and remained more or less on a positive trend, capital inflows are still dominated by portfolio (and other) investment flows. Meanwhile, gross capital outflows seemed to be improperly recorded until 2004. In this regard, as shown in Graph 4, capital outflows were mainly attributed to transactions in other investment assets (records of external debt transactions from the corporate and banking sectors). Sharp deficits in other investment assets in 2005 (USD 10.4 billion) were due to increased asset holdings (currency and deposits) by the private sector in foreign countries, particularly in the second and third quarters of 2005. Similar movements have been recorded recently, in July–August 2007, with other private sector investment assets increasing from USD 486 million (end-September 2006) to USD 2.6 billion (end-September 2007). An increase in other investment assets has been detected from increased deposits in foreign countries by domestic banks (banks’ nostro/foreign exchange accounts at foreign correspondent banks).
–10,000 –8,000–6,000–4,000–2,000
0 2,0004,0006,0008,000
10,000
1980 1983 1986 1989 1992 1995 1998 2001 2004 2007
Direct investment Portfolio investment Others

268 BIS Papers No 44
Graph 3
Composition of gross capital inflows In millions of US dollars
Source: Bank Indonesia.
Graph 4
Composition of gross capital outflows In millions of US dollars
Source: Bank Indonesia.
2.2 Capital flows: drivers and impact on the economy
Drivers of capital flows The brisk rate of capital inflows, especially during the pre-crisis period, was, on the one hand, driven by the pressing need for development funds and, on the other, encouraged by financial liberalisation. Domestic saving, which ordinarily should be the main source of development financing, was inadequate for the scale of investment needed. Realising the importance of domestic as well as foreign financing, the government moved forward with progressive reforms for the economy and the financial sector. The most important policy
–2,000 –1,000
0 1,000 2,000 3,000 4,000 5,000 6,000
Q1 Q2 Q3 Q4 Q1 Q2 Q3 Q4 Q1 Q2 Q3 Q4 Q1 Q2 Q3 Q4
Direct investment Portfolio investment Others2004 20062005 2007
–5,000
–4,000
–3,000
–2,000
–1,000
0
1,000
2,000
Q1 Q2 Q3 Q4 Q1 Q2 Q3 Q4 Q1 Q2 Q3 Q4 Q1 Q2 Q3 Q4
Direct investment Portfolio investment Others2004 2005 2006 2007

BIS Papers No 44 269
reform for improvement of capital flows was the launching of the free foreign exchange regime in 1970, under which anyone in Indonesia could hold, buy and sell foreign exchange. In a subsequent reform in 1982, exporters were allowed to hold foreign exchange from their export earnings as needed. In 1983 and 1988, the government launched ambitious deregulation policies for the banking system and the capital market. In June 1983, the government eliminated ceilings on credit allocations and interest rates. The October 1988 banking deregulation led to a rapid expansion in banking networks and activities, including the opening of foreign banks and expansion of foreign bank branch operations. Bank ownership was liberalised in 1989 with foreign investors permitted to own up to 99% of bank shares listed on the capital market. Bank Indonesia also replaced offshore borrowing ceilings for banks with a new requirement on the net open position. In the real sector, new sectors were opened to foreign investment in 1991.
Other internal factors attracting foreign capital to Indonesia included stable macroeconomic conditions (reflected in relatively strong economic growth, low inflation and a stable exchange rate) and the high interest rate differential. On the external side, Indonesia’s capital inflows were encouraged by the downward trend in international interest rates at the beginning of 1990. At the same time, the recession in the United States, Japan and some European countries prompted investors to reallocate portfolios to emerging markets, including Indonesia. Another external factor was the rapid expansion in the number of investment institutions, such as mutual funds, that invested heavily in developing countries in pursuit of long-term profits and diversification of risks.
Reflecting the inadequacy of domestic savings as the main source of development financing was the savings-investment (S-I) gap for the 1980–96 period, which averaged 2.5 to 3% of total GDP. During the 1998–99 economic crisis, Indonesia the S-I gap turned into a surplus, reflecting a significant drop in investment activities. In the recovery process of the post-crisis period, the steady improvement in the overall macro economy and sociopolitical condition has gradually reversed the picture, producing the highest momentum in 2001 with an S-I surplus of 4.2% of GDP. Nevertheless, it can be seen from Graph 5 that while saving and investment have steadily increased, the net borrowing (S-I) gap has fluctuated during the last five years. This confirms that the economic recovery process has been volatile and relatively vulnerable to subsequent shocks.
Graph 5 Savings-investment gap
As a percentage of GDP
Source: Bank Indonesia.

270 BIS Papers No 44
Impact of capital flows on the economy The positive impact of capital inflows on the Indonesian economy is reflected in macroeconomic indicators during the pre-crisis period (Table 1). Between 1989 and 1996, Indonesia enjoyed one of the highest growth rates in Asia. Growth during the period averaged 7.2% while inflation was relatively subdued at below 10%. Unemployment averaged 4.9%. Per capita GDP improved significantly, rising from USD 596 in 1990 to USD 1,155 in 1996. The high economic growth occurred alongside structural changes in the economy, which shifted away from the traditionally dominant role of agriculture towards heavier reliance on manufacturing as the engine of the economy.
Table 1
Pre-crisis macroeconomic performance in Indonesia
1990 1991 1992 1993 1994 1995 1996
Internal stability Real GDP growth (in per cent) 9.0 8.9 7.2 7.3 7.5 8.1 7.8
Agriculture 2.3 2.9 6.3 1.7 0.6 4.2 1.9 Industry 13.2 11.8 8.2 9.8 11.1 10.2 10.4 Services 7.6 9.3 6.8 7.5 7.2 7.9 7.6
Percentage of GDP: Consumption 63.3 64.1 61.8 64.7 65.6 65.9 66.0 National savings 27.5 26.9 26.9 27.0 28.4 28.0 28.5 Investment 30.1 29.9 29.0 28.3 30.3 31.3 32.1
Inflation (CPI) 9.5 9.5 4.9 9.8 9.2 8.6 6.5 Fiscal balance 0.4 0.4 –0.4 –0.6 0.1 0.8 0.2
External stability Current account (percentage of GDP?) –2.8 –3.7 –2.2 –1.6 –1.7 –3.7 –4.0 Net capital flows (percentage of GDP?) 4.9 5.0 3.8 1.9 2.4 4.6 5.0 Forex reserves (in import months) 4.7 4.8 5.0 5.2 5.0 4.4 5.1 M2 ratio against forex reserves (in per cent) 514.0 505.7 497.4 557.1 602.9 657.4 633.3 Total offshore borrowing (as a percentage of goods and services exports) 222.0 236.9 221.8 211.9 195.8 205.0 194.0 Short-term offshore borrowing (as a percentage of goods and services exports) 15.9 17.9 20.5 20.1 17.1 20.9 24.8 Debt service ratio (as a percentage of goods and services exports) 30.9 32.0 31.6 33.8 30.0 33.7 33.0 Exports (as a percentage of GDP) 26.6 27.4 29.4 25.9 26.0 26.0 26.2 Export growth (in per cent) 15.9 13.5 16.6 8.4 8.8 13.4 9.7 Oil prices (USD per barrel) 28.6 20.1 18.7 14.1 16.1 18.0 22.8
Source: Bank Indonesia.

BIS Papers No 44 271
The brisk growth rate and massive capital inflows also resulted in steady expansion in Indonesia’s international reserves (gross foreign assets). After relative stability in the range of USD 2.5 billion to USD 5.6 billion during the period from 1980 to 1990, international reserves mounted steadily to USD 17.8 billion in 1996. Domestic interest rates maintained a declining trend in keeping with the flush liquidity on the market. However, because of the pressing need for foreign capital, the government maintained an interest rate differential to ensure that domestic interest rates would be competitive against foreign interest rates. In real terms, domestic interest rates remained positive as a result of the downward trend in inflation.
Although financial sector deregulation offered numerous benefits, it was not supported by an adequate regulatory and supervision framework, nor by the institutional framework needed to promote financial system efficiency. With inadequate regulation and supervision, poor governance and heavy government intervention in credit allocations, the financial system was left weak and vulnerable. At the micro level, banks and corporate actors frequently ignored prudential principles. Offshore borrowings, in particular, were fraught with currency and maturity mismatches. Feeling secure given Indonesia’s track record of a stable rupiah during the period, the private sector neglected to hedge their offshore borrowings. When the exchange rate plunged into turmoil, the lack of hedging left these borrowers in a highly exposed position.
Heavy capital inflows helped to keep the rupiah at the lower limit of Bank Indonesia’s intervention band. Measured in real terms, the rupiah in fact gained in value, with especially strong appreciation recorded during 1996 and the first half of 1997. In order to discourage market speculation and reduce the costs of intervention, Bank Indonesia gradually widened the intervention band. The strengthening rupiah hurt Indonesia’s competitiveness and created distortion in savings and investment decisions, thus reducing economic efficiency at the macro level.
Increased capital inflows led to expansion in the money supply, which in turn fuelled aggregate demand at levels exceeding the absorption capacity of productive sectors. During the 1990–96, the narrow measure of the money supply (M1) and broad money (M2) widened by an average of 26.9% and 20% respectively. This quickly led to overheating in the Indonesian economy, particularly in 1995–96 when vigorous growth (close to 8%) was followed by high inflation (around 8.5%) and a hefty current account deficit (4% of GDP).
In addition, a property boom funded by bank credit expansion and offshore borrowing led to an asset price bubble. Offshore borrowing by the government and private sector alike mounted to levels that by international standards would begin triggering alarm. Dominating the debt stock were private sector borrowings, which climbed sharply from USD 64 billion in 1990 to USD 110.2 billion in 1996 (48.5% of GDP). The combination of these conditions left the economy vulnerable to domestic and international pressures.
2.3 The economic crisis and its impact on the economy A prominent event related to Indonesian external developments was the economic crisis of 1997–98. In July 1997, contagion from the balance of payments crisis in Korea and Thailand placed mounting pressure on the rupiah. With the domestic economy already fragile, the exchange rate turmoil quickly unfolded into a fully fledged financial and economic crisis. Externally, the exchange rate crisis triggered massive private capital flight with Indonesia’s balance of payments recording a deficit for the first time since 1989/90. The rupiah value of foreign debt and debt servicing obligations soared, causing many companies to default.
Unlike with Thailand, few had suspected that Indonesia would suffer such a devastating crisis. Even the leading rating agencies failed to detect the country risk. Right until the eve of Indonesia’s crisis, markets were still indicating a fairly high level of confidence. The capital market index recovered immediately after Thailand abandoned the currency peg and

272 BIS Papers No 44
adopted a free floating rate system in early July 1997. Shortly after that, however, expectations regarding Indonesia quickly reversed. Private capital that had previously poured into Indonesia suddenly began flowing out. Before the crisis, foreign investors had been perfectly willing to roll over short-term debt, such as commercial paper, certificates of deposit and promissory notes, but now all this had changed. Quickly, offshore sources of borrowing for the domestic private sector dried up while payments on outstanding debt were falling due. The capital account surplus that had reached USD 11 billion in 1996 plunged drastically to USD 2.5 billion in 1997. In 1998, the capital account sustained a USD 3.8 billion deficit that in 1999 widened further to USD 4.6 billion.
Despite the sharp rise in government capital inflows during the period, this was insufficient to cover the mounting deficit caused by outflows of private capital. Most of the official capital inflows comprised borrowing from creditor nations and international financial institutions under IMF coordination in support of the economic recovery programme. Indonesia’s post-crisis foreign debt composition thus changed significantly with a sharp rise in government debt in contrast to the decline in private sector borrowing.
Graph 6
Rupiah/dollar exchange rate and SBI1 rate
0
2,000
4,000
6,000
8,000
10,000
12,000
14,000
88.1 90.1 92.1 94.1 96.1 98.1 00.1 02.1 04.1 06.10
10
20
30
40
50
60
70
IDR/USD (lhs) SBI rate, in per cent (rhs) 1 SBIs are Bank Indonesia Certificates issued since 1984 to manage the money supply.
Source: Bank Indonesia.
What started as a balance of payments crisis unfolded into a multidimensional crisis that brought down the economy as a whole. The rupiah quickly lost value amid wide fluctuations, falling from IDR 2,500 per US dollar in July 1997 to IDR 5,000 in December that year and to a low of IDR 16,000 (in Graph 6 less than IDR 14,000) per US dollar in June 1998. The economy contracted across all sectors, producing a sharp 13.7% real GDP decline in 1998 (year on year). This was worsened by the failure of the export sector to take advantage of the rupiah’s depreciation because of inability to produce and the drying-up of financing. Domestic banks began to record negative margins, which resulted in a rapid contraction of the supply of domestic credit. In 1998, the sharp depreciation of the rupiah sent inflation soaring from 11.6% in 1997 to 77.6%. Also contributing to the near hyperinflation was the sheer size of the money supply, and especially of cash outside banks. To curb inflation and stabilise the rupiah, Bank Indonesia applied an extremely tight monetary policy with steep increases in domestic interest rates.

BIS Papers No 44 273
After the worst of the crisis had passed and new policies had been introduced to put the economy back on track, signs of significant recovery began to emerge in 2002–03. Even so, conditions were far removed from the boom years before the crisis. The exchange rate recovered significantly to stabilise in the range of IDR 8,500 to IDR 9,000 to the US dollar in 2003. Inflation fell sharply from 77.6% at the peak of the crisis (1998) to 5.06% in 2003. Likewise, interest rates came down from 38% (working capital credit) at the end of 1998 to 13.4%. Although Indonesia’s recovery lagged behind that of other crisis-hit countries, economic growth nevertheless steadily improved to 4.72%.
During this time, Indonesia also saw improvement in the balance of payments. The current account surplus during the most turbulent period of the crisis had resulted mainly from sharply reduced imports. In the years that followed, the surplus was maintained due to the strengthening performance of non-oil and gas exports. In 2003, the current account surplus reached USD 8.1 billion or 4.0% of GDP. With improved macroeconomic stability, private capital began flowing back into the country. During 2004–07, the capital account recorded an average surplus of USD 2.6 billion per year. Capital flows consisted mainly of rapidly expanding portfolio inflows and debt servicing by the private sector. As a result of the debt restructuring programme, private sector debt repayments were substantially lower than previously estimated. However, FDI remains low. The dominance of short-term funds in capital inflows calls for vigilance, as these flows are highly susceptible to changes in sentiment that can disrupt monetary stability.
A valuable lesson from previous situations and the crisis itself is that financial sector liberalisation without adequate regulation, control and management (good governance) can cause fundamental weaknesses at the micro level. This is reflected in the following:
(i) Excessive dependence on foreign sources of funding. With heavy capital inflows, Indonesia’s private sector became increasingly dependent on external financing, particularly through debt. Before the crisis, private sector offshore borrowing had soared to nearly 60% of total foreign debt. At the same time, the managed floating exchange rate system in use before the crisis offered an implicit guarantee against exchange rate risk that encouraged the private sector to take out massive long-term loans without hedging.
(ii) Foreign debt mounted in the banking sector, with escalating risk from maturity and currency mismatch. To circumvent high domestic interest rates, Indonesia’s private sector sought funding alternatives from overseas offering lower interest rates. Many domestic banks borrowed short-term from foreign institutions to support their lending to the domestic private sector. These funds were then disbursed as long-term loans denominated in rupiahs. In 1993, foreign debt in the financial sector stood at USD 6 billion. By 1995, this had soared to USD 12.1 billion.
(iii) The financial condition of the banking system steadily weakened from mounting problem loans. Amid the rapid credit expansion, problem loans soared in the banking industry because of the high volume of lending that ignored prudential principles. In November 1996, loan losses in the banking system stood at IDR 10.4 trillion (about 2% of GDP or 10% of total lending), with 68% of these losses recorded at state banks.
(iv) Government intervention in credit selection. Lending decisions at state banks were strongly influenced by government intervention, with the result that many loans were extended by reason of political pressure or connections. Decisions concerning credit expansion were in many cases implicitly or explicitly directed by the government.
(v) Poor management (governance). Lack of bank financial transparency undermined not only the accuracy of financial analysis but also social control and market discipline. Unsound business management led to inefficiency and failure in the application of good management principles. Poor corporate governance was also

274 BIS Papers No 44
reflected in the lack of effective institutions, particularly for resolution of bankruptcy. This in turn created moral hazard in the business sector.
3. Management of capital flows
The heavy social and economic costs of the financial crisis underscore the importance of efforts to reduce economic vulnerability to sudden reversals in capital inflows. Capital flows tend to follow a cycle, rushing in when the economy is strong and rushing back out again during times of decline. Developing countries are more susceptible to loss of investor confidence, with the result that the economic and social costs of a financial crisis can be enormous. So far, Indonesia has adopted a series of policies to mitigate negative impacts from capital flows on the economy. These policies focus on two key areas. First, the use of macroeconomic policy instruments to counter the negative impact of capital flows on monetary, fiscal and exchange rate stability. Second, the control of short-term capital flows through a series of regulations on foreign borrowing, foreign exchange transactions and operations of the banking system. The appropriate policy mix depends on various factors, such as the causes of capital inflows and outflows (permanent or temporary), availability and flexibility of instruments and the condition of the domestic financial market.
It is painfully obvious that policies put in place prior to the crisis were inadequate for building Indonesia’s economic resilience to the negative impact of capital volatility. This was demonstrated by Indonesia’s inability to cope with the contagion effect of the mid-1997 currency crisis in Thailand. For this reason, the management of capital flows in the post-crisis period has been supported by efforts to improve the resilience of the domestic financial system through a series of structural reforms. Following this, policy focused on efforts to boost capital inflows through consolidation of macroeconomic stability and actions to reduce the risk of a reoccurrence of the crisis. In general, policy targeted the following four objectives: a sound macroeconomic framework consistent with the exchange rate regime; a sound domestic financial system with proper controls and prudential standards; an independent and strong central bank; and transparency through provision of up-to-date and accurate economic information. A number of elements have been important in achieving these goals:
3.1 Monetary policy Monetary policy plays an essential role in coping with demand pressure. During the managed floating rate regime, monetary policy focused on sterilisation of the monetary expansion caused by the accumulated foreign exchange reserves as a means of curbing demand pressure. Sterilisation took place primarily through open market operations using Bank Indonesia Certificates (SBIs), with the support of the statutory reserve requirement, discount window and moral suasion.
In response to the excessive monetary growth in 1994 brought on by domestic credit expansion partly funded by offshore loans, monetary policy was tightened significantly in mid-1995. Monetary expansion was effectively reduced through forex market sterilisation. However, the monetary policy tightening resulted in higher domestic interest rates, particularly during the 1995–96 period. This occurred at a time of falling rates on dollar instruments, thus widening the interest differential. In turn, the wider differential provided added impetus to capital inflows. Because short-term capital flows were more responsive to changes in the interest differential and movement in the nominal exchange rate remained largely steady, a shift took place in the composition of external debt obligations. Historically, external obligations had consisted primarily of foreign investment and long-term borrowings, but now were dominated by portfolio flows and other short-term debts.

BIS Papers No 44 275
The new composition significantly increased the burden of monetary sterilisation through the use of open market operation instruments, and support from other monetary instruments became necessary. To reduce bank lending capacity, the statutory reserve requirement was raised from 3% in 1995 to 5% in 1997. Bank Indonesia in addition sought to limit credit expansion through moral suasion, calling on banks to submit their annual business plans and progress reports and establishing a credit policy direction. Bank Indonesia also introduced restrictions on lending to the property sector.
During the crisis, the priority for monetary policy was to arrest the depreciation of the rupiah and rein in inflation by tightening the money supply. This was accomplished by absorbing excess liquidity and especially the enormous volume of base money that resulted from Bank Indonesia’s liquidity support extended to commercial banks to keep the banking system from collapse. In response, interest rates climbed sharply from 22% in January 1998 to a high of 70% in September that year. Although several underlying factors played significant roles, it is believed that the monetary institutional establishment was the main aspect fostering economic stability, not only in the short run but also in the long run. During 2003, five years after the crisis, consistent monetary policies supported by prudent fiscal policies and other progress achieved in economic restructuring have contributed to macroeconomic and monetary stability. The inflation rate declined significantly to about 5% in 2003, from an average of 10% over the 2000–02 period. Consequently, these conditions provided adequate room for monetary policy to consistently adjust interest rates in order to support further economic recovery.
To strengthen monetary policy effectiveness, the monetary authority introduced the Inflation Targeting Framework in July 2005 with an interest rate (the BI rate) as the operating target. Open market operations were also supported by direct intervention on the rupiah money market using rupiah intervention instruments.
3.2 Exchange rate system In an open small economy like that of Indonesia, the management of the exchange rate plays a vital role.2 Since 1967, Indonesia has employed three different exchange rate regimes (fixed, managed float and float). The periods of the fixed and managed floats alone were marked by eight devaluations – six of them during 1967–78. Prior to the 1997 currency crisis, the policy focus was on maintaining a real exchange rate conducive to export-oriented growth.
In the early years of national development, Indonesia had relied on a currency peg. However, increasing capital mobility and growing integration into the regional and international economy led Bank Indonesia to consider a more market-oriented exchange rate mechanism. Thus in 1978, Indonesia abandoned the peg for the managed floating system.3 Under this system, movement in the rupiah was managed by Bank Indonesia within an intervention band. The direction of the middle point of the intervention band was determined by Bank Indonesia, taking into account the real competitiveness of the rupiah against the real exchange rate movements of major trading partner currencies. Bank Indonesia would then
2 Transmission of exchange rate fluctuations is felt throughout the country through import prices which in turn
are reflected in general prices through the price of finished goods produced with imported intermediate goods. Inflation in general prices determines the level of interest rates. Through the interaction of the money market and the goods market, this interest rate, adjusted for inflation, theoretically determines the output of the economy.
3 In 1971–78, Indonesia had operated a fixed exchange rate with the rupiah pegged against the US dollar. This period was also marked by a number of devaluations.

276 BIS Papers No 44
only intervene on the foreign exchange market when the market exchange rate began moving outside the intervention band.
As Indonesia’s economy opened further with the rising volume of capital inflows, the intervention band was progressively widened. From September 1992 to August 1997, Bank Indonesia widened the band eight times. Despite this, capital inflows, particularly of short-term capital, continued to mount rapidly. The reason was that the intervention band helped the market to predict movement in the nominal exchange rate, and this reduced the incentive for market agents to hedge their offshore debt exposure. Because of the heavy volume of capital inflows, the market exchange rate was almost always at the bottom limit of the intervention band (Graph 7).
Graph 7
Exchange rate movement and the intervention band
Source: Bank Indonesia.
The massive capital outflows during the crisis resulted in serious problems for macroeconomic management. The sudden movement of vast volumes of capital necessitated hugely expensive market intervention, reduced the effectiveness of monetary sterilisation and increased the quasi-fiscal costs of monetary policy operations. The first move to arrest the decline in the rupiah was the widening of the intervention band. However, pressure on the rupiah continued to mount. On 14 August 1997, the monetary authority abandoned the intervention band altogether and switched to a free-floating exchange rate system. This protected base money from fluctuations in capital flows, limited speculation and shifted the weight of the increased exchange rate risk onto foreign investors.4
4 Since Indonesia moved from managed to free floating on 14 August 1997, intervention has been used
primarily as a liquidity management tool to offset government expenditures. At the same time, such interventions can also stabilise rupiah volatility, especially during rapid depreciations associated with excess liquidity. Thus intervention, through tightening domestic liquidity by the sale of foreign exchange, can be used as a framework to influence the exchange rate. As well as absorbing excess rupiah liquidity, intervention by way of selling foreign currency also aims at lessening the volatility of the exchange rate, easing market pressures, and, by its nature, adding foreign currency liquidity to a market which is often marked by lack of supply.

BIS Papers No 44 277
However, the sudden weakening of the rupiah against the US dollar during the 1997 crisis and the brief period right after it simply reflected the excess demand for the US dollar against the rupiah in the local market. Closer observation revealed that such excess demand did not necessarily represent any underlying real transaction of goods and services. Non-resident economic agents who held current accounts with Indonesian banks played a big role in such a phenomenon. In this context, part of the excess demand for US dollars can be categorised as “speculative trading”.
Given the thin, small and immature IDR/USD exchange market during that time, such large speculative trading volumes had relatively major consequences for the economy. The IDR/USD exchange rate became a source of uncertainty, due to the nature of the speculation, which triggered volatility more than stability. Subsequently, it posed bigger problems for the economy because a large number of economic agents were facing the sudden reality of asymmetrical (limited) information regarding the future IDR/USD rate, thus influencing their economic decisions involving any exposure to exchange rate risk. In contrast, other players, mainly in the international financial markets, enjoyed relatively less risky decision-making in their business, due to their advantages in terms of access, prowess and knowledge of international finance issues. Right after the rupiah was freely floated against the US dollar, for instance, nobody could easily calculate its “equilibrium” rate. Only economic agents with an information advantage and sophistication were able to reap gains from IDR/USD trading during that time – mainly economic agents in the international financial market – and among the most influential players were non-residents.
It is common practice for countries to try to limit speculative trading of their currency in the interest of safeguarding domestic price stability. Asian countries have been known to do so, including Singapore, Malaysia, Thailand and China. How does Indonesia go about it?
As briefly discussed above, right after it was allowed to float freely, the Indonesian rupiah became the subject of speculative trading; this occurred with relative ease due to the lack of regulation. The offshore rupiah market has been known to be very active, thus making the rupiah as an international “commodity” in the world market, which only mirrors the currency’s internationalisation. The ownership of rupiahs by non-residents can be motivated by a real underlying need to finance the goods and services traded or by profit-seeking through speculative trades, two areas which are not easily separated. While the use of the rupiah for underlying real transactions is desirable, its use for speculation is not, because the latter would introduce instability into the market if not isolated. Thus, the trading of rupiahs by non-residents in the offshore market does not benefit the economy because the main underlying need in this case is merely to speculate on the IDR/USD rate for profit.
IDR/USD trading by non-residents involves spot and derivatives transactions. Spot market transactions take place conventionally with counterparties agreeing to each other’s bids and asks with the promise to deliver as arranged, while derivatives involve a higher degree of complexity. For example, derivatives often involve synthetic swaps, where a non-resident can speculate on the IDR/USD rate by buying rupiahs from the resident via the spot transaction (two-day or next day settlement), and at the same time buying back the US dollars in the forward market (for future delivery). By doing this, non-residents obtain the implicit rupiah credit facility (non-conventional) while locking their exchange rate risk through forward transactions.
In order to curb such speculative action arising from the internationalisation of the rupiah, in 1997 Bank Indonesia issued a regulation that limits forward trading to USD 5 million per transaction, although with only partial success due to the lack of enforcement and sanctions. Given all these problems, a well orchestrated policy is needed to really curb speculative trading, especially by limiting international speculators’ access to the rupiah, including rupiah

278 BIS Papers No 44
financing through sophisticated derivatives arrangements.5 Fortunately, Bank Indonesia and the government of Indonesia have introduced the needed regulations, which have been relatively successful in reducing the threat of such speculation.6 However, all of these abnormal market activities only took place during the period of upheaval, which is the only context in which speculative trading of this kind can reap big gains. Hence it must be stated that when the overall market situation has normalised and the impact of fluid political and other non-economic factor developments has lessened, the sizeable swap and derivatives market with its highly diverse maturity profile will be a catalyst for the future development of Indonesia’s modern financial sector.
3.3 Regulation of offshore borrowing and efforts to improve transparency In October 1991, Indonesia reinstituted quantitative limits on offshore borrowing by banks and the government sector, including state-owned enterprises. A ceiling on private offshore borrowing was also imposed for activities directly connected with government institutions. The central bank set up a queuing system in which prospective borrowers would apply for licences within the ceiling. Penalties were imposed on banks that did not submit progress reports on their offshore borrowing and on borrowing in excess of the ceiling. The queuing system enabled the central bank to determine the amount of the debt drawdown and monitor the terms and conditions and use of borrowed funds.
Following this, the government introduced quantity controls over private sector foreign borrowing in a regulation on issuance of commercial paper where banks acted as arrangers. Bank Indonesia also eliminated the subsidy for swap facilities in order to reduce incentives for drawdown of debts. The attempts to restrict private offshore borrowing lacked effectiveness because of the difficulty of controlling capital flows in a relatively free foreign exchange system. Complicating this was the lack of an accurate, thorough and timely reporting system. The central bank was unable to control capital flows and had difficulty in obtaining an accurate picture of private sector foreign borrowings.
Lack of detailed, accurate and timely data on capital flows, especially short-term capital, is a key factor in the slow policy response to pressures generated by rapid capital flows. To resolve this, Bank Indonesia has developed a system for monitoring foreign exchange flows and strengthened transparency based on accurate reporting of economic and financial information as stipulated in Act no 24 of 1999 on Foreign Exchange Flows.
3.4 Banking regulations on bank forex transactions and forex positions Bank Indonesia is engaged in an ongoing drive to strengthen bank performance and efficiency in order to build a sound banking industry resilient to internal and external shocks. Actions taken include improvements to the application of prudential principles, bank restructuring through mergers, resolution of problem loans, and rescue or closure of problem banks. The central bank also encourages banks to apply self-regulatory principles, improve the quality of risk management and enhance the quality of human resources.
On other fronts, Bank Indonesia is working to bring the Indonesian banking system into line with the standards proposed by the Basel Committee on Banking Supervision. The capital
5 For example forward and/or swap selling, and put and call option transactions. 6 Government Regulation no 18/1998 of 2 February 1998 limits the amount of rupiahs that may be physically
transported into and out of Indonesia, while various Bank Indonesia circulars limit rupiah cash loans for exchange rate trading, as does Official Announcement by the Exchange Rate Department to Banks no 30/19/UD of 2 September 1997.

BIS Papers No 44 279
adequacy ratio was raised to 8% at all banks in 1995–96. The loan/deposit ratio is restricted to a maximum of 110%, and banks must also operate under the legal lending limit.
Restrictions also apply to bank asset positions and foreign exchange liabilities in the regulation on the net open position (NOP). In 1992, Bank Indonesia raised the NOP from 20% to 25% of bank capital, with banks required to report their NOP regularly to the central bank. Initially, the NOP regulation applied only to on-balance sheet assets and foreign exchange components. This was subsequently amended to include off-balance sheet items.
As important as these provisions were, they still proved inadequate in compensating for the weak internal management in the banking sector. Weak internal control and the unsupportive behaviour of bank owners and management concerning prudential principles led to rampant banking irregularities in areas ranging from credit valuation and classification to application of accounting standards. For example, banks competed with each other in lending to the property sector, where loans were partly funded through offshore borrowing and extended without proper credit valuation. This, in turn, led to burgeoning problem loans and became one of the factors that undermined the banking sector and ultimately brought on the banking crisis in Indonesia.
To ease pressure on the rupiah, on 12 January 2001 Bank Indonesia issued Regulation no 3/3/2001 on Restrictions on Rupiah Transactions and Foreign Currency Loans by Banks. The regulation essentially covers two main areas:
(i) Prohibition of rupiah transfers by Indonesian banks to non-residents, with particular emphasis on rupiah transfers not supported by underlying transactions within the Indonesian economy.
(ii) Restriction on derivatives transactions not supported by underlying transactions, with the maximum limit for derivatives transactions involving forex sales by domestic banks to non-residents being lowered from USD 5 million to USD 3 million.
This regulation is intended to limit the supply of rupiahs from residents to non-residents for potential use in speculative activities and thus curb excessive fluctuation in the rupiah. In addition to the policy restricting foreign exchange transactions, Bank Indonesia also amended the NOP regulation. In July 2004, the new NOP was introduced for two categories: (i) a 30% NOP on on-balance sheet components and the overall balance sheet for banks that include market risk in the calculation of their capital adequacy; and (ii) a 20% NOP on on-balance sheet components and the overall balance sheet for banks not calculating market risk.7
3.5 Financial sector restructuring The primary goal of financial sector restructuring is to rebuild public confidence in the banking sector and, in so doing, create long-term financial system stability, improve efficiency in financial intermediation, and build financial system resilience for the medium and long term. The following are specific actions pursued to achieve these objectives:
(i) Rebuilding confidence in the banking sector by launching a blanket guarantee scheme guaranteeing bank deposits of all types, in both domestic and foreign currency.
7 See Bank Indonesia Regulation no 6/20/PBI/2004 of 15 July 2004 amending Bank Indonesia Regulation
no 5/13/PBI/2003 on the Net Open Position for Commercial Banks.

280 BIS Papers No 44
(ii) Improvements in banks’ internal governance:
• Strengthening of the legal framework, policies and infrastructure of the banking system. To this end, new laws on the banking system and the central bank came into force in October 1998 and May 1999.
• Strengthening of prudential regulations with focus on improving banks’ internal control, organisational structure, enforcement of banking regulations and a specific programme for building up the expertise of bank supervisors and examiners.
(iii) Rebuilding bank solvency:
• Establishment of the Indonesian Banking Restructuring Agency (IBRA) and the Asset Management Unit (AMU).
• Closing-down of problem banks. Following the crisis, 20 commercial banks had their licences revoked and four state banks were merged into a single entity named Bank Mandiri (September 1998).
• Strengthening of bank capital through the recapitalisation programme.
3.6 Fiscal policy and other structural reforms Sound fiscal conditions are important for reducing the volatility of capital flows. To address this, the government strengthened fiscal prudence in two key steps. The first involved reducing the size of the foreign debt service burden by using the fiscal surplus and the proceeds raised from the privatisation of state-owned enterprises for early repayment of high interest foreign debt. Second came expenditure reductions in investment and consumption designed to ease government dependency on international borrowings. The government expenditure reductions were designed to protect major revenue-generating activities important for long-term growth. Because most government expenditures are used for non-tradable goods and services, this expenditure reduction policy would also help ease pressures for real appreciation of the exchange rate. Fiscal conditions were strengthened through increased taxation and improved management of state-owned enterprises. The conservative fiscal policy enabled the government to accumulate considerable savings deposited with the central bank that reduced the expansion of base money.
With the crisis having severely weakened domestic demand, fiscal policy sought to promote economic recovery and lay the foundations for sustainable fiscal management. Four main objectives were established. The first was to provide a fiscal stimulus for the sectors and social group worst affected by the crisis. The second was to prepare for the creation of more agricultural resources in the medium term. The third was support for banking recapitalisation and restructuring. The fourth was management of the fiscal deficit using funding not originating from the central bank.
Domestic revenues were strengthened through improvements to the tax structure and tax administration. Non-tax revenues were enhanced by transferring some hitherto off-budget items to budget revenues. To fund the budget deficit, the government continued to draw on foreign borrowings that accounted for as much as 60% of total budget funding. Other budget funds came from the proceeds of the privatisation of state-owned enterprises and sales of bank assets held by IBRA. To provide added deficit financing, the government re-entered the international capital market in 2004 with a successful USD 1 billion bond issue that attested to improved credibility in the eyes of foreign investors.
Structural reforms in the economy have been focused on addressing various problems that hamper the efficient functioning of the market mechanisms on the supply side. Adjustments are required to improve transparency in decision-making, foster a climate of fair competition and improve good governance through market-friendly policies. Measures taken to improve

BIS Papers No 44 281
transparency and efficiency in the government sector include developing mechanisms for the resolution of tariff issues and business conflicts and improving mechanisms for the selection of government projects. Meanwhile, the critical steps towards fostering a conducive business climate are, inter alia, removing obstacles to foreign investment, lowering import tariffs and export taxes on various products, eliminating import subsidies, and removing import monopolies for basic commodities, price controls on certain products and restrictions on foreign share ownership of companies listed on the stock exchange.
3.7 Developing robust capital markets In Indonesia, as in most of East Asia, the banking sector continues to be the major source of domestic financing. Capital markets are still embryonic, and on the few occasions when issues are priced, they are usually in small amounts. The inadequacies of East Asia’s capital markets represent the flipside of dominant banking sectors that have intermediated over 80% of the region’s investment. Banking sector dominance was even greater in Indonesia, and in the aftermath of the 1997 financial crisis bank lending collapsed, further exacerbating domestic economic implosion. The collapse of bank lending after the crisis exposed the fragilities of both the country’s and the region’s financial systems in responding to external shocks due to unexpected capital reversals. To address weaknesses in the financial system, Indonesia has systematically adopted a practical step-by-step approach, based on collaboration among all government agencies, to creating an environment in which these economic, technical and political factors build confidence and lead to the robust development of capital markets. An equity market and a rudimentary bond market already exist in Indonesia; however, developing the bond market is now a primary focus.
A primary stage of Bank Indonesia’s strategy involves establishing a comprehensive market for government bonds, which will eventually become the backbone of the corporate and other sectors of the bond market that are likely to emerge. The market for government bonds will help provide a benchmark yield curve and establish the overall credit curve off which all other issues will be priced. A deep and liquid market for government bonds not only fosters financial stability by allowing the development of other capital market sectors, but also provides the government with tools for effectively managing its debt, reducing dependence on foreign borrowing and supporting the implementation of sound and prudent monetary policy.
4. Capital flows and financial stability: recent salient observations
As a consequence of increasing globalisation coupled with greater openness of the economy, Indonesia’s economic and financial institutions are undergoing changes. Key factors behind the changes are the macro policies adopted by the Indonesian government and the rapid progress in information technology. Another important factor is the growth in the number of financial institutions: by November 2007, Indonesia had 130 banks with 9,667 branch offices, compared with 7,001 branch offices operating for 141 banks in 2002. In November 2007, funds mobilisation and credit reached IDR 114.84 trillion and IDR 963 trillion, up from IDR 59.9 trillion and IDR 371 trillion, respectively, in 2002 (Graph 8).

282 BIS Papers No 44
Graph 8
Commercial bank credit In trillions of rupiahs
Source: Bank Indonesia.
The capital market has also seen remarkable change. Listing on the Jakarta stock exchange (JSX) climbed from 331 companies in 2002 to 383 in December 2007, while market capitalisation also soared in the same period from IDR 268 trillion to IDR 1,988 trillion (Graph 9). Share trading rose from IDR 10.2 trillion in 2002 to IDR 89.2 trillion in 2007. This indicates that sources of business funding are diversifying away from the banking system. At the same time, the expanding portion of foreign investor holdings in the capital market reflects the growing integration of Indonesia’s money market and capital market into the global system. The ratios in value terms of foreign investor sales and purchases to total sales and purchases in the capital market are given in Graph 10.
Graph 9
Jakarta stock exchange market capitalisation In trillions of rupiahs
Sources: Bank Indonesia; CEIC.
0
200
400
600
800
1,000
Jan
93
Jan
94
Jan
95
Jan
96
Jan
97
Jan
98
Jan
99
Jan
00
Jan
01
Jan
02
Jan
03
Jan
04
Jan
05
Jan
06
Jan
07
Commercial bank credit
0
500
1,000
1,500
2,000
Jan
93
Jan
94
Jan
95
Jan
96
Jan
97
Jan
98
Jan
99
Jan
00
Jan
01
Jan
02
Jan
03
Jan
04
Jan
05
Jan
06
Jan
07
Market capitalisation
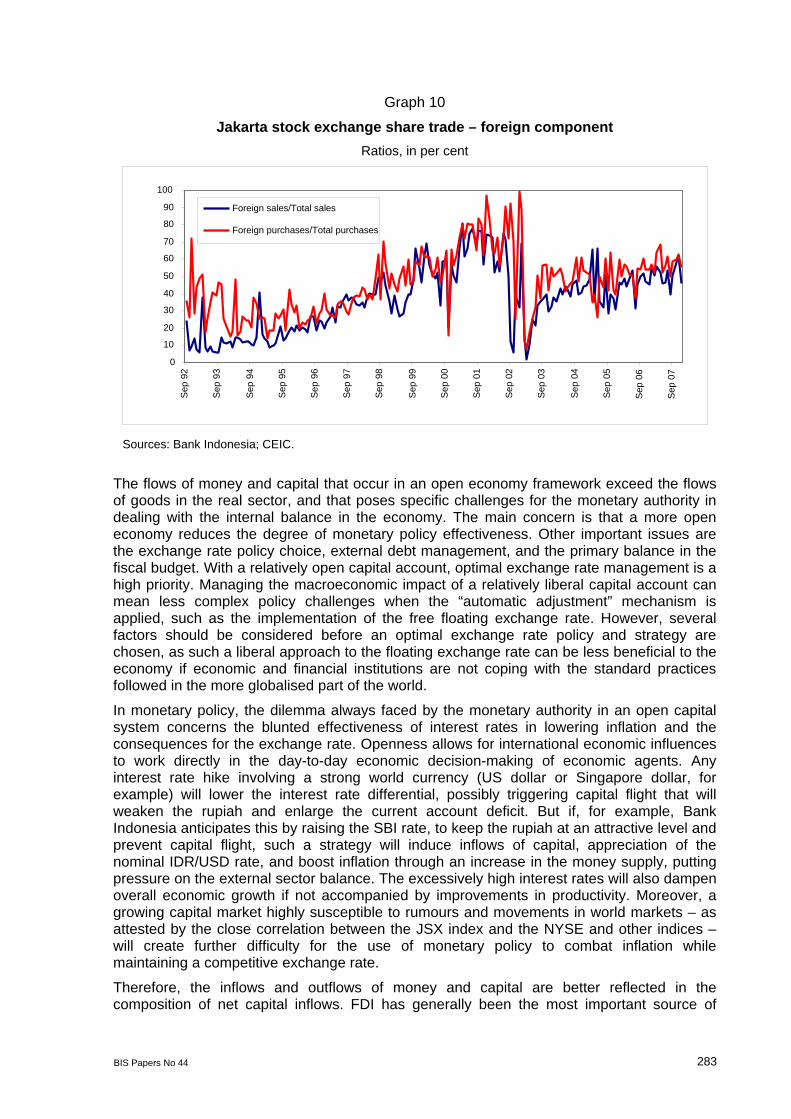
BIS Papers No 44 283
Graph 10
Jakarta stock exchange share trade – foreign component Ratios, in per cent
Sources: Bank Indonesia; CEIC.
The flows of money and capital that occur in an open economy framework exceed the flows of goods in the real sector, and that poses specific challenges for the monetary authority in dealing with the internal balance in the economy. The main concern is that a more open economy reduces the degree of monetary policy effectiveness. Other important issues are the exchange rate policy choice, external debt management, and the primary balance in the fiscal budget. With a relatively open capital account, optimal exchange rate management is a high priority. Managing the macroeconomic impact of a relatively liberal capital account can mean less complex policy challenges when the “automatic adjustment” mechanism is applied, such as the implementation of the free floating exchange rate. However, several factors should be considered before an optimal exchange rate policy and strategy are chosen, as such a liberal approach to the floating exchange rate can be less beneficial to the economy if economic and financial institutions are not coping with the standard practices followed in the more globalised part of the world.
In monetary policy, the dilemma always faced by the monetary authority in an open capital system concerns the blunted effectiveness of interest rates in lowering inflation and the consequences for the exchange rate. Openness allows for international economic influences to work directly in the day-to-day economic decision-making of economic agents. Any interest rate hike involving a strong world currency (US dollar or Singapore dollar, for example) will lower the interest rate differential, possibly triggering capital flight that will weaken the rupiah and enlarge the current account deficit. But if, for example, Bank Indonesia anticipates this by raising the SBI rate, to keep the rupiah at an attractive level and prevent capital flight, such a strategy will induce inflows of capital, appreciation of the nominal IDR/USD rate, and boost inflation through an increase in the money supply, putting pressure on the external sector balance. The excessively high interest rates will also dampen overall economic growth if not accompanied by improvements in productivity. Moreover, a growing capital market highly susceptible to rumours and movements in world markets – as attested by the close correlation between the JSX index and the NYSE and other indices – will create further difficulty for the use of monetary policy to combat inflation while maintaining a competitive exchange rate.
Therefore, the inflows and outflows of money and capital are better reflected in the composition of net capital inflows. FDI has generally been the most important source of
0
10 20 30 40 50 60 70 80 90
100S
ep 9
2
Sep
93
Sep
94
Sep
95
Sep
96
Sep
97
Sep
98
Sep
99
Sep
00
Sep
01
Sep
02
Sep
03
Sep
04
Sep
05
Sep
06
Sep
07
Foreign sales/Total sales
Foreign purchases/Total purchases

284 BIS Papers No 44
inflows, bringing not only capital but also technology and market access, and without creating short-term liabilities. Meanwhile, obligations in the form of royalties or dividends normally arise after a company has started operating and earning profit. Portfolio investment is the logical consequence of capital market expansion, but it is obviously preferable to have inflows for equity investment. At the same time, it is becoming more difficult to raise long-term borrowings, which has led to the recent soaring trend in short-term private borrowing. Another important issue is the effectiveness of the government’s debt management strategy in avoiding a debt trap. In fact, in terms of total debt, there is a shift in the government role to the private sector.
Using a simple exercise, we seek to establish how the inflows and outflows of foreign capital in the case of the Indonesian economy respond to the movement of interest rate differentials and the real effective exchange rate. Basically, we estimate the probability of “capital flow decreases” given changes in macroeconomic variables.8 Our aim is to check whether the market shows an excessive tendency to flee Indonesia when the prime macroeconomic variables – that is, the real effective exchange rate (REER) and interest rate differentials, move.
Graph 11 shows that the probability that “capital inflows (outflows) decrease” becomes smaller (bigger) with a higher interest rate differential. This just confirms the notion of “flight to higher gains” for foreign capital in a particular small open economy with free capital movements. However, it is encouraging that when the market sees interest rate differentials narrow, the probability of bigger foreign capital outflows remains below 0.50. That alone proves the confidence of the international economic agents who already hold positions in Indonesia and their willingness to stay.
Graph 11
Foreign capital flows (to and from Indonesia) and their response to movements in interest rate differentials,
November 2003–June 2007
8 To capture the response of capital flows to some financial market signals, we use the probit model. This model
is a regression model for a dependent variable that has a Bernoulli distribution, a discrete probability distribution. The series records 1 when gross capital flows decrease and 0 when gross capital flows increase or remain stable. We use interest rate differentials, REER and the nominal exchange rate as financial market signals. The data period is May 2003 to June 2007.
0
0.25
0.50
0.75
1.00
3.0 3.5 4.0 4.5 5.0 5.5 6.0 6.5 7.0 7.5 8.0 8.5 9.0
Pro
babi
litie
s of
“cap
ital f
low
dec
reas
es”
Probabilities of “capital inflow decreases”Probabilities of “capital outflow decreases”
Interest rate differentials

BIS Papers No 44 285
Meanwhile, Graph 12 shows that the probability that “capital inflows (outflows) decrease” in both cases becomes smaller with real effective exchange rate appreciation. REER appreciation is associated with a decrease in Indonesian economic competitiveness. However, real appreciation is conducive to foreign economic agents continuing investing in Indonesian short-term equity and fixed income portfolios. That relates to the future expectation of better returns in terms of their home currencies, which explains why foreign holdings in those two types of portfolio investments remain relatively high. Thus, we still see the probability of capital outflows below 0.50, which again shows how the international economic agents investing in Indonesia maintain their confidence to stay, vis à vis the appreciation of the REER.
Graph 12
Foreign capital flows (to and from Indonesia) and their response to REER, November 2003–June 2007
Finally, we adopt a different approach where the two most important variables that influence capital flows are now compressed into one “composite” variable.9 We do this with a principal component analysis, where the dimensions of the interest rate differentials and the REER vectors are now compressed and mapped into one dimension so as to see how the “fundamentals base” movement of both variables (REER and interest rate differentials) influences the probability of capital flows decreasing.
Graph 13 shows a very interesting finding from this analysis. The probability that “capital inflows (outflows) decrease” becomes bigger (smaller) with the combination of a rise in the interest rate differential and REER appreciation. This suggests that, in the face of an increase in the interest rate differential and REER appreciation, foreign capital already in Indonesia will probably stay, while a decrease in capital inflows is more likely.
9 The term “composite” variable is actually not entirely correct by definition in our principal component analysis
approach. However, it is meant only to simplify the interpretation of a new single vector of data which actually represents the fundamental dynamic factors: REER and interest rate differentials, influencing the probability of “capital flow decreases”, which is produced by the estimation of the principal component of both variables.
0
0.25
0.50
0.75
89 94 99 104 109 114 119
REER
Pro
babi
litie
s of
“cap
ital f
low
dec
reas
es”
Probabilities of “capital inflow decreases”
Probabilities of “capital outflow decreases”

286 BIS Papers No 44
Graph 13
Foreign capital flows (to and from Indonesia) and their response to the composite of
interest rate differentials and REER, November 2003–June 2007
5. Closing remarks
Indonesia’s financial sector liberalisation succeeded in strengthening the capacity of the domestic financial system and promoting the rapid expansion of foreign capital inflows for financing national development. However, in the first half of the 1990s huge inflows of capital, much of which were short-term, led to asset price bubbles in the property sector and runaway credit expansion that threatened financial system stability. Indonesia became an easy target for speculators because of weaknesses in the financial system, poor corporate governance and heavy dependence on the external sector. As a result, the country was plunged into a prolonged crisis.
The actions taken during the crisis and post-crisis period have brought significant results, although Indonesia is still some way from achieving full recovery from the crisis. Considerable progress has been made in stabilising macroeconomic conditions and resolving various structural problems. This has helped to create conditions that will enable Indonesia to move forward with the development process set back by the crisis. In view of the importance of foreign capital in accelerating economic development and having learned lessons on the negative impact of weak management in this area, the policy actions necessary for Indonesia to move forward are as follows:
First, globalisation is an unstoppable phenomenon and Indonesia must do what is necessary to profit from this trend. An open economy offers a means of financing development beyond the capacity of domestic sources. Indonesia must thus retain the free foreign exchange regime and support its usefulness by building a more efficient, stronger and sounder domestic financial market. The monitoring of foreign exchange flows is therefore not aimed at imposing restrictions on capital flows. Instead, it is more for statistical purposes in support of monetary policy and improved transparency, one of the prerequisites for the creation of an efficient market.
0
0.25
0.50
0.75
1.00
–2.0 –1.5 –1.0 –0.5 0 0.5 1.0 1.5 Data composite of interest rate differentials and REER
Pro
babi
litie
s of
“cap
ital f
low
dec
reas
es”
Probabilities of “capital inflow decreases”Probabilities of “capital outflow decreases”

BIS Papers No 44 287
Second, the strengthening of the financial system will be crucial. Liberalisation of capital flows should be supported by a more robust institutional structure and regulatory framework in the financial system, particularly in the application of prudential principles and better risk management in keeping with international standards. These efforts must also be complemented by consistent macroeconomic policy.
Third is the selection of an appropriate exchange rate system. The balance of payments crisis in Indonesia and other countries was closely linked to negative impacts from rigid exchange rate systems. Experience demonstrates that systems like these lead to moral hazard in taking on excessive, unhedged foreign borrowings. In the view of the monetary authority, the free floating rate system is the most appropriate for today’s conditions. Sharp rate fluctuations from the application of this system can be minimised through consistent implementation of appropriate macro and micro policies.
Fourth, good governance and transparency in the private and government sectors are important to the development of healthy markets and strengthening of government policy credibility. To achieve this, at least two prerequisites need to be in place: (i) implementation of macroeconomic policy and financial sector regulations within a transparent framework supported by up-to-date, accurate and high-quality information; and (ii) the private sector must operate in compliance with accounting standards and uphold international standards of disclosure in keeping with sound business principles.
Fifth, Indonesia must extend full support for improvements in the international financial architecture. To avoid future crises and cope with the impact of any crises that may arise, the international financial system must undergo a restructuring to ensure not only that countries operate sound macroeconomic policies, but also that these policies are properly coordinated. This is especially necessary among developed countries. The restructuring must also ensure that the private sector is involved in the management of capital inflows.
References
Bank Indonesia (1998): Annual Report 1997/98, Jakarta.
——— (2002): Annual Report 2001, Jakarta.
Calvo G, L Leiderman and C Reinhart (1993): “Capital flows and real exchange rate appreciation in Latin America”, IMF Staff Papers, 40 (1).
Calvo G and C Reinhart (1998): The consequences and management of capital inflows: lessons for Sub-Saharan Africa, EGDI (Expert Group on Development Issues), Almqvist & Wiksell International.
Eichengreen, B, M Mussa, G Dell’Ariccia, E Detragiache, G Milesi-Ferretti and A Tweedie (1999): “Liberalizing capital movements: some analytical issues”, Economic Issues, no 17, IMF.
Goeltom, M (2007): Essays on macroeconomic policy: the Indonesian experience, Gremedia.
Grillli, V and G Milesi-Ferretti (1995): “Economic effects and structural determinants of capital controls”, IMF Staff Papers, 42 (3).
McLean, B and S Shrestha (2002): “International financial liberalization and economic growth”, Research Discussion Papers, no 2002-03, Economic Research Department, Reserve Bank of Australia.


BIS Papers No 44 289
Twenty years of financial liberalisation in Israel: 1987–20071
Zvi Eckstein2 and Tamar Ramot-Nyska3
I. Introduction
In May 2006, Warren Buffet’s US-based Berkshire Hathaway acquired 80% of the stock of Israel-based Iscar Metalworking Companies for USD 4 billion, this being its first acquisition of a firm outside the United States. A while after the acquisition, Mr Buffet said in an interview that “Iscar is a dream deal. It has surpassed all the expectations I had when buying the company and my expectations had been very high”. Isaac Tshuva is an Israeli businessman who started his career as a small local real estate entrepreneur and nowadays has the controlling interest in several transnational investment and holding companies. In 2004 Mr Tshuva bought the Plaza Hotel on Fifth Avenue for USD 675 million. These two deals, despite their outstanding value in Israeli terms, are only two examples of the increasing involvement of Israeli business people and firms in the global economy to an extent that would have been deemed inconceivable or impossible 20 years ago.
In 1984, Israel’s public debt/GDP ratio reached 284% and the State of Israel was close to debt repudiation. At the end of 2006 the ratio was 87%, and at the end of the second quarter of 2007 the economy’s total net liabilities were about USD 22 billion, with a total net debt instrument asset surplus of USD 38 billion.4 These factors imply an improvement in the financial position of the economy and a rapid increase in its openness, expressed by the growing activity of Israeli residents abroad (Graph 9). Twenty years ago the government was diverting a large part of private savings to its budget via administrative measures: there were many restrictions on financial activity, including foreign exchange activity of both Israelis abroad and non-residents in the domestic economy (Ben Bassat (2002)). The supervision of foreign exchange activity had been very strict, and it was almost impossible to do business without the intervention or the permission of the Israeli authorities. For example, there was a quota on the amount of foreign currency that Israelis could take abroad, and residents could not hold real assets abroad (Michaely (2007)).
Over the last 20 years, Israel has moved from almost complete control and deep government involvement in every segment of the financial markets to a regime with a practically independent central bank (see more about the independence of the central bank in Cukierman (2007)) and free capital flows, having implemented many structural and financial reforms. This transformation eased the constraints that had restricted the financial activity of Israelis abroad and of non-residents in the local economy, improved Israel’s position in the global economy and contributed to domestic growth.
Due to growing fiscal expenditure, increasing debt to finance large deficits (Graphs 3 and 4) and an accommodative monetary policy, in 1974–84 the Israeli economy went through a
1 Prepared for the 2008 BIS Deputy Governors’ Meeting on capital flows and financial assets in emerging
markets, Basel, 31 January and 1 February 2008. 2 Deputy Governor, Bank of Israel ([email protected]). 3 Office of the Deputy Governor, Bank of Israel ([email protected]). 4 Data for the end of the second quarter of 2007 are available from the Bank of Israel’s website
(http://www.boi.gov.il/deptdata/pik_mth/iip/iip07e.htm).

290 BIS Papers No 44
period of high inflation and poor economic performance in terms of growth and productivity, a period known as the lost decade. Following the 1967 and 1973 wars, defence expenditure escalated and so did social expenditure. The substantial financial needs of the government impelled it to expand its already intensive involvement in the financial market in order to reduce its deficit financing cost. In addition, during the lost decade there were large deficits in the current account. The government reacted to these shocks with recurrent devaluations of the shekel, raising the prices of supervised products and cutting subsidies, steps which were not accompanied by the appropriate monetary policy and which caused inflationary bumps.
In 1985, after the inflation rate soared to unprecedented levels and the economy almost reached the stage of debt repudiation, an economic stabilisation programme was implemented. This programme required new standards of fiscal and monetary discipline, expressed in particular through restrictions on increases in public expenditure and legislation that prevented the Bank of Israel from supplying the government’s financial needs (known as the No-Printing Law). The implementation of the programme and the adherence to its principles led to the recovery of the economy, which eventually improved the credibility of macroeconomic policy.
The stabilisation programme changed the macroeconomic fundamentals of the Israeli economy. Among these changes, the Israeli money market, capital market, foreign currency market, pension funds, banking system and tax system went through many reforms (Table 2). Based on international experience, the reforms were implemented gradually, in order to integrate Israel into the global economy with minimal shocks to financial stability. The integration process was also supported by the growing interest of investors in emerging economies. However, there is still a need for more financial reform in the future, with the objective of improving the competitiveness of the local economy, making it a more attractive business location for both residents and non-residents, and supporting economic growth.
In the rest of this paper we discuss the macroeconomic and institutional background to the financial reforms, which emphasises the importance of applying new discipline to Israel’s economic administration as formulated in the mid-1980s. We then describe what was done during the economic stabilisation programme of 1985 and how it contributed to the implementation of economic reforms, while focusing on what was done during the liberalisation process. We sum up with an example demonstrating the resilience of the economy.
II. Financial restraint and economic stagnation, 1974–84
Fiscal and monetary policy Israel went through a period of high inflation, economic stagnation and financial restraint from the early 1970s until the mid-1980s. This period, known as the lost decade, came after 15 years of relatively low fiscal deficits, low inflation and strong economic growth. In 1985, when the economy almost reached the stage of debt repudiation, a stabilisation programme established new macroeconomic discipline and set the conditions for economic reforms and a price stability regime. The processes Israel went through have characteristics similar to those in the great inflationary periods described in Sargent (1981) – where governments’ financial needs led to hyperinflation that ended with the implementation of new fiscal and monetary regimes.
The inflationary process in the economy during the lost decade began to accelerate in the wake of the severe shocks that followed the 1973 Yom Kippur War, which resulted in a drastic increase in defence expenditure to over 30% of GDP (Graph 1). An additional major component of government expenditure during that time was growing social expenditure, intended mainly to preserve high employment and to achieve other political and social objectives (Graph 2, Barkai and Liviatan (2007)). This resulted in an increase in government

BIS Papers No 44 291
expenditure to over 75% of GDP during most of the period, high public deficits, and a growing public debt that reached almost 284% of GDP in 1984 (Graph 3). Graph 4 illustrates the inflation rate from 1970 to 1990.
Graph 1
Defence expenditure, 1970–2006 As a percentage of GDP
Source: Central Bureau of Statistics.
Graph 2
GDP growth and the unemployment rate, 1970–2006 In per cent
Source: Central Bureau of Statistics.
0
0.05
0.1
0.15
0.2
0.25
0.3
0.35
0.4
1970
1972
1974
1976
1978
1980
1982
1984
1986
1988
1990
1992
1994
1996
1998
2000
2002
2004
2006
–2
0
2
4
6
8
10
12
14
1970
1972
1974
1976
1978
1980
1982
1984
1986
1988
1990
1992
1994
1996
1998
2000
2002
2004
2006
GDP growth Unemployment rate

292 BIS Papers No 44
Graph 3
Fiscal parameters, 1970–2008 As a percentage of GDP
Data for 1970–80: according to old SNA; thereafter according to new SNA. Broken lines indicate extrapolations. 1 2008–09: Bank of Israel forecast.
Source: Central Bureau of Statistics.
Graph 4
Inflation in the previous 12 months, end of year, 1970–90 In per cent
Source: Central Bureau of Statistics.
0
50
100
150
200
250
300
350
400
450
500
1970 1972 1974 1976 1978 1980 1982 1984 1986 1988 1990
–50
0
50
100
150
200
250
300
350
1970
1972
1974
1976
1978
1980
1982
1984
1986
1988
1990
1992
1994
1996
1998
2000
2002
2004
2006
2008
1
–15
5
25
45
65
85Gross public debt (right-hand scale) Gov expenditure (right-hand scale) Gov deficit (left-hand scale)

BIS Papers No 44 293
Many papers were written about the proceedings during the era of high inflation (for example, Bruno and Fischer (1984)). These describe the attempts to stabilise inflation and inflation expectations and to soften inflation impacts – including such steps as the cut in subsidies aimed at reducing public expenditure, measures aimed at limiting price increases to a certain rate, and wage indexation mechanisms. However, we would stress the high nominal and real price of the economic developments during those years: high deficits in the current account and the public budget, and high inflation. These developments led to controls being imposed on the foreign exchange market, international financial and current account transactions, and the channelling of a large part of private savings into financing the public debt.
Financial markets During the lost decade the economy was characterised by fiscal dominance; monetary policy was accommodative, dominated mostly by the fiscal and political considerations of the government, leaving no room for significant actions by the central bank (Barkai and Liviatan (2007)). In addition, because of the intervention of the government in financial markets and due to discrimination in credit allocation and intervention in the money market, the sphere of influence of monetary policy was narrow (Cukierman (2007)). There was no monetary anchor and the government reacted to deficits in the current account by repeated devaluations of the currency, increasing the prices of supervised products and cutting subsidies. The Bank of Israel had to supply the government’s credit needs by printing money, and its actions during the great inflationary period were mostly concentrated in stabilising the inflationary alignment by considerable sterilisation, and had a smaller influence on the inflation trend (Barkai and Liviatan (2007)).
The inflationary process was influenced by global factors as well, such as the energy crisis of the 1970s. The Israeli reaction was a far-reaching indexation of prices and wages to restrain the real influence of inflation. The government did not adapt its agenda to the changing local and global economic conditions – the increase in defence expenditure, a slowdown in economic and demographic growth and global stagnation, and the deepening of the economic crisis.
Government intervention in the markets included administrative restrictions, exceptional liquidity rates, credit quotas and exemptions, restrictions on international capital flows and discriminatory tax and interest rates. The government discriminated against borrowing by private firms by means of taxation and controls on private bond issues. For example, institutional investors – for example pension funds and trust funds – had to invest 95% of their total annual net inflow of sources in non-tradable government bonds; 60% of short-term credit and 65% of housing loans were directed by the government (Ben Bassat (2002)).
The array of prohibitions and exemptions, the wide range of interest rates, and the measures taken by the government to secure its control of the financial market made the market structure complex, reduced its efficiency, and increased the expenses of financial intermediaries and regulators. This was expressed in a high average cost of finance. For example, the interest on foreign credit in 1985 ranged from 8.3% for the preferred groups to 33.8% for loans subject to administrative limits (Ben Bassat (2007)).
The foreign exchange market As stated above, during the lost decade there were strict controls on foreign exchange activity. However, over the years there was a slow easing of those controls, particularly those on current account transactions. Consequently tariffs on imports were lifted, mostly due to

294 BIS Papers No 44
agreements signed with Israel’s main trading partners.5 Starting in 1991, protection against imports from other areas was gradually lifted as well.
A change in the ruling party in 1977 introduced a revolutionary liberalisation process in the foreign exchange market that eventually failed. The process included two major components: easing of capital flows and a change in the exchange rate system from a crawling peg to a free float. Opening the economy to capital flows against the background of unstable macroeconomic conditions created large demand for foreign funds and led to great monetary expansion and to further devaluations that only increased the inflationary spiral (Michaely (2007)). In 1979 the Bank of Israel ordered Israeli firms and households to stop taking short- and medium-term credit in foreign exchange. Later on, the prohibition was replaced with a system of fines imposed on short- and medium-term credit in foreign exchange that were removed only a few years later with the implementation of liberalisation in the foreign exchange market. The main lesson learned from this episode was that capital flows cannot be liberalised without associated adjustments of the financial system and of monetary policy.
III. The stabilisation programme, 1985
Towards mid-1985 it became harder for the government to increase its already high debt in order to finance the public deficit, and the Israeli economy almost reached the stage of debt repudiation. The large fiscal deficit (Graph 3) became particularly problematic due to the increasing difficulty of sterilising the large monetary injections by selling government bonds, and the government had to finance its deficit by drawing on its foreign exchange reserves. In addition, the current account deficit continued to be relatively large and resulted in recurrent currency devaluations, and the money printing due to the large government deficit strengthened the inflationary spiral. These circumstances required a determined joint programme which would commit the government and the central bank to a different discipline.
The stabilisation policy was implemented with the assistance of experts from academia, the US government, the Ministry of Finance and the Bank of Israel. It was based on several principles: establishment of fiscal balance and perseverance in fiscal discipline for the future, and ending the ability of the Bank of Israel to increase the money supply to finance the public deficit; dealing simultaneously with the balance of payments and inflation issues within the framework of a nominal anchor. Structural and financial reforms were postponed to a later stage.
Within the framework of the programme, a nominal anchor to restrain price increases was adopted and a commitment to new fiscal discipline aimed at reducing the debt/GDP ratio was undertaken. Accordingly, a large cut in the fiscal deficit was made to stop the need to print money (Graph 3) and the exchange rate was chosen as an additional nominal anchor to restrain inflation; it was first pegged to the US dollar, and later to a currency basket. To protect itself from a drastic increase in real wages which could encourage the inflationary spiral, the government had signed temporary wage freeze agreements with the labour unions, which themselves signed a temporary agreement to freeze prices with the Manufacturers’ Association.
An important objective of the stabilisation programme was to reduce the ability of the government to finance its deficit by directing the activity in financial markets and by
5 Israel signed free trade agreements with the European Union in 1977 and the Free Trade Area Agreements
with the United States in 1985.

BIS Papers No 44 295
intervening directly in the management of monetary policy, and to give the central bank greater independence in the management of monetary policy. Accordingly, the No-Printing Law was enacted, which prevented the central bank from giving the government credit to finance its deficits, and direct credit was gradually abandoned. The Bank of Israel was also released from supporting government bond prices, so it had a wider basis from which to affect price stabilisation and was eventually able to manage an independent interest rate policy (Cukierman (2007)).
The stabilisation strategy succeeded remarkably well in supporting the disinflation process and in improving macroeconomic fundamentals. In just a few quarters, inflation decreased from 400% to 20% (Graph 5). From 1987 the exchange rate regime became more flexible: a horizontal exchange rate band was adopted for direct intervention on the foreign exchange market, with an upper and lower boundary of ±3% from the central rate. From the early 1990s the exchange rate was replaced as the main monetary anchor by an inflation targeting regime, with Israel being one of the first countries to operate such a regime, and the interest rate became the main monetary policy tool. After the adoption of inflation targeting the flexibility of the exchange rate was further strengthened and the exchange rate band was widened, until its complete cancellation in 2003.6 Graph 5 illustrates the gradual decrease of inflation rates and the adoption of inflation targets from the early 1990s. These are reflected in the reduction of the public debt from 284% of GDP at the end of 1984 to 199% at the end of 1985.
Graph 5
Inflation in the 12 months and inflation target, 1990–2007 In per cent
Sources: Bank of Israel; Central Bureau of Statistics.
6 From 1996 the Bank of Israel stopped intervening directly in the foreign exchange market, except for
defending the exchange rate boundaries, which was seldom required. The exchange rate band was abandoned in 2005, when the exchange rate regime was practically fully convertible.
–4
1
6
11
16
21
1990 1991 1992 1993 1994 1995 1996 1997 1998 1999 2000 2001 2002 2003 2004 2005 2006 2007
Inflation in the past 12 months Inflation target

296 BIS Papers No 44
The determination of the government to succeed in stabilising the economy and its adherence to the new macroeconomic discipline contributed to the credibility of the programme and of the new economic policy framework, and were highly important to the success of the programme in the short and longer runs. A special US grant of USD 1.5 billion (about 6% of GDP), spread over two years, which the government used only as a financial safety net, boosted confidence in the programme. A further benefit that enhanced the image of the economy was an improvement in US aid in 1985: the conversion of US loans into grants at an annual rate of USD 0.9 billion.
IV. An era of reforms in Israeli financial markets, from 1987 till today
After the 1985 stabilisation programme, Israel’s macroeconomic fundamentals gradually improved and so did the credibility of the Israeli economy, for these benefited from the general interest in emerging economies. As a result, the economic conditions needed for far-reaching financial and structural reforms and full liberalisation of the foreign exchange market emerged. These reforms were implemented via a gradual reduction of government intervention in domestic financial and money markets (Gottlieb and Blejer (2002); Ben Bassat (2007); Michaely (2007)). Yet, much remains to be done to increase competition in the financial markets and the banking sector, and to introduce modern financial instruments.
The 20-year transition to a market economy proceeded along a number of channels simultaneously, which contributed to (1) the establishment of strong macroeconomic discipline to consolidate the credence given to the economy by investors (which is also a condition for the development of financial markets and reforms); (2) a strengthening of the stability of the local banking system; and (3) the development of financial instruments to manage foreign exchange risks and to increase activity in the local economy. The government gradually reduced its involvement in the domestic money and capital markets, removed restrictions on international capital flows and laid the foundations for increased competition between financial intermediaries. This shift included many measures such as changes in the money, foreign exchange and capital markets and many changes in the composition of the budget, influenced by privatisation and other structural changes. Table 1 presents the share of directed credit in total bank credit and the differential between the interest rate on short-term credit and on deposits in selected years. The data illustrate the change over time and the reduction in government control of the market. Table 2 presents the main financial and economic reforms during this period.
Table 1
The outcome of government intervention in the market, selected years
In per cent
Year Share of directed credit in total bank credit
Net interest spread on short-term credit and deposits
1985 60.5 40.7
1990 25.4 16.4
1995 8.2 9.2
2000 4.0 7.8
2004 5.7 7.1
Source: Ben Bassat (2007).

BIS Papers No 44 297
Table 2
Selected economic reforms in Israel since the 1980s
Sphere Main parameters Implementation year of selected measures1
Removal of administrative restrictions on deposits and credit
Since 1987
Reduction in direct discriminatory credit
1982–90
Use of new monetary policy tools
Makam nominal bill: since 1987. Auctions for commercial bank deposits: since 1995
Money market
Decrease in liquidity rates, and avoidance of their use as a monetary tool
Since 1987
Reduction in requirements for institutional investors to invest in government bonds
Since 1987
Removal of the constraints on issuing private bonds
Since 1987
Capital market
Gradual elimination of the issuance of non-tradable government bonds
1987–2003
Liberalisation of the foreign exchange market
1987–2003 Foreign currency market
Revocation of tax on capital flows
2003–04
Elimination of tax discrimination Since 1987 (eliminating tax and subsidies discrimination on production factors and goods)
Tax system
Taxation of financial income Since 2003
Programme to attain actuarial balance in pension funds funded by the government, employers and employees
Since 1995 Pension funds
Raising of retirement age 2004
Splitting of non-banking corporations and subsidies
Since the 1990s
Splitting-off of the management of provident and mutual funds from the banks
Banking system
Splitting-off of underwriting and consulting from the banks
2005 (Bachar Reform)
1 In some cases implementation was spread over a few years; some of the reforms were partial.
Sources: Ben Bassat (2002); Ben Bassat (2007); Michaely (2007).

298 BIS Papers No 44
The planning and implementation of further financial reforms in the Israeli financial market is still continuing. Current working groups and interministerial committees are working on deepening the financial market and making it more competitive and attractive for investors. Among current matters being promoted are the development of the repo and securitisation markets and a deepening of competition in the banking system. These reforms also contribute to the integration of Israeli financial markets into the global economy and to the economy’s financial resilience.
Current account transactions were almost completely free when the liberalisation of the financial account began. Hence, we focus on the reforms that were part of the financial account liberalisation process, and their influence on capital flows and the resilience of the economy. The process which resulted in the full liberalisation of the foreign exchange market in Israel ran from 1987 to 2003, with the objective of abolishing foreign exchange control and achieving full convertibility of the new shekel. This process was part of a strategy to increase the openness of the economy, as it was recognised that the benefits from liberalisation would compensate for its costs – deriving mostly from the required structural and institutional preparations for the development of the capital markets, and from the increase in financial stability risks. The full list of restrictions that still applied to foreign exchange and current account transactions in the Israeli economy in 1987 can be found in Michaely (2007).
The liberalisation process brought the economy from a situation of almost full government control of capital flows and activity in foreign exchange to one of utilisation of relative advantages, free capital movements and much more competitive and efficient capital markets.
The liberalisation of the foreign exchange market was completed in 2003, when all restrictions on capital transactions were eliminated. However, the road to full liberalisation also included a few noteworthy landmarks (Graph 6). In 1993 the export premium programme and a general surcharge on imports were abolished, after which there were no restrictions on current account transactions. In 1998 there was another significant landmark, when the almost full list of restrictions was replaced by a list stating only a few components that remained forbidden – many transactions in the current and capital accounts were permitted from then on, unless they were stated in the list. In the year 2000 the remaining restrictions applied only to the activity of institutional investors, who were allowed to invest only 20% of their assets abroad. In 2003 all restrictions were removed and Israel’s foreign exchange regime became totally free.
Graph 6
Twenty years of foreign exchange liberalisation
FX nominal anchor
Annual inflation target
Multi-year
inflation targeting
Pegged exchange rate regime
Horizontal fluctuation band
Diagonal crawling band
Expansion of the crawling band – no intervention
Removal of the crawling band
FX supervision Lifting of restrictions on capital inflows
Lifting of restrictions on capital outflows
Abolition of most FX supervision procedures
Removal of external sector tax discrimination
1985 1989 1991 1992 1997 1998 2003 2005
Source: Ozer et al (2005).

BIS Papers No 44 299
The sequence of the liberalisation process was designed to integrate Israel into the global markets gradually, with minimal shocks to financial stability. Accordingly, the sequence was set according to the following criteria:
(1) The type and extent of capital movement and liquidity: short-term capital flows have higher volatility and liquidity and they are considered more risky to financial stability. Accordingly, the sequence of liberalisation was to allow free long-term capital imports, including direct investments, and investments in securities and long-term bonds before the shorter-term transactions. Capital outflows gradually became feasible only at a later stage, and again, long-term flows were allowed before their shorter-term counterparts. Restrictions on capital outflows by domestic residents were also removed gradually, starting with those on long-term financial investments; only at a later stage were they removed from shorter-term investments as well.
(2) Sectors of the economy: priority was given to removal of restrictions on the activity of the business sector and of non-residents, because the government considered that these sectors could boost the domestic economy’s integration into the global economy and contribute to its growth. Restrictions on the activity of households and institutional investors were removed only at a later stage. Households were permitted first to make financial investments abroad, subject to tax discrimination, which was not applicable to the financial activity of the business sector. The tax discrimination was totally removed only in 2003–04, a while after the restrictions on investments were removed as well. The holding of foreign currency bank accounts abroad by households was delayed to later stages in the process. The institutional investors sector, which represents the main part of households’ savings, was left to the end of the process in view of this sector’s considerable potential to transfer capital abroad.
V. The influence of the liberalisation process on capital flows
The increased capital flows into the Israeli economy were the outcome of a combination of good luck and good policy. The liberalisation process, alongside other macroeconomic reforms and improvements in the fundamentals of the economy, altered the magnitude and composition of the financial account, increased the economy’s accessibility to world markets and improved its credit rating. In addition to the impact of the internal changes mentioned above, the Israeli economy benefited from its inclusion among emerging markets and the growing interest of foreign international investors in such markets.
From 1997, Israel’s financial activity vis-à-vis other countries underwent significant changes, reflected both in an increased volume of capital flows and in a growing number of participants. A few simultaneous developments contributed to this evolution: the liberalisation of the foreign exchange market, which offered more possibilities for Israelis to raise capital abroad and to invest abroad; increased exposure of the economy to external factors, which was a part of the globalisation process and which was expressed, inter alia, by increased capital flows to and from emerging markets; and tax reforms that reduced distortions in the taxation of financial assets, contributing to increased investments abroad by Israelis (mostly households and institutional investors). All of these developments came in addition to the fast expansion of the local financial market and of the Israeli high-tech industry and its position as a leading sector in the economy.
During the liberalisation years, non-resident investment in equity and foreign direct investment (FDI) in Israel grew rapidly (Graph 7), and the proportion of tradable investment and activity in the Tel Aviv Stock Exchange in the economy also increased (Graph 8), all of which contributed to a change in the composition of the assets and liabilities portfolio of the economy. The change in the net external (debt instrument) liabilities position of the economy from positive to negative (Graph 9) shows the increase in investment in debt instruments of

300 BIS Papers No 44
Israelis abroad – the economy had moved from a position of net borrower to net lender – and reflects the greater openness of the economy. Accordingly, there was a substantial increase of more than 160% in the assets of Israelis abroad, mainly in direct investments, tradable bonds and foreign exchange credit, and an increase of over 95% in Israeli residents’ liabilities, with the main growth being in FDI and in tradable bonds. Over the years, the share of long-term capital inflows increased and so did the economy’s credit rating, providing further witness to its fundamental credibility (Gottlieb and Blejer (2002); Rehavi and Weingarten (2006)).
Graph 7
Non-resident investment in Israel, 1985–2006 In billions of US dollars
Source: Bank of Israel.
One main outcome of the increased exposure of the economy to capital flows and other financial reforms is the enlargement in the number and variety of participants in financial activity. For example there has been an expansion in the Israeli private non-banking sector, which has boosted the raising of capital abroad and decreased the dependency of residents on the traditional financial intermediaries, such as the Israeli government and domestic banks. As a result, the traditional intermediaries’ share in Israel’s total external liabilities has declined, while the share of the private non-banking sector has risen (Rehavi and Weingarten (2006)).
Following international experience and the unsuccessful liberalisation process of the 1970s, the gradual removal of restrictions on foreign exchange activity was followed by a shift from supervision by the central bank to documentation of the activity of financial entities (Ozer et al (2005)). The slow process of foreign exchange market liberalisation enabled the Bank of Israel to progressively develop a data infrastructure that documents the activity of Israeli residents in foreign currency markets and non-residents’ activity in local markets. The reporting network includes reports from various financial intermediaries, primarily banks, on their activity abroad and in foreign currency, as well as direct reports from corporations and individuals whose volume of activity exceeds a certain threshold.
–1
1
3
5
7
9
11
13
15
1985 1986 1987 1988 1989 1990 1991 1992 1993 1994 1995 1996 1997 1998 1999 2000 2001 2002 2003 2004 2005 2006
PortfolioFDI Other investment

BIS Papers No 44 301
Graph 8 Tel Aviv Stock Exchange, non-resident turnover
In billions of US dollars
Source: Bank of Israel.
Graph 9 Net external (debt instrument) liabilities position
In billions of US dollars
Source: Bank of Israel.
–40
–30
–20
–10
0
10
20
30
1985 1986 1987 1988 1989 1990 1991 1992 1993 1994 1995 1996 1997 1998 1999 2000 2001 2002 2003 2004 2005 2006 2007
Net external liabilities
–4
1
6
11
16
21
26
31
36
1985 1986 1987 1988 1989 1990 1991 1992 1993 1994 1995 1996 1997 1998 1999 2000 2001 2002 2003 2004 2005 2006
InvestmentRealisation

302 BIS Papers No 44
Monitoring capital flows and trends in new shekel/forex markets contributes to the management of monetary policy and the maintenance of financial stability; in particular it contributes to early identification of developments essential to the decision-making process, especially in small open economies. Therefore, in its meetings, the monetary policy forum at the Bank of Israel receives a detailed summary of the financial stability of the economy and of the past and expected trends and developments in the foreign exchange market, based, among other things, on data on foreign exchange activity. In addition, the participants receive an evaluation of the economy’s exposure to economic risks, applying to the activity of both residents and non-residents.
VI. Free capital movements and the resilience of the economy
Since 1987, the Israeli economy has experienced a few major events which undermined financial stability and were reflected by substantial depreciation and a marked increase in exchange rate volatility. Three examples of such events are the worldwide financial crises in 1998, local developments that affected the yield-versus-risk ratios in the economy in 2002, and the impact of the Second Lebanon War, in 2006. We will focus on the impact of the last event.
The Second Lebanon War began in mid-July 2006 and lasted 32 days. The war led to a slowdown in economic activity in the north of Israel and also had an impact on the rest of the country. During the period of the war, business production fell by an annualised 4.1% and aggregate GDP fell by an annualised 0.8%, due to the growth in public spending and the slowdown in economic activity. However, the slowdown was scarcely apparent in domestic uses and mainly influenced exports and inventories.
Graph 10
The new shekel/US dollar exchange rate during the Second Lebanon War
Source: Bank of Israel.
4.3
4.35
4.4
4.45
4.5
4.55
4.6
1 Ju
n 06
8 Ju
n 06
15 J
un 0
6
22 J
un 0
6
29 J
un 0
6
6 Ju
l 06
13 J
ul 0
6
20 J
ul 0
6
27 J
ul 0
6
3 Au
g 06
10 A
ug 0
6
17 A
ug 0
6
24 A
ug 0
6
31 A
ug 0
6
7 Se
p 06
Outbreak of the hostilities

BIS Papers No 44 303
In spite of the war in the north, financial markets (foreign currency and domestic bonds) showed steadfastness throughout the second half of 2006, with annual GDP growth of 5.1% (Graph 2). In the first few days of the war the new shekel depreciated by 3% (Graph 10), and exchange rate risk, measured by the implied volatility of (mainly short-term) new shekel/dollar options, rose by 2.5% to 8%. Three weeks after the hostilities began, the exchange rate and implied volatility reverted to their prewar levels, and summarising the whole of the period of the war, exchange rate risk was steady.
During the Second Lebanon War the Bank of Israel published a few press releases in order to calm the markets and to strengthen confidence in Israeli markets and the credence of economic policy. The reaction of investors, foreign and domestic, throughout the war was milder than it had been during earlier crises, when households had reacted by buying significant quantities of foreign currency (Bank of Israel (2007a,b)).
During the above-mentioned events, the Bank of Israel refrained from intervening in the foreign exchange market, but reacted vigorously with the interest rate tool or with relevant press releases to strengthen public confidence in economic policy with a view to counteracting processes that could undermine financial stability.
VII. Conclusion
The economic events of the past 30 years in Israel give an example of an economy that moved from a situation of almost complete government control over financial markets, with economic institutions serving the government’s financial needs, to an economy with strict fiscal discipline, an independent monetary policy and open and free financial markets. The gradual move to a market economy in Israel has expanded its economic resources and increased its growth potential.
Since the implementation of the stabilisation programme in 1985, fiscal discipline has been maintained despite frequent changes of government and high defence risks, and a continuous process of economic reforms has been pursued. Evidence of the improvement in the credence of the economy and its adherence to stable economic policy is provided by a Standard & Poor’s announcement regarding the decision to raise Israel’s long-term foreign currency sovereign credit rating from A– to A at the end of November 2007:
“The ratings are moreover supported by Israel’s prosperous economy and strong political commitment to long-term fiscal consolidation … Fiscal consolidation intensified in 2007, and the general government debt burden continued its downward trend to 82% of GDP at year-end 2007 ... Israel has additional borrowing flexibility due to the loan guarantee program by the United States, its key ally ...”.
Much has to be done in the future to make the Israeli capital market more compatible with international standards. Continuing the gradual economic reforms that began 20 years ago is essential to achieving increased capital market efficiency and stability. However, these things can be achieved only if the economy continues to adhere to strict fiscal rules and a responsible monetary policy that will reinforce its credibility and contribute to growth and resistance to financial risks.

304 BIS Papers No 44
References
Bank of Israel (2007a): Inflation Report 2006, July–December, February.
——— (2007b): Annual Report 2006, April.
Barkai, H and N Liviatan (2007): “A Monetary History”, in The Bank of Israel: Selected Topics in Israel’s Monetary Policy, vol 1, Oxford University Press.
Ben Bassat, A (2002): “The Obstacle Course to a Market Economy in Israel”, in A Ben Bassat, The Israeli Economy, 1985–1998: From Government Intervention to Market Economics, MIT Press.
——— (2007): “Conflict, Interest Groups and Politics in Structural Reforms”, unpublished working paper.
Bruno, M (1989): “Israel’s Crisis and Economic Reform in Historical Perspective”, Economic Quarterly, vol 40, no 141 (in Hebrew).
Bruno, M and S Fischer (1984): “The Inflationary Process in Israel: Shocks and Accommodation”, NBER Working Papers, no w1483.
Cukierman, A (2007): “De Jure, De Facto, and Desired Independence: The Bank of Israel as a Case Study”, in N Liviatan and H Barkai (eds), The Bank of Israel: Selected Topics in Israel’s Monetary Policy, vol 2, Oxford University Press.
Djivre, J and D Tsiddon (2002): “A Monetary Labyrinth: Instruments and the Conduct of Monetary Policy in Israel, 1987–1998”, in A Ben Bassat, The Israeli Economy, 1985–1998: From Government Intervention to Market Economics, MIT Press.
Gottlieb, D and M Blejer (2002): “Liberalization in the Capital Account of the Balance of Payments”, in A Ben Bassat, The Israeli Economy, 1985–1998: From Government Intervention to Market Economics, MIT Press.
Michaely, M (2007): “The Liberalization in Israel’s Foreign Exchange Market, 1950–2002”, in N Liviatan and H Barkai (eds), The Bank of Israel: Selected Topics in Israel’s Monetary Policy, vol 2, Oxford University Press.
Ozer, B, S Reiss and Y Soffer (2005): Israel’s Financial Account Liberalization, Foreign Exchange Activity Department, Bank of Israel.
Rehavi, Y and A Weingarten (2006): Israel’s Financial Account, 1998 to 2005, Foreign Exchange Activity Department, Bank of Israel (in Hebrew).
Reiss, S (2006a): The Meaning of Short-Term Capital Import to the Economy, Foreign Exchange Activity Department, Bank of Israel, unpublished.
——— (2006b): The Exposure of the Non-Banking Private Sector to Exchange Rate Risks – Short-Term Implications, Foreign Exchange Activity Department, Bank of Israel, unpublished.
Sargent, T J (1981): “The Ends of Four Big Inflations”, Federal Reserve Bank of Minneapolis Working Paper no 158.
Strawcynski, M and J Zeira (2002): “Reducing the Relative Size of Government in Israel After 1985”, in A Ben Bassat, The Israeli Economy, 1985–1998: From Government Intervention to Market Economics, MIT Press.

BIS Papers No 44 305
Capital flows and effects on financial markets in Korea: developments and policy responses
Byung Chan Ahn1
I. Introduction
Despite having relatively sound macroeconomic fundamentals, Korea experienced a currency crisis at the end of 1997, as domestic banks faced difficulties renewing their overseas borrowings owing to contagion from the East Asian region. After the crisis, Korea changed its exchange rate regime from a market average exchange rate system to a free-floating system in December 1997. Along with this change, Korea switched its monetary policy framework from monetary targeting to inflation targeting with a call rate operating target. In addition, Korea has opened its domestic financial and capital markets step by step. The capital markets in Korea have now been opened in almost all areas, including equity and bond transactions. Investment overseas by residents has also been liberalised. As a result, capital inflows to and outflows from Korea have increased greatly.
With the deepened linkage between domestic and international financial markets, the domestic financial and foreign exchange markets are now significantly influenced by overseas factors. Korean policymakers have worked to minimise the possibility of negative effects arising from the much greater exposure of the Korean economy and its financial markets to external shocks such as changes in international capital flows. They will need to strengthen their various efforts in the future.
This paper is organised as follows. Section II describes the developments related to capital flows in Korea since 2002 and their characteristics. Section III analyses the impacts of capital flows on the domestic capital, deposit and foreign exchange markets. Lastly, Section IV deals with policy responses related to exchange rates, monetary policy and financial stability.
II. Capital flows in Korea
After the currency crisis at the end of 1997, Korea’s capital account temporarily registered deficits in 1998 and 2001, owing to increased overseas loan payments triggered initially by difficulties in extending the maturities of loans and then by the early redemption of the country’s IMF loan.
Since 2002, however, Korea’s capital account has shown substantial surpluses, thanks to the increases in direct and indirect investment by foreign investors encouraged by strengthened corporate and financial restructuring.
In particular, both capital outflows and capital inflows have increased markedly since 2006. This reflects an increase in portfolio investment abroad by residents, a rapid rise in financial institution borrowing to meet the resulting demand for foreign currency, and an increase in
1 Director General, International Department, Bank of Korea. The author is deeply indebted to Yong-Seung
Cho, Chanho Park, Weon-Joon Lee and Areum Kim of the International Finance Research Team, International Department, for their valuable contributions.

306 BIS Papers No 44
corporate trade credits. At the same time, the current account surplus has shown a gradual decline.
Table 1
Capital account trends in Korea In billions of US dollars
91–961 1997 1998 1999 2000 2001 2002 2003 2004 2005 2006 2007
Capital account2
(A–B) 11.5 1.9 –3.4 2.4 12.7 –2.7 7.3 15.3 9.4 7.1 21.1 8.6
Inflows (A) 23.1 17.9 –3.7 7.6 20.1 –2.0 12.3 27.5 29.5 24.7 59.5 84.7
Outflows (B) 11.6 16.0 –0.3 5.2 7.4 0.7 5.0 12.2 20.1 17.6 38.4 76.11 Based on yearly averages. 2 Excludes the other capital account (eg migrants’ transfers, patent right sales) from the capital account (BOP basis).
Source: Bank of Korea.
1. Capital inflows During 2002–05, gross capital inflows to Korea averaged USD 23.5 billion a year. This was led largely by foreign portfolio and direct investment, which accounted for 54.2% and 22.8% of total capital inflows, respectively. Of the foreign portfolio investment, investment in equity securities was a little greater than that in debt securities. Major factors behind the increase in direct and portfolio investment inflows were Korea’s improved credit ratings after the early IMF loan redemption in 2001, the country’s improved economic fundamentals, and its improved investment environment due to the continuation of corporate and financial restructuring. Owing to the increased export and import volume, corporate trade credits expanded during the period and accounted for 27.3% of total capital inflows.
Gross capital inflows were about USD 60 billion and USD 85 billion in 2006 and 2007, respectively, or 2.6 times and 3.6 times the yearly average for 2002–05 as shown in Graph 1. This was driven largely by increased financial institution borrowing to meet demand for foreign currency, owing to a reversion to net outflows in foreign equity investment and increases in portfolio investment abroad by residents. At the same time, the current account surplus declined substantially due to the won’s rapid appreciation.
The composition of gross inflows has changed significantly. Gross inflows in foreign equity investment have been negative in recent years, reaching USD –28.7 billion in 2007, more than triple the USD –8.4 billion recorded in 2006. This is mainly because international investment banks and hedge funds sold the Korean stocks in which they had invested, in order to compensate for their losses related to the US subprime mortgage crisis. Behind the outflows of foreign equity investment were background factors such as the relatively high weight of foreign investment in the Korean stock market compared to other emerging economies’ stock markets, the surge in capital gains due to the recent rise in stock prices, and an environment in which retrieving an investment is easy owing to the abundant liquidity in the Korean stock market. It is hard to see this as a “sell Korea” trend, because foreign ownership in the Korean stock market, as of the end of 2007, stood at 30.9%, higher than the average (27~28%) in emerging economies, and also because Korea still has strong economic fundamentals. In contrast, foreign investment in the bond market has risen greatly.

BIS Papers No 44 307
It increased by USD 52.1 billion in 2007 and hovered above net outflows of foreigners’ investment from the stock market. This was due to a greater incentive for arbitrage, created by a drop in swap rates resulting from massive sales of forward dollars by export companies, including those in the shipbuilding industries, and by asset management companies promoting residents’ foreign securities investment to hedge their own exchange rate risks. As part of this trend, financial institution borrowings rose sharply and have accounted for 59.4% of total capital inflows since 2006. Trade credits have also increased, owing to an expansion in import volume. The weight of foreigners’ portfolio investment has, however, decreased to 15.9%, due to net declines in foreign portfolio investment in the equity market. In contrast, the ratio of foreign investment to total inflows in the bond market has increased to 26.7%. The ratio of foreign direct investment to total inflows has also decreased, to 3.6%.
Table 2
Trends of capital inflows to Korea In billions of US dollars
2001 2002 2003 2004 2005 2006 2007 2002–051,3 2006–071,3
FDI 3.5 2.4 3.5 9.2 6.3 3.6 1.6 5.4 (22.8) 2.6 (3.6)
Portfolio investment 11.7 4.5 21.5 16.0 9.0 0.4 23.3 12.7 (54.2) 11.5 (15.9)
(Equity investment) 10.3 0.4 14.4 9.5 3.3 –8.4 –28.7 6.9 (29.3) –18.6 (–18.1)
(Bond investment) 1.4 4.1 7.1 6.5 5.7 8.0 52.1 5.8 (24.8) 30.0 (26.7)
Bank borrowings –13.2 1.9 –5.0 –0.9 1.0 44.2 41.6 –0.8 (–3.2) 42.9 (59.4)
Trade credits –2.8 3.5 6.3 8.1 7.8 13.1 13.6 6.4 (27.3) 13.3 (18.5)
Other –1.2 0.0 1.2 –2.9 0.6 –0.9 4.7 –0.2 (–1.1) 1.9 (2.6)
Gross inflows2 –2.0 12.3 27.5 29.5 24.7 59.5 84.7 23.5 (100) 72.1 (100) 1 Yearly averages. 2 Excludes the other capital account (eg migrants’ transfers, patent right sales) from the capital account (BOP basis). 3 Figures in parentheses refer to the weights in total inflows.
Source: Bank of Korea.
2. Capital outflows During 2002–05, gross capital outflows from Korea averaged USD 13.7 billion a year. This was mainly led by residents’ portfolio investment and direct investment abroad. The former accounted for 46.3% of total capital outflows and the latter for 27.3%. In portfolio investment, investment in bonds was a little greater than that in equities. However, both corporate trade credits and loans for non-residents were negligible.
Capital outflows from Korea have grown considerably since 2006. They totalled USD 38.4 billion in 2006 and USD 76.1 billion in 2007, 2.8 and 5.6 times greater, respectively, than the 2002–05 averages, as shown in Graph 1. In particular, portfolio investment increased from USD 6.3 billion during 2002–05 to USD 42.4 billion in 2007, accounting for 56% of total capital outflows for the year. Most of the portfolio investment abroad has been in the form of equities, whereas bond investment has been a small sum. This big increase in capital outflows has been due mainly to the measures to promote residents’ portfolio investment

308 BIS Papers No 44
abroad since early 2006.2 Direct investment abroad by residents quadrupled from USD 3.8 billion, the yearly average over 2002–05, to USD 15.3 billion in 2007. However, the ratio of direct investment abroad to total capital outflows decreased to 20.4% during 2006–07.
Table 3
Trends of capital outflows from Korea In billions of US dollars
2001 2002 2003 2004 2005 2006 2007 2002–051,3 2006–071,3
Direct inv abroad 2.4 2.6 3.4 4.7 4.3 8.1 15.3 3.8 (27.3) 11.7 (20.4)
Portfolio inv 5.1 3.8 3.6 7.4 10.7 22.4 42.4 6.3 (46.3) 32.4 (56.5)
(Equity inv) 0.5 1.5 2.0 3.6 3.7 15.3 52.4 2.7 (19.6) 33.9 (59.1)
(Bond inv) 4.6 2.3 1.6 3.8 7.0 7.1 –10.0 3.6 (26.7) –1.5 (–2.6)
Bank loans –3.1 –4.8 4.5 2.4 –0.3 1.3 10.3 0.5 (3.4) 5.8 (10.1)
Trade credits 1.2 0.7 0.0 1.0 –0.5 1.6 2.0 0.3 (2.2) 1.9 (3.2)
Other –4.9 2.7 0.7 4.7 3.4 5.1 6.1 2.8 (20.8) 5.6 (9.7)
Gross outflows2 0.7 5.0 12.2 20.2 17.6 38.4 76.1 13.7 (100) 57.3 (100) 1 Yearly averages. 2 Excludes the other capital account (eg migrants’ transfers, patent right sales) from the capital account (BOP basis). 3 Figures in parentheses refer to the weights in total outflows.
Source: Bank of Korea.
3. Net capital flows During 2002–05, net capital flows to Korea amounted to average inflows of USD 9.8 billion a year. This was driven mainly by net portfolio investment and net trade credits, which averaged about USD 6 billion each over the period. In portfolio investment, net investment in equities was a little larger than that in bonds. However, other items, including cash and deposits and banks’ net borrowings, registered net outflows.
Meanwhile, net capital inflows to Korea have grown greatly since 2006. In 2006, they stood at USD 21.1 billion, more than twice the 2002–05 average. They showed a further increase of USD 8.6 billion in 2007. This increase over the past two years has been led mainly by banks’ net borrowings, which accounted for USD 37.1 billion, and net trade credits, which made up USD 11.5 billion. However, portfolio investment recorded net outflows of USD 20.9 billion, owing to a large decrease in net equity investment (USD 52.4 billion) and despite a sharp increase in net bond investment (USD 31.5 billion). In addition, direct investment has reverted to a net outflow.
2 All restrictions on the range of foreign currency securities in which residents can invest were abolished and the
limit on overseas investment funds was increased in March 2006.

BIS Papers No 44 309
Table 4
Trends of net capital flows in Korea In billions of US dollars
2001 2002 2003 2004 2005 2006 2007 2002–051
2006–071
Net direct inv 1.1 –0.2 0.1 4.6 2.0 –4.5 –13.7 1.6 –9.1
Net portfolio inv. 6.6 0.7 17.9 8.6 –1.7 –22.7 –19.1 6.4 –20.9
(Equity inv.) 9.8 –1.1 12.4 5.8 –0.4 –23.7 –81.2 4.2 –52.4
(Bond inv.) –3.2 1.8 5.5 2.8 –1.3 0.9 62.1 2.2 31.5
Net bank borrowings –10.1 6.7 –9.5 –3.3 1.3 42.9 31.2 –1.2 37.1
Net trade credits –4.0 2.7 6.3 7.1 8.2 11.5 11.5 6.1 11.5
Other 3.7 –2.6 0.5 –7.6 –2.7 –6.0 –1.3 –3.1 –3.7
Total net flows2 –2.7 7.3 15.3 9.4 7.1 21.1 8.6 9.8 14.9 1 Yearly averages. 2 Excludes the other capital account (eg migrants’ transfers, patent right sales) from the capital account (BOP basis).
Source: Bank of Korea.
Graph 1
Trends of capital account by composition in Korea In billions of US dollars
Source: Bank of Korea.
–150
–100
–50
0
50
100
150
91–96 1997 1998 1999 2000 2001 2002 2003 2004 2005 2006 2007
Other investment accountDebt securities accountEquity securities accountDirect investment accountCapital account

310 BIS Papers No 44
III. Effects of capital flows on domestic financial markets
After the currency crisis in 1997, Korea liberalised the capital account and introduced a free-floating exchange rate system. Since then, capital inflows and outflows have expanded, particularly during 2006 and 2007 when they increased substantially. These trends largely reflected sharp increases in the export orders of Korean shipbuilding companies and in residents’ portfolio investment abroad and the resulting greatly increased hedging through the forward markets. These changes in capital flows have influenced the development of Korean financial markets and strengthened the linkage between domestic and international financial markets.
1. Capital market
Stock market Since the currency crisis at the end of 1997, sustained large-scale foreign investment inflows have fostered the development of the Korean stock market in terms of both quantity and quality, through expansion of the stock demand base.
In terms of quantity – first, the volume of stock transactions stood at about 265 billion shares in 2005, 22 times the 12.2 billion recorded in 1997. Second, the Korean stock price index (KOSPI) reached 1,379 at the end of 2005, 3.7 times the 376 at the end of 1997. Third, total market capitalisation of listed shares amounted to KRW 726 trillion (equivalent to USD 718 billion) at the end of 2005, compared to KRW 78 trillion (USD 46 billion) at end-1997.
From the perspective of quality – first, the composition of stock market participants’ shareholdings has changed drastically. Between 1998 and 2005, the proportion of shareholdings of foreigners and institutional investors increased from 18% and 13.7% to 37.2% and 18.6%, respectively, while that of government and public bodies decreased from 19.7% to 3.7%, indicating an expansion of the Korean stock market’s investor base. Second, the equity derivatives markets such as the KOSPI futures and KOSPI options have made considerable progress, and the equity derivatives market structure has deepened. The daily volume of KOSPI 200 futures transactions totalled 176,000 contracts at the end of 2005, a sixteenfold increase over the 11,000 contracts at the end of 1997. In addition, the daily volume of transactions in KOSPI 200 options rose 318 times from 32,000 contracts at the end of 1997 to 10,182,000 at the end of 2005.
Despite foreigners’ stock investment having reverted to a net selling position since 2006, the Korean stock market has shown sustained stable growth, as the KOSPI has risen greatly and transactions have maintained relatively high volumes thanks to the expansion of both market scale and investor base. First, although the volume of stock transactions has more or less declined compared with 2005, amounting to 203 billion shares in 2006 and 233.6 billion in 2007, it still represents a high level. Second, the KOSPI has maintained a strong upward trend, reaching 1,434 points at the end of 2006 and climbing further to 1,897 at the end of 2007, even though the proportion of foreigners’ shareholdings has declined. Third, market capitalisation has expanded considerably, from KRW 777 trillion (equivalent to USD 835 billion) at the end of 2006 to KRW 1,052 trillion (USD 1,124 billion) at the end of 2007. Lastly, the equity derivatives market has grown steadily, showing a recovery trend where the daily transaction volume in KOSPI 200 futures was 189,000 contracts at the end of 2006 and 195,000 contracts at the end of 2007, while the daily transaction volume in the KOSPI 200 options market was 9,775,000 contracts at end-2006 and 11,076,000 contracts at the end of 2007.

BIS Papers No 44 311
Table 5
Key Korean stock market indicators
1997 1999 2001 2003 2004 2005 2006 2007
Transaction volume1 12.2 78.0 210.8 234.7 164.3 265.3 203.0 233.6
Market capitalisation2, 3 78.1 448.2 307.7 392.7 443.7 726.0 776.7 1,051.8
KOSPI2 376 1,028 694 811 896 1,379 1,434 1,897
Foreign shareholding proportion2, 4 18.5 32.2 37.7 40.1 37.2 35.2 30.9
Transaction volume of KOSPI 200 futures5 11 69 128 252 223 176 189 195
Transaction volume of KOSPI 200 options5 32 321 3,347 11,489 10,127 10,182 9,775 11,0761 In billions of shares. 2 Period-end basis. 3 In trillions of won. 4 Market capitalisation (KOSPI + KOSDAQ) basis, in per cent. 5 Daily average, in thousands of contracts.
Source: Korea Exchange.
With the increase in foreigners’ investment in the Korean stock market, there has been greater coupling of the movements of domestic and US stock prices. During the period 1999–2006, the correlation of the KOSPI with the Nasdaq and Dow Jones indices averaged 0.72 and 0.61, respectively.
Table 6
Correlation between the KOSPI and US stock indices
1995–97 1999 2001 2003 2005 2006 1999–2006
Nasdaq –0.17 0.71 0.46 0.95 0.79 0.79 0.72
Dow Jones –0.27 0.88 0.48 0.95 0.38 0.58 0.61
Source: Bank of Korea, Monthly Bulletin, September 2007.
The increase in foreigners’ investment, which enables the investor base of the domestic stock market to expand and also provides more ample liquidity, could have positive effects on the Korean stock market. However, in the case of continued large-scale inflows and outflows of foreigners’ investment, this is likely to cause domestic financial market volatility, particularly due to the amplification of stock price volatility.
Bond market Until 2005, foreign investment in the Korean bond market was smaller than that in the Korean stock market. The investment was also limited to Korean Treasury bonds (KTBs) and monetary stabilisation bonds (MSBs) issued by the government and the Bank of Korea, respectively. The foreign-held share in total KTBs and MSBs outstanding stood at only 1.0% at the end of 2005. However, inflows of foreigners’ investment to the KTB and MSB markets increased substantially in 2007, with the foreign share rising to 9.5% at the end of that year. The rise of foreign ownership in the Korean bond market has been mainly attributable to

312 BIS Papers No 44
foreign investors’ increased buying of KTBs and MSBs at the cost of the Korean won in exchange for foreign currency funds through currency rate swaps (CRS pay or sell & buy swaps) due to the increase in arbitrage incentives.
Table 7
Swap rates and domestic-foreign interest rate differentials Annual, in per cent
2004 2005 2006 2007
Foreign currency swap rate (A)1 2.19 0.04 –0.77 –1.40
Domestic-foreign interest rate differential (B)2 2.14 0.09 –0.51 –0.14
Difference (A–B) 0.05 –0.05 –0.26 –1.26 1 (Three-month non-deliverable forward (NDF) rate/spot exchange rate – 1) × 4 (annual %); NDF rate based on bid-offer midrate published by ICAP as of 15:00. 2 Certificates of deposit (three-month) – Libor (three-month).
Source: Bank of Korea.
Foreign investors also play a major role in the KTB futures market. The proportion of foreigners’ transactions rose sharply, from 9.9% in 2005 to 14.3% in 2006. The KTB futures market has thus also made considerable progress in terms of quality, supported by foreign investor participation.
In the meantime, Korean bond investment (net buying basis) by foreign bank branches totalled less than USD 1 billion in 2005 but then increased sharply, by USD 17 billion in 2006 and by USD 14 billion in 2007. Along with this, the share of banks’ transactions in the KTB futures market has maintained a strongly upward trend, and a substantial part of this seems to be attributable to transactions by foreign bank branches.
Foreigners’ influence on KTB yields has recently grown. The negative correlation between the foreign ownership ratio and the interest rate gap (KTB yield minus the call rate) has become more evident, with the correlation coefficient shifting from 0.06 during 2000–04 to –0.15 during 2005–07.
Table 8
Korean bond market participation by foreigners and foreign bank branches
2005 2006 2007
Net buying by foreigners (USD billions)1 0.6 1.5 32.2
Net buying by foreign bank branches (USD billions)2 0.9 17.4 13.8
Transaction vol of KTB futures (3-yr) (thousands of contracts)3 45 42 56
Ratio of foreigners’ transaction in KTB futures (3-yr) (%) 9.9 14.3 11.8
Ratio of banks’ transactions in KTB futures (3-yr) (%) 35.0 35.8 38.8 1 In- and outflow basis; external accounts for securities investment. 2 Net buying basis. 3 Daily average.
Source: Korea Exchange, Korean Financial Supervisory Service.

BIS Papers No 44 313
2. Deposit market Since 2003, the government has adopted various measures to encourage foreign securities investment. In March 2003 the range of foreign securities eligible for investment by residents was extended, and in March 2006 the Korean government abolished the limits on foreign securities investment by individual investors. From June 2007, the government also exempted domestic asset management companies from taxation on gains through overseas stock purchases in foreign investment funds. Thanks to these measures, residents’ foreign portfolio investment has increased sharply, from USD 5.2 billion in 2003 to USD 56.1 billion in 2007.
Table 9
Residents’ foreign securities investment1, 2 In billions of US dollars
2002 2003 2004 2005 2006 2007
Residents’ foreign securities investment 4.2 5.2 12.4 18.5 29.5 56.1 Change over previous year (%) (23.8) (138.5) (49.2) (59.5) (90.2) 1 Based on foreign exchange receipt and payment statistics. 2 Figures in parentheses indicate the percentage change rates compared with the same period of the previous year.
Source: Bank of Korea.
As residents’ foreign securities investment has grown rapidly, there have been corresponding changes in the deposit market, including a decline in the volume of bank deposits (excluding certificates of deposit (CDs) and bank debentures) and a significant rise in deposits at asset management companies. Accordingly, the share of bank deposits in the total sum of the two decreased to 73% at the end of 2007, from 81% in 2003. The savings outflow from banks into asset management companies has thus continued, leading to more difficult financing circumstances. In reaction to this, banks have augmented their issuance of CDs and bank debentures to ensure sufficient fund-raising, leading to increases in interest rates on CDs and bank debentures.
Table 10
Changes in deposits at banks and asset management companies
2002 2003 2004 2005 2006 2007
Bank deposits (A)1 580.8 630.8 642.6 686.7 759.8 810.8 (CD issuance amount) 18.3 29.9 39.2 55.6 66.9 95.2 (Debenture issuance amount) 46.0 56.1 68.5 76.7 108.3 137.5
Asset management company deposits (B)1 174.9 145.0 187.0 204.3 234.6 296.4 Total (A+B)1 755.7 775.8 829.6 891.0 994.4 1,107.2 C = [A/(A+B)] 0.77 0.81 0.77 0.77 0.76 0.73 D = [B/(A+B)] 0.23 0.19 0.23 0.23 0.24 0.27 CD interest rates2 4.79 4.27 3.46 4.25 4.77 6.04 Bank debenture interest rates2 5.04 4.78 3.48 4.94 4.96 6.42 1 Based on period-end figures, in trillions of won. 2 Based on figures for new issuances; average annual interest rates in December; in per cent. Source: Bank of Korea.

314 BIS Papers No 44
3. Foreign exchange market The average amount of daily trading in the spot foreign exchange market has seen a considerable increase of 30% annually from 2002 to 2007, reaching USD 18.8 billion in 2007 compared to USD 5 billion in 2002. This significant growth in transactions in the spot market is due to several factors. First, Korea’s export-import volume has expanded by 19% a year on average since 2002. Second, the total amount of inflows and outflows of investments by foreigners has gone up greatly. Third, due to the increase in arbitrage trading incentives since 2006, financial institutions’ net borrowings rose to USD 42.9 billion and USD 31.2 billion in 2006 and 2007, respectively.
Table 11
Volumes of capital and spot exchange market transactions In billions of US dollars
2002 2003 2004 2005 2006 2007
Capital transactions (net) 6.3 13.9 7.6 4.8 18.0 6.2
(Foreign portfolio capital inflows) 73.0 83.3 122.6 166.2 237.4 371.9
(Foreign portfolio capital outflows) 74.6 70.8 113.2 167.6 250.6 400.8
(Financial institution net borrowings) 6.7 –9.5 –3.3 1.3 42.9 31.2
Amount of exports-imports1 312.1 372.6 477.9 545.3 635.8 728.6 (19.4) (28.3) (14.1) (16.6) (14.6)
Amount of spot exchange transactions2 5.0 5.6 8.6 9.7 12.8 18.8 (11.3) (53.5) (12.4) (31.7) (47.1) 1 Sum of exports and imports on a BOP basis; figures in parentheses indicate percentage change from previous year. 2 Daily average figures; figures in parentheses indicate percentage change from previous year.
Source: Bank of Korea.
In the meantime, the Korean won appreciated by 6% per year on average during the period 2002–06, notably by 11.8% and 7.2% in 2005 and 2006, respectively. The continued appreciation of the won has resulted from the growth in export volume and the increase in capital inflows amid continued depreciation of the US dollar in global financial markets since 2004.
Table 12
Changes in the USD/KRW exchange rate In per cent
2002 2003 2004 2005 2006 2007
Period-end basis 10.5 0.2 14.8 3.0 9.0 –0.9
Average yearly change basis 3.2 5.0 4.1 11.8 7.2 2.8
Figures represent appreciation (+) or depreciation (–) percentages.
Source: Bank of Korea.

BIS Papers No 44 315
As the amount of spot exchange trading and the demand for hedging have increased, the trading of forwards and currency derivatives has grown rapidly. Forward trading, including trading of NDFs, has increased 43% per year on average since 2002. This has been attributable largely to the fact that export companies and asset management companies dealing with foreign securities investment have stepped up their forward selling. Domestic securities investment by non-residents has also risen. Moreover, the scale of trade in foreign currency derivative products such as FX swaps and cross currency swaps has expanded significantly, due to the increased scale of transactions by banks seeking to adjust foreign exchange positions induced by the forward trading of export companies and asset management companies.
Table 13
Forward and derivative transaction amounts In billions US dollars
2002 2003 2004 2005 2006 2007
Amount of foreign exchange transactions1 9.1 12.0 18.6 22.3 30.2 46.5 (32.0) (55.1) (20.0) (35.0) (54.2)
Spot exchange 5.0 5.6 8.6 9.7 12.8 18.8 (11.3) (53.5) (12.4) (31.7) (47.1) Forwards 1.2 2.1 3.0 3.6 5.1 7.2 (66.9) (43.0) (22.0) (40.7) (40.9) FX swaps 2.0 3.0 5.2 6.5 7.8 12.2
(54.4) (71.4) (25.4) (19.8) (56.9) Other currency derivatives2 0.9 1.3 1.9 2.6 4.6 8.4
(54.1) (43.5) (37.8) (76.8) (84.3) 1 Daily average. 2 Includes currency derivatives and interest rate derivatives; figures in parentheses indicate percentage change from previous year.
Source: Bank of Korea.
IV. Policy responses
After the currency crisis at the end of 1997, Korea’s current account continued to register large surpluses, thanks to strengthened export competitiveness boosted by the sharp depreciation of the won until 2001. The capital account has also recorded large surpluses since 2002. This environment accordingly increased pressure for monetary expansion through the foreign sector, and added more pressure for Korean won appreciation. In response to these pressures, the conduct of efficient monetary and exchange rate policies has emerged as a major challenge in macroeconomic policy, for both price stability and sustainable economic growth. Meanwhile, the scale and frequency of capital flows have increased in line with the gradual liberalisation of the capital account. Maintaining the stability of individual financial institutions and the financial markets as a whole has therefore also emerged as an important policy issue.

316 BIS Papers No 44
1. Greater exchange rate flexibility The large-scale current and capital account surpluses have put appreciation pressures on the won since 2002, along with the rise of Korea’s sovereign credit ratings. There were concerns that excessive currency appreciation at a time when Korea had just recovered from the currency crisis might worsen the Korean economy by causing a decrease in exports and a slowdown in economic growth. To cope with this, the authorities took various measures to promote capital outflows through increased direct and indirect overseas investment by residents, in order to balance supply and demand in the foreign exchange market. For example, the range of foreign securities in which residents can invest was extended in March 2003, and all restrictions on them were abolished in March 2006.
Measures to promote capital outflows from Korea
In order to ease the one-sided trend of won appreciation by promoting a balance between supply and demand in the FX market, the authorities took measures to encourage a gradual increase in overseas direct and indirect investment by residents.
1. Overseas direct investment
In January 2003, the limit on overseas direct investment in financial and insurance companies by residents, excluding financial institutions, was adjusted upwards from USD 100 million per case to USD 300 million. In July 2005, the limit was removed. Meanwhile, the limit on individuals’ overseas direct investment was twice adjusted upwards, in July 2005 and January 2006 (from USD 1 million to USD 3 million, and then to USD 10 million). In March 2006, it was completely lifted.
2. Overseas portfolio investment
The range of foreign securities in which residents can invest was extended in March 2003, and all restrictions on them were abolished in March 2006. Overseas investment funds were exempted from capital gains taxation in June 2007.
3. Overseas real estate investment
The limit on the value of an individual’s residential property overseas was raised in July 2005 and January 2006 (from USD 300,000 to USD 500,000 to USD 1 million). It was lifted completely in March 2006. In May 2005, investors were allowed to acquire overseas real estate worth up to USD 1 million for investment purposes. In February 2007, that ceiling was raised to USD 3 million, and it is planned to abolish it in 2008.
However, won appreciation pressures have continued due to the sound fundamentals of the Korean economy and the surpluses in both the current and the capital account since 2002. Thus, the authorities have had no choice but to accept the won’s appreciation trend based on the judgment that acting against the trend was inappropriate. This has been not only because of the tremendous costs of countering the trend, but also because of the resultant negative impacts on economic stability and growth in the medium and long term from distortions in the foreign exchange and financial markets. The authorities have conducted limited smoothing operations, to ease unstable market sentiments only in case of excessive fluctuation over a short period. As a result, the Korean won has strengthened greatly against major currencies such as the US dollar since the end of 2001. The won appreciated by a total of 38.9% against the dollar and 34.5% against the yen during 2002–07, on an annual average basis. In particular, the extent of won appreciation against the US dollar over the period is larger than the appreciation of the yen, the renminbi and major competitive currencies in Southeast Asia.

BIS Papers No 44 317
Table 14
Changes in the exchange rates of selected currencies In per cent
2001 2002 2003 2004 2005 2006 2007 2002–07
–12.4 3.2 5.0 4.1 11.8 7.2 2.8 38.9 Won/US dollar1 (–5.0) (10.5) (0.2) (14.8) (3.0) (9.0) (–0.9) (41.3)
–1.3 6.3 –2.9 –2.7 13.8 13.3 4.0 34.5 Won/100 yen1 (9.1) (–0.3) (–9.5) (10.6) (17.7) (10.0) (–6.2) (21.1)
Yen/US dollar2 –11.3 –2.9 8.0 7.2 –1.9 –5.2 –1.2 3.2
US dollar/euro2 –3.0 5.5 19.6 10.0 0.0 0.9 9.1 52.9
New Taiwan dollar/ US dollar2 –7.6 –2.1 0.4 2.9 3.9 –1.1 –1.0 2.9
Singapore dollar/US dollar2 –3.7 0.1 2.7 3.1 1.5 4.7 5.5 18.9
Renminbi/US dollar2 0.0 0.0 0.0 0.0 1.0 2.7 4.8 8.8
Baht/US dollar2 –9.6 3.4 3.5 3.2 –0.1 6.2 17.4 37.6 1 Appreciation (+) or depreciation (–) of the won against the US dollar and the yen over the specified periods, on an annual average basis. Figures in parentheses represent the appreciation (+) or depreciation (–) over the specified periods on a period-end basis. 2 Appreciation (+) or depreciation (–) of the currency indicated against the US dollar over the specified periods, on an annual average basis.
Source: Bank of Korea, Bloomberg.
2. Effective implementation of monetary policy The Bank of Korea has striven to absorb a considerable amount of excess liquidity from the foreign sector by issuing monetary stabilisation bonds (MSBs). As a result, the outstanding amount of MSBs has increased gradually, with the ratio of the outstanding amount of MSBs to M2 rising from 10.3% at the end of 2001 to 15.2% at the end of 2005. There has been growing concern that this excessive issuance of MSBs is limiting the effective implementation of monetary policy. To cope with this, the Bank of Korea has taken various measures since late 2005. It raised its policy rate (the overnight call rate) seven times, by a total of 1.75 percentage points (from 3.25% to 5.0%) from October 2005 to August 2007, to maintain sufficient market liquidity. It also raised the reserve requirement ratio from 3.0% to 3.8% on average in December 2006. In 2007, meanwhile, large-scale sales of forward contracts by shipbuilding firms to hedge their exchange rate risk, and massive outflows in the form of residents’ overseas portfolio investment, stimulated spot foreign exchange demand from banks for the adjustment of their foreign exchange positions. After August 2007, the worsening defaults on US subprime mortgage loans and the consequent increase in international financial market unrest led to more difficult financing conditions for domestic financial institutions. In the course of this process, the imbalance in the currency swap market deepened, forcing the Bank of Korea to participate in the market from September 2007 as a sell & buy trader to mitigate the disequilibrium.
Thanks to these measures, MSB issuing conditions have improved, partly reimbursing MSBs in circulation, and the ratio of the amounts outstanding of MSBs to M2 declined to 11.8% at the end of 2007.

318 BIS Papers No 44
Graph 2
Overnight call rate target adjustments Annual basis, in per cent
Figures in parentheses are the call rate target adjustment dates.
Source: Bank of Korea.
Table 15
Monetary stabilisation bonds outstanding In billions of US dollars
2001 2002 2003 2004 2005 2006 2007
Capital and financial account1 –2.7 7.3 15.3 9.4 7.1 21.1 8.6
Current account 8.0 5.4 12.0 28.2 15.0 5.4 6.0
MSBs outstanding (A)2 60.2 71.0 88.5 137.9 153.5 170.3 160.6
M2 outstanding (B)2 582.4 735.2 753.0 922.3 1,009.7 1,236.0 1,360.6
A/B (in per cent) 10.3 9.7 11.8 15.0 15.2 13.8 11.8 1 Excludes the other capital account (eg migrant transfers, patent right sales) from the capital account (BOP basis). 2 End-of-year, converted using the period-end FX rates.
Source: Bank of Korea.
3. Strengthening of prudential regulation for financial market stability Since the financial crisis at the end of 1997, the Korean government has expanded the opening of the domestic financial and capital markets to promote foreign capital inflows, as well as enlarging the permitted amount of residents’ overseas investment in stages since 2003. In accordance with this, the scale and frequency of capital movements have increased significantly. As a result, domestic financial institutions and the financial market as a whole have become increasingly affected by changes in the international financial markets. In particular, drastic capital outflows led by external shocks could disrupt the stability of individual financial institutions. In response to these challenges, and based on the lessons of the previous financial crisis, the financial supervisory authority has taken complementary
3.0
3.5
4.0
4.5
5.0
5.5
2000 2001 2002 2003 2004 2005 2006 2007
(2.10) (8.9)
(10.5) (2.8) (7.5)
(9.19) (5.7) (5.13)
(7.10)(8.12)
(11.11)
(12.8)
(2.9)
(6.8)
(8.10) (7.12)
(8.9)

BIS Papers No 44 319
measures to maintain the soundness of individual financial institutions’ operations in foreign assets and liabilities.
As a first step, the authority set up the Foreign Exchange Soundness Guiding Ratios,3 to force domestic financial institutions to reduce the possibility of mismatches between their foreign currency assets and liabilities. It also established the Foreign Exchange Risk Management Indication Standards4 and induced financial institutions to strengthen their internal risk management to deal with foreign exchange risk based on these standards.
In the face of capital liberalisation, the increasing diversity and complexity of financial transactions have in the meantime made it difficult for the supervisory authority as well as financial institutions to gauge and evaluate the related risks. Taking this into consideration, the supervisory body has reinforced its monitoring of capital inflows and outflows and has worked to foster expertise in financial derivatives to strengthen its analysis of the derivatives market. Furthermore, the foreign exchange authority has pledged to drastically relax or remove ex ante transaction restrictions regarding external transaction activities, while also switching to a reporting obligation system from the previous requirement that market participants wishing to transact receive authorisation or permission. As a countermeasure, it is therefore undertaking expansion and improvement of the FEIS (Foreign Exchange Information Systems) to strengthen its monitoring of such capital transactions. Through the FEIS, the authority has not only reinforced its monitoring of overseas foreign currency borrowing and changes in the foreign currency conditions of financial institutions, but has also carried out ordinary surveillance and analysis, particularly of unusual, odd and huge transactions, with an emphasis on capital and derivatives trades.
References
Allen, M, C Rosenberg, C Keller, B Setser and N Roubini (2002): “A balance sheet approach to financial crisis”, IMF Working Paper WP/02/210, December.
Bank of Korea (various years): Balance of payments trends, 1990–2007.
Financial Supervisory Service of Korea (various years): Foreign investor securities trading development, 2002–2007.
International Monetary Fund (1995): International capital markets: developments, prospects, and policy issues.
Ito, T (2000): “Capital flows in Asia”, in S Edwards (ed), Capital flows and the emerging economies theory, evidence, and controversies, University of Chicago Press, pp 255–97.
3 The guidelines are as follows:
(i) Liquidity ratio in foreign currency (ratio of foreign currency assets within three months of residual maturity to foreign currency liabilities within three months of residual maturity): 85/100 or above.
(ii) Ratios of maturity mismatch between foreign currency assets and liabilities (ratios of assets exceeding liabilities to total assets) for residual maturities of seven days or less: 0/100 or above; for residual maturities of one month or less: 10/100 or below.
(iii) Ratio of funding resources for medium- and long-term loans in foreign currency: for foreign currency loans granted with maturities of one year or longer, 80/100 or more of the loan amounts shall be covered by foreign currency borrowings with maturities of one year or longer.
4 The Foreign Exchange Risk Management Indication Standards have specifically been set up by the supervisory authority to deal with the foreign exchange risks of financial institutions, such as country risk, large credit risk, financial derivatives transaction risk and market risk.

320 BIS Papers No 44
Korea Exchange (2006): Futures and options market development in year 2006.
Korean Ministry of Finance and Economy (2006): “A plan of foreign exchange liberalization in Korea”, press release, 19 May.
Park, J S (2001): “Increased capital flows and monetary policy”, in J H Ham et al (eds), The changing financial environment and monetary policy, Jisik-sanup Publications, pp 503–62.
Rogoff, K (1999): “Perspectives on exchange rate volatility”, in M Feldstein (ed.), International capital flows, University of Chicago Press, pp 441–53.
Won, S Y (2005): “Analysis on bond market liberalization and its impact on the market after financial crisis”, Journal of Korean Economic Development Research, vol 11, pp 23–57.

BIS Papers No 44 321
Capital flows and financial assets in emerging markets: determinants, consequences and challenges
for central banks: the Malaysian experience
Ooi Sang Kuang1
I. Introduction
The subject of capital flows has always featured prominently on the agenda of central banks in the emerging market economies in general and Bank Negara Malaysia is no exception. As a recipient of capital inflows, Malaysia has benefited significantly in terms of lower financing costs, increased technological transfers, and higher investment and economic growth. At the same time, however, the relatively smaller size and greater openness of the Malaysian economy renders the country more susceptible to the associated risks and volatilities of financial globalisation. In such an environment, it is recognised that efforts to strengthen and deepen domestic financial markets, adopt sound macroeconomic policies and move toward more flexible exchange rate arrangements, while important, do not necessarily guarantee that one’s economy will be spared the vagaries of large and volatile international capital flows. Therein lies the challenge for Bank Negara Malaysia (and central banks in emerging market economies in general) – to maximise the benefits of capital inflows, while continually strengthening our resilience to the inherent volatility of such flows and maintaining constant vigilance over developments in the capital account and the behaviour of asset prices.
This paper discusses Malaysia’s experience in managing capital flows and the issues and challenges arising from increased international financial integration. Section II of the paper traces the changes in the profile of capital flows and the measures adopted by Bank Negara Malaysia to monitor these flows. The impact of the increasing integration of the Malaysian financial markets into the global financial system is outlined in Section III. Section IV elaborates on some of the implications of capital flows for the conduct of monetary policy while Section V highlights the challenges to financial stability and the central bank’s regulatory and supervisory response. The paper concludes (Section VI) with some food for thought on moving forward the discussion on managing the challenges relating to capital flows in emerging market economies.
II. Changes in capital inflows and outflows: underlying factors and mechanisms to monitor risks
Historically, foreign direct investment (FDI) has been the mainstay of capital inflows into Malaysia, although portfolio flows have gained increasing significance in the recent period. Despite intensified competition, Malaysia continues to receive a steady inflow of net FDI, averaging about USD 5.8 billion per annum (equivalent to about 3.8% of GDP) for the period 2004–07. At the same time, outward FDI (net investment abroad by Malaysian companies) has also increased, averaging about USD 5.5 billion (or 3.6% of GDP) per annum. The
1 The views expressed in this paper are those of the author (Deputy Governor, Bank Negara Malaysia) and do
not necessarily represent the stance or policy of the central bank. The author would like to thank Ms Madelena Mohamad, Ms Wan Hanisah Wan Ibrahim, Mr Fraziali Ismail, Mr Nazrul Hisyam Mohd Noh, Dr Shariman Alwani Mohamed Nordin, Mr Toh Hock Chai and Mr Ng Chow Soon for their assistance and research input.

322 BIS Papers No 44
–4
–2
0
2
4
6
8
10
12
1991
1992
1993
1994
1995
1996
1997
1998
1999
2000
2001
2002
2003
2004
2005
2006
2007
USD billion
outward FDI figure reflects the increasing capacity of Malaysian companies to expand and diversify their operations abroad, which is in line with government policy to promote more regional and global Malaysian players. While the progressive liberalisation of foreign exchange administration rules is not directly aimed at promoting outward FDI, it has facilitated such outflows by creating a more conducive environment for international trade and investment. Indeed, residents (individuals and corporations) are freely permitted to invest their own funds abroad, and no restrictions or controls apply if the investing company has no domestic ringgit borrowing. However, some prudential limits are prescribed in cases where domestic credit facilities are involved, but only for large investments abroad (individuals: in excess of a total of MYR 1 million equivalent per year; corporations: more than MYR 50 million equivalent per year). The aim is to encourage the use of the nation’s financial resources for productive activities. Overall, it is not surprising that on a net basis, inflows of direct investment into Malaysia have trended downwards, signifying a rebalancing of Malaysia’s role as both an importer and exporter of investment capital (Graph 1).
Graph 1
Direct investment
Source: Department of Statistics, Malaysia.
Notwithstanding the continuing importance of FDI flows, the significance of portfolio flows has also increased in the recent period (Graph 2). Both the magnitude and volatility of portfolio flows into and out of Malaysia have increased along with its greater integration into the global financial system. Such flows have been channelled mainly into equity and debt securities, short-term money market papers and non-resident bank deposits.
In 2004, portfolio investment recorded a net inflow of USD 8.5 billion, reflecting the enhanced attractiveness of Malaysian assets, amid a positive economic and corporate outlook and the deepening of the domestic bond market. There were intermittent episodes where market expectations of a realignment of Asian exchange rates, including that of the ringgit, contributed to significant inflows of speculative portfolio funds, particularly in the fourth quarter of 2004 and continuing into the first half of 2005. While there was a surge in portfolio inflows immediately following the depegging of the ringgit from the US dollar on
Net foreign direct investment (FDI) Net direct investmentNet investment abroad

BIS Papers No 44 323
21 July 2005 (in anticipation of further ringgit appreciation), the flows normalised quickly amid orderly price adjustment in the foreign exchange market. The large unwinding of the speculative short-term positions in the fourth quarter of 2005 (as expectations of ringgit appreciation subsided) resulted in a decline in Bank Negara Malaysia’s reserves from their peak of USD 80 billion as at end-September 2005 to USD 70.2 billion as at end-December 2005.
Graph 2
Portfolio investments
Source: Department of Statistics, Malaysia.
Strong economic fundamentals and a confluence of positive pull factors, including new investment incentive packages, further liberalisation of foreign exchange administration measures, and the general appreciation of the ringgit were factors that attracted foreign interest in Malaysian papers and equities in recent years. Nevertheless, the steady inflows since the first half of 2006 have been punctuated by several episodes of market correction and temporary foreign withdrawals, for example during the Shanghai market correction in February 2007 and heightened global market uncertainty following the US subprime mortgage problem in July–August 2007. Nevertheless, inflows of foreign funds for investment in the debt market resumed in the fourth quarter of 2007 as foreign investors remained cautious with investments in the equity market. While the impact on the domestic financial markets was relatively mild, the central bank maintained its vigilance over developments in the capital account.
In view of the important role of capital flows in the Malaysian economy, Bank Negara Malaysia has developed several internal reporting systems to enhance its surveillance and monitoring of capital account transactions. These systems provide the Bank with in-depth knowledge on the composition, size, source and currency exposure of capital inflows and outflows, and facilitate timely assessment of risks. The monitoring process is also facilitated by the fact that most of the FDI and portfolio capital flows are intermediated primarily through financial institutions. This intermediation channel also accords a greater degree of consumer protection, enhances efficiency and reduces cross-border transaction costs. The monitoring systems on capital flows include:
–10.0
–5.0
0.0
5.0
10.0
Q1
2004
Q2
2004
Q3
2004
Q4
2004
Q1
2005
Q2
2005
Q3
2005
Q4
2005
Q1
2006
Q2
2006
Q3
2006
Q4
2006
Q1
2007
Q2
2007
Q3
2007
Q4
2007
USD billion
Net debt securities Net equity securitiesNet portfolio investment
Unwinding of speculative short-term position
Global liquidity and attractiveness of Malaysian papers prompted foreign
purchases of debt securities
Inflows due mainly to expectation of realignments of
exchange rates across Asia Large inflows due mainly to
economic fundamentals
Liquidation of equity securities due to global
financial correction
Switching of asset class from equity securities to debt securities by risk-
averse investors
Liquidation of equity and debt securities
due to US subprime concerns
Inflows into debt securities resumed, while investors remained cautious in
the equity market

324 BIS Papers No 44
• The Ringgit Operations Monitoring System (ROMS), which provides information (near real-time basis) on cross-border flows which affect the international reserves of the Bank;
• The Cash Balance of Payments (CBOP) reporting system, which provides detailed data on all cross-border flows of funds between residents and non-residents effected through the banking system, intercompany and overseas accounts; and
• The quarterly External Asset and Liability (EAL) Survey, which provides detailed information on overall flows and stocks of external assets and liabilities of the economy, including potential claims or servicing obligations.
III. Implications for the depth of the financial sector and its resilience
The increase in non-resident activity has had a positive impact on Malaysian financial markets as capital inflows have contributed to an increase in the size and liquidity of the country’s asset markets. Graphs 3–6 highlight the impact of capital inflows on the equity and bond markets. Higher levels of foreign participation in the Malaysian stock exchange have greatly enhanced liquidity in the equity market. Significantly, shifts in capital flows into the equity market influence movements in the Kuala Lumpur Composite Index (KLCI), given its strong correlation with changes in non-resident holdings of stocks. In the bond market, the negative correlation between inflows of foreign portfolio investment and short-term yields further suggests that high capital inflows have contributed to lower yields in this market.
Graph 3
Trading volume in Bursa Malaysia attributable to resident and non-resident market participants
In per cent
Source: Bursa Malaysia.
85 82 69
81 76 7383 78 71 68
76 69 63 66 63
15 18 31
19 24 2717 22
29 3224
31 37 34 37
0
10
20
30
40
50
60
70
80
90
100
1993
1994
1995
1996
1997
1998
1999
2000
2001
2002
2003
2004
2005
2006
2007
Local investors Foreign investors

BIS Papers No 44 325
0
200
400
600
800
1,000
1,200
1,400
1,600
1,800
Jan 01 Jul 01 Jan 02 Jul 02 Jan 03 Jul 03 Jan 04 Jul 04 Jan 05 Jul 05 Jan 06 Jul 06 Jan 07 Jul 07 Jan 08
MYR million Government securities
Central bank securities
Cagamas papers
Graph 4
Daily trading volume of Malaysian government, Bank Negara Malaysia and Cagamas debt securities
(January 2001 to December 2007)
Sources: Bank Negara Malaysia’s Bond Information and Dissemination System (BIDS) and Bursa Malaysia’s Electronic Trading Platform (ETP).
Graph 5
Non-resident holdings of stocks vs KLCI: twelve-week rolling correlation
Sources: Bursa Malaysia and Bloomberg.
0.0 0.1 0.2 0.3 0.4 0.5 0.6 0.7 0.8 0.9 1.0
31 M
ar 0
4
30 J
un 0
4
30 S
ep 0
4
31 D
ec 0
4
31 M
ar 0
5
30 J
un 0
5
30 S
ep 0
5
31 D
ec 0
5
31 M
ar 0
6
30 J
un 0
6
30 S
ep 0
6
31 D
ec 0
6
31 M
ar 0
7
30 J
un 0
7
30 S
ep 0
7
31 D
ec 0
7
Cor
rela
tion

326 BIS Papers No 44
Graph 6 Three-month yields vs portfolio investment:
thirty-day rolling correlation
Sources: Bank Negara Malaysia’s Fully Automated System for Issuing/Tendering (FAST) and Ringgit Operations and Monitoring System (ROMS).
As shown in Graph 7, the increase in foreign presence in the Malaysian equity market is highly correlated with the rise in price/earnings (P/E) ratios in the recent past. Non-resident holdings of shares as a percentage of total shares in the KLCI had risen to about 19% by end-2007 and the foreign presence has supported stronger performance in the stock market. As a result, with the higher P/E ratios, the cost of equity is now lower and this could encourage further fund-raising activities via the equity market, although this would also depend on other factors in the market.
Graph 7 Annual change in non-resident holdings of shares in KLCI
vs annual change in P/E ratio, in per cent
Sources: Bursa Malaysia and Bloomberg.
2
6
10
14
18
22
26
30
34
Jul 0
5
Apr
06
Jul 0
6
Apr
07
Jul 0
7
–30
–20
–10
0
10
20
30
40
50
Growth in non-resident holdings of shares (lhs)
Growth in P/E ratio (rhs) Correlation is 0.87
–1 –0.8 –0.6 –0.4 –0.2
0 0.2 0.4 0.6 0.8
1 31
Jan
07
18 F
eb 0
7
8 M
ar 0
7
26 M
ar 0
7
13 A
pr 0
7
1 M
ay 0
7
19 M
ay 0
7
6 Ju
n 07
24 J
un 0
7
12 J
ul 0
7
30 J
ul 0
7
17 A
ug 0
7
4 Se
p 07
22 S
ep 0
7
10 O
ct 0
7
28 O
ct 0
7
15 N
ov 0
7
3 D
ec 0
7
21 D
ec 0
7
Cor
rela
tion
Aug
05
Nov
05
May
06
May
07
Aug
07
Sep
05
Dec
05
Feb
06
Aug
06
Nov
06
Sep
06
Jun
06
Dec
06
Oct
07
Dec
07
Nov
07
Sep
07
Oct
05
Jan
06
Mar
06
Oct
06
Jan
07
Feb
07
Mar
07
Jun
07

BIS Papers No 44 327
Introduction of new financial instruments and their impact on financial institutions While liquidity in the domestic financial markets has increased steadily over the years, considerable efforts have also been made to further enhance financial market development. The introduction of new money market instruments, including Bank Negara Monetary Notes (BNMNs) and Islamic money market instruments have improved liquidity management, deepened and broadened the conventional and Islamic money markets and enhanced the capacity of the financial system to absorb capital inflows. Significantly, the size of the domestic bond market has increased more than fourfold since 1998, while the proportion of private debt securities in the bond market is approaching the 50% level. To a considerable extent, this has contributed to Malaysia’s resilience against external shocks, such as the recent market turbulence. (It is also recognised that strong economic fundamentals were likewise important in building economic resilience, including a comfortable level of reserves.)
In terms of the impact of increasing non-resident activity in local asset markets on financial institutions, the results have generally been positive, notably in terms of new financing and business opportunities. In particular, the use of securitisation as a means of financing has also increased, with a total MYR 8.4 billion being raised in the capital market, which amounts to 14.1% of total funds raised in this market year in 2007. Cagamas Berhad, the quasi-government national mortgage and securitisation agency, has also benefited from the overall increase in global investor interest. It successfully executed its fourth residential mortgage-backed securities (RMBS) deal in May 2007, amounting to MYR 2.1 billion at competitive yields, approximately 20% of which was allocated to non-resident investors at the primary level.
Overall competition has also increased, with better pricing, quality and value added and more customer-centric financial services. Product offerings have also expanded, with new financial innovations to capture and retain a wider customer base, including private banking, wealth management and structured investment instruments. Significantly, total assets, loans and deposits of the banking system have grown at annual average rates of 10.9%, 8.7% and 12.6% respectively over the past three years (Graphs 8 and 9).
Graph 8
Banking system total assets, loans and deposits 2001–07 Annual growth, in per cent
Source: Bank Negara Malaysia’s Monthly Statistical Bulletin.
0
5
10
15
20
25
Dec 00
Jun 01
Dec 01
Jun 02
Dec02
Jun03
Dec03
Jun04
Dec04
Jun05
Dec05
Jun 06
Dec 06
Jun 07
Dec07
Total assets Gross loans Deposits accepted

328 BIS Papers No 44
Graph 9
Banking system total assets, loans and deposits 2001–07 As a percentage of nominal GDP
Source: Bank Negara Malaysia’s Monthly Statistical Bulletin.
Apart from growth in traditional banking business, greater depth in the financial markets has also provided more treasury-related opportunities for banking institutions. While profits from financing-related activities remain high, net gains from treasury-related operations have also increased as an alternative profit centre. In the first half of 2007, the net interest income of the banking system expanded by 13.5% (year-on-year), whilst growth in profit before tax was also supported by higher income from fee-related (+41.4%) and treasury and investment (+111%) activities (fee-related activities include loan arrangement and credit card portfolios, corporate advisory, wealth management and remittance services). Despite some progress, however, the securitisation market and risk transfer instruments in Malaysia remain largely untapped thus far, given the prolonged period of ample liquidity and as demand for and capacity to offer such instruments have only started gaining momentum in the more recent period.
Role of foreign financial institutions The banking system in Malaysia comprises commercial and full-fledged Islamic banks and investment banks. Foreign-owned banking institutions in Malaysia are locally incorporated and subject to a similar regulatory and supervisory framework to that of their domestic counterparts. These institutions have always played a significant role in financial intermediation and operate in direct competition with domestic players. As at end-July 2007, foreign commercial and Islamic banks accounted for approximately 22% of market share, in terms of assets, loans and deposits (approximately 19–20% in 2004).
Over the years, foreign players have facilitated the transfer of technology and expertise to domestic institutions, including the promotion of: (i) international best practices and standards in risk management; (ii) new and innovative financial products and services; (iii) new business models and strategies and ventures into new growth areas (for instance, foreign-owned Islamic banking institutions newly established in Malaysia have adopted a business model similar to that being used in the Middle East by venturing into new areas such as property development and actively promoting two-way investments between Malaysia and the Middle East); and (iv) access to international financial instruments, institutions and markets for customers as well as for other domestic players through their
0
50
100
150
200
250
Dec 00
Jun 01
Dec 01
Jun 02
Dec 02
Jun 03
Dec03
Jun04
Dec04
Jun05
Dec05
Jun06
Dec06
Jun 07
Dec 07
Total assets Gross loans Deposits accepted

BIS Papers No 44 329
2.5
3.0
3.5
4.0
4.5
5.0
5.5
M1
2001
M4
2001
M7
2001
M10
200
1
M1
2002
M4
2002
M7
2002
M10
200
2
M1
2003
M4
2003
M7
2003
M10
200
3
M1
2004
M4
2004
M7
2004
M10
200
4
M1
2005
M4
2005
M7
2005
M10
200
5
M1
2006
M4
2006
M7
2006
M10
200
6
M1
2007
M4
2007
M7
2007
M10
200
7
Three-year
Five-year
Ten-year
extensive international networks, for both risk management and investment purposes. Foreign banks also act as counterparts to domestic players in some derivatives transactions.
Prior to 2006, foreign participation in the domestic asset markets was relatively low. Since then, however, interest in such participation has increased significantly, attracted by the positive pull factors cited in Section II above. In the equity market, the KLCI improved by 21.8% in 2006, the strongest performance since 2003. At end-2007, the KLCI rose by a further 31.8%, above the 2006 level. The increase in foreign demand for ringgit bonds resulted in a downward trend in Malaysian Government Securities (MGS) yields, from a high of 4.5% to 5% at end-June 2006 (Table 1). Since June 2006, MGS yields have declined by 79–91 basis points for three- to ten-year maturities. In addition, the spreads between ten-year and one-year MGS have also narrowed significantly (Graphs 10 and 11).
Table 1
MGS yields, June 2006–December 2007
June 2006 December 2007 Changes (in basis points)
Three-year 4.480 3.635 –85
Five-year 4.570 3.783 –79
Ten-year 5.047 4.142 –91
Source: Bank Negara Malaysia’s Fully Automated System for Issuing/Tendering (FAST).
Graph 10
Historical series of three, five and ten-year MGS benchmark yields In per cent
Source: Bank Negara Malaysia’s Fully Automated System for Issuing/Tendering (FAST).

330 BIS Papers No 44
3.2
3.4
3.6
3.8
4.0
4.2
4.4
4.6 M
GS
1
MG
S 2
MG
S 3
MG
S 4
MG
S 5
MG
S 6
MG
S 7
MG
S 8
MG
S 9
MG
S 1
0
April 2006
December 2005
December 2007
Graph 11
MGS benchmark yield curve since December 2005 In per cent
Source: Bank Negara Malaysia’s Fully Automated System for Issuing/ Tendering (FAST).
The stronger equity market performance and relatively lower MGS yields were achieved despite the several distinct periods of market corrections cited earlier (in May–June 2006, February and June 2007, and July–August 2007). While there were some outflows of funds effected by non-residents during these periods, foreign participation in Malaysia’s equity market remained generally high. Similarly, in the bond market, foreign holdings of long-term bonds have been relatively stable. The impact of the outflow of non-resident investments during the recent subprime mortgage problem was mainly felt in the short-term securities market. Overall, conditions in the Malaysian financial markets have become more volatile during the periods of foreign financial market corrections and particularly during the global bond sell-off in June 2007 (Graphs 12 and 13).
Graph 12 KLCI daily returns: thirty-day rolling standard deviation
Source: Bloomberg.
0.4
0.6
0.8
1.0
1.2
1.4
1.6
1.8
Jan
03
Mar
03
Apr
03
Jun
03
Aug
03
Oct
03
Dec
03
Feb
04
Apr
04
May
04
Jul 0
4
Sep
04
Nov
04
Jan
05
Mar
05
Apr
05
Jun
05
Aug
05
Oct
05
Dec
05
Feb
06
Mar
06
May
06
Jul 0
6
Sep
06
Nov
06
Jan
07
Mar
07
Apr
07
Jun
07
Aug
07
Oct
07
Nov
07
Stan
dard
dev
iatio
n
0.2

BIS Papers No 44 331
Sep
05
May
06
0.00
0.05
0.10
0.15
0.20
0.25
0.30
0.35
Oct
05
N
ov 0
5
Dec
05
Jan
06
Mar
06
Apr
06
Jun
06
Jul 0
6
Aug
06
Sep
06
Nov
06
Dec
06
Jan
07
Feb
07
Mar
07
Apr
07
May
07
Ju
l 07
Aug
07
Se
p 07
O
ct 0
7
Nov
07
Stan
dard
dev
iatio
n
MGS 10 MGS 5 MGS 3
Graph 13
MGS yields: thirty-day rolling standard deviation
Source: Bank Negara Malaysia’s Fully Automated System for Issuing/Tendering (FAST).
Graph 14
KLCI, S&P 500, FTSE 100 and DAX vs ten-year yields: ninety-day rolling correlation
Source: Bloomberg.
A rough proxy for determining the level of integration of domestic financial market segments is to assess if the relationships between the different segments exhibit trends that resemble those normally seen in the more advanced financial markets and to compare how different market segments respond to similar shocks. In this regard, the positive correlation between the KLCI and MGS yields has been strengthening, in line with the trend in the more advanced financial markets (Graph 14). Nonetheless, intermittent periods of negative correlation do not necessarily imply that the different market segments of the Malaysian
–1.0
–0.5
0.0
0.5
1.0
31 M
ay 0
6
30 J
un 0
6
31 J
ul 0
6
31 A
ug 0
6
30 S
ep 0
6
31 O
ct 0
6
30 N
ov 0
6
31 D
ec 0
6
31 J
an 0
7
28 F
eb 0
7
31 M
ar 0
7
30 A
pr 0
7
31 M
ay 0
7
30 J
un 0
7
31 J
ul 0
7
31 A
ug 0
7
30 S
ep 0
7
31 O
ct 0
7
30 N
ov 0
7
31 D
ec 0
7
– C
orre
latio
n +
KLCI vs MGS
S&P vs UST
DAX vs GECU

332 BIS Papers No 44
financial markets are not integrated, as this could reflect the ease with which portfolio investments flow between the equity and bond markets as investors reassess their risk appetite and diversification strategies, thus suggesting some level of integration. The closer correlation between the domestic and international markets, on the other hand, suggests that capital flows, especially outflows, are largely influenced by developments in international financial markets (Graphs 15 and 16).
Graph 15
Ten-year government bond yields: Malaysia against Euro and United States: ninety-day rolling correlation
Source: Bank Negara Malaysia’s Fully Automated System for Issuing/Tendering (FAST).
Graph 16
KLCI vs MSCI World and KLCI vs S&P 500: ninety-day rolling correlation
Source: Bloomberg.
–1.0 –0.8 –0.6 –0.4 –0.2
0.0 0.2 0.4 0.6 0.8 1.0
Dec
05
Jan
06
Feb
06
Mar
06
Apr
06
May
06
Jun
06
Jul 0
6
Aug
06
Sep
06
Oct
06
Nov
06
Dec
06
Jan
07
Feb
07
Mar
07
Apr
07
May
07
Jun
07
Jul 0
7
Aug
07
Sep
07
Oct
07
Nov
07
Dec
07
Cor
rela
tion
Malaysia vs United States
Malaysia vs EURO
–1.0 –0.8 –0.6 –0.4 –0.2 0.0 0.2 0.4 0.6 0.8 1.0
13 A
ug 0
3
27 O
ct 0
3
10 J
an 0
4
25 M
ar 0
4 8
Jun
04
22 A
ug 0
4
5 N
ov 0
4 19
Jan
05
4 Ap
r 05
18 J
un 0
5
1 Se
p 05
15
Nov
05
29 J
an 0
6
14 A
pr 0
6 28
Jun
06
11 S
ep 0
6
25 N
ov 0
6
8 Fe
b 07
24
Apr
07
8 Ju
l 07
21 S
ep 0
7
Cor
rela
tion
KLCI vs MSCI World KLCI vs S&P 500

BIS Papers No 44 333
In terms of the impact of large capital flows, this can be seen across all market segments. The KLCI rose as large inflows entered the equity market, while MGS yields declined following large inflows into the bond market. Conversely, the impact of a reversal (capital outflows) is reflected in a decline in the KLCI and higher bond yields.
Despite the increasing presence of hedge funds in this region, to date foreign investor participation in the domestic financial markets has been fairly straightforward. Purchases of domestic financial assets have been direct, without significant recourse to the derivatives markets and as such, these purchases are reflected in the capital flows data captured by the existing monitoring systems (cited in Section II). The Malaysian derivatives market is still in its developmental stage and market activity is gradually picking up. Most of the transactions are over-the-counter and not exchange-traded. Thus, the significance of derivatives markets in allowing foreign investors to take positions without these being reflected in capital flows is still minimal.
The influence of hedge fund growth and carry trades on the Malaysian financial markets is relatively indirect. In the aftermath of the subprime mortgage problem, efforts by hedge funds to rebalance their portfolio allocation in the emerging markets have indirectly affected the domestic financial markets. In the last two years, the influence of hedge funds and carry trades on the domestic equity and bond markets has been incidental to their activities in taking positions on the outlook of the domestic currency.
IV. Implications of capital flows for the conduct of monetary policy: exchange rate developments; sterilisation; control over interest rates
Bank Negara Malaysia’s monetary policy stance is determined on the basis of an assessment of the balance of risks on the outlook for inflation and growth. However, foreign currency inflows and their impact on liquidity and on the price and ownership structure of financial assets are closely monitored.
Since the removal of the ringgit peg in July 2005, capital inflows and outflows have had a significant impact on exchange rate movements. Generally, capital inflows have generated upward pressure on the exchange rate. However, the broad appreciation trend has often been punctuated by sporadic periods of capital outflows arising from external factors. The ringgit’s performance in 2006 is exemplary of this trend. In the first five months of the year, it appreciated against the US dollar by 5.5%, reaching a high of 3.5825 on 11 May, as net trade inflows were augmented by investment inflows attracted by the favourable economic fundamentals and expectations of ringgit appreciation. In the latter half of May, however, the uptrend of the ringgit reversed following a broad withdrawal of investments from emerging market equities and bonds. As the effects of the emerging market sell-off subsided in July, the ringgit remained relatively stable against the US dollar, with net trade inflows being offset by outflows for overseas direct investment, portfolio investment, repayment and prepayment of external loans and the repatriation of profits. The ringgit traded in the range of 3.6970–3.5860. The currency then trended upwards from mid-October 2006, gaining momentum in December, as portfolio flows returned to emerging markets amid positive investor sentiment. During this period, the ringgit appreciated against the US dollar, ending the year at 3.5315. For the year 2006 as a whole, the ringgit appreciated by 7% against the US dollar.
In 2007, regional currencies benefited from positive investor sentiment towards the region, as evident from the buoyant equity and capital markets. However, as in 2006, the broad positive trend was punctuated by the several corrections cited earlier, namely the correction in the Shanghai stock market in March, the strengthening of the US dollar on interest rate expectations in June and concerns over weaknesses in the US subprime mortgage markets in July and August. Between 21 July 2005 and 31 December 2007, the ringgit appreciated by

334 BIS Papers No 44
12.9% against the US dollar, 12% against the Japanese yen and 0.1% against the pound sterling, but depreciated against the euro (–5.4%). The ringgit exhibited a mixed performance against regional currencies, appreciating against most currencies in the range of 1.2 to 14.9%, but depreciating against the Philippine peso (–17.4%), Thai baht (–6.5%) and Singapore dollar (–1.6%).
The central bank’s intervention in the foreign exchange market seeks to moderate large fluctuations, not to influence the underlying trend. The aim is to minimise disruptions to trade and investment, reduce misalignments and facilitate orderly adjustments. No specific measures have been introduced to deal with currency appreciation pressures over the past five years.
Some commentators have argued that the benefits of a stronger ringgit outweigh the costs as it mitigates imported inflation, encourages exporters to increase efficiency and competitiveness, and reduces the input cost of imported manufactured products. Nevertheless, the strength of the ringgit, particularly against the US dollar, remains on the “watch list” for some Malaysian manufacturers. In regular dialogues with the manufacturing industry, the central bank has sought to enhance communication on exchange rate developments, while encouraging industry players to take proactive measures to improve productivity and widen recourse to hedging their foreign exchange exposure with the banking institutions.
Challenges of sterilisation of intervention The increase in inflows arising from the recent current account and capital account surpluses has resulted in an accumulation of international reserves and an increase in liquidity in the interbank system. Throughout the year in 2007, domestic liquidity increased significantly, by MYR 50.9 billion to MYR 298.6 billion. A challenge for Bank Negara Malaysia is to absorb any excess liquidity to pre-empt the build-up of inflationary pressures, while ensuring that the cost of sterilisation is effectively managed.
In managing domestic liquidity, the central bank employs various monetary policy tools, including direct money market borrowings, repo operations, issuance of BNMNs and FX swap operations. Currently, direct money market borrowing is the main monetary instrument, accounting for 41.3% of surplus liquidity sterilised as at 31 December 2007. The maturity structure for direct borrowing ranges from overnight to three months.
Bank Negara Malaysia has gradually shifted towards the use of repo operations and BNMNs to manage liquidity. Repo operations allow the Bank to absorb surplus liquidity at lower cost (typically 2–3 basis points lower than direct borrowings) due to its collateralised nature. In addition, they facilitate the development of both the repo market and the underlying cash market in debt securities by promoting market turnover and interest in trading and market-making. The repo tenure ranges from one month to three months. As at 31 December, repo operations absorbed 10.1% of sterilised liquidity.
In absorbing liquidity for longer tenures, Bank Negara Malaysia prefers to issue BNMNs. These instruments may be issued based on conventional or sharia-compliant principles, as well as various structures such as discount to face value, fixed or floating coupon bearing, with maturity terms ranging from one month up to three years. To date, the central bank has issued three-month, six-month, nine-month and one-year discount to face value BNMNs, one-year coupon bearing and two-year floating rate BNMNs. As at 31 December 2007, BNMNs accounted for 22.9% of total monetary instruments employed by the central bank, compared with 10.6% as at end-2006.
Given the magnitude of surplus liquidity to be sterilised relative to the size of the economy, the advantages of issuing longer-term BNMNs are that it facilitates more efficient longer-term sterilisation and reduces the need for larger turnover of shorter-term sterilisation transactions on a daily basis. At times, market conditions have also allowed the central bank to reduce the

BIS Papers No 44 335
sterilisation cost by using longer-term instruments. The Bank has also issued floating rate bonds to enable it to absorb liquidity for longer terms, while hedging against interest rate risks. The increase in issuances of BNMNs (Table 2) has a positive impact on the local short-term bills market by enhancing the depth and breadth of the short-term securities market. This instrument is also an effective tool in managing liquidity arising from volatile short-term capital flows.
Table 2
Bank Negara Bills, Bank Negara Negotiable Notes and Bank Negara Monetary Notes as at year-end
Year Outstanding amount (MYR billions)
Average duration (days)
2002 11.8 76.1
2003 12.9 75.0
2004 14.9 80.8
2005 16.9 84.6
2006 22.9 104.3
2007 69.0 103.1
Source: Bank Negara Malaysia.
The direct cost of sterilisation is low given that the overnight policy rate (OPR) in Malaysia is lower than in most G7 countries except Japan, providing an interest differential in favour of Malaysia. Sterilised intervention has enabled the central bank to manage the surplus liquidity effectively and kept the OPR near to its target.
Bank Negara Malaysia recognises the potential risks of currency exposure and has instituted several measures to manage and mitigate such risks. In managing reserves, the investment strategy emphasises diversification to preserve the purchasing power of the Bank’s international reserves over the medium and long term. Currency exposures are monitored and foreign exchange gains or losses are revalued on a quarterly basis. The gains and losses are smoothed out via the exchange rate fluctuation reserves account. FX swap transactions in this area are recognised as a pair of borrowing and lending transactions in separate currencies rather than as a pair of FX transactions to avoid fluctuations arising from the use of FX swaps.
Effect of sterilised intervention on the banking system’s balance sheet The effect of sterilised intervention on banks’ balance sheets (Graph 17) depends on the sterilisation instruments used and whether the banks, as opposed to the non-bank private sector, are the ultimate holders of these instruments. While direct borrowing clearly leads to an increase in banks’ liquid assets (increase in banks’ net lending to the central bank), the effect of BNMNs is less straightforward, as not all the securities issued end up in the banks’ portfolios. Instead, a substantial portion of the BNMNs has been taken up by non-residents (see Table 3), with banks merely acting as intermediaries. Though a relatively new instrument, the BNMN was used more actively than direct borrowing in 2007, resulting in an increase in the share of BNMNs in the total liquidity absorbed to about half the share of direct borrowing.

336 BIS Papers No 44
Graph 17
Assets of the banking system In per cent
Source: Bank Negara Malaysia’s Monthly Statistical Bulletin.
Table 3
Central bank securities
Outstanding amount Non-resident holdings
MYR billions
2002 11.8 0
2006 22.9 9.4
2007 69.0 36.1
Source: Holdings data from Bank Negara Malaysia’s Real-Time Transfer of Funds and Securities (RENTAS) system.
There are two channels through which sterilised intervention can influence bank lending behaviour. The first possible channel is that “easy and risk-free profits” from large holdings of sterilisation securities could alter banks’ incentives to lend to the non-bank private sector. However, the perceived incentive to reap “easy profits” may be overstated. In practice, banks find it more profitable to invest in other assets given larger risk premiums embedded in loans and non-sterilisation papers. In fact, banks in Malaysia have been competing with each other to increase lending, amid ample liquidity, on price and non-price factors to ensure that they continue to be able to generate sufficient returns to meet shareholders’ expectations.
Second, to the extent that banks with liquid assets feel better placed to expand credit going forward (switching from holdings of sterilisation instruments to loans), the restraining influence of sterilised intervention on monetary growth could be temporary. Ultimately, however, whether or not banks expand credit depends on the underlying economic
0
20
40
60
80
100
Other assets
Other securities
Central bank securities
Government securities
Amounts due from abroad
Amounts due from central bank
Amounts due from banking institutions
Loans
Deposits placed, reverse repos and NIDs held
2002 2006 2007

BIS Papers No 44 337
conditions. It would be more of a concern in instances where demand for credit is very strong. Thus far, there is no indication of excessive credit growth in Malaysia.
As noted earlier, Malaysia’s interest rate policy has always been based on the central bank’s assessment of the prospects for inflation and economic growth. As Malaysia is a small and highly open economy, close attention is paid to external factors and their potential implications for domestic stability. While large capital inflows have played a role in influencing the level of short-term and long-term rates in the bond market, the central bank’s efforts in promoting the depth and breadth of the financial markets, especially the bond market, have enhanced Malaysia’s resilience and improved its capacity to manage and absorb external shocks and volatility. Nonetheless, shocks driven by short-term volatility in the global financial markets may still result in fluctuations in short-term bond yields, but this does not imply any reduction in the central bank’s ability to influence domestic interest rates. Market fundamentals as reflected and influenced by the level of the Bank’s policy rate would still exert a significant influence on the eventual shape and level of the yield curve. Occasionally, the yield curve may even temporarily be flat or inverse in shape instead of upward-sloping.
V. Regulatory and supervisory response to financial stability challenges posed by capital flows
Given the opportunistic and volatile nature of capital flows, regulatory authorities face the challenge of decoupling fluctuations in asset prices, in particular equity and property prices, due to changes in macroeconomic fundamentals from the emergence of asset bubbles. The capacity and capability of regulatory authorities to formulate timely and appropriate economic and prudential policies in response to increased cross-border capital flows and the possible formation of asset bubbles remain a major challenge.
In an increasingly integrated global economy and financial system, the process of decoupling stresses and risks in one economy from another becomes more complex. A case in point is the current period of higher volatility in the global and regional financial markets, triggered primarily by the unwinding of positions by international investors amid mounting uncertainty following the subprime episode, which was followed by corrections in domestic markets.
This underscores the importance of effective mechanisms for coordination and collaboration between regulators in the host and home country with emphasis on meeting the information needs of those responsible for financial and macroeconomic stability. The growing presence of cross-border financial conglomerates entails greater migration of decision-making and incongruence of organisational structures. While widely recognised, the effectiveness of existing mechanisms remains largely untested.
Intensified competition in lending activities can lead to higher risk-taking appetite as financial institutions strive to sustain the return on assets and profitability. This, together with the rapid pace of product innovation and financial engineering, can potentially result in mispricing and concentration of risks and the misassumption of liquidity. The challenge therefore is for central banks to strike a balance between promoting competition and efficiency in the banking system, and putting in place the necessary prudential safeguards to preserve stability and orderly market conditions.
On the regulatory front, concerted efforts have, over the years, been made towards further strengthening and streamlining the existing prudential and regulatory framework in line with international best practices, whereby the key focus has been on enhancing institutional risk management infrastructure and capabilities as well as promoting stronger governance and accountability amid greater transparency within and among financial institutions. These efforts have paved the way for more operational flexibility being accorded to financial institutions that have consistently demonstrated strong risk management capability. Highlights of some of the key flexibilities are as follows:

338 BIS Papers No 44
In April 2007, Bank Negara Malaysia’s limit on the foreign currency net open position (20% of banks’ capital base) was abolished to provide greater flexibility to licensed onshore banks to undertake foreign currency business. Beginning in January 2007, banking institutions that have the capacity and capability, and that meet the central bank’s supervisory standards, were given the flexibility to determine their own internal policy governing their equity-related activities instead of being subject to the prevailing limit of 5% prescribed by the central bank. The type of shares in which an institution can invest has also been expanded to include all listed shares, preference shares, unlisted shares and foreign equities. The limit for aggregate exposures to investments in shares and interest in shares, however, has remained at 25% of a bank’s capital base. This is being reinforced through the continued rigorous supervisory assessments on capabilities covering equity valuation, policies on risk diversification, risk mitigation arrangements and stress testing capabilities of banking institutions.
Exposures to private debt securities of banking institutions are subject to single customer credit limits, with a separate limit of 10% of the bank’s total capital. Valuations for securities (fixed income, equity and their hybrid) in the trading books of banking institutions are based on market valuation to reflect market movements. Since April 2005, banking institutions have been required to set aside capital for market risk exposures. The capital charges on market and large exposure risks vary depending on the level and type of exposures.
While the direct and spillover effects from the fallout of the subprime market crisis and its contagion into credit and financial markets were relatively large in some countries, the impact on Malaysia was relatively small and largely emanates from the associated increase in external financial market volatility. This is due to the almost negligible direct exposures of Malaysian banking institutions and insurers to the subprime market. Notwithstanding this, the central bank has continuously enhanced its supervisory oversight and regulatory measures to ensure the resilience and soundness of financial institutions and the financial system, in tandem with the changing financial and operating environment. With growing maturity of the market and the players’ capabilities, the supervisory and regulatory approach has evolved from being predominantly “rule-based” via the adoption of administrative controls and prescriptive rules, towards a “principle-based” approach which is more adaptive to changing market circumstances and business practices. Under this regime, greater flexibility from both the regulatory and supervisory perspectives is accorded to institutions that have strong risk management and corporate governance practices in place.
Similarly, on the supervisory front, the approach has evolved to adapt to increased complexities and to enhance the effectiveness of supervision in line with the rapid structural and operating changes taking place in the domestic financial system. Supervisory activities are now premised on a rigorous risk-based framework whereby supervisory resources are prioritised towards areas that pose substantial risks to the stability and soundness of the financial system and individual institutions. This should enable a structured and pre-emptive approach in assessing financial institutions’ risk profiles and the effectiveness of internal risk management systems.
For instance, the increasingly complex group structures involving financial conglomerates have called for the development of a consolidated supervision framework to ensure balance between allowing group synergy and efficiency, and ensuring that the conglomerates do not introduce excessive risks into the overall system. Similarly, due attention will continue to be paid to enhancing cooperation and exchange of information between home/host supervisors amid the increased capital flows environment. Micro stress testing is now being adopted at the institutional level not merely as a risk management tool, but more importantly as a business management and strategy tool.
It is now more widely recognised that the task of preserving financial stability is not the sole accountability of the central bank but rather the shared responsibility of different stakeholders. Bank Negara Malaysia is now placing greater emphasis on the principal responsibilities and accountabilities of the boards and senior management of banking

BIS Papers No 44 339
institutions, particularly in ensuring that their institutions embrace a strong culture of corporate governance and integrity, with robust internal controls and risk management practices. Greater emphasis has also been placed on enhancing the effectiveness of macroprudential surveillance that provides a more holistic view of structural imbalances, interactions and vulnerabilities within the financial system as well as facilitating the monitoring of the system at the national and global level.
The need to identify and assess the link to and risk of contagion for the domestic financial systems arising from regional and global financial markets poses an additional challenge. This is in view of the magnitude and speed of mobility of international capital and the increasing risks of contagion from financial crises between markets. Equally important but nevertheless very challenging would be the identification and measurement of contagion risk between various economic sectors and the financial sector with a view to facilitating the assessment of the impact of stresses from the economy on the financial sector and vice versa.
Coupled with more integrated micro and macro surveillance activities, improved financial safety nets, prudential standards and risk management principles that are aligned with international practices, the enhanced supervisory and regulatory measures adopted by Bank Negara Malaysia have enabled more efficient identification of emerging vulnerabilities and effective remedial response to financial stability challenges.
VI. Conclusion
Emerging market economies, including Malaysia, face a real challenge in managing the increasing magnitude and volatility of capital flows. In many respects there is a dilemma as, given their openness and relatively nascent stage of financial deepening, it is not feasible for emerging market economies to allow the domestic currency to absorb the full impact of capital flows. To do so would risk disruptive currency movements that could undermine real trade and investment activity. At the same time, efforts to deepen and broaden domestic financial markets (to better absorb capital flows) cannot move as quickly as the authorities would like. It needs to be recognised that financial deepening is a long-term process, requiring a long gestation period to achieve financial maturity.
While measures to strengthen monitoring systems and enhance the resilience of the domestic economic and financial system are important in building resilience, they do not guarantee that an economy will be completely insulated from volatile capital flows. This begs the question: what else can the international community in general, and emerging market economies in particular, do to better cope with large and volatile capital flows? At one extreme, the conventional “Wall Street” view that capital flows will take care of themselves does not appear to be a feasible option for emerging markets, at least for the foreseeable future. At the other end of the spectrum, calls for active management of capital flows, including capital controls and a tax on inflows (the so-called “neo-structuralist” view) may face practical limitations.
The exogenous nature of capital flows and their strong contagion effects do, however, suggest an important role for closer international cooperation in supporting national policies to build resilience. In this regard, this meeting of deputy governors represents an important element in such cooperation – to promote a better understanding of the nature and policy implications of capital flows. There is much scope for closer cooperation to penetrate the opaqueness of capital flows. With greater transparency, hopefully, the task of managing these flows will become less onerous.


BIS Papers No 44 341
The impact of international financial integration on Mexican financial markets
José Sidaoui
Introduction
Over the last decade, market liberalisation and advances in information technology have eliminated barriers to capital mobility and reduced financial transaction costs. These developments, together with a favourable market environment characterised by abundant liquidity, have led to an unprecedented integration of domestic financial systems worldwide.
Mexico, as other emerging market economies, has taken advantage of this environment to implement structural policies and modernise regulation in order to strengthen its financial system. The purpose of this paper is to highlight the benefits of international integration for the money, bond and foreign exchange markets, which, in many ways, have been the flagship of international integration. Exposure to global financial competition has broadened the range of intermediaries and investors, leading to more transparent pricing, higher liquidity and lower transaction costs in the domestic markets. It has also enlarged the menu of investment alternatives and helped to attract more specialised and sophisticated participants. This has generated a virtuous cycle of increased integration, modernisation, competition and efficiency.
The development of a market-oriented financial system comes, in part, from the experience of successive macroeconomic crises exacerbated by a closed and overregulated financial system. The transition to the current stage of development has required both vision and consistency from the financial authorities to provide domestic markets with sound foundations. This has required specific actions to incorporate the best international practices in terms of both the regulatory framework and the infrastructure to conduct operations.
The structure of the paper is as follows. Section I presents the development of the Mexican financial system in its transition from a relatively closed system to its current state. Section II provides some evidence for and explores some of the benefits of increased integration in financial markets. Section III describes the implications of financial integration for monetary policy and is followed by conclusions.
I. The institutional background
This section briefly describes the institutional background that has shaped the Mexican financial system since 1970.
At the beginning of the 1970s, Mexico was a relatively closed economy operating under a fixed exchange rate regime, in which foreign investment was severely curtailed and the financial system was overregulated. The central bank determined the interest rate levels of a small range of available saving instruments. On the asset side of banks, regulation imposed strict restrictions on lending by allocating a large share of the available deposits to specific activities.
During the 1970s, the government gradually abandoned the macroeconomic stability attained in the previous 20 years. Since most of the government deficit was financed directly by the central bank, monetary expansion brought about a consequent upward pressure on inflation. Even though inflation was on the rise, nominal interest rates remained constant, resulting in

342 BIS Papers No 44
financial disintermediation as people began withdrawing their bank deposits, discouraged by negative real returns and the foreseeable devaluation of the currency. After a significant speculative attack against the peso, the government was forced to devalue it in September 1976.
The 1976 crisis was resolved due to the availability of additional government revenues coming from the exploitation of massive oil fields; however, almost none of the structural problems that induced the crisis were properly addressed. In particular, the financial system remained highly regulated and, therefore, vulnerable to the prevailing macroeconomic imbalances. There were, however, two significant changes implemented during those years in the financial arena: the issuance of the first government debt securities denominated in pesos (Cetes); and the granting of permission to banks to offer different products under the same legal entity. Commercial banks became “multiple banks”. Although these changes were positive, they had limited effects on the workings of the system since most of the other regulations remained unchanged.
At the beginning of the 1980s, the economy again faced a huge government deficit, amounting to 15% of GDP by 1982, due to falling international oil prices. At the same time, the Federal Reserve implemented a restrictive monetary policy. To compensate for the drastic reduction in oil revenues, the Mexican government resorted intensively to short-term external credit from international banks. However, the combination of a rapidly increasing debt, lower oil prices, and higher interest rates abroad made the prevailing fixed exchange rate regime untenable. Once more, Mexico was forced to devalue its currency.
Macroeconomic instability followed the devaluation of 1982, led by a large fiscal deficit and an exchange policy that sought to achieve a competitive rate through devaluations. The inflation rate reached 180%. In the wake of the realisation that macroeconomic stability cannot be attained by imposing controls or through isolated and, most of the time, contradictory actions, there was an important policy shift. The new policy was based on the notion that effective integration with the rest of the world would provide the incentives needed for sustained growth. Consequently, in 1986, the government embarked on a comprehensive strategy to deal with the different problems it faced. Measures were taken to address the fiscal imbalance, the external debt was renegotiated, and to increase competitiveness, the economy was opened up to both merchandise and financial flows.
The new policy included several actions to relieve financial repression. Exchange controls began to be gradually dismantled and compulsory direct financing from commercial banks began to be replaced by liquidity requirements. The new requirements took the form of marketable debt instruments which provided banks with an incentive to foster the development of the government debt market. With the expansion of the securities market, banks were no longer needed to directly finance the public sector.
At the beginning of the 1990s, additional policies to further deregulate the financial sector were undertaken. In 1991, the government decided to re-privatise the banking system. This action was aimed at both modernising the industry and mending the inefficiencies brought about by 10 years of state ownership. Banks were allowed to freely determine deposit and lending rates as well, and all credit allocation directives were abolished. Perhaps one of the most important actions to open up the capital account was also taken: foreign residents were granted permission to hold positions in domestic fixed income securities and equities.
The efforts to stabilise the economy and modernise the financial system were shadowed by the inability of the inflexible exchange and interest rates to respond to the massive capital inflows that were entering the country at the time. The lack of flexibility in key relative prices contributed to a rising current account deficit, an accumulation of international reserves and the expansion of banking credit.
From 1990 to 1994, the central bank actively intervened in both money and foreign exchange markets with the purpose of keeping the exchange rate within a predetermined band. The limits to the band were set to achieve an inflation objective. This policy was effective in

BIS Papers No 44 343
bringing down inflation from levels of 30% in 1990 to 7% in 1994. Nevertheless, this strategy revealed several shortcomings. For example, a portion of the considerable capital inflows from 1991 to 1993 were intermediated by commercial banks, allowing them to rapidly expand their lending to the private sector. However, neither the recently privatised commercial banks nor the banking supervisory agency had the expertise to adequately manage the enlarged risk exposure intrinsic to such a huge credit expansion. Additionally, the deposit insurance framework, according to which all banks’ liabilities were guaranteed, induced perverse moral hazard incentives which were exacerbated by inoperative regulation.
In 1994, both the macroeconomic environment and expectations changed dramatically, as the Federal Reserve aggressively implemented a restrictive monetary policy and Mexico suffered from political instability. As a consequence, there was a reversal of short-term capital inflows.
As in 1982, to avoid the impending devaluation of the peso, most of the international reserves were depleted through continuous interventions in the foreign exchange market. Additionally, in an attempt to restrain the demand for dollars that had severely stressed the foreign exchange market, the government placed massive amounts of tesobonos through operations in the primary and secondary markets.1 However, after a series of speculative attacks, the peso was devalued in December 1994. As discussed in Sidaoui (2006), the overarching incentive structure of the Mexican financial system set the stage for the dual balance of payments and banking crises.
To deal with the 1994–95 crisis, an emergency stabilisation programme to ensure the solvency of the economy was implemented by assembling an international financial assistance package that allowed the substitution of short-term tesobonos with long-term liabilities.2 Once this package was obtained, the government implemented the second step of the stabilisation programme aimed at inducing a rapid macroeconomic adjustment, mainly by enlarging domestic savings and eliminating, for good, fiscal dominance by curtailing expenditures and broadening tax revenues.3
Even in the midst of the crisis, the government reasserted its commitment to market policies and implemented several actions to promote the modernisation of the financial sector, allowing both exchange and interest rates to be determined by supply and demand only, and undertaking a far-reaching reform to change the private pension system from a pay-as-you-go mechanism to an individual capitalisation scheme.
In addition to these reforms, several legal and regulatory actions were implemented to improve the workings of markets and promote their consolidation. Among the legal reforms, worth mentioning is the elimination of restrictions on foreign investment in the financial system, which brought fresh capital and technical expertise to the financial industry; the introduction of an explicit and limited deposit insurance framework, which minimised moral hazard; a system of prompt corrective actions that set out immediate actions to be undertaken by banks and supervisors if their capital adequacy fell short of the required minimum; a better corporate resolution law; the improvement of creditors’ rights, and the creation of credit bureaus to prevent adverse selection problems.
1 Tesobonos were zero coupon bills denominated in US dollars but payable in Mexican pesos, placed by the
federal government at discount rates with 28-day to one-year terms to maturity. 2 See Sidaoui (2005) for more details on the Mexican strategy of foreign currency intervention in dealing with
the tesobono problem. 3 Sidaoui (2006) gives a thorough description of the adjustment programme implemented to address the 1995
crisis.

344 BIS Papers No 44
The most important regulatory reforms were the adoption of international accounting standards for all financial companies, improvements in information disclosure and accountability, stricter capital adequacy regulation, and better corporate governance. Regulators also provided the derivatives markets with a sound framework. Furthermore, when markets required unbiased references for their workings and could not reach them by themselves, the central bank provided them with such references: for example, the daily fix-peso rate or the 28-day interbank interest rate (TIIE).
II. Evidence of increased integration and some of its benefits
This section presents evidence of Mexican financial markets’ increased integration into the international financial system. Recent developments in Mexico’s money, bond and foreign exchange markets are analysed. Particular attention is given to the response of local players to the deeper integration of financial markets. The benefits of higher competition in each of these markets are also reviewed.
Increased financial integration has been particularly evident in the foreign exchange market. Full adherence to a floating exchange rate regime and the absence of capital controls has paved the way for a peso-dollar market that has grown above expectations, in terms of both volume traded and number of participants. As reported in the recent editions of the BIS Triennial Central Bank Survey of Foreign Exchange and Derivatives Market Activity, the volume of peso-dollar transactions doubled in 2004–07 and has increased more than fourfold since 2001 (BIS (2004, 2007)). Like other emerging market currencies in the survey, the increase in daily volume traded for the peso in 2004–07 was attributed almost entirely to transactions between intermediaries outside the country (Table 1).
Table 1
Offshore foreign exchange markets As a percentage of total value
Offshore market
2004 2007
Mexican peso 28 61
Australian dollar 60 59
Canadian dollar 59 68
Czech koruna 64 42
Hong Kong dollar 19 14
New Zealand dollar 75 88
Polish zloty 34 68
A transaction is classified as “offshore” when neither of the trading parties is a local financial institution.
Source: Bank of Mexico calculations with data from the BIS Triennial Central Bank Survey of Foreign Exchange and Derivatives Market Activity and from the central banks of Australia, Canada, China, the Czech Republic, New Zealand and Poland.

BIS Papers No 44 345
Commercial banks account for most of the volume of foreign exchange transactions in the peso-dollar market. However, this dominance has been decreasing in favour of other participants, such as institutional investors (local and foreign), hedge funds, commodity trading advisers (CTAs), and model-based technical trading accounts (see BIS (2004, 2007)). In 2007, foreign exchange transactions among local and foreign banks accounted for 58% of the total volume traded locally as compared with 78% in 2004. Meanwhile, participation by other financial institutions, which include a large proportion of foreign institutions, rose from 19% in 2004 to 34% in 2007.
Increased integration is also evident in the fixed income market, mainly in the government bond segment. Intermediation in the primary and secondary markets continues to be carried out predominantly by traditional, large deposit-taking institutions. However, subsidiaries of foreign institutions, which have focused more on securities trading, have gained importance (Graph 1). These recent and more dynamic institutions represent a welcome counterbalance.
Higher integration with the global financial system has also led to a wider base of investors in the local bond and money markets. The period of low interest rates and “excess liquidity” from 2002 onwards brought about a sharp increase in foreign investors’ participation in these securities (Graph 2). In Mexico, this was especially evident in the fledgling market for peso-denominated government nominal bonds. Driven by a need to diversify their portfolios and to search for higher-yield instruments, foreign investors were attracted to local markets by the stable macroeconomic environment and the lack of restrictions on capital flows. By February 2008, foreign investors held peso-denominated government securities for a total of USD 25.2 billion (13% of total debt outstanding); 92% of these holdings were in long-term government bonds.
Graph 1
Bidders in primary auctions of government securities As a percentage of total offered
Retail banks include the three largest deposit-taking institutions (Banamex, Bancomer and Santander); investment banks include JPMorgan Chase, Bank of America, Deutsche Bank, Credit Suisse and Merrill Lynch.
Source: Bank of Mexico.
2003
14.5
46.2
39.3
Retail banks
Investment banks
Others
2007
33.6 45.0
21.4

346 BIS Papers No 44
Graph 2
Foreign flows to debt markets In millions of US dollars
Source: Emerging Portfolio Fund Research. Source: Bank of Mexico.
Evidence reveals higher levels of integration into the global financial system also by Mexican institutional investors. Nowadays, local pension funds (Afores) have around 9% of their assets invested in foreign assets (Graph 3). The stronger links to foreign markets and the regulatory changes to their investment regimes have provided local investors with a wider set of instruments and investment opportunities.
Financial integration has also allowed foreign entities to issue peso-denominated debt and to take advantage of the demand for highly rated non-government peso-denominated bonds. Worth mentioning is the amount of euro-peso securities outstanding, which has almost equalled the level of non-bank Mexican corporate peso-denominated debt (Graph 4).
Several factors have contributed to the expansion of the euro-peso market, in particular the ability of foreign issuers to efficiently manage their currency exposures in a liquid foreign exchange forward peso market. Another relevant factor has been the development of the government debt yield curve. By extending the maturity of bonds to 30 years since 2006, issuers and investors have been able to price these securities according to the reference rates (Graph 5).
Graph 3
Pension funds’ investment in equity and foreign securities In millions of US dollars
Source: Pension Funds Supervisory Commission (Comisión Nacional del Sistema de Ahorro para el Retiro, CONSAR).
Cumulative flows to bonds from Latin Americadedicated funds
-1,500
-1,000
-500
0
500
1,000
1,500
2,000
2,500
Jan Feb Mar Apr May Jun Jul Aug Sep Oct Nov Dec
2005 200620072004
2008
Mexico: Government securities holdings by foreigners
8,000
10,000
12,000
14,000
16,000
18,000
20,000
22,000
24,000
Jul 05 Nov 05 Mar 06 Jul 06 Nov 06 Mar 07 Jul 07 Nov 07 Mar 08
0
2,000
4,000
6,000
8,000
10,000
12,000
Feb 05 Aug 05 Feb 06 Aug 06 Feb 07 Aug 07 Feb 08
Local equity Foreign debt Foreign equity

BIS Papers No 44 347
Graph 4
Domestic debt markets
Sources: Bank of Mexico; Bloomberg. Source: Bank of Mexico.
Graph 5
Euro-peso maturity
Sources: Bank of Mexico; Bloomberg.
Entities tapping into this market include international financial institutions, such as the Inter-American Development Bank and the World Bank, quasi-sovereign entities like the KfW banking group, and a large number of foreign financial institutions. The number of institutions issuing euro-peso debt has increased almost threefold in the last two years (Graph 6).
Graph 6
Euro-peso debt issuance
The shaded areas represent the number of issuers in each sector.
Source: Bloomberg.
Euro-peso debt by sector Amount outstanding in millions of pesos
0
50,000
100,000
150,000
200,000
250,000
Mar 05 Sep 05 Mar 06 Sep 06 Mar 07 Sep 07 Mar 08
Commercial banks
Supra-nationals
Financial services
Other
Non-bank Mexican corporate debt by sector Amount outstanding in millions of pesos
0
50,000
100,000
150,000
200,000
250,000
300,000
2001 2002 2003 2004 2005 2006 2007 2008
Non-bank financial institutions
Secondary industryConstructionCommerceTelecom, transport and highways administration Other
Maturity of euro-peso and government bonds at issuanceYears
0
5
10
15
20
25
30
35
2002 2004 2005 2006 2007
Government bonds (maximum maturity)
Euro-peso (average maturity)
Euro-peso (maximum maturity)
Euro-peso debt issuers, 2005
Financial services, 8
Other, 20
Supranational, 17
Commercial banks, 5
Euro-peso debt issuers, 2007
Other, 16
Financial services, 65
Commercial banks, 43
Supranational, 17

348 BIS Papers No 44
Many of these issuers have taken advantage of the high demand for highly rated peso-denominated debt. In some cases, this situation has presented them with arbitrage opportunities when they swap the peso exposure, thus resulting in lower funding costs as compared with issuing directly in their local currencies.4 On the demand side, euro-peso debt allows local and foreign institutional investors to maintain a peso exposure and diversify the credit risk of their portfolios away from traditional domestic issuers, namely the federal government and large Mexican corporations. As previously mentioned, regulatory changes to the investment guidelines of local pension funds have increased the demand for these bonds.
Further evidence of increased financial integration in Mexico is the ownership structure of financial companies. Throughout the sector, foreigners own a significant share of the industry. For example, in the banking system, subsidiaries of foreign institutions account for almost 80% of total assets (Figure 1).
Figure 1
Share of foreign-owned bank assets In per cent
In selected Latin American countries (2005) In Mexico (2007)
Country Foreign participation
Argentina 48
Bolivia 25
Brazil 27
Chile 41
Peru 46
Mexico 80
Source: Bank of Mexico.
The financial system as a whole has benefited from this ownership structure, especially in terms of an efficient transfer of human and technological capital. The financial system has increased its exposure to innovative tools and sophisticated risk management practices, which has led to greater specialisation.
According to recent analysis by the Bank of Mexico, the increase in foreign participation also corresponds to a period of greater competition among commercial banks when measured in terms of overall income, lending activity in the mortgage market and consumer credit.5 Greater competition and financial innovation, together with macroeconomic stability and improvements in regulatory and supervisory frameworks, have allowed for a gradual restoration of credit by commercial banks and other intermediaries. These conditions have increased the effectiveness of the credit transmission channel of monetary policy.
4 See Annex A for a detailed example of these transactions. 5 For further details see Bank of Mexico (2006).
Mexico 21%
Spain34%
USA28%
Canada4%
UnitedK10%
OtherCountries
3%
Mexico 21
Spain 34
United States
28
Canada 4
United Kingdom
10
Other countries
3

BIS Papers No 44 349
Integration has diversified the base of market participants. It has also led to the specialisation of intermediaries, issuers and institutional investors, giving rise to new and more sophisticated instruments. Markets have therefore become more competitive and more efficient, attracting more participants, further integrating domestic markets into the global financial system and generating more competition, thus creating a virtuous cycle.
In the foreign exchange market, increased competition has led to an extension of active trading hours to other time zones and to a significant reduction in bid-ask spreads. As participation in the foreign exchange market has extended to time zones outside the United States, the hours in which the peso is traded more actively have shifted accordingly.6 Data provided by Reuters show that the distribution of trading activity has shifted considerably, with the highest levels of market activity occurring when Mexico, New York and London are simultaneously open (Graph 7). Another very important change has been the reduction in the bid-ask spread for peso-dollar transactions, which has declined during the most active trading hours by more than 30% in the last two years.
Graph 7
Intraday trading activity in the foreign exchange market
Trading time frame in the US dollar-Mexican peso Trading time frame in the US dollar-Mexican peso foreign exchange market foreign exchange market Average number of trades per minute in 2004, GMT Average number of trades per minute in 2007, GMT
0.0
2.0
4.0
6.0
8.0
10.0
12.0
14.0
11:00 12:00 13:00 14:00 15:00 16:00 17:00 18:00 19:00 20:00 21:00
London market close
Chicago pit opening
0.0
2.0
4.0
6.0
8.0
10.0
12.0
14.0
11:00 12:00 13:00 14:00 15:00 16:00 17:00 18:00 19:00 20:00 21:00
London market close
Chicago pit opening
Average US dollar-Mexican peso bid-ask spread in 2007 Mexican peso cents, GMT
0.00
0.05
0.10
0.15
0.20
0.25
0.30
0.35
0.40
0.45
11:3
0
12:0
0
12:3
0
13:0
0
13:3
0
14:0
0
14:3
0
15:0
0
15:3
0
16:0
0
16:3
0
17:0
0
17:3
0
18:0
0
18:3
0
19:0
0
19:3
0
20:0
0
20:3
0
Source: Reuters.
6 A statistical test of the distribution of day trading shows that the average distribution during 2007 shifted
relative to the average distribution prevailing in 2005. For further details, see Annex B.

350 BIS Papers No 44
The wider use of electronic trading platforms has attracted more global players and increased the effective trading day for the peso.7 In this context, the Bank of Mexico recently presented an initiative to incorporate the peso as a member currency of CLS Bank. This measure will help to eliminate the settlement risk of peso-dollar transactions and develop a 24-hour market for the Mexican peso.
Table 2
Volume in the foreign exchange market Daily average
2004 2007
Foreign exchange global volumes1
Peso global volume (in millions of US dollars) 20,311 39,221
Peso volume completely operated abroad (as a percentage of total) 28 61
Foreign exchange derivatives volumes2
Over-the-counter markets
Peso derivatives volume (in millions of US dollars) 9,978 28,981
Peso derivatives volume completely operated abroad (as a percentage of total) 55 63
1. Volume in outright forwards (in millions of US dollars) 1,716 4,594
operated abroad (as a percentage of total) 39 91
2. Volume in foreign exchange swaps (in millions of US dollars)
7,171 19,958
operated abroad (as a percentage of total) 56 49
3. Volume in options (in millions of US dollars) 708 4,185
operated abroad (as a percentage of total) 67 97
4. Volume in other derivatives (in millions of US dollars) 383 244
operated abroad (as a percentage of total) 95 95
Exchange markets
Daily average volume in Mexder (in millions of US dollars) 104 101
Daily average volume in the Chicago Mercantile Exchange (in millions of US dollars) 399 546 1 Includes spot transactions, forwards and foreign exchange swaps. 2 Includes forwards, foreign exchange swaps, options, currency swaps and other derivatives.
Sources: BIS, Triennial Central Bank Survey of Foreign Exchange and Derivatives Market Activity; Bank of Mexico; Mexder.
7 Data from the 2007 Triennial Central Bank Survey of Foreign Exchange and Derivatives Market Activity show
that 75% of volume in the peso-dollar market goes through electronic platforms and the rest via intra-dealer voice brokers.

BIS Papers No 44 351
Non-commercial players have become more interested in the liquidity and depth of markets for swap and forward transactions referenced to the Mexican peso (both over-the-counter and standardised markets). Technically driven strategies depend heavily on their executor’s ability to open and close positions promptly at low transaction costs, and the Mexican peso has been particularly appealing for such purposes. According to a recent study, funds that base their decisions on technical models (mainly CTAs) represent approximately 45% of the Mexican peso volume generated on the Chicago Mercantile Exchange. In contrast, purely fundamental decisions are taken by only 10% of these funds. Hybrid models that incorporate technical and macroeconomic indicators make up for the rest of the volume generated.8
Other instruments, particularly options, are mostly booked in offshore centres with local intermediaries acting as third parties between investors and foreign banks (mostly parent banks) that take on risk. This arrangement is the result of efficiency gains obtained by consolidating global risks in one book and having technical expertise in managing global portfolios usually located at banks’ headquarters (Table 2).
Global integration has also contributed to the expansion of execution vehicles. In the local foreign exchange market, the emergence of prime brokerage has allowed commercial and investment banks to provide credit lines, facilitating the entry of international funds to the dollar-peso market.
Increased competition in the securities market has also had a positive impact by reducing debt trading transaction costs. This benefit is evident in the compression of assigned bids in primary auctions of government securities. Bid-offer spreads for bonds in the secondary market have fallen significantly and are currently between 1 and 2 basis points for the most relevant reference points on the curve (Graph 8). Lower transaction costs facilitate the price discovery process and the reduction of the government’s cost of funding.
Graph 8
Transaction costs in government debt markets In basis points
Source: Bank of Mexico. Source: Remate Electrónico.
Foreign holders of peso-denominated debt have been key players in the development of the secondary market. In the early stages of development of the government yield curve, foreign investors were particularly interested in long-term bonds (Graph 9). Their holdings of these bonds (bonos) were relatively stable even in times of market stress, especially compared to the demand from local institutional players. Graph 9 shows the divergent behaviour between Afores and foreign investors during the first half of 2006.
8 Anderson (2003).
Primary auctions: allocated bids spread
0
10
20
30
40
50
60
2001 2002 2003 2004 2005 2006 2007 2008
10 years 20 years
Bid-offer spreads of on-the-run government bonds
0
4
8
12
16
2001 2002 2003 2004 2005 2006 2007

352 BIS Papers No 44
Graph 9
Holdings of government debt
Source: Bank of Mexico.
Competition from foreign investors has been an important factor influencing the change in investment strategies of local pension funds. The opportunity cost to Afores of holding short-term portfolios and following short-term strategies became patent when compared to the investment strategies followed by foreign players. Since the second half of 2006, Afores have focused more on long-term investment strategies and adopted investment benchmarks. Consequently, the duration and diversification of their portfolios as well as their resilience to short-term market volatility have increased considerably, thus representing a positive externality of increased financial integration with the Mexican bond market.
The emergence of investors and issuers with different needs and risk profiles has also increased the demand for hedging vehicles. As a result, interest rate derivative products have developed rapidly (Graph 10). The growth of a local interest rate swap market confirmed that the innovation process was under way. Virtually non-existent in the late 1990s, exposure to Mexican interest rates is now possible with liquid swaps up to 10 years, and transactions up to 30 years becoming more common. Many foreign participants favour this market over the cash market because of its high liquidity and flexibility. The swap market, known as the TIIE market, is also actively used to express relative value views and exploit apparent inconsistencies or arbitrages among markets. Various types of risks can now be hedged at Mexder, the local futures exchange. TIIE contracts with maturities up to 10 years are among the futures contracts with the highest global trading volume. Government bond contracts and other instruments have also gained relevance.
Graph 10
Interest rate derivatives
Source: Bloomberg. Source: Mexder.
Long-term holdingsIn millions of pesos, yield in per cent
- 20,00040,00060,00080,000
100,000120,000140,000160,000180,000200,000
Jan 05 Jul 05 Jan 06 Jul 06 Jan 07 Jul 07 Jan 087.0%7.5%8.0%8.5%9.0%9.5%10.0%10.5%11.0%11.5%
12.0%Foreigners (lhs) Pension funds (lhs) 20-year bond (rhs)
Long-term holdings of bonos, > 7 years In per cent
0
10
20
30
40
50
60
Jan 05 May 05 Sep 05 Jan 06 May 06 Sep 06 Jan 07 May 07 Sep 07 Jan 08
Foreigners Pension funds
Mexico: 10-year swap spread In basis points
0
20
40
60
80
100
Jan 04 Jul 04 Jan 05 Jul 05 Jan 06 Jul 06 Jan 07 Jul 07 Jan 08
28-day TIIE futures traded at Mexder In millions of US dollars
020,00040,00060,00080,000
100,000120,000140,000160,000180,000200,000
2003 2004 2005 2006 2007 20080
100,000
200,000
300,000
400,000
500,000
600,000Volume (lhs)
Open interest (rhs)

BIS Papers No 44 353
The growing presence of international players has increased the demand for innovative instruments. An example is the federal government’s management of liabilities through the use of debt exchange warrants and swaps.9
III. Implications of financial integration for monetary policy
After the 1994 devaluation of the peso, monetary policy became the nominal anchor of the economy. Since then, the central bank has committed to steer monetary policy towards an inflation objective. In the years following the crisis, the inflation objective was referred to the prevailing year-end annual percentage change of the consumer price index (CPI). In 2000, the central bank started publishing quarterly inflation reports and introduced the core component of the CPI to identify the trend for inflation. The transition towards an inflation targeting framework was completed in 2002 with the specification of a long-term inflation target of 3% for annual CPI inflation, with a variability interval of +/–1 percentage points.
As a result of adopting the inflation targeting framework, monetary policy implementation has become more transparent, open to public scrutiny, and easier to understand and anticipate for market participants (Graph 11). Since 2003, monetary policy announcements have been made public at predetermined dates, together with a press release. This has improved the Bank of Mexico’s accountability and helped anchor inflation expectations, thereby reinforcing the transmission channel of monetary policy.
Graph 11
Monetary policy and short-term rates
Source: Bank of Mexico.
9 For further details, see Annex C.
Overnight and one-month funding ratesIn per cent
2
4
6
8
10
12
14
16
18
20
Jan 00 Mar 01 May 02 Jul 03 Sep 04 Nov 05 Jan 07 Mar 08
Overnight 28-day TIIE

354 BIS Papers No 44
To some extent, the integration with global markets and the presence of foreign investors in the domestic market have facilitated improvements in both the implementation and communication of monetary policy. Indeed, the transition to an inflation targeting framework took place very smoothly as foreigners regarded it as the best practice in developed markets, which, in turn, helped to explain it to domestic market participants; ie foreigners provided a positive demonstration effect on domestic investors. The presence of foreign investors has also improved research and central bank watching.
Financial integration has contributed to the development of deeper and more liquid capital markets. The central bank has therefore been able to execute monetary policy without having undesirable effects on the functioning of markets. In conducting its operations, the Bank of Mexico has tried to rely mostly on marketable instruments, further promoting market development.
An example of the aforementioned is illustrated during the period from January 2000 to December 2006, when the central bank decided to accumulate a considerable amount of international reserves (USD 42 billion). Such an accumulation implied an expansion of liquidity of a large magnitude in the financial system. The Bank of Mexico was forced to increase its peso-denominated liabilities in order to sterilise the excess liquidity. More than half of the sterilisation was carried out via the placement of debt securities in the open market. During that period, the central bank issued debt instruments that float daily with the overnight rate and pay coupons every 28 days. These instruments are fully marketable and relatively liquid in secondary markets. The central bank relied only on compulsory deposits whenever the forecasted liquidity expansion was likely to outrun the steady sterilisation coming from the placement of debt securities. Compulsory deposits are remunerated at the overnight funding rate (Graph 12).
Graph 12
Bank of Mexico’s liquidity management
Source: Bank of Mexico.
Another important element in conducting monetary policy is the possibility to extract information from financial markets. Today, domestic markets are a good indicator of expectations regarding future policy actions and these can be tracked down continuously through prices for interest rate futures and swaps. The foreign exchange options market allows the central bank to monitor expectations regarding potential movements in the value of the peso.10
10 Exchange rate dynamics used to be very important for policy formulation given the high pass-through of
exchange rate depreciation to inflation. However, this pass-through has declined significantly due partly to the
Reserve accumulation and monetary base growth Cumulative flows in billions of pesos
0
200
400
600
800
1,000
1996 1997 1998 1999 2000 2001 2002 2003 2004 2005 2006 2007 2008
International reserves
Monetary base
Monetary regulation bonds and remunerated depositsAmount outstanding in billions of pesos
0
50
100
150
200
250
300
1998 1999 2000 2001 2002 2003 2004 2005 2006 2007 2008
Remunerated depositsMonetary regulation bonds

BIS Papers No 44 355
Conclusions
After more than a decade of consistent efforts, Mexico has consolidated a stable macroeconomic environment and established a new regulatory framework – which includes the adoption of best practices – for financial markets. These, together with a commitment to free and flexible markets, have allowed the economy to take advantage of the opportunities of global integration.
Financial integration, mainly reflected in increased competition in domestic markets, has contributed to a more developed and sounder local financial system. Exposure to global capital markets has increased competition as well as the number of intermediaries and investors, leading to more transparent pricing and lower transaction costs. As shown in Section II, foreign players’ involvement in local markets has changed trading patterns by promoting the use of more sophisticated instruments, thus contributing to the adoption of the best international market practices.
The use of more complex instruments, such as derivatives, has led to more efficient risk management by banks and other private entities. Arbitrage opportunities have increased, resulting in more efficient market pricing.
Establishing and updating an appropriate regulatory framework has therefore become necessary. Financial authorities have been active in adapting legal and regulatory policies to the rapid developments in local markets.
A sound financial market has benefited the Mexican economy by allowing both individuals and institutions to gain access to more favourable terms of financing. The liquid and deep local financial markets have shielded the economy during the recent periods of market turbulence. Throughout these episodes, local markets have remained remarkably resilient to external shocks.
Financial integration has also driven forward the adoption of actions aimed at improving understanding of monetary policy decisions. These developments, together with deepening credit markets, have strengthened the expectations and credit transmission channels of monetary policy.
Nevertheless, exposure to global markets has also shed light on some shortcomings in the money and bond markets:
• The process for determining the interbank reference interest rate. Since this rate is a reference for a large proportion of commercial bank assets and commercial banks also participate in its fixing, there is an incentive to quote high levels. The same may happen with futures contracts and interest rate swaps. In order to minimise manipulation, the central bank has constantly revised and strengthened the fixing procedure.
• Underdeveloped securities lending and long-term repo markets. Even though open and standard regulation has been in place since 2004, only a very small number of operations are carried out. Financial authorities continue to revise all regulations on a permanent basis to provide the missing building blocks for these markets to function efficiently.
• Fiscal distortions. The fiscal regime for foreign investors has been adapted to encourage their participation in financial markets. Often, the withholding tax regime on interest rate income needs to be updated.
strong commitment of the government and the central bank to a flexible exchange rate regime (see Sidaoui and Ramos-Francia (2008)).

356 BIS Papers No 44
• Absence of credit derivatives for peso-denominated securities. Regulation needs to be improved to allow local institutional investors to access this type of instrument. Currently, only interbank operations are permitted. As a result, the market has not developed.
The aforementioned deficiencies bring to the fore the need to constantly improve upon the workings of local markets.
In sum, financial integration has given access to world capital markets to more people, providing for a better allocation of savings and investment as well as more and sophisticated instruments to better manage risks. At the same time, however, it has also brought new global challenges. Mexico must be prepared to face them by acting in two dimensions: on the internal side, by strengthening its macroeconomic fundamentals and continually revising its legal and regulatory frameworks; and, on the external side, by adopting a more active role within the global community of central banks, regulators and other authorities to improve the international financial architecture.

BIS Papers No 44 357
Annex A: Example of funding through a euro-peso issue
Recent debt issuance by Morgan Stanley of a fixed coupon 20-year maturity bond for a
nominal amount of MXN 350 million
The issue date was 12 September 2007 and the yield was 8.48% per annum (67 basis points above the yield of the corresponding federal government bond). If Morgan Stanley were to have swapped the coupons from fixed to floating (TIIE) and then carried out a cross-currency swap from TIIE to Libor, the corresponding US dollar funding rate would be in Libor minus 44 basis points, a rate significantly lower than the interest rate at which Morgan Stanley can borrow directly in US dollars.11
According to market sources, Morgan Stanley’s US dollar funding rate at the time was approximately 100 basis points higher than Libor.
Source: Bloomberg.
11 Another way to assess the advantage cost for Morgan Stanley is to compute the US dollar implied yield if all
the bond’s cash flows were to have been swapped back into US dollars. The implied US dollar yield to maturity, using market prices of forward peso-dollar exchange rates, would be 5.41% per annum, 112 basis points lower than the yield to maturity of a bond issued by Morgan Stanley in US dollars maturing on June 2027.
Europeso Fix / float IRS CC basis swap
Peso swap rate : 9.03%
? =
Libor + 0.11%
minus
(9.03% - 8.48%)
swap spreadLibor – 0.44%
Morgan Stanley’ s implied US dollar funding rate
Fixed peso rate : 8.48%
USD Libor + 0.11%
Peso interbank rate (TIIE)
Peso interbankrate (TIIE)
Europeso Fix / IRS CC
Peso swap rate : 9.03%
? =
Libor + 0.11%
minus
(9.03% - 8.48%)
swap spreadLibor – 0.44%
Morgan Stanley’ s funding rate
Fixed peso rate : 8.48%
USD Libor + 0.11%
Peso interbank rate (TIIE)
Peso interbankrate (TIIE)
Peso swap rate : 9.03%
? =
Libor + 0.11%
minus
(9.03% – 8.48%)
swap spreadLibor – 0.44%
Morgan Stanley’ s funding rate
Fixed peso rate : 8.48%
USD Libor + 0.11%
Peso interbank rate (TIIE)
Peso interbankrate (TIIE)
Europeso Fix / IRS CC
Peso swap rate : 9.03%
? =
Libor + 0.11%
minus
(9.03% 8.48%)
swap spreadLibor – 0.44%
Morgan Stanley’ s impliedfunding rate
Fixed peso rate : 8.48%
USD Libor + 0.11%
Peso interbank rate (TIIE)
Peso interbankrate (TIIE)
Peso swap rate : 9.03%
? =
Libor + 0.11%
minus
(9.03% 8.48%)
swap spreadLibor – 0.44%
Morgan Stanley’ s impliedfunding rate
Fixed peso rate : 8.48%
USD Libor + 0.11%
Peso interbank rate (TIIE)
Peso interbankrate (TIIE)
Europeso Fix / IRS CC
Peso swap rate : 9.03%
? =
Libor + 0.11%
minus
(9.03% 8.48%)
swap spreadLibor – 0.44%
Morgan Stanley’ s funding rate
Fixed peso rate : 8.48%
USD Libor + 0.11%
Peso interbank rate (TIIE)
Peso interbankrate (TIIE)
Peso swap rate : 9.03%
? =
Libor + 0.11%
minus
(9.03% 8.48%)
swap spreadLibor – 0.44%
Morgan ’ s
Fixed peso rate : 8.48%
USD Libor + 0.11%
Peso interbank rate (TIIE)
Peso interbankrate (TIIE)

358 BIS Papers No 44
Annex B: Statistical analysis to test the shift in the
distribution of trading hours in the peso-dollar market
A series of statistical tests were conducted using the average distribution of daily trading for two different periods. The first period includes data for the whole of 2004 while the second includes data from January 2007 to date. Distributions are referred to as F2004 and F2007, respectively (Graph B1).
The Kolmogorov-Smirnov test was used as follows:
{ })()(max 20042007 xFxFKS −=
where x denotes a specific minute during the day.
The tests performed were as follows:
a) Ho: F2004 = F2007 vs H1: F2004<> F2007
The null hypothesis is rejected with a confidence of 95%.
The p-value of the KS statistic is 0.18%.
b) Ho: F2004 >= F2007 vs H1: F2004< F2007
The null hypothesis is rejected with a confidence of 95%.
The p-value of the KS statistic is 0.09%.
c) Ho: F2004 <= F2007 vs H1: F2004> F2007
The null hypothesis is not rejected with a confidence of 95%.
The p-value of the KS statistic is 99.96%.
The results suggest that the distribution of 2007 has shifted to the left relative to the one prevailing in 2004. This means that the peso-dollar market is more liquid earlier in the day, a condition that could be attributed to foreign participants.
Graph B1
Source: Bank of Mexico.
Cumulative distribution functions of trading in the US dollar-Mexican peso market Cumulative percentage per minute in 2004 and 2007, GMT
0
10
20
30
40
50
60
70
80
90
100
11:00 12:00 13:00 14:00 15:00 16:00 17:00 18:00 19:00 20:00 21:00
2007 2004

BIS Papers No 44 359
Annex C: Federal government debt management operations
A. Debt exchange warrants
Under the terms of a transaction, a warrant is exercised if the yield spread between the debt in pesos and that in foreign currency decreases (Graph C1, left-hand panel). For investors, this “insurance” is appealing because they can sell UMS bonds (foreign currency denominated bonds) and purchase fixed rate peso bonds under favourable conditions. Meanwhile, the Ministry of Finance carries out large transactions to substitute foreign for local debt without adversely affecting the bond market. From November 2005 to October 2007 the federal government exchanged debt under this mechanism for a total of USD 4.4 billion.
B. Local debt swaps
A second example of the use of innovative instruments is the swapping of government bonds to smooth their maturity schedules (Graph C1, right-hand panel). This type of procedure has reduced the settlement of very large amounts of securities at similar dates, without diminishing the liquidity and depth obtained by maintaining large amounts in circulation for most of the bonds’ life. From September 2005 to July 2007 the government carried out 10 swap operations for a total of MXN 35.5 billion.
Graph C1
Debt exchange warrants and debt swaps
As of 9 November 2006. Colours in the left-hand panel show the eligible bonds to be swapped by warrant holders; for example, UMS with maturities between zero and five years could be swapped for the bond maturing in December 2011. This graph corresponds to the 2005 warrant.
Sources: Bank of Mexico; Ministry of Finance (Secretaria de Hacienda y Crédito Público, SHCP).
UMS and domestic bond yield curves Yield
Maturity (years)
3.0
4.0
5.0
6.0
7.0
8.0
9.0
0 2 5 7 10 17 25
MBono
UMS
11 Dec 14 Dec 24 Dec
Amounts swapped in 2006–07 (variation of amounts outstanding) In billions of pesos
-25.0
-20.0
-15.0
-10.0
-5.0
0.0
5.0
10.0
2006 2007 2009 2010 2011 2012 2013 2014 2015

360 BIS Papers No 44
C. Federal government-Bank of Mexico swap (Graph C2)
In 2006, the Ministry of Finance announced the prepayment of USD 12.4 billion of external debt. To finance the transaction, the Ministry issued domestic securities (Bondes D), with the same characteristics as BREMs.12 Such sales were then used to purchase international reserves from the Bank of Mexico, which, in turn, used those Mexican pesos to buy back BREMs from the local bond market. All transactions were done through open auctions with previously disclosed and explained rules.
Graph C2
Central bank-federal government swap
Source: SHCP.
12 BREMs were adjustable coupon notes issued and placed by the Bank of Mexico from 2000 to 2006 to sterilise
the excess liquidity in the money market originated by the accumulation of international reserves. BREMs maturity terms were one, three and five years. Their coupon was referred to the daily overnight interest rate, payable every 28 days.
World Bank World Bank World Bank
IADB IADB & &
World Bank
Bondes D Dollars
Bondes D
Banco de Banco de
MM é
Local Local MarketMarketForeign Creditors
Dollars
Government
Local Market
CentralBank
BREMs
IADB IADB & &
World Bank
Banco de Banco de
MM é
Local Local MarketMarket
External debt cancellation
Foreign creditors
Government
Local market
Centralbank

BIS Papers No 44 361
References
Anderson, G (2003): “IMM Speculators in MXN”, presentation to the Bank of Mexico, ABN AMRO, March.
Bank for International Settlements (2004): Triennial Central Bank Survey of Foreign Exchange and Derivatives Market Activity.
——— (2007): Triennial Central Bank Survey of Foreign Exchange and Derivatives Market Activity.
Bank of Mexico (2006): Financial Stability Report.
Jeanneau, S and C Pérez Verdía (2005): “Reducing financial vulnerability: the development of the domestic government bond market in Mexico”, BIS Quarterly Review, December.
Sidaoui, J J (2002): “The role of the central bank in developing debt markets in Mexico”, in BIS Papers, no 11, “The development of bond markets in emerging economies”, pp 151–64, June.
——— (2005): “Central banking intervention under a floating exchange rate regime: ten years of Mexican experience”, in BIS Papers, no 24, “Foreign exchange market intervention in emerging markets: motives, techniques and implications”, pp 209–30, May.
——— (2006): “The Mexican financial system: reforms and evolution 1995-2005”, in BIS Papers, no 28, “The banking system in emerging economies: how much progress has been made?”, pp 277–93, August.
Sidaoui, J J and M Ramos-Francia (2008): “The monetary transmission mechanism in Mexico: recent developments”, in BIS Papers, no 35, “Transmission mechanisms for monetary policy in emerging market economies”, pp 363–94, January.


BIS Papers No 44 363
Macroeconomic implications of capital inflows: Peru 1991–20071
Renzo Rossini,2 Zenón Quispe3 and Rocío Gondo4
I. Introduction
During the early 1990s, many emerging market economies in Asia and Latin America experienced massive capital inflows, favoured by structural reforms and improvements in macroeconomic management. Although the higher degree of financial integration brought many benefits, the capital inflows resulted in overheating and increased vulnerability to financial crises, which led in some cases to sudden reversals of capital flows.
In recent years, the high level of global liquidity and favourable economic conditions achieved via improved macroeconomic management have generated massive capital inflows to emerging market economies. Peru has also experienced significant capital inflows, especially in foreign direct investment (FDI), contributing to economic growth and development possibilities, but also creating downward pressures on the exchange rate. The strength of the fiscal position, with sustained primary surpluses and the de-dollarisation of the financial system, has helped neutralise the side effects of capital inflows and allowed the monetary authorities to respond through sterilised interventions without endangering the inflation targeting regime.
This paper analyses the macroeconomic effects of the 2000s episode of capital inflows and compares it with the episode of the 1990s. It also evaluates policy measures implemented in order to reduce the impact of abrupt reversals of capital flows.
II. Capital flows in Peru
Emerging market economies in general, and Peru in particular, were recently experiencing significant capital inflows, due to high levels of global liquidity and favourable economic conditions reflecting better macroeconomic management and the stimulus of previously implemented structural reforms. However, this episode of capital inflows is different to the one experienced during the 1990s, as it was spread across a larger number of countries with solid current account positions, in a context of a higher degree of financial integration.
However, along with the benefits of increased financing, capital inflows can also cause negative effects resulting in an overheated economy, exchange rate pressures and greater vulnerability to financial crisis. European emerging market economies have received large capital inflows in recent years. These flows were initially made up mainly by foreign direct investment; however, portfolio inflows, especially those oriented towards the acquisition of
1 The views expressed in this paper are those of the authors and do not necessarily reflect the position of the
Central Reserve Bank of Peru (BCRP). We are indebted to Adrian Armas and Fernando Vasquez for valuable comments and suggestions.
2 General Manager, Central Reserve Bank of Peru. 3 Head of the Monetary Program Division. 4 Economist in the Economic Studies Department.

364 BIS Papers No 44
debt securities, have become more important over time. These large inflows were stimulated by country-specific factors such as large interest rate differentials, large-scale privatisation programmes, sound and credible macroeconomic policies and enhanced economic prospects, as mentioned by Ötker-Robe et al (2007). Even though capital inflows provide economic benefits, large portfolio inflows may challenge macroeconomic management through their effects on exchange rates and liquidity; therefore, authorities need to make careful use of interest rate and intervention policies to avoid disorderly exchange rate adjustments and preserve the credibility of their monetary policy regimes.
Structural reforms and capital inflows: 1993–96 Improvements in macroeconomic management achieved through stabilisation programmes and structural reforms implemented during the early 1990s generated a massive flow of foreign capital to emerging market economies, and especially to Asia and Latin America. Despite their benefits, capital inflows overheated the expansion of aggregate demand in these economies and increased their vulnerability to a financial crisis. International volatility in a context of fragile domestic financial systems led to a fast reversal of capital flows in the late 1990s, which generated sharp depreciations and contractionary effects in these economies.
Similarly, Peru also experienced a rapid increase in capital inflows in the early 1990s, after a series of structural reforms implemented together with a stabilisation programme. This experience is described by Castillo and Barco (2008).
After a decade of high inflation and persistent output contractions, in 1990 the Peruvian government implemented a drastic stabilisation programme and structural reforms to attain macroeconomic stability and to encourage sustainable economic growth. The improved institutional arrangements set a new legal framework with price stability as the only monetary policy objective and established central bank autonomy in order to achieve it. These measures helped to lower inflation from 7,482% in 1990 to 6.5% in 1997. Structural reforms associated with the deregulation of the financial system and capital liberalisation also allowed the economy to access the international financial markets and generate fresh capital inflows which helped to increase the economy’s productive capacity. The output growth rate increased from –5.1% in 1990 to 5.3% in 1997.
The environment of increasing monetary stability and sustainable output growth after the implementation of the structural reforms attracted capital inflows. Between 1991 and 1997, net private capital inflows were, on average, 5.8% of GDP, concentrated mainly on the long-term segment.
Capital outflows after the Russian crisis
Macroeconomic impact The Peruvian economy experienced two main shocks during the late 1990s. The first one was a reduction in the terms of trade, after the decrease in worldwide demand for commodities following the Asian crisis. Even though this shock did not have a significant effect on investment or consumption, there was a sharp reduction in short-term capital flows.
However, the Russian and Brazilian crises of 1998 and 1999 caused significant outflows of short-term capital from emerging economies, including Peru. The EMBI indicator for Latin America jumped from 657 to 967 basis points between August and September 1998, while in the case of Peru, it rose from 680 to 914 basis points. The outflows quickly impacted the financial system and the foreign exchange market.
Short-term capital flows switched from an inflow of USD 649 million in 1998 to an outflow of USD 808 million after the financial crises, while FDI slightly increased from USD 1,582 million

BIS Papers No 44 365
to USD 1,812 million during the same period. Similarly, other Latin American countries also showed a sharp decrease in short-term capital flows, while long-term capital inflows remained relatively steady.
Table 1
Private capital flows As a percentage of GDP
1998 1999
FDI Portfolio, net
Other, net FDI Portfolio,
net Other,
net
Argentina 1.7 2.9 1.1 7.8 –2.4 –0.2
Bolivia 11.1 –0.9 2.5 12.2 –0.7 –2.2
Brazil 3.5 2.2 –3.3 4.6 0.6 –3.9
Chile 4.0 –3.1 1.8 8.5 –4.4 –3.6
Colombia 2.1 1.2 –0.2 1.6 –0.7 –2.5
Paraguay 4.2 0.1 1.0 1.2 –0.1 –0.7
Peru 2.8 –0.7 1.1 3.5 –0.7 –1.6
Uruguay 0.7 1.9 –0.7 1.1 0.4 –1.4
Source: IMF, International Financial Statistics.
The wave of capital outflows put the exchange rate and money markets under pressure. The pressures were absorbed through a sharp increase in interest rates.
Financial conditions deteriorated with the reversal in short-term capital flows. The increase in interest rates and the nominal exchange rate depreciation generated a decrease in credit growth, accompanied by a decline in economic activity. The growth rate of credit from the banking system to the private sector dropped from 24% in 1997 to 14% in 1998, while output growth decreased from 6.9% in 1997 to –0.7% in 1998.
Even though the pattern of capital flows was similar to those observed in other South American economies, Peru experienced a lower reduction in output growth as well as a smaller real foreign exchange depreciation. Peru had a high level of international reserves, which helped to provide the banking sector with foreign currency liquidity during the liquidity shortage period. The lower reduction in GDP growth was also related to some extent to countercyclical fiscal policy, as the overall fiscal balance deteriorated from a surplus in 1997 to a deficit of 3% of GDP in 2000, and the investment in the tradable sector during the pre-crisis period allowed for increases in production capacity, especially in the mining and agricultural sectors.
Policy responses to capital outflows This episode of financial turmoil and increases in country risk led to a USD 987 million outflow of short-term capital in the fourth quarter of 1998, which generated interest rate and exchange rate variability. The initial policy response was to avoid a sharp depreciation of the domestic currency because of the balance sheet effects of a large depreciation in highly dollarised economies like Peru. As mentioned initially, the central bank allowed an increase in the short-term interest rate from 25% in July 1998 to 39% two months later. In the medium

366 BIS Papers No 44
term, the shock was absorbed through a 20% nominal depreciation of the exchange rate, while the interest rate fell back to 16.9% (Graph 1). After a short time, the authorities reoriented their policies towards the provision of foreign currency liquidity to the banking system.
Graph 1
Interbank interest rate, 1997–98 In per cent
Source: Central Reserve Bank of Peru.
Some of the policy measures implemented were:
Monetary policy measures a. Credit facilities in foreign currency. The central bank opened a window for short-term
credit in foreign currency as from 2 September 1998, in order to offset the short-run foreign currency liquidity restriction.
b. Reduction of the average and marginal reserve requirements on foreign currency deposits. Starting on 8 September 1998, the average reserve requirement on foreign currency deposits was reduced by 4.5 percentage points, through a series of 1.5 percentage point monthly reductions. This measure allowed the provision of foreign currency liquidity for USD 420 million. In addition, the marginal reserve requirement on foreign currency deposits was reduced from 35% to 20% in December 1998.
c. Foreign exchange interventions.
Against a backdrop of devaluation expectations and higher exchange rate volatility, the central bank restricted its purchases of foreign currency. Net purchases, including operations with the public sector, fell from USD 1,191 million in 1997 to a negative value of USD 639 million in 1998, considering the sale of USD 83 million in the foreign exchange market in September 1998.
Government and supervisory measures d. Conversion of foreign currency public deposits to domestic currency. This measure
provided foreign currency liquidity to the private sector, while also increasing the domestic currency resources of banks. These resources were used to increase the credit of the banking system in domestic currency by PEN 790 million in the fourth
0.0 5.0
10.0 15.0 20.0 25.0 30.0 35.0 40.0 45.0
Jan 97 Apr 97 Jul 97 Oct 97 Jan 98 Apr 98 Jul 98 Oct 98

BIS Papers No 44 367
quarter of 1998, partially offsetting the reduction in credit in foreign currency of USD 303 million.
e. Temporary purchases of banks’ portfolios. There were two programmes for temporary purchases of banks’ asset portfolios, for a total of USD 427 million, where banks were required to repurchase their portfolios at a discount rate of 20% in the following five years. They also committed to a net worth strengthening programme through the injection of new capital.
After the macroeconomic adjustment had taken place, the Peruvian authorities implemented several policy measures to guarantee the solvency of the banking system, including:
a. A net worth consolidation programme (creation of a fund for temporary capitalisation of banks);
b. A financial system consolidation programme (incentives for mergers);
c. A programme for financial rescue of agricultural companies and a programme for net worth consolidation of commercial companies;
d. Provision requirements (provisions based on the risk quality of banks’ assets);
e. Limits to banks’ global positions in foreign currency (a 100% limit (of capital?) on the overbought position and a 2.5% limit (of capital?) on the oversold position).
Between 1998 and 2001 the number of banks in Peru decreased from 25 to 15 due to the liquidation of nine banks and the merger of three, while two new banks started operations in 1998 and 1999, respectively. The total fiscal cost of the banking crisis is estimated at 2.1% of GDP.5
Policy measures adopted to confront the reversal of capital flows allowed for a quick reversal of the banking sector liquidity shortage. The low depreciation of the real exchange rate, compared to other Latin American countries, limited the deterioration of banks’ assets in Peru’s highly dollarised economy, and helped to neutralise the drop in GDP growth.
Countercyclical fiscal policy helped the economy by reducing the government deficit during the period of large capital inflows and by using these resources to increase public expenditure after the sudden stop. As a result, there was less overheating in GDP growth during the capital inflow period and a soft landing was possible after the reversal of capital flows.
Another feature that bolstered the resilience of the Peruvian economy’s long-term macroeconomic prospects was the persistence of FDI during the financial crisis, which maintained an average value of 2.7% of GDP between 1998 and 2002.
Macroeconomic stability and capital inflows: 2002–07 During the last few years there has been a gradual recovery in private capital inflows since the minimum reached in 2003, mainly in the form of FDI, favoured by the stable macroeconomic environment of price stability, fiscal discipline and financial solvency (Graph 2).
5 This indicator includes the programme for the exchange of treasury bonds for non-performing loans, the bank
restructuring programme, the financial consolidation programme and the corporate debt restructuring programme.

368 BIS Papers No 44
Graph 2
Net private capital inflows As a percentage of GDP
Source: Central Reserve Bank of Peru.
Table 2
1993–97 1998–2001 2002–07
Average Volatility Average Volatility Average Volatility
FDI 4.8 0.43 2.5 0.36 3.3 0.31
Other long-term 1.4 0.17 0.3 2.26 –0.6 3.39
Short-term 1.3 1.34 –1.0 1.43 0.0 ...
Total 7.5 0.27 1.8 0.65 2.8 1.32
Source: Central Reserve Bank of Peru.
During the last five years, the Peruvian economy has been experiencing a sustained expansion of economic activity, reaching GDP growth rates of 7.6% in 2006 and 9.0% in 2007, accompanied by a similar trend of domestic demand. In particular, private consumption and private investment have shown a faster pace of growth, reflecting consumer and business optimism in a context of increased disposable income due to higher terms of trade and employment growth. Since 2002, output growth has been much more stable than during the first wave of capital inflows of the mid-1990s. In fact, the volatility of GDP growth decreased from 49% (measured by the ratio of the standard deviation to its average) during 1993–97 to 27% during 2002–07 (Table 3).
–4.0
–2.0
0.0
2.0
4.0
6.0
8.0
10.0
12.0
1993 1994 1995 1996 1997 1998 1999 2000 2001 2002 2003 2004 2005 2006 2007
Other long-term flows Short-term flowsFDI Total
First wave Financial and political crises
Macroeconomic stability

BIS Papers No 44 369
4.8
14.0
11.9
1.4
–3.1
2.3
–0.4
4.1 3.7 4.0
5.7
10.0
11.6
2.5
6.9
0.9
3.0
0.2
5.04.0
5.1
6.7
–0.9
7.0 7.6
9.0
–0.7
4.8
8.6
12.8
–4.0
–2.0
0.0
2.0
4.0
6.0
8.0
10.0
12.0
14.0
16.0
1993 1994 1995 1996 1997 1998 2000 2001 2002 2003 2004 2005 2006 2007
Domestic demand
GDP
First wave Financial crises Macroeconomic stability
1999
–10.2
7.6 7.6
2.5
–8.1
–1.7 –1.7
5.0
0.1
9.4
5.6
27,4
3.6
–6.0 –8.6
–5.7
–2.0 –1.5
–5.4 –6.6
1.4
–7.1 –6.5 –5.9–2.7 –2.9
–2.2
0.01.4
3.0
–15.0
–10.0
–5.0
0.0
5.0
10.0
15.0
20.0
25.0
30.0
1993 1994 1995 1996 1997 1998 1999 2000 2001 2002 2003 2004 2005 2006 2007
Terms of trade (growth rate) Current account (% GDP)
First wave Financial crisesMacroeconomic
stability
Graph 3
Domestic demand and GDP
Source: Central Reserve Bank of Peru.
Table 3
GDP growth volatility
1993–97 1998–2001 2002–07
Average GDP growth 7.12 0.86 6.24 Variability 0.49 1.56 0.27
Source: Central Reserve Bank of Peru calculations, author calculations.
Another characteristic of the current scenario is the important increase in the terms of trade, which has been translated into a progressive improvement in the current account, reaching surpluses in the last two years. The favourable evolution in the price of exports has led to an increase in profits and reinvestments, giving an extra impulse to FDI during the last few years (Graph 4).
Graph 4
Current account and terms of trade
Source: Central Reserve Bank of Peru.

370 BIS Papers No 44
The first wave of capital inflows (1993–97) coincided with the privatisation process, stimulating FDI inflows; thus during this period FDI averaged 4.8% of GDP, 2.0% of which represented privatisation inflows. FDI then declined during the period of financial and political crisis, mainly due to the end of the privatisation process, but to a much lesser extent than other flows (2.5% on average). During 2002–07 FDI recovered its pace, reaching an average of 3.3% of GDP (Graph 5).
Graph 5
Foreign direct investment As a percentage of GDP
Source: Central Reserve Bank of Peru.
Capital inflows show a hike in 2007, again due mainly to FDI flows, accompanied also by long- and short-term debt, reversing the negative pattern shown since the end of the last decade. The current figures are different from those of 1997 since the current share of non-FDI inflows is low. In 1997 short-term flows were the largest component, reaching 4.2% of GDP (FDI accounted for only 3.5% of GDP), while in 2007 they represented only 1.9% of GDP (FDI: 4.9%, Graph 6). Therefore, financial and macroeconomic vulnerability due to capital inflows is much lower than in previous episodes.
Graph 6 Net capital inflows
As a percentage of GDP
Source: Central Reserve Bank of Peru.
0.0
1.0
2.0
3.0
4.0
5.0
6.0
7.0
8.0
9.0
10.0
1993 1994 1995 1996 1997 1998 1999 2000 2001 2002 2003 2004 2005 2006 2007
Privatisation
FDI net of privatisation
First wave Financial and political
crises Macroeconomic stability
3.5
1.3
4.2 FDI
Others, long- term
Short- term 4.9
3.4
1.9
FDIOthers,
long-term
1997 2007
Short-term

BIS Papers No 44 371
Identifying the determinants of capital inflows In the literature on capital inflows, researchers have examined the determinants of particular types of capital flows, distinguishing between short- and long-term flows. Most of the work on this topic analyses the presence of country-specific and external determinants. Some earlier approaches suggested that capital inflows to developing countries depend mostly on the business cycle of the developed world, with a decline in investment returns in developed countries causing investors to seek higher returns in emerging market economies. However, as shown by Montiel and Reinhart (1999), the distribution of capital inflows between emerging economies depends on country-specific factors.
In these approaches, the arbitrage factor, measured by the difference in returns between domestic and foreign currency assets, is expected to have a positive relationship with capital inflows. In the specific case of long-term capital inflows, indicators associated with macroeconomic stability will encourage an increase in capital inflows, especially of longer terms. Therefore, proper economic institutional arrangements associated with price stability, fiscal discipline and a sound financial system should attract longer-term capital inflows, principally foreign direct investment.
In order to identify the determinants of capital inflows in Peru, we first use a cointegration analysis on capital inflows following the work done by Ocampo and Tovar (2003). They examine the effect of regulation of capital flows in Colombia. The estimation is based on a ortfolio framework model, which considers the interest rate parity condition, controlling for reserve requirements in foreign currency. We then extend this approach by including indicators of macroeconomic stability.
For the first estimation we consider two types of interest rate differentials: (1) the spread between the domestic interbank interest rate and the US federal funds rate, and (2) the arbitrage factor, as represented by the spread of equivalent term deposit rates in Peru and the United States. The estimate takes into account reserve requirements on foreign borrowing implemented since October 2004 and the variation in the nominal exchange rate. The maturities considered for the arbitrage factor are one, two and three years.
In addition, we include an economic activity variable, proxied for by imports of capital goods, and control for the effect on total volume of reversals of capital flows during the Asian, Russian and Brazilian crises. In the case of Peru, although there is a ceiling on the foreign investments of private pension funds (set as a percentage of the total value of the fund), foreign investment by these funds accounts for a significant proportion of capital outflows from this country. Therefore, the value of these funds is considered in the regression analysis.
Using Johansen’s maximum likelihood cointegration analysis, we estimate the following relationship:
ttttt DZZZ ε+Ψ+Π+ΔΓ+μ=Δ −− 111
where Zt considers the two indicators on interest rate differentials, imports of capital goods and the value of the private pension funds, and Dt includes the dummies for financial crises.
The equilibrium relationship shows that, for all the maturities considered in the analysis, there is a high response of net capital inflows to the arbitrage factor. In the case of short-term interest rate differentials, although we obtain the expected positive sign, it is statistically insignificant in the estimation.

372 BIS Papers No 44
Table 4
Dependent variable: Private capital flows
Sample: 1994.01–2007.02
Equation 1 Equation 2 Equation 3
Import of capital goods S.D. P_value
2.31 0.471
0.0001
2.23 0.469
0.0001
0.69 0.316
0.0332
Arbitrage factor 12 months
S.D. P_value
7,181.1 1,984.1 0.0007
24 months S.D. P_value
6,490.0 1,816.5 0.0008
36 months S.D. P_value
5,019.7 1,207.4 0.0001
Pension fund foreign investment S.D. P_value
–1.26 0.247
0.0001
–1.31 0.244
0.0001
–1.39 0.170
0.0001
Short-term interest rate differential S.D. P_value
2,893.7 1,657.7 0.0869
2,559.4 1,617.2 0.1197
1,707.7 1,451.40
0.2448
Adjustment coefficient S.D. P_value
–0.56 0.163
0.0011
–0.58 0.166
0.0009
–0.42 0.16
0.0102
The cointegration analysis proves the existence of one long-term equilibrium relationship between net private capital flows, interest rate differentials, imports of capital goods and the foreign investment of the country’s private pension funds. The error correction term indicates a rise in the speed of adjustment of any disequilibria by capital flows as the maturity of the arbitrage factor increases.
In the second set of estimations we centre our attention on the determinants of long-term capital flows, incorporating as explanatory variables indicators that assess Peru’s macroeconomic performance in terms of monetary policy soundness, fiscal discipline and financial sector health.
The primary balance of the fiscal sector is used as an indicator of the fiscal position, the inflation rate as an indicator of monetary policy soundness and the non-performing loans ratio as an inverse indicator of financial sector strength. Decreasing inflation, a lower ratio of non-performing loans and an improving overall balance of the public sector provided an environment of macroeconomic stability that contributed to lower short-term capital flows to Peru and instead attracted foreign direct investment. The three equations differ from each other in that they include a different maturity for the arbitrage factor, for 12, 24 and 36 months, respectively. The results for the three equations are similar, in both sign and magnitude; however, the ratio of non-performing loans is not statistically at all. The estimations excluding the non-performing loans ratio show similar results to those shown in Table 5.

BIS Papers No 44 373
Table 5
Dependent variable: Long-term private capital flows
Sample: 1994.01–2007.02
Equation 1 Equation 2 Equation 3
Primary result NFPS S.D. P_value
319.9 26.1
0.0001
350.8 26.76
0.0001
336.9 27.18
0.0001
Arbitrage factor 12 months
S.D. P_value
4,842.1 1,503.6 0.0022
24 months S.D. P_value
4,913.2 1,478.1 0.0016
36 months S.D. P_value
4,662.3 1,482.9 0.0028
Pension fund foreign investment S.D. P_value
–1.47 0.280
0.0001
–1.52 0.296
0.0001
–1.53 0.290
0.0001
Inflation S.D. P_value
–40.81 15.58
0.0115
–39.55 16.48
0.0200
–40.56 16.30
0.0161
Non-performing loans S.D. P_value
–6.22 31.33
0.8433
12.65 33.03
0.7033
6.20 32.65
0.8502
Adjustment coefficient S.D. P_value
–0.34 0.11
0.0032
–0.28 0.10
0.0072
–0.31 0.10
0.0039
The results suggest that sound institutional economic arrangements enhance longer-term capital inflows such as foreign direct investment. This may explain the relative persistence of such flows to Peru over the whole estimation period.
Recent experience with the derivatives market The derivatives market has also gone through important developments during the last few years in Peru. The forward foreign exchange market is actually the most important market, where non-resident investors (the main players in this market) make non-deliverable contracts.
Since 2006 the forward market has shown a high degree of volatility (Graph 7). From 2003 to 2005 the net balance of forward purchases was around USD –700 million, covering the risk of new sol depreciation (future purchases of dollars at a predetermined exchange rate). Political uncertainty as presidential elections approached at the end of 2005 was reflected in financial markets, in particular in the foreign exchange market. The net balance of forward purchases more than doubled from its normal levels, to USD –1,700 by mid-2006. As the forward market is not organised, banks hedged the forward contract risk in the spot market by buying dollars, reinforcing the depreciation pressures on the new sol.

374 BIS Papers No 44
Graph 7 Net balance of forward purchases and the exchange rate
Source: Central Reserve Bank of Peru.
After the political uncertainty was resolved, the forward market changed rapidly, switching from reflecting the risk of depreciation to reflecting the risk of appreciation (future purchases of new soles at a predetermined exchange rate). Thus the net balance of forward purchases amounted to USD 1,075 million in May 2007, a swing of USD 2,700 million over the preceding 12 months; this amount represents more than 10% of the central bank’s net international reserves (NIR). These drastic changes introduced more volatility into the exchange market.
III. Policy responses to capital inflows
Rationale for international reserve accumulation in dollarised economies The Central Reserve Bank of Peru has a fully fledged inflation targeting regime with a point target of 2% and a tolerance range of ±1%. This target reflects the central bank’s commitment to monetary stability. In order to attain this objective, the central bank constantly evaluates indicators of inflationary pressure, and based on its quarterly forecasting model decides the level of the reference rate for the interbank money market that brings the inflation forecasts to the inflation target over the monetary policy horizon.
Table 6
–2,000
–1,500
–1,000
–500
0
500
1,000
1,500
Jan 03 Jul 03 Jan 04 Jul 04 Jan 05 Jul 05 Jan 06 Jul 06 Jan 07 Jul 072.95
3.05
3.15
3.25
3.35
3.45
3.55
Net balance of forward purchases Exchange rate
Monetary policy scheme
Inflation targeting
Financial dollarisation risk control
De-dollarisationpolicies
Risk assessment andpolicy responses
to shocks
+

BIS Papers No 44 375
12.0
14.0
16.0
18.0
20.0
22.0
24.0
26.0
1997 1998 1999 2000 2001 2002 2003 2004 2005 2006 2007 0
5,000
10,000
15,000
20,000
25,000
30,000NIR/GDPNIR
Over the first five years of implementation of inflation targeting, the average annual inflation rate has been 2.0%, with a standard deviation of 1.3 percentage points, which shows that inflation has been within the target range (between 1.5 and 3.5%) in this period. Moreover, inflation has been within the target range in 73% of the last 50 months under the inflation targeting regime (November 2002–December 2006, excluding the initial convergence from a 0% inflation rate towards the target range during January–October 2002).
The second pillar of the monetary policy framework consists of measures to control the risks associated with financial dollarisation. The main risks of a dollarised economy are related to the liquidity and solvency of the financial system:6
• Liquidity risks are associated with maturity mismatches, considering the short-term liabilities and long-term assets that characterise commercial banks’ balance sheets. Even though this is common to any banking system, in an economy with financial dollarisation the maturity mismatch generated in foreign currency introduces higher liquidity risks considering that the central bank does not issue that currency.
• Solvency risks occur because economic agents’ income is denominated in domestic currency, while debts are dollar-denominated. This generates a currency-related credit risk because a sharp depreciation of the domestic currency reduces the repayment capacity of agents.
To deal with these risks, the BCRP limits balance sheet effects by pre-emptive accumulation of reserves and by moderating the volatility of the exchange rate. To avoid moral hazard it also requires that commercial banks hold large liquid reserves against their foreign currency liabilities. In addition, it promotes voluntary financial de-dollarisation and encourages economic agents to internalise financial dollarisation risks.
In line with this framework, international reserves increased from USD 9,598 million in 2002 to USD 27,689 million in 2007 (Graph 8).
Graph 8
NIR/GDP
Source: Central Reserve Bank of Peru.
6 See Gulde et al (2004).
Mill US$

376 BIS Papers No 44
Indicators of international liquidity In general, foreign exchange accumulation must be consistent with prudent levels of international reserves. One of the most used indicators is the Guidotti-Greenspan indicator, which takes into account a sudden stop of capital inflows into the economy, so foreign reserves should at least cover the short-term liabilities. Currently, international reserves represent 3.5 times Peru’s short-term external liabilities.
Table 7
International liquidity indicators
1997 1998 1999 2000 2001 2002 2003 2004 2005 2006 2007
NIR/short-term external liabilities 1.29 1.15 1.25 1.50 1.46 2.11 2.14 1.97 2.77 3.55 3.46
NIR/short-term external liabilities + foreign currency broad money 0.60 0.54 0.53 0.56 0.60 0.74 0.78 0.83 0.95 1.08 1.31
Source: Central Reserve Bank of Peru.
However, this indicator does not take into account the risks facing a dollarised economy, as foreign currency deposits show a higher volatility than domestic currency deposits during turmoil periods. A modified Guidotti-Greenspan indicator can be built by adding domestic deposits in foreign currency and the short-term liabilities. The new indicator shows that net international reserves have been roughly in line during the last three years.
Assessing the effectiveness of foreign exchange intervention Sterilised intervention affects the exchange rate through the portfolio channel and the signalling channel. As domestic and foreign assets are imperfect substitutes, sterilised interventions will alter the relative supply of domestic assets, and therefore the composition of investors’ portfolios. This will generate an increase in the return of domestic assets, which will lead to a depreciation of the exchange rate. The second channel, which works through the signalling process, operates if foreign exchange intervention signals the future direction of monetary policy. For the signalling channel to be strong, central bank intervention must be consistent with changes in the stance of monetary policy.
In order to analyse the effect of foreign exchange intervention on the exchange rate, we performed a volatility analysis, through generalised autoregressive conditional hetero-skedasticity (GARCH) models with daily data for the period between 2004 and 2007, when the Central Reserve Bank of Peru actively intervened in the foreign exchange market. This model considers the effect of intervention on both exchange rate returns and volatility. Previous work on exchange rate volatility has been done by Dominguez (1998) to analyse the effect of interventions by the Deutsche Bundesbank and the Bank of Japan on the volatility of the mark and the yen respectively.
In the mean level estimation, we consider the variation between the exchange rate at the opening of the exchange rate market and the closing level of the previous day, as an indicator of appreciatory or depreciatory pressures in the market. In addition, we include an asymmetric effect of the conditional exchange rate volatility, measured by a variability coefficient that has been constructed using conditional variability.

BIS Papers No 44 377
In the variance estimation, we consider a GARCH (1,1) specification. The Exponential-GARCH (E-GARCH) model was also tested, but there was no evidence of an asymmetric effect in the variance equation for the period under analysis.
In both equations, we include the interest rate differential to account for arbitrage opportunities that will generate pressures on the exchange rate, and the investor’s risk perception of the domestic economy, measured through the EMBI index. In order to test for the effectiveness of intervention, the estimation contains a variable that takes three values (–1, 0 or 1) if the central bank sells dollars, does not intervene on the market or purchases dollars, respectively.
By examining the results for the exchange rate mean level equation, it can be observed that there is no significant effect of a decision to intervene in the foreign exchange market in terms of either appreciation or depreciation of the currency, suggesting that intervention does not change the path of the exchange rate. However, intervention decisions do have a significant impact in terms of reducing extreme exchange rate volatility. This result supports a credible commitment by the central bank to reducing excessive volatility through foreign exchange interventions.
Table 8
Dependent variable: VNER_CLOSE
Method: ML - ARCH (Marquardt) – Normal distribution
Coefficient Std error z-statistic Prob
C 7.36E-05 6.56E-05 1.120978 0.2623
VNER_OPEN 0.440730 0.040133 10.98177 0.0000
INT –1.07E-05 6.23E-05 –0.170853 0.8643
VEMBI(–1) 0.002466 0.000459 5.371341 0.0000
VNER_CLOSE(–1) –0.188469 0.033618 –5.606130 0.0000
APREC*CV –0.023741 0.001598 –14.85839 0.0000
DEPREC*CV 0.018136 0.001961 9.247301 0.0000
Variance equation
C 8.50E-07 4.92E-08 17.27792 0.0000
RESID(–1)^2 0.149999 0.046262 3.242358 0.0012
GARCH(–1) 0.599987 0.023065 26.01239 0.0000
INT –6.74E-07 4.88E-08 –13.82739 0.0000
VEMBI(–1) 5.49E-06 1.81E-08 303.9510 0.0000
R-squared 0.647856 Mean dependent var –0.000146
Adjusted R-squared 0.643636 SD dependent var 0.001911
F-statistic 153.5350 Durbin-Watson stat 2.223919
Prob(F-statistic) 0.000000
Bollerslev-Wooldridge robust standard errors and covariance.

378 BIS Papers No 44
Challenges for monetary control and sterilisation Two factors have contributed to the monetary and macroeconomic management of reserves:
• Fiscal policy. In a context of strong growth of private consumption and private investment, the improvement observed in the fiscal stance has helped to offset potential demand pressures on inflation. The increase in tax revenues, due to higher export prices and the dynamism of economic activity and complemented by prudent public spending management, has allowed an increase in the public sector surplus to 3.1% of GDP in 2007 (Graph 9).
Graph 9
Overall balance of the public sector As a percentage of GDP
Source: Ministry of Finance and Central Reserve Bank of Peru.
Moreover, the accumulation of resources has given the authorities scope to respond effectively, without affecting credibility, in the case of a reversal of capital inflows to smooth the cost in economic activity.
The improvement in the fiscal stance has also helped to reduce exchange rate appreciation pressures linked to current account surpluses and capital inflows. On the one hand, disciplined fiscal expenditure reduces demand in non-tradable sectors, curbing real exchange rate appreciation. On the other, the resources coming from an increase in the surplus of the government’s overall balance are being deposited at the central bank, reducing the need to sterilise foreign exchange market intervention.
The government has also made efforts to improve its external position by prepaying and replacing external debt with domestic debt, helping to recycle foreign inflows.
Public debt as a percentage of GDP has been reduced from 46.7% in 2002 to 29.2% in 2007. This is mostly explained by the reduction in the public external debt from 36.5% of GDP in 2002 to 18.4% in 2007 (Graph 10).
0.1
–1
–3.2 –3.3 –2.5 –2.3
–1.7–1
–0.3
2.1
3.1
–4.0
–3.0
–2.0
–1.0 0.0
1.0
2.0
3.0
4.0
1997 1998 1999 2000 2001 2002 2003 2004 2005 2006 2007

BIS Papers No 44 379
Graph 10
Public debt As a percentage of GDP
64.0
53.048.0
45.0
31.834.4
37.8 36.0 35.2 36.5 37.135.1
28.023.6
18.4
47.1 45.5 45.9 46.7 47.144.3
37.732.7
29.2
37.334.1
46.649.7
56.0
67.9
0.0
10.0
20.0
30.0
40.0
50.0
60.0
70.0
80.0
1993
1994
1995
1996
1997
1998
1999
2000
2001
2002
2003
2004
2005
2006
2007
Internal
External
First wave Financial and political crises
Macroeconomic stability
Source: Ministry of Finance and Central Reserve Bank of Peru.
• De-dollarisation. The de-dollarisation process has contributed to the central bank’s monetary policy management. The resulting increase in the demand for domestic currency has reduced the necessity for sterilisation. During the last five years, the financial dollarisation ratio has been reduced from 65% in 2002 to 46% in 2007. In terms of GDP, the private sector broad money in domestic currency has maintained an increasing tendency while foreign currency broad money has been decreasing relative to GDP (Graph 11).
Graph 11
Broad money As a percentage of GDP
Source: Central Reserve Bank of Peru.
0.0
5.0
10.0
15.0
20.0
1993 1995 1997 1999 2001 2003 2005 2007
Domestic currencyForeign currency

380 BIS Papers No 44
Table 9
Dollarisation ratios
Year Broad money of the banking system
Credit of the banking system to the private sector
Credit of the financial system to the private sector
1993 69 76 77
1994 64 74 74
1995 63 71 72
1996 67 74 72
1997 65 77 75
1998 69 80 79
1999 70 82 82
2000 70 82 81
2001 67 80 78
2002 65 79 76
2003 62 77 73
2004 55 74 71
2005 55 70 67
2006 51 63 60
2007 46 60 57
Source: Central Reserve Bank of Peru.
The injections of liquidity related to foreign exchange purchases by the central bank
are sterilised through the issuance of central bank CDs (CDBCRPs). However, intervention, even when sterilised, can generate some challenges in terms of monetary management.7 In particular the central bank needs to monitor the functioning of the transmission channels, control of the operating targets and sterilisation costs.
• Operating target. The central bank formally adopted the inflation targeting framework in 2002, and uses the interbank interest rate as an operating target. Since then, interest rate volatility has fallen dramatically, to one third of the volatility of the three previous years (Graph 12). This lower volatility will be transmitted to the other interest rates in the economy, reducing uncertainty of the returns in domestic assets, and thus reinforcing the de-dollarisation process.
Thus sterilisation operations have allowed the interbank rate to become permanently aligned to the policy reference rate (Graph 13).
7 See Mohanty and Turner (2006) and Alberola and Serena (2007).

BIS Papers No 44 381
Graph 12
Interbank interest rate In per cent
Source: Central Reserve Bank of Peru.
Graph 13
Foreign exchange interventions, reference and interbank interest rates
Source: Central Reserve Bank of Peru.
• Interest rate transmission channel. Massive sterilisation through market instruments may cause upward pressures on the interest rate, as economic agents ask for a higher return for central bank CDs. In this case the yield curve will lose its connection with the monetary policy stance reflected in the reference rate, weakening the transmission channels.
The evolution of the short- and medium term interest rates reveals that this risk has not materialised in Peru. The average rate of the CDBCRPs has followed the reference rate during sterilisation episodes, so upward pressures do not seem significant (Graph 14).
0.0
5.0
10.0
15.0
20.0
25.0
30.0
35.0
40.0
45.0
Jan
97
Jun
97
Nov
97
Apr
98
Feb
99
Jul 9
9
Oct
00
Mar
01
Aug
01
Jan
02
Jun
02
Nov
02
Apr
03
Sep
03 04 04 04 05 05 06 06 07 07 07
Lower and stable rates
Feb
Jul
Dec
Oct
Mar
Aug Jan
Jun
Sep
98
Dec
99
May
00
May
Nov
–500
0
500
1,000
1,500
2,000
2,500
Sep 03 Mar 04 Sep 04 Mar 05 Sep 05 Mar 06 Sep 06 Mar 07 Sep 07 1.0 1.5 2.0 2.5 3.0 3.5 4.0 4.5 5.0 5.5 Foreign exchange intervention
Reference interest rateInterbank interest rate
US$ Mill %

382 BIS Papers No 44
Graph 14
CDBCRP balances and average interest rate, 2003–07
Source: Central Reserve Bank of Peru.
• Crowding out. The issuance of central bank CDs to sterilise liquidity injections due to foreign exchange interventions could reduce the resources for securities issued by the private sector. However, central bank issuance of CDBCRPs has not been an obstacle to the development of the domestic capital market. Private bond issuance, even though still small, has been continuously increasing during the last few years. Thus, the stock of bonds of the private sector has grown around 20% during the last two years (2004–06), and 41% in domestic currency.
• Rollover risk. In order to reduce refinancing risk, average maturity has been increasing. Up to 2001 there were no maturities higher than one year; now maturities go up to three years (central government bonds have maturities up to 30 years); thus, maturity has increased from 138 to 224 days between 2001 and 2007 (Graph 15). Furthermore, there has been a diversification of maturities to encourage the development of a short-run yield curve (Graph 16).
Graph 15
Average maturity of CDBCRP securities
Source: Central Reserve Bank of Peru.
138
162
260
282
224
180
224
0
50
100
150
200
250
300
Dec 01 Dec 02 Dec 03 Dec 04 Dec 05 Dec 06 Dec 07
0
2,000
4,000
6,000
8,000
10,000
12,000
14,000
16,000
18,000
Jan 03 Jun 03 Jan 04 Jul 04 Jan 05 Jul 05 Jan 06 Jul 06 Jan 07 Jul 07
0.0
1.0
2.0
3.0
4.0
5.0
6.0
CDBCRP stock CDBCRP interest rate Interbank reference rate

BIS Papers No 44 383
Graph 16
Source: Central Reserve Bank of Peru.
• Sterilisation costs. If there is a positive differential between the interest rates associated with the liabilities and assets of its balance sheet, the central bank will incur quasi-fiscal costs. However, during the recent inflows episode, there have been no significant differences between international rates and the returns on CDBCRPs; thus, the financial position of the central bank has not been at stake (Graph 17).
Graph 17
CDBCRP interest rate, three-month Libor and central bank profits
Source: Central Reserve Bank of Peru.
In general, foreign exchange intervention and international reserve accumulation have been consistent with the inflation targeting scheme, considering that the inflation target has been achieved, foreign exchange interventions have been sterilised to keep the interbank interest rate at its reference level, and there is no commitment to maintain a specific level or range of
–1.0
0.0
1.0
2.0
3.0
4.0
5.0
6.0
Jan03
Apr03
Jul03
Oct03
Jan04
Apr04
Jul04
Oct04
Jan05
Apr05
Jul05
Oct05
Jan06
Apr06
Jul06
Oct06
Jan07
Apr07
Jul07
Oct07
(%)
–30
20
70
120
170
Mill S/.
Central bank profits CDBCRP interest rate Three-month LIBOR
31%
25%9%
16%
9%
2% 7%
p <= 3 m 3 m. < p <= 6 m. 6 m. < p <= 9 m.9 m. < p <= 1 y. 1 y. < p <= 1,5 y. 1,5 y. < p <= 2 y.2 y. < p <= 3 y.
30%
20%10%
40%
p <= 3 m 3 m. < p <= 6 m. 6 m. < p <= 9 m. 9 m. < p <= 1 y.
2001 (PEN 1,840 million) 2007 (PEN 21,458 million)

384 BIS Papers No 44
the exchange rate (Graph 18). However, it is important to continuously assess the risks related to foreign exchange intervention and specifically the impact on inflation expectations, interest rates and financial costs.
Graph 18
Inflation
Source: National Institute of Statistics.
The role of reserve requirements The Central Reserve Bank of Peru communicates its monetary policy stance using its “Nuevos Soles” policy rate, targeting the interbank overnight interest rate through open market operations. However, as previously mentioned, the second pillar of this monetary policy framework comprises policies implemented in order to reduce the vulnerabilities related to large speculative capital inflows or shortages linked to international financial crises by controlling the liquidity and solvency risks associated with financial dollarisation. These measures complement and preserve the sound management of the inflation target-oriented monetary policy.
To deal with these risks, the BCRP limits balance sheet effects by pre-emptive accumulation of international reserves and by moderating the volatility of the exchange rate. However, high levels of international reserves could induce moral hazard behaviour among economic agents given that they may assign higher probabilities to the central bank’s use of reserves to provide liquidity during critical situations, and the financial system may fail to internalise dollarisation risks.
Consequently, in Peru, from the beginning of the 1990s8 the use of higher reserve requirements as a tool for managing foreign currency monetary aggregates, compared to the reserve requirement ratio for domestic currency at the minimum level, allowed the central bank to sterilise large capital inflows and to control the availability of lending funds of the financial system, helping to preserve appropriate levels of loans to the private sector in a way compatible with macroeconomic stability and sustainable economic growth. Additionally, the raising of bank liabilities in foreign currency required increasing holdings of liquid assets at appropriate levels to confront sudden reversals of capital inflows.
Reserve requirements on foreign currency deposits, and the interest rate paid on these reserves, are also used as instruments to prevent the expansion of monetary aggregates
8 As summarised in Quispe (2000).
11.8
6.5 6.0
3.7 3.7
–0.11.5
2.53.5
1.5 1.1
3.9
1996 1997 1998 1999 2000 2001 2002 2003 2004 2005 2006 2007
Average 2002–06: 2.0%

BIS Papers No 44 385
denominated in foreign currency. The foreign currency reserve ratio is important because Peru is subject to large capital inflows. Although approximately 75% of these capital flows are estimated to be long-term, the scale of inflows is still large enough to threaten monetary stability.
The foreign currency reserve ratio can also act as a buffer against a sudden reversal of these inflows and can encourage the public to hold domestic currency. However, the ratio is not changed systematically for monetary policy purposes and remains a supplementary device. In 1993, the marginal reserve requirement for foreign currency deposits was 45%; it was reduced to 35% and 20% in October and December 1998, respectively; and increased to 30% in November 2004. Additionally, since April 2004 the reserve requirements in foreign currency have been extended to the credit lines received by domestic banks from overseas financial institutions. At the beginning of 2008, due to significant short-term capital inflows, the central bank strengthened its position by increasing reserve requirements. As of May 2008, the minimum reserve requirement ratio was 8.5% for both domestic and foreign currency bank liabilities, and the marginal reserve requirement ratio was 25% for domestic currencies and 45% for foreign currencies. Furthermore, the BCRP established a 120% marginal reserve requirement for non-resident deposit holdings in the domestic financial system.
Required reserves are remunerated at an interest rate related to Libor and are computed on the basis of monthly averages. These reserves comprise banks’ vault cash holdings and demand deposits at the central bank. The combined effects of the marginal and the minimum legal requirements implied, by the end of 1993, effective reserve requirement ratios of 43% and 12.1% for foreign and domestic deposits, respectively; this had decreased to 30.1% and 6.4% respectively by December 2007 (Graph 19).
Graph 19
Commercial banks: effective reserve requirement ratio in domestic and foreign currencies
In percentage points
Source: Central Reserve Bank of Peru.

386 BIS Papers No 44
Peru and the current global financial crisis Since August 2007, triggered by the subprime crisis in the United States, the global financial system has been facing a financial turmoil. The turmoil deepened from mid-September 2008 due to the generalised liquidity squeeze and stoppage of credit lines, pushing the industrial economies into recession, and implying greater uncertainty regarding commodity prices, interest rates and exchange rates. This crisis is also affecting the developing economies, with downward growth pressures on China, India, the Middle East and Southeast Asia, and the transition economies. Although Latin America has actually shown a dynamic economic activity, the continent’s economies have begun to face tight financial conditions. Peru has maintained its dynamic pace with high growth rates (9.3% forecast for 2008), and the inflation rate, although one of the lowest in Latin America (6.7% projected for 2008), has been addressed by the central bank, with gradual adjustments of its monetary policy stance – six 25 basis point increases of the policy rate from 5.0% in December 2007 to 6.5% in September 2008, aiming for a gradual return to the inflation target level of 2% in 2010, according to the central bank’s Inflation Report of September 2008.
However, in October and November 2008 the Central Reserve Bank of Peru paused its adjustment process, reorienting its efforts to ensure liquidity in the domestic financial system and to reduce the extreme volatility of the exchange rate in order to offset possible negative balance sheet effects in a partially dollarised economy. Strong macroeconomic fundamentals and the preventive accumulation of international reserves allowed the central bank a high capacity of response to face situations of international turbulence. In the actual context of tight international liquidity, Peru observed a reversal of foreign investors’ positions in domestic currency, and the central bank intervened in the exchange market, selling dollars in order to prevent any perverse effects. Furthermore, the central bank expanded its range of monetary operations in order to provide financial entities with greater flexibility to manage their liquidity in new soles and dollars. In addition, since October 2008 the reserve requirement rates in soles and dollars have been reduced, and credit lines from abroad have been exempted from reserve requirements.
Conclusions
Recent capital inflows to Peru are mainly explained by an increase in foreign direct investment and long-term debt. This behaviour has been strongly related to structural reforms and better macroeconomic management, which accounts for stable inflows of long-term capital, even during periods of financial crises. In this sense, our estimations show the high importance of macroeconomic stability as a determinant of long-term capital inflows, through indicators of fiscal and monetary discipline and financial stability.
Even though sterilised intervention may generate several risks to monetary control, foreign exchange intervention and international reserve accumulation have been consistent with the inflation targeting scheme.
The Central Reserve Bank of Peru has successfully met its inflation goals in this environment of capital inflows. The yearly inflation average was 2.0% from the implementation of the inflation targeting scheme in 2002 until 2006, and during 2007 it was among the lowest rates in the region.

BIS Papers No 44 387
References
Alberola, E and J M Serena (2007): “Global financial integration, monetary policy and reserve accumulation. Assessing the limits in emerging economies”, Banco de España Working Papers, No 0706, Bank of Spain.
Castillo Bardález, P and D Barco Rondán (2008): “Facing up a sudden stop of capital flows: policy lessons from the 90’s Peruvian experience”, Central Reserve Bank of Peru Working Papers, No 2008–002, January.
Dominguez, K (1998): “Central bank intervention and exchange rate volatility”, Journal of International Money and Finance, vol 17, issue 1, pp 161–90.
Gulde, A-M, D Hoelscher, A Ize, D Marston and G De Nicolo (2004): “Financial stability in dollarized economies”, IMF Occasional Paper No 230, Washington, DC, June.
Mohanty, M and P Turner (2006): “Foreign exchange reserve accumulation in emerging markets: what are the domestic implications?”, BIS Quarterly Review, September.
Montiel, P and C Reinhart (1999): “Do capital controls and macroeconomic policies influence the volume and composition of capital flows? Evidence from the 1990s”, Journal of International Money and Finance, vol 18, issue 4, pp 619–35.
Ocampo, J A and C Tovar (2003): “Colombia’s experience with reserve requirements on capital inflows”, CEPAL Review No 81, December, pp 7–31.
Ötker-Robe, I, Z Polański, B Topf and D Vávra (2007): “Coping with capital inflows: experiences of selected European countries”, IMF Working Paper No WP/07/190.
Quispe, Z (2000): “Monetary policy in a dollarised economy: the case of Peru”, in L Mahadeva and G Sterne (eds), Monetary Policy Frameworks in a Global Context, Routledge and Bank of England, September, pp 330–53.


BIS Papers No 44 389
Capital flows and financial assets in the Philippines: determinants, consequences
and challenges for the central bank
Celia M Gonzalez1
I. Introduction
Asian emerging market economies have recently been major beneficiaries of capital flows from the developed countries. The literature suggests that the major factors that encouraged this flow of capital to emerging market economies are the sustained decline in interest rates in the industrial world, and the depth of financial development in emerging markets (Reinhart (2005) and IMF (2007a)). However, the prolonged surge in capital flows to the region has renewed concerns among policymakers on issues related to global liquidity, financial stability and capital reversals. History has provided empirical evidence that massive capital inflows in the 1980s may have contributed to the stock market bubbles in Latin America, which led to an excessive expansion in domestic credit and undermined the stability of the financial system (Calvo et al (1994)). As such, policy responses to the surge in capital have included sterilisation measures and reforms to the regulatory and supervisory frameworks, which are generally aimed at addressing the mounting pressures on the exchange rate and growing liquidity in the financial system.
The interaction between capital flows and macroeconomic factors has been discussed in previous literature and addressed issues pertaining to the determinants, policy challenges and management of capital flows. This paper presents the trends of capital flows and financial assets in the Philippines for the period 2000–07, and outlines the policy responses of the central bank to the surge in foreign exchange inflows from both capital and current account transactions.
II. Trends and composition of capital flows
The Philippines generally posted net inflows in its capital and financial account during the period 2000–07, with exceptions in 2004 and 2006, in tandem with robust growth and positive prospects for the economy (Graph 1). After relatively stable flows for three years (2001–03), the pattern of net capital flows started to show an almost symmetrical upswing and downswing behaviour reflecting volatilities in the trend. Such behaviour can be traced primarily to the large net outflows posted under the portfolio investment account in 2004 (USD 1.7 billion) and the other investment account in 2006 (USD 5.8 billion). In 2007, the net capital and financial account registered a net inflow of USD 3.9 billion, an exceptional increase compared to only USD 20 million in 2006.
1 Managing Director, International Department, Bangko Sentral ng Pilipinas (BSP). This paper was prepared for
the Bank for International Settlements’ Emerging Market Deputy Governors Meeting held on 31 January– 1 February 2008 in Basel, Switzerland. The author acknowledges the research contribution of Mr Dennis Lapid and Ms Ma Teresa S Dueñas. The views expressed in this paper are solely the author’s and do not necessarily reflect those of the BSP. The usual disclaimer applies.

390 BIS Papers No 44
Graph 1
Capital and financial account in the Philippines
r = revised; p = preliminary.
Source: BSP.
Net investment by non-residents in the Philippines, as reflected in the balance of payments (BOP), reached USD 10.3 billion in 2007, twice the year-ago level (Table 1). This was traced to the continued strength in portfolio investments concentrated in debt securities issued by the national government, a jump in other inward investments in the form of public sector programme loans, and increased currency and deposit placements by non-residents. In terms of other investments, non-residents’ investments in the form of currency and deposits showed mixed movements, while bank loans posted net outflows in 2003, 2004 and 2006 and net inflows in 2005 and 2007. Net direct investments dropped markedly in 2001, partly due to the political situation, but started to pick up significantly in 2004. Several factors influenced the progressive rise in investor confidence, including strengthening macroeconomic fundamentals, political stability and reports of strong corporate earnings.
Residents’ net investments abroad started to turn positive in 2002 and increased significantly in 2004. For the most part, this was accounted for by the surge in portfolio investments (debt securities) and other investments, which include bank loans2 and currency and deposits. Moreover, investments in financial derivatives generally traced an uptrend starting in 2003, indicating growing appetite for more complex financial products, as well as expansion and greater integration with international capital markets. Residents’ net investments abroad continued to grow in 2005–07, reaching USD 6.4 billion as of end-2007.
2 Mainly by offshore banking units (which are considered residents for statistical purposes), particularly from
2005 onwards.
–2000
–1000
0
1,000
2,000
3,000
4,000
5,000
6,000
2000 2001 2002 2003 2004 2005 2006/r 2007/p
In m
illio
ns o
f US
dolla
rs
–400
–300
–200
–100
0
100
200
300
400
500
In p
erce
nt
Net flow (lhs) Growth rate (rhs)

BIS Papers No 44 391
Table 1
Capital and financial account In millions of US dollars
2000 2001 2002 2003 2004 2005 2006/r 2007/p
Capital and financial, net 3,363 911 1,056 726 –1,630 2,229 20 3,928
Capital account 138 62 27 54 17 40 138 24
Financial account 3,225 849 1,029 672 –1,647 2,189 –118 3,904
Direct investment 2,115 335 1,477 188 109 1,665 2,818 –514
Portfolio investment –553 1,027 746 562 –1,713 3,475 3,043 3,088
Financial derivatives 44 –15 –21 –64 –27 –43 –138 –288
Others 1,619 –498 –1,173 –14 –16 –2,908 –5,841 1,618
Non-residents’ investment in the Philippines, net 1,709 8 1,943 1,078 689 7,275 5,086 10,284
Capital account 168 86 50 82 46 58 181 108
Financial account 1,541 –78 1,893 996 643 7,217 4,905 10,176
Direct investment 2,240 195 1,542 491 688 1,854 2,921 2,928
Portfolio investment 259 1,084 1,374 1,380 –803 3,621 4,610 3,569
Financial derivatives –122 –98 –106 –118 –85 –141 –297 –458
Others –836 –1,259 –917 –757 843 1,883 –2,329 4,137
Residents’ investment abroad, net –1,654 –903 887 352 2,319 5,046 5,066 6,356
Capital account 30 24 23 28 29 18 43 84
Financial account –1,684 –927 864 324 2,290 5,028 5,023 6,272
Direct investment 125 –140 65 303 579 189 103 3,442
Portfolio investment 812 57 628 818 910 146 1,567 481
Financial derivatives –166 –83 –85 –54 –58 –98 –159 –170
Others –2,455 –761 256 –743 859 4,791 3,512 2,519
r = revised; p = preliminary.
Source: BSP.
However, it is worth noting that exports of goods and services and remittances from overseas Filipino workers have been the main sources of foreign exchange inflows. Further, these have, on average, been relatively more stable than investment flows, as indicated by their significantly lower coefficients of variation compared to investments (Table 2). This suggests that current account receipts are less susceptible to shocks. However, they have also contributed to recent currency appreciation pressures (2005–07).

392 BIS Papers No 44
Table 2
Relative magnitude and volatility of selected foreign exchange inflows 2000–06
Sources of foreign exchange inflows As a percentage of GDP
Coefficient of variation 1
Overseas Filipino remittances2 9.7 11.9
Exports of goods and services 48.0 6.3
Foreign direct investments 1.5 63.9
Foreign portfolio investments 1.7 97.0 1 (Standard deviation/mean) *100%. 2 Channelled through the banking system.
Source: BSP
III. Trends in financial assets
Prices of financial assets in the Philippines exhibited an uptrend during the period 2000–07, as shown in the appreciation of the peso relative to the US dollar (2005–07), the rise in the composite stock index (2004–07) and the fall in domestic interest rates (which correspondingly increased the price of peso-denominated bonds issued onshore).
Foreign exchange market In terms of effective exchange rates, the Philippine peso posted a depreciating trend relative to the US dollar from 2000 to 2004 but began to appreciate from 2005 (Graph 2). For the period 2000–04, the peso, on average and in real terms, depreciated against its major trading partners’ currencies by an annual average of 5.6%, while from 2005 to 2007, it appreciated by an annual average of 9.9%. In terms of nominal exchange rate, the peso strengthened from PHP 55.09/USD 1 in 2005 to PHP 46.15/USD 1 in 2007. This situation developed as the US dollar generally weakened against the peso and other regional currencies amid fears of a US recession following the subprime mortgage crisis and the weakness in employment conditions. In addition, the sustained increase in earnings remittances of overseas Filipino workers and enhanced investor confidence due to improving macroeconomic fundamentals also contributed to the appreciation of the peso.

BIS Papers No 44 393
Graph 2
Average effective exchange rate indices of the peso December 1980 = 100%
Calculated against major trading partners (United States, Japan, European Monetary Union, United Kingdom).
Source: BSP.
Stock market The stock market experienced a boom in 1999 but this was not sustained the following year as the country underwent political and economic challenges (Graph 3). The market recovered gradually and in 2004 grew by 34.5% (measured by the percentage change of the composite stock index). The market sustained its bullish momentum thereafter, and posted record highs in the first six months of 2007. In early July, the stock market index reached 3,802.32 index points, a level close to the 1997 marker (3,313.11 index points). Trading was buoyed by strong economic fundamentals, easing US interest rates and net foreign investment inflows. However, the market closed lower in end-July at 3,501.2 index points, dragged down by concerns over the sell-off in US stocks and global equity markets due to the US subprime concerns, among other things.
Rising investor risk aversion due to the US subprime mortgage problem dominated developments in the equities market in the second semester of 2007. Market sentiment was also dragged down by the spike in crude oil prices, but the market’s drop was softened by the US Federal Reserve’s successive moves to cut policy rates, followed by the BSP’s own policy rate cuts. As a result, the composite index averaged 3,616.85 index points in 2007.
50
55
60
65
70
75
80
85
90
95
2000 2001 2002 2003 2004 2005 2006 2007 10
11
12
13
14
15
16
17
Real (lhs) Nominal (rhs)
In p
erce
nt

394 BIS Papers No 44
Graph 3
Performance of the Philippine stock market
Source of basic data: Philippine Stock Exchange (PSE)
Bond market Government issuances have continued to dominate the domestic bond market. As of end-September 2007, outstanding government securities (GS) amounted to PHP 2.25 trillion, 60.3% of which were regular issuances (eg T-bills and fixed rate treasury bonds, the latter accounting for 54% of total regular issuances). Prices of bonds, represented by T-bill rates, generally depicted a downtrend for the period 2000–07 (Graph 4). In 2000, the interest rate for 91-day T-bills averaged 9.9%, but this went down to an average of 3.4% in 2007, due to the sharp slowdown in inflation (to an average of 2.8%) as well as the significant progress in fiscal consolidation. The average 91-day T-bill rate for the sample period (2000–07) was 6.7%. The same downtrend was demonstrated by the longer tenors.
In the early 1990s, the Philippine debt securities market began to move from being a market dominated by short-term money market instruments to longer-term bond issues. Reforms complementing the liberalisation of the financial market in the 1980s were implemented by the government, leading to the emergence of the government bond market as a major venue for mobilising long-term funds. The major reforms include:
1. Making certain government securities eligible as reserves against deposits and trust products;
2. Broadening the investor base through the granting of more licences for primary dealers (mostly banks that represent the dominant players in the financial system) and introduction of small-denominated securities that appeal to retail investors;
3. Introducing government securities with longer maturities in 1991–96;3
3 In 1991, the government introduced three-year floating rate treasury notes (FRTNs). These were replaced in
1994 by fixed rate treasury notes (FXTNs) in the light of the volatile movement in interest rates, which adversely affected interest payments and hence the predictability of the fiscal position of the government. Medium- to long-term fixed rate treasury bonds (FXTBs) began to be issued in 1994 for two-year instruments, in 1995 for five-year tenors, in 1996 for seven- and 10-year instruments, in 1997 for 20-year issues and in 2000 for 25-year maturities.
0.0 500.0
1,000.0 1,500.0 2,000.0 2,500.0 3,000.0 3,500.0 4,000.0
2000 2001 2002 2003 2004 2005 2006 2007
PSE
Inde
x
–40.0 –30.0 –20.0 –10.0 0.0 10.0 20.0 30.0 40.0 50.0
In p
erce
nt PSE Index Growth

BIS Papers No 44 395
4. Improving the infrastructure of the government securities market with the automation of the auction process and the establishment of the Registry of Scriptless Securities (RoSS); and
5. Introducing a government bond exchange programme to improve liquidity and lengthen the maturity structure of outstanding government securities.
Graph 4
Treasury bill rates
Source: Bureau of the Treasury
IV. Policy options for managing capital flows
In addressing surges in capital flows, central banks first need to examine the sustainability, reversibility and volatility of such flows. Typically, policymakers want to minimise large swings in capital flows and prevent undue volatility in domestic financial markets. At the same time, it is well recognised that capital inflows help relax the financing constraint of the domestic economy. Thus, rather than discourage inflows altogether, authorities generally undertake measures to attract direct investments and other long-term capital flows.
The typical immediate response to surges in inflows is to offset them through reserve accumulation, which can be implemented quickly and can provide some breathing space to policymakers, allowing them to assess whether inflows are transitory or permanent. This is often accompanied by sterilisation moves to prevent excessive liquidity expansion. Sterilisation can take a range of forms, eg sale of bonds, increases in reserve requirements on bank deposits and various types of central bank borrowing from commercial banks.
However, if inflows persist, authorities must reduce reliance on sterilisation to avoid potentially large costs, equivalent to the difference between the interest earned on foreign exchange reserves and the cost of absorbing additional liquidity. Indeed, aggressive sterilisation through open market operations can raise domestic interest rates and depress
0.0
2.0
4.0
6.0
8.0
10.0
12.0
14.0
2000 2001 2002 2003 2004 2005 2006 2007
In p
erce
nt
91-day 182-day 364-day

396 BIS Papers No 44
aggregate demand. By fuelling high domestic interest rates, sterilisation may deprive the economy of the benefits of inflows in the form of higher domestic investment and growth (Schadler (1994)). When sterilisation proves to be infeasible, greater exchange rate flexibility can mitigate inflows by encouraging market participants to take cognisance of exchange rate risks in cross-border financial transactions. It also promotes and encourages the use of exchange risk management instruments.
Authorities may also consider increasing the demand for foreign exchange, which can be done by voluntarily accelerating prepayment of external debt and relaxing rules on capital outflows during periods of surplus. At the same time, the supply of foreign exchange can be reduced by encouraging the national government and market players to shift from foreign borrowing to domestic fund-raising activities (eg equity/bond issuances), helping develop the domestic capital market in the process.
Some countries (such as Chile in the 1990s and Thailand more recently) have opted to impose capital controls as a means of reducing the size of inflows, relieving exchange rate pressures, regaining monetary policy autonomy and encouraging more long-term types of inflows. However, the heterogeneity across countries in the capital control measures employed, the conditions under which they are introduced, and the degree of enforcement together imply that the apparent effectiveness of controls in one country may not necessarily translate into equal success in another setting. As such, the divergent experience and empirical evidence on the effectiveness of measures to restrict capital flows suggest grounds for caution. The most that can be said for controls on capital inflows is that they are able to expand monetary policy autonomy and change the composition of flows toward longer maturities, but are unable to reduce the volume of net flows (Magud and Reinhart (2006)). It is also uncertain whether controls can in fact relieve pressures on the exchange rate over an extended period of time. Even in country cases in which a narrow range of objectives were met, controls had only temporary effects as market participants eventually found ways to circumvent them.
For countries that choose to remain open and financially integrated, the best insurance against volatility and sudden stops in capital movements remains sound macroeconomic policy, characterised by low inflation, fiscal balance and prudent credit creation. Fiscal consolidation, in particular, can help moderate aggregate demand pressures in order to avoid any need for tight monetary policy and higher domestic interest rates.
V. BSP policy responses
The BSP has undertaken a variety of measures to temper appreciation pressures on the peso and maintain overall stability in the foreign exchange market. Among others, these include the build-up in international reserves (accompanied by measures to manage the resulting expansion in liquidity), prepayment of the BSP’s debt, implementation of a series of reforms to further liberalise the existing foreign exchange regulatory framework, adoption of a risk-based approach to banking supervision, support for initiatives to develop the domestic capital market, and provision of various forms of assistance to sectors adversely affected by the peso appreciation.
Foreign exchange market and liquidity management The BSP employs several types of discretionary open market operations to smooth short-term fluctuations in exchange rate movements as a result of changes in liquidity movements. Under an inflation targeting regime, the participation of the BSP in the foreign exchange market is aimed at dampening excessive volatility of the exchange rate, which may attract speculative demand and exacerbate further volatilities. Combined with other measures such

BIS Papers No 44 397
as adjustments in monetary policy stance and/or imposition of prudential regulations, these policy actions are taken to counter threats to inflation and inflation expectations which could deter the achievement of the inflation target.
With regard to liquidity management, the BSP has implemented new measures (effective 10 May 2007) to help prevent potential inflationary pressures that could build up over the medium term, mainly as a result of rapid money supply growth, including from sustained foreign exchange inflows. These liquidity management measures include: (a) encouraging the Government Service Insurance System, the Social Security System and other government-owned and controlled corporations to deposit funds with the BSP; (b) allowing trust entities under BSP supervision to deposit funds with the BSP; and (c) allowing special deposit account (SDA) placements of banks to be considered as alternative compliance with the liquidity floor requirements for government deposits. The SDA, a non-collateralised instrument priced at a premium over the reverse repurchase facility, has been used since November 1998 as an additional monetary policy tool in the absence of government securities that can be used for open market operations.
Foreign exchange regulatory reforms The Philippine foreign exchange regulatory regime is characterised by an open current account, few restrictions on capital inflows and some controls on capital outflows. The liberalisation measures introduced in the early 1990s were directed at enhancing the supply of foreign exchange by reducing transaction and financing costs, broadening financing options and promoting opportunities for portfolio diversification. However, there remained a few restrictions on capital inflows and some controls on capital outflows. Hence, the BSP adopted a comprehensive yet measured approach for the roadmap toward further liberalisation of foreign exchange transactions.
On 22 February 2007, the Monetary Board (MB) approved the first phase of reforms to the foreign exchange regulatory framework to make the regulatory environment more responsive to the needs of an expanding, more dynamic economy that has become increasingly integrated with global markets. Improving macroeconomic fundamentals, as well as ongoing banking, capital market and institutional reforms, provided a favourable setting for the comprehensive review and gradual reform of the existing foreign exchange regulatory framework. The reforms, which became effective on 2 April 2007, involved changes in rules governing external current account and capital account transactions as well as prudential regulations.
First, with respect to current account transactions, the limit on allowable foreign exchange purchases by residents from banks to cover payments to foreign beneficiaries for non-trade current account purposes without supporting documents was increased from USD 5,000 to USD 10,000. Furthermore, the “no splitting” restriction and notarisation requirement for applications to purchase foreign exchange beyond a specified amount were also lifted. These measures are expected to accommodate the rising demand by residents for foreign exchange to service non-trade current transactions such as education of dependents abroad, medical care and payment of service fees, and to reduce transaction costs for bank clients, including retail customers.
Second, with regard to capital account transactions, the limit on allowable outward investments by residents without prior BSP approval and registration was increased from USD 6 million to USD 12 million per investor per year. Also, residents’ investments in foreign currency denominated bonds issued by the national government and other Philippine entities are now eligible to be funded with foreign exchange purchased from banks. The increase in the allowable limit on outward investments is expected to allow greater portfolio and risk diversification and facilitate integration with global markets.

398 BIS Papers No 44
Third, in the area of prudential regulations, a symmetrical limit of 20% of unimpaired capital with an absolute limit of USD 50 million was imposed on both the overbought (OB) and oversold (OS) positions of banks. The increase in the OB limit from 2.5% of unimpaired capital to 20% gives banks more flexibility to increase their foreign exchange holdings. This enhances banks’ capability to service the increasing foreign exchange requirements of the corporate sector and contributes to further reducing exchange rate volatility. Restoring the OS limit at 20% of unimpaired capital, on the other hand, serves as a prudential measure to discourage excessive exposure of banks to foreign exchange risks. The adjustments in both the OB and OS limits complement the BSP’s thrust towards risk-based supervision and are aligned with banks’ improved capacity to manage foreign exchange exposures relative to their capitalisation levels.
On 20 December 2007, the MB approved the second phase of reforms4 to the foreign exchange regulatory framework. The second phase focused largely on two objectives: first, to promote greater integration with international capital markets and risk diversification; and second, to streamline the documentation and reporting requirements on the sale of foreign exchange by banks. Clarifications on certain existing regulations were also made.
Among other things, the policy reforms included further increases in (a) allowed foreign exchange purchases from banks by residents for non-trade current account transactions (without the need for supporting documentation) to USD 30,000; and (b) the limit on outward investments without the need for prior BSP approval to USD 30 million per investor per year or per fund in the case of qualified investors (QIs).5 QIs may also apply for a higher limit with the BSP. With the liberalisation of foreign exchange rules, banks are expected to continue to adopt safe and sound practices in undertaking their foreign exchange transactions. The BSP remains vigilant and stands ready to act to ensure that foreign exchange transactions are consistent with the stability of the financial system.
Structural reforms: bond market development Complementing the reforms in the regulatory framework, the BSP supports initiatives related to the development of the domestic and regional bond markets. The lack of innovative and diversified financial products in the market leaves investors and intermediaries with very limited investment choices and narrow investment opportunities. Hence, the availability of a wider array of financial products would stir market activity by creating greater market depth, breadth and liquidity. It will also enable the market to better satisfy investors’ diversified appetite for risk. The country’s improving fiscal situation and economic fundamentals make its issuances an increasingly attractive investment option.
Domestic initiatives With a view to mobilising domestic savings, introducing new financial instruments and revitalising the secondary market to help stimulate the domestic capital market, the BSP has:
1. Enhanced corporate governance in the banking system to improve investor confidence and increase availability of reliable information on which investment decisions are based;
4 These reforms took effect on 21 January 2008. 5 For the purposes of this regulation, QIs shall be limited to the following: insurance and pre-need companies;
collective/pooled funds, whether in a corporate or contractual structure, such as mutual funds, unit investment trust funds and variable insurance; public or private pension or retirement or provident funds and such other entities and funds as the BSP may determine as qualified investors on the basis of such factors as financial sophistication, size and regularity of financial transactions, net worth and size of assets being managed.

BIS Papers No 44 399
2. Aligned local accounting standards with International Accounting Standards;
3. Launched the Philippine Payment System (PhilPASS), a real-time payment infrastructure system which is aligned with the systems operating in other countries. PhilPASS contributes to minimising systemic risk as real-time high-value payments between banks are made using their deposit accounts with the BSP;
4. Established the fixed income exchange (Philippine Dealing and Exchange System) that allows integrated and straight through processing of securities transactions from trading to custody;
5. Improved financial transparency by enhancing the existing benchmark for securities trading and enforcing more stringent mark to market regulations. Official calculation was assigned to a self-regulatory organisation (PDEx) to enhance the credibility of the benchmarks;
6. Provided for the recognition/derecognition of domestic credit rating agencies for bank supervisory purposes. The BSP issued these guidelines to meet a growing need for credit rating services by both the financial industry and regulators;
7. Expanded the menu of investment products to include unit investment trust funds (UITFs), long-term negotiable certificates of deposit, retail repurchase agreements, and securities borrowing and lending transactions. The creation of UITFs by authorised trust entities was aimed at aligning the operation of pooled funds under management by trust entities with international best practices and enhancing their credibility with retail investors. The UITF is an improved version of the existing common trust fund (CTF), with assets that will be marked to market daily so that investors will not be misled as to the real performance of their investments;
8. Defined the role of third-party custodians in the delivery of sold securities to avoid multiple sales and undocumented repurchase agreements;
9. Supported the passage of critical legislation to: (a) allow securitisation transactions; and (b) exempt the secondary trading of securities from documentary stamp tax; and
10. Reviewed the regulatory framework for corporate rehabilitation, individual retirement funds and collective investment schemes.
Regional initiatives The Philippines is also actively involved in efforts to promote the development of the capital market and stability of the financial system in the region. Together with the other ASEAN member countries and Japan, China and Korea (collectively called ASEAN+3), the Philippines participates in the Asian Bond Market Initiative (ABMI) which aims to broaden and deepen the ASEAN+3 region’s capital markets and reduce overdependence on the banking system for raising funds. The ABMI focuses on facilitating access to bond markets and enhancing market infrastructure for local and regional bond market development.
The BSP also participates in the Chiang Mai Initiative (CMI), a regional financing arrangement established in May 2000 that aims to provide short-term liquidity support for temporary balance of payment difficulties among ASEAN+3 member countries. The CMI presently involves two components: (a) the ASEAN Swap Arrangement (ASA); and (b) a network of bilateral swap and repurchase facilities among the ASEAN countries, in cooperation with China, Japan and Korea. To further enhance the current CMI setup, ASEAN+3 members are also currently working on multilateralising the CMI. Progress has been made on this front, as member countries have agreed in principle to adopt a self-managed reserve pooling arrangement (SRPA). Discussions are currently being held on the implementation details of the arrangement.

400 BIS Papers No 44
Other measures While an appreciated peso relative to the US dollar yields some benefits, for example (a) helps dampen the inflationary pressures arising from price increases of imported commodities; (b) reduces the peso costs of serving foreign currency obligations; and (c) enables the BSP to further build up the country’s gross international reserves, it also leads to a number of negative consequences, for example: (a) reduction in the price competitiveness of Philippine exports; (b) lowering of the peso equivalent of dollar remittances of overseas Filipino workers; and (c) lowering of the profits for domestic producers of import substitutes and the tourism sector. Thus, a number of measures have been implemented to assist the export sector as well as overseas Filipino workers.
Initiatives to support the export sector In August 2005, the BSP gave a PHP 10.5 million grant to the Export Development Council (EDC) to help raise the performance of the export sector, increase its competitiveness and help increase foreign exchange earnings. A total of PHP 9.5 million or 90.5% of the grant was utilised for export promotion and development projects within the prescribed one-year utilisation period that ended on 2 April 2007.
In 2007, the BSP also contributed PHP 50 million to the PHP 280 million Export Promotion Fund. The Fund was established by the EDC as a public-private sector partnership to provide supplemental financing for the promotion and development of Philippine exports. The target beneficiaries are primarily the micro and small enterprises that have been adversely affected by the recent appreciation of the peso.
Aside from the direct grants to exporters, the BSP has set aside annual budgets for the peso and foreign exchange rediscounting facilities of PHP 20 billion and USD 500 million, respectively. The Peso Rediscount Facility and the Exporters Dollar and Yen Rediscount Facility allow banks to rediscount their existing loans to exporters, thus helping support the working capital needs of local exporters. Under Circular No 515 dated 6 March 2006, the coverage of these facilities was broadened and the availment guidelines further simplified by reducing the eligibility requirements for applicant banks.
The BSP also promotes the use of hedging mechanisms and hedging products offered by banks to reduce foreign exchange risks. One such product is the foreign exchange insurance offered by the Development Bank of the Philippines (DBP), which gives exporters the ability to benefit from peso depreciation or protection from losses during peso appreciation. Under this product, the exporter has the right, but not the obligation, to sell their dollars against the peso to the DBP at a specified price on a specified date. The other hedging mechanism is forward foreign exchange rate protection, a forward foreign exchange contract where only the net difference between the agreed dollar/peso forward rate and the market rate shall be settled at maturity. Unlike the foreign exchange insurance scheme, forward foreign exchange rate protection entails no charges and offers a fixed exchange rate at a specified future date, therefore protecting the exporter at a certain rate if the peso appreciates.
Initiatives to support overseas Filipino workers The BSP recognises the valuable contribution of overseas Filipino workers’ remittances to the economy. As part of its efforts to improve the environment for the remittance flows, and in order to assist the workers in their remittance concerns, the BSP has created an interactive portal that links users to information on the different banks and non-bank remittance companies in the Philippines. This enables the remitters to scan the market for the lowest remittance rates. Further, the BSP encourages overseas Filipino workers to invest in financial products to optimise the use of their remittances for development and future integration of these workers into the Philippine economy. These initiatives include:

BIS Papers No 44 401
1. Issuance of retail treasury bonds to overseas Filipinos. The national government and the BSP have agreed in principle to offer retail treasury bonds starting 2008 as an alternative investment instrument for these workers. Discussions are ongoing on the size and mechanism of the bond issuance; and
2. Access to commercial bank investment products and services for overseas Filipino workers. Commercial banks offer specialised investment products and services such as insurance, pension and real estate loans through tie-up arrangements with pre-need and property firms.
VI. Conclusion
The paper presents the trends in capital flows and prices of financial assets in the Philippines for the period 2000–07. Surges of capital inflows, together with strong remittances from overseas Filipino workers, are associated with the rise in the prices of financial assets over the period, namely: (a) domestic currency; (b) bonds; and (c) stocks, which was due in turn to improving macroeconomic fundamentals, the sustained deployment of Filipino workers overseas, and global liquidity conditions. The BSP recognises that a major challenge related to this development is the need to put in place policies that will help maximise the benefits from the inflows while minimising the associated downside risks. Unfortunately, there is no single measure or approach to achieve this. What is required is a set of consistent policies geared to promoting investor confidence and sound risk management, providing high-quality, timely information and reducing risks associated with higher levels of investments. In this regard, the BSP has adopted a three-pronged approach to managing foreign exchange flows that: (a) promotes productive use of inflows; (b) facilitates private sector outward flows; and (c) sustains strong and stable macroeconomic conditions.
Productive use of inflows involves the prepayment of foreign currency debt and the building-up of the BSP’s international reserves, accompanied by initiatives to mitigate the unfavourable impact of an appreciated currency on exporters and families/beneficiaries of Filipinos working overseas.
In facilitating private sector outward flows, the BSP takes the view that liberalising said outflows can help reduce the burden of sterilising net inflows and facilitate portfolio diversification by the private sector. In this regard, the BSP has already implemented the first and second waves of reform in its foreign exchange regulatory framework. These involve changes in regulations pertaining to external current account and capital account transactions as well as prudential measures. The liberalisation of foreign exchange transactions is also expected to help reduce upward pressures on the peso in the short term and allow freer and more efficient capital flows in the long term.
Sustaining a stable macroeconomic environment entails adherence to sound macroeconomic policy – such as fiscal discipline, low inflation and prudent credit creation – which remains the best insurance against capital reversals. At the same time, financial sector policy should be directed at reducing the vulnerability of the financial system by encouraging adequate risk management systems for supervised institutions.

402 BIS Papers No 44
References
Calvo, G, L Leiderman and C Reinhart (1994): “The Capital Inflows Problem: Concepts and Issues”, Contemporary Economic Policy, vol XII.
Dakila, F and R Claveria (2007): “Identifying the Determinants of Overseas Filipinos’ Remittances: Which Exchange Rate Measure is Most Relevant?”, BSP Working Paper Series, no 2007-02, Center for Monetary and Financial Policy.
Hannoun, H (2007): “Policy responses to the challenges posed by capital inflows in Asia”, speech delivered by the Deputy General Manager of the BIS to the 42nd SEACEN Governors’ Conference in Bangkok, Thailand on 28 July 2007.
International Monetary Fund (2000): World Economic Outlook.
——— (2007a): Global Financial Stability Report.
——— (2007b): World Economic Outlook.
López-Mejía, A (1999): “Large Capital Flows: Causes, Consequences, and Policy Responses”, Finance and Development, vol 36, no 2, September, http://www.imf.org/external/pubs/ft/fandd/1999/09/lopez.htm.
Magud, N and C Reinhart (2006): “Capital Controls: An Evaluation”, NBER Working Papers, no 11973.
Reinhart, C (2005): “Some Perspective on Capital Flows to Emerging Market Economies”, NBER Reporter, Summer, http://www.nber.org/reporter/summer05/reinhart.html.
Schadler, S (1994): “Capital Movements and Surveillance”, in T Baliño and C Cotterelli (eds), Frameworks for Monetary Stability and Policy: Issues and Country Experiences, International Monetary Fund, Washington, pp 357–72.

BIS Papers No 44 403
Capital flows and their implications for monetary and financial stability: the experience of Poland
Jerzy Pruski1 and Piotr Szpunar2
Introduction
The last two decades can be characterised as a period of globalisation which has involved economic liberalisation combined with the opening-up of economies to international trade and financial flows. Economic liberalisation implied the lifting of various controls and restrictions and of entry barriers into specific sectors like banking, as well as the pursuit of market-oriented reforms, with far-reaching privatisation. Many countries competed for international capital, reforming their economies to attract foreign investment (see Abiad and Mody (2005)). As a result in many countries, including Poland, the opening-up of the economy has triggered massive capital flows. The main topics of the present paper are policy implications and the effects of these capital movements.
The present paper consists of three distinct parts. The first is devoted to macroeconomic issues related to the conduct of monetary policy in the liberalised capital account environment of the transforming economy. The main topic of the second part is the development of the financial sector in the environment of free movement of capital, with a special focus on the Polish case. Here we analyse the role of foreign capital and investors in the development of the financial system: institutions, markets and instruments. The main conclusion of this section is that the capital inflow has greatly contributed to the evolution and modernisation of the Polish financial system, enhancing its efficiency and stability. The third part of the paper presents implications of the significant presence of foreign financial institutions in the domestic financial system for financial stability. These include, in particular, potential channels of contagion.
I. Capital flows and monetary policy
I.I Policy responses to growing capital flows Increasing capital flows around the world have influenced domestic policies. Growing global markets have made a significant contribution to improved discipline in the area of monetary and fiscal policies, punishing bad policies and rewarding good ones.
The need for more disciplined monetary policies has fostered a higher degree of independence of central banks and contributed to global disinflation. Not only has the increased independence of central banks improved monetary policy practices (Rogoff (2006)), it has also triggered an evolution in the nature of the monetary transmission mechanism. Monetary policy now affects the economy more through inflation expectations and exchange rates (Bean (2006), Woodford (2005)). Thus, the credibility of policy has become a very valuable asset (Corbo and Schmidt-Hebbel (2001)).
1 First Deputy President, National Bank of Poland (NBP). 2 Director, Financial System Department, NBP.

404 BIS Papers No 44
On the other hand, however, growing capital flows have increased market volatilities and amplified the transmission of shocks, with long-term real interest rates increasingly determined globally. Opaqueness in financial markets limits policymakers’ ability to assess risks properly. Not only bad policies but also simple bad luck can be severely punished by the markets. The well known theoretical trilemma (pick one of two under international capital mobility: monetary independence or a fixed exchange rate) has become the key constraint in determining domestic financial policies and the level of international financial integration (Devereux et al (2006)). The room for manoeuvre for domestic policies has shrunk significantly. Higher capital mobility has decreased monetary independence and confronted central banks with corner choices in implementing monetary policy. In practice it has become clear that in a world with increasing capital mobility it is more difficult to maintain the fixed exchange rate strategy than to conduct independent monetary policy.
Many countries have operated a monetary policy regime based on fixed exchange rates. The smooth changeover to a floating exchange rate regime was (and in some cases still is) complicated in many dimensions, thus inducing so-called “fear of floating”. Some countries attempted to conduct a kind of eclectic monetary policy regime, combining some elements of inflation targeting with rather strict interventions in the foreign exchange markets in order to manage the exchange rate. In both cases increasing capital flows can easily undermine such an approach. The probability of a fixed exchange rate regime lasting eight years has been calculated to be below 0.3 (Spiegel (2007)).
Some countries have tried to limit financial flows using capital controls. These measures, however, have proved insufficient and, in most cases, ineffective, creating ways to circumvent the restrictions and thus distorting the normal functions of financial systems and markets. Even the case of Chile, presented as a success story, is debatable as strict capital controls (well prepared and based on the existing reporting and supervisory infrastructure) changed the structure and duration rather than the scale of flows (see Sławiński and Dusza (1998)).
In a catching-up economy, a fixed exchange rate regime does not protect the currency from real appreciation. Thus, it seems that an appropriate policy response to large (actual or potential) capital flows should be pursuing price stability and anchoring inflation expectations. The transition from a fixed to a floating exchange rate regime can, however, lead to high exchange rate volatility (as markets test the new equilibrium levels and/or test the solidity of the authorities’ commitment). This could bring about a loss of competitiveness and high economic costs, especially in cases where the regime changeover is combined with a disinflation process. The pace of nominal appreciation matters. Some countries have used the above-mentioned eclectic approach to manage the transitory period smoothly (Pruski and Szpunar (2005)). A gradual, orderly regime changeover should reduce the macroeconomic costs of economic agents’ adjustment to higher exchange rate volatility (see Graphs 3 and 4 and Table 1).
In the long run, however, monetary policy with low stable inflation as a target should contribute to exchange rate stabilisation. Two countries with price stability targets should have a relatively muted exchange rate, of course with reservations regarding some market and economic factors like market sentiment, potential tensions, the HBS effect, etc.
I.II Inflation targeting in coping with capital inflows Empirical evidence supports the view that inflation targeting as a corner solution combined with free floating is an appropriate response to capital flows. An inflation targeting regime seems to immunise economies against the consequences of capital flows and accompanying shifts in exchange rates. First, exchange rate movements do not necessarily need to be hampered by foreign exchange interventions. Under inflation targeting a central bank uses its own interest rate, which it controls to a much greater extent than exchange rates (as it has the monopoly on issue of its own domestic currency). Second, even large shifts in exchange

BIS Papers No 44 405
rates become less harmful as economic agents have to be prepared for them (no implicit guarantees) and there are instruments available to cope with exchange rate risk. Thus, the macroeconomic cost of exchange rate volatility declines with time. In many cases, pass-through coefficients also drop as economic agents adjust to the environment of exchange rate volatility (see Annex 1). Finally, after the initial volatility under the regime changeover, exchange rate movements may decrease (Graph 1 shows an example for Poland in the last two years).
Graph 1
Exchange rates vis-à-vis the euro
75
80
85
90
95
100
105
110
115
120
125
Jan
01
May
01
Sep
01
Jan
02
May
02
Sep
02
Jan
03
May
03
Sep
03
Jan
04
May
04
Sep
04
Jan
05
May
05
Sep
05
Jan
06
May
06
Sep
06
Jan
07
May
07
Sep
07
Jan
08
CZK 100 = 31.7 HUF 100 = 250.4 PLN 100 = 4.10 SKK 100 = 41.2Series6 Series7 Series8
Source: NBP data.
Long-term capital flows, especially foreign direct investment (FDI) flows, can also influence the conduct of monetary policy under an inflation targeting framework. High levels of foreign investor participation in the banking sector might modify the functioning of the credit channel in the monetary transmission mechanism, because of the access of domestic banks to sources of funding in foreign parent institutions. On the other hand, access to parent bank funding may stabilise the supply of funds and smooth the fluctuations that might result from the business cycles. This has been observed in some countries. In Poland, however, the scale of intragroup financing of domestic banks has not been large, and thus has not had a serious impact on the conduct of monetary policy. A larger impact was probably seen through the improvement of banking sector efficiency as well as through increased financing of the real sector of the economy, mainly households.
Yet, inflation targeters are few and relatively recent among emerging market economies. On the other hand, however, in many countries the experience with inflation targeting does not span an entire business cycle, so the new regime has not really been tested. In addition, inflation targeting under limited policy credibility may lead to greater volatility and a procyclical policy stance. There is probably still some “fear of floating” – avoiding real exchange rate volatility is considered an important policy objective in small open emerging economies, as the exchange rate may be the most important determinant of domestic inflation. Some other problems hampering the smooth introduction of an inflation targeting

406 BIS Papers No 44
regime may result from: high pass-through, a high share of volatile prices in the CPI basket (eg food), a low level of monetisation or a high level of dollarisation/euroisation. While these obstacles may appear serious, some of them can be easily overestimated. The experience of Poland shows that the most important conditions for inflation targeting encompass: central bank instrument independence, an adequately developed financial system (with an interbank deposit market as the key ingredient), sufficient money market infrastructure (effective interest rate setting, reflecting market conditions), and efficient liquidity management by the central bank (monetary operations). This experience also makes it clear that some other elements (often highlighted in the literature; see Christoffersen et al (1999)) were of minor importance during the initial phase of the changeover to the inflation targeting regime and could be developed gradually thereafter, for example the MTM models or more sophisticated strategy and communication.
Summing up, the experience of Poland with an inflation targeting regime seems to have been largely positive so far. Despite high capital flows and exchange rate fluctuations, strong economic growth accompanied by low inflation and low current account deficits has been achieved. The new strategy has helped reduce inflation and stabilise it at a low level and in this way enhanced the credibility of the monetary authorities (see Graph 2). Inflation targeting has facilitated control over inflation and delivered an instrument to influence credit growth, which is also important for the stability of the financial sector. At the same time, inflation targeting offers more flexibility, including higher resistance to capital flows. It has also helped avoid vulnerability, as there have been no implicit guarantees inducing moral hazard behaviour on the part of economic agents. It has not, however, prevented the advance of currency substitution in domestic credit markets, especially in the housing loan market, which weakens the monetary transmission mechanism and increases households’ exposure to foreign exchange risk. To some extent, currency substitution may have even been bolstered by the gradual strengthening and low volatility of the Polish zloty since 2004.
Graph 2
Consumer price index Annual changes, in per cent
Source: ECB.
0
2
4
6
8
10
12
14
16
1999 2000 2001 2002 2003 2004 2005 2006 2007 Czech Republic Hungary Poland Slovakia

BIS Papers No 44 407
Graph 3
Gross domestic product Annual changes, in per cent
Source: Eurostat.
Graph 4
Current account deficit As a percentage of GDP
Source: Eurostat.
Czech Republic Hungary Poland
–10 –9
–8
–7
–6
–5
–4
–3
–2
–1
0
1997 1998 1999 2000 2001 2002 2003 2004 2005 2006 2007(Q1–Q3)
Slovakia
–2
0
2
4
6
8
10
1997 1998 1999 2000 2001 2002 2003 2004 2005 2006 2007(Q1–Q3)
Czech Republic Hungary Poland Slovakia

408 BIS Papers No 44
Table 1
Macroeconomic developments under the inflation targeting regime in Poland
1998 1999 2000 2001 2002 2003 2004 2005 2006 2007
Annual average change, in per cent
CPI 11.8 7.3 10.1 5.5 1.9 0.8 3.5 2.1 1.0 2.5
GDP 5.0 4.5 4.3 1.2 1.4 3.9 5.3 3.6 6.1 6.21
Domestic demand 6.4 5.2 3.1 –1.3 0.9 2.7 6.0 2.4 6.6 6.31
Real effective exchange rate 4.7 –3.4 9.7 12.5 –3.7 –9.3 0.7 12.6 2.7 5.5
As of December each year, in per cent
NBP interest rate 15.50 16.50 19.00 11.50 6.75 5.25 6.50 4.50 4.00 5.00
As a percentage of GDP
Current account balance –4.0 –7.4 –5.8 –2.8 –2.5 –2.1 –4.3 –1.6 –3.2 –3.72
FDI in Poland 3.7 4.3 5.5 3.0 2.1 2.1 5.1 3.4 5.6 ...
Portfolio investment 1.1 0.4 1.9 0.6 1.6 1.7 4.2 4.9 0.5 ...
Financial derivatives 0.0 0.3 0.2 –0.2 –0.5 –0.4 0.1 0.1 –0.2 ...
Loans to corporations (stock) 4.5 6.1 6.6 7.3 7.6 8.5 6.5 6.3 6.8 ...
Official reserve assets (stock) 16.5 17.0 15.3 13.6 14.1 15.2 11.9 14.1 13.3 ...
Public finance balance, ESA95 –4.3 –2.3 –3.0 –5.1 –5.0 –6.3 –5.7 –4.3 –3.9 –2.51
... = not available. 1 Estimates available as of February 2008. 2 As of third quarter of 2007.
Sources: NBP data; Central Statistical Office.
II. Capital flows and the financial system
Financial development constitutes a potentially important mechanism for long-term growth. Numerous studies show that the opening-up of the domestic economy to foreign competition, as well as the establishment of appropriate economic institutions, seems crucial in this respect (see Rajan and Zingales (2003) and Baltagi et al (2007)). Foreign investors have played a very important role in the development of the Polish financial system, with regard to both financial institutions and financial markets. Their visible presence was the result of the liberalisation of financial and capital flows carried out mainly during the 1990s (see Graph 5).
Financial liberalisation was one of the fundamental market-oriented reforms implemented at the beginning of the transformation in Poland, and included both domestic reforms and policies and the gradual lifting of foreign exchange controls. The former involved reducing

BIS Papers No 44 409
entry barriers to the financial market for new entities with a different ownership structure. The legal framework for the latter included a new act on foreign exchange controls, an act on investment with participation of foreign entities adopted in mid-1991, and further measures implemented later. These measures were connected with Poland’s entry into the OECD and its accession to the European Union. There were many drivers behind this liberalisation process, including:
• assuring access to foreign funding to facilitate the modernisation of the economy and to provide capital in the absence of domestic sources of funds at the beginning of the transition;
• ensuring access to modern technology and management skills, to make the economy competitive and efficient;
• enabling participation in the global economy and international division of labour.
The full adjustment to OECD capital flow rules was made in 2002, when the remaining restrictions on short-term operations were lifted. The high presence of foreign capital has strongly influenced the characteristics of the Polish financial system and its ability to withstand shocks (financial stability).
II.I Financial institutions Foreign investors are now majority owners of most Polish financial institutions. They control 71% of the capital of the Polish banking sector, 77% of the insurance sector, and 40% of the pension funds sector, as well as 26% of investment funds (as at the end of 2006). This key role of foreign capital is the result of the fact that due to historical reasons, the amount of domestic private capital available at the beginning of the transition process was low. The process of increasing the presence of foreign investors has been a gradual one. The developments in the banking sector can serve as a good example of this process, which comprised both FDI and portfolio investment. In the former case, three forms were present: privatisation of existing banks, takeovers of Polish private banks and greenfield investment.
During the 1990s the inflow of FDI to Poland paved the way for an efficient privatisation of Polish banks (NBP (2003)), which play a key role in the Polish financial sector.3 The privatisation methods used have evolved over time and at first only limited participation of the strategic investors was allowed. It took some time for investors to take the dominant position in the equity capital of banks by the acquisition of shares on the Warsaw Stock Exchange, which also included new issues of shares.4 Some private banks changed their ownership structure and gradually became subsidiaries of foreign institutions. Gradually, the government attitude changed, and the privatisation strategy adopted in the late 1990s involved the sale of a majority of shares to a single strategic investor. That was supportive in selecting the best suited and most reputable candidates for investors, as well as in negotiating the price and additional conditions of the privatisation deals. At present, most large Polish banks are subsidiaries of foreign banks with head offices typically in the EU 15 countries.
The access of foreign financial institutions to the Polish market through greenfield investment has also evolved through the years. The early 1990s saw only few banks established as greenfield institutions. Those greenfield banks, which had operated since the early stages of
3 The share of banks’ assets in the assets of the financial sector is still the highest (67% in 2006), although it
has diminished by 26 percentage points in the recent decade, as a consequence of steady and more dynamic growth of non-banking financial institutions (NBP (2003)).
4 With appropriate authorisation from the Commission for Banking Supervision.

410 BIS Papers No 44
the transformation, were very successful and profitable, specialising in corporate banking and trade finance. The Polish market attracted greater interest after a successful restructuring of the banking sector and upon Poland receiving a positive credit rating in the mid-1990s.
After the completion of the privatisation of the banking sector and entry into the European Union, the pattern of capital inflows to the financial sector started to change. Since 1 May 2004 new entrants to the Polish market have been mostly branches.5 Foreign direct investment in banks which are subsidiaries of foreign institutions mostly takes the form of an accrual of retained earnings. In banks with a low deposit base, the inflow of capital takes the form of acceptance by the parent bank of subordinate debentures or issuance of other types of debt securities by the Polish subsidiary. The attractiveness of Poland for foreign investment has stemmed from the development of an appropriate institutional environment, including a legal and regulatory framework. Moreover, the prompt and successful restructuring of state banks has greatly helped in improving Poland’s reputation abroad and in drawing the attention of potential investors. The other important factor was the accession process and entry into the European Union in 2004.
Analysing the tendencies in foreign capital inflows to the Polish banking sector in the last decade according to their type, three distinct periods can be distinguished: 1997–98, 1999–2003 and 2004–06. The first period was characterised by a high share of FDI flows in total inflows, reaching 40–50%, decreasing portfolio inflows and an increasing role of credit and other types of debt. The second period can be characterised by a still high share of FDI, ranging from 47 to 56%, but much lower portfolio investment and a steady share of foreign credit inflow. The third period was characterised by a drop in the FDI share to 32%, with simultaneous strong growth in portfolio investment and a high, but steady share of credit and other types of debt. The changes in the structure of flows were the results of changes in public policy towards foreign investor access to the Polish banking sector, including privatisation, and the situation of the banks themselves (mainly their capital buffer levels and tendencies in their liquidity position).
The banking sector in Poland is the largest segment of its financial system, accounting for 71% of its assets in 2006. But the liberalisation of capital flows has provided the possibility of raising funds directly from international markets, and large amounts of FDI in the real sector of the economy have caused the banking sector’s role in the supply of funds for financing domestic enterprises to be smaller and less dynamic than originally expected. The cross-border financing of companies by their parent institutions has played an especially important role (see Graph 6). Contrary to this, the financing of the household sector is completely dominated by banking institutions.
5 A result of the adoption of the single passport principle.

BIS Papers No 44 411
Graph 5
Gross private sector capital inflows In millions of zlotys
0
20,000
40,000
60,000
80,000
100,000
120,000
1997 1998 1999 2000 2001 2002 2003 2004 2005 2006
– Credit and other types of debt
– Portfolio investments (debt securities, money market instruments, equityinvestments)
– Foreign direct investment
Source: NBP (2006).
Graph 6
Sources of funding of the real sector In millions of zlotys
81,386
25,008109,199
35,620
139,043
56,285
178,644
78,760
208,198
105,043
226,809
123,619
238,799
138,155
258,912
156,798
266,780
206,677
294,712
235,236
361,815
284,908
0
100,000
200,000
300,000
400,000
500,000
600,000
700,000
800,000
1996 1997 1998 1999 2000 2001 2002 2003 2004 2005 2006
Cross-border long-termloansDebt securities
FDI
Domestic bank credit
Source: NBP (2006).

412 BIS Papers No 44
II.II Financial markets Foreign investors have also contributed significantly to the development of financial markets in Poland. The emergence of some segments, notably the over-the-counter (OTC) derivatives market, was due to the activity of London-based banks. Foreign players have made substantial contributions to the liquidity of the markets in which they operate. In some Polish financial markets non-residents play a dominant role (for example the foreign exchange spot market and OTC derivatives market).
The development of the OTC market for derivative instruments – for both currencies and interest rates – would not have been possible without foreign banks. Such instruments (non-deliverable forwards, interest rate swaps, forward rate agreements, foreign exchange options) started being traded in the mid-1990s on the London market. Polish banks have successively joined that market. Currently foreign banks are very active participants in the OTC derivatives market (their share in net turnover on the domestic interest rate instruments market exceeds 50%). Part of foreign banks’ investments in Polish treasury bonds is funded on the FX swap market (by rolling over T/N zloty loans). The share of foreign banks in net turnover on the FX swap market exceeds 90%. FX swaps have commonly been used in carry trade transactions. Foreign banks are very active on the domestic FX spot market; their share in net turnover on the zloty market has reached 70%. The liquidity on that market is primarily created by foreign banks. These banks also have large positions in off-balance sheet interest rate instruments. Large exposures in BPVs6 without flows of funds show that transactions serve speculative or hedging purposes. Some derivative instruments would not be offered by banks active in Poland, if not used to offset the exposures resulting from their sale (hedge back-to-back) to banks abroad (mainly parent banks). In the case of more sophisticated instruments, such as foreign exchange exotic options and interest rate options, banks in Poland only play the role of agents in their sale.
The importance of foreign players can be seen in the example of the futures and options market of the Warsaw Stock Exchange. This has been developing in a different way to previously mentioned market segments, with relatively lower participation of non-residents (their share in futures contract turnover did not exceed 4% in 1999–2004, while in 2006 the share of non-residents in futures contracts was 9% and in options 3%). The market is still of minor importance in Poland and its liquidity is not comparable to that of the OTC market.
Foreign capital has also contributed to the development of the equity market. In the mid-1990s, at the early stage of stock market functioning in Poland, the market was characterised by low capitalisation, a limited number of listed companies and high investment risk. Foreign investors were an important source of capital for listed Polish companies (their share in capitalisation was nearly 30%). With the development of the stock market in Poland (growth in capitalisation, new companies listed, privatisation) foreign participation in shares of domestic companies on the Polish market grew and by the end of the 1990s reached 50%. A record high level (60% of capitalisation) was achieved in 2004. Since then foreign players’ share in the market has been falling, due to both strong demand on the side of domestic investors and some withdrawal of foreign capital from the Warsaw Stock Exchange (strong profit-taking after 2005), as well as a number of IPOs of Polish private companies. One should add that around two thirds of foreign investors on the Warsaw Stock Exchange are direct investors (taking into account the share in the value of investment).
The activity of foreign institutions has been especially important for the build-up of liquidity in the financial markets. The liquidity ratios of the stock and bond markets have been steadily
6 The BPV (basis point value) is a fundamental measure used in interest rate instrument portfolio management
which corresponds to the change in the value of an instrument (portfolio) caused by a shift of 1 basis point in the yield to maturity.

BIS Papers No 44 413
improving. The share of foreign investors in stock market turnover in 1996–2006 was over 30%; in 2005 it exceeded 40%. Foreign investors are very active in the most liquid segments of the Polish financial market, and provide a substantial contribution to their liquidity. These segments comprise stocks which belong to the WIG20 index basket (90% of the stock portfolio of non-residents is placed in WIG20 companies) and the benchmark bond market (non-residents accounted for over 36% of turnover in the treasury bond market in 2006). These findings are confirmed by such measures as the turnover/capitalisation ratio (in the case of stocks) the bid-ask spread, and the Hui-Heubel ratio. After pension funds, foreign investors are the second largest group of investors on the Polish bond market, with a 22% share at the end of June 2007. The drop in non-residents’ activity in the third quarter of 2005 had a serious impact on bond market liquidity, evidenced by an increase in the vulnerability of bond yields to changes in benchmark bonds’ turnover, as measured by the Hui-Heubel ratio.
III. Strong presence of foreign capital and financial stability
The inflow of foreign capital has facilitated the development of Poland’s financial institutions and markets. Its potential adverse macroeconomic effects have been moderated by an adequate choice of monetary policy framework and its rigorous execution. This has led to generally positive results in the area of financial stability, although some potentially negative results of the process can also be identified. In an open financial system, certain channels of international contagion may arise due to exposure to international financial markets.
The flow of foreign investment to Poland seems comparable to the pattern observed in countries undergoing similar changes and transforming into market economies. In most countries in transition the creation of a stable banking sector has implied the active participation of foreign investors. Those countries that have attempted to develop the banking sector relying to a great extent on domestic capital have eventually ended up facing banking crises or at least major difficulties (as examples one may quote, among EU member countries, Bulgaria, the Czech Republic, Romania, Slovakia). This has confirmed the results of international studies, which show that the presence of foreign investors in the financial sector improves its resilience to external shocks and assures the stability of credit supply and overall financial stability (see Clarke et al (2003)). There are also opinions that in deep crises, the presence of foreign capital protects the domestic market from capital outflows (see Peek and Rosengren (2000)).
The participation of foreign strategic investors in Poland, as in most transition countries, has facilitated the development and modernisation of the financial sector, primarily by the transfer of know-how. As a result of the presence of foreign investors, one could observe an increase in market competition resulting in an increase in the efficiency of financial institutions. Foreign investment has led to a wider variety of financial products becoming available to non-financial sectors. This has encouraged the process of diversification of assets of households and corporations, diminishing their vulnerability to possible shocks. The same process can be observed on the liability side of their balance sheets.
Risk management at foreign-owned institutions The transfer of know-how has been especially valuable in the area of risk management. The transfer of developed in-house risk management systems has brought major improvement in this area. This has resulted in a tightening of credit policies and practices and a more determined attitude towards non-performing loan (NPL) resolution (see BIS (2004)) reflected in the steep increases in NPLs just after the takeover of domestic banks. In the long run this process has also caused a structural change in the allocation of capital in the economy, based only on business considerations. The credit policies followed by the new banks

414 BIS Papers No 44
differed greatly from domestic banks’ policies before their privatisation. State-owned banks granted credit mostly to their traditional customers from the public sector (related party lending), while private and privatised banks, especially those with foreign owners, usually follow different patterns. They tend to provide funding to companies from more technologically advanced sectors, to be more competitive and efficient, to rely on more formal credit assessment standards and to apply risk-adjusted pricing. This change was anticipated by reformers when transforming the banking sector, as they decided to leave capital allocation in the economy to the independent, private banks.
The result of a change in risk management was also visible in the price of credit. Contrary to common views, recent studies conducted at the NBP have shown that the presence of foreign banks has a positive impact on the cost of credit to clients (Degryse et al (2007)). The lowest credit rates were offered by banks controlled by foreign entities, which started their operations as greenfield institutions. The second lowest came from banks privatised with the participation of foreign strategic investors, due to their better assessment of credit risk. Acquiring strong strategic owners has also resulted in a lowering of the cost of credit to banks themselves, as this fact positively influenced domestic banks’ ratings.
The organisation of risk management systems in numerous banking groups may also constitute a challenge to financial stability. Some banking groups tend to centralise risk management functions, meaning that decisions concerning risk exposure and management methods are made at the parent banks’ head offices. Such a division of power among the dominant and subordinate entities may lead to a lack of more sophisticated risk management skills among domestic managers.
Another problem emerges in banking groups where a matrix management system is utilised. The balance sheet structure of a domestic bank can be optimal from the group perspective, but if acting as a standalone entity, the domestic bank’s structure can be far from this state.
Among the advantages of the way in which foreign strategic investors run Polish banks, one could name the insulation from direct negative effects of large international exposures, but this has a negative side as well. Concentration mainly on domestic activities limits the diversification of assets of banks, increasing their vulnerability in the case of shocks to the Polish economy.
Strategic ownership and intragroup division of power The Polish experience shows that strategic foreign owners (mainly parent banks) have contributed to the stability of domestic banks through other channels as well. Having a strategic investor brings the asset of reputation to a bank. While at the beginning of the 21st century the overall level of NPLs in the Polish banking system had reached 21% of the total loan portfolio and, in the case of some banks, an increase in NPLs resulted in financial losses, strategic owners constituted a serious source of capital.
It has to be remembered that Poland has yet to experience a crisis situation involving a foreign-owned bank. The experiences of other countries in this field vary. The case of Rijecka Banka, the third largest bank in Croatia, shows that the support of a majority investor cannot be treated as a given. An NBP survey on this issue (NBP (2007)) reveals that some banks can count on liquidity support from foreign owners (in the form of credit lines). According to estimates based on NBP survey data, these banks hold nearly 25% of deposits of non-financial entities. Banks holding 40% of deposits of non-financial entities have been provided with a promise of liquidity support in a less binding form (eg a promise contained in the financial reports of a capital group or submitted to the Commission for Banking Supervision). However, meeting contractual obligations may depend on the liquidity of the owners (parent banks), especially in periods of stress, when refinancing on the interbank monetary market is difficult or costly, for example as in early August 2007. Recent developments in the global markets, which led to the liquidity crisis in the European market in

BIS Papers No 44 415
particular (see Section II.I) and in the United States, had no impact on the liquidity of the Polish banking sector.
Polish banks, as subsidiaries of global or large European banking groups, do not invest directly in the global markets. Thus, Polish banks were not directly influenced by the recent turmoil in global markets caused by the US subprime crisis. The owners had also decided that they should mainly specialise in providing services to domestic clients, and this has so far insulated the Polish banking system from the outcome of the crisis.
New channels of contagion In spite of the current state of insulation from the subprime fallout, several channels of possible contagion may be identified. These include the credit, funding, capital and confidence channels, which are elaborated on hereafter.
Contagion through the credit channel arises due to domestic banks’ credit exposures to foreign entities, especially foreign financial institutions. Although these exposures are generally low and diversified, there is a risk of a sudden increase in intragroup exposure if a parent company experiences liquidity or solvency problems. The parent company may attempt to gather funding from subsidiaries at a low price which would not compensate for credit risk. In the short run, this could result in turmoil in domestic financial markets as the affected subsidiary would be forced to raise cash and convert it into foreign currency. Due to the opacity of financial markets, such a fire sale could even incite a crisis of confidence within the financial sector. The risk profile of the affected institution would also be put under pressure. In the longer run, if default on the intragroup loan became likely, the solvency of the affected institution could be compromised. For Poland, the likelihood of credit channel contagion can be assessed as low due to, inter alia, the systemic importance in their domestic markets of foreign banking groups which operate in Poland and – as demonstrated in summer 2007 – EU banking groups’ preference for using ECB liquidity operations instead of intragroup support. Still, if credit channel contagion did materialise, its impact could be very severe, as in extreme situations the subsidiary might need to provide credit to an insolvent parent company.
The funding channel is linked to foreign funding of domestic financial institutions. Short-term foreign funding could be very volatile in times of crisis, especially if it is not provided by the group. If foreign funding sources form a substantial part of a bank’s liabilities, the bank might be unable to replace them and forced to sell assets at distressed prices. This would induce market turmoil as well as halt loan supply. As short-term foreign funding does not constitute a very significant component of Polish banks’ liabilities, a shortage in such funding would not threaten overall financial stability. Some small Polish institutions, however, rely on intragroup funding. In several EU countries, foreign banks acting as strategic owners play an important role as the source of financing for the credit expansion of domestic banks. The case of the Baltic countries shows that in extreme cases, such reliance could lead to very large macro imbalances in the domestic economy, as well as the build-up of a potential asset bubble, and render domestic institutions vulnerable to liquidity conditions in the international markets.
Foreign-owned financial institutions are also reliant on parent companies’ ability to provide them with capital if they intend to expand. Problems at the parent company, however, may prompt a large dividend payout, in line with the short-term interest of the investor. This would hamper the growth potential of the subsidiary and could lead to suboptimal allocation of credit as some investment opportunities would not be pursued due to overly restrictive financial constraints. If, on the other hand, the subsidiary needs recapitalisation after a substantial loss, and the parent company is unwilling to commit capital, a threat to financial stability could materialise. Due to disproportionalities in the development of financial markets in Poland and in the investors’ countries of origin, banks may be systemically important to the host country (thus requiring a great deal of attention and scrupulous supervision), while at the same time being insignificant from the point of view of operations of a financial group as

416 BIS Papers No 44
a whole or investors in the country of origin (which may be an incentive to minimise supervision costs). This will also cast doubt on the ability and will to act in a crisis situation.
Given that several subsidiaries of foreign banking groups operate under the group’s brand, reports on group losses may be associated by the public with the current standing of the local subsidiary. This in turn could trigger a decline in confidence in the subsidiary, up to a sudden withdrawal of deposits. Similar effects may appear in the interbank markets, especially when exact linkages between the parent and subsidiary are uncertain.
Capital flows, liquidity of financial markets and availability of credit Foreign investors are positively influencing the stability of the Polish financial system by contributing to the development of financial markets. Contributions have included creating a market for risk hedging instruments, increasing the liquidity of the markets and diversifying the investor base. The diversification and expansion of the investor base has contributed to stability by eliminating the negative consequences of investment limits of some large domestic institutional investors. This brings the benefits of diversified objectives and preferences. The existence of this effect is confirmed by the correlation between the monthly transaction balance of foreign investors and the monthly balance of investment transactions of Polish pension funds, which were strongly negative in 2006 (–0.624). The activities of investors from different countries are also determined by events on their local markets. This contributes to market liquidity, making transactions easier to perform, allowing specific strategies to be pursued (see Grossman (1977)), and facilitating hedging activities.
Financial stability is also enhanced by the activity of foreign capital in the non-financial sector of the economy. A large part of the foreign indebtedness of Polish enterprises (40%) consists of intragroup exposures. This means that besides the relatively strong growth of foreign debt of this sector of economy (in the last 10 years it has increased from 2.3% to 6.5% of GDP), financing conditions seem very stable.
Competition in the banking market and financial stability The majority of foreign owners of Polish banks are large complex European banks. We are currently observing the process of the creation of a single pan-European financial market. One of the symptoms of this process is increasing concentration in the EU banking system. The side effects of the concentration in home markets are bank mergers in host countries, resulting in the creation of large, systemically important institutions. This has further implications for the financial stability of the host country financial system, namely the effect on competition in the domestic banking sector and the incentives for home and host supervisory institutions to act promptly in normal times, as well as in crisis situations.
We have mentioned the very positive general effects of large foreign capital activity on the development of Polish financial markets and, through this, on the stability of the Polish financial system. The consequences of strong capital inflows and strong foreign presence in the financial system and the economy as a whole cannot, however, be assessed unambiguously. There are several potentially negative side effects of this situation for both financial development and stability. The widespread foreign ownership of financial institutions, especially systemically important banks, creates new channels of contagion from parent banks and the markets in which they operate to domestic banks. In the event of distress at a parent institution the reputation asset becomes reputation risk. It is also worth mentioning that the way in which foreign investors operate (intragroup financing, centralisation of risk management) has contributed to the underdevelopment of some financial market segments in Poland, namely the corporate bond market, credit derivatives, etc.

BIS Papers No 44 417
IV. Summary
Increasing capital flows, facilitated by financial and capital account liberalisation in numerous countries, have created a new macroeconomic environment across the globe. The last two decades can be characterised as a period of globalisation, which has involved economic liberalisation combined with an opening-up of economies to international trade and financial flows. Economic liberalisation implied the lifting of various controls and restrictions and of entry barriers into specific sectors like banking, as well as the pursuit of market-oriented reforms, with far-reaching privatisation. Many countries opened up their economies in order to compete for international capital and reformed their economies to attract foreign investment (see Abiad and Mody (2005)). This in turn induced massive flows of capital and fluctuations in exchange rates. In the central and eastern European (CEE) countries, including Poland, these processes accompanied the transition from central planning to market economy.
Focusing on the case of Poland, we have analysed the consequences of increasing capital flows for both the conduct of monetary policy and financial market stability and development. We have learned that inflation targeting constitutes the appropriate strategy to cope with increasing capital flows and the associated negative consequences for exchange rate stability. The experience of Poland shows that under an inflation targeting regime, strong economic growth accompanied by low inflation and low current account deficits have been achieved despite high capital flows and exchange rate fluctuations (see Table 1). Inflation targeting has facilitated control of inflation and delivered instruments to influence domestic demand and credit growth, which is also important for the stability of the financial sector. At the same time inflation targeting allows the economy to respond more flexibly to higher resistance to capital flows. It also helps avoid vulnerability, as there are no implicit guarantees inducing moral hazard behaviour among economic agents (see Table A1).
On the other hand, the opening-up of the capital account has enabled Poland to attract large FDI flows, including those flowing into the financial system. These inflows have greatly contributed to the evolution and modernisation of the Polish financial system, as well as its efficiency and stability, in a number of ways (see Graph 5).
First, the presence of investors has considerably accelerated the development of financial markets and instruments (for example the issuance of short-term market debt instruments and the development of hedging instruments). Second, as active traders they have been providing liquidity to various markets. Third, foreign-owned banks have supported the development of the banking sector. They have been a source of technology diffusion, including risk management techniques – for example through staff turnover or demonstration effect, and also via the market transactions performed with other banks. Some foreign-owned banks have been leaders in bringing advanced customer products to the market and in implementing high standards of customer service. This has also stimulated competition in various market segments which have been expanding from corporate to retail customers and intensifying, exerting pressure on the cost of credit and lending conditions. Foreign investors have undoubtedly had a positive influence on the stability of the Polish banking sector. Their involvement in the restructuring of the sector in the form of capital injections has enabled many banks to survive and prevented the failure of many major banks.
The examples of several countries suggest that the presence of foreign strategic investors does not guarantee unconditionally the safety of domestic banks and therefore the stability of the domestic financial system. New channels of contagion could emerge in line with increasing intragroup linkages. The experience of Poland to date has shown that all the positive effects of opening to foreign capital and the high presence of foreign investors have materialised while the negative aspects have so far remained absent. This does not mean, however, that one should not closely follow the risks involved.

418 BIS Papers No 44
Annex 1
Table A1
Central bank assessments of exchange rate pass-through (PT)
Recent
estimate of PT
coefficient1
Has PT coefficient declined recently?
Main reason for PT decline
Relative size of PT to
different price indices
Other
Hong Kong SAR
No evidence that PT declined
India 8–17% Yes, since the 1990s Decline in inflation; lower
tariffs
Malaysia No; PT relatively stable in 1990–2006
Philippines 1.2% Yes, from 23% before 1993
PT is generally very low
Singapore 3% CPIPT < Imp.PricePT
Complete PT after two years
Thailand Small Increased slightly ER flexibility CPIPT << Prod.Pr.PT <<
Imp.Pr.PT
PT to import prices full and rapid;
PT to CPI not full even in the long run
Colombia 3% in 2006
Yes, from 4–5% in mid-1980s
Peru 10% in 2006
Yes, from 10–20% in 2001–04
Venezuela Yes, during 2005–06 FX reserves↑;oil prices↑; lower
ER volatility
Czech Republic
0–40% Yes Inflation targeting,
ER flexibility
CPIPT << Imp.PricePT
Hungary Yes Widening of ER band, inflation
targeting
Poland 12% in 2006
Yes, from 24% in 2002
Inflation targeting, ER float
Asymmetric response of PT (ER↓ > ER↑)
Israel 23% in 1999–2004
Yes, from 33% in 1991–98
Decline in inflation, ER stabilisation
Half of PT via rental contracts fixed to the
US dollar
Turkey 42% since 2001
Yes, from 63% before the float
Full PT takes one year(versus four–five months before)
South Africa 7.8% Not clear that PT has declined
Asymmetric, threshold effects apply
1 Percentage increase in the CPI following a 10% depreciation of the exchange rate (individual national definitions may differ slightly).
Source: Mihaljek and Klau (2008).

BIS Papers No 44 419
Annex 2
Table A2
Banking sector assets, credits and deposits in CEE countries and selected EU and euro area countries in 2004–06
As a percentage of GDP
Assets/GDP Credits/GDP Deposits/GDP
2004 2005 2006 2004 2005 2006 2004 2005 2006
Czech Republic 93.5 98.7 97.9 32.5 37.5 43.3 57.0 58.5 60.2
Hungary 72.0 79.8 88.4 35.1 39.3 43.4 32.9 34.1 35.5
Poland 58.2 59.7 64.4 24.7 26.3 30.6 32.8 33.5 35.5
2005
Austria 264.5 156.4 100.6
Estonia 107.0 59.3 48.5
Germany 299.5 91.7 61.2
Italy 163.8 61.7 42.9
Lithuania 63.0 36.5 35.3
Portugal 243.7 137.4 93.3
Euro area countries 283.3 123.5 102.0
Sources: ECB (2006); national central banks; Eurostat.

420 BIS Papers No 44
References
Abiad, A and A Mody (2005): “Financial reform: what shakes it? What shapes it?”, American Economic Review, vol 95, no 1, March.
Baltagi, B H, P O Demetriades, S H Law (2007), Financial Development, Openness and Institutions: Evidence from Panel Data, World Economy and Finance, Economic and Social Research Council, Working Paper no 0022, May.
Bank for International Settlements (2004): “Foreign direct investment in the financial sector of emerging market economies”, CGFS Publications, no 22, Basel, March.
Bean, C (2006): “Globalisation and inflation”, speech to the LSE Economics Society, London School of Economics, 24 October.
Christoffersen, P, F Westcott and F Robert (1999): “Is Poland ready for inflation targeting?”, IMF Working Paper no 99/41, March.
Clarke, G, R Cull, M S Martinez Peria and S Sánchez (2003): “Foreign bank entry: experience, implications for developing countries, and agenda for further research”, The World Bank Research Observer, vol 18, no 1, Spring.
Corbo, V and K Schmidt-Hebbel (2001): “Inflation targeting in Latin America”, Central Bank of Chile Working Papers, no 105, September.
Degryse, H, O Havrylchyk, E Jurzyk and S Kozak (2007): The effect of foreign bank entry on cost of credit in transition countries. Which borrowers benefit the most?, mimeo.
Devereux, M, P R Lane and J Xu (2006): “Exchange rates and monetary policy in emerging market economies”, The Economic Journal, vol 116, no 511, April.
European Central Bank (2006): EU Banking Structures, Frankfurt, October.
Grossman, S J (1977): “A characterization of the optimality of equilibrium in incomplete markets”, Journal of Economic Theory, vol 15, pp 1–15.
Mihaljek, D and M Klau (2008): “Exchange rate pass-through in emerging market economies: what has changed and why?”, in BIS Papers, no 35, “Transmission mechanisms for monetary policy in emerging market economies”, pp 103–30, January.
National Bank of Poland (2003): Financial Stability with a Special Focus on Foreign Banks.
——— (2006): International investment position of Poland 2006, NBP.
——— (2007): Financial Stability Review: first half of 2007, p 33.
Peek, J and E S Rosengren (2000): “Implications of the globalization of the banking sector: the Latin American experience”, New England Economic Review, Federal Reserve Bank of Boston, September.
Pruski, J and P Szpunar (2005): “Exchange rate policy and foreign exchange interventions in Poland”, in BIS Papers, no 24, “Foreign exchange market intervention in emerging markets: motives, techniques and implications”, May, pp 255–64.
Rajan, R G and L Zingales (2003): “The great reversals: the politics of financial development in the twentieth century”, Journal of Financial Economics, vol 69, issue 1, pp 5–50.
Rogoff, K (2006): “Impact of globalization on monetary policy”, paper prepared for a symposium sponsored by the Federal Reserve Bank of Kansas City on “The new economic geography: effects and policy implications”, Jackson Hole, Wyoming, 24–26 August.
Sławiński, A and M Dusza (1998): “Kryzysy walutowe w krajach otwierających się na wymianę”, Materiały i Studia, 1998/1, NBP, Warsaw.

BIS Papers No 44 421
Spiegel, M M (2007): “Financial globalization and monetary policy”, presentation at the Bank of Korea 15th annual Central Banking Seminar, 18–21 September.
Woodford, M (2005), “Central-Bank Communication and Policy Effectiveness”, publication draft of paper presented at FRB Kansas City Symposium on “The Greenspan era: lessons for the future,” Jackson Hole, Wyoming, 25–27 August 2005.


BIS Papers No 44 423
Capital flows and financial assets in emerging markets: determinants, consequences
and challenges for central banks
Muhammad Al-Jasser and Ahmed Banafe
General comments
Cross-border capital flows have increased very rapidly this decade due to liberalisation of financial markets and information technology. This expansion has been accompanied by broad-based global growth and has resulted in diversification of investments and, in emerging market economies (EMEs), financial market development and a reduction in the cost of capital. It was inevitable, however, that capital inflows would complicate the conduct of monetary policy. In particular, certain developing Asian economies (eg China and India) have received inflows which have raised the challenge of investing those inflows while managing upward pressure on exchange rates.
Broadly speaking, central banks faced with large capital inflows can choose between three responses in a global environment which is becoming inflationary (due to rises in prices of food and raw materials). The first is to let the currency appreciate. This reduces inflationary pressure but makes domestic industry less competitive and introduces instability into the exchange rate (what goes up may come down). The second is to sterilise the inflows in some way: a recent development has been the establishment of sovereign wealth funds that recycle capital surpluses abroad. The third possible response is to undertake administrative measures such as raising reserve requirements and restraining credit expansion to limit the impact of capital flows, in particular on inflation.
Because global capital flows are intermediated through financial markets, central banks will have to pay even closer attention to the developments in their domestic markets to make sure that they understand where leverage and excessive risk-taking activity is occurring. It was noteworthy that at the start of the recent global credit crunch, the major central banks were challenged by the multiple roles played by commercial banks in the creation, packaging, selling, financing and ownership of credit derivative products. An issue of interest is how central banks can work to anticipate similar events in the EMEs.
Prior to the meeting, the BIS circulated a detailed list of questions for participants, grouped under the six headings shown below. Saudi Arabia’s situation is unusual in that it has historically had an open capital account with substantial build-up of both private and public assets abroad. Inward investment has mainly been in large joint ventures. Domestic asset markets are not characterised by sophisticated use of derivatives and there is little evidence of hedge fund activity. The questions are designed for more diversified economies where private sector capital inflows are dominant. Thus, many of these questions are peripheral to the concerns of the Saudi Arabian Monetary Agency (SAMA).
1. The size and composition of gross capital inflows and their risk characteristics for the receiving EMEs
In Saudi Arabia, gross capital inflows are dominated by oil revenue which flows to the account of the government, and for which SAMA has complete information. Second, there are investment inflows, particularly for joint ventures to develop the economy, normally

424 BIS Papers No 44
financed by syndicated loans which are monitored. Third, there are private investment flows into asset markets. Foreign investors are not allowed to invest directly in the Saudi stock market, but they can invest through mutual funds. The private sector has substantial overseas assets and, when repatriated from time to time, these show up as capital inflows. Foreign direct investment (FDI) is encouraged by the authorities and has picked up significantly since Saudi Arabia’s accession to the World Trade Organization (WTO) at the end of 2005. According to the Saudi Arabian General Investment Authority (SAGIA), the value of gross FDI in Saudi Arabia rose to $18 billion in 2006 from $12 billion in 2005, and the total stock of FDI was about $48 billion in 2006.
2. The size and composition of capital outflows, with particular emphasis on financial asset investment abroad intermediated by financial institutions
As with capital inflows, there are no restrictions on capital outflows. Government organisations are major investors abroad. These include the Public Pension Agency (PPA), the General Organization for Social Insurance (GOSI), the Saudi Fund for Development (SFD) and also SAMA, which manages the foreign exchange reserves. There is no specific sovereign wealth fund or stabilisation fund. Private sector assets abroad are estimated to be sizeable. Historically, domestic banks have arbitraged between US dollar and Saudi riyal rates, placing funds in the interbank markets to take advantage of interest rate differentials and relying on the fixed exchange rate regime. Recently the trend has been to manage assets as investment portfolios rather than liquidity management.
The government has been encouraging financial market development. Under the Capital Markets Authority (CMA), additional investment banks/brokers have been licensed and there is a growing private sector pension and insurance business, a large part of which is likely to go abroad in the form of long-term investments.
3a. Implications for the depth of the financial sector and its resilience
Because gross capital inflows are dominated by the government account and the funds flow into SAMA, capital inflows have not been an important influence in restructuring the local asset markets. The Saudi stock market is one of the most liquid in the region. The government bond market is illiquid due to the paying-down of government debt (debt/GDP is poised to fall from its peak of around 100% to about 19%). The real estate market is dominated by Saudi citizens. Domestic asset prices have not been seriously impacted by the recent global credit crunch.
3b. Consequences of inflows for domestic asset markets and non-financial corporate balance sheets
Foreign investment has become important in the last few years in the specific context of large joint venture development projects financed by syndicated loans (and on occasion by tightly distributed bond issues). Foreign demand has little impact on the level of asset prices and there is no evidence of sizeable hedge fund activity. Derivative markets are still in their infancy.

BIS Papers No 44 425
4. Implications of capital flows for the conduct of monetary policy: exchange rate developments; sterilisation; control over interest rates
Operationally, SAMA’s routine sales of dollars to domestic banks are aimed at meeting the private sector’s commercial and financial demand for foreign currencies. Under normal circumstances, foreign exchange operations have no discernible effect on money market conditions. In the event of excessive foreign exchange outflow or inflows for speculative or event-specific reasons, there tends to be an imbalance in system liquidity, causing interbank riyal interest rates to rise or fall. However, the application of liquidity instruments, such as repos and foreign exchange swaps, has been instrumental in addressing money market disequilibrium to a large extent.
The driver of monetary developments over the last few years has been oil revenue. Economic activity remains vigorous. The rate of nominal growth cooled somewhat in 2007 due to developments in the oil sector (lower oil production). The non-oil economy will continue to provide the main engine of economic growth but depends on the continued flow of oil income to a large extent. In 2007, nominal GDP growth was 7.1%, real GDP growth 3.5%, the current account surplus stood at about $92 billion, and inflation averaged 3.7% for the first 10 months of the year.
Inflows from expanded oil revenue have allowed the government to increase fiscal spending and simultaneously pay down debt. This has stimulated the economy and enhanced the liquidity of the banking system. As the government has pursued a policy of paying down government debt, domestic banks have become forced dissavers of government securities, and have responded by increasing their consumer lending activity. M3 has been growing at around 20% per annum.
There has been some debate about the merits of retaining a base public debt/GDP ratio, which might be around 20%. This could provide a benchmark yield curve for corporate debt and would allow the issuance of longer-dated instruments. But so far the paying-down of debt has meant that in effect there is no sterilisation policy: in practical terms oil revenue dollars flow into SAMA’s account and are reinvested abroad in a prudent diversification of assets. More problematic is the effect on the economy of higher fiscal spending, which has exacerbated the inflationary situation.
In late 2004, SAMA began to tighten the repo and reverse repo rate. In 2005, SAMA supplemented a tighter monetary policy by introducing administrative measures to limit rapid growth in consumer and stock market margin loans. When the stock market corrected precipitously in early 2006, SAMA’s priority was to avoid exacerbating financial market conditions by delaying further withdrawal of policy stimulus. As the stock market showed signs of stabilisation, SAMA increased policy rates in February 2007 as part of its tightening campaign against rising M3 growth and inflation. More recently, SAMA has continued the downward adjustment to its reverse repo rate without altering the benchmark repo rate in view of speculative buying of the riyal and the Federal Reserve’s policy easing in the aftermath of the subprime mortgage lending crisis.
Currently, high levels of liquidity in the economy and continuing expectation of a realignment of the riyal mean that SAMA has limited traction in controlling liquidity by adjustment of repo and reverse repo rates. Inflation is becoming a matter of concern. This is a largely home-grown issue, due to higher rental/real estate prices, wage inflation and higher food prices globally. Restraining the growth in government spending is important to tackling inflation. The government has recently introduced a subsidy on rice and baby milk.

426 BIS Papers No 44
5. Regulatory and supervisory response to financial stability challenges posed by capital inflows
Saudi Arabia has followed a path of open capital flows. The authorities closely monitor commercial banks’ activity to make sure that they follow a prudent pattern of behaviour with regard to their foreign exchange positions.
Conclusion
In conclusion, the global liquidity glut will continue to present challenges for central banks in steering their monetary policy. The interplay between financial stability and monetary policy is a relatively new field of research which is continuously evolving. There is no simple answer to the question of how much emphasis the central bank should place on financial stability considerations in its monetary policy. Domestic social and regulatory conditions can have an important influence on all aspects of macroeconomic policy.
As is the case with most central banks in the developing economies, SAMA is faced with the challenges of abundant domestic liquidity, surging M3 and rising inflation. Given the limited effectiveness of interest rate moves, as part of its monetary management SAMA has recently resorted to raising reserve requirements following the introduction of prudential guidelines on credit expansion in 2005. Fiscal policy remains the key to restraining growth in M3.

BIS Papers No 44 427
Thailand’s experiences with rising capital flows: recent challenges and policy responses
Yunyong Thaicharoen and Nasha Ananchotikul1
1. Introduction
Over the past decade, the Thai economy has continued its financial integration with the global markets. This greater integration has brought benefits in terms of lowering the cost of capital and greater diversification, but it also presents greater risks associated with the increased volatility of flows that comes with a greater share of portfolio inflows. In 2006, the surge in capital inflows, coupled with a current account surplus, put tremendous pressure on the baht, leading to excessive baht appreciation. If left unchecked, this could have threatened export performance and, more importantly, economic instability as domestic demand was marred by political uncertainties and in no condition to provide an alternative engine for growth. Therefore, the Bank of Thailand (BOT) decided to step in to curb the excessive appreciation of the currency. However, several conventional methods to manage the exchange rate proved to be ineffective as the pace of baht appreciation continued to accelerate.
The unremunerated reserve requirement (URR) was thus implemented in December 2006 to provide a price-based friction on selected short-term capital inflows with the aim of slowing down the pace of baht appreciation, reducing short-term capital inflows and allowing the economy to adjust to the large change in international prices. The evidence suggested that the measure had succeeded in achieving its stated objectives, as inflows had been reduced, the baht was more stable and the economy continued to expand satisfactorily with robust export performance and signs of recovery in domestic demand. Mindful of negative and distortionary effects of the URR measure, especially if left in place for too long, the BOT subsequently lifted the measure on 3 March 2008, after carefully ensuring that the threat of excessive currency movements had subsided and that the Thai economy had improved and was ready to better cope with potential flow and currency volatility.
This paper highlights recent challenges to the Thai economy arising from surging capital flows as well as policy responses, with a focus on the implementation of the URR measure. Section 2 summarises key developments over the past decade of the financial integration process between Thailand and the world, in terms of both capital flows and the international investment position, as well as key policy developments. Section 3 focuses on the challenge of rapid appreciation of the baht as a result of surging inflows during 2006–07, as well as policy responses. Section 4 provides details on the URR measure and an assessment of its effectiveness. Section 5 outlines the conditions and rationale leading to the removal of the measure, and the progress on other measures that the monetary authority has recently implemented to strengthen Thailand’s resiliency against volatile flows and exchange rates. Section 6 concludes.
1 Monetary Policy Group, Bank of Thailand. Prepared by the authors and staff in the Capital Account and
Balance of Payments Policy Team, Monetary Policy Group, for the 2008 Deputy Governors' Meeting in January 2008. The paper is an updated version of the one circulated during the meeting, to reflect the subsequent removal of the Unremunerated Reserve Requirement (URR) in March 2008. The authors thank Dr Thitanun Mulligamas and Dr Somsajee Siksamat for their valuable guidance and suggestions. All errors remain the authors’ own.

428 BIS Papers No 44
2. Overview of the policy framework and key developments in capital flows
The BOT adopted inflation targeting as the monetary policy framework in 2000. The target band is for core inflation, which excludes energy and fresh food prices, to be between 0% and 3.5% on quarterly average. This flexible inflation targeting framework provides the central bank with the discipline needed to achieve long-run price stability as the main policy objective, while allowing enough policy flexibility to accommodate other important economic considerations such as economic growth and financial stability.
Under the managed float regime, the BOT has largely allowed the overall direction of the baht to adjust to changes in market fundamentals. The Bank intervenes in the FX markets only to curb excessive short-term volatility or prevent disorderly adjustment of the baht, which could result in adverse impacts on the real sector or pose risks to economic stability. It is not the BOT’s intention to peg the baht at a particular level, but rather to allow it to move in line with regional currencies and consistently with Thailand’s economic fundamentals. Indeed, greater exchange rate flexibility under the managed float regime over the past decade has proved to be quite successful in facilitating the adjustment of the Thai economy to various economic and financial shocks.
In terms of the capital account policy framework, the central bank recognises the importance of the direct benefits of freer flows of capital, including lower costs of funding and greater risk-sharing. Freer flows of capital also play a significant role in deepening the financial markets, improving governance and facilitating technology transfers. This recognition is reflected in Thailand’s record of having a relatively open capital account regime, especially on the inflow side, compared to its emerging market counterparts. However, greater financial integration does present significant policy challenges as well, since greater movements of capital usually entail increased volatility of flows and asset prices which could potentially undermine economic and financial stability. In the rest of this section, we will present a brief discussion of the key developments in capital flow movements into and out of Thailand over the past decade.
Inflows Following the 1997 Asian crisis, which marked the end of the great wave of capital flows to emerging Asia that began in the early 1990s, there has been a new wave of large capital inflows to the region since 2002. Gross capital inflows to emerging Asia have now returned to the historically high levels of the pre-crisis period. This partly reflects strengthened macroeconomic policy frameworks and growth-enhancing structural reforms of most economies in the region, as well as ample global liquidity and favourable worldwide financial conditions. In the case of Thailand, gross capital inflow2 had slowly picked up from its lowest level since the end of 1997, and accelerated markedly during 2005 and 2006.3
2 Gross inflow is defined as total non-residents’ inflows minus total non-residents’ outflows. Total flow is
comprised of foreign direct investment, portfolio investment and other investment (including loans). 3 The peak of FDI during 1998–99, in the aftermath of the crisis, largely reflects the recapitalisation of the
affected firms in Thailand by their parent companies abroad. Concurrently, the significant drop in inflows from other investment was driven by callbacks and repayment of foreign debt.

BIS Papers No 44 429
Figure 1
Capital inflows by flow type for Thailand and selected East Asian economies1
As a per cent of GDP, four-quarter moving average
Gross inflows
-10
-5
0
5
10
15
20
Q1 1991 Q1 1994 Q1 1997 Q1 2000 Q1 2003 Q1 2006
Thailand
EA 9
FDI inflows
0
1
2
3
4
5
6
7
Q1 1991 Q1 1994 Q1 1997 Q1 2000 Q1 2003 Q1 2006
Thailand
EA 9
Portfolio investment inflows
-2
-1
0
1
2
3
4
5
Q1 1991 Q1 1994 Q1 1997 Q1 2000 Q1 2003 Q1 2006
Thailand
EA 9
Other investment inflows
-20
-15
-10
-5
0
5
10
15
20
Q1 1991 Q1 1994 Q1 1997 Q1 2000 Q1 2003 Q1 2006
Thailand
EA 9
1 India, Indonesia, Korea, Malaysia, Pakistan, the Philippines, Sri Lanka, Taiwan (China) and Thailand.
In line with the regional trend, the inflows to Thailand have also shifted from being dominated by bank loans during the pre-crisis period to deriving increasingly from FDI and portfolio investment in recent years, with FDI becoming the most important component and reaching its highest level at 8.2% of GDP during the first quarter of 2006. This trend may be explained by the lessons learned from the Asian crisis, which has led Thai banks and businesses to rely more on domestic borrowing and foreign creditors to be more prudent in making loans, resulting in substantially reduced inflows in the form of foreign debt. Meanwhile, increases in portfolio investment flows probably reflect the movement of funds away from developed countries to seek higher yields in emerging markets, especially in Asia. In Thailand, recent surges in inflows may have also been driven by attractive yields and the expectation of baht appreciation. The increased share of portfolio inflows also implies an increase in the volatility of both asset prices and overall inflows.
Outflows Capital outflows from East Asia and Thailand have increased rapidly in recent years, reaching unprecedented levels (Figure 2). A number of common factors have contributed to

430 BIS Papers No 44
this trend, including increased current account surplus, outflow liberalisation and, in the case of outward FDI, a more global and regional supply chain.
Figure 2
Capital outflows by flow type for Thailand and selected East Asian economies
As a per cent of GDP, four-quarter moving average
In the case of Thailand, most of the outflows remain in the form of foreign currency deposits by the banking sector, as with the other investment flows. This type of outflow largely reflects the increase in foreign asset holding by the banking sector to square its FX positions as a result of being the counterparty to the BOT’s swap agreements, which are one of the channels the Bank uses to sterilise its FX intervention. However, in recent years, Thailand’s portfolio outflows have increased significantly following the gradual liberalisation of portfolio investment through institutional investors. Still, the overall size of portfolio outflows to GDP remains relatively lower than that of other East Asia economies. (Details of Thailand’s outflows liberalisation measures will be discussed in subsequent sections.)
Key developments in Thailand’s international investment position The information from the latest survey of the international investment position (IIP) in 2007 reveals a number of interesting issues and trends:
Thai residents’ holdings of foreign assets have risen steadily in line with the continued surplus in the current account. The value in US dollars of foreign assets held
Q1 2006
Thailand
Gross outflows
–7
–6
–5
–4
–3
–2
–1
0
1
2
3
Q1 1991 Q1 1994 Q1 1997 Q1 2000 Q12003
EA 9
–0.8
–0.6
–0.4
–0.2
FDI outflows
–1
0
0.2
0.4
Q1 1991 Q1 1994 Q1 1997 Q1 2000 Q1 2003 Q1 2006
Thailand EA 9
Portfolio investment outflows
–2
–1.5
–1
–0.5
0
0.5
1
Q1 1991 Q1 1994Q1 1997 Q1 2000 Q1 2003 Q1 2006
Thailand EA 9
Other investment outflows
–7–6–5–4–3–2–10123
Q1 1991 Q1 1994 Q1 1997 Q1 2000 Q1 2003 Q1 2006
Thailand EA 9

BIS Papers No 44 431
by Thai residents has roughly doubled over the past seven years, from $55 billion in 2000 to $106 billion in 2006, equivalent to 51.7 % of GDP. Most of the increases in foreign asset holdings were, however, carried out by the official sector in the form of rapid accumulation of foreign reserves, which were intended initially to ensure reserve adequacy and later to slow down baht appreciation. The increase in the “loans and other investments” category – especially in 2006 – largely reflects the increase in foreign currency deposits by the banking sector to match increased hedging activities by exporters. Despite continued relaxation of outflow restrictions, both outward direct investment and portfolio investment abroad expanded only slowly during the period up to 2006.
Figure 3
Foreigners’ holdings of Thai assets have seen a clear shift from bank loans to FDI and portfolio investment. Thailand’s foreign liabilities have risen in dollar amount, but declined in terms of share of GDP, from 93% of GDP in 2000 to 80.3% in 2006. Foreign bank loans declined significantly after the 1997 crisis as both the official and the private sector paid down the external debt and sought alternative financing via domestic financial markets. In the meantime, non-residents’ holdings of Thai assets in the form of FDI and portfolio securities
Foreign Assets Held by Thai Residents
20
40
60
80
100
120
140
2000 2001 2002 2003 2004 2005 2006 P35
37
39
41
43
45
47
49
51
53
55Securities, OfficialSecurities, PrivateLoans and other investmentFDITotal Assets (as % of GDP) (Right Axis)
% of GDPBillion USD
Source: BOT’s International Investment Position Survey (2007)
20
40
60
80
100
120
140
160
180
2000 2001 2002 2003 2004 2005 2006 P70
75
80
85
90
95
100Securities, OfficialSecurities, PrivateLoans and other investmentFDITotal Liabilities (as % of GDP) (Right Axis)
Foreign Liabilities (Thai Assets Held by Nonresidents)
% of GDPBillion USD
Source: BOT’s International Investment Position Survey (2007)

432 BIS Papers No 44
continue to grow steadily over the period as a result of the Thai economy’s improved economic fundamentals as well as a global trend of diversifying into emerging markets.
Table 1
Thailand’s international investment position, classified by business sector
In millions of US dollars
Total Year Banks
Non-bank corpora-
tions
Govern-ment
and state enterprises
Monetary authorities Amount % of GDP
Assets 2001 16,546 3,807 923 33,048 54,324 47
2006 25,628 11,702 2,335 66,985 106,650 51.7
Liabilities 2001 15,160 61,769 20,912 8,325 106,166 91.9
2006 26,890 119,253 19,468 0 165,611 80.3
Net 2001 1,386 –57,962 –19,989 24,723 –51,842 –44.9
2006 –1,262 –107,551 –17,133 66,985 –58,961 –28.6
Source: BOT 2007 IIP.
Though Thailand’s external position remains a net foreign liability position at the aggregate level, its vulnerability to currency exposure has decreased significantly. As a percentage of GDP, the net foreign liability has declined from 45% in 2001 to 29% in 2006. In addition, the gross external debt figures certainly overstate the extent of currency exposure because they fail to capture the currency risk reduction through increased hedged positions as well as the rising share of baht-denominated external debt.4 Moreover, the increased importance of FDI as opposed to bank loans has reduced the risk of sudden reversal. Thus, Thailand’s external balance sheet position is much less sensitive to exchange rate changes now compared to in the past.
However, there are still a number of important distributional issues that warrant further scrutiny. In terms of sectoral distribution, there seems to be a clear trend of sectoral mismatch. While most liabilities are accumulated in the non-bank corporation sector, most of the assets, roughly two thirds of the country’s foreign assets, are with the central bank in the form of foreign reserves.5
One of the implications of the sectoral mismatch is the big difference in terms of debt-equity profile between Thailand’s foreign assets and liabilities. On the liability side, the share of Thai assets held by foreigners in the form of equity has been rising rapidly, reaching 65% of total liabilities in 2006. On the asset side, however, roughly 93% of foreign assets held by Thai residents are in debt form, largely reflecting the fact that a significant share of total assets is under central bank reserve management and can therefore by law only be invested in safe and liquid assets such as government bonds. The concentration of private assets in fixed income instruments could also be attributed to regulatory restrictions, low risk tolerance on
4 A recent estimate indicates that up to 25% of total external debt is denominated in baht. 5 As for the banking sector, the net position is expectedly small due to a prudential regulation that limits the
open position of foreign currency holdings.

BIS Papers No 44 433
the part of Thai investors, and the lack of investment capability in a more complex setting or instruments in the form of both outward FDI and portfolio equity. Compared to debt, return on equity investment may be more volatile, but it is also associated with higher expected return and greater potential for risk-sharing in the long run. Thus, the current debt-heavy portfolio allocation by Thai residents is likely to be suboptimal in terms of risk-return profile. Granted, the share of outward equity investment will tend to rise along with the financial literacy and investment capability of Thai investors.
Table 2
Thailand’s IIP by debt equity classification1
% Year Debt Equity
Assets 2001 94.8 5.2
2006 91.3 8.7
Liabilities 2001 65.1 34.9
2006 34.7 65.3 1 Equity includes equity FDI, equity portfolio, derivative instruments and gold holdings by the central bank.
Source: IIP survey (2007).
It is also worth noting that Thailand’s holding of foreign assets in the form of FDI, portfolio and other investment, as a percentage of GDP, is very small in comparison to those of other countries in the region. An exception is the level of foreign reserves, which reflects the accumulation of reserves after the 1997 crisis, partly as a result of the FX intervention in an attempt to slow down the currency appreciation.
Table 3
Comparisons of foreign assets as a percentage of GDP across countries (by type of flow)
Direct investment outflows
Portfolio equity outflows
Debt outflows (portfolio + other)
Foreign reserve minus gold Stock as
% of GDP 1995 2004 1995 2004 1995 2004 1995 2004
Malaysia 10.5 21.0 1.0 2.2 14.7 31.2 26.8 56.4 Singapore 46.9 104.4 41.5 139.2 77.3 250.4 81.8 105.1 Philippines 1.7 2.3 0.7 1.7 13.2 20.1 8.4 15.2 Indonesia 0.8 1.3 0.0 0.0 5.7 7.4 6.8 15.5 Thailand 1.4 3.3 0.0 0.4 6.2 11.1 21.4 29.8 Korea 3.1 7.8 0.3 2.0 12.1 13.4 6.3 29.2 Taiwan 10.4 29.9 3.2 37.0 32.1 64.9 34.1 75.1 China 2.5 2.2 0.1 0.3 8.7 15.6 10.8 37.3 Japan 4.5 7.9 2.8 7.8 39.0 55.3 3.5 17.8 United States 18.4 28.0 10.7 21.5 22.1 33.9 1.0 0.6
Source: EWN Mark II dataset; authors’ calculations.

434 BIS Papers No 44
3. Rapid baht appreciation in 2006 and policy responses
Following the 1997 financial crisis and up to 2004, Thailand’s balance of payments positions followed a similar pattern of surpluses in the current account and deficits in the capital account. The current account surpluses were attributable to robust export performance, benefiting from a competitive exchange rate as well as a healthy global economy, while import growth was relatively subdued owing mainly to the slowdown in investment spending relative to the pre-crisis period. At the same time, the deficits in the capital account over the period were mainly a result of the continuation of debt repayment to foreign investors by both the public and private sectors as well as the shift in funding towards domestic financial markets. Therefore, the upward pressure on the baht from the current account surplus was to some extent offset by the capital account deficit, resulting in a rather gradual trend of baht appreciation during 2001–04.
Figure 4
Balance of payments development
Source: Bank of Thailand.
In 2005, however, the situation began to reverse, with the current account registering a large deficit while the capital account recorded a surplus for the first time since the crisis. The sudden turnaround in the current account position was caused chiefly by the oil price subsidy programme implemented during 2004 and mid-2005, which fixed retail petrol prices below the world markets’ prices, resulting in continued growth of domestic oil consumption and a huge import bill for petroleum products, given that Thailand needed to import nearly 90% of domestic oil consumption. Meanwhile, declining outflows of debt repayment and surging inflows in the form of both FDI and portfolio securities contributed to a large surplus in the capital account. Again, with the positions of the two accounts in opposite directions, the baht was largely stable in 2005.
-15,000
-10,000
-5,000
0
5,000
10,000
15,000
1996
1997
1998
1999
2000
2001
2002
2003
2004
2005
2006
p
9m20
07p
-15
-10
-5
0
5
10
15
CA/GDP (RHS)Capital account/GDP (RHS)Balance of Payments (LHS)
million USD % of GDP

BIS Papers No 44 435
Figure 5
Bilateral and effective exchange rate for the Thai baht
Dec.0733.70
Dec.0777.78
Nov.0789.03
Index: 1994=100Real Effective Exchange Rate (REER)
Nominal Effective Exchange Rate (NEER)
Baht strengthenBaht weaken
FX (Baht / US$)Baht / Dollar
50
60
70
80
90
100
110
Jan 93 Jan 95 Jan 97 Jan 99 Jan 01 Jan 03 Jan 05 Jan 07
20
30
40
50
60
Jan 93 Jan 95 Jan 97 Jan 99 Jan 01 Jan 03 Jan 05 Jan 07
Source: Bank of Thailand.
However, the upward pressure on the baht intensified in 2006 due to surpluses in both the current and the capital account. In the former, while exports continued to expand satisfactorily, import growth declined sharply following the abolishment of the oil price subsidy programme and softened domestic demand due mainly to rising concerns over political uncertainties. As a result, the current account reversed from a $7.6 billion deficit to a surplus of $2.2 billion, or 1.1% of GDP. However, most of the upward pressure on the baht came from the capital account. In particular, the amount of inflows via private non-bank sectors had risen by more than $4 billion the previous year to $13 billion, or 6.6% of GDP. The increase in inflows to the non-bank private sector was accounted for by the sharp increase in both equity and debt flows. It is worth nothing that the outflows in the bank sector mainly reflected the increase in banks’ holdings of foreign currency deposits or short-term instruments to square their foreign exchange position as a result of being the counterparty to the BOT’s swap agreements (one of the channels the central bank uses to sterilise its FX intervention).6 If the outflows associated with the swap agreements between the BOT and the banking sector were taken out, the adjusted figure for the capital account in 2006 would be much higher, comparable to the figure in 2005. The sharp increase in balance of payments surpluses from $5.4 billion in 2005 to $12.7 billion in 2006, with most of the surpluses coming from the capital account, led to a rapid baht appreciation of more than 16% against the US dollar, making it one of the world’s most strengthening currencies in 2006.
6 Therefore, the overall capital account position will underestimate the upward pressure on the baht in this case.
To better assess the pressure from capital flows, one should consider the rise in reserves as a result of FX intervention to curb upward pressure on the baht from inflows as well.

436 BIS Papers No 44
Table 4
Thailand’s balance of payments and selected external sector indicators (2001–06)1
Millions of US dollars Average 2001–04 2005 2006
Current A/C 4,338 –7,642 2,315 (% of GDP) 3.3% –4.3% 1.1%
Capital and financial A/C1 –1,613 11,085 6,806 (% of GDP) –1.4% 6.3% 2.1%
Of which: Bank –165 222 –7,427 (% of GDP) –0.2% 0.1% –3.6% Of which: Private non-bank –1,924 9,340 14,721 (% of GDP) –1.5% 5.3% 7.1%
Of which: Equity 3,578 7,245 11,892 (% of GDP) 2.5% 4.1 5.7% Of which: Debt2 –1,636 659 4,661 (% of GDP) –1.3% 0.4% 2.3%
Balance of payments 2,857 5,422 12,742 International reserves1 40,988 52,066 66,985 Forward obligations1 1,810 3,840 6,941 1 Reinvested earnings (RE) included. 2 Including direct loans, other loans and debt securities.
Source: Bank of Thailand.
Figure 6
Baht movement in 2006
Source: Bank of Thailand.
If left unchecked, the rapid rise of the baht in 2006 could have posed significant risks to macroeconomic stability through its implications for export performance. Over the past decade, the importance of the export sector has increased significantly relative to Thailand’s economic structure, with the value of exports relative to overall GDP rising from around 30%

BIS Papers No 44 437
in 1997 to more than 60% in 2006. Thus, in general, the health of the Thai economy has been increasingly tied to the performance of the export sector. Even more importantly, over the past few years the Thai economy has been left with not much choice but to rely on net exports as the engine for growth, as domestic demand has been markedly affected by continued political uncertainties and higher oil prices. Table 5 shows that during 2001–05, the country’s economic growth was basically driven by domestic demand. However, during 2006–07, more than three fourths of GDP growth came from net exports. Indeed, without growth contribution from net exports, overall economic growth during that time would have been only 1.1%, a figure many may consider to be at the brink of recessionary conditions by the Thai economy’s and other emerging markets’ standards.
Table 5
Contribution to Thailand’s GDP growth
Avg 2001–05 Avg 2006–Q3 2007
GDP growth 5.1 4.8
– Domestic demand (includes change in inventory and statistical discrepancy) 5.4 1.1
– Net exports –0.3 3.7
Sources: Bank of Thailand; NESDB.
Besides posing a threat to overall economic growth, excessive baht appreciation might also have resulted in instability in the labour market. The sectors most vulnerable to exchange rate appreciation were the agricultural sector and labour-intensive sectors such as textiles. The exporting firms in these sectors, compared to their counterparts in high-tech industries such as electronics or automobiles, tended to be characterised by small size, low import content production (thus, no offsetting gain from cheaper imports), low natural hedge, infrequent use of hedging instruments, low margin, little pricing power and higher price elasticity. Therefore, it would have been extremely difficult for firms in these sectors to cope with an excessive rise of the baht in a very short period of time. More importantly, these sectors accounted for a significant share of overall employment, with jobs in the agricultural sector representing 38% of Thailand’s labour force, while the labour-intensive manufacturing sector made up 27% of total manufacturing jobs in Thailand. The loss in price competitiveness in such a short period could possibly have led to mass closure of the firms in these sectors, with potentially grave consequences for the labour market outlook.
Policy responses prior to the implementation of the URR In response to the rapid rise of the baht, in 2006 the BOT tried to slow down the pace of baht appreciation by implementing a number of conventional measures including FX intervention, outflow liberalisation and anti-speculative measures. These measures, however, proved to be rather ineffective in achieving the stated objectives. Each of the measures is described below.
(i) FX intervention The rapid baht appreciation in 2006 was deemed to be a situation that warranted closer management by the central bank as it could have posed a threat to economic stability. Thus, the BOT stepped up the conduct of FX purchase operations in 2006. This can be seen in a marked increase of net reserves (ie gross reserves plus net forward positions) of roughly $18 billion in 2006 alone (Figure 7), equivalent to 29% year-on-year growth, among the

438 BIS Papers No 44
highest rates of reserve accumulation in the region (Figure 8). The rate of reserve accumulation over this period was also significantly faster than that observed during 2000–05, when reserves grew on average only $5 billion per year.
Figure 7
Gross reserves and forward obligations
Figure 8
Percentage change in reserves in 2006 for selected countries
Sources: Bank of Thailand; CEIC.
Despite sustained efforts, the effectiveness of FX intervention proved to be limited under the surge of inflows as the baht continued to strengthen against the US dollar. This was especially the case in the last two months of 2006 when the rate of baht appreciation against the dollar accelerated to 0.7% per week, compared to the average appreciation rate of 1% per month over the first 10 months of the year.
–40
–20
0
20
40
60
80
100
120
97 98 99 00 01 02 03 Q1 04
Q1 05
Q1 06
Q1 07
International reserves
Forward obligations
External debt (rhs)
-
USD billions
Source: Bank of Thailand.

BIS Papers No 44 439
Table 6
Net changes in reserves and pace of baht appreciation, 2006
January–October November–mid-December
Change in gross reserves $1,023 million per month $474 million per week
Change in net reserves1 $1,165 million per month $912 million per week
Appreciation of THB/USD 1.0% per month 0.7% per week 1 Reserves include forward obligations.
Source: Bank of Thailand.
The rise in reserves and surplus liquidity arising from intervention posed an additional significant policy challenge in terms of liquidity management. The BOT normally sterilises to offset the excess liquidity resulting from FX intervention in order to avoid inflationary effects and maintain the policy rate at the level set by the Monetary Policy Committee (MPC). In theory, sterilisation can be done by conducting the central bank’s open market operations or raising reserve requirements. The latter option, however, imposes implicit costs on financial institutions if reserve requirements are not remunerated or are remunerated at lower than market rates. The BOT therefore chose to sterilise largely by utilising open market instruments, particularly through issuance of BOT bonds, FX swap and repurchase transactions.
Of the three instruments, the issuance of BOT bonds emerged as the main choice for liquidity management thanks to its relative efficiency in absorbing liquidity on a large scale with longer maturities. Its importance particularly grew over the past few years, in line with the accumulation of reserves. Figure 9 shows the shares of outstanding amounts of each instrument used for liquidity management in 2003 and 2007.7 The share of BOT bonds increased from 43% in 2003 to 62% in 2007, while its outstanding value increased more than sevenfold over that period, from 180 billion baht in 2003 to 1,400 billion baht at the end of 2007. Meanwhile, to reduce the need for refinancing too frequently in the face of sustained pressure on the baht, the maturity of BOT bonds issued has become longer over the past few years, from largely one-year maturity in 2005 to one- to three-year maturity in late 2007 (Figure 10).
The direct cost of sterilisation has not been a big policy concern so far, since the cost of carry on international reserves is largely even, as domestic interest rates are on average comparable to foreign interest rates. However, too many bond issues bunching up together in a short period could have an adverse impact on the yield curve. Special attention was therefore paid to the timing, volume and maturity of the bond issues in order to minimise this impact.8 Nevertheless, if the need to intervene in the FX market and subsequent sterilisation through issuance of BOT bonds persists for a very long time, it could have implications for the cumulative costs of such operations as well as the BOT’s ability to maintain interest rates at a level consistent with targeted inflation rates.
7 Note that the figures shown here do not necessarily represent the amount of sterilisation (or intervention, for
that matter) conducted by the BOT, as the Bank uses these instruments for overall liquidity management and not only for sterilisation purpose.
8 Another way to minimise such risks is to issue bonds directly to household sectors. For example, recently BOT savings bonds were issued to retail depositors, and received tremendous interest. In this way, the Bank manages to absorb liquidity and provide an alternative saving vehicle for depositors while avoiding disrupting the yield curve.

440 BIS Papers No 44
Figure 9
Share of outstanding amount of OMO instruments for liquidity management (by type)
Source: Bank of Thailand.
Figure 10
Outstanding amount of BOT bonds By original maturity
Source: Bank of Thailand.
As for the implications of FX intervention on the central bank’s balance sheet, rapidly rising reserve accumulation and substantial appreciation of the baht against the dollar led to considerable FX revaluation loss in 2006. Despite the BOT’s efforts to gradually diversify the currency composition of the reserves away from dollars over the past several years, dollar-denominated assets still account for a significant share of total reserves. At times, reports of losses on the BOT’s balance sheet have been played up by the media and often put out of context, creating misunderstanding among the public. In response, the BOT has stepped up its communication with the market and the public at large on the rationale behind and explanation of the implications of FX intervention for the BOT’s balance sheet. Emphasis should be placed on medium-term balance-sheet performance, and not as much on the
2y
1y
FX swaps
24%
BOT bills/bonds
62%(1,400 bn baht)
RP
14%
End-2007
Total 2,253 billion baht
FX swaps 48%
BOT bills/bonds
43%
RP 9%
End-2003 Total 415 billion baht
(39 billion baht)
(180 bn baht) ($4,955 mn
= 180 bn baht)

BIS Papers No 44 441
year-to-year valuation losses incurred as a result of short-term exchange rate fluctuations. More importantly, it is the BOT ‘s policy to give priority to maintaining overall economic and financial stability over the profits and losses on the central bank’s balance sheet.
(ii) Interest rate policy Theoretically, one way to reduce the size of inflows is to lower the policy interest rate. Granted, as an inflation targeting central bank, the BOT would give priority to keeping inflation within the stated band when setting the policy rate, while taking other factors such as economic growth and FX stability into consideration. However, the situation in 2006 complicated the BOT’s decision whether to lower the policy rate even more than usual. In July 2005, after the termination of the oil price subsidy, headline inflation jumped markedly to average close to 6% over the second half of the year. Meanwhile, core inflation, which excludes energy and fresh food prices, came close to the upper bound of the inflation band (0–3.5%) in mid-2006. In response to this growing inflationary pressure, the BOT gradually raised the policy rate to the peak of 5% in mid-2006 in order to contain the second-round effects of the price increase. The boost in the policy rate seemed to have worked as inflation started to level off. However, towards the end of the year, there was renewed concern over price stability, as global oil prices seemed to be heading up again. As a result, the MPC decided in December 2006 to keep the policy rate unchanged at 5%. It was also of the view that lowering the rate with the aim of weakening the baht despite the looming threat of rising inflationary pressure might send the wrong signal to the markets about the Bank’s commitment to maintaining price stability. Finally, the 5% policy rate was hardly high compared to rates in many other currencies at the time, and thus was unlikely to cause the baht to be a main target currency for carry trade activities.
Figure 11
Inflation and policy interest rates
Source: Ministry of Commerce.
(iii) Outflow liberalisation Another policy measure which could help mitigate upward pressure on the baht is outflow liberalisation. Removing regulatory restrictions on outflows in an appropriate sequencing and pace would not only help create more balanced flows and thus alleviate upward baht pressure, but also enhance the benefits from greater economic and financial integration through risk-sharing, diversification and enhanced return. In fact, given the relatively low level of foreign asset holding by Thai residents compared to other comparable economies (as shown in Table 3), there was much room for Thailand to gain from greater investment opportunities in the global markets.
Responses to outflow relaxation were rather slow in the early phase. After the external position stabilised following the 1997 crisis, the BOT gradually relaxed restrictions on portfolio outflow investment from 2003 by allowing households and corporations to invest in
–2
0
2
4
6
8
2001 2002 2003 2004 2005 2006 2007
Headline inflation
Core inflation
Core inflation target band: 0-35% R/P one-day
%

442 BIS Papers No 44
securities abroad through qualified institutional investors under the pre-announced annual quota. The given quota is allocated among seven types of institutional investors: (1) the Government Pension Fund; (2) the Social Security Fund; (3) insurance companies; (4) specialised financial institutions; (5) mutual funds; (6) provident funds; and (7) securities companies.9 However, during 2003–06 only 18% the of total annual quota was actually invested abroad, and the outstanding amount of portfolio investment abroad by qualified institutional investors at the end of 2006 was less than $2 billion. Such low interest in investing abroad over that period can be attributed to both cyclical and structural factors. The cyclical factors included the favourable returns of domestic assets and the continued trend of baht appreciation, and the structural ones most likely included households’ lack of financial literacy regarding foreign investment and institutional investors’ inability to offer attractive investment products at reasonable cost.
Much of the portfolio outflows were in the form of fixed income funds with full FX hedging, with the simple objective of earning slightly higher fixed returns compared to the returns offered by domestic bank deposits. This type of investment would not necessarily provide much relief to the upward pressure on the baht, as the weakening pressure on the currency from the outflows was cancelled by the opposite pressure arising from forward purchases of baht. For private portfolio outflows to effectively counter the upward pressure, the hedging ratio of this kind of investment would have to be lower. Such an investment strategy is likely to require underlying investment assets in the form of equity securities10 or more sophisticated FX risk management. Granted, these kinds of risk preference, literacy and skills can only be accumulated over time through actual experience as well as investment in the capacity-building of institutional investors. The bottom line is that the relaxation of outflow restrictions, while bringing immediate benefits in terms of greater risk diversification for investors, was quite ineffective in mitigating the upward pressure on the baht, especially while the market expected the currency to strengthen (see list of outflow liberalisation measures for 2003–07 in Appendix 1).
(iv) Measures to manage inflows In general, Thailand has been very open to investment from abroad, with relatively small restrictions on inflows, especially those involved with genuine trade and investment. However, in cases where the BOT detected currency speculation activities which could jeopardise exchange rate stability, it would consider introducing measures aimed at prohibiting or discouraging such activities. Table 7 gives a summary of important anti-speculative measures implemented over the past five years.
Of particular interest are the measures implemented in November and December of 2006. Entering the fourth quarter of 2006, the upward pressure on the baht had intensified, with large sums of foreign inflows channelling into a number of short-term fixed income instruments with the objective of gaining from attractive yields and anticipated baht appreciation. These activities, if left unchecked, could have led to a self-fulfilling prophecy, as the baht would probably have continued to strengthen beyond what is justified by the fundamentals. As a result, the BOT implemented a number of measures to discourage such activities. However, the effectiveness of these measures proved to be limited. As the
9 For the first four types of institutional investors, the investment quota is allocated by the BOT. The quota for
the latter three is allocated by the Securities and Exchange Commission (SEC), which receives the annual quota from the BOT.
10 Discussions with institutional investors in Thailand revealed that most of the fixed income funds (with low volatility of underlying assets) were fully hedged for FX risk, while the FX exposures of equity funds tended to be unhedged since equity returns were usually already highly volatile. Nevertheless, hedging preferences may change in the future.

BIS Papers No 44 443
currency threatened to break 35 baht per US dollar – seen by market participants as the key psychological threshold – the BOT decided to announce the implementation of the URR on short-term inflows on 18 December 2006.
Table 7
Summary of the BOT’s anti-speculative measures during 2003–06
Date Detail of measures
11 Sep 2003 With underlying trade or investment, financial institutions can borrow Thai baht or enter into transactions comparable to baht borrowing from non-residents up to underlying value. However, for transactions without underlying trade and investment, financial institutions can borrow Thai baht or enter in transactions comparable to baht borrowing from non-residents for only up to 50 million baht per entity. Applies to transactions whose tenor is not over three months.
14 Oct 2003 The daily outstanding balance of the Non-resident Baht Account is limited to a maximum of 300 million baht per non-resident. Exceptions to this limit considered on a case by case basis by the BOT.
3 Nov 2006 The BOT seeks cooperation from financial institutions not to issue and sell bills of exchange in baht for all maturities to non-residents.
4 Dec 2006 − Financial institutions are asked to refrain from selling and buying all types of debt securities through sell-and-buy-back transactions for all maturities. Such transactions are financial instruments which non-residents can use to evade the BOT’s anti-speculation measures.
− Financial institutions are allowed to buy and sell foreign currencies with non-residents or to credit or debit the Non-resident Baht Accounts for the settlements relating to investments in government bonds, treasury bills or BOT bonds only when such investment holdings are longer than three months.
− Financial institutions are allowed to borrow baht or enter into transactions comparable to baht borrowing from non-residents without underlying trades and investments in Thailand only for a maturity of at least six months, an increase of three months from the previous measure.
4. Implementation of the URR and assessment of its effectiveness
On 18 December, 2006, the BOT announced the implementation of the URR, considered a price-based friction, on selected types of inflows. The objectives of the URR were to: (1) break the momentum of rapid one-way speculation on the baht and allow the baht movement to be more in line with regional currencies; (2) slow down the surge of inflows, which would enable the FX management to be more effective, especially during the period of ongoing concerns over the US dollar slide; and (3) provide time for the private sector to adjust to the sharp rise of the baht and for various measures implemented by the central bank aimed at stimulating domestic demand and achieving more balanced flows to bear fruit.
Under the URR, investors who brought new foreign currency funds into Thailand and wanted to convert into baht for external borrowing, investing in debt securities, mutual funds and property funds, and those FX transactions without proof of underlying positions, were required to reserve 30% of the total fund amount with commercial banks and would be allowed to get the reserve back after one year without penalty. However, if the investors took

444 BIS Papers No 44
the funds out of Thailand within the year, they were refunded only two thirds of the reserved funds.
In designing the URR measure, the BOT was careful to apply the measure only to the types of inflows most likely to be employed by currency speculators, while minimising the impact of such measures on inflows associated with genuine trade and investment. Therefore, the Bank exempted inflows of less than $20,000 and those related to trade in goods and services, foreign direct investment, and equity portfolio investment in the stock exchange.11 Moreover, the URR did not affect funds already in Thailand prior to 19 December 2006, or compromise investors’ freedom to move such funds out of the country in the future.
To alleviate the burden of the URR measure on the business sector, the BOT gradually announced relaxations of the measure:
• In February 2007, the choice of full FX hedging was provided as alternative for the 30% reserve requirement for loans.12 This option required the investor to fully hedge the FX exposure of the loan for its entire life, for loans with original maturity of less than or equal to one year. For loans with longer original maturities, investors had to fully hedge their FX exposure for at least one year, and could manage their FX risks as they desired afterwards.
• In March 2007, a similar hedging alternative was provided for investment funds into debt securities and unit trusts such as mutual and property funds, with the added conditions that: (1) the funds be kept in a Special Non-resident Baht Account for Debt Securities and Unit Trusts (SND), allowed only for settlements related to investment in debt securities and unit trusts; and (2) the full FX hedging be maintained throughout the holding of such securities.
• In December 2007, additional relaxations were announced, including:
– Loans not exceeding $1 million and with a maturity of at least one year were exempted from both the reserve requirement and the full hedge requirement.
– Businesses wishing to borrow in foreign currency and having a natural hedge in the form of future foreign currency earning were allowed to submit the request for exemption from both requirements on a case by case basis.
– New investment funds, as part of the rights offering programme by existing property funds, were exempted from both requirements.
(Please see further details on the URR applications on different types of inflows and subsequent relaxations in Table 8.)
11 Initially, the URR measure was also applied to equity investment in the Stock Exchange of Thailand (SET).
However, it was exempted on the day after the announcement for a number of reasons, including: (1) concern over the severe decline in stock value during the first day of trading following the URR announcement, with potentially much more selling orders to come; (2) the commitments by custodian banks that they could monitor the funds investing in the SET via the special accounts; and (3) the assessment that investing in equity securities is not the most likely option to be used for currency speculation due to its inherently high price volatility. Thus, beginning on 20 December 2006, new funds earmarked for equity investment in the SET and in other official exchanges were exempted from the URR and must be kept in the SNS. The funds cannot be used for investing in other types of securities.
12 New inflows with fully hedged FX positions will not cause upward pressure on the baht at the time of converting foreign funds into baht since the buy order for dollars in the forward leg of the swap agreement will offset the spot sale of dollars. However, the pressure on the baht might resurface when the forward positions were unwound after the URR measure was abolished.

BIS P
apers No 44
445
Table 8 Details of the Unremunerated Reserve Requirement (URR) measure and subsequent relaxation (by type of inflows)
Portfolio equity (<10% of ownership)
Trade,
services, FDI In the stock
market Outside the
stock market
Loans (only those signed after
18 December 2006) Bonds Mutual funds,
property funds Swaps
with local banks
Non-resident
Baht Account (NRBA)
URR (19 Dec 2007)
Exempt Exempt; funds kept in SNS1 account
Case by case basis
URR 30% URR 30% URR 30% URR 30% URR 30%
URR (between Mar and Dec 2007)
Exempt Exempt; funds kept in SNS account
Case by case basis
URR 30% or full hedge (FH) for the maturity of loan, or up to one year for loans with maturities > one year
URR 30% or FH for the whole holding period, and funds must be kept in an SND account2
URR 30% or FH for the whole holding period, and funds must be kept in an SND account2
URR 30% URR 30%
URR (17 Dec 2007–3 Mar 2008)
Exempt Exempt; funds kept in SNS account
Case by case basis
URR 30% or full hedge (FH) for the maturity of loan, or up to one year for loans with maturities > one year Exemption from URR/FH for – loans of amounts not exceeding $1mn and with lending period ≥ one year – loans for firms with export receipts (natural hedge)
URR 30% or FH for the whole holding period, and funds must be kept in an SND account2
URR 30% or FH for the whole holding period, and funds must be kept in an SND account2 Exemption from URR/FH for – participation in right offering programmes by existing property funds
URR 30% URR 30%
1 SNS: Special Non-resident baht account for Securities. 2 The funds must be kept in Special Non-resident Baht Accounts for Debt Securities and Unit Trusts (SNDs), allowed only for settlements related to investment in debt securities and unit trusts.

446 BIS Papers No 44
The URR measure lessened the pressure of baht speculation and was pivotal in ensuring the stability of the currency. However, being aware of the potential adverse effects of the URR measure on the cost of capital for domestic business as well as the erosion of its effectiveness over the long run, the BOT intended to employ the URR only temporarily. In the following subsections, we assess the effectiveness and potential costs of the measure. Considerations leading to its removal in February 2008 are presented in the next section.
Assessment of the effectiveness of the URR measure In terms of benefits, the URR measure apparently achieved its stated objectives in the following areas:
(1) The URR helped break momentum of the one-way bet on the baht and allow baht movement to be in line with regional currencies. Prior to implementation of the URR, the baht was under fierce speculative pressure, which caused an excessive pace of appreciation that could have harmed the real sector. After the implementation of the measure, baht movement stabilised.
Figure 12
Selected regional currency movements against the US dollar 2006–2007
Sources: Bank of Thailand; Bloomberg.
Granted, the URR did not succeed in reversing the trend completely, as the appreciation of the currency did resume subsequently due largely to the growing current account surplus. However, the pace of appreciation was much more moderate compared to the few weeks prior to the adoption of the measure, and more importantly was more in line with the currencies of Thailand’s major trading partners and competitors. In 2006, however, the baht strengthened in both NEER and REER terms, by 9.8% and 11.3% respectively, implying a significant loss in export price competitiveness. In contrast, in 2007, despite the gain in bilateral terms against the US dollar of 7.4% (between 3 January and 14 December 2008), baht movement in NEER and REER terms was largely unchanged.
0.8
0.9
1.0
1.1
30 Dec 05 2 May 06 31 Aug 06 27 Dec 06 26 Apr 07 23-Aug-07
Indonesia Korea Taiwan
Singapore Philippines B/$
URR 14-Dec-07
Appreciation against USD
Index (30 Dec 05 = 1)
PHP
KRW
SGD
TWD
INDO
THB

BIS Papers No 44 447
Table 9
Changes of baht value in bilateral, nominal effective and real effective terms during 2006 and 2007
2006 (first
11 months)
2006 (first
11 months + first two weeks of
December)
2006 (whole year)
2007 (end date/begin date)
% change in bilateral FX (baht/$)
+14.0 +16.6 +13.9 +7.4 (14 Dec 2007/3 Jan 2007)
% change in REER +10.3 na +11.3 +0.6
(Oct 2007/Dec 2006)
% change in NEER +8.5 na +9.8 +0.2
(Nov 2007/Dec 2006)
Source: Bank of Thailand.
(2) The URR measure contributed to the stability of the baht in 2007 by reducing inflows to a more manageable level and enabling FX interventions to become more effective in slowing down the pace of currency appreciation. Table 10 summarises selected items from the 2001–07 balance of payments. Most of the reduction in net flows in 2007 is attributable to the inflows to the non-bank private sector, declining from $13.6 billion in 2006 to $6.2 billion during the first nine months of 2007. Unsurprisingly, the net debt flows including loans and debt securities, both of which are subject to the URR or full hedge requirement, show the most significant drop, from $4.6 billion in 2006 to $1.3 billion during January–September 2007.13 Meanwhile, net equity flows in the non-bank sector, which were exempt from the URR measure, remained large at almost 6% of GDP, similar to the previous year. It is interesting to note that equity flows in terms of both FDI and portfolio investment were apparently not significantly affected by the implementation of the URR, as some had initially feared. In particular, equity flows from non-residents into the stock market have been buttressed by the relatively low P/E ratio of the Thai stock markets and the anticipation among foreign investors of an imminent resolution to the ongoing political uncertainty.
Indeed, the contribution of the URR measure and the full hedge requirement to reducing the upward pressure on the baht goes beyond what is implied by the figures reported in the BOP table. The inflows for which investors chose the full hedge option do not put pressure on the baht at the time of converting foreign currency funds into baht, as the mandatory simultaneous forward purchase of dollars cancels out the pressure on the baht. Figure 13 presents data on the outstanding amount of inflows subject to either the reserve or full hedge requirement, by type of inflow, during December 2006–January 2008. It indicates that investors were more inclined to choose the full hedge option, with more than $4.4 billion worth of funds being fully hedged to cover their FX positions, compared to only around $1.2 billion under the reserve requirement.14 Most of the fully hedged funds were loans, with
13 The reduction in net debt flows was also due in part to the increase in portfolio outflows in the form of fixed
income funds by domestic institutional investors, especially during the third quarter of 2007. 14 The figures are the total amount of funds subject to the URR. Thus, only 30% of these amounts are actually
required to be deposited at commercial banks under the reserve requirement. Based on available information, investors who choose the URR option can be divided into two main groups: (1) small firms that need to borrow

448 BIS Papers No 44
quite a small amount of funds earmarked for investment in debt securities and unit trusts. Thus, the current measure had directly eased the pressure on the baht by at least $4.4 billion by January 2007. What is harder to estimate is how much additional funds would have flowed into Thailand without the URR and full hedge measures. Based on market intelligence and what has transpired in regional financial markets, a fair and conservative estimate would probably put the total reduction of pressure on the currency resulting from these measures at around $10 billion in 2007.15
Table 10
Thailand’s balance of payments and selected external sector indicators (2001–06)1
(Million USD) Average 2001-2004 2005 2006 2007P
Current A/C 4,338 –7,642 2,315 14,049 (% of GDP) 3.3% –4.3% 1.1% 5.7%
Capital and financial A/C1 –1,613 11,085 6,806 –2,413 (% of GDP) –1.4% 6.3% 2.1% –1.0%
Of which: Bank –165 222 –7,427 –1,121 (% of GDP) –0.2% 0.1% –3.6% –0.5% Of which: Private non-bank –1,924 9,340 14,721 2,768 (% of GDP) –1.5% 5.3% 7.1% 1.1%
Of which: Equity 3,548 7,245 11,892 13,810 (% of GDP) 2.5% 4.1% 5.7% 5.6% Of which: Debt2 –1,636 659 4,661 2,024 (% of GDP) –1.3% 0.4% 2.3% 0.8%
Balance of payments 2,857 5,422 12,742 17,102 International reserves1 40,988 52,066 66,985 87,455 Forward obligations1 1,810 3,840 6,941 19,086 External Debts1 57,516 52,039 59,643 61,738 1 Reinvested earnings (RE) included. 2 Including direct loans, other loans, and debt securities. P preliminary
Source: Bank of Thailand.
abroad but lack the credit line with domestic banks to enter into forward agreements as required under full hedge option, and (2) investors who may bring funds into Thailand under the URR, driven by expected arbitrage opportunities of the two-tiered exchange rates.
15 A further reduction of pressure on the baht was also achieved by the non-hedged portion of Thai residents’ investment outflows (see Section 5) and by the management of public debt including the acceleration of foreign debt repayment, the reduction in the hedging ratio and the shift to domestic financing.

BIS Papers No 44 449
Figure 13
Outstanding amount of funds subject to the URR measure and the full hedge requirement
0
1,000
2,000
3,000
4,000
5,000
6,000
7,000
Dec-06Jan-07
Feb-07Mar-07
Apr-07May-07
Jun-07Jul-07
Aug-07Sep-07
Oct-07Nov-07
Dec-07Jan-08
Mill
ion
US
D
FH Loans FH Bonds FH Unit trust URR*
* Total amount of funds that were subject to the URR
Source: Bank of Thailand.
Despite apparently reduced pressure from net inflows, there was continued upward pressure on the baht, mainly from the increased surplus in the current account, which reached 6.1% of GDP during 2007, the highest share since 2000. This surplus was the result of a combination of robust export performance,16 due largely to Thai exporters’ success in finding new markets, and subdued import growth caused by stagnant domestic investment spending. Therefore, the BOT still needed to intervene in the FX markets in order to allow the currency to strengthen in an orderly manner. As a result, net foreign reserves, which include both gross reserves and net long forward positions, reached $106 billion at end-2007. Nevertheless, the bottom line is that by reducing the amount of short-term inflows, the URR measure made FX intervention more effective in curbing excessive changes in the exchange rate. Furthermore, by reducing the amount of foreign exchange the BOT needed to purchase, the URR measure helped lessen the costs associated with sterilisation and reduced the risks that too much BOT bond issuance could have a significant impact on the yield curve.
(3) By slowing down the pace of baht appreciation, the URR measure provided time for the economy and the private sector to adjust to the large change in relative international prices in a more efficient and orderly manner. If the excessive pace of baht appreciation observed in 2006 had been allowed to continue in 2007, it probably would have led to a significant slowdown in overall economic growth and resulted in mass business closures and layoffs, threatening economic and financial stability. This scenario would have
16 Again, the impressive export performance in the face of baht appreciation has been uneven across sectors.
While the high-tech and resource-based manufacturing sectors have continued to enjoy reasonably high growth of export values, the labour-intensive manufacturing sector (excluding exports of unwrought gold) saw export values, in baht terms, contract by 3.9% over the first nine months of 2007.

450 BIS Papers No 44
been even more likely given that the contraction in private investment persisted during the first half of 2007. Instead, the measure contributed to the steady growth of overall exports, which in turn supported overall economic activity. The preliminary estimate of GDP growth in 2007 was around 4.8%, a satisfactory rate given all the domestic and external difficulties the Thai economy had to contend with.
The URR measure also afforded the business sector time to adjust business operations and strategies to the changing environment. Granted, some of the necessary operational adjustment would take quite some time, certainly more than just one year, to bear fruit, but the evidence indicates that the business sector responded earnestly to this competitive challenge by enhancing their risk management and improving their business operations. In terms of risk management, the amount of forward FX purchases by exporters to hedge FX risks rose,especially during the second half of 2006 through the first quarter of 2007 in both absolute terms and in terms of a percentage of overall export receipts. Surely, part of the increased hedging activities was attributable to expected baht appreciation, but the rise in the hedging ratio was still a welcome development as it indicated that an increasing number of exporters had realised the importance of hedging compared to in the past. It might well also have reflected better knowledge and access to hedging,17 as a result of the campaign by commercial banks and the central bank to promote FX risk management literacy, especially among SMEs, over the past few years. All of these efforts should help them manage their FX risk more efficiently in the future. With regard to short-term adjustments in business operations, the most frequently cited initiatives by exporters are trimming unnecessary costs and finding new markets. At least with respect to the latter, there have been signs of success since export values to the new markets such as the Middle East, China, India and the new EU countries all showed impressive growth in 2007, helping to reduce dependence on traditional export markets.
Figure 14
Bank’s forward FX positions with exporters and importers
Source: Bank of Thailand.
17 According to the BOT’s corporate survey on FX hedging behaviour (2005), the main obstacles to hedging
reported were the lack of knowledge, the lack of access and an improper attitude towards risk management. These problems were apparently more severe in the SME group compared to their larger counterparts.
%
3,000
4,000
5,000
6,000
7,000
8,000
9,000
10,000
11,000
12,000
13,000
Jan-
05
May
-05
Sep-
05
Jan-
06
May
-06
Sep-
06
Jan-
07
May
-07
Sep-
07
Exports (Bank Buy)Imports (Bank Sell)
Millions of USD URR
32%23%Exporter’s hedging ratio
30%33%Importer’s hedging ratio
Sep-07Nov-06

BIS Papers No 44 451
Potential costs of the URR measure While Thailand’s experience with the URR measure seems to indicate that it brought benefits by reducing inflows and slowing down the pace of baht appreciation, it certainly was no free lunch. By introducing additional costs to the funding of selected types of inflows into Thailand, the measure could have raised the overall cost of capital for Thai businesses and create inefficiencies owing to distortions in economic and financial decisions. There was also the issue of market confidence in policy direction with regard to capital account policy. To quantify these impacts would require a detailed analysis of data and information beyond the scope of this paper. However, this subsection provides a preliminary discussion of the three areas in which the URR measure and the full hedge requirement could have had undesirable effects on the Thai economy: (1) the cost of capital, (2) the two-tier FX market and (3) market confidence.
(1) Higher cost of capital and distortions in financial and economic decisions The URR measure required that 30% of the funds from abroad for the purpose of loans, debt securities and unit trusts be deposited at commercial banks for one year without interest payments. In effect, the measure raised the cost of funding from abroad through these channels. The added costs were relatively high for short-term flows and declined with a longer investment horizon. Whether the measure raised the overall cost of funding significantly or not also depends on many other related factors, particularly the availability of alternative sources of funding. In 2007, there were reasons to believe that under liquidity conditions in Thailand at that time, the impact of the URR measure on the overall cost of capital to the business sector thus far had been minimal. First, there was still ample liquidity in the banking sector to accommodate firms that might want to switch from external to domestic financing without much difference in the cost of funds. In addition, in contrast to past situations, Thailand’s current account had been in surplus, implying that, at least for the moment, the economy did not depend on external financing to close its financing gap. Second, any potential increase in the cost of capital due to the URR measure was further alleviated by the gradual decline in the policy interest rate during 2007, from 5% to 3.25%. Third, investors had the option to fully hedge their FX positions, instead of putting up the 30% in reserves. Indeed, information collected by the BOT indicates that the majority of funds subject to the measure in 2007 chose the full hedge option, with only a relatively small number choosing the reserve requirement option. Thus, the option of full hedge did play an important role in minimising the URR’s impact on the cost of capital.
However, the full hedge requirement for loans did introduce new inefficiencies in terms of possible overhedging, especially by firms with some degree of natural hedge. Also, the information also reveals that firms that chose the reserve requirement over the full hedge option tended to be smaller ones with difficulties securing credit lines with local commercial banks to enter into forward contracts.18 To further alleviate the burden of overhedging on small firms and reduce the cost of capital, the BOT announced a further relaxation of the measure on 18 December 2007 which included: (1) lowering the hedging ratio for external loans taken out by firms with natural hedge by the extent that its FX exposure had already been covered by future foreign currency earning, and (2) waiving any loans less than $1 million and with maturity of at least one year.
18 The fact that, in some respects, smaller firms tend to suffer more from the capital control than their larger
counterparts is consistent with the findings from other countries’ experiences.

452 BIS Papers No 44
(2) The two-tier FX market The URR created a two-tier FX market in which the baht was more expensive in the offshore than the onshore market. Though almost all FX transactions involving baht were settled onshore, the discrepancy in the two rates occasionally created confusion among exporters that led to panic selling of the dollar, especially during the initial period after URR implementation. Some market participants were also concerned that the offshore rate might serve as a psychological reference point for investors with respect to where the baht would be heading in the future – which could lead to a self-fulfilling prophecy, where the onshore baht rate is expected to move towards the more expensive offshore rate.
Figure 15
The two-tier FX market after the implementation of URR
2929.5
3030.5
3131.5
3232.5
3333.5
3434.5
3535.5
3636.5
3737.5
3838.5
3939.5
4040.5
4141.5
4242.5
43
Jan-
05
Feb-
05
Mar
-05
Apr-
05
May
-05
Jun-
05
Jul-0
5
Aug
-05
Sep-
05
Oct
-05
Nov
-05
Dec-
05
Jan-
06
Mar
-06
Apr-
06
May
-06
Jun-
06
Jul-0
6
Aug
-06
Sep-
06
Oct
-06
Nov
-06
Dec-
06
Jan-
07
Feb-
07
Mar
-07
May
-07
Jun-
07
Jul-0
7
Aug
-07
Sep-
07
Oct
-07
Nov
-07
onshore
offshore
Baht/$
Source: Bank of Thailand.
(3) Impact on investor confidence The most potential significant cost of the adoption of the URR measure was probably its impact on investor confidence. Needless to say, these types of issues are very difficult to assess in the short run. Granted, most initial commentaries on the URR implementation were negative, based mainly on the large fall of the SET index on the first trading day following the announcement of the measure. The index dropped from 730.55 at the end of 18 December 2006 to 622.14 the next day, driven by a record 25 billion baht one-day sell-off by foreign investors. Many predicted it would take a long time to attract foreign investors back to the Thai stock markets, but this was not the case. The day after the announced exemption of investment in the stock markets from the URR measure, the SET index recouped a large part of its initial loss, and over the following few months it gradually increased and finally surpassed its pre-URR level in May 2007. The SET index recovery was supported by large inflows from foreign investors, attracted by a relatively low P/E ratio and the anticipated resolution of political uncertainties. Indeed, between 20 December 2006 and the end of 2007, foreign investors had cumulative net buy positions in the SET of more than 49 billion baht. Thus, the initial adverse impact on investor confidence seem largely to have steadily subsided over time.

BIS Papers No 44 453
Figure 16
SET index and non-residents’ net buy position in the Stock Exchange of Thailand
-25,000
-20,000
-15,000
-10,000
-5,000
0
5,000
10,000
01-S
ep2-O
ct
31-O
ct
28-N
ov
28-D
ec
29-Ja
n
26-F
eb
27-M
ar
27-A
pr
29-M
ay
27-Ju
n25
-Jul
24-A
ug
21-S
ep
19-O
ct
19-N
ov600625650675700725750775800825850875900925
SET IndexMillion Baht
SET Index (RHS)
Nonresident’s Net Buy Position
Source: Stock Exchange of Thailand.
The BOT knew there would be costs associated with the implementation of capital controls, mostly related to the inefficiency in economic and financial decisions. This is why the URR (a price-based measure) was chosen over other quantity-based measures to minimise potential distortionary effects. Once it was implemented, the BOT monitored the situations closely and chose to gradually relax some aspects of the measure in order to mitigate the burden and inefficiencies inflicted on the business sector, while keeping the essence of the measure in place. However, based on other countries’ experiences, the adverse impacts of capital control measures grow over time in terms of the distortions they may cause in financial decisions. The BOT thus communicated clearly to the markets its intention to employ the URR only on a temporary basis, to give the economy time to adjust to the large change in the exchange rate in a more efficient and orderly manner. Thailand has always been committed to the stepped and gradual liberalisation of capital flows to facilitate the process of financial integration with the global markets. However, removal of the measures must be carried out with the appropriate timing and under the right conditions.
5. Removal of the URR measure
Fourteen months after its introduction, the URR measure was lifted, on 3 March 2008. The decision to do so was in line with the BOT’s intention to adopt the measure only temporarily and after carefully ensuring that the appropriate conditions and timing were met to ensure a smooth transition. Chief among the key factors leading to the decision was the fact that the economic expansion had become more balanced, with improvement in domestic demand and continued robust export performance. In addition, more balanced FX flows, additional policy tools for liquidity management, and supporting fiscal policies on the part of the government also contributed to the conclusion that the authority would be in a better position to curb excessive currency movements effectively and that the economy would be able to cope with potential currency volatility more efficiently. Details of each of the reasons for the decision are described below.

454 BIS Papers No 44
More balanced growth. Economic data in the fourth quarter of 2007 and January 2008 indicated a healthier recovery in domestic demand along with continued export expansion. Figure 17 shows that the private consumption and the private investment index bottomed out in Q2 2007, leading to an increase in the contribution to growth from domestic demand in Q3 2007. Both indices continued to rise sharply during the last quarter of 2007 and into January of 2008 (except for a single decline in private consumption index in December 2007), partly due to lower interest rates and an improved political outlook after the establishment of the new government early in 2008. Additional fiscal stimuli, such as public infrastructure investment in mega-projects, will lend further support to continuing domestic demand recovery. Greater investment spending will also lead to an increase in imported capital goods, which would help the current account be more balanced, thus further reducing the upward pressure on the baht.
Figure 17
Signs of domestic demand recovery
-5
0
5
10
15
20
25
Jan2003
Jul Jan2004
Jul Jan2005
Jul Jan2006
Jul Jan2007
Jul Jan2008
Private Consumption Index
% PCI Growth (RHS)
% YOY
Contribution to GDP growth%
-6
-3
0
3
6
9
12
15
Q12002
Q3 Q12003
Q3 Q12004
Q3 Q12005
Q3 Q12006
Q3 Q12007
Q3
Private consumption Private investment
Government spending Net exports
GDP
Private Consumption Index (PCI) and Private Investment Index (PII)
Sources: Bank of Thailand; NESDB.
In addition to rising domestic demand, exports continued to expand briskly despite the baht appreciation, further stimulating economic growth while lessening the earlier fear of a sharp slowdown in exports. As illustrated in Figure 18, growth in export value has accelerated since mid-2007, reaching 33.6% year on year in January 2008. This reflects exporters’ ability to compete and adjust to the new environment through greater use of foreign exchange hedging and improvements in production efficiency, management and market diversification. In terms of market diversification, the recent period has seen Thai exporters finding new markets for their products and selling to a wider range of markets, particularly in the Middle East, India and new EU member countries, as shown in Table 11.19 Expansion of the new export markets as well as enhanced risk management on the part of exporters will continue to support export growth and strengthen the resiliency of the Thai external sector to exchange rate variability.
19 The new EU countries include Bulgaria, Cyprus, the Czech Republic, Estonia, Hungary, Latvia, Lithuania,
Malta, Poland, Romania, Slovakia and Slovenia.

BIS Papers No 44 455
Figure 18
Continued robust export performance
-15 -10 -5 05
10152025303540
Jan2001
Jul Jan2002
Jul Jan2003
Jul Jan2004
Jul Jan2005
Jul Jan2006
Jul Jan2007
Jul Jan2008
export growth (%YOY)
Source: Bank of Thailand.
Table 11
Export shares and growth, by market
Share (%) Growth (% yoy) Country
2006 2007 Jan 2008 2006 2007 Jan 2008
Japan 12.6 11.9 10.9 8.6 10.6 11.3
United States 15 12.6 11.5 14.4 –1.2 16
EU (27) 13.9 14 13.8 19.2 18.4 23.8
New EU 0.9 1.2 1.2 40.4 60.4 53.9
ASEAN: 20.8 21.3 22 10.8 20.4 43.8
Middle East 4.4 4.9 4.7 28 30 48.8
Australia 3.4 3.8 4.6 37 31.6 54.3
China 9 9.7 9.9 27.9 26.5 45.5
Hong Kong SAR 5.5 5.7 6.2 16.2 21.2 57.7
India 1.4 1.7 1.7 18.3 47.2 37.7
New Zealand 0.4 0.4 0.4 0.8 17.1 18.5
Taiwan (China) 2.6 2.2 1.8 23.7 –1.4 –17.5
All (customs) 100 100 100 16.9 17.5 33.3
Foreign exchange flows had become more balanced as a result of moderating trade account surpluses, increasing the amount of Thai investment abroad, and regulations that permit residents to deposit foreign currencies effective early February 2008. Moderation in trade surpluses in December 2007 and January 2008 was largely due to an increase in import volume of consumer and capital goods in tandem with rising domestic demand. This toned down foreign exchange inflows.
Meanwhile, capital outflows in terms of portfolio and direct investment have increased significantly as measures to stimulate outflows have become effective. Recent key measures include the January 2007 announcement that qualified institutional investors wishing to invest

456 BIS Papers No 44
in securities abroad in amounts not exceeding $50 million per fund could do so without having to seek approval from the BOT. This measure was meant to reduce policy uncertainty and send out a clear policy signal to institutional investors so that they could plan their trading strategies and capacity-building more effectively. In addition, in August 2007 the BOT allowed private funds to invest abroad and agreed to grant a quota of up to $10 billion to the SEC to be allocated among mutual funds, securities companies, provident funds and private funds.20 The types of foreign investment products have also been expanded to include foreign securities listed in the Thai capital markets. This greater availability of foreign financial products and investment opportunities would enable Thai investors to diversify their portfolios more efficiently.
The above initiatives to further liberalise capital outflows resulted in an acceleration of portfolio outflows by Thai residents in 2007. The data in Figure 19 show that portfolio outflows through institutional investors increased substantially in the second half of that year and into January 2008, with an outstanding amount in January 2008 of roughly $13 billion, a marked increase from $2.5 billion at the beginning of 2007. Most of the increase in outflows was attributable to shifts from bank deposits to foreign investment funds that invest in foreign fixed income instruments, with most FX exposure being hedged. This can be viewed as depositors’ attempts to seek higher yields through the new foreign investment channel compared to what they earn from domestic deposits.21
Figure 19
Outstanding amount of portfolio investment abroad through institutional investors1
0
2,000
4,000
6,000
8,000
10,000
12,000
14,000
Jan Feb Mar Apr May Jun Jul Aug Sep Oct Nov Dec
$ Million
฿0
฿50
฿100
฿150
฿200
฿250
฿300
฿350
฿400
฿450
YOY %
2006 Level 2007 Level % YOY (RHS)
2,657
12,980
1 Qualified institutional investors include mutual funds, pension funds, the Social Security Fund, the Government Pension Fund, insurance companies, specialised financial institutions and securities companies.
Source: Bank of Thailand.
20 This quota was later extended to $30 billion on 3 March 2008, as a supporting measure to help manage the
capital flows after the lifting of the URR. 21 However, the hedged portion of the outflows will not necessarily relieve the upward pressure on the baht, as
the weakening pressure on the currency from the outflows was cancelled out by the opposite pressure from forward purchases of the baht. Thus, the increase in overall outflows will provide relief directly only for the portion that is unhedged, and indirectly to the extent that it may influence market psychology regarding the future direction of the baht. Going forward, based on other countries’ experiences, it is likely that the hedging ratio of portfolio outflows will decline as the share of equity investment increases and investors become more selective in their hedging strategy.

BIS Papers No 44 457
Regarding outward direct investment, the BOT has further reduced restrictions to facilitate the expansion of Thai businesses abroad as well as the financial management of multinationals operating in Thailand. The new regulation introduced in 2007 allows a parent company (a subsidiary company) in Thailand to invest in, or lend to, its subsidiary company22 (a parent company23) abroad in an aggregated amount not exceeding $100 million per year, up from the $50 million limit imposed by the previous regulation. In addition, under the new rule, companies registered in the main board of the SET are free to invest abroad with no limit and can lend abroad up to $100 million per year without approval from the BOT. This relaxation of direct investment regulations and the more outward-looking focus of Thai businesses resulted in a sharp increase in outward direct investment in 2007, equivalent to 123% year-on-year growth (Table 12).
Table 12
Capital outflows, 2006–07
Millions of US dollars 2006 2007 ∆% yoy
Thai direct investments (1) 639 1,422 122.54
– investment in a subsidiary company1 639 1,394 118.15
– investment in a parent company2 – 28 –
Thai loans (2) 574 741 29.09
– extended to a subsidiary company1 462 581 25.76
– extended to a parent company2 112 160 42.86
Property investment abroad (3) 24 54 125.00
Total (1) + (2) + (3) 1,237 2,217 79.22 1 Subsidiary company here refers to a foreign company of which at least 10% of shares are held or owned by a Thai parent company. 2 Parent company here refers to a foreign company that holds at least 10% of total shares of a domestic subsidiary company.
Besides outflow liberalisation, foreign exchange regulations were also relaxed to help Thai corporations and households manage their financial positions more efficiently. Key regulatory changes introduced in 2007 include the extension of the repatriation period for income earned abroad from 120 to 360 days, the abolishment of the surrender requirement so that those with income from abroad were no longer required to sell their foreign currency income to a bank within any time limit, the removal of the limit on foreign currency deposits for those with income from abroad and, for the first time, permission for those without income from abroad to open a foreign currency deposit account with an imposed limit. See Appendix 1 for a chronology of the relaxations of controls on capital outflows.
This rapid increase in overall outward investment brought about more balanced flows, which helped reduce the upward pressure on the baht and thus created an appropriate environment for removing the URR measure. To further encourage portfolio investment abroad and facilitate capital flow management, upon the announcement of the URR removal on 29 February 2008, the BOT increased the foreign investment limit for the SEC from $10 billion to $30 billion, to be allocated among domestic institutional investors. Going
22 A foreign company of which at least 10% of shares are held or owned by a Thai parent company. 23 A foreign company that holds at least 10% of total shares of a domestic subsidiary company.

458 BIS Papers No 44
forward, the Bank will continue to further liberalise capital outflows, with priority being placed on proper pacing and sequencing of regulatory relaxation to ensure maximum benefits while minimising associated risks. To strengthen market infrastructure, efforts and resources will also be devoted to enhancing retail investors’ financial literacy and upgrading institutional investors’ capability to invest abroad and manage risk effectively as well as strengthening retail investor protection through improved information disclosure.
The BOT has more instruments to manage liquidity and the currency under the new Bank of Thailand Act. The new BOT Act, passed in early 2008 by the National Legislative Assembly, will give the central bank more flexibility in managing liquidity and reserves. It will grant the BOT an additional instrument for managing liquidity through the acceptance of deposits from commercial banks, for which the Bank will pay market-determined interest rate. Thus, these added options will diversify the channels in which the Bank manages liquidity in the system, thus helping reduce the risks of over-reliance on BOT bond issuance, which could impact on the yield curve.
The progress on a number of policy fronts discussed above allows us to infer that the Thai economy is now more ready to cope with greater flows and FX volatility compared to the pre-URR period. Before the measure was lifted, market participants adjusted their behaviour in line with expectations that the URR would be removed, which eroded its effectiveness. After carefully considering the changes in the environment and internal and external factors, the BOT decided at the end of February 2008 that it was the appropriate time to lift the measure. Since 3 March, financial institutions have been able to purchase or exchange foreign currencies against the baht from their customers in full amounts without withholding 30% of the foreign currencies as reserves in all cases. Customers whose foreign currencies were withheld as reserves can make a request to the BOT through financial institutions for a full refund, unremunerated, without having to prove that the funds remained in Thailand for at least one year.24 Customers who hedge their foreign exchange risks for exemption from the URR and wish to unwind their hedging contracts can submit a request to the Bank through financial institutions on a case by case basis, which the BOT will consider for approval within 15 working days.
In addition to the above-mentioned relaxation of outflows through the extension of the SEC quota to $30 billion, the BOT also announced the following measures on 29 February in order to smooth out the adjustment process after the lifting of the URR.
1. To improve the measures to prevent baht speculation:
• Revision of the rule on domestic financial institutions borrowing baht from non-residents by reducing the limit for transactions with no underlying trade or investment for all maturities to no more than a 10 million baht outstanding balance per group of non-residents.
• Revision of the regulations regarding the provision of baht liquidity by domestic financial institutions to non-residents by expanding each institution’s limits for transactions with no underlying trade or investment to no more than a 300 million baht outstanding balance per groups of non-residents.
24 The BOT will remit the funds to financial institutions on the seventh working day from the date requests are
received. If customers do not request a refund within two years of the date the reserves were withheld, the reserves will be considered forfeited and be earmarked for public benefit.

BIS Papers No 44 459
2. To streamline the rules for Non-resident Baht Accounts:
• Revision of the structure of the Non-resident Baht Account (NRBA) by dividing it into the Non-resident Baht Account for Securities (NRBS) and the Non-resident Baht Account (NRBA). Under the new structure, the transfer of baht between the same types of accounts is allowed while the transfer between different types of account is prohibited.
The BOT has also launched the following temporary programmes to support the adjustment and improve the production efficiency of small and medium-sized enterprises (SMEs):
1. A programme to support the improvement of SMEs’ production efficiency by providing soft loans through financial institutions totalling 40,000 million baht for a period of three years.
2. A facility to purchase (back-to-back) foreign currency that SMEs sold forward to financial institutions for a period of six months.
The market took the lifting of the URR measure quite well, as there were no significant unexpected movements in the stock, bond or foreign exchange markets following the BOT’s announcement.25 This smooth and orderly transition came thanks mainly to the credible and well oriented package of policies that not only succeeded in deterring short-term speculative inflows but also prepared the economy and the private sector to better withstand fluctuations in relative international prices. Moreover, the clear signal from the BOT to actively manage surges in capital flows also helped prevent further speculative attempts. However, there is no reason for complacency. Several risks remain for the Thai economy – a major one being the ongoing subprime crisis in the United States, which might slow down global economic growth much more than expected, adversely affecting Thai export growth and possibly driving more capital inflows into Thailand and other regional economies. Rising oil prices might also threaten domestic economic stability and deteriorate global economic growth. The BOT will continue to monitor internal and external conditions closely to ensure timely and appropriate policy response to any shock that might adversely impact the Thai economy.
6. Conclusion
The experience of coping with volatile flows and currency movements over the past few years has highlighted the significant challenges that Thailand and other emerging markets must face in the era of greater financial integration. The effectiveness of various conventional tools to manage the impact of capital inflows proved to be limited in the midst of a surge in inflows. The adoption of capital controls such as the URR measure could be a policy option under certain circumstances, but careful consideration must be paid to specific implementation plans to minimise potential adverse impacts on the markets and long-term microeconomic costs to the economy. It is important to realise that the central bank’s ability to manage the movement of capital flows and the exchange rate is rather limited, especially against the background of increased integration of global financial markets. The priority going forward must then be to implement reforms that will strengthen economic resiliency against flows and currency volatility.
Progress has been made in many areas which should help the Thai economy to be more resilient to potential volatility of capital flows and the exchange rate in the future. Outflow investments have risen, bringing more balance to the net flows as well as reaping the
25 The baht appreciated from 32.01 to 31.70 against the US dollar the day after the announcement of the URR
removal.

460 BIS Papers No 44
benefits of international diversification, following the relaxation of outflow restrictions. Greater use of financial hedging instruments as well as further regulatory relaxations on FX transactions should lead to more efficient financial and risk management in the business sector. Going forward, it is imperative that both the public and the private sectors continue to strengthen the resiliency of the Thai economy in preparing for increased risks associated with greater financial integration. The main efforts would include upgrading risk management practices among all economic sectors through the promotion of financial literacy as well as the development of efficient hedging instruments; deepening the financial and capital markets through institutional reforms and enhanced corporate governance; improving the quality and timeliness of data on capital flows and FX transactions; and enhancing Thailand’s productivity and competitiveness by creating more a favourable investment climate and upgrading the quality of human resources and public infrastructure.

BIS P
apers No 44
461
Appendix 1
Selected measures and relaxation of controls on capital outflows and FX regulations, 2002–08
Issue date Direct investment abroad Portfolio investment abroad Foreign currency deposit (FCD) Others
2002 Mutual funds are allowed to make portfolio investments abroad of up to $200mn total per year.
2003 Upon approval by the BOT, six types of institutional investors1 are allowed to invest abroad, in: (1) debt securities issued by the Thai government and corporates, and (2) sovereign and quasi-sovereign debt instruments issued by non-residents, subject to annual limits set by the authorities.
April 2005 The range of securities the six types of institutional investors1 are allowed to invest in is extended to include: (1) invest-ment grade debt securities issued by non-resident international organisations, and (2) investment units of foreign unit trusts supervised by securities agencies that are members of the IOSCO,2 or investment units issued in countries with securities exchanges that are members of the WFE,3 excluding investment units of hedge funds.
For footnotes, see the end of the table.

462 B
IS Papers N
o 44
Selected measures and relaxation of controls on capital outflows and FX regulations, 2002–08 (cont)
Issue date Direct investment abroad Portfolio investment abroad Foreign currency deposit (FCD) Others
10 May 2006
The amount of FCDs’ outstanding balance for a juristic person is extended, to foreign currency (FC) earnings and future FX obligations between $10mn and $50mn.
Individual Juristic person
With obligations within six months
$1mn $50mn
Extends permission to open FCD accounts to individuals and juristic persons with FC earnings, but without future foreign exchange obligations. Individual Juristic
person With obligations within six months
$1mn $50mn
12 Jan 2007
Thai parent companies4 are allowed to invest in or lend to subsidiary and affiliated companies abroad up to $50mn per company per year (previously $10mn). Thai subsidiary companies5 are allowed to invest or lend to their parent and affiliated companies up to $20mn per company per year (previously $5mn).
Seven types of institutional investors6 are allowed to invest in Thai securities issued abroad with no limit, and in foreign secu-rities abroad up to an outstanding balance of $50mn per fund with no prior approval. An eligible institutional investor wishing to create a fund that invests in foreign securities abroad with an outstanding balance beyond $50mn may seek approval from the BOT or the SEC, depending on assigned jurisdiction.
Without obligations
$0.05mn $2mn
1 Apr 2007
The BOT approves a quota of $3bn to the SEC to be allocated to foreign juristic persons, with certain qualifications, for issuing securities in the Thai stock market.
For footnotes, see the end of the table.

BIS P
apers No 44
463
Selected measures and relaxation of controls on capital outflows and FX regulations, 2002–08 (cont)
Issue date Direct investment abroad Portfolio investment abroad Foreign currency deposit (FCD) Others
24 Jul 2007
Companies listed on the Stock Exchange of Thailand with positive net worth and which are not under rehabilitation can invest abroad up to $100mn per year (previously $50mn).
– Residents with funds originated abroad regardless of sources may deposit foreign currencies with financial institutions in Thailand according to the following rules:
The limit of fund remittances by Thai residents to a family member who is a permanent resident abroad is raised to $1mn.
Individual Juristic person
With obligations within 12 months
$1mn $100mn
Repatriation requirement: extends the duration within which Thai residents with foreign currency receipts must bring such receipts into Thailand, from 120 to 360 days.
Without obligations
$0.1mn $5mn Surrender requirement is extended from 15 to 360 days.
– Residents with foreign currency funds originated within the country can deposit them with financial institutions in Thailand according to the following rules:
Individual Juristic person
With obligations within 12 months
$0.5mn $50mn
1 Aug 2007
The BOT approves a quota of $10bn to the SEC to be allocated among mutual, pension and private funds for purchasing securities abroad. The quota can also be applied to foreign securities issued in the Thai markets such as cross-listing products or Transferable Custody Receipts (TCR).
Without obligations
$0.05mn $0.2mn

464 B
IS Papers N
o 44
Selected measures and relaxation of controls on capital outflows and FX regulations, 2002–08 (cont)
Issue date Direct investment abroad Portfolio investment abroad Foreign currency deposit (FCD) Others
17 Dec 2007
– Thai parent companies4 are allowed to invest in or lend to their subsidiary and affiliated companies abroad up to $100mn per year.
– Removing any limit on FCDs as long as the funds are originated abroad for both individuals and juristic persons.
Increases the limit for purchases of properties abroad from $1mn to $5mn.
– Thai subsidiary companies5 are allowed to invest or lend to their parent and affiliated companies up to $100mn per company per year.
– Raising the limit on FCDs for residents with foreign currency funds originated domestically (below).
– Companies listed on the Stock Exchange of Thailand (SET) are free to invest abroad with no limit, and can lend abroad, in accordance with the two points above, up to $100mn per year.
Funds originated domes-tically
– With obligations within 12 months
Not exceeding $1mn or with obli-gations not exceeding 12 months
Not exceeding $100mn or with obli-gations not exceeding 12 months
– Without obligations
$0.1mn $0.3mn
For footnotes, see the end of the table.

BIS P
apers No 44
465
Selected measures and relaxation of controls on capital outflows and FX regulations, 2002–08 (cont)
Issue date Direct investment abroad Portfolio investment abroad Foreign currency deposit (FCD) Others
3 Mar 08 The BOT increases the foreign portfolio investment quota for the SEC to $30bn, to be allocated to pension and private funds for purchasing securities abroad.
1 Government pension funds, social security funds, provident funds, mutual funds (excluding private funds), insurance companies and specialised financial institutions. 2 International Organization of Securities Commissions. 3 World Federation of Exchanges. 4 Parent company here refers to a foreign company which holds or owns at least 10% of the total shares of a domestic subsidiary company. 5 Subsidiary company here refers to a foreign company of which 10% of shares are held or owned by a Thai parent company. 6 Includes the six types of institutional investors previously eligible to invest abroad, plus securities companies.


BIS Papers No 44 467
Capital flows to Turkey: financial implications and policy responses
Mehmet Yörükoğlu and Ali Çufadar
1. Introduction
In recent years, capital inflows to almost all emerging countries have significantly increased. While it is possible to identify a number of push factors as the driving forces behind this development, country-specific pull factors have also played an important role. Indeed, most emerging countries have improved their macroeconomic stability by implementing sound monetary and fiscal policies and intensive structural reforms. This surge in capital inflows to the emerging economies has on the one hand supported economic growth but on the other hand introduced challenges for the policymakers of emerging economies with regard to monetary and financial stability.
Since the deep economic and financial crisis of 2001, Turkey has been one of the emerging countries that has improved its economic fundamentals by implementing sound monetary and fiscal policies and has received intensive capital inflows. This paper aims to discuss the structural changes that took place in capital inflows to Turkey, the implications of these inflows for the financial system and potential policy responses.
2. Macroeconomic developments
The historical data clearly reveal that 2002 was a turning point in recent Turkish economic history. After 2002, Turkey started a new IMF- and World Bank-endorsed stabilisation programme with strong disinflation, fiscal discipline and structural reforms in the banking system and privatisation targets. In addition to the stabilisation programme, the European Union (EU) convergence process has backed both the political and structural reforms as in December 2004 the European Council accepted 3 October 2005 as the start date of accession negotiations. The new framework of EU integration has anchored both political and structural reforms that have facilitated strong improvements in longer-term expectations and confidence in the sustainability of the reforms.
Table 1 Main trends in Turkish economy
Averages 1984–90 1991–2001 2002–07
Inflation 54.5 75.9 13.9 Standard deviation 14.9 21.6 8.7 GDP growth 5.7 2.9 6.8 Standard deviation 3.6 5.4 1.9 Total investment annual change 9.7 1.9 15.9 Private investment, annual change 13.1 2.4 18.4 Primary surplus/GNP –0.3 1.8 4.6 Productivity growth n/a 5.8 6.8 Privatisation revenues (total, USD billions) 0.5 6.8 22.5
Sources: TURKSTAT; Treasury; Central Bank of the Republic of Turkey (CBRT).

468 BIS Papers No 44
As a result of strong commitments to the targets of the programme, these policies have yielded impressive disinflation, an increase in growth potential and improvements in most other macroeconomic variables. The average GDP growth rate increased from only 2.9% in the 1990s and early 2000s to 6.8% during 2002–07. Output volatility (measured as the standard deviation of growth) also fell over the same period from 5.4% to only 1.9%. Moreover, the average inflation rate declined from 75.9% in the 1990s and early 2000s to 13.9% in 2002–07 (Table 1).
The improvements and the trends can be better analysed with year-over-year data, as shown in Table 2.
Table 2
Main macroeconomic indicators (2001–07)
2001 2002 2003 2004 2005 2006 2007
Inflation 68.5 29.7 18.4 9.3 7.7 9.6 8.4
GDP growth –5.7 6.2 5.3 9.4 8.4 6.9 4.5
Total investment annual change –30.0 14.7 14.2 28.4 17.4 13.3 3.4
Primary surplus/GDP 5.1 4.0 4.9 5.5 5.1 4.6 3.5
PSBR/GDP 12.2 10.0 7.3 3.6 –0.3 –2.0 0.0
Real interest rates (ex post) 26.3 12.0 16.3 12.5 7.5 7.5 8.9
Net public sector debt stock/ GDP 66.5 61.5 55.1 49.1 41.7 34.2 29.1
Net domestic debt/GDP 38.9 36.3 37.9 35.7 35.2 30.2 27.8
Net external debt/GDP 27.6 25.2 17.2 13.4 6.5 4.0 1.3
Current account balance/GDP 1.9 –0.3 –2.5 –3.7 –4.6 –6.1 –5.7
Sources: TURKSTAT; CBRT; SPO; Treasury.
In the last six years, sustained fiscal discipline that yielded a 5% primary surplus on average has been the leading factor in the success of the programme. During this period, the resulting high economic growth has been mainly driven by rapid growth in private investment and a significant increase in manufacturing sector productivity. In addition to a notable increase in growth, the inflation rate has declined gradually from 70% to single digits. As fiscal discipline and privatisation have reduced the public sector pressure on interest rates and monetary policy oriented towards price stability reduced the inflation risk premium, real interest rates have declined to single digits from the last decade’s average of more than 20%. Relatively lower interest rates, privatisation and fiscal discipline have helped the public sector borrowing requirement vanish, from around 10% of GDP towards a current situation in which net debt payments are implemented. As a result of these developments, the ratio of public sector net debt stock to GDP declined from 67% in 2001 to 29% in 2007. Even as the net domestic debt-to-GDP ratio declined from 38.9% to 27.8%, the net external debt stock-to-GDP ratio declined from 27.6% to 1.3%. This impressive macroeconomic performance suggests that although global liquidity conditions have supported capital inflows to the country, the main determinant has been (favourable) country-specific factors.

BIS Papers No 44 469
3. General trends in capital flows to Turkey
Although the capital account in Turkey was fully liberalised in 1989, the weak economic performance of the economy and the volatile nature of Turkish financial markets, together with general volatility in emerging markets, had prevented significant and sustained capital inflows to the country.
Table 3
General trends in balance of payments statistics
Balance of payments developments (total in billions of US dollars) 1984–
90 1991–
99 2000–
01 2002 2003 2004 2005 2006 2007 2002–07
Current account –4.8 –10.9 –6.2 –0.6 –7.5 –14.4 –22.1 –31.9 –37.6 –114.2Capital and financial account 9.1 27.9 8.6 7.6 7.1 14.2 38.1 38.2 44.5 149.8Foreign direct investments 2.2 5.4 3.0 1.0 1.3 2.0 9.0 19.1 19.9 52.2
Inflow 2.2 7.8 5.3 1.2 1.8 2.9 10.4 21.4 22.9 60.7Outflow 0.0 –2.4 –2.4 –0.3 –0.5 –0.9 –1.4 –2.3 –3.0 –8.5
Portfolio investments 0.1 0.2 –8.5 0.9 2.5 7.5 11.6 8.1 1.9 32.4
Stocks 0.1 2.4 0.4 0.0 0.9 1.4 5.7 1.9 5.1 15.1Domestic government securities 0.0 –2.1 –8.9 0.9 1.6 6.0 5.9 6.1 –3.3 17.4
Banking system 2.8 –2.4 –8.1 –3.2 2.1 0.6 8.7 –3.1 –1.4 3.6
Assets (securities and FX assets) –2.4 –13.8 –1.7 –0.8 –0.2 –6.6 –1.6 –14.0 –5.3 –28.7Liabilities (deposits and credits) 5.2 11.4 –6.3 –2.4 2.3 7.2 10.4 11.0 3.9 32.3
Non-bank sectors 7.1 20.7 3.0 0.9 1.6 7.2 13.8 17.3 28.7 69.5Public sector and central bank –3.0 4.0 19.2 8.0 –0.3 –3.0 –4.9 –3.2 –4.5 –8.0
IMF –1.8 0.9 13.6 6.4 –0.1 –3.5 –5.4 –4.5 –4.0 –11.1Other –1.2 3.0 5.6 1.6 –0.2 0.5 0.4 1.3 –0.6 3.1
Net errors and omissions 0.0 3.0 –4.8 –0.8 4.4 1.0 1.8 –0.2 1.1 7.4Change in reserves1 –4.3 –20.0 2.3 –6.2 –4.0 –0.8 –17.8 –6.1 –8.0 –43.01 Negative figures show an increase in reserves.
Source: CBRT.

470 BIS Papers No 44
After 2002, thanks partly to favourable global liquidity conditions, but mainly to the economic transformation process of the Turkish economy, the amount and structure of foreign capital flows changed significantly. Foreign direct investment, private sector external borrowing and portfolio inflows increased steadily, as shown in Table 3.
(a) Foreign direct investment The most dramatic change in capital account items in recent years occurred in foreign direct investment (FDI). While total net FDI during the 1984–2001 period was only USD 10.6 billion, it increased to USD 52.2 billion in the last six years. Although the current account balance has worsened, the rapid increase in FDI after 2005 somewhat eased the concerns due to its non-debt nature and positive effect on the productive and competitive capacity of the Turkish economy. The prospects for EU accession and convergence expectations have also played an important role in increasing FDI flows to the country.
For the time being, FDI inflows to Turkey are concentrated in the banking system and other service sectors such as telecommunications (Table 4). But considering the experience of other emerging countries, FDI inflows are expected to continue and spread to a broad range of industries through mergers and acquisitions and greenfield investments as the sound monetary and fiscal policies and the reform process of the country continue.
Table 4
Foreign direct investment by sector In millions of US dollars
2002 2003 2004 2005 2006 2007
Banking 260 51 69 4,018 6,957 11,439
Other services 250 231 852 3,685 8,688 3,263
Manufacturing 110 448 190 785 1,866 4,207
Other 2 15 79 47 128 338
Total 622 745 1,190 8,535 17,639 19,247
Source: Treasury.
(b) Portfolio flows Until 2003, the instability of financial markets had limited foreign investor participation in bond (mainly domestic government securities) and stock markets. However, foreign portfolio inflows to bond and stock markets increased to USD 32.4 billion by 2007.
The portfolio inflows consist of three items: (i) investments in stock markets; (ii) investments in bond markets; and (iii) investments in money markets. The money market investments of foreigners consist of swaps, deposits and credit transactions with domestic banks. Although investments in stock and securities markets are shown in the portfolio investment item in balance of payments statistics, money market transactions are generally shown under the assets and liabilities of the banking sector. In recent years, the volume of TRY swap and credit transactions increased to USD 17.2 billion. By adding USD 17.2 billion in money market transactions to the portfolio inflows, the cumulative sum of portfolio inflows reached USD 49.6 billion in the last six years (Table 5).

BIS Papers No 44 471
Table 5
Net foreign portfolio inflows In billions of US dollars
2002 2003 2004 2005 2006 2007
Stocks 0.0 0.9 1.4 5.7 1.9 5.1
Government securities 0.9 1.6 6.0 5.9 6.1 –3.3
Money market instruments 0.0 0.2 0.1 4.7 6.5 5.7
Total 0.9 2.7 7.5 16.3 14.6 7.6
Source: CBRT.
(c) Other flows The net effect of the banking system on foreign capital flows has been relatively limited as it also intermediated capital outflows due to currency substitution. For the last two years, there have been USD 4.5 billion worth of net capital outflows through banking system transactions. While the total foreign exchange (FX) borrowing of banks from abroad was USD 16.6 billion during 1984–1999 period, it increased to USD 32.3 billion in the last six years. Likewise, the foreign assets of banks also increased from USD 16.2 billion to USD 28.7 billion.
Despite the increase in the other sub-items of the capital account in recent years, the public sector has made net external debt payments as a result of fiscal discipline and privatisation revenues.
Historically, one of the main sources of FX inflows to Turkey has been the rise in non-bank private sector debt. In recent years, as access to international markets has improved, the non-bank sectors have increased FX borrowing significantly, to finance their investments. The USD 69.5 billion increase in non-bank private sector debt in the last six years significantly outweighs the USD 30.8 billion increase during the 1984–2001 period. Furthermore, the maturity of borrowing shifted from short-term to medium- and longer-term, which in turn reduces the vulnerability of this sector to short-term tightening in global liquidity conditions.
As a result of the increase in banking and non-banking sectors’ external borrowing, the gross external debt of Turkey increased from USD 113.6 billion in 2001 to USD 247.2 billion in 2007. A decomposition of external debt shows that while the public sector debt stock has increased from USD 71.5 billion to USD 89.2 billion, the private sector debt stock has increased from USD 42.1 billion to USD 158.0 billion in recent years (Figure 1). But the increase in external debt mainly stemmed from longer-term private sector debt that reduces vulnerabilities. Since 2001, the short-term private sector external debt stock increased from USD 14.6 billion to USD 37.4 billion, while the medium- and long-term external debt stock increased from USD 27.5 billion to USD 120.7 billion.

472 BIS Papers No 44
Figure 1
External debt stock In billions of US dollars
0
50
100
150
200
250
300
2001 2002 2003 2004 2005 2006 2007
Medium Term PrivateShort Term PrivatePublic
Source: Treasury.
(d) Capital outflows Against a significant increase in capital inflows to Turkey, we have also observed some capital outflows. There have been two main sources of capital outflows: (i) foreign direct investment abroad; and (ii) portfolio investment in international markets through the banking system. For the last six years, while FDI outflows were only USD 8.5 billion, portfolio outflows intermediated by the banking system were more significant.
Residents in Turkey have been allowed to hold FX deposits in the banking system since 1984. As a result of high volatility in domestic financial markets and a lack of confidence in the Turkish lira (TRY), the FX deposits of residents have gradually increased. The banks used these FX deposits to provide FX credits in domestic markets and to invest in FX assets abroad where some part of these assets has been investments in the Turkish Treasury’s eurobonds. Thus, the banks have continually intermediated foreign capital outflows except in the 2000–01 crisis years. This intermediation has increased in recent years as a result of the rise in FX deposits of residents. In the last six years, banking system foreign assets increased by USD 28.7 billion.
In the last two years, the strong appreciation of the lira and volatility in the financial markets encouraged domestic residents (individuals and firms) to strongly increase their FX holdings, and the banking system increased its foreign assets, in turn causing heavy capital outflows. FX deposits of the residents in the banking system rose from USD 60 billion to USD 95 billion in last three years (Figure 2), which resulted in a USD 15 billion increase in banking system foreign assets.
Although the increase in FX deposits of residents is the main source of capital outflows, it has two important positive implications for the stability in the domestic markets: (i) it dampens some of the appreciation pressure on the TRY and excess TRY liquidity; and (ii) it reduces the potential volatility of exchange rates and interest rates in case of external shocks as residents start to sell FX for domestic currency. As a matter of fact, this shock absorber characteristic has been clearly observed during recent volatility periods in the FX markets.

BIS Papers No 44 473
40
50
60
70
80
90
100
31/12/04 30/12/05 29/12/06 28/12/07 0
3
6
9
12
15
18
21 Change in deposits (rhs)Total FX deposits
Some foreign portfolio investors call residents’ FX deposits an implicit insurance against volatility in FX and securities markets.
Figure 2
FX deposits and yearly change In billions of US dollars
Source: CBRT.
4. The impact of increased capital flows on the domestic financial system
(a) The functioning of local capital markets As a result of new foreign portfolio inflows and accumulated interest earnings, the total market value of foreign portfolio investments increased from USD 5.3 billion to USD 120.3 billion over the last five years (Figure 3). The increase in foreign portfolio flows intensified especially after 2004, as is the case in most other emerging countries.
Moreover, the share of foreign investors in stock markets increased from 50% to 72% of free float while their share in government securities rose from 3% to 11.6% of the total domestic debt stock in the last three years (from May 2004 to January 2008; Figures 4 and 5). As a result of the expansion of foreign investors’ share in domestic markets, the impact of foreign portfolio flows on domestic markets has significantly increased. The rise in foreign investors’ share in these markets has also contributed to the liquidity of the markets.

474 BIS Papers No 44
Figure 3
Non-residents’ portfolio stock In billions of US dollars
0102030405060708090
100110120
2002 2004 2007
Other Government securitiesStock
Source: CBRT.
Figure 4
Foreigners’ share in ISE stocks in free float
Figure 5
Foreigners’ share in government debt securities
Source: Central Registry Agency. Source: CBRT.
Until some years ago, as a result of the lack of institutional and international investors, the high domestic debt stock was mostly carried on the banking system balance sheet in Turkey. The average maturity of deposits of the banking system was only three months, and holding government debt stock at longer maturities had posed a critical problem as the banking system was reluctant to assume the maturity mismatch risk. The average maturity of the domestic debt stock was very short, and the Treasury could only issue floating rate notes in the longer term.
In recent years, however, the growing participation of foreign investors who are also eager to invest in fixed rate longer-term securities has reduced the dependence of the Treasury on the domestic banking system. In addition to the new investor base, a decisive monetary policy oriented towards price stability which reduced inflation risks has enabled the Treasury to issue longer-term fixed rate securities. In the last six years, the average maturity of the
45.0
50.0
55.0
60.0
65.0
70.0
75.0
31/05/2004 31/05/2005 31/05/2006 31/05/2007
%
0.02.04.06.08.0
10.012.014.016.0
22/0
8/20
03
05/1
2/20
03
19/0
3/20
04
02/0
7/20
04
15/1
0/20
04
28/0
1/20
05
13/0
5/20
05
26/0
8/20
05
02/1
2/20
05
17/0
3/20
06
30/0
6/20
06
13/1
0/20
06
26/0
1/20
07
11/0
5/20
07
24/0
8/20
07
07/1
2/20
07
%

BIS Papers No 44 475
government debt stock has increased from nine months to almost three years, with an average borrowing cost under the previous levels (Figure 6).
Figure 6
Average maturity of domestic debt stock
9
14.7
27.527.4
11.5
33.3
5
10
15
20
25
30
35
40
2002 2003 2004 2005 2006 2007
MONTHS
Source: Treasury.
In addition to lengthening, the yield curve has become inverted (Figure 7), mainly because of the decline in inflation and the improvement in the credibility of the Central Bank of the Republic of Turkey (CBRT). However, the concentration of foreign investors on longer maturities has also been critical in terms of shifts in the yield curve. Although the share of foreign investors in the total domestic debt stock is only 15%, their share in long-term fixed rate securities is almost 50%.
Figure 7
Nominal yield curve
30.0
35.0
40.0
45.0
50.0
55.0
60.0
1 M
3 M
6 M 1 Y
2 Y
5 Y
15.0
16.5
18.0
19.5
21.0
22.5
24.031.12.2002
14.01.2008 (Right)
Source: CBRT.

476 BIS Papers No 44
On the other hand, as the share of foreign investors in the Istanbul Stock Exchange (ISE) has increased, they have become the main driver of market performance. As a result, ISE indices have tracked global market indices (Figure 8).
Figure 8
MSCI and ISE
Source: Bloomberg.
Although it may be concluded that domestic pull factors in most emerging countries have outweighed push factors stemming from favourable global liquidity conditions, the increase in the share of foreign investors in domestic markets and financial integration led to a significant increase in the sensitivity of domestic asset prices to developments in mature markets.
The simple correlation matrixes given in Table 6 shows how the sensitivity of Turkish assets to international market developments has increased.
Table 6 Correlation of Turkish asset returns with foreign markets
TRY DJ VIX ISE
2004–05 TRY 1.00 –0.09 0.10 –0.43 DJ –0.09 1.00 –0.77 0.08 VIX 0.10 –0.77 1.00 –0.10 ISE –0.43 0.08 –0.10 1.00
2007 TRY 1.00 –0.52 0.40 –0.68 DJ –0.52 1.00 –0.82 0.40 VIX 0.40 –0.82 1.00 –0.27 ISE –0.68 0.40 –0.27 1.00
Source: Bloomberg.
0
100
200
300
400
500
600
700
800
31/12/2001 31/12/2002 31/12/2003 31/12/2004 31/12/2005 31/12/2006 31/12/2007 7,500
17,500
27,500
37,500
47,500
57,500
67,500 MSCI-Emerging Europe ISE-100 (rhs)

BIS Papers No 44 477
This suggests that despite the decoupling argument, domestic markets are even more susceptible to changes in global liquidity conditions and risk appetite now.
(b) Bank intermediation in the domestic economy In recent years the growth rate of the banking system balance sheet has reached 23% on average (Figure 9). There have been three main sources of this impressive growth: (i) deepening of the financial system as a result of an increase in confidence; (ii) a decline in nominal and real interest rates; and (iii) an increase in TRY and FX borrowing opportunities in international markets. The change in the structure of the banking system balance sheet has been more impressive. The high domestic debt, which in recent decades generally had crowded out lending to consumers and private sector, had been absorbed by the banking system. But the trend has dramatically changed since 2003 as fiscal discipline and higher foreign investment in government securities have reduced the pressure of domestic debt stocks on the balance sheet of the banking system. Thus, the banking system has focused on normal banking activities.
As a result of the high primary surplus and privatisation revenues, the Treasury has reduced the domestic debt rollover ratios significantly below 100%, which in turn has increased loanable funds in the banking system for private sector and consumer credits (Figure 10).
Figure 9
Growth rate of banking system assets Figure 10
The Treasury’s rollover ratio (TRY + FX)
Source: CBRT. Source: Treasury.
In addition, the availability of longer-term TRY-denominated credit and swap transactions in international markets has enabled banks to increase the maturity of their loans. Foreign direct investment in the banking system and the increase in available funds for loans have resulted in heavy competition in the banking industry which has entailed some relaxation in credit conditions and a significant increase in credit maturities.
All these factors have enabled banks to significantly increase their lending activity and the share of credits in their total assets. While the share of securities in the banking system’s balance sheet has decreased from 41% to around 28%, the share of credits has increased from 23% to 49% (Figure 11).
10
15
20
25
30
35
2002 2003 2004 2005 2006 2007
%
70
80
90
100
110
120
2002 2003 2004 2005 2006 2007
%

478 BIS Papers No 44
Figure 11
Share of securities and loans in total assets
Source: Treasury.
Consequently, credit growth has increased to triple digits and supported domestic consumption and investment (Figures 12 and 13).
Figure 12
Growth rate of consumer credits Annual, in per cent
Figure 13
Growth rate of total credits
Annual, in per cent
Source: CBRT. Source: CBRT.
Even though the ratio of credits to GDP has been lower than in developed countries, it has dramatically increased from around 10% to 25% in last four years (Figures 14 and 15). The CBRT has always kept a close eye on domestic credit growth for both price and financial stability purposes.
15
20
25
3035
40
45
50
55
2002 2003 2004 2005 2006 2007
%
LoansSecurities
–50 0
50100150200250300
Jan
02M
ay 0
2S
ep 0
2Ja
n 03
May
03
Sep
03
Jan
04M
ay 0
4S
ep 0
4Ja
n 05
May
05
Sep
05
Jan
06M
ay 0
6S
ep 0
6Ja
n 07
May
07
Sep
07 –20
0
20
40
60
80
Jan
02M
ay 0
2S
ep 0
2Ja
n 03
May
03
Sep
03
Jan
04M
ay 0
4S
ep 0
4Ja
n 05
May
05
Sep
05
Jan
06M
ay 0
6S
ep 0
6Ja
n 07
May
07
Sep
07

BIS Papers No 44 479
Figure 14
Ratio of consumer credits to GDP Figure 15
Ratio of total credits to GDP
0
2
4
6
8
Jan
02M
ay 0
2Se
p 02
Jan
03M
ay 0
3Se
p 03
Jan
04M
ay 0
4Se
p 04
Jan
05M
ay 0
5Se
p 05
Jan
06M
ay 0
6Se
p 06
Jan
07M
ay 0
7Se
p 07
5
10
15
20
25
Jan
02M
ay 0
2Se
p 02
Jan
03M
ay 0
3Se
p 03
Jan
04M
ay 0
4Se
p 04
Jan
05M
ay 0
5Se
p 05
Jan
06M
ay 0
6Se
p 06
Jan
07M
ay 0
7Se
p 07
Source: CBRT. Source: CBRT.
5. Policy responses
(a) Exchange rate policy and liquidity management Since the adoption of the floating exchange rate regime in February 2001, exchange rates have been determined by supply and demand conditions in the market, and the CBRT has not had any exchange rate level target. But considering the importance of the level of foreign exchange reserves for reducing the unfavourable effects of potential shocks and for boosting confidence in the economy, the CBRT has conducted foreign exchange purchase operations in the market since 2002. Despite the CBRT’s massive FX purchases, the significant increase in foreign capital inflows has resulted in general stability in nominal exchange rates and a significant real exchange rate appreciation of the lira.
Figure 16
Nominal exchange rates Figure 17
Real exchange rates
Source: CBRT. Source: CBRT.
As capital inflows have increased significantly, there has been a coordinated response from the Treasury and the CBRT to excessive foreign exchange supply. While the Treasury has preferred to reduce FX or FX-linked debt stock, the CBRT has focused on building up FX reserves, consistent with the floating exchange rate regime as much as possible.
Jan
95Ju
l 95
Jan
96Ju
l 96
Jul 9
7Ja
n 98
Jul 9
8Ja
n 99
Jul 9
9Ja
n 00
Jul 0
0Ja
n 01
Jul 0
1Ja
n 02
Jul 0
2Ja
n 03
Jul 0
3Ja
n 04
Jul 0
4Ja
n 05
Jul 0
5Ja
n 06
Jul 0
6Ja
n 07
Jul 0
7
(1995 = 100)
80
100
120
140
160
180
200CPI-based WPI-based
Jan
97
1.101.201.301.401.501.601.701.801.902.002.102.20
Jan
02
Jun
02
Oct
02
Mar
03
Aug
03
Jan
04
Jun
04
Nov
04
Apr
05
Sep
05
Feb
06
Jul 0
6
Dec
06
May
07
Oct
07
0.5*USD + 0.5*EURO EURO USD

480 BIS Papers No 44
During 2004–06, the Treasury’s outstanding FX or FX-linked gross debt declined from USD 98 billion to USD 91.2 billion. The decline in FX or FX-linked debt/GDP was more impressive in the 2002–07 period, falling from 37.4% to 13.6% (Figures 18 and 19). This has reduced the government’s vulnerability to exchange rate volatility.
Figure 18 Gross debt stock
(external + FX/FX-denominated/ domestic debt)
In billions of US dollars
Figure 19 The Treasury’s gross FX-
indexed domestic debt As a percentage of GDP
80
85
90
95
100
2002 2003 2004 2005 2006 2007
13.59
30.83
25.10
17.33
37.44
19.30
0
10
20
30
40
2002 2003 2004 2005 2006 2007
%
Source: Treasury. Source: Treasury.
In order to increase FX reserves, starting in April 2002, the CBRT began conducting transparent FX buying auctions. In order to secure transparency and reduce uncertainty around its activities in the FX market, the terms and conditions of these auctions were pre-announced. Moreover, to improve transparency, the CBRT started to announce annual FX buying auction programmes in 2005 and pledged not to change them unless significant changes in FX liquidity were observed. In addition to FX buying auctions, the CBRT has always announced the possibility of direct buying or selling interventions in case of excessive volatility in FX rates.
During 2002–07, the CBRT purchased net USD 54.6 billion (Table 7), and the CBRT FX reserves increased from USD 18.6 billion to USD 72.3 billion (Figure 20).
Table 7 FX sales and purchases of the CBRT
In billions of US dollars
CBRT FX purchases CBRT FX sales Net purchase
2002 0.8 0.0 0.8
2003 9.9 0.0 9.9
2004 5.4 0.0 5.4
2005 22.0 0.0 22.0
2006 9.7 3.1 6.6
2007 9.9 0.0 9.9
Total 57.7 3.1 54.6
Source: CBRT.

BIS Papers No 44 481
Figure 20
FX reserves of the CBRT In billions of US dollars
Source: CBRT.
Because of these heavy FX purchases, there has been persistent excess TRY liquidity in the market. The CBRT’s sterilisation strategy has been to improve the coordination between its liquidity management and the Treasury’s debt management policies, and to withdraw remaining excess liquidity through open market operations (Figure 21). During 2002–07, as market conditions allowed, the Treasury increased the cash balances held with the CBRT to assist in the effective sterilisation of excess liquidity (Figure 22).
Figure 21
Excess TRY liquidity Figure 22
The Treasury’s account with the CBRT In millions of TRY
Source: CBRT. Source: CBRT.
The CBRT has withdrawn the excess liquidity mainly via TRY deposit operations in the Interbank Money Market within the CBRT and via overnight reverse repo transactions in the Istanbul Stock Exchange repo market.
On the other hand, the CBRT Law empowers the CBRT to issue central bank liquidity bills for its own account with maturities up to 91 days that are tradable in the secondary markets. Within this legal framework, considering the fact that the upsurge in excess liquidity withdrawn via overnight maturity may undermine the efficiency and flexibility of monetary policies, the CBRT has decided to issue liquidity bills in addition to the existing open market instruments. The first group of liquidity bills, totalling TRY 735 million, was issued on 20 July 2007 with a
20
30
40
50
60
70
80
2002 2003 2004 2005 2006 2007
0
4,000
8,000
12,000
16,000
20,000
24,000
28,000
Jan
02
Apr
02
Jul 0
2O
ct 0
2Ja
n 03
Apr
03
Jul 0
3O
ct 0
3Ja
n 04
Ap r
04
Jul 0
4O
ct 0
4Ja
n 05
Apr
05
Jul 0
5O
ct 0
5Ja
n 06
Apr
06
Jul 0
6O
ct 0
6Ja
n 07
Apr
07
Jul 0
7O
ct 0
7D
ec 0
7
OUTSTANDING REPO & REVERSE REPO + INTERBANK WITHDRAWALS(In millions of TRY)
–21,000–17,500 –14,000 –10,500–7,000–3,500
03,5007,000
02/0
1/02
02/0
5/02
30/0
8/02
28/1
2/02
27/0
4/03
25/0
8/03
23/1
2/03
21/0
4/04
19/0
8/04
17/1
2/04
16/0
4/05
14/0
8/05
12/1
2/05
11/0
4/06
09/0
8/06
07/1
2/06
06/0
4/07
04/0
8/07
02/1
2/07
Sterilisation (rev repo + interbank) Repo Net OMO
REPO
REVERSE REPO + INTERBANK

482 BIS Papers No 44
maturity of 32 days. The total amount of liquidity bills issued is TRY 3.3 billion. In July 2007, the CBRT also informed the market that if excess liquidity increased further and caused aggressiveness in the lending behaviour of the banking system, it would consider raising reserve requirements as an effective monetary policy instrument to withdraw excess liquidity permanently, and would prevent aggressive credit growth.
Excessive amounts of liquidity sterilised with short-term maturity may cause aggressiveness in lending activity, reduce the effectiveness of liquidity management and interest rate policy and contribute to excessive volatility in foreign exchange markets in case of external shocks. Therefore, to improve the effectiveness of liquidity management, the CBRT’s strategy relies on a step-by-step approach: (i) up to some acceptable levels that will not trigger aggressiveness in banks’ lending behaviour, the excess liquidity is withdrawn by short-term (eg overnight or weekly) transactions; (ii) beyond these critical levels, coordination with the Treasury should be improved and excess liquidity should be withdrawn with longer maturities, in order to prevent a sharp increase in domestic credits; (iii) if the excess liquidity still prevails and the Treasury is reluctant to go ahead with more sterilisation, central bank bills should be actively used; and (iv) if the active use of the central bank bills is not enough to control the domestic credit growth caused by excess liquidity, reserve requirements should be considered as an effective monetary policy instrument that will support the central bank’s interest rate policy, although this is not currently popular in central banking.
(b) Prudential regulations In order to smooth out the effects of capital inflows on the economy, in addition to FX reserve build-up and effective liquidity management policies, the authorities have also focused on prudential regulations for the banking system in line with the financial stability objective.
For this purpose, Turkey has concentrated on: (i) tight rules for the FX open positions, liquidity and capital adequacy ratio (CAR) of the banking system; (ii) transparency; (iii) risk management; and (iv) coordination with the CBRT and the Banking Regulation and Supervisory Authority (BRSA), rather than focusing on impediments to capital flows.
The CAR requirement is set as 8%, but the target for this ratio is increased to 12%. Banks which do not meet this requirement are not allowed to open new branches. In addition to capital adequacy and liquidity ratios, the net FX positions of the banking system are closely monitored. According to current regulations, “the absolute value of the foreign exchange net open position/own funds” standard ratio may not exceed 20%.
The BRSA also continues to maintain the capacity to evaluate the increasingly complex risk management procedures and risk models used by banks. More frequent on- and offsite bank examinations and increased reporting requirements (even daily for some types of data) are applied. Banks are examined according to a risk-based approach by taking all kinds of risks, including operational risk, into account. Moreover, stress testing has been enhanced. The Turkish authorities plan to implement Basel II as of January 2009. Finally, Turkey voluntarily joined the Financial Sector Assessment Program (FSAP) in 2006 to improve its financial system.
Although the unconsolidated CAR of the banking sector (the ratio of own funds to risk-weighted assets) declined from 31% in 2003 to 19% in 2007, it is still well above the target ratio of 12% (Figure 23). Accordingly, Turkish authorities always keep a close eye on the banking sector’s open FX positions. The sector has been behaving cautiously on foreign exchange risks, and the banks have a negligible foreign exchange net position (Figure 24).
The authorities in Turkey focus not only on direct risks stemming from the banking system’s net FX open positions, but also on indirect risks stemming from those of the non-bank sector. In order to limit risks associated with the non-bank sector’s FX open positions, the CBRT has always warned the public about such risks and has supported the development of derivatives markets. For that reason, the CBRT conducts a detailed analysis on the net open positions of

BIS Papers No 44 483
the non-bank firms by including all FX liabilities and assets in the Financial Stability Report, published every six months. As can be seen in Table 8, although the gross FX debt stock of the non-bank sector has increased significantly in recent years, the increase in net FX open positions has been relatively muted.
Figure 23
Capital adequacy ratio Figure 24
Open FX positions
Source: BRSA-CBRT. Source: CBRT.
Table 8
FX positions of the non-banking sector In billions of US dollars
December 2005 December 2006 June 2007 Change %
(June 2007–December 2006)
Assets 49.5 67.1 72.4 8.0
Deposits 34.0 49.3 52.2 5.8
Securities 1.7 1.7 1.7 –4.8
Other 13.8 16.0 18.6 16.0
Liabilities 76.6 104.5 123.4 18.1
Cash loans 60.3 86.0 103.7 20.5
Domestic 21.1 25.1 28.6 13.8
Foreign 39.3 60.9 75.1 23.3
Other 16.3 18.5 19.8 6.8
Net position –27.1 –37.4 –51.0 36.3
Source: Financial Stability Report, November 2007.
6. Conclusion
In recent years there has been a shift in the amount and structure of capital inflows to Turkey. As the amount of these inflows have reached unprecedented levels, the share of FDI and longer-term private sector credits has increased significantly. Taking into account the
18.8
15
20
25
30
35
2001 2002 2003 2004 2005 2006 2007
Capital adequacy ratio(unconsolidated, %)
20.8
25.6
31.0
23.7
28.3
21.8
–1,750
–1,250
–750
–250
250
Jan
07
Feb
07
Mar
07
Apr
07
May
07
Jun
07
Aug
07
Sep
07
Oct
07
Nov
07
Dec
07

484 BIS Papers No 44
structural changes in macroeconomic policies and improvements in economic fundamentals, it may be concluded that country-specific pull factors, rather than favourable global liquidity conditions, have been the main driver of capital inflows.
Although capital inflows have supported a rate of economic growth which has significantly exceeded historical averages, the CBRT has faced some challenges involving excess FX and TRY liquidity. In order to manage these challenges, the CBRT has focused on the FX reserve build-up without interrupting the floating exchange rate regime and effective sterilisation of excess TRY liquidity to control inflationary pressures. Furthermore, tight rules on capital and liquidity adequacy and FX open positions of the banking system have been maintained.
The main challenge for emerging countries, especially Turkey, will be to sustain capital inflows in case of changes in global liquidity conditions. In recent years, as a result of a rise in foreign investors’ share in domestic markets and increased financial integration, the sensitivity of domestic markets and domestic credit conditions to developed country markets has increased significantly. This has been particularly apparent during recent periods of volatility in global financial markets. Of course, it will not be possible to avoid all the negative effects of a worsening in global liquidity conditions in the short run, but emerging countries can limit these negative effects by sustaining credible monetary and fiscal policies and structural reforms.