financial economic impact analysis final draft - · pdf filefinal draft. hamilton airport ......
TRANSCRIPT

City of Hamilton Airport Employment Growth District
- Phase 2 Financial/Economic Impact Analysis and
Marketing Strategy
September 15, 2010
Final Draft

Hamilton Airport Employment Growth District - Phase 2 Financial/Economic Impact Analysis and Marketing Strategy
Dillon Consulting Ltd. i Watson & Associates Economists Ltd.
EExxeeccuuttiivvee SSuummmmaarryy Watson & Associates (W&A) in association with WCM Consulting Ltd. and Dillon Consulting Ltd.
was retained by the City of Hamilton to prepare a Fiscal Impact Analysis and Marketing Strategy
regarding the development of the Hamilton Airport Employment District (AEGD). The analysis
provided herein is being developed concurrently with the Secondary Plan and Master Plan
Study for the AEGD which is being lead by Dillon Consulting Ltd. Collectively, this report forms
a component of the Phase 2 analysis for the Hamilton AEGD.
As part of the Phase 1 Secondary Plan exercise, W&A was retained to establish the market
potential of the AEGD as well as to identify and assess the competitiveness of the AEGD lands
within a broader regional market area. The May 2008 Phase 1 Secondary Plan study also
provides a detailed analysis of the existing conditions of the City’s surrounding
industrial/business parks. Phase 2 builds on the Phase 1 analysis by examining the AEGD’s
competitiveness against specific industrial/business in Ontario and the U.S. which are adjacent
to or within proximity to a major airport. The Phase 2 report also provides a broad marketing
strategy including initiatives to attract signature employment and drive AEGD business
development. Lastly, this component of the Phase 2 AEGD study provides a comprehensive
examination of the fiscal impacts of development within the AEGD, focusing on operating and
capital impacts, as well as economic development benefits.
The following summarizes the key findings of the Phase 2 analysis of the AEGD related to
financial/economic impacts and general marketing approach.
• The AEGD presents a strategically important employment area for the City of Hamilton.
The AEGD offers the potential for a major new employment node within the context of a
multi modal transportation hub which includes the Hamilton International Airport (HIA).
With a net developable area of 1,173 net ha (2,899 net acres), the largest contiguous
land assembly in the region, the AEGD can accommodate a wide range of employment
and employment-related land uses.

Hamilton Airport Employment Growth District - Phase 2 Financial/Economic Impact Analysis and Marketing Strategy
Dillon Consulting Ltd. ii Watson & Associates Economists Ltd.
• The City of Hamilton is well-positioned geographically to potentially benefit from the
anticipated gradual shift of employment growth on employment lands from more mature
and developed west GTA municipalities. The AEGD favourably located in terms of
access to major highways, and skilled labour, and offers a developable area of ‘critical
mass’ at competitive prices. The proximity of the HIA in relation to the AEGD is a
significant asset which further enhances the development potential of the area.
• Other major airports in the region, including Toronto Lester B Pearson International
Airport and Buffalo-Niagara International Airport have limited off-site employment land
development opportunities, which places the AEGD and HIA in a unique position and
highly marketable. Despite this, however, the AEGD does face competition from other
industrial/business parks in the GGH.
• The future development of the AEGD represents an opportunity for the City of Hamilton
to enhance and diversify its local economic base, reduce commuting dependency,
provide for a more balanced tax assessment base, and foster a more complete and
sustainable community. A healthy balance between local population and employment is
echoed throughout many of the guiding principles of the Provincial Growth Plan1, which
stress the importance of “vibrant” and “complete” communities that support a “strong and
competitive economy”.
• Given its attributes, the AEGD’s employment lands development potential is anticipated
to be concentrated in advanced manufacturing, warehousing, transportation and
logistics, business services, and accommodation and food services. Between 2011 and
2031, the AEGD is anticipated to have employment growth of 24,360 and by buildout,
employment is anticipated to increase to 43,200. In addition, the development of the
AEGD is anticipated to have a significant indirect ‘spin-off employment and induced
economic impacts.
1 Places to Grow. Better Choices. Brighter Future. Growth Plan for the Greater Golden Horseshoe,
2006. Ministry of Infrastructure Renewal.

Hamilton Airport Employment Growth District - Phase 2 Financial/Economic Impact Analysis and Marketing Strategy
Dillon Consulting Ltd. iii Watson & Associates Economists Ltd.
• The development of the AEGD is anticipated to have a positive fiscal impact on the City
of Hamilton. By 2031 the AEGD is forecast to generate a positive impact on the City’s
property tax base of approximately $66 million. Capital costs associated with the AEGD
will be largely funded through development charges (DCs) in accordance with the City’s
existing DC By-law 09-143 and 09-144. In accordance with the master servicing studies
prepared for the AEGD related to roads/transit, water, wastewater and stormwater
management, the City’s municipal-wide DC rate would be nominally impacted by the
development of the AEGD Secondary Plan Area.
• Average industrial land values in the market area support a private-sector driven
approach to developing the AEGD. It is recommended that a coordinated approach
between the City and the development community should be considered to ensure
control of development and timing and minimize the financial risks associated with
development.
• An approach to a general marketing strategy has been developed herein, which outlines
the competitive position of the AEGD, identifies key target sectors and requirements at a
regional/local level, summarizes the potential marketing and promotional tools to foster
future development activity within desired industry sectors and sets out a general
approach to performance measurement and monitoring of development.

Hamilton Airport Employment Growth District - Phase 2 Financial/Economic Impact Analysis and Marketing Strategy
Dillon Consulting Ltd. iv Watson & Associates Economists Ltd.
TTaabbllee ooff CCoonntteennttss Executive Summary .................................................................................................................... i
Table of Contents .................................................................................................................. iv
1.0 Introduction ................................................................................................................... 1
1.1 Terms of Reference ....................................................................................................... 1
1.2 Description of the Study Area ........................................................................................... 1
1.3 The Role of Major Airports in Employment Land Development ........................................ 7
2.0 Competitive Analysis ......................................................................................................... 9
2.1 Regional Perspective ....................................................................................................... 9
2.2 Review of Major Airports in the Region ........................................................................... 10
2.3 Review of Major Industrial/Business Parks in the Region ............................................... 16
2.4 Review of Best Practices in Select Industrial/Business Parks in the Region .................. 19
2.5 How Does AEGD Rank – Strengths and Weaknesses ................................................... 21
3.0 Anticipated Development and Economic Impacts ........................................................... 23
3.1 Economic Drivers of Future Employment Growth in the AEGD ...................................... 23
3.2 AEGD Employment Growth Forecast ............................................................................. 26
3.3 Economic Impacts of Proposed Development ................................................................ 33
4.0 The City’s Role in Developing the AEGD ........................................................................ 40
4.1 Municipal Trends ..................................................................................................... 40
4.2 Development Approach ................................................................................................... 40
5.0 AEGD Fiscal Impacts of Development ............................................................................ 42
5.1 Operating Expenditure Implications ................................................................................ 42
5.2 Operating Revenue Implications ..................................................................................... 47
5.3 Taxation Revenue ..................................................................................................... 47
5.4 Net Fiscal Impact on the City .......................................................................................... 50
5.5 Capital Fund Impacts ..................................................................................................... 53
5.6 Conclusions ..................................................................................................... 62
6.0 Marketing Strategy .......................................................................................................... 63
6.1 What is the Long-term Vision for the AEGD? .................................................................. 63
6.2 Market Definition and Segmentation ............................................................................... 64

Hamilton Airport Employment Growth District - Phase 2 Financial/Economic Impact Analysis and Marketing Strategy
Dillon Consulting Ltd. v Watson & Associates Economists Ltd.
6.3 Target Sector Needs and Requirements Analysis .......................................................... 65
6.4 Local Site Requirements by Target Sector ..................................................................... 73
6.5 Promotion and Communication ....................................................................................... 73
6.6 Performance Measures and Monitoring .......................................................................... 79
6.7 Keys to Success ..................................................................................................... 80
7.0 Conclusions ................................................................................................................. 82
Appendix A – Survey of Existing Industrial Properties within the City of Hamilton
Appendix B – Detailed AEGD Capital Costs for Roads, Water, Wastewater and Stormwater
Services
Hamilton Airport Employment Growth District - Phase 2 Financial/Economic Impact Analysis and Marketing Strategy
Dillon Consulting Ltd. 1 Watson & Associates Economists Ltd.
11..00 IInnttrroodduuccttiioonn
1.1 Terms of Reference
Watson & Associates (W&A) in association with WCM Consulting Ltd. and Dillon Consulting Ltd.
was retained by the City of Hamilton to prepare a Fiscal Impact Analysis and Marketing Strategy
regarding the development of the Hamilton Airport Employment District (AEGD). The analysis
provided herein is being developed concurrently with the Secondary Plan and Master Plan
Study for the AEGD which is being lead by Dillon Consulting Ltd. Collectively, this report forms
a component of the Phase 2 analysis for the Hamilton AEGD.
As part of the Phase 1 Secondary Plan exercise, W&A was retained to establish the market
potential of the AEGD as well as to identify and assess the competitiveness of the AEGD lands
within a broader regional market area. The Phase 1 May 2008 Secondary Plan study also
provides a detailed analysis of the existing conditions of the City’s surrounding
industrial/business parks. Phase 2 builds on the Phase 1 analysis by examining the AEGD’s
competitiveness against specific industrial/business in Ontario and the U.S. which are adjacent
to or within proximity to a major airport. The Phase 2 report also provides a broad marketing
strategy including initiatives to attract signature employment and drive AEGD business
development. Lastly, this component of the Phase 2 AEGD study provides a comprehensive
examination of the fiscal impacts of development within the AEGD, focusing on operating and
capital impacts, as well as economic development benefits.
1.2 Description of the Study Area
The Airport Employment Growth District (AEGD) comprises 3,113 ha of land surrounding the
John C. Munro Hamilton International Airport (HIA). Situated in the west end of the Glanbrook
community within the City of Hamilton, the AEGD is bound by Garner Road/Twenty Road West
to the north, Carluke Road East/White Church Road to the south, Fiddler’s Green Road to the
west and Upper James Street to the east.

Hamilton Airport Employment Growth District - Phase 2 Financial/Economic Impact Analysis and Marketing Strategy
Dillon Consulting Ltd. 2 Watson & Associates Economists Ltd.
The AEGD presents a strategically important employment area surrounding the Hamilton
International Airport (HIA). Historically, the City of Hamilton has maintained a strong industrial
base that has grown and evolved in connection with major transportation networks throughout
the area. In the past, this has encompassed the development of employment lands along side
port facilities, railroads, and highways. The development of the AEGD within the context of a
multi modal transportation hub, combining air and road transport, offers an unparalleled
opportunity for the City. The AEGD offers the potential for a major new employment node which
would improve live-work ratios in the City, build synergies with the airport, enhance the airport’s
role as an economic driver, support long-term prosperity, and contribute to quality of life in
Hamilton.
The AEGD Secondary Plan provides for a major business park development which
complements the HIA, and is compatible with the residential development abutting Garner
Road/Twenty Road. The plan also recognizes and allows for certain existing land uses to
continue until such time that they are redeveloped and also preserves and enhances the
prominent natural areas throughout the study area.
The AEGD offers a range of employment and employment-related land uses in the context of an
eco-industrial park. This includes a provision for prestige industrial, light industrial and airport
related business development which have an environmentally friendly footprint which is to be
managed through a range of urban design and development principles.
The preferred AEGD land use scenario encompasses 1,173 net ha (2,898 net acres) of
developable land and identifies four distinct employment categories: Airport-Related Business,
Airside Industrial, Light Industrial and the Prestige Business Park, as illustrated in Map 1-1.
Prestige business park uses are directed to the area’s major roadways where urban design
guidelines facilitate the transition to neighbouring residential and agricultural/rural land uses.
Light industrial uses are directed to interior lands abutting natural areas and prestige business
park uses. Airport-Related business industrial uses, which require direct “airside” access, are
located adjacent to the existing and future runway aprons of the HIA. Meanwhile, Airport-
Related commercial businesses, which cater to air travellers, are to be located in close proximity

Hamilton Airport Employment Growth District - Phase 2 Financial/Economic Impact Analysis and Marketing Strategy
Dillon Consulting Ltd. 3 Watson & Associates Economists Ltd.
to the airport. The Plan also provides for a limited range of employment-related commercial that
serves employees of the Secondary Plan area.
There are two stages of development for the AEGD, based on servicing schedules as illustrated
In Map 1-2. The Secondary Plan Area, consisting of 662 net ha (1,635 net acres), is shown in
blue (servicing phase 1) and green (servicing phase 2). The Additional Study Area (the
additional study area) is shown in orange, and will comprise the remaining 511 net ha (1,263 net
acres) of net developable land. Table 1-1a and 1-1b illustrate the anticipated development by
employment sector. Prestige Business Park represents the largest component of the net
developable employment lands followed by Light Industrial.

Hamilton Airport Employment Growth District - Phase 2 Financial/Economic Impact Analysis and Marketing Strategy
Dillon Consulting Ltd. 4 Watson & Associates Economists Ltd.
Table 1-1a
Employment Sector Acres HaPercentage
of Total Land Area
AI: Airside Industrial 156 63 9.6%ARB: Airport-Related Business 119 48 7.3%IND: Light Industrial 495 200 30.3%PBP: Prestige Business Park 865 350 52.9%Total 1,635 662 100.0%Source: Watson & Associates Economists Ltd., 2010.
Land Uses by Employment Sector, 2031 (Secondary Plan Area)Hamilton Airport Employment Growth District (AEGD)
Net Developable Area
Table 1-1b
Employment Sector Acres HaPercentage
of Total Land Area
AI: Airside Industrial 241 98 8.3%ARB: Airport Related Business 311 126 10.7%IND: Light Industrial 1,002 405 34.5%PBP: Prestige Business Park 1,345 545 46.4%Total 2,899 1,173 100.0%Source: Watson & Associates Economists Ltd., 2010.
Land Uses by Employment Sector, BuildoutHamilton Airport Employment Growth District (AEGD)
Net Developable Area
(Secondary Plan and Additional Study Area)

Hamilton Airport Employment Growth District - Phase 2 Financial/Economic Impact Analysis and Marketing Strategy
Dillon Consulting Ltd. 5 Watson & Associates Economists Ltd.
Map 1-1 Airport Employment Growth District Refined Preferred Land Use Option

Hamilton Airport Employment Growth District - Phase 2 Financial/Economic Impact Analysis and Marketing Strategy
Dillon Consulting Ltd. 6 Watson & Associates Economists Ltd.
Map 1-2 Airport Employment Growth District
Phasing Map

Hamilton Airport Employment Growth District - Phase 2 Financial/Economic Impact Analysis and Marketing Strategy
Dillon Consulting Ltd. 7 Watson & Associates Economists Ltd.
1.3 The Role of Major Airports in Employment Land Development
The proximity of the HIA in relation to the AEGD is a significant asset which enhances the
development potential of the area. The concept of an “airport” has evolved from solely a
transportation hub to a multi modal employment hub serving as catalysts for a large range of
economic activities. Major airports have the potential to generate new business and
employment that extends beyond their immediate environs. This includes employment lands
located adjacent or in periphery of major airports.
Major airports both nationally and internationally are developing employment lands to capitalize
on the strategic advantages of proximity to airport-related services. This trend is partly driven
by a changing economy, which is increasingly global, high-tech, knowledge-based and serviced
oriented which demands increased connectivity, accessibility, and speed. Industry clusters with
these attributes recognize proximity to airports as a core asset as it allows for the efficient and
expedient movement of cargo and business travel by air. Employment lands located in the
periphery of major airports tend to develop synergies with airport activities, capitalizing on the
attractiveness of proximity to air transport connectivity which can enhance business efficiency
and optimize business operations. The strength and nature of this relationship is largely
dependent on the size and type of direct airport activities, in terms of the number of passengers
and amount and type of cargo handled.
As highlighted in the 2002 Hamilton Airport Gateway Opportunities Study,1 proximity and access
to a major airport is advantageous for an increasing number of employment sectors. Sectors
such as research and development and advanced manufacturing rely increasingly on air
transport in their supply chains and just-in-time delivery. This includes companies engaged in
time sensitive businesses such as computer hardware/software, electronics,
telecommunications equipment, apparel, automotive components, industrial equipment and
healthcare/biotechnology. Other sectors directly tied to airport activities and operations include
1 Hamilton Airport Gateway Opportunities Study, Price Waterhouse Coopers, 2002.
Hamilton Airport Employment Growth District - Phase 2 Financial/Economic Impact Analysis and Marketing Strategy
Dillon Consulting Ltd. 8 Watson & Associates Economists Ltd.
air freight distribution/logistics (e.g. regional integrator operations, on-site customs brokers,
freight forwarders) and the aerospace industry.
Employment lands in proximity to major airports are also increasingly attractive for corporate
office uses. This includes airport related businesses such as airline corporate offices and
businesses that are dependent on airport access for corporate travel and/or air shipping as a
crucial element of their business. Typically this market is loosely focused on medium to large
businesses that desire office space for operations in the region, and find a degree of attraction
as a result of the unique environment offered by the AEGD. These businesses do not
necessarily value all of the logistical opportunities presented by operating within the AEGD, but
do attribute some value to the positive perception of the AEGD (a prestige setting) and by
association the businesses operating within it. Major airports are also increasingly attractive to
national and multi-national companies whose business activities are far reaching and proximity
to commercial air service is advantageous for business air travel for both employees and clients.
Lastly, employment sectors such as information and cultural industries, professional and
scientific services, food processing, agri-business, arts entertainment and recreation, health
care and social assistance also represent key target industry sectors. While these industries do
not all necessarily rely on air transportation, there are key sub-sectors within them that have a
heavy dependence on air transportation or for which proximity to an airport can be a significant
competitive advantage. For example, film and media editing facilities frequently locate around
airports to facilitate film production schedules. In the food processing and agri-business sector,
the transportation of perishable food and other agriculture products relies on airfreight.

Hamilton Airport Employment Growth District - Phase 2 Financial/Economic Impact Analysis and Marketing Strategy
Dillon Consulting Ltd. 9 Watson & Associates Economists Ltd.
22..00 CCoommppeettiittiivvee AAnnaallyyssiiss The competitiveness of the AEGD is assessed here from a regional and local perspective as a
“stand alone” employment area and also within the context of the HIA, and the potential
synergies and competitive advantages that proximity to a major airport presents. This
commentary builds on the analysis of the Phase 1 Secondary Plan (Chapters 7 and 9).
2.1 Regional Perspective
As discussed in Chapter 7 of the Phase 1 Secondary Plan, the AEGD is situated in the south-
western portion of the Greater Golden Horseshoe (GGH) - one of the fastest growing and
economically diverse regions in North America. The AEGD is well-positioned geographically to
potentially benefit from the anticipated gradual shift of employment growth on employment lands
from more mature and developed west Greater Toronto Area (GTA) municipalities. As
previously discussed, the AEGD has inherent advantages for employment lands development.
The District’s relative competitiveness in a regional context was assessed in Chapter 9 of the
Phase 1 Secondary Plan. This encompassed a profile of competing business parks in the
context of the municipalities in which they are located. This included a summary of the location
attributes and economic indicators identified for each of the eight municipalities investigated
(including the City of Hamilton). The report identified that the AEGD (and the City of Hamilton)
compares favourably to other municipalities in the surrounding market. Key findings include:
• The HIA is a core advantage to the AEGD;
• The AEGD is well positioned geographically in proximity to 400 series highways and the
U.S. border;
• The AEGD has good access to an educated and skilled local labour pool and a major
post-secondary research institution;
• The City of Hamilton is a well balanced community and ranks highly in terms of
live/work ratio; and
• The City of Hamilton’s employment lands are competitively priced and the City has the
lowest industrial development charges of the surveyed municipalities.

Hamilton Airport Employment Growth District - Phase 2 Financial/Economic Impact Analysis and Marketing Strategy
Dillon Consulting Ltd. 10 Watson & Associates Economists Ltd.
The Phase 1 Secondary Plan identifies that given the strategic size and location of the study
area, the AEGD will offer a new industrial business park with a critical mass of prestigious
development, which can successfully compete with neighbouring employment lands across the
GGH. The AEGD has the potential to be attractive for employment lands development given its
regional attributes (i.e. location, size, access, proximity to employment markets, etc.). The
AEGD lands are also competitive due to their western Greater Toronto Area + Hamilton (GTAH)
location, access to major highways (Highway 403, Highway 6 and Red Hill Creek Expressway),
employment markets, and a large and diverse labour pool. The proximity and association with a
major airport – the Hamilton International Airport – is an added strategic advantage of the
AEGD.
Though the City of Hamilton is well positioned to capture a significant share of long-term
regional economic growth potential, the AEGD faces competition from municipalities in the
surrounding market area (i.e. GGH “Outer Ring” and west GTAH). Municipalities in the west
GTAH are highly marketable towards office and prestige employment development in corporate
business park settings. Many GTAH fringe and GGH “Outer Ring” municipalities such as Milton,
Halton Hills Caledon, Guelph, and Waterloo Region also have a strong base in advanced
manufacturing, warehousing, transportation and logistics and pose significant competition due
to their proximity to the west GTAH, availability of large tracts of lands and access to
transportation networks. A number of major airports and associated employment lands in the
region and beyond also pose potential competition for the AEGD.
These competitors are evaluated in more detail in the following sections.
2.2 Review of Major Airports in the Region
Given its location adjacent to the HIA, the AEGD offers the potential to attract new “air intensive”
business sectors to the area and also retain local businesses that can benefit from proximity to
the airport. However, the HIA is not the only major airport in the surrounding market area. The

Hamilton Airport Employment Growth District - Phase 2 Financial/Economic Impact Analysis and Marketing Strategy
Dillon Consulting Ltd. 11 Watson & Associates Economists Ltd.
Airport Market Analysis and Land Needs Study1 identified that the HIA has a number of
competitors in the GGH and beyond including Toronto-Lester B. Pearson International Airport
(TLBIA), London International Airport (LIA), Region of Waterloo International Airport (RWIA).
Buffalo-Niagara International Airport (BNIA) and Niagara Falls International Airport (NFIA), both
located in upstate New York, USA, near the Canada-US border, are also discussed. The major
airports identified are examined here in the context of their respective economic activities and
related employment lands.
HIA and the airports included in this analysis and their general characteristics are summarized
in Table 2-1. Key findings are as follows:
• HIA ranks as the region’s third largest airport in terms of passenger traffic, after Toronto-
Lester B. Pearson International (TLBPIA) and Buffalo-Niagara International Airport
(BNIA), with 550,000 passengers annually;
• In terms of passenger traffic, HIA is significantly smaller than TLBPIA and BNIA and only
modestly higher than London International Airport (LIA);
• In contrast, the Region of Waterloo International Airport (RWIA) and Niagara Falls
International Airport (NFIA) are relatively small in terms of annual passenger traffic;
• HIA is the region’s second largest in terms of cargo volume after TLBPIA with 78,250
tonnes of cargo handled annually;
• In terms of cargo, HIA handles roughly one-quarter of the volume of TLBPIA and double
that of BNIA;
• RWIA, NFIA, and LIA have limited cargo activities;
• With the exception of RWIA, all airports have existing adjacent off-site
industrial/business park (employment) lands;
• The largest employment lands concentration (occupied and vacant) is at TLBPIA with
over 5,000 net ha. In contrast, the proposed AEGD at HIA with 1,176 net ha would be
roughly one–quarter the size;
1 Airport Market Analysis and Land Needs, LPS AVIA Consulting, August 2009.

Hamilton Airport Employment Growth District - Phase 2 Financial/Economic Impact Analysis and Marketing Strategy
Dillon Consulting Ltd. 12 Watson & Associates Economists Ltd.
• The AEGD is considerably larger than aggregate employment lands located at other
airports in the region including BNIA, the next largest;
• TLBPIA and BNIA have limited expansion potential for off-site employment lands. In
contrast, expansion potential is high at HIA, LIA, RWIA and NFIA (subject to need); and
• Employment lands expansion potential at RWIA and LIA are considered long-term.
Airport LocationAnnual
Passengers (2008)
Annual Cargo 2008
(tonnes)
Off-Site Employment
Lands Expansion Potential1
Hamilton International Airport Hamilton, ON 550,000 78,250 1,176 HIGHLester B. Pearson International Airport Toronto, ON 30,127,000 322,250 5,068 LIMITEDLondon International Airport London, ON 462,000 325 53 HIGHRegion of Waterloo International Airport Waterloo, ON 119,000 N/A 0 HIGHBuffalo-Niagara International Airport Buffalo, NY, USA 5,526,000 36,075 365 (2) LIMITEDNiagara Falls International Airport Niagara Falls, NY, USA 40,000 180 160 (2) HIGHSource: Watson & Associates Economists Ltd.
1. Subject to need.
2 Estimated gross ha adjusted to net ha using 75% gross to net ratio.
Total Off-Site Employment Lands - Total Occupied and
Vacant (net ha)
Table 2-1Major Airports in the Region
A general overview of each airport in the region is provided below.
Toronto – Lester B. Pearson International Airport
Toronto-Lester B. Pearson International Airport (TLBPIA) is Canada’s largest airport both in
terms of passenger and cargo traffic (30,127,000 million passengers and 322,250 tonnes of
cargo annually) and serves as a major international gateway and national hub. The airport is
located in northeast Mississauga on a mature site and is constrained in terms of potential
expansion opportunities for airport related activities and neighbouring employment lands.
The airport has about 110 net ha available for future development of airport related and
complementary uses.1 Immediately outside of the Airport boundaries, there are a number of
1 Toronto-Lester B. Pearson International Airport Master Plan 2008

Hamilton Airport Employment Growth District - Phase 2 Financial/Economic Impact Analysis and Marketing Strategy
Dillon Consulting Ltd. 13 Watson & Associates Economists Ltd.
major employment lands surrounding the airport which are within the Airport Operating Area, as
defined by the Airport Master Plan. This includes Northeast and Airport Corporate employment
districts in the City of Mississauga and Rexdale Employment District in the City of Toronto. The
Northeast District (total size 3,476 net ha) is situated north and west of the airport property and
includes a mix of corporate office, light industrial uses, and distribution/warehousing, and
accessory uses. The Airport Corporate District (total size 292 net ha), located immediately south
of the airport, contains a high degree of prestige type development including corporate office
with some warehousing. The Rexdale Employment District (total size 1,300 net ha) consists
primarily of warehousing and light manufacturing). All three employment lands areas are
approaching buildout, with 93% occupied in total.
London International Airport
The London International Airport (LIA) is situated in London, Ontario, approximately 120 km
southwest of HIA. The LIA is a regional airport, with annual passenger traffic totalling 462,000
and cargo totalling 325 tonnes. The airport’s passenger services include four major airlines with
direct connections to major centres in Canada and the U.S. Midwest and also three
vacation/charter airlines. The number of passenger routes served has expanded considerably in
the past few years. The airport is also served by a number of air cargo handlers.
In December 2008 the Federal government designated the LIA as an approved Federal
Transshipment Centre for International cargo. This allows aircraft from Europe or Asia to fly
directly to LIA and shipments can be stored or broken down to smaller denominations for
distribution to a third country via air, land or rail.
The LIA has a strong flight training centre, with four aviation schools operating from the airport.
The Commercial Aviation Management Program at the University of Western Ontario is affiliated
with the LIA.
Adjacent to the airport, the Skyway Industrial Park encompasses a total area of 121 gross ha
and is being jointly developed by the City of London and Airport. Major uses include

Hamilton Airport Employment Growth District - Phase 2 Financial/Economic Impact Analysis and Marketing Strategy
Dillon Consulting Ltd. 14 Watson & Associates Economists Ltd.
manufacturing and warehousing. Phase 1 was completed in 2004 and contains 53 net ha which
is close to buildout, Phase 2, covering an area of 51 gross ha, is in pre-design with construction
to commence in 2013. The Park offers good access to Highway 401 via Veterans Memorial
Parkway.
Region of Waterloo International Airport
The Region of Waterloo International Airport (RWIA) is situated in the Region of Waterloo, about
65 km northwest of HIA. The airport, which is owned and operated by the Regional Municipality
of Waterloo has a strong base in general and corporate aviation activity. In 2008, the RWIA
handled 119,000 passengers and a limited amount of cargo and is served by two airlines with
schedule air service and one charter airline. The airport is aggressively working to expand its
passenger traffic base.
The airport has a strong base in flight training with development of the Waterloo-Wellington
Flight Centre, a state-of-the-art training facility.
The airport has no existing employment lands in its proximity though potential large scale
employment lands development in the area is planned. The Regional Growth Management
Strategy (RGMS) recommends the development of new employment lands, known as the “East
Side Lands” in the vicinity of the Region of Waterloo International Airport to help maintain and
enhance the economic prosperity of the Region. The new Region of Waterloo Official Plan has
identified the strategic development of these lands. The East Side Lands in vicinity of the
airport are subject to significant infrastructure improvements and environmental studies and are
anticipated to be developed over the long term (i.e. 20+ years). The airport is anticipated to
complement the development of the East Side employment lands.
Buffalo-Niagara International Airport
The Buffalo-Niagara International Airport is situated just outside Buffalo New York in the Town
of Cheektowaga. Located about 28 km from the Canada-U.S. border at Fort Erie, the airport is

Hamilton Airport Employment Growth District - Phase 2 Financial/Economic Impact Analysis and Marketing Strategy
Dillon Consulting Ltd. 15 Watson & Associates Economists Ltd.
Western New York’s primary passenger and cargo airport serving 5,526,000 passengers and
handling 36,075 of cargo annually.
The airport is served by 12 commercial airlines with scheduled service to U.S. destinations in
the mid-west and eastern seaboard and four air cargo carriers including FedEX and UPS. The
airport’s air cargo facility is a designated Foreign Trade Zone (FTZ) which allows imported cargo
to be handled duty free unless it enters the U.S. market.
The airport is situated in an urban area, limiting expansion potential either for airport related
activities or industrial/business park development. The main employment lands adjacent to the
airport is a 330,000 sq. ft. facility situated on a 7 net ha site owned by the Niagara Frontier
Transportation Authority. The existing space has some available building space suited for office,
industrial, research and development, and manufacturing and warehousing.
Outside the airport property, the area has approximately 500 gross ha (occupied and vacant) of
industrial/business park lands to the east and north adjacent the airport. This industrial land is in
proximity and has direct access to the I-90 (New York Thruway) highway. Industrial and
commercial development in the airport vicinity, increased considerably after construction of the
new passenger terminal in November 1997.1 Significant amounts of vacant developable land
exist to the east of the airport and are actively being marketed. This includes Airborne Business
Park covering 20 gross ha (50 gross acres), being marketed for office and flex use and Aero
Business Park which is geared for light manufacturing and warehousing. Aero Business Park
and Airport Business Park are both Foreign Trade Zone designated. Foreign Trade Zones
(FTZs) provide allow U.S. economic activities engaged in international trade-related activities to
avoid duties.
Niagara Falls International Airport
1 Buffalo Niagara International Airport, Part 150 Noise Compatibility Study - Volume II, PB Aviation,
October 26, 2004.

Hamilton Airport Employment Growth District - Phase 2 Financial/Economic Impact Analysis and Marketing Strategy
Dillon Consulting Ltd. 16 Watson & Associates Economists Ltd.
Niagara Falls International Airport is situated in Niagara Falls New York, approximately 20 km
from the Canada-U.S. border Queenston crossing. The airport’s origins are as a military base
(existing) which has evolved to civilian use. The airport handles about 40,000 passengers and
180 tonnes of cargo annually.
Niagara Falls International Airport is being promoted as an emerging cargo hub and foreign
trade zone. A new airport terminal opened in September 2009 which will facilitate its long term
passenger and cargo growth plans. The airport’s proximity to the Canada-U.S. border crossing
has attracted investment from Canadian firms who have business interests/activities in the U.S.
market.
The industrial/business parks around the airport include Niagara Industrial Airpark, Wheatfield
Business Park and Vantage International Pointe (designated as Foreign Trade Zone). The parks
have a significant vacant developable land well suited for light industrial, warehousing and
distribution and office activities.
The Niagara Falls International Airport has very competitive landing fees, making it an attractive
location for air cargo. The Foreign Trade Zone at the Vantage International Pointe, allows for
the general warehousing, light manufacturing and product distribution to be exempt from subject
duty if products are not imported to U.S.
In October 2009, a private consortium submitted a preliminary plan to build a $12 million,
100,000-square-foot air cargo operation that would target international freight. Such a facility
would significantly increase the airport’s air cargo handling capacity.
2.3 Review of Major Industrial/Business Parks in the Region
In addition to the employment lands located adjacent to other major airports in the region, the
AEGD will compete with other large-scale industrial/business parks in the GGH and in
particular, parks in proximity to major airports. The Phase 1 Secondary Plan provided some
insight into this, examining competing parks from a municipal level perspective. Phase 2 builds
Hamilton Airport Employment Growth District - Phase 2 Financial/Economic Impact Analysis and Marketing Strategy
Dillon Consulting Ltd. 17 Watson & Associates Economists Ltd.
on this previous analysis with emphasis on the business/industrial park level. This includes a
review of select industrial/business parks in the surrounding market area.
The comparative analysis includes three industrial/business parks adjacent to major airports in
the region (two situated adjacent to Toronto Lester B. Pearson International Airport and one
located next to the London International Airport). Four additional industrial/business parks are
reviewed which are considered as highly competitive with AEGD based on geographic location,
size, and occupant/land use mix.
Tables 2-2 summarize the select industrial/business parks by general parameters (physical and
economic characteristics and locational attributes). Key findings are:
• Next to the Northeast Employment District in Mississauga, the AEGD is the largest
industrial/business parks in terms of total potential developable size;
• The surveyed industrial/business parks adjacent to TLBPIA and LIA are approaching
buildout;
• Parks situated in proximity to AEGD, including Ancaster Business Park and North
Glanbrook Business Park, have significant vacant lands available for development;
• Serviced industrial land prices are highest in parks situated adjacent to the TLBIA
followed by Meadowvale Business Park;
• In contrast, land prices in Hamilton are considerably lower, about one-third of that of the
Northeast Employment District and Airport Corporate Employment District;
• Serviced land prices are lowest at the Skyway Industrial Park in London; and
• Common parcel sizes at the TLBIA employment lands range between 1-5 ha, which
have a concentration of corporate office, airport related warehousing/logistics, and
advanced manufacturing.

Hamilton Airport Employment Growth District - Phase 2 Financial/Economic Impact Analysis and Marketing Strategy
Dillon Consulting Ltd. 18 Watson & Associates Economists Ltd.
Industrial/Business Park Location Developer Size (net ha) Vacant (net ha) % Vacant
Common Parcel Size
(ha)
Price per serviced acre Occupant Mix
Select Industrial/Business Parks Adjacent to Major Airports
AEGD Hamilton TBD 1,176 1,176 100% TBD TBDCorporate office, advanced
manufacturing, warehousing
Airport Corporate Employment District
Mississauga
Private sector assembly, servicing, marketing
292 44 15% 1-4 ha $735,000-$835,000 Corporate Office, warehousing
Northeast Employment District Mississauga
Private sector assembly, servicing, marketing
3,476 191 5% 1- 5 ha $735,000-$835,000Advanced Manufacturing, warehousing, logistics,
corporate office
Skyway Industrial Park-Phase 1 LondonCity of Lodon
(City land owned, serviced, sold)
53 3 6% 3-8 ha $75,000 Manufacturing, warehousing
Select Industrial/Business Parks in Surrounding Market Area
Ancaster Business Park HamiltonCity of Hamilton
(City land owned, serviced, sold)
230 140 61% 1 - 4 ha $200,000 - 250,000 Advanced Manufacturing, Warehousing
Meadowvale Business Park Mississauga
Private sector assembly, servicing, marketing
850 220 26% 2-3 ha $500,000-$650,000
Corporate Office, Information Technology, Research and Development, Advanced
Manufacturing.
Milton/401 Business Park Milton
Private sector assembly, servicing, marketing
665 215 32% 8-20 ha $475,000 - 575,000Warehousing,
Transportation, Logistics, Manufacturing
North Glanbrook Business Park HamiltonCity of Hamilton
(City land owned, serviced, sold)
285 235 82% $200,000 - 250,000Advanced Manufacturing,
Warehousing, Professional Offices
Source: Watson & Associates Economists Ltd. survey
Table 2-2Select Industrial/Business Parks
Physical and Economic Characteristics
Table 2-3 summarize the select industrial/business parks by locational attributes in terms of
access to transportation networks. Key findings are:
• The AEGD is adjacent to a major airport (HIA), similar to Airport Corporate and
Northeast Employment Districts (TLBPIA) and Skyway Industrial Park (LIA);
• The other surveyed parks are in reasonable driving distance of major airports (less than
40 km);
• The AEGD, unlike the Airport Corporate and Northeast Employment Districts,
Meadowvale Business Park, and Milton/401 Business Park does not have direct
exposure to a 400 series highway;

Hamilton Airport Employment Growth District - Phase 2 Financial/Economic Impact Analysis and Marketing Strategy
Dillon Consulting Ltd. 19 Watson & Associates Economists Ltd.
• The north end of the AEGD is in proximity to Highway 403/Highway 6 interchange, which
serves as a gateway to the Park;
• The AEGD has direct access/exposure to a limited access highway (Highway 6); and
• The Northeast Employment District (TLBPIA) is in proximity to an intermodal facility
which is unavailable at AEGD, Airport Corporate Employment District and Skyway
Industrial Park.
Industrial/Business Park DIstance to Major Airport
Direct 400 Series
Highway Access
Direct Access to
Limited Access
Highway
Distance to 400 Series
Proximity to Intermodal
Facility
Direct Rail Access
Select Industrial/Business Parks Adjacent to Major Airports
AEGDADJACENT
(Hamilton Intl' Airport)
NO YES 2 - 4 km NO NO
Airport Corporate Employment District
ADJACENT (Toronto Intl'
Airport)YES NO <1 km NO NO
Northeast Employment DistrictADJACENT (Toronto Intl'
Airport)YES NO <1 km YES NO
Skyway Industrial Park-Phase 1 ADJACENT (London Airport) NO YES 12 km NO NO
Select Industrial/Business Parks in Surrounding Market Area
Ancaster Business Park 12 km (Hamilton Intl' Airport) NO NO 2 km NO NO
Meadowvale Business Park 20 km (Toronto Intl' Airport) YES NO <1 km NO NO
Milton/401 Business Park 38 km (Toronto Intl' Airport) YES NO <1 km NO YES
North Glanbrook Business Park 15 km (Hamilton Intl' Airport) NO NO 2 km NO NO
Source: Watson & Associates Economists Ltd. survey
Table 2-3Select Industrial/Business Parks
Locational Attributes
2.4 Review of Best Practices in Select Industrial/Business Parks in the Region
This section identifies “best practices” and key attributes of successful industrial/business parks
based on the survey and profile of select industrial/business parks in the preceding Section.

Hamilton Airport Employment Growth District - Phase 2 Financial/Economic Impact Analysis and Marketing Strategy
Dillon Consulting Ltd. 20 Watson & Associates Economists Ltd.
Additional commentary is provided with respect to the conditions which facilitate the successful
development of employment areas (i.e. access/location, site size and configuration etc.)
Attributes of successful industrial/business parks depend partly on their core focus, as
described below:
Industrial
• 400 series/limited access highway access is critical for the success of more traditional
industrial parks that have a significant degree of manufacturing, warehousing,
distribution and logistics. These parks do not necessarily have to be adjacent to a 400
series/limited access highway but must be in proximity and easily accessible via major
arterials that pass through limited residential or mixed use commercial area(s);
• Size is vital to ensure a wide selection/flexibility of land options and must include a
sufficient supply of large parcels. As a minimum, 80 ha (200 acres) is typically a suitable
size for an industrial park in order to reach the critical mass needed to provide
reasonable presence, choice, and economies of scale. Newer parks focused on
warehousing and transportation tend to be larger, in excess of 200 ha (500 acres);
• Location must provide efficient and effective vehicular access and circulation, particularly
for heavy truck traffic;
• Extensive buffering is most critical for heavy industry in order to minimize noise, air
pollution to neighbouring residential and other non-residential areas. This is most
successful when parks are on the urban fringe and removed from urban areas; and
• Given the relatively land extensive uses, land prices must be competitive.
Prestige
• Access and exposure/visibility to 400 series highway/limited access highways is critical
for business parks, particularly for the corporate office component;
• Size is less important for prestige business parks; however, these areas must be large
enough to foster a sense of place, a self contained entity and to allow for on-site
amenities;

Hamilton Airport Employment Growth District - Phase 2 Financial/Economic Impact Analysis and Marketing Strategy
Dillon Consulting Ltd. 21 Watson & Associates Economists Ltd.
• Moderate buffering is sufficient for business parks and research and technology oriented
parks; and
• Park character is typically enhanced through high quality building design and
streetscapes, as well as attractive landscaping, which can be developed through site
controls and design guidelines.
2.5 How Does AEGD Rank – Strengths and Weaknesses
The following provides a summary of AEGD’s strengths and potential weakness based on the
above analysis.
Strengths
• The AEGD has direct access/visibility to Highway 6, a limited access highway, which
connects to Highway 403 located less than 1 km to the north;
• The Park is adjacent to the HIA, one of the region’s largest airports in terms of
passenger and cargo traffic. The proximity and access to a major airport and related
services is a core competitive advantage which few other employment areas in the
region offer;
• Access to the airport from Niagara and the U.S. has been greatly enhanced with the
recent completion of the Redhill Creek Expressway;
• The Park is situated adjacent to the Airport Business Park. The clustering of employment
lands is an effective means of creating a critical mass;
• The Park is of competitive size and is self contained, which is a important feature for a
business park;
• A large portion of the Prestige designated lands are concentrated on the west side of the
park with direct exposure and access to Highway 6;
• Light Industrial lands are clustered and located on the periphery of the park;
• Employment lands are well configured, contiguous and are well suited for larger size
parcels and conducive for a broad range of industrial and commercial uses;

Hamilton Airport Employment Growth District - Phase 2 Financial/Economic Impact Analysis and Marketing Strategy
Dillon Consulting Ltd. 22 Watson & Associates Economists Ltd.
• The park features large Core Natural Features Areas, which enhance the aesthetic
appeal of the park;
• The transitional employment zones potentially act as an effective buffer from residential
lands on the north side of the park;
• A wide range of permitted uses are proposed across the various designated land uses
including Airport-Related Business, Airport-Related Commercial, Prestige Business Park
and Light Industrial;
• The Park will be subject to urban design guidelines and extensive landscaping. A higher
urban design will be required for the Prestige Business Park; and
• AEGD is a key component of the City’s future Bus Rapid Transit (BRT) or Light Rail
Transit (LRT) system which will increase its economic potential over the longer term.
Potential Weaknesses
• Height restrictions may potentially limit the built form and building options in the AEGD;
• The AEGD is unprecedented in size in the context of Hamilton and the HIA. Staging and
phasing of the employment lands will need to be carefully planned and monitored to
coincide with absorption rates and HIA expansion and growth (passenger and cargo);
and
• A limited area of the AEGD Secondary Plan Area has direct access/exposure to
Highway 6.
Hamilton Airport Employment Growth District - Phase 2 Financial/Economic Impact Analysis and Marketing Strategy
Dillon Consulting Ltd. 23 Watson & Associates Economists Ltd.
33..00 AAnnttiicciippaatteedd DDeevveellooppmmeenntt aanndd EEccoonnoommiicc IImmppaaccttss The following Chapter provides an analysis of the AEGD regarding the potential drivers of future
employment growth, forecast employment growth by sector and land use, employment density
and the economic impacts of anticipated development. This Chapter builds on the previous
analysis carried out in the Phase 1 Secondary Plan.
3.1 Economic Drivers of Future Employment Growth in the AEGD
While Hamilton’s share of employment growth within the GTAH employment market area has
historically been limited, there are several factors which suggest that Hamilton’s share will
increase over the next 25 years. The following drivers of future employment growth and
employment land needs have been identified for the City of Hamilton, which supports the trend
for a larger employment growth share in the City over the 2009 to 2031 planning period and
beyond.
1. Diminishing GTAH Employment Lands Supply
Historical growth on employment lands within the GGH has largely been concentrated in the
western half of the GTAH. This is largely due to the extensive transportation infrastructure of
the area including a network of 400 series highways, access to commercial air travel, freight and
delivery services via Pearson International Airport, intermodal facilities, and proximity to U.S
employment markets. As a result, west GTAH municipalities such as Mississauga and
Brampton have traditionally been successful in attracting a steady absorption of new industries
with a broad range of industrial and commercial sectors.
Within the GTAH, the availability of vacant designated employment lands is tightening up
considerably. Additional “greenfield” lands are becoming more limited as a considerable portion
of potentially developable greenfield lands have been removed from the supply inventory under
the Oak Ridges Moraine Conservation Act, 2001, and Greenbelt Protection Act, 2005.

Hamilton Airport Employment Growth District - Phase 2 Financial/Economic Impact Analysis and Marketing Strategy
Dillon Consulting Ltd. 24 Watson & Associates Economists Ltd.
Within the west GTAH the supply of vacant greenfield employment lands is steadily diminishing
in Mississauga, Brampton, Oakville, Burlington, Caledon and Milton. At present, Mississauga’s
employment land supply is already over 85% built out, and limited new Greenfield areas exist. In
Brampton, which has traditionally been an attractive area for warehousing and transportation,
designated vacant employment land supply is sufficient to accommodate growth over the next
15 years while future designated employment area opportunities will be subject to the approval
of the Brampton Northwest Expansion Area. Meanwhile, Caledon has sufficient designated
vacant employment lands to accommodate growth for the next 13 years.1 In Burlington, the
Niagara Escarpment Greenbelt constrains development potential north of Highway 407, limiting
the City’s greenfield areas that are available for future employment lands development. The
City also has a limited number of larger vacant parcels in designated vacant employment lands.
Meanwhile, Oakville, has an adequate level of employment land supply available (20+ years).
Milton, a municipality which has experienced considerable land expansive development, has
sufficient vacant supply to accommodate employment growth for the next 10 years. As
employment lands supply steadily declines in several GTAH communities, municipalities to the
west, including the City of Hamilton, are becoming increasingly attractive for employment lands
development.
2. Niagara to GTA (NGTA) Transportation Corridor
The Niagara to GTA (NGTA) Corridor Planning and EA Study is currently being undertaken by
the Ontario Ministry of Transportation (MTO) in accordance with the Ontario Environmental
Assessment Act (EA Act) and the EA Terms of Reference, which are approved by the Minister
of the Environment in June, 2006.
In June, 2010 the NGTA Study Team held the fourth round of Public Information Centres (PICS)
to present and receive feedback on the assessment of the transportation alternatives and the
draft multi-modal Transportation Development Strategy for the Niagara to GTA Transportation
Corridor.
1 Caledon employment lands supply includes Mayfield West.

Hamilton Airport Employment Growth District - Phase 2 Financial/Economic Impact Analysis and Marketing Strategy
Dillon Consulting Ltd. 25 Watson & Associates Economists Ltd.
Key recommended priorities include:
• A Hamilton focused Inter-Regional Transit System to bring commuters to Hamilton City
Centre from outlying areas;
• Improve access to Hamilton Port from the Highway network;
• Improve access to the HIA from the Highway network;
• Address CP Rail corridor constraints; and
• Address constraints associated with the existing CN lift bridge in St. Catharines.
In addition to the above priorities, a number of key transportation strategies have also been
identified related to longer term highway widening and new transportation corridor planning,
including:
• A new multiuse corridor between Highway 407 and Highway 403 (in Hamilton) and
Highway 406 to the QEW;
• Strategic Highway QEW widening from Oakville to St. Catharines;
• Highway realignments and upgrades on Highway 403 through Hamilton, Highway 6
south of Highway 401; Highway 6 south of Highway 403 (Hamilton); Highway 403 from
the QEW northerly to Highway 407; Highway 401; and Complete QEW widening to
Highway 420.
The transportation strategy also recommends that the existing highway system should be
actively monitored to assess how population and employment growth rates and patterns are
changing, to determine when corridor planning should be undertaken between Welland and
Hamilton over the longer term.
It is anticipated that MTO will release their draft Transportation Development Strategy in early
October 2010 for public review and comment. The final MTO report is expected to be released
in March 2011.

Hamilton Airport Employment Growth District - Phase 2 Financial/Economic Impact Analysis and Marketing Strategy
Dillon Consulting Ltd. 26 Watson & Associates Economists Ltd.
3. Access to Labour Force Pool/Synergies with Post Secondary Institutions
As highlighted in the Phase 1 Secondary Plan, Hamilton employers are able to draw from a
wide local labour force pool. There is also opportunity to build partnerships and synergies with
post secondary institutions including McMaster University and Mohawk College. This includes
the potential to build on the concept of the West Hamilton Innovation District Special Policy Area
and the McMaster Innovation Park, with application to the AEGD focused on innovation for
corporate, academic and government research in science and technology.
Similar synergies have been successfully developed in the Cities of Waterloo and Guelph. In
Waterloo, the University of Waterloo Research and Technology Park is a key employment area
in the City and has developed strong synergies between the academic (University of Waterloo)
and private sectors. In Guelph, the University of Guelph Research Park is focused on research
and development activities affiliated with the University of Guelph.
4. Competitive Industrial Land Prices Serviced industrial land values within the larger urban centres of the west and north GTA range
from a low of $600,000 per acre in Brampton to nearly $800,000 per acre in Mississauga.
Average prices in Milton and Oakville average around $500,000 per acre while in Burlington
land prices are $400,000 per acre. Average industrial land values for vacant serviced industrial
within the AEGD are anticipated to be in the $250,000-$300,000 range. Competitive industrial
land prices, combined with a diminishing supply of available vacant industrial land throughout
many of the more heavily urbanized municipalities of the west and north GTA enhances the
market potential of the AEGD.
3.2 AEGD Employment Growth Forecast
Given its strategic advantages and location, as discussed in Chapter 1, AEGD’s employment
lands development potential is anticipated to be concentrated in advanced manufacturing,

Hamilton Airport Employment Growth District - Phase 2 Financial/Economic Impact Analysis and Marketing Strategy
Dillon Consulting Ltd. 27 Watson & Associates Economists Ltd.
warehousing, transportation and logistics, business services, and accommodation and food
services.
This section provides an analysis of the long-term employment growth potential of the AEGD.
Specifically, the following topics have been explored:
• Forecast long-term employment growth by sector, according to the AEGD’s unique
geography and proximity to the HIA;
• Employment density and the relative targets as set by the City of Hamilton;
• Employment forecast by major land use; and
• Forecast land absorption.
3.2.1 Employment by Sector and Sub-sector
By 2031, the AEGD is anticipated to have employment growth of 24,360. By buildout
employment is anticipated to increase to 43,200.
It is anticipated that a large percentage share of the future employment growth in this area will
be dominated by land extensive, low-density employment in the warehousing/transportation and
wholesale trade sectors (approximately 45% of total employment growth), as shown in Tables 3-
1a and 3-1b. It should be noted that a limited portion of potential warehousing/transportation
facilities also accommodate office development. Other key employment growth sectors include:
business services, manufacturing, retail and accommodation and food services, a portion of
which tend to generate higher average employment density, good spin-off job opportunities, and
a high percentage of well paying full-time jobs.

Hamilton Airport Employment Growth District - Phase 2 Financial/Economic Impact Analysis and Marketing Strategy
Dillon Consulting Ltd. 28 Watson & Associates Economists Ltd.
Table 3-1a
Employment Sector Employment by Sector
Percent Employment
by Sector
Emp./Net Acre Emp./Net Ha Acres Ha
Utilities & Construction 850 3.5% 14 34 62 25.3 Manufacturing 1,950 8.0% 17 41 116 47.1 Wholesale Trade / Transportation and Warehousing 10,960 45.0% 10 24 1,132 458.2 Business Services1 5,120 21.0% 49 122 104 41.9 Retail, Accommodation and Food Services 3,660 15.0% 28 69 131 52.9 Public Administration 600 2.5% 26 65 23 9.3 Other Services 1,220 5.0% 18 45 67 27.2 Total 24,360 100.0% 15 37 1,635 662 Source: Watson & Associates Economists Ltd., 2010.
Employment Land Needs on Employment
Lands
Note: Employment density f igures are based on employment targets as per the City of Hamilton comprehensive employment study. They do not necessarily reflect the densities that w ould occur based on anticipated market trends.
Hamilton Airport Employment Growth District (AEGD) Employment Forecast on Employment Lands by Sector, 2031
1. Business Services includes: Information and Cultural Industries, Finance and Insurance, Real Estate and Rental and Leasing, Professional, Scientif ic and Technical Services, Management of Companies and Enterprises, Administrative and Support, Waste Management and Remediation Services.
Employment Density
Table 3-1b
Employment Sector Employment by Sector
Percent Employment
by Sector
Emp./Net Acre
Emp./Net Ha Acres Ha
Utilities & Construction 1,512 3.5% 14 34 111 45.0 Manufacturing 3,456 8.0% 17 41 206 83.5 Wholesale Trade / Transportation and Warehousing 19,440 45.0% 10 24 2,008 812.7 Business Services1 9,072 21.0% 49 122 183 74.2 Retail, Accommodation and Food Services 6,480 15.0% 28 69 231 93.6 Public Administration 1,080 2.5% 27 67 40 16.1 Other Services 2,160 5.0% 18 45 119 48.2 Total 43,200 100.0% 15 37 2,899 1,173 Source: Watson & Associates Economists Ltd., 2010.
Hamilton Airport Employment Growth District (AEGD)Employment Forecast on Employment Lands By Sector, Buildout
Employment DensityEmployment Land
Needs on Employment Lands
Note: Employment density f igures are based on employment targets as per the City of Hamilton comprehensive employment study. They do not necessarily reflect the densities that w ould occur based on anticipated market trends.
1. Business Services includes: Information and Cultural Industries, Finance and Insurance, Real Estate and Rental and Leasing, Professional, Scientif ic and Technical Services, Management of Companies and Enterprises, Administrative and Support, Waste Management and Remediation Services.

Hamilton Airport Employment Growth District - Phase 2 Financial/Economic Impact Analysis and Marketing Strategy
Dillon Consulting Ltd. 29 Watson & Associates Economists Ltd.
3.2.2 Employment Density by Sector and Total Employment Density For each of the employment sub-sectors identified in Table 3-1a and 3-1b, a net density
assumption (i.e. employees/net Ha) has been applied to determine the overall employment land
need impacts within the subject area. As mentioned earlier, the land needs of the wholesale
trade, warehousing and transportation sectors are the largest, with 458 and 818 hectares
forecast for 2031 and buildout respectively.
The calculated overall weighed density for employment on employment lands for the wholesale
trade and transportation and warehousing sector is 24 employees/net Ha (10 employees/net
acre), which is below the City-wide density target of 37 employees/net ha. To ensure that
Hamilton meets its City-wide target of 37 employees/ha, the City will need to ensure that
employment density on all other employment lands average approximately 42 employees per
Ha.
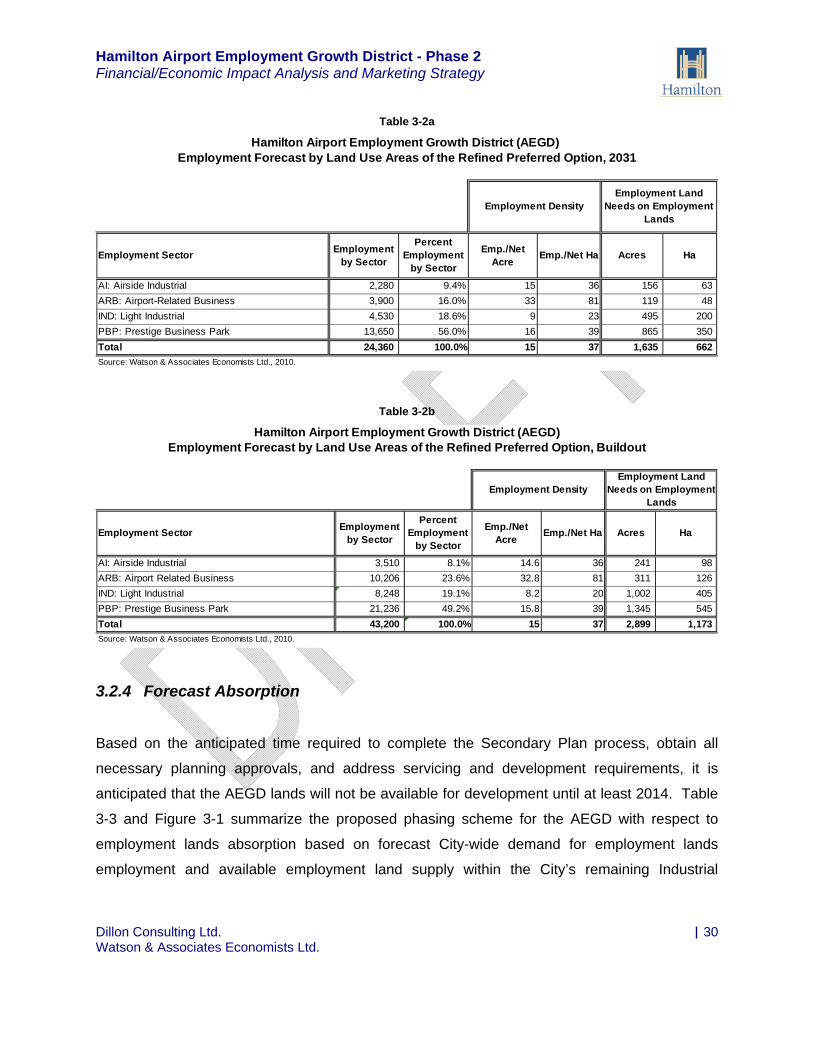
3.2.3 Employment by Major Land Use Table 3-2a and 3-2b summarize the amount of employment in the AEGD by the major land use
categories identified in section 1.1. Prestige Business Park is the major sector, comprising 56%
of the employment of the AEGD by 2031. At buildout its share is set to diminish to just under
50% as more airport related commercial establish themselves within the AEGD.
Hamilton Airport Employment Growth District - Phase 2 Financial/Economic Impact Analysis and Marketing Strategy
Dillon Consulting Ltd. 30 Watson & Associates Economists Ltd.
Table 3-2a
Employment Sector Employment by Sector
Percent Employment
by Sector
Emp./Net Acre
Emp./Net Ha Acres Ha
AI: Airside Industrial 2,280 9.4% 15 36 156 63 ARB: Airport-Related Business 3,900 16.0% 33 81 119 48 IND: Light Industrial 4,530 18.6% 9 23 495 200 PBP: Prestige Business Park 13,650 56.0% 16 39 865 350 Total 24,360 100.0% 15 37 1,635 662 Source: Watson & Associates Economists Ltd., 2010.
Employment Forecast by Land Use Areas of the Refined Preferred Option, 2031
Employment DensityEmployment Land
Needs on Employment Lands
Hamilton Airport Employment Growth District (AEGD)
Table 3-2b
Employment Sector Employment by Sector
Percent Employment
by Sector
Emp./Net Acre
Emp./Net Ha Acres Ha
AI: Airside Industrial 3,510 8.1% 14.6 36 241 98 ARB: Airport Related Business 10,206 23.6% 32.8 81 311 126 IND: Light Industrial 8,248 19.1% 8.2 20 1,002 405 PBP: Prestige Business Park 21,236 49.2% 15.8 39 1,345 545 Total 43,200 100.0% 15 37 2,899 1,173 Source: Watson & Associates Economists Ltd., 2010.
Hamilton Airport Employment Growth District (AEGD)Employment Forecast by Land Use Areas of the Refined Preferred Option, Buildout
Employment DensityEmployment Land
Needs on Employment Lands
3.2.4 Forecast Absorption Based on the anticipated time required to complete the Secondary Plan process, obtain all
necessary planning approvals, and address servicing and development requirements, it is
anticipated that the AEGD lands will not be available for development until at least 2014. Table
3-3 and Figure 3-1 summarize the proposed phasing scheme for the AEGD with respect to
employment lands absorption based on forecast City-wide demand for employment lands
employment and available employment land supply within the City’s remaining Industrial

Hamilton Airport Employment Growth District - Phase 2 Financial/Economic Impact Analysis and Marketing Strategy
Dillon Consulting Ltd. 31 Watson & Associates Economists Ltd.
Business Parks. As illustrated in Table 3-3, approximately 56% of the AEGD lands are
anticipated to be absorbed by 2031.
Table 3-3
Year Hectares Acres2011-2016 17 422016-2021 195 4822021-2026 225 5562026-2031 225 5562006-2031 662 1,635
Forecast Absorption on Employment Lands, 2011-2031Hamilton Airport Employment Growth District

Hamilton Airport Employment Growth District - Phase 2 Financial/Economic Impact Analysis and Marketing Strategy
Dillon Consulting Ltd. 32 Watson & Associates Economists Ltd.
512
2535
45 45 45 45 45 45 45 45 45 45 45 45 45
0102030405060708090
Hect
ares
Years
Figure 3-1Hamilton Employment Growth District
Forecast Absorption of Employment Lands (Net Hectares) 2011-2031
Absorption of Employment Lands

Hamilton Airport Employment Growth District - Phase 2 Financial/Economic Impact Analysis and Marketing Strategy
Dillon Consulting Ltd. 33 Watson & Associates Economists Ltd.
3.3 Economic Impacts of Proposed Development
Employment lands are an integral part of the City’s economic development potential. All
employment can be categorized as being “basic” or “non-basic” in terms of its relationship to the
local economy. “Basic” employment is that which primarily involves service to non-local
markets. “Non-basic” employment is largely “population-related” and is geared to the local
residential and business market. Basic employment is the “engine” of economic growth -
maintaining an adequate “basic” employment base is fundamental to providing potential “spin-
off” employment and income opportunities in the “non-basic” sector.
Employment lands are important because they accommodate “basic” employment. From an
economic development perspective, maintaining an adequate employment lands base is
fundamental to providing competitive local “basic” employment opportunities. The majority of
anticipated employment growth in the AEGD is defined as “basic” employment.
The following section explores a number of the key economic and socio-economic impacts
associated with the development of the AEGD. Specific areas of consideration include:
• Employment Activity Rate (ratio of employment to population);
• Employment multipliers or “spin-off” employment potential;
• Temporary Employment Growth; and
• Induced Economic Impacts.
Employment Activity Rate
An employment activity rate is defined as the ratio of total locally-based jobs to total locally-
based population. As of 2006, the employment activity rate for the City of Hamilton was 39%.
Over the 2011 to 2031 forecast period, the City’s employment activity rate is anticipated to
increase moderately to 43%.1
1 Excludes Census population undercount.

Hamilton Airport Employment Growth District - Phase 2 Financial/Economic Impact Analysis and Marketing Strategy
Dillon Consulting Ltd. 34 Watson & Associates Economists Ltd.
A healthy balance between local population and employment is echoed throughout many of the
guiding principles of the Provincial Growth Plan for the Greater Golden Horseshoe (Places to
Grow)1 that stress the importance of “vibrant” and “complete communities” which support a
“strong and competitive economy.” With the development of the AEGD, the City will be better
positioned over the long term to build a balanced and complete community, increase its non-
residential tax assessment base, reduce commuting dependency and traffic congestion, and
generally improve environmental, health and socio-economic conditions.
Employment Multipliers or “Spin-Off” Employment Potential
As previously identified, Hamilton is forecast to add 24,360 jobs in the AEGD by 2031 and is
expected to produce 43,200 total jobs by buildout. Tables 3-4a and 3-4b summarize the
potential “spin-off” employment by sector using employment multiplier data. Employment
multipliers provide a summary of the indirect economic effect or “shock” from income and/or
employment generated by a particular employment sector. This analysis has been based on
2005 Provincial Multipliers available in the Statistics Canada Input/Output model, which
provides a comprehensive accounting model of the inter-industrial structure of the Ontario
economy.
For the purpose of this analysis, the 20-year and buildout forecast periods have been used to
measure the associated economic impact of development. The results of this analysis identify
that the 2031 employment forecast for the AEGD could potentially yield up to an additional
11,800 indirect jobs distributed on a broad regional basis. Also, the 43,200 direct jobs at
buildout of the AEGD could potentially yield up to an additional 20,400 indirect jobs.
1 Places to Grow. Better Choices. Brighter Future. Growth Plan for the Greater Golden Horseshoe
2006. Ministry of Public Infrastructure Renewal.

Hamilton Airport Employment Growth District - Phase 2 Financial/Economic Impact Analysis and Marketing Strategy
Dillon Consulting Ltd. 35 Watson & Associates Economists Ltd.
In accordance with the rate of anticipated employment growth by employment sector and the
specific multipliers calculated by sector, spin-off employment is anticipated to be distributed as
follows:
29%
21% 21%
18%
3%3%
3%2%0%
Figure 3-2Hamilton Airport Employment Growth District (AEGD)
Potential "Spin-off" Employment Opportunities Associated with Preferred Employment Scenario based on 2005 Multiplier
Transportation and warehousing;
Wholesale and retail trade;
“Knowledge-based” employment sectors;Manufacturing;
Construction;
Accommodation and Food;
Other; (residual)
Government; and
Arts
Source: Statistics Canada 2005 Input/Output Model

Hamilton Airport Employment Growth District - Phase 2 Financial/Economic Impact Analysis and Marketing Strategy
Dillon Consulting Ltd. 36 Watson & Associates Economists Ltd.
Table 3-4a
Employment Sector Employment by Sector
2005 Multiplier1
Additional Employment
Agriculture, forestry, fishing and hunting - 1.43 - Mining and oil and gas extraction - 1.95 - Utilities 240 1.67 161 Construction 610 1.51 309 Manufacturing 1,950 2.06 2,074 Wholesale trade 4,870 1.45 2,198 Retail trade 1,220 1.17 213 Transportation and warehousing 6,090 1.54 3,289 Information and cultural industries 610 1.69 420 Finance and insurance 240 2.21 290 Real estate and rental and leasing 610 2.21 736 Professional, scientific and technical services 2,440 1.37 898 Management of companies and enterprises 610 0.00 - Administrative and support, waste management and remediation services 610 1.17 103 Educational services - 1.09 - Health care and social assistance - 1.14 - Arts, entertainment and recreation - 1.32 - Accommodation and food services 2,440 1.16 393 Other services (except public administration) 1,220 1.11 129 Public administration 600 1.46 276 Total 24,360 11,489 Source: Watson & Associates Economists Ltd., 2010.1. Statistics Canada Provincial Input-Output Multipliers, 2005.
2031
Potential "Spin-off" Employment Opportunities Associated with PreferredEmployment Scenario based on 2005 Multiplier
Hamilton Airport Employment Growth District (AEGD)

Hamilton Airport Employment Growth District - Phase 2 Financial/Economic Impact Analysis and Marketing Strategy
Dillon Consulting Ltd. 37 Watson & Associates Economists Ltd.
Table 3-4b
Employment Sector Employment by Sector
2005 Multiplier1
Additional Employment
Agriculture, forestry, fishing and hunting - 1.43 - Mining and oil and gas extraction - 1.95 - Utilities 432 1.67 290 Construction 1,080 1.51 547 Manufacturing 3,456 2.06 3,675 Wholesale trade 8,640 1.45 3,899 Retail trade 2,160 1.17 377 Transportation and warehousing 10,800 1.54 5,833 Information and cultural industries 1,080 1.69 744 Finance and insurance 432 2.21 521 Real estate and rental and leasing 1,080 2.21 1,303 Professional, scientific and technical services 4,320 1.37 1,590 Management of companies and enterprises 1,080 0.00 - Administrative and support, waste management and remediation services 1,080 1.17 183 Educational services - 1.09 - Health care and social assistance - 1.14 - Arts, entertainment and recreation - 1.32 - Accommodation and food services 4,320 1.16 696 Other services (except public administration) 2,160 1.11 228 Public administration 1,080 1.46 497 Total 43,200 20,383 Source: Watson & Associates Economists Ltd., 2010.1. Statistics Canada Provincial Input-Output Multipliers, 2005.
Hamilton Airport Employment Growth District (AEGD)Potential "Spin-off" Employment Opportunities Associated with Preferred
Employment Scenario based on 2005 MultiplierBuildout
While the potential indirect economic impact will be concentrated in Transportation and
Warehousing employment sectors, a significant percentage of economic spin off is also
anticipated in the “knowledge-based” and manufacturing sector. This highlights the importance
of attracting and retaining local employment growth in these sectors.
Temporary (Construction) Employment Growth
Anticipated non-residential development will also influence growth within temporary employment
sectors such as the construction industry. During the construction phase, expenditures will be
made for the construction of buildings and infrastructure. This investment will create
employment associated with construction as well as generate spending on materials and
Hamilton Airport Employment Growth District - Phase 2 Financial/Economic Impact Analysis and Marketing Strategy
Dillon Consulting Ltd. 38 Watson & Associates Economists Ltd.
services required. Additional benefits (multipliers) will be derived as employees spend income
earned in the local economy.
Tables 3-5a and 3-5b provide an estimate of direct and indirect temporary employment
generated (in person years) for every $1,000 spent on non-residential construction, as well as
the purchase materials, equipment and services by the commercial operations, using
employment multiplier data available from the Statistics Canada Input-Output model.1
The construction of new non-residential development would generate a total of 79,358 person
years (of temporary construction) employment throughout the AEGD over the 2031 forecast
period and more than 130,335 person years employment by buildout of the study area. Based
on an average of 20 years of work per employee, this would generate the demand for
approximately 4,000 and 6,500 construction employees for Hamilton and the surrounding area
over the respective 20-year and buildout forecasts.2 Note: additional employment generated
from the construction of infrastructure associated with new development has been excluded
from this analysis. Increased non-residential construction is also anticipated to generate
economic job opportunities for individuals in Hamilton related to real estate, property
maintenance, landscaping, and other construction-related trades.
Induced Economic Impacts of Population and Employment Growth
In addition to the direct and indirect employment impacts identified above, induced economic
effects can also be anticipated from increased labour income and wealth generated from local
employment opportunities. In turn, this will generate growth in household savings, taxation,
consumption of goods and services within the local economy. This increase in demand will
result in further expansion on the local and regional employment market, largely in the retail and
business services sector.
1 For the purposes of this exercise, it was necessary to estimate construction costs in 2005 $ in order to use available Statistics Canada I/O multiplier data to calculate employment generated. The cost of constructing residential and non-residential development has been based on industry averages for 2005 using the Reed Construction Cost Index. 2 A portion of these jobs would be filled by existing construction employees.

Hamilton Airport Employment Growth District - Phase 2 Financial/Economic Impact Analysis and Marketing Strategy
Dillon Consulting Ltd. 39 Watson & Associates Economists Ltd.
Table 3-5a
Employment Sector Employment by Sector Total Sq. Ft.1
Value of Construction 000's 2009$
Value of Construction 000's 2005$
Direct Indirect Total Direct Indirect Total
Industrial 14,065 17,581,250 7,032,500$ 6,157,246$ 0.00786 0.00309 0.01095 48,396 19,026 67,422 Commercial 9,695 5,332,250 1,173,095$ 991,174$ 0.00786 0.00309 0.01095 7,791 3,063 10,853 Institutional 600 420,000 109,200$ 98,840$ 0.00786 0.00309 0.01095 777 305 1,082 Total 24,360 23,333,500 8,314,795$ 7,247,261$ 56,963 22,394 79,358 Source: Watson & Associates Economists Ltd., 2010Additional Employment calculated from Statistics Canada Provincial Input-Output Multipliers, 2005.1. Square Foot Per Employee Assumptions
Industrial 1250Commercial/ Population Related 550Institutional 700
Person Years of Employment GeneratedEmployment Multipliers
Hamilton Airport Employment Growth District (AEGD)Employment Impacts of Growth on Temporary Employment (Construction), 2031
Table 3-5b
Employment Sector Employment by Sector Total Sq. Ft.1
Value of Construction 000's 2009$
Value of Construction 000's 2005$
Direct Indirect Total Direct Indirect Total
Industrial 24,948 31,185,000 11,550,000$ 10,112,505$ 0.00786 0.00309 0.01095 79,484 31,248 110,732 Commercial 17,172 9,444,600 1,923,900$ 1,625,546$ 0.00786 0.00309 0.01095 12,777 5,023 17,800 Institutional 1,080 756,000 182,000$ 164,734$ 0.00786 0.00309 0.01095 1,295 509 1,804 Total 43,200 41,385,600 13,655,900$ 11,902,785$ 93,556 36,780 130,335 Source: Watson & Associates Economists Ltd., 2010.Additional Employment calculated from Statistics Canada Provincial Input-Output Multipliers, 2005.1. Square Foot Per Employee Assumptions
Industrial 1250Commercial/ Population Related 550Institutional 700
Employment Multipliers Person Years of Employment Generated
Hamilton Airport Employment Growth District (AEGD)Employment Impacts of Growth on Temporary Employment (Construction), Buildout
Hamilton Airport Employment Growth District - Phase 2 Financial/Economic Impact Analysis and Marketing Strategy
Dillon Consulting Ltd. 40 Watson & Associates Economists Ltd.
44..00 TThhee CCiittyy’’ss RRoollee iinn DDeevveellooppiinngg tthhee AAEEGGDD The City has a strong and successful history of industrial land development. However, there is
a potential role for the private sector in the development of the AEGD. The purpose of this
Chapter is to explore the role and approach for the City regarding employment land assembly
and development of the AEGD.
4.1 Municipal Trends
In recent decades, most industrial/business parks in the “Outer Ring” of the GGH and beyond,
including areas west of Hamilton have been municipally developed, whereas in the core GTAH,
they have been privately developed. Examples of communities in the “Outer Ring” of the GGH
and beyond which have had active municipal land development include Brantford, Cambridge,
Guelph, Kitchener, London and Waterloo.
Generally, market values for industrial/business park lands are strongly correlated to GTAH
proximity. Lower land prices and slower rates of development outside of the GTAH create
difficulties in sustaining private sector development of employment lands requiring municipal
development of industrial/business parks.
To allow for a minimum return on investment, market value of serviced land typically has to be
in excess of $150,000 per acre. The potential for private sector development above this point
increases with the market value of serviced land. Most communities in the “Outer Ring” of the
GGH and beyond, including Brantford and London have serviced land market values below
$150,000. In contrast, Cambridge, Kitchener, Waterloo and Guelph have land market values
that are in the range of $200,000 and $300,000 per serviced acre, which meet the conditions
required to sustain a moderate degree of private development sector.
4.2 Development Approach
Given the current market for employment lands in Hamilton, the private sector is sufficiently
strong and economically viable to support large-scale employment lands development. It is also
recognized that the AEGD developable lands are not currently owned by the City, and would

Hamilton Airport Employment Growth District - Phase 2 Financial/Economic Impact Analysis and Marketing Strategy
Dillon Consulting Ltd. 41 Watson & Associates Economists Ltd.
need to be purchased at market rates in order to pursue municipal land development of the
area. This presents a challenge to the City. It is recommended that a coordinated approach
between the City and the development community be considered for the AEGD lands to:
• Ensure control of development and timing;
• Properly market the AEGD lands;
• Provide market choice of employment lands by land owner/developer, location, site size,
price and access/exposure; and
• Minimize financial risk.

Hamilton Airport Employment Growth District - Phase 2 Financial/Economic Impact Analysis and Marketing Strategy
Dillon Consulting Ltd. 42 Watson & Associates Economists Ltd.
55..00 AAEEGGDD FFiissccaall IImmppaaccttss ooff DDeevveellooppmmeenntt The following chapter provides a detailed analysis of the fiscal impacts of the proposed AEGD
development on the City’s operating and Capital expenditures.
5.1 Operating Expenditure Implications
Table 5-1 summarizes the City’s “Revenue Fund” or “Operating Fund” transactions for 2008, as
reported in the City’s 2008 FIR. This represents a simple “model” of the City’s financial position
for the operating fund and provides the structure of the financial impact analysis contained
herein.
Table 5-2 modifies the operating expenditures shown in Table 5-1 by netting “Net Debt
Charges” and “Own Fund Transfers” from the total. The debt charges are for “sunk”
investments, unaffected by growth. The own fund transfers can vary significantly from year to
year and relate largely to capital expenditures and general reserve contributions, which are
addressed separately in this analysis. It is therefore appropriate to remove these two classes of
expenditures from the net spending base, before determining the average operating fund
spending levels per capita and employee.
Secondly, user fees and service charges were deducted on a service-by-service basis. These
revenue items are expected to increase generally in direct proportion to future growth and
expenditure increases. These revenues can be most readily provided for in this way, on a net
expenditure basis, as each expenditure category is expected to increase at different rates,
which would otherwise complicate the forecasting of individual revenues, if they were addressed
separately.

Hamilton Airport Employment Growth District - Phase 2 Financial/Economic Impact Analysis and Marketing Strategy
Dillon Consulting Ltd. 43 Watson & Associates Economists Ltd.
2008 FIR$ (000's)
1 Expenditures1.01 General Government 106,598.71.02 Fire 69,503.51.03 Police 130,699.81.04 Protective Inspection and Control 18,108.91.05 Other Protection 9,582.11.06 Roadways & Winter control 101,625.01.07 Parking, streetlighting & other 24,247.01.08 Transit 86,175.21.09 Sanitary Sewer System 71,223.91.10 Storm Sewer System 14,684.51.11 Waterworks System 65,559.91.12 Waste collection 16,105.31.13 Waste disposal 15,794.21.14 Other Environmental Services 26,219.41.15 Cemeteries 3,338.21.16 Public Health 38,717.51.17 Ambulance 28,161.71.18 General Assistance 187,672.61.19 Assistance to Aged Persons 40,325.11.20 Child Care 51,405.31.21 Social Housing 104,235.31.22 Parks & Recreation 65,105.41.23 Libraries 30,740.61.24 Cultural Services 22,360.71.25 Planning and Zoning 23,804.01.26 Commercial and Industrial 12,214.8
Total 1,364,208.3
2 Revenue Fund Revenues2.01 Payments in lieu of taxes 11,443.32.02 Ontario unconditional grants (e.g. CRF) 51,090.42.03 Ontario conditional grants 217,201.62.04 Canada conditional grants 26,390.32.05 Revenue from other municipalities 2,016.82.06 User fees and service charges 252,477.32.07 Licenses, & Permits 13,129.42.08 Rents, concessions and franchises 41,143.12.09 POA and other fines 12,753.72.10 Penalties and interest on taxes 9,109.92.11 Investment income-From other 6,429.02.12 Donations 476.62.13 Sales of publications, equipment, etc. 158.82.14 Government Business Enterprise 18,555.02.15 Gaming & Casinos & Other Misc Cash Recovery 5,752.02.16 Contributions from Capital Fund 28,276.52.17 Contributions from reserves and reserve funds 30,061.02.18 Supplementary Taxes 8,233.72.19 Manual Adjustments 317.12.20 ROW/Utility Transmission & Corridors 3,200.92.21 Tax Adjustments (6,535.2)2.22 Surplus 1,838.8
Total Non-Tax Revenues 733,520.13 Net Expenditures (General Levy) 630,688.3
Total 1,364,208.3Sources: 2008 Financial Information Return
Table 5-1City Of Hamilton - AEGD
Summary Of Expenditures And Revenues, 2008

Hamilton Airport Employment Growth District - Phase 2 Financial/Economic Impact Analysis and Marketing Strategy
Dillon Consulting Ltd. 44 Watson & Associates Economists Ltd.
Net Long Term Own NETTOTAL Debt Charges Fund User Fees & OPERATING
EXPENDITURE CATEGORY EXPENDITURE Transfers Service Charges EXPENDITURE % $(000's) % $(000's)1.01 General Government 106,598.7 416.7 63,407.9 10,296.4 32,477.5 71.7% 23,293.3 28.3% 9,184.21.02 Fire 69,503.5 1,111.0 2,068.4 287.0 66,037.1 71.7% 47,362.7 28.3% 18,674.41.03 Police 130,699.8 1,311.0 2,499.4 4,990.9 121,898.6 71.7% 87,427.3 28.3% 34,471.31.04 Protective Inspection and Control 18,108.9 - 271.2 1,036.7 16,801.0 71.7% 12,049.9 28.3% 4,751.11.05 Other Protection 9,582.1 - 1,228.0 - 8,354.1 71.7% 5,991.7 28.3% 2,362.41.06 Roadways & Winter control 101,625.0 23,363.3 7,448.5 1,391.3 69,421.9 71.7% 49,790.3 28.3% 19,631.61.07 Parking, streetlighting & other 24,247.0 - 1,392.6 6,544.3 16,310.1 71.7% 11,697.8 28.3% 4,612.31.08 Transit 86,175.2 - 5,096.6 34,279.7 46,798.9 71.7% 33,564.8 28.3% 13,234.11.09 * Sanitary Sewer System n/a n/a n/a n/a n/a n/a n/a1.10 Storm Sewer System 14,684.5 494.5 12,628.8 28.8 1,532.4 71.7% 1,099.0 28.3% 433.31.11 * Waterworks System n/a n/a n/a n/a n/a n/a n/a1.12 Waste collection 16,105.3 - 54.2 1.4 16,049.7 71.7% 11,511.1 28.3% 4,538.71.13 Waste disposal 15,794.2 1,993.0 3,023.3 3,953.5 6,824.4 71.7% 4,894.6 28.3% 1,929.91.14 Other Environmental Services 26,219.4 1,486.7 1,735.4 5,770.3 17,227.0 71.7% 12,355.4 28.3% 4,871.61.15 Cemeteries 3,338.2 - 28.9 1,581.7 1,727.6 100.0% 1,727.6 0.0% 0.01.16 Public Health 38,717.5 15.6 87.9 994.0 37,620.0 90.0% 33,858.0 10.0% 3,762.01.17 Ambulance 28,161.7 - 1,110.0 34.5 27,017.2 71.7% 19,377.1 28.3% 7,640.11.18 General Assistance 187,672.6 - 1,668.2 406.9 185,597.5 95.0% 176,317.7 5.0% 9,279.91.19 Assistance to Aged Persons 40,325.1 2,520.5 1,241.6 9,306.7 27,256.2 100.0% 27,256.2 0.0% 0.01.20 Child Care 51,405.3 - 206.0 1,594.0 49,605.3 100.0% 49,605.3 0.0% 0.01.21 Social Housing 104,235.3 6,414.6 13,221.3 844.6 83,754.7 100.0% 83,754.7 0.0% 0.01.22 Parks & Recreation 65,105.4 2,431.0 2,257.0 7,973.6 52,443.7 95.0% 49,821.5 5.0% 2,622.21.23 Libraries 30,740.6 220.6 572.7 337.9 29,609.3 95.0% 28,128.8 5.0% 1,480.51.24 Cultural Services 22,360.7 - 129.6 8,843.8 13,387.3 95.0% 12,717.9 5.0% 669.41.25 Planning and Zoning 23,804.0 125.8 1,354.9 4,625.6 17,697.7 71.7% 12,693.0 28.3% 5,004.71.26 Commercial and Industrial 12,214.8 541.9 101.8 4,244.6 7,326.4 0.0% 0.0 100.0% 7,326.4
Total 1,227,424.5 42,446.2 122,834.2 109,368.3 952,775.8 796,295.7 156,480.0* Recovered from rates.
Sources: 2008 Financial Information Return
2009 Pop. (Est. as per DC Background Study) 525,000 71.7% Capital Spending From Current Budget: Total Expenditures 1,227,424.5 2009 Emp. (Est. as per DC Background Study) 207,000 28.3% -Debt 42,446.2
732,000 -Own Fund Transfers 122,834.2 -User Fees & Service Charges 109,368.3
=(42446.168+122834.24)/ 952,775.8 = 17.3%Round Up = 20.0%
H:\Hamilton\Hamilton Airport Employment District\[Hamilton Fiscal Impact 2008 (FIR).xls]Expenditures
Residential Share Non-residential Share
Table 5-2City Of Hamilton - AEGD
Summary Of Net Operating Expenditures For 2008$(000's)

Hamilton Airport Employment Growth District - Phase 2 Financial/Economic Impact Analysis and Marketing Strategy
Dillon Consulting Ltd. 45 Watson & Associates Economists Ltd.
Table 5-2 also provides for a calculation of the provision made by the City in 2008 for capital
spending from the current budget (debt and own fund transfers as a percentage of net operating
expenditures). This 17.3% (20% rounded) provision recognizes the accelerated use by growth
of existing assets not included in the development charge provision and the long term lifecycle
use and replacement of the new assets required by growth. In other words, this means that a
portion of the tax base is required to cover capital costs that are not fully covered by
development charges.
Table 5-3 allocates the City’s existing operating expenditure components between the needs of
residential development and non-residential development (i.e. industrial, commercial and
institutional), based on differences in the amount of such development and the need for
particular types of services in each case.
Table 5-3 further assesses each of the City’s key service components in relation to the
proposed development, to determine how the operating costs are likely to be impacted, based
on the general circumstances of each service. The expenditure allocation is then presented on
a per capita/per employee basis.
The “Basis for Potential Impact” column denotes a particular percentage factor in each case.
This factor reflects any variation from the current overall average per capita expenditure level,
which is likely to be involved in servicing a new development increment within the City. For
instance, if the average existing expenditure for a service such as Fire is $100 per household,
economies of scale or other efficiencies may indicate that service costs for the growth increment
alone are likely to be lower than average, say 90% (or $90 per capita), while being unaltered for
the existing population of the City.
These percentage attributions are used to compute an overall average incremental operating
cost per capita and per employee. These per capita and employee expenditure averages are
utilized, subsequently, to estimate the incremental expenditure requirement generated by
growth. This estimate is based on City-wide average costs. A more accurate measure would
reflect the area-specific impact of an individual development.

Hamilton Airport Employment Growth District - Phase 2 Financial/Economic Impact Analysis and Marketing Strategy
Dillon Consulting Ltd. 46 Watson & Associates Economists Ltd.
Expenditure Item Residential Non-Resid. Basis for Potential Impact Capita Employee
1.01 General Government 23,293.3 9,184.2 22.18 22.18
1.02 Fire 47,362.7 18,674.4 81.19 81.19
1.03 Police 87,427.3 34,471.3 149.88 149.88 1.04 Protective Inspection and Control 12,049.9 4,751.1 20.66 20.66 1.05 Other Protection 5,991.7 2,362.4 10.27 10.27 1.06 Roadways & Winter control 49,790.3 19,631.6 47.42 47.42 1.07 Parking, streetlighting & other 11,697.8 4,612.3 11.14 11.14 1.08 Transit 33,564.8 13,234.1 57.54 57.54 1.09 Sanitary Sewer System n/a n/a n/a n/a1.10 Storm Sewer System 1,099.0 433.3 1.88 1.88 1.11 Waterworks System n/a n/a n/a n/a1.12 Waste collection 11,511.1 4,538.7 21.93 21.93 1.13 Waste disposal 4,894.6 1,929.9 9.32 9.32 1.14 Other Environmental Services 12,355.4 4,871.6 21.18 21.18 1.15 Cemeteries 1,727.6 - 2.96 - 1.16 Public Health 33,858.0 3,762.0 58.04 16.36 1.17 Ambulance 19,377.1 7,640.1 33.22 33.22 1.18 General Assistance 176,317.7 9,279.9 302.26 40.35 1.19 Assistance to Aged Persons 27,256.2 - 46.72 - 1.20 Child Care 49,605.3 - 85.04 - 1.21 Social Housing 83,754.7 - 143.58 -
1.22 Parks & Recreation 49,821.5 2,622.2 85.41 11.40
1.23 Libraries 28,128.8 1,480.5 48.22 6.44 1.24 Cultural Services 12,717.9 669.4 21.80 2.91 1.25 Planning and Zoning 12,693.0 5,004.7 18.13 18.13 1.26 Commercial and Industrial - 7,326.4 - 26.55
Total Expenditures 796,295.7 156,480.0 1,299.98 609.94
Sources: 2008 Financial Information Return 2009 Pop. (Est. as per DC Background Study) 525,000 2009 Emp. (Est. as per DC Background Study) 207,000
" "75% cost attribution The planning processing operation is already sized to accommodate
75% cost attribution. Represents the potential for economies of scale.75% cost attribution The planning processing operation is already sized to accommodate
90% cost attribution. Costs per resident assumed to be largely in proportion to growth, with minor administrative economies (i.e. share of General Government expenditures and department administration).
" 90% cost attribution represents some potential for economies of scale.
" "
" "50% cost attribution. Basic road network in place. 50% cost attribution. Economies of scale associated with administration.
" "
n/a90% cost attribution represents the potential for economies of scale.
" "
90% cost attribution represents some potential for economies of scale.n/a
000's $ Expenditure Per
50% cost attribution. Basic organization structure in place. Significant economies expected.
90% cost attribution. Cost per resident likely to be maintained, other than minor administrative economies. (i.e. share of General Government expenditures and department administration)
Table 5-3City Of Hamilton - AEGD
Outline Of Basis For Net Operating Expenditure Impact Assumptions
Net 2008 Expenditure
" "
" "
90% cost attribution represents some potential for economies of scale.
100% cost attribution. Limited potential for economies of scale. " "
" "
" "

Hamilton Airport Employment Growth District - Phase 2 Financial/Economic Impact Analysis and Marketing Strategy
Dillon Consulting Ltd. 47 Watson & Associates Economists Ltd.
5.2 Operating Revenue Implications
Table 5-4 sets out the 2008 non-tax revenues for the City (as outlined in Table 5-1), and
identifies those non-tax revenues which are expected to be directly affected by growth. Table 5-
4 references only user fees/service charges as part of the total. They have already been
removed in calculating net expenditures, since they are expected to increase in direct proportion
to future spending increases. Grants and subsidies are not assumed to increase with growth.
These revenues are then allocated between population and employees to provide a per capita
and per employee non-tax revenue estimate.
5.3 Taxation Revenue
The property taxes generated by the various types of development are calculated as the City-
purpose tax rates for the applicable property types for the year 2008, applied against average
assessment estimates in each case. Assessment assumptions for commercial and industrial
development are based on industry standards, as an assessment and floor area sample was
not readily available.
The following City-wide tax rates for the year 2008 are applicable:
2008 Tax Rate %
City Wide Culture &
Recreation
Fire Transit Total
Industrial 3.524909 + 0.268776 + 0.556205 + 0.307782 = 4.657672%
Commercial 2.111846 + 0.161029 + 0.333234 + 0.184399 = 2.790508%
Institutional1 1.045822 + 0.079744 + 0.165023 + 0.091317 =1.381906%
1 For institutional development, the range of potential revenue can be quite considerable, i.e. private uses are taxable, federal/provincial uses would pay through payment-in-lieu (PIL) but perhaps at a lower assessment value, and municipal buildings would not be taxed. For analysis purposes, the above assumes private institutional at the residential tax rate to represent a lower overall average across the study area. It should be noted that institutional development is anticipated to account for less than 2% of the total new GFA forecast at buildout.

Hamilton Airport Employment Growth District - Phase 2 Financial/Economic Impact Analysis and Marketing Strategy
Dillon Consulting Ltd. 48 Watson & Associates Economists Ltd.
Table 5-4 City of Hamilton
Outline Of Basis For Net Operating Revenue Impact Assumptions
Revenue Item Total Residential Non-Resid. Basis for Potential Impact Capita Employee71.7% 28.3% $ $
2.01 Payments in lieu of taxes 11,443.3 - 11,443.3 - -
2.02 Ontario unconditional grants (e.g. CRF) 51,090.4 36,642.7 14,447.7 - -
2.03 Ontario conditional grants 217,201.6 155,779.8 61,421.8 - -
2.04 Canada conditional grants 26,390.3 18,927.4 7,462.8 - -
2.05 Revenue from other municipalities - - - - -
2.06 User fees and service charges 109,368.3 78,440.4 30,927.9 - -
2.07 Licenses, & Permits 13,129.4 9,416.6 3,712.8 17.94 17.94
2.08 Rents, concessions and franchises 41,143.1 29,508.4 11,634.7 56.21 56.21
2.09 POA and other fines 12,753.7 9,147.1 3,606.6 17.42 17.42
2.10 Penalties and interest on taxes 9,109.9 6,533.8 2,576.2 12.45 12.45
2.11 Investment income-From own funds - - - - -
2.11 Investment income-From other 6,429.0 4,610.9 1,818.0 - -
2.12 Donations 476.6 341.8 134.8 0.65 0.65
2.13 Sales of publications, equipment, etc. 158.8 113.9 44.9 0.22 0.22
2.14 Government Business Enterprise 18,555.0 13,307.9 5,247.1 25.35 25.35
No Impact Anticipated
No Impact Anticipated
Expected to increase in direct proportion to growth.
Expected to increase in direct proportion to growth.
Expected to increase in direct proportion to growth.
Primarilly Interest earnings. No impact antcipated.
Expected to increase in direct proportion to growth.
Revenue Per
No Impact Anticipated
Expected to increase in direct proportion to growth.
No Impact Anticipated
Net 2008 Revenue000's $
Expected to increase in direct proportion to growth.
n/a
Netted in Table 2.
Expected to increase in direct proportion to growth.
Expected to increase in direct proportion to growth.

Hamilton Airport Employment Growth District - Phase 2 Financial/Economic Impact Analysis and Marketing Strategy
Dillon Consulting Ltd. 49 Watson & Associates Economists Ltd.
Table 5-4 (Continued) City of Hamilton
Outline Of Basis For Net Operating Revenue Impact Assumptions
Revenue Item Total Residential Non-Resid. Basis for Potential Impact Capita Employee71.7% 28.3% $ $
2.15 Gaming & Casinos & Other Misc Cash Recovery 5,752.0 5,752.0 - 1.10 -
2.16 Contributions from Capital Fund 28,276.5 20,280.3 7,996.2 - -
2.17 Contributions from reserves and reserve funds 30,061.0 21,560.1 8,500.9 - -
2.18 Supplementary Taxes 8,233.7 5,905.3 2,328.4 - -
2.19 Manual Adjustments 317.1 227.4 89.7 - -
2.20 ROW/Utility Transmission & Corridors 3,200.9 2,295.7 905.2 - -
2.21 Tax Adjustments (6,535.2) (4,687.1) (1,848.1) - -
2.22 Surplus 1,838.8 1,318.8 520.0 - -
Total Revenues 588,394.2 415,423.4 172,970.9 131.32 130.23 n/a 130.23
Sources: 2008 Financial Information Return 2009 Pop. (Est. as per DC Background Study) 525,000 2009 Emp. (Est. as per DC Background Study) 207,000
The revenues generated from gaming are based on a wider service area and here a nominal 10% has been attributed to Hamilton (for analysis purposes). 100% of these revenues have been assigned to residential.$5,752,000 ÷525,000 X 10%
Revenue PerNet 2008 Revenue
000's $
Institutional Only
No Impact Anticipated
No Impact Anticipated
N/a. Full annual tax increase included elsewhere.
No Impact Anticipated
No Impact Anticipated
N/a. Full annual tax increase included elsewhere.
No Impact Anticipated

Hamilton Airport Employment Growth District - Phase 2 Financial/Economic Impact Analysis and Marketing Strategy
Dillon Consulting Ltd. 50 Watson & Associates Economists Ltd.
5.4 Net Fiscal Impact on the City
Table 5-5 summarizes the estimated net annual fiscal impact of various forms of non-residential
development on the City with respect to its own funds. The average annual operating surplus
(deficit) has been calculated as the difference between:
• Property taxation, based on the assumptions above in Section 5.3 Chapter Taxation
Revenue; plus
• Non-tax revenues, as estimated above in Section 5.2 Operating Revenue Implications;
• Operating expenditures, as addressed in Section 5.2 Operating Expenditure
Implications; and
• Capital spending from the current budget (20.0% of net operating expenditures), as
addressed in Section 5.2, Operating Expenditure Implications, and calculated in Tables
5-1 and 5-2.
On this basis, it is concluded that industrial and commercial development in the City can be
expected to generate an annual operating surplus, even using somewhat conservative
assessment assumptions. Institutional development is expected to yield a smaller surplus.
The fiscal impact per employee calculated in Table 5-5 is applied to the associated type of
development over two phases of development:
1. Phase 1 2011 to 2021 (6,000 employees); and
2. Phase 2 2021 to 2031 (18,360 employees).
The results of this analysis are shown in detail in Table 5-6. It is expected that each of the
growth periods evaluated would have a net positive impact on the City’s property taxes of
approximately $16.2 million (2011-2021), and $49.8 million (2021-2031) (2008 $).

Hamilton Airport Employment Growth District - Phase 2 Financial/Economic Impact Analysis and Marketing Strategy
Dillon Consulting Ltd. 51 Watson & Associates Economists Ltd.
Table 5-5
1 2 3
Industrial Commercial InstitutionalFinancial Component
Operating Expenditures
Sq.Ft. Per Employee1 1,250 550 700
Employees per 1,000 sq.ft. 0.80 1.82 1.43
X 609.94$ /employee 487.95$ 1,110.09$ 872.22$
Sub-Total 487.95$ 1,110.09$ 872.22$
Capital Spending from Current Budget
20% of other operating expenditures 97.59$ 222.02$ 174.44$
Total Annual Expenditures 585.54$ 1,332.11$ 1,046.66$
Revenues
Assessment for 2009 Tax Purposes (per Sq.ft. of GFA) 75$ 125$ 124$
Per 1,000 sq.ft. of GFA 75,000$ 125,000$ 124,000$
2008 Tax Rate 4.657672% 2.790508% 1.381906% 2
Property Tax Revenue Increase 3,493.25$ 3,488.14$ 1,713.56$
Non-Tax Revenue Employees per 1,000 sq.ft. 0.80 1.82 1.43
employees X 130.23$ /employee 104.18$ 237.00$ 186.23$
TOTAL ANNUAL REVENUES 3,597.43$ 3,725.14$ 1,899.79$
Annual Operating Surplus (Deficit) 3,011.89$ 2,393.03$ 853.13$ H:\Hamilton\Hamilton Airport Employment District\[Hamilton Fiscal Impact 2008 (FIR).xls]non-res summary
NOTE:
1
2 Represents 3
Employment density assumptions derived by Watson & Associates Economists Ltd., based on survey data for Greater Toronto Area.
Refer to industrial assessment sample (Appendix A).
City of HamiltonFiscal Impact Summary for Non-Residential Development

Hamilton Airport Employment Growth District - Phase 2 Financial/Economic Impact Analysis and Marketing Strategy
Dillon Consulting Ltd. 52 Watson & Associates Economists Ltd.
Employees onAEGD
Employment Land
Net Floor AreaSq. Ft. 1
Fiscal Impact
Fiscal Impactper sq.ft.
Industrial 3.01$ 14,065 17,581,250 52,919,563$
Commercial 2.39$ 9,695 5,332,250 12,744,078$
Institutional 0.85$ 600 420,000 357,000$
24,360 23,333,500 66,020,640$
Total
Source: Watson & Associates Economists Ltd.
1 Square Feet per EmployeeIndustrial 1,250Commercial 550Institutional 700
Total
Table 5-6City Of Hamilton - AEGD
Summary of Fiscal Impact of ICI Development (2031)
Employment Sector

Hamilton Airport Employment Growth District - Phase 2 Financial/Economic Impact Analysis and Marketing Strategy
Dillon Consulting Ltd. 53 Watson & Associates Economists Ltd.
5.5 Capital Fund Impacts
5.5.1 Introduction New development generates the need for additional City capital facilities, (potentially) including
new and expanded road facilities, treatment plants, pumping stations, sewer and water
collectors, trunks and mains, as well as stormwater management facilities, plus a full range of
other local and regional services (e.g. libraries, recreation centres, park development, transit,
police, fire, etc.). Policies relating to funding sources for local municipal growth-related capital
works in Hamilton are generally found within the City’s 2009 Development Charge Background
Study.1
The City’s capital budget consists of a blend of growth-related and non-growth-related capital
projects. The City’s residential share of growth-related costs is largely funded from
development charges (DCs). Non-growth-related capital expenditures, which cover repairs,
replacements, DC deductions, ineligible services and exempt development items, etc., are
financed from existing reserves/reserve funds, operating budget transfers, debt, grant/subsidies
(when available) and related sources.
Development charges (DCs) are the primary financing source for eligible growth-related capital
works. DCs represent a one-time capital funding source, which fund the majority of the City’s
growth-related capital costs. These revenues are calculated on an average cost basis which
can be used to largely fund the development-related capital servicing requirements of the
Hamilton AEGD. However, a number of servicing costs are not absorbed by development
charges, as a result of various provisions in the Development Charges Act, 1997 (DCA)
including:
1 City of Hamilton Development Charge Background Study. June 22, 2009. (Revision to May 20, 2009
DC Background Study and Including Final Adopted DC By-law) Watson & Associates Economists Ltd.

Hamilton Airport Employment Growth District - Phase 2 Financial/Economic Impact Analysis and Marketing Strategy
Dillon Consulting Ltd. 54 Watson & Associates Economists Ltd.
• Ineligible services, such as parkland acquisition, general administration, cultural
facilities, etc.;
• Ineligible costs, including computer equipment and short-life vehicles;
• The 10% reduction for “soft” services;
• The industrial expansion exemption, the residential intensification exemption and the
exemption for school, municipal and other uses and the City’s discretionary exemptions;
• Cost deductions relating to excess capacity; and
• Cost deductions related to level of service ceilings.
As a result, the City is required to supplement its capital funding program by contributions from
the operating budget. These contributions have been broadly incorporated in the 20% capital
spending from the current budget allowance (refer to Table 5-2).
5.5.2 Potential Growth-Related Capital Works and Funding Sources
Capital works related to the Hamilton AEGD will be largely funded through City DCs. The City’s
2009 Development Charges Background Study provides details with respect to development
infrastructure servicing policy. These guidelines set out, in general, the range of infrastructure
that constitutes City of Hamilton development charges projects. A brief description of these
costs is summarized below, by service.
Roadways, Localized Intersection Improvements and Transit
Details regarding the roadways program for the AEGD are provided in the May 10, 2010,
Hamilton AEGD Transportation Master Plan. In total, a cost of $226.57 million has been
estimated for the construction of new roadways, and the incremental costs associated with the

Hamilton Airport Employment Growth District - Phase 2 Financial/Economic Impact Analysis and Marketing Strategy
Dillon Consulting Ltd. 55 Watson & Associates Economists Ltd.
improvement or widening of existing roadways. 1 From this total, approx. $99.09 million has
been identified as DC eligible. The City’s current DC guidelines state that all collector roads
internal to development to which the plan relates are a local service (i.e. direct developer
responsibility) under s.59 of the DCA. In accordance with the City’s current DC policy a total of
$88.72 million has been identified as a direct developer responsibility. In addition, a total of
$38.76 million in roads costs are identified as benefit to existing development. These costs are
largely related to reconstructing the existing portion of the road where a road widening project is
underway throughout the AEGD Secondary Planning Area. It is important to note that many of
the costs associated with existing roads would occur regardless if development occurs within
the AEGD over the next 20 years.
In addition to the identified capital costs for roads infrastructure, $5.89 million in transit costs
have been identified for the AEGD Secondary Planning Area. Under the DCA, 1997, historic
service standard measures provide a ceiling on the level of the development charge which can
be imposed for transit services. In accordance with the City of Hamilton 2009 DC Background
Study, the City has allocated all of the eligible DC funding for transit services to other City-wide
transit projects outside of the AEGD. Accordingly, none of the capital costs associated with
transit for the AEGD are assumed to be DC eligible at the present time. However, the City of
Hamilton has the authority under the DCA, 1997 to reallocate a portion of the the identified DC
eligible funds for transit from existing transit projects throughout the City to the AEGD.
Furthermore, DC funding for transit services is limited to a 10 year horizon for future population
and employment growth. As such, additional DC revenue will be available to fund AEGD transit
capital costs post 2019 at the time the next Development Charge Background Study update is
undertaken in 2014.
1 As identified on page 133 of the May, 2010 Hamilton AEGD Transportation Master Plan A portion of the total costs (approximately $20 million or 9 % of total roads costs) has been identified as “potential” roadway projects which may be omitted depending on site development plans.

Hamilton Airport Employment Growth District - Phase 2 Financial/Economic Impact Analysis and Marketing Strategy
Dillon Consulting Ltd. 56 Watson & Associates Economists Ltd.
Watermains
Details regarding the water servicing program for the AEGD are provided in the May 10, 2010,
Hamilton AEGD Draft Water and Wastewater Servicing Master Plan. In total, the AEGD
Secondary Planning Area costs estimated for water services are estimated at $28.52 for the
construction of new trunk watermains. From this total, 51% ($14.58 million) of the costs have
been identified as DC eligible. The current DC guidelines state that watermains internal to a
specific development, as well as external watermains (300 mm or smaller in size) to be
connected to an existing local/regional main, are considered to be the developer’s responsibility
through a subdivision or development agreement with the City. 1 In accordance with these DC
guidelines a total of $10.36 million has been identified as a direct developer responsibility.
There is also a minimal allocation of costs to post period/existing benefit of $3.6 million.
Wastewater
The May 10, 2010, City of Hamilton AEGD Draft Water and Wastewater Servicing Master Plan
sets out the required wastewater servicing program for the development of the AEGD
Secondary Planning Area. A total cost of $44.08 million has been estimated for the construction
of new trunk sanitary sewer mains, of which 69% ($28.30 million) has been identified as DC
eligible. The current DC guidelines state that watermains internal to a specific development, as
well as external sanitary sewers (450 mm or smaller in size) to be connected to an existing
local/regional sewer, are considered to be the developer’s responsibility through a subdivision or
development agreement with the City. 2 In accordance with these DC guidelines a total of
$15.78 million has been identified as a direct developer responsibility.
1 City of Hamilton Development Charges Background Study. Appendix E. May 20, 2009. 2 City of Hamilton Development Charges Background Study. Appendix E. May 20, 2009.

Hamilton Airport Employment Growth District - Phase 2 Financial/Economic Impact Analysis and Marketing Strategy
Dillon Consulting Ltd. 57 Watson & Associates Economists Ltd.
Storm Sewers and Stormwater Management Facilities
Details regarding the stormwater servicing program for the AEGD are provided in the May 10,
2010, Hamilton AEGD Draft Subwatershed Study and Draft Stormwater Master Plan. A total
cost of $45.86 million has been estimated for the storm sewers and stormwater management
facilities, of which 100% has been identified as DC eligible.
5.5.3 Expenditure Summary
Table 5-7 summarizes these costs by service in 2009 dollars. Total infrastructure costs
associated with roads, transit, water and wastewater services are estimated at $351 million to
develop the AEGD Secondary Planning Area. From this total cost, approximately $194 million
(approximately 55%) would be funded through DCs (including post period benefit). A total of
approximately $115 million of the AEGD Secondary Planning Area costs would be a direct
developer responsibility in accordance with the City’s current local service DC policy guidelines.
Lastly, a total of $42 million of the AEGD costs (approximately 12% of total costs) are not DC
eligible and would be funded from the tax levy. Additional details related to the potential growth-
related capital works associated with the AEGD are provided in Appendix A.
Total Cost
Direct Developer
Responsibility
Non DC Eligible/Existing
Benefit
Post Period Benefit
DC Eligible Cost
226.57$ 88.72$ 38.76$ -$ 99.09$ 45.86$ -$ -$ -$ 45.86$
7.56$ -$ -$ 7.56$ 28.52$ 10.36$ 3.13$ 0.45$ 14.58$ 44.08$ 15.78$ -$ -$ 28.30$
Total 352.59$ 114.86$ 41.89$ 8.01$ 187.82$ Source: Watson & Associates Economists Ltd. 2010
The AEGD is forecast to accommodate approximately 24,000 employees on 662 net Ha (1636 net acres).
Storm Water Drainage and Control ServicesTransit 1
Water Services
Wastewater Services
Service
1. DC funding for transit services is limited to a 10 year planning horizon. Additional DC revenue will be available to fund AEGD transit capital costs post 2019 at the time the next Development Charge Background Study update is undertaken in 2014.
Table 5-7Hamilton AEGD Capital Fund Impacts, 2011-2031
(Millions)
Roads and Related

Hamilton Airport Employment Growth District - Phase 2 Financial/Economic Impact Analysis and Marketing Strategy
Dillon Consulting Ltd. 58 Watson & Associates Economists Ltd.
5.5.3 Calculation of the Development Charge
Table 5-8 provides the calculation of the City-wide DC as adjusted for the identified capital costs
associated with the development of the AEGD related to roads, water, wastewater and
stormwater services.
Single-Detached NON-RESIDENTIAL Industrial Single-Detached NON-RESIDENTIAL Industrial Single-Detached NON-RESIDENTIAL Industrial
Dwelling & Semi- (per sq.ft. of Dwelling & Semi- (per s.f. of Dwelling & Semi- (per s.f. of
Detached Dwelling Gross Floor Area) Detached Dwelling Gross Floor Area) Detached Dwelling Gross Floor Area)
Service (per unit) (per unit)
Roads and Related 6,065.00$ 6.49$ 6,435.50$ 6.93$ 6.93$ 370.50$ 0.44$ 6.93$ Services 304.00$ 0.33$ 303.55$ 0.33$ 0.33$ (0.45)$ (0.00)$ 0.33$ Wastewater Services 9,180.00$ 6.65$ 6.65$ 9,096.00$ 6.59$ 6.59$ (84.00)$ (0.06)$ (0.06)$ Water Services 3,795.00$ 2.75$ 3,678.00$ 2.67$ 2.67$ (117.00)$ (0.08)$ 2.67$ Storm Water Drainage and Control Services 3,700.00$ 2.35$ 3,900.00$ 2.48$ 2.48$ 200.00$ 0.13$ 2.48$ Remaining Soft Services 3,645.00$ 0.80$ 3,645.00$ 0.80$ 0.80$ -$ 0.00$ 0.80$ Total Municipal-Wide Development Charge 26,689.00$ 19.37$ 6.65$ 27,058.05$ 19.80$ 19.80$ 369.05$ 0.43$ 13.15$ Source: Watson & Associates Economists Ltd. 2010
Current 2009 DC Municipal-Wide DC, By-law 09-143, 09-144 (Fully-Serviced)
(per sq.ft of Gross Floor Area)
As per Hamilton AEGD Master Servicing Plans 1
(per sq.ft of Gross Floor Area)
Difference
(per sq.ft of Gross Floor Area)
1. City of Hamilton AEGD Transportation Master Plan, May 2010, City of Hamilton AEGD Phase 2 Draft Subwatershed Study and Draft Stormwater Master Plan, City of Hamilton AEGD Phase 2 Draft Water & Wastewater Servicing Master Plan.
Table 5-8City of Hamilton
Impact of Hamilton AEGD on Municipal-wide Development Charge Rates
In accordance with the above capital costs for hard services, Hamilton’s calculated City-wide
DC would increase from $26,689 to $27,058 per single/semi-detached unit. This represents a
marginal increase of $369 per single/semi-detached unit (or 1.4%). The City’s calculated non-
residential charge would increase marginally from $19.37/sq.ft to $19.80. This represents an
increase of $0.43/sq.ft or 1.02%. Note: as discussed in Section 5.5.5, industrial development
currently only contributes towards wastewater services as per Council’s direction.
5.5.4 Timing of Payment and DC Credits
Development charges are calculated and payable on the day that the building permit is issued in
relation to the development. For “hard” services (i.e. roads and related, water services,
wastewater services and stormwater drainage facilities), DCs could be collected earlier at
subdivision approval, if provided for in the DC By-law. A municipality and one or more

Hamilton Airport Employment Growth District - Phase 2 Financial/Economic Impact Analysis and Marketing Strategy
Dillon Consulting Ltd. 59 Watson & Associates Economists Ltd.
landowners may also enter into a front-ending agreement which provides for the cost of a
project which will benefit an area in the municipality to which the DC By-law applies (i.e. AEGD).
Such an agreement can provide for the costs to be borne by one or more parties to the
agreement who are, in turn, reimbursed in the future by persons who develop land defined in
the agreement.
The DCA, 1997 sets out a number of credit requirements, which apply where a municipality
agrees to allow a person to perform work in the future that relates to a service in the DC by-law.
These credits are used to reduce the amount of development charges to be paid. The value of
the credit is limited to the reasonable cost of the work which does not exceed the average level
of service. The credit applies only to the service to which the work relates, unless the
municipality agrees to expand the credit to other services for which a development charge is
payable.
5.5.5 Fiscal Impact of Reduced Industrial DC
As of July 5, 2010 the City of Hamilton’s residential and non-residential DC will be implemented
at the full rate as calculated in the 2009 City of Hamilton DC Background Study (note that
phase-in provisions were made within the By-law). The City of Hamilton will continue to
discount the industrial DC rate at $6.65 per sq.ft. Table 5-9 provides a comparison of the
calculated industrial DC as per the City of Hamilton Master Servicing Plans for the AEGD
against the current discounted industrial DC. The total difference between the calculated
industrial DC and the discounted industrial DC is $13.15 per sq.ft.

Hamilton Airport Employment Growth District - Phase 2 Financial/Economic Impact Analysis and Marketing Strategy
Dillon Consulting Ltd. 60 Watson & Associates Economists Ltd.
Service
AEGD Calculated Industrial DC (per
sq.ft of Gross Floor Area)
Discounted Industrial DC (per sq.ft. of Gross Floor
Area) Difference
Water & Wastewater (Rate Supported) 9.26$ 6.65 2.61$ Remaining Services (Tax Supported) 10.54$ - 10.54$ Total 19.80$ 6.65 13.15$
1. As per City of Hamilton By-Law No. 09-143/09-144
Table 5-9City of Hamilton
Comparison of Calculated Industrial Development Charge vs. Discounted Industrial DC Charge 1
Note: Discounted Industrial DC has been apportioned by service in accordance with calculated industrial DC
Tables 5-10 and 5-11 summarize the fiscal impacts of the reduced industrial DC between tax
supported and rate supported services in accordance with the forecast of industrial gross floor
area (GFA) in the AEGD Secondary Planning Area by 2031. Over the 2031 forecast period, the
potential loss of DC revenues which would need to be supported by the tax levy is estimated at
$185.32 million. This translates into an annualized costs of $13.85 million adjusted for interest.1
An additional $45.89 million of potential losses in DC revenue would need to be supported
through the City’s water and wasterwater rates. This translates into an annual costs of $3.43
million adjusted for interest. Note: that total annual operating expenditures for water and
wastewater are approximately $137 million of which approximately 60% relates to capital related
expenditures (i.e. debt, transfers from capital and transfers from reserves). Given the
incremental revenue to be generated from the AEGD development, incremental water and
wastewater costs should not impact the existing rates.
1 Note that interest costs from debentures can be included in the City’s reserve fund statements under the
DCA,1997

Hamilton Airport Employment Growth District - Phase 2 Financial/Economic Impact Analysis and Marketing Strategy
Dillon Consulting Ltd. 61 Watson & Associates Economists Ltd.
10.54$
-$ Difference ($/Sq.ft) 10.54$
17,581,250 185,323,956$ 13,854,850$
Source: Infrastructure Ontario 20 year amortized interest rate.
Fiscal Impact of Reduced Industrial Development Charge (Tax Supported)
Potential Loss of Revenue (Tax Supported)Annual Cost Assuming 20 Year Debenture at 4.71% interest rate 1
Table 5-10City of Hamilton
Calculated Non-Res DC per Sq.ft. as per AEGD Master Plans (All Services Excluding Water & Wastewater)
Industrial DC Charge in Effect, as at July 1, 2010 (All Services Excluding Water and Wastewater)
Total Industrial GFA Forecast 2011,2031 (Sq.ft)
9.26$
6.65$
Difference ($/Sq.ft) 2.61$ 17,581,250 45,887,063$ 3,430,525$
Calculated Non-Res DC per Sq.ft. as per AEGD Master Plans (All Services Excluding Water & Wastewater)
Table 5-11City of Hamilton
Fiscal Impact of Reduced Industrial Development Charge (Rate Supported)
Annual Cost Assuming 20 Year Debenture at 4.71% interest rate 1
Industrial DC Charge in Effect, as at July 1, 2010 (All Services Excluding Water and Wastewater)
Total AEGD Industrial GFA Forecast 2011,2031 (Sq.ft)Potential Loss of Revenue (Rate Supported)
Table 5-12 summarizes the impact of the current industrial DC discount on the forecast net tax
supported operating surplus associated with development in the AEGD by 2031. By 2031,
development within the AEGD would still provide a positive fiscal impact to the City of $52
million annually assuming the discounted industrial DC rate remains in effect.

Hamilton Airport Employment Growth District - Phase 2 Financial/Economic Impact Analysis and Marketing Strategy
Dillon Consulting Ltd. 62 Watson & Associates Economists Ltd.
Net Fiscal Impact
Total Net Operating Surplus (Year 2031) 66,020,640$ As per Table 5-6Annual Industrial DC Shortfall (Tax Supported) 13,854,850$ As per Table 5-11Adjusted Net Operating Surplus (Year 2031) 52,165,790$
Notes
Table 5-12City of Hamilton - AEGD
Impact of Reduced Industrial Development Charges on Net Operating Surplus
5.6 Conclusions
The development of the AEGD is anticipated to have a positive fiscal impact on the City of
Hamilton. By 2031 the AEGD is forecast to generate a positive impact on the City’s property tax
base of approximately $66 million. Capital costs associated with the AEGD will be largely
funded through development charges (DCs) in accordance with the City’s existing DC By-law
09-143 and 09-144. In accordance with the master servicing studies prepared for the AEGD
related to roads/transit, water, wastewater and stormwater management, the City’s municipal-
wide DC rate would be nominally impacted by the development of the AEGD Secondary
Planning Area.

Hamilton Airport Employment Growth District - Phase 2 Financial/Economic Impact Analysis and Marketing Strategy
Dillon Consulting Ltd. 63 Watson & Associates Economists Ltd.
66..00 MMaarrkkeettiinngg SSttrraatteeggyy Chapters 1 though 5, provided herein, include a comprehensive assessment the competitive
position of the AEGD, forecast employment growth by sector, and assess long term the fiscal/
economic impacts of developing this area. This chapter provides an approach to a general
marketing strategy for the City of Hamilton Economic Development Dept. as it relates to
targeting, promoting and attracting industrial and commercial development to the AEGD.
6.1 What is the Long-term Vision for the AEGD?
The AEGD presents a strategically important employment area for the City of Hamilton. With a
total net developable area of 1,173 net ha (2,899 net acres), the largest contiguous land
assembly in the region, the AEGD can accommodate a wide range of employment and
employment-related land uses.
Building on the work previously carried out through the Secondary Plan process, the overall
vision for the AEGD is a vibrant major employment node within the context of a multi-modal
transportation hub which includes the Hamilton International Airport (HIA). This employment
area will target a range of corporate office, airport-related, airport-dependent, prestigious and
general industrial uses as well as other businesses services providing both conventional and
knowledge-based services.
As previously discussed, the AEGD lands are competitive due to their western GTAH location,
highway access (Hwy. 403, Hwy. 6 and Red Hill Creek Expressway) and access to surrounding
employment markets and labour. It is critical that these attributes are highlighted, coupled with
the competitiveness of the GTAH as a whole, when identifying the factors which set the AEGD
apart from its competition.
The proximity and association with a major airport – the Hamilton International Airport – is an
added strategic advantage of the AEGD for businesses who require/desire direct apron access
for their operations (e.g. freight/shipping operators), businesses who are associated with airport
services, businesses who benefit from being in the immediate vicinity of an international airport,

Hamilton Airport Employment Growth District - Phase 2 Financial/Economic Impact Analysis and Marketing Strategy
Dillon Consulting Ltd. 64 Watson & Associates Economists Ltd.
and support businesses who promote the efficiency of the area (vehicle service stations, cafes,
restaurants, accommodations, etc.).
To ensure the success of the AEGD, marketing efforts must be geared towards both the
broader strengths of the AEGD as well as specific target sector investment attraction efforts.
While it is beyond the scope of this assignment to develop and implement sector specific
marketing strategies for the AEGD, it is critical to understand the following general issues if the
AEGD is to be successful:
• What target employment sectors should specific marketing strategies be geared
towards?
• What are the regional and local attributes which these target sectors typically require to
be competitive and successful?
• What marketing and communication tools can be used to inform prospective industries
about the opportunities of the AEGD?
• What is the recommended approach to measure and monitor the success of marketing
and economic development efforts geared towards the AEGD?
These issues are explored in detail in the following section.
6.2 Market Definition and Segmentation
Given the local and regional infrastructure assets located within and surrounding the AEGD, this
area is well positioned to accommodate employment growth across a broad range of industrial
and commercial industry sectors, including:
• Advanced Manufacturing;
• Research and Development;
• Corporate Office;
o Airport Related Businesses (e.g. cargo/freight operator offices, passenger airline
corporate offices;
o Airport Dependent (e.g. high travel frequency, time-sensitive shipments); and
o Airport Prestige Business.
• Warehousing, Transportation and Logistics;

Hamilton Airport Employment Growth District - Phase 2 Financial/Economic Impact Analysis and Marketing Strategy
Dillon Consulting Ltd. 65 Watson & Associates Economists Ltd.
• Business Services; and
• Accommodation and Food Services.
The growth of these broad employment sectors (and the specific industry clusters within them)
will ultimately depend on the evolving nature of macro-economic trends (i.e. timing of global
economic recovery, trends in domestic manufacturing, etc.) the impacts of government stimulus
and initiatives (i.e. green energy solutions) as well as the competitive forces which influence the
ongoing success of industry growth within a particular region. The following section explores
the latter issue related to industry needs and competitive forces within the context of the
targeted industry sectors for the AEGD.
6.3 Target Sector Needs and Requirements Analysis
The following section provides an overview of the general requirements for each of the major
target sectors identified for the AEGD in terms of location, infrastructure, market conditions,
facility needs, and land use. The target markets have varying regional and park-level
requirements and the AEGD offers most of the attributes desired, as illustrated in Table 6-1.
These are discussed in detail herein by target market sector.
Attributes that are desirable for a large number of targets sectors may be marketed to most of
the target sectors. Over emphasizing attributes that are of less value to a given sector can dilute
the intended message of the advantages of locating in the AEGD. Attributes which are valued
across a wide number of sectors can be included in more general promotional materials, while
attributes which are valued in only select target sectors are recommended to be kept within
respective target sector marketing efforts.
Through understanding the key attributes of the respective target sectors, more efficient sector-
specific marketing strategies can be developed which will aid in the creation of a positive market
perception of the AEGD. Also, it will provide crucial information needed when making general
development decisions that could positively or negatively affect that value of the development to
the target sectors identified.

Hamilton Airport Employment Growth District - Phase 2 Financial/Economic Impact Analysis and Marketing Strategy
Dillon Consulting Ltd. 66 Watson & Associates Economists Ltd.
Table 6-1 Target Sectors – Regional and Park-Level Requirements
Advanced Manufacturing
Research & Development Transportation/ Warehousing/
Wholesale Trade
Corporate Office/Business Services
Accommodation and Food Services
Access, exposure and
proximity to 400
series/limited access
highways
Availability of skilled and
unskilled labour force
pool, union vs. non-union
environment
Training and education
Proximity to suppliers
and/or customer-base
Proximity to U.S border
Proximity to surrounding
employment markets and
related industry clusters
Competitive wage rates
Access/proximity to related
industry cluster(s) and
institutions/government
agencies
Access to skilled labour
pool.
Prestige “campus-like”
setting
Urban design guidelines,
land use controls, height
restrictions, landscaping
Access to major 400 series
highways, with limited traffic
congestion and highway tolls
Competitive land prices
Market choice by site size,
configuration, zoning,
location, etc.
Expansion potential
Truck assess,
loading/unloading
requirements
Intermodal transportation
potential, proximity to major
infrastructure
Proximity to customer-base
Proximity to U.S. border
Access and integration
with post secondary
institutions and research
facilities
Zoning requirements
Urban design guidelines,
land use controls, height
restrictions, landscaping
Flexible leasing structures
Multi-tenant vs.
freestanding office space
Market choice (Type A vs.
B office space)
Capitalization rates
Incubator facilities
Water quality
Access, exposure and proximity
to major 400 series/limited
access highways
Exposure and configuration
within industrial/business district
Safety issues, potential land use
conflicts
Local traffic volumes and flow
Proximity to employment and
population base
Signage

Hamilton Airport Employment Growth District - Phase 2 Financial/Economic Impact Analysis and Marketing Strategy
Dillon Consulting Ltd. 67 Watson & Associates Economists Ltd.
Advanced Manufacturing
Research & Development Transportation/ Warehousing/
Wholesale Trade
Corporate Office/Business Services
Accommodation and Food Services
Competitive land prices
Market choice by site size,
configuration, zoning,
location, etc.
Competitive tax, water
and utility rates
Expansion potential.
Zoning requirements
Power and technological
requirements
Power and technological
requirements
Outside storage
Potential attributes of the AEGD.

Hamilton Airport Employment Growth District - Phase 2 Financial/Economic Impact Analysis and Marketing Strategy
Dillon Consulting Ltd. 68 Watson & Associates Economists Ltd.
Advanced Manufacturing
Due to the dynamic nature of advanced manufacturing, this sector has a unique set of
requirements in order to run their operations efficiently, all of which the AEGD is able to provide.
The most relevant of these needs are as follows:
• Access to 400 series/limited access highways;
• Access to skilled and unskilled labour;
• Proximity to markets and related industry clusters;
• Proximity to US market; and
• Competitive land prices.
The first four of these requirements allow for operations to receive inputs, process them, and
ship outputs in a manner that accommodates the time sensitive nature of this type of
manufacturing. The final requirement is geared towards industries that typically require larger
land allotments for operations, as high land prices in a particular area can act as a “barrier to
entry.”
Competing regions looking to expand their economic base by attracting an advanced
manufacturing firm must be capable of providing for the time sensitive needs of this employment
sector, while simultaneously providing a skilled workforce, competitive land prices, as well as
on- and off-site amenities. Attention to value-add services tailored to meet the current and
forecast needs of this sector is critical as the AEGD is developed.
Research and Development
Research & Development (R&D) firms typically attach value to the following attributes when
considering expansion or relocation into a market:
• Access to skilled labour force;
• Proximity to related industry cluster (companies and public institutions such as
universities); and
• Prestige “campus-like” setting.

Hamilton Airport Employment Growth District - Phase 2 Financial/Economic Impact Analysis and Marketing Strategy
Dillon Consulting Ltd. 69 Watson & Associates Economists Ltd.
Due to the high value of knowledge within the sector, access to a skilled labour force is a key
need of R&D businesses, as failure to have sufficient intellectual resources limits the ability of
the firm to satisfy the needs and wants of their clients. Further, proximity to related industry
clusters is important to permit access to clients, suppliers and partners.
Employment markets that offer a high availability of skilled labour and have post secondary
educational facilities offer the strongest competition in the R&D sector. While land prices and
operating expenditures play a role in site selection and overall competitiveness, proximity to a
post-secondary institution is a critical factor. As previously identified in the Phase 1 AEGD
Secondary Plan, research intensive universities such as McMaster, with expertise in advanced
manufacturing, play a pivotal role in ensuring industries are at the forefront of technological
innovation. Given its proximity to McMaster University and access to surrounding employment
markets, the AEGD is an ideal location to commercialize, manufacture and distribute goods
developed through local manufacturing, engineering and R&D.
Corporate Office
Corporate office clients interested in operating in an area such as the AEGD are generally
dependent on the following characteristics for efficient and competitive operation of their
businesses:
• Prestige setting;
• Access and exposure to 400 series/limited access highway; and
• Access to on-site amenities and proximity to off-site services.
Further, Airport Related Businesses or Airport Dependent Businesses rely heavily on airport
access/connectivity and related airport services for efficient operation of their services.
The corporate office and business services sector broadly consists of knowledge-based
industries such as finance, insurance, real estate and leasing, call centres, convention centres
and most other office buildings, including head offices. Over the past decade, employment
growth within this sector has been strong across the GTAH. Stronger growth in the business

Hamilton Airport Employment Growth District - Phase 2 Financial/Economic Impact Analysis and Marketing Strategy
Dillon Consulting Ltd. 70 Watson & Associates Economists Ltd.
services sector generally means a greater proportion of employment on employment lands will
be occurring in office, prestige industrial and flex-space buildings. Generally, greenfield settings
such as the AEGD are attractive to developers seeking to draw commercial occupants, because
of their prestige settings, higher building design and landscaping standards and location to new
areas.
Competition forces in the Corporate Office and Business Services area are quite broad and
strong. Though value may be placed on the proximity to an international airport by some
businesses, competitive land prices are a determining factor. Consequently, failure to offer
lands at a competitive rate will reduce the potential number of interested businesses. Further,
market choice in terms of sales/leasing options is also a competitive issue.
Business Services
Very similar in their need structure as the Corporate Office sector, Business Services firms
typically operate on a more regional basis. As such, the following list of attributes desired in a
development is nearly identical to that of the Corporate Office sector:
• Access to on-site amenities and proximity to off-site services;
• Prestige setting;
• Access to skilled labour force; and
• Flexible leasing structures and market choice (multi-tenant vs. freestanding office, Type
A vs. Type B).
Due to the regional operational nature of this sector, ease of access for consumers and access
to nearby complementary services and amenities is critical when considering a potential
development site. In addition, proximity to the HIA would in most cases be considered an
element of prestige, and would have some value when considering other financial concerns
such as land pricing and flexible leasing arrangements.
Hamilton Airport Employment Growth District - Phase 2 Financial/Economic Impact Analysis and Marketing Strategy
Dillon Consulting Ltd. 71 Watson & Associates Economists Ltd.
Warehousing, Transportation and Logistics
The Warehousing, Transportation, and Logistics sector has the most requirements when
considering potential development sites. This is due mainly to the larger land requirements of
this sector, as well as the importance of being in close proximity to their service markets. Based
on these features of the sector, the following are the key desired attributes of development sites
to be considered:
• Access to 400 series/limited access highways;
• Competitive land prices;
• Availability of large tracts of land;
• Flexibility in zoning, parcel configuration;
• Compatible surrounding land uses;
• Intermodal transportation potential; and
• Proximity to markets, US border.
When combined effectively, these attributes contribute to the efficiency and ultimately the
profitability of Warehousing, Transportation, and Logistics firms. Land related properties focus
on competitive land pricing for large, flexible tracts of land required for the large warehouses,
storage yards, and shipping areas. Locational requirements include direct access to their
process distribution channels through various modes of transportation.
The structure of the Canadian economy focuses attention on logistics as a source of competitive
advantage, because it is increasingly dependent on trade. In addition, the growing
interdependence of companies and their suppliers continues to increase the importance of this
integrated business process. In turn, this is driving the need for more, bigger and better-located
warehouses and logistics facilities.
Given the number of needs of this particular employment sector, there is less competition from
the general market as not all industrial/business parks meet the required criteria. However,
competition does exist from other airports/distribution centres in the region, as previously
highlighted in Chapter 2. Also, given the relatively large financial resources required for

Hamilton Airport Employment Growth District - Phase 2 Financial/Economic Impact Analysis and Marketing Strategy
Dillon Consulting Ltd. 72 Watson & Associates Economists Ltd.
participation in this sector, there are fewer participating firms, thus increasing the level of
competition in the marketplace as a result.
Assuming that competitors are also capable of offering a development that will meet the needs
of the firms in this sector, the land itself becomes an important commodity. As in all commodity
markets, variations in price from the lowest offered must be balanced by other tangible and
intangible benefits, or be dismissed in favour of a lower priced, similar quality competitor.
Accommodation and Food Services
A complementary sector within any significant business area, the Accommodation and Food
Services sector allows for a better working experience within the AEGD, and plays a critical role
in the development of both a community culture, as well as the prestige image desired. In order
to attract high-quality, prestige firms to the AEGD, the following needs must be satisfied by any
potential development:
• Access/exposure and proximity to 400 series/major highways;
• Proximity to employment/population base; and
• Minimal potential conflicts with industrial land uses.
Similar to the Business Services sector, access to clients and population/employment bases are
highly important for Accommodation and Food Services firms. However, these firms require a
greater degree of access and visibility than the Business Sector.
Due to the regional nature of operations of the Accommodation and Food Services sector,
competition comes primarily from those areas in proximity to the AEGD who are an easily
accessible alternative for the population and employment base. Assuming that logistical and
exposure needs are met, and the area is considered profitable for operations, the firms in this
sector will balance land prices against more direct/central access to their customer base.

Hamilton Airport Employment Growth District - Phase 2 Financial/Economic Impact Analysis and Marketing Strategy
Dillon Consulting Ltd. 73 Watson & Associates Economists Ltd.
6.4 Local Site Requirements by Target Sector
At the local level, site specific building and lot requirements can vary considerably by
employment sector. The availability or market choice of developable lands which ultimately
meet these criteria can have a major impact of the marketability of the AEGD employment
lands. Table 6-2 provides a summary of these local requirements by target employment sector.
With an understanding of both the regional and local site requirement of industry sectors, the
objective is to create an image of the AEGD as an area that strives to lead the pack in
prestigious, green, functional, competitive and pedestrian friendly development. To this end,
regional infrastructure opportunities and local market choice will naturally produce a competitive
advantage for firms in their specific sectors.
6.5 Promotion and Communication
6.4.1 Promotional Tools There are a range of promotional tools which can been used by the City to inform prospective
industries about the opportunities of the AEGD. It is recommended that promotional tools are
designed to reach both broad and narrow business audiences. All marketing tools must have
strong visual consistency based on an established brand for the AEGD. Promotional tools
include:
• Business Attraction Package/Brochures o Community profile and lure brochure featuring large panorama photographs,
location maps, site availability and pricing, sector information, planning and
servicing information and other highlights
• Sub-Sector Industry Cluster Analysis o Building on the target sector analysis, showcase specific industry clusters
and their importance to the City’s and AEGD’s economic performance
o Review and analyse industry trends and opportunities as it relates to future
investment for the AEGD
o Indentify AEGD competitive strengths

Hamilton Airport Employment Growth District - Phase 2 Financial/Economic Impact Analysis and Marketing Strategy
Dillon Consulting Ltd. 74 Watson & Associates Economists Ltd.
Table 6-2 Employment Sectors – Site Specific Requirements
Target Sector Typical Building
Size (Sq.ft.) Building
Types and Zoning
Typical Ranges in Lot Sizes
(Ha)
Air-Side Access
Requirements
Ceiling Height Requirements
e.g. Industry Types Comments
Advanced Manufacturing
10,000 to 250,000 General and
Prestige Ind.
1-4 Low (general
manuf.) to high
(maintenance)
Advanced Machinery
Manufacturing (e.g.
aerospace), Fuel
Technology
New growth in the manufacturing
sector is anticipated to be
focused around small to
medium-sized manufacturing
operations
Transportation/ Warehousing/ Wholesale Trade
10,000 to
1,000,000
Warehouse,
General and
Prestige Ind.
Potential
Outside Storage
4-20 Low to High
depending on
specific
operation
Typically 30-
50+ feet
Freight Forwarding,
Regional integrator
operations, such as
FedEx, or UPS, Food
Processing Distribution
Centres
Employment uses within this
sector/category are generally
land-extensive. Employment
densities are often very low.
Operations can often include
some assembly, light
manufacturing and office use.
Research & Development/ Corporate Office/ Business Services
2,000 to 50,000 Prestige
Industrial, multi-
tenant
commercial
office
<1 to 2 Typically Low Airline Corporate
Offices, Real Estate
Services, Financial
Services, Professional
and Scientific Services
Government offices,
Key component of knowledge-
based economy
This sector has recently been a
high growth area for the City
Accommodation and Food Services
5,000 to 20,000 Freestanding
and Ancillary
Retail Facilities,
Commercial
<1 to 3 Low Restaurants, Hotels,
motels, convention
centres, and ancillary
retail
Potential to geographically
cluster this sector with the
Business Services, Public Admin
and Other Services sector

Hamilton Airport Employment Growth District - Phase 2 Financial/Economic Impact Analysis and Marketing Strategy
Dillon Consulting Ltd. 75 Watson & Associates Economists Ltd.
• Entrepreneur Video Stories o On-line video segments which capture stories of accomplished City of
Hamilton businesses
o Focus on local business growth, innovation and business attraction strategies
• Press Releases, Newsletters, Report to Stakeholders o An annual report to stakeholders provides the City of Hamilton an opportunity
to summarize key milestones and future steps regarding the development of
the AEGD Secondary Planning Area
o Semi-annual news letters to stakeholder groups are also recommended to
provide an update on local recent events and more broadly discuss City-wide
opportunities which are integrated with the success of the AEGD
o Newsletters would also be used to selectively showcase specific local
success stories within target industry sectors
• Post Card Direct Mail Campaign o Targeted at the top 1,000+ business prospects on a semi-annual basis
o The focus of the campaigns will be to promote doing business in the City of
Hamilton and specifically the AEGD
• Advertising o Advertising approaches should consider local, regional and international
audiences
o The EDCO (Economic Developers Council of Ontario) directory reaches a
very broad audience across Canada and the U.S and includes distribution to
consulates worldwide
• Promotional Giveaways o Promotional items such as pens, clothing items imprinted or embroidered with
an AEGD branding and logo to promote recognition and awareness
• Tradeshow Booths and Panels o Flexible and dynamic for ongoing outreach activities and promotional events
• Conferences, Presentations, Journal Articles

Hamilton Airport Employment Growth District - Phase 2 Financial/Economic Impact Analysis and Marketing Strategy
Dillon Consulting Ltd. 76 Watson & Associates Economists Ltd.
o Presentations at conferences and stakeholder workshops are recommended
to increase awareness, promote development opportunities, competitive
advantages, economic impacts, share local experiences and receive industry
feedback. Presentations can also be showcased in greater detail through
publications in applicable journals.
6.4.2 Communication
Communications with existing Hamilton businesses, residents and prospective industries should
focus on raising the profile of the AEGD and the economic impact of development on a local,
regional and international level.
The use of media (radio, print, television and internet) is a common tool for economic
developers to reach out and inform, residents, existing businesses and prospective industries,
profile the success of local businesses, showcase the competitive advantage of an area and
involve stakeholder groups in ongoing economic development activities.
The communication strategy for the AEGD should aim to engage and inform all relevant
stakeholder groups and partners to ensure opportunities are created and progress is being
made in developing a common vision for the area. Figure 6-1 illustrates the relevant
stakeholders.
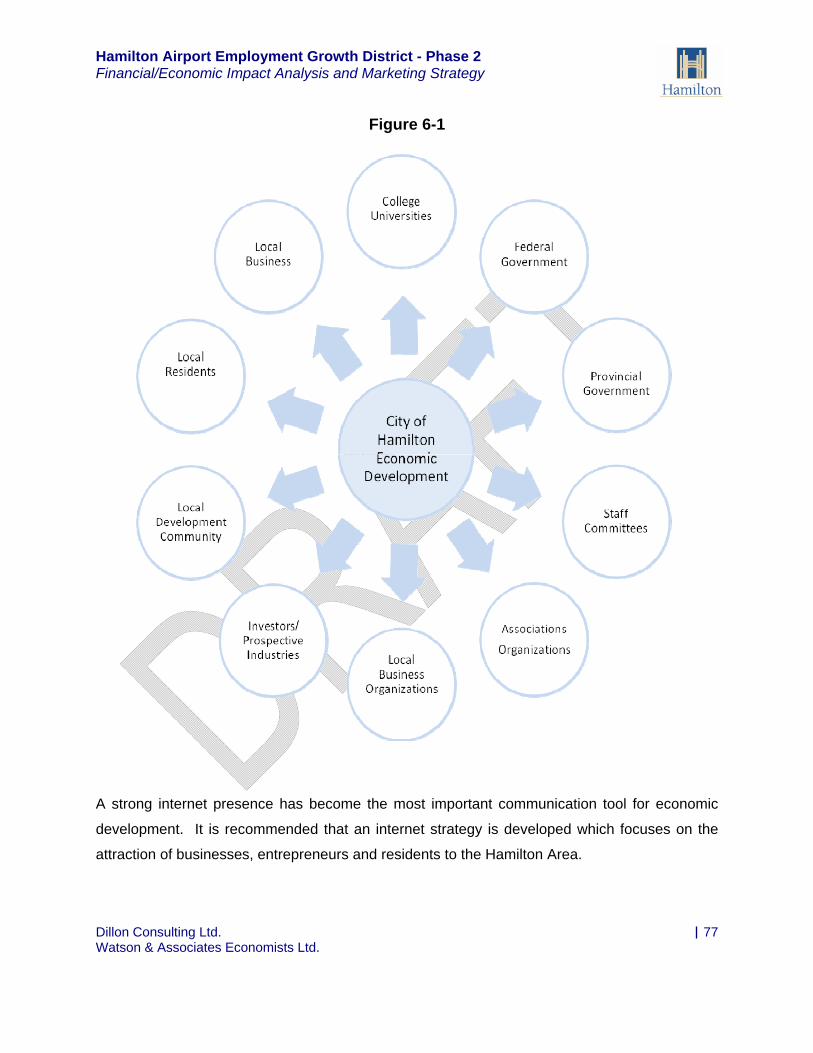
Hamilton Airport Employment Growth District - Phase 2 Financial/Economic Impact Analysis and Marketing Strategy
Dillon Consulting Ltd. 77 Watson & Associates Economists Ltd.
Figure 6-1
A strong internet presence has become the most important communication tool for economic
development. It is recommended that an internet strategy is developed which focuses on the
attraction of businesses, entrepreneurs and residents to the Hamilton Area.

Hamilton Airport Employment Growth District - Phase 2 Financial/Economic Impact Analysis and Marketing Strategy
Dillon Consulting Ltd. 78 Watson & Associates Economists Ltd.
The internet provides an opportunity to develop a series of targeted messages to a wider range
of audiences through a one stop source of information. It is recommended that the City of
Hamilton develop a comprehensive on-line business resource centre for the AEGD which
provides the following base information:
• Relevant information regarding the AEGD which demonstrates the City’s commitment to
developing a prestigious, eco-industrial business park. Potential relevant information
would include; the vision statement for the area as developed through the AEGD
secondary plan, a map of the proposed land use plan and phasing schedule,
background information related to eco-industrial development and design, the location of
developable lands within the AEGD, existing and planned infrastructure services,
highway infrastructure, etc.
• Key statistical information which showcases the key competitive advantages of the
AEGD for commercial/industrial development, such as average land prices, population
and labour force growth within the surrounding area, access to major infrastructure (i.e.
400 series highways, intermodal facilities, the US border, labour force, post secondary
institutions and surrounding employment markets).
• A detailed profile of the general and specific industry sectors targeted to the AEGD. This
should include a comprehensive list of existing industries located within Hamilton and
the surrounding market area;
• Web-based interactive tools (including GIS-based mapping applications) which allows
developable land area as well as existing and proposed key infrastructure assets to be
reviewed on-line. Web-based interactive tools would also allow prospective industries to
become more familiar with the Hamilton Area and existing business environment. It is
recommended that video sites are also developed which would showcase existing
business owners within targeted industry sectors.
• Social networking tools (e.g. Facebook, MySpace, YouTube, Linkedln, etc.) which allows
peer to peer and personal communications focused on the attraction of businesses,
entrepreneurs and residents to the area.
• Email Strategy - email blasts should be used to send regular communications to relevant
stakeholder groups.

Hamilton Airport Employment Growth District - Phase 2 Financial/Economic Impact Analysis and Marketing Strategy
Dillon Consulting Ltd. 79 Watson & Associates Economists Ltd.
A highly interactive, visual website highlighting the proposed vision of the AEGD with artistic
renditions, diagrams, facts and figures will allow the City to communicate their vision of the
AEGD development, while simultaneously providing stakeholders with a means of providing
their feedback through the use of submission forms and general comment email accounts.
Also critical to the communication strategy is a clear communication plan aimed at local
residents who currently live within or adjacent to the AEGD. It is recommended that the City
inform local residents of recent studies, decisions and other milestone events related to the
AEGD through a range of media and communication tools.
6.6 Performance Measures and Monitoring
Performance measures for economic development are important in understanding how
economic development activities contribute to the ultimate goals and objectives for a particular
area, municipality or region. Economic development Performance measures typically focus on
specific “hard data” related to positive economic impacts as a measure of success. It is
recommended that the that City track, analyze and monitor “hard data” associated with the
development of the AEGD on an annual basis related to (but not limited to) the following:
• Tax revenues;
• Direct employment growth by employment sector and location;
• Number of business start-ups by sector and number of employees;
• Actual infrastructure costs vs. estimates;
• Impacts on land values;
• Actual employment absorption rates vs. forecast absorption;
• Employment density and built form (i.e. number of employees per hectare/acre, sq.ft per
employee, lot coverage and floor space index); and
• Building size (i.e. gross floor area).
It is also recommended that local businesses are surveyed annually to determine:
• Regional and local attributes which attracted new business to the AEGD;

Hamilton Airport Employment Growth District - Phase 2 Financial/Economic Impact Analysis and Marketing Strategy
Dillon Consulting Ltd. 80 Watson & Associates Economists Ltd.
• Short-term to medium expansion/contraction plans in terms of employment growth and
building space needs; and
• Shortcomings and challenges of the AEGD with respect to economic competitiveness
and functionality.
In addition to the above “hard data” analysis, “soft” goals and objectives also need to be
monitored on a regular basis. While “soft” issues are difficult to measure it is important that
they are incorporated into the monitoring program to capture the comprehensive needs that
must be met to achieve the broader success of the AEGD by all stakeholder groups. Key
issues include:
• The socio-economic impacts of the AEGD such as local household income, commuting
patterns and quality of life;
• Community and business vitality;
• Land use synergies and conflicts; and
• Sustainability indicators focused on the AEGD’s ecological footprint and impacts to the
triple bottom line.
Ultimately, this information should be used to develop an on-line business directory and profile
of the AEGD for marketing and promotional purposes as well as future planning, land needs and
master planning analysis.
6.7 Keys to Success
As previously stated, the AEGD presents a strategically important employment area surrounding
the Hamilton International Airport (HIA) that provides an unparalleled opportunity for
employment lands development in the west GTAH. The AEGD offers a site of “critical mass”
and market choice for both prestige and industrial land uses accommodating a wide range of
potential industrial and business sectors. The keys to success for the general marketing
strategy of the AEGD are as follows:
• A collective vision must be developed and implemented with input from all relevant
stakeholder groups regarding the ultimate values, goals and objectives for AEGD.

Hamilton Airport Employment Growth District - Phase 2 Financial/Economic Impact Analysis and Marketing Strategy
Dillon Consulting Ltd. 81 Watson & Associates Economists Ltd.
• A process of communication must be initiated between all relevant stakeholder groups
and target market representatives. While relationships are being developed and
communication networks established, on-going development and two-way promotion of
the area should be initiated as a means to generate awareness of the AEGD and gain
feedback from industry.
• With a communication strategy is place, ongoing profiling of targeted sub-sectors should
be developed to gain a better understanding of future employment prospect and industry
needs.
• Specific attention should be dedicated to seeking out or creating opportunities for
informal or formal partnerships with sector leaders in both business, as well as
planning/research and development operations, as such partnerships not only develop
awareness of the AEGD, but also serve to create additional knowledge for the AEGD
marketers in a constantly changing market environment.
• In order to evaluate the strengths and weaknesses of marketing efforts, an on-going
process of survey and performance analysis must be pursued. This strategy will be
supported primarily through e-communications (e-mail / web surveys, discussion boards,
etc.), and is key to keeping up with the constantly changing nature of industry.
Hamilton Airport Employment Growth District - Phase 2 Financial/Economic Impact Analysis and Marketing Strategy
Dillon Consulting Ltd. 82 Watson & Associates Economists Ltd.
77..00 CCoonncclluussiioonnss The AEGD presents a strategically important employment area for the City of Hamilton. The
AEGD offers the potential for a major new employment node within the context of a multi modal
transportation hub which includes the Hamilton International Airport (HIA). With a net
developable area of 1,173 net ha (2,899 net acres), the largest contiguous land assembly in the
region, the AEGD can accommodate a wide range of employment and employment-related land
uses.
The City of Hamilton is well-positioned geographically to potentially benefit from the anticipated
gradual shift of employment growth on employment lands from more mature and developed
west GTA municipalities. The AEGD favourably located in terms of access to major highways,
and skilled labour, and offers a developable area of ‘critical mass’ at competitive prices. The
proximity of the HIA in relation to the AEGD is a significant asset which further enhances the
development potential of the area.
Other major airports in the region, including Toronto Lester B Pearson International Airport and
Buffalo-Niagara International Airport have limited off-site employment land development
opportunities, which places the AEGD and HIA in a unique position and highly marketable.
Despite this, however, the AEGD does face competition from other industrial/business parks in
the GGH.
The future development of the AEGD represents an opportunity for the City of Hamilton to
enhance and diversify its local economic base, reduce commuting dependency, provide for a
more balanced tax assessment base, and foster a more complete and sustainable community.
A healthy balance between local population and employment is echoed throughout many of the
guiding principles of the Provincial Growth Plan17, which stress the importance of “vibrant” and
“complete” communities that support a “strong and competitive economy”.
17 Places to Grow. Better Choices. Brighter Future. Growth Plan for the Greater Golden Horseshoe, 2006. Ministry of Infrastructure Renewal.

Hamilton Airport Employment Growth District - Phase 2 Financial/Economic Impact Analysis and Marketing Strategy
Dillon Consulting Ltd. 83 Watson & Associates Economists Ltd.
Given its attributes, the AEGD’s employment lands development potential is anticipated to be
concentrated in advanced manufacturing, warehousing, transportation and logistics, business
services, and accommodation and food services. By 2031, the AEGD is anticipated to have
employment growth of 24,360 and by buildout, employment is anticipated to increase to 43,200.
In addition, the development of the AEGD is anticipated to have a significant indirect ‘spin-off
employment and induced economic impacts.
The development of the AEGD is anticipated to have a positive fiscal impact on the City of
Hamilton. By 2031 the AEGD is forecast to generate a positive impact on the City’s property tax
base of approximately $66 million. Capital costs associated with the AEGD will be largely
funded through development charges (DCs) in accordance with the City’s existing DC By-law
09-143 and 09-144. In accordance with the master servicing studies prepared for the AEGD
related to roads/transit, water, wastewater and stormwater management, the City’s municipal-
wide DC rate would be nominally impacted by the development of the AEGD Secondary
Planning Area.
Average industrial land values in the market area support a private-sector driven approach to
developing the AEGD. It is recommended that a coordinated approach between the City and
the development community should be considered to ensure control of development and timing
and minimize the financial risks associated with development.
An approach to a general marketing strategy has been developed herein, which outlines the
competitive position of the AEGD, identifies key target sectors and requirements at a
regional/local level, summarizes the potential marketing and promotional tools to foster future
development activity within desired industry sectors and sets out a general approach to
performance measurement and monitoring of development.

Hamilton Airport Employment Growth District - Phase 2 Financial/Economic Impact Analysis and Marketing Strategy
Dillon Consulting Ltd. 84 Watson & Associates Economists Ltd.
Appendix A Survey of Existing Industrial Properties within the City of Hamilton

Hamilton Airport Employment Growth District - Phase 2 Financial/Economic Impact Analysis and Marketing Strategy
Dillon Consulting Ltd. 85 Watson & Associates Economists Ltd.
Property Address Square Footage Acreage Assessed ValueAnnual Property
TaxesAsssment Per Sq.Ft.
950 South Service Road 289,110 13.438 $16,305,000 $543,424 $56.40400 Glover Road 157,316 24.44 $7,755,000 $361,563 $49.30830 South Service Road 167,752 23.093 $9,336,000 $470,669 $55.65665 Arvin avenue 34,800 3.564 $2,319,000 $96,540 $66.641425 Osprey Drive 40,200 1.99 $4,425,000 $140,827 $110.07921 Barton Street 52,355 3.242 $3,070,000 $92,862 $58.64560 Arvin Avenue 48,080 6.998 $2,918,000 $91,116 $60.69123 Dartnall Road 23,993 2.423 $255,000 $6,527 $10.6390 Glover Road 173,462 10.188 $7,368,000 $254,990 $42.48803 Barton Street 32,064 7.612 $4,143,000 $188,358 $129.2145 Oriole Avenue 43,220 3.705 $3,901,000 $95,602 $90.26210 Constellation Drive 110,370 5.439 $7,006,000 $231,132 $63.48425 Arvin Avenue 307,160 11.165 $11,955,000 $390,607 $38.92891 Arvin Avenue 46,917 8.168 $2,950,000 $132,083 $62.88430 McNeilly Road 60,545 3.635 $4,591,000 $137,095 $75.83925 Arvin Avenue 127,780 9.529 $7,081,000 $242,182 $55.421052 South Service Road 169,803 13.844 $12,766,000 $596,131 $75.181325 Cormorant 153,330 10.961 $11,897,000 $627,428 $77.591310 Cormorant 83,702 11.4 $7,623,000 $357,486 $91.07944 South Service Road 74,853 3.907 $4,520,000 $202,251 $60.39180 Constellation 66,208 4.849 $6,270,000 $211,213 $94.70414 Dewitt 58,674 5.911 $4,732,000 $144,048 $80.65881 Arvin Avenue 70,192 3.95 $3,957,000 $168,892 $56.37910 Arvin Avenue 25,500 2.596 $1,997,000 $87,977 $78.311216 South Service 70,607 4.061 $4,112,000 $187,271 $58.241430 Cormorant 15,122 2.114 $1,142,251 $45,159 $75.54400 Green Road 749,433 43.68 $25,965,000 $877,772 $34.65395 Green Road 241,291 9.032 $11,318,000 $480,223 $46.91Source: City of Hamilton, 2009
APPENDIX ATABLE A
SURVEY OF EXISTING INDUSTRIAL PROPERTIES WITHIN THE CITY OF HAMILTON
Hamilton Airport Employment Growth District - Phase 2 Financial/Economic Impact Analysis and Marketing Strategy
Dillon Consulting Ltd. 86 Watson & Associates Economists Ltd.
Appendix B Detailed AEGD Capital Costs for Roads, Water, Wastewater and
Stormwater Services

Hamilton Airport Employment Growth District - Phase 2 Financial/Economic Impact Analysis and Marketing Strategy
Dillon Consulting Ltd. 87 Watson & Associates Economists Ltd.
Project No. Road From To
Growth Share
% Capital Improvement
Gross Capital Cost Estimate
Post Period Benefit
Other Deductions
Net Capital Cost
Benefit to Existing
Development Existing Reserve
Direct Developer
Responsibility
Benefit to Existing
Development
Grants, Subsidies and
Other Contributions Attributable to
New Development
Total Residential Share 50%
Non-Residential Share 50%
2c 1t Southcote Road Garner Twenty Extension 90% 2 lane reconstruction 2,714,819 2,714,819 - 271,482 2,443,337 1,221,668.71 1,221,668.71 2d 2t Southcote Road Twenty Extension Book 90% 2 lane reconstruction 2,714,819 2,714,819 - 271,482 2,443,337 1,221,668.71 1,221,668.71 3a 3t Glancaster Road Garner Dickenson 85% Widening 2 to 4 lanes 13,324,127 13,324,127 - 1,998,619 11,325,508 5,662,754.14 5,662,754.14 4 4t Upper James Street Alderlea Avenue Homestead Drive 35% Widening 4 to 6 lanes 30,227,272 30,227,272 - 19,647,727 10,579,545 5,289,772.58 5,289,772.58 5a 5t Garth Street Extension Twenty Dickenson 100% New 4 lane construction 10,074,421 10,074,421 - - 10,074,421 5,037,210.50 5,037,210.50 5b 6t Garth Street Extension Dickenson Collector 2E 100% New 4 lane construction 3,185,996 3,185,996 - - 3,185,996 1,592,998.10 1,592,998.10 6b 7t Book Road Highway 6 Southcote 85% Widening 2 to 4 lanes 4,665,731 4,665,731 - 699,860 3,965,871 1,982,935.59 1,982,935.59 9 8t Garner Road E Fiddlers Green Glancaster 50% Widening 2 to 4 lanes 19,518,946 19,518,946 - 9,759,473 9,759,473 4,879,736.50 4,879,736.50 10 9t Dickenson Road Glancaster Upper James 95% Widening 2 to 4 lanes 11,925,827 11,925,827 - 596,291 11,329,536 5,664,767.90 5,664,767.90 11a 10t Dickenson Road Extension Southcote Smith 90% Widening 2 to 4 lanes 2,078,490 2,078,490 - 207,849 1,870,641 935,320.72 935,320.72 11b 11t Dickenson Road Extension Smith Glancaster 85% New 4 lane construction 4,110,963 4,110,963 - 616,644 3,494,318 1,747,159.21 1,747,159.21 12 12t Twenty Road Glancaster Aldercrest (Upper James) 85% Widening 2 to 4 lanes 14,165,168 14,165,168 - 2,124,775 12,040,393 6,020,196.45 6,020,196.45 13a 13t Twenty Road Extension Southcote Glancaster 100% New 2 lane construction 4,778,994 4,778,994 - - 4,778,994 2,389,497.16 2,389,497.16 16 14t Airport Road Terminal Access Rd East Cargo Road 80% Widening 2 to 4 lanes 2,098,075 2,098,075 - 419,615 1,678,460 839,230.12 839,230.12 17 15t Airport Service Road Glancaster Airport 83% New 4 lane construction 12,265,873 12,265,873 - 2,146,528 10,119,345 5,059,672.56 5,059,672.56 18a 16t Collector 1N Smith Collector 2E 0 New 2 lane construction 3,684,120 3,684,120 3,684,120 - - - 20 17t Book Road E Collector 2W Glancaster 0 2 lane reconstruction 1,756,735 1,756,735 1,756,735 - - - 22a 18t Collector 6N Glancaster Collector 6E 0 New 4 lane construction 8,086,581 8,086,581 8,086,581 - - - 22b 19t Collector 6N Collector 6E Collector 7E 0 New 4 lane construction 3,465,677 3,465,677 3,465,677 - - - 24a 20t Collector 10N Collector 5W Smith 0 New 2 lane construction 2,953,072 2,953,072 2,953,072 - - - 24b 21t Collector 10N Smith Glancaster 0 New 2 lane construction 7,593,613 7,593,613 7,593,613 - - - 35a 22t Smith Road Garner Dickenson Extension 0 New 2 lane construction 4,736,341 4,736,341 4,736,341 - - - 35c 23t Smith Road Extension Hydro Corridor N 0 New 2 lane construction 536,762 536,762 536,762 - - - 36a 24t Glancaster Road Dickenson Extension Collector 1N 0 Widening 2 to 4 lanes 1,882,927 1,882,927 1,882,927 - - - 37 25t Collector 1E Twenty Dickenson 0 New 2 lane construction 6,912,625 6,912,625 6,912,625 - - - 42 26t Collector 6E Twenty Dickenson 0 New 2 lane construction 6,789,275 6,789,275 6,789,275 - - - 43a 27t Collector 7E Dickenson Collector 6N 0 New 2 lane construction 2,734,437 2,734,437 2,734,437 - - - 43b 28t Collector 7E Collector 6N Upper James 0 New 4 lane construction 2,604,046 2,604,046 2,604,046 - - - 44a 29t Collector 1W Garner Collector 10N 0 New 2 lane construction 2,455,143 2,455,143 2,455,143 - - - 44b 30t Collector 1W Collector 10N Twenty Extension 0 New 2 lane construction 3,168,425 3,168,425 3,168,425 - - - 45a 31t Collector 2W Garner Dickenson Extension 0 New 2 lane construction 5,821,167 5,821,167 5,821,167 - - - 45b 32t Collector 2W Garner Dickenson Extension 0 New 2 lane construction 3,085,044 3,085,044 3,085,044 - - - 23a Collector 7N Collector 5W Southcote 0 New 2 lane construction 3,868,255 3,868,255 3,868,255 - - - 23b Collector 7N Southcote Collector 2W 0 New 2 lane construction 4,331,130 4,331,130 4,331,130 - - - 33b Collector 12S Collector 4E Collector 5E 0 New 2 lane construction 1,130,278 1,130,278 1,130,278 - - - 36b Glancaster Road Collector 1N Airport 0 2 lane reconstruction 5,734,134 5,734,134 5,734,134 - - - 38 Collector 2E Collector 1N Airport 0 New 2 lane construction 2,961,376 2,961,376 2,961,376 - - - 40 Collector 4E Collector 12S White Church 0 New 2 lane construction 1,214,308 1,214,308 1,214,308 - - - 41 Collector 5E Collector 12S White Church 0 New 2 lane construction 1,211,361 1,211,361 1,211,361 - - -
Total 226,566,352 - - 226,566,352 - 88,716,829 38,760,345 - 99,089,178 49,544,589 49,544,589
Appendix BTable B-1
AEGD Roads - Capital Projects, 2009-2031

Hamilton Airport Employment Growth District - Phase 2 Financial/Economic Impact Analysis and Marketing Strategy
Dillon Consulting Ltd. 88 Watson & Associates Economists Ltd.
Project ID Stage - Phase
PD EA SCH.
Size Length Unit Cost Base Cost Additional CostEngineering / Contingency
(25%)Total Cost
Direct Developer
Cont.
Development Charges
Post Period Benefit
Oversizing Benefit to Existing
Comments
(mm) (m) (2009 $/m) (2009 $) (2009 $) (2009 $) (2009 $) (2009 $) (2009 $) (2009 $) (2009 $) (2009 $)
B-1 1-1 18 A+ 300 389 398 $ 155,000 $ - $ 39,000 $ 194,000 $ - $ 194,000 $ - $ - $ - Existing Rd Allowance - 100% DCB-2 1-1 18 B 400 417 664 $ 277,000 $ - $ 69,000 $ 346,000 $ 207,564 $ 138,436 $ - $ - $ - B-3 1-1 18 A+ 400 700 664 $ 465,000 $ - $ 116,000 $ 581,000 $ - $ 581,000 $ - $ - $ - Existing Rd Allowance - 100% DCB-4 1-1 18 B 300 705 398 $ 281,000 $ - $ 70,000 $ 351,000 $ 351,000 $ - $ - $ - $ - B-5 1-1 18 B 300 358 398 $ 143,000 $ - $ 36,000 $ 179,000 $ 179,000 $ - $ - $ - $ - B-6 1-1 18 B 300 420 398 $ 167,000 $ - $ 42,000 $ 209,000 $ 209,000 $ - $ - $ - $ - B-7 1-1 6 B 300 621 398 $ 247,000 $ - $ 62,000 $ 309,000 $ 309,000 $ - $ - $ - $ - B-8 1-1 6 B 300 565 398 $ 225,000 $ - $ 56,000 $ 281,000 $ 281,000 $ - $ - $ - $ - B-9 1-1 6 B 300 512 398 $ 204,000 $ - $ 51,000 $ 255,000 $ 255,000 $ - $ - $ - $ - B-10 1-1 6 B 300 659 398 $ 262,000 $ - $ 66,000 $ 328,000 $ 328,000 $ - $ - $ - $ - B-11 1-1 6 B 300 700 398 $ 279,000 $ - $ 70,000 $ 349,000 $ 349,000 $ - $ - $ - $ - B-12 1-1 6 B 300 675 398 $ 269,000 $ - $ 67,000 $ 336,000 $ 336,000 $ - $ - $ - $ - B-13 1-1 6 B 300 856 398 $ 341,000 $ - $ 85,000 $ 426,000 $ - $ 426,000 $ - $ - $ - Existing Rd Allowance - 100% DCB-14 1-1 6 B 300 594 398 $ 236,000 $ - $ 59,000 $ 295,000 $ 295,000 $ - $ - $ - $ - B-15 1-1 18 A+ 400 383 664 $ 254,000 $ - $ 64,000 $ 318,000 $ - $ 318,000 $ - $ - $ - Existing Rd Allowance - 100% DCB-20 1-2 18 B* 7 ML $ - $ - $ 6,266,000 $ - $ 3,133,000 $ - $ - $ 3,133,000 El. Tank split 50/50 with ex. Z18 B-21 1-2 6 B* 400 372 664 $ 247,000 $ - $ 62,000 $ 309,000 $ - $ 185,179 $ 123,821 $ - $ - Zone 6 Trunk - DC with PP BenefitB-22 1-2 18 A+ 300 590 398 $ 235,000 $ - $ 59,000 $ 294,000 $ - $ 294,000 $ - $ - $ - Existing Rd Allowance - 100% DCB-23 1-2 18 A+ 300 603 398 $ 240,000 $ - $ 60,000 $ 300,000 $ - $ 300,000 $ - $ - $ - Existing Rd Allowance - 100% DCB-24 1-2 18 B 300 354 398 $ 141,000 $ - $ 35,000 $ 176,000 $ 176,000 $ - $ - $ - $ - B-25 1-2 18 B 300 579 398 $ 231,000 $ - $ 58,000 $ 289,000 $ 289,000 $ - $ - $ - $ - B-26 1-2 18 B 400 421 664 $ 280,000 $ - $ 70,000 $ 350,000 $ 209,744 $ 140,256 $ - $ - $ - B-27 1-2 18 B 300 418 398 $ 166,000 $ - $ 42,000 $ 208,000 $ 208,000 $ - $ - $ - $ - B-28 1-2 18 B 300 436 398 $ 174,000 $ - $ 44,000 $ 218,000 $ 218,000 $ - $ - $ - $ - B-29 1-2 6 B* 400 2559 664 $ 1,698,000 $ - $ 425,000 $ 2,123,000 $ - $ 2,123,000 $ - $ - $ - Zone 6 Trunk - 100% DCB-30 1-2 18 B 400 568 664 $ 377,000 $ - $ 94,000 $ 471,000 $ 282,677 $ 188,323 $ - $ - $ - B-31 1-2 18 B 400 863 664 $ 573,000 $ - $ 143,000 $ 716,000 $ 429,594 $ 286,406 $ - $ - $ - B-32 1-2 18 B 400 552 664 $ 366,000 $ - $ 92,000 $ 458,000 $ 274,781 $ 183,219 $ - $ - $ - B-33 1-2 6 A+ 300 953 398 $ 380,000 $ - $ 95,000 $ 475,000 $ - $ 475,000 $ - $ - $ - Existing Rd Allowance - 100% DCB-34 1-2 18 A+ 400 293 664 $ 195,000 $ - $ 49,000 $ 244,000 $ 146,025 $ 97,975 $ - $ - $ - B-35 1-2 18 B 300 416 398 $ 166,000 $ - $ 42,000 $ 208,000 $ 208,000 $ - $ - $ - $ - B-36 1-2 18 B 300 586 398 $ 233,000 $ - $ 58,000 $ 291,000 $ 291,000 $ - $ - $ - $ - B-37 1-2 18 B 300 295 398 $ 117,000 $ - $ 29,000 $ 146,000 $ 146,000 $ - $ - $ - $ - B-38 1-2 18 B 300 412 398 $ 164,000 $ - $ 41,000 $ 205,000 $ 205,000 $ - $ - $ - $ - B-39 1-2 6 A+ 300 259 398 $ 103,000 $ - $ 26,000 $ 129,000 $ - $ 129,000 $ - $ - $ - Existing Rd Allowance - 100% DCB-40 1-2 18 B 300 268 398 $ 107,000 $ - $ 27,000 $ 134,000 $ 134,000 $ - $ - $ - $ - B-41 1-2 18 A+ 300 627 398 $ 250,000 $ - $ 63,000 $ 313,000 $ - $ 313,000 $ - $ - $ - Existing Rd Allowance - 100% DCB-42 1-2 18 A+ 300 350 398 $ 139,000 $ - $ 35,000 $ 174,000 $ - $ 174,000 $ - $ - $ - Existing Rd Allowance - 100% DCB-43 1-2 18 A+ 300 416 398 $ 166,000 $ - $ 42,000 $ 208,000 $ 208,000 $ - $ - $ - $ - Existing Rd Allowance - 100% DCB-44 1-2 18 B 300 569 398 $ 227,000 $ - $ 57,000 $ 284,000 $ 284,000 $ - $ - $ - $ - B-45 1-2 18 B 300 416 398 $ 166,000 $ - $ 42,000 $ 208,000 $ 208,000 $ - $ - $ - $ -
Appendix B
TABLE B-2 WATER CAPITAL PROGRAM
SERVICING OPTION C

Hamilton Airport Employment Growth District - Phase 2 Financial/Economic Impact Analysis and Marketing Strategy
Dillon Consulting Ltd. 89 Watson & Associates Economists Ltd.
Project ID Stage - Phase PD EA
SCH. Size Length Unit Cost Base Cost Additional CostEngineering / Contingency
(25%)Total Cost
Direct Developer
Cont.
Development Charges
Post Period Benefit Oversizing Benefit to
Existing Comments
(mm) (m) (2009 $/m) (2009 $) (2009 $) (2009 $) (2009 $) (2009 $) (2009 $) (2009 $) (2009 $) (2009 $)
B-46 1-2 18 B 300 432 398 $ 172,000 $ - $ 43,000 $ 215,000 $ 215,000 $ - $ - $ - $ - B-47 1-2 18 B 300 784 398 $ 312,000 $ - $ 78,000 $ 390,000 $ 390,000 $ - $ - $ - $ - B-48 1-2 18 B 300 645 398 $ 257,000 $ - $ 64,000 $ 321,000 $ 321,000 $ - $ - $ - $ - B-49 1-2 6 A+ 300 886 398 $ 353,000 $ - $ 88,000 $ 441,000 $ - $ 441,000 $ - $ - $ - Existing Rd Allowance - 100% DCB-50 1-2 6 A+ 300 687 398 $ 274,000 $ - $ 69,000 $ 343,000 $ - $ 343,000 $ - $ - $ - Existing Rd Allowance - 100% DCB-51 1-2 6 B* 400 595 664 $ 395,000 $ - $ 99,000 $ 494,000 $ - $ 296,186 $ 197,814 $ - $ - Zone 6 Trunk - DC with PP BenefitB-52 1-2 6 A+ 300 598 398 $ 238,000 $ - $ 60,000 $ 298,000 $ - $ 298,000 $ - $ - $ - Existing Rd Allowance - 100% DCB-53 1-2 6 B 300 636 398 $ 253,000 $ - $ 63,000 $ 316,000 $ 316,000 $ - $ - $ - $ - B-54 1-2 6 B 300 624 398 $ 248,000 $ - $ 62,000 $ 310,000 $ 310,000 $ - $ - $ - $ - B-55 1-2 6 B* 400 837 664 $ 556,000 $ - $ 139,000 $ 695,000 $ - $ 695,000 $ - $ - $ - Zone 6 Trunk - 100% DCB-56 1-2 6 B 300 680 398 $ 271,000 $ - $ 68,000 $ 339,000 $ 339,000 $ - $ - $ - $ - B-57 1-2 6 B 300 709 398 $ 282,000 $ - $ 71,000 $ 353,000 $ 353,000 $ - $ - $ - $ - B-58 1-2 6 A+ 300 870 398 $ 346,000 $ - $ 87,000 $ 433,000 $ - $ 433,000 $ - $ - $ - Existing Rd Allowance - 100% DCB-59 1-2 6 B 300 177 398 $ 70,000 $ - $ 18,000 $ 88,000 $ 88,000 $ - $ - $ - $ - B-60 1-2 6 B 300 514 398 $ 205,000 $ - $ 51,000 $ 256,000 $ 256,000 $ - $ - $ - $ - B-61 1-2 6 B* 400 1181 664 $ 784,000 $ - $ 196,000 $ 980,000 $ - $ 980,000 $ - $ - $ - Zone 6 Trunk - 100% DCB-62 1-2 6 B* 400 607 664 $ 403,000 $ - $ 101,000 $ 504,000 $ - $ 504,000 $ - $ - $ - Zone 6 Trunk - 100% DCB-63 1-2 6 A+ 300 322 398 $ 128,000 $ - $ 32,000 $ 160,000 $ - $ 160,000 $ - $ - $ - Existing Rd Allowance - 100% DCB-64 1-2 6 B 300 180 398 $ 72,000 $ - $ 18,000 $ 90,000 $ 90,000 $ - $ - $ - $ - B-65 1-2 6 B 300 700 398 $ 279,000 $ - $ 70,000 $ 349,000 $ 349,000 $ - $ - $ - $ - B-66 1-2 6 B 300 180 398 $ 72,000 $ - $ 18,000 $ 90,000 $ 90,000 $ - $ - $ - $ - B-67 1-2 6 B 300 450 398 $ 179,000 $ - $ 45,000 $ 224,000 $ 224,000 $ - $ - $ - $ - B-68 1-2 6 B* 400 662 664 $ 439,000 $ - $ 110,000 $ 549,000 $ - $ 549,000 $ - $ - $ - Zone 6 Trunk - 100% DCB-69 1-2 6 B* 400 397 664 $ 263,000 $ - $ 66,000 $ 329,000 $ - $ 197,623 $ 131,377 $ - $ - Zone 6 Trunk - DC with PP Benefit
37,083 $ 17,797,000 $ - $ 4,458,000 $ 28,521,000 $ 10,358,385 $ 14,576,603 $ 453,012 $ - $ 3,133,000
Note: EA Schedule B projects will be on future road alignments and will be re-classified as A+ once road right-of-ways are established. Schedule B* projects were previously approved under 2006 City Wide Water and Wastewater Master Plan
Appendix B
TABLE B-2 WATER CAPITAL PROGRAM
SERVICING OPTION C

Hamilton Airport Employment Growth District - Phase 2 Financial/Economic Impact Analysis and Marketing Strategy
Dillon Consulting Ltd. 90 Watson & Associates Economists Ltd.
Project ID Stage-Phase EA SCH. Size Length Unit Cost Base Cost Additional Cost
Engineering / Contingency
(25%)Total Cost Direct Developer
Cont.Development
ChargesPost Period
Benefit Oversizing Benefit to Existing Comments
(mm) (m) (2009 $/m) (2009 $) (2009 $) (2009 $) (2009 $) (2009 $) (2009 $) (2009 $) (2009 $) (2009 $)
C-1 1-1 B 375 1,275 485 $ 618,000 $ - $ 155,000 $ 773,000 $ 773,000 $ - $ - $ - $ - C-1a 1-1 B 375 450 485 $ 218,000 $ - $ 55,000 $ 273,000 $ 273,000 $ - $ - $ - $ - C-1b 1-1 B 375 350 485 $ 170,000 $ - $ 43,000 $ 213,000 $ 213,000 $ - $ - $ - $ - C-1c 1-1 B 375 950 485 $ 460,000 $ - $ 115,000 $ 575,000 $ 575,000 $ - $ - $ - $ - C-2 1-1 A+ 375 1,400 485 $ 678,000 $ - $ 170,000 $ 848,000 $ - $ 848,000 $ - $ - $ - Existing Rd Allowance - 100% DCC-3 1-1 A+ 375 875 485 $ 424,000 $ - $ 106,000 $ 530,000 $ - $ 530,000 $ - $ - $ - Existing Rd Allowance - 100% DCC-3a 1-1 B 375 400 485 $ 194,000 $ - $ 49,000 $ 243,000 $ 243,000 $ - $ - $ - $ - C-3b 1-1 B 375 425 485 $ 206,000 $ - $ 52,000 $ 258,000 $ 258,000 $ - $ - $ - $ - C-4 1-1 A+ 375 1,150 1427 $ 1,641,000 $ - $ 410,000 $ 2,051,000 $ - $ 2,051,000 $ - $ - $ - Deep Section - Increased unit costC-4a 1-1 B 375 750 485 $ 363,000 $ - $ 91,000 $ 454,000 $ 454,000 $ - $ - $ - $ - C-5-i 1-1 A+ 450 630 1615 $ 1,017,000 $ - $ 254,000 $ 1,271,000 $ - $ 1,271,000 $ - $ - $ - Deep Section - Increased unit costC-5-ii 1-1 A+ 600 880 584 $ 514,000 $ - $ 129,000 $ 643,000 $ - $ 643,000 $ - $ - $ - Existing Rd Allowance - 100% DCC-5a 1-1 A+ 375 700 485 $ 339,000 $ - $ 85,000 $ 424,000 $ - $ 424,000 $ - $ - $ - Existing Rd Allowance - 100% DCC-6 1-1 B 375 850 485 $ 412,000 $ - $ 103,000 $ 515,000 $ - $ 515,000 $ - $ - $ - Existing Rd Allowance - 100% DC
SPS2 1-1 A+ $ 700,000 $ - $ 700,000 $ - $ - $ - Twenty Rd SPS UpgradesC-11 1-2 B 375 1,200 485 $ 581,000 $ - $ 145,000 $ 726,000 $ 726,000 $ - $ - $ - $ - C-11a 1-2 B 375 675 485 $ 327,000 $ - $ 82,000 $ 409,000 $ 409,000 $ - $ - $ - $ - C-11b 1-2 B 375 350 485 $ 170,000 $ - $ 43,000 $ 213,000 $ 213,000 $ - $ - $ - $ - C-11e 1-2 B 375 670 485 $ 325,000 $ - $ 81,000 $ 406,000 $ 406,000 $ - $ - $ - $ - C-11f 1-2 A+ 375 600 485 $ 291,000 $ - $ 73,000 $ 364,000 $ - $ 364,000 $ - $ - $ - Existing Rd Allowance - 100% DCC-12 1-2 A+ 750 3,339 2379 $ 7,943,000 $ - $ 1,986,000 $ 9,929,000 $ - $ 9,929,000 $ - $ - $ - Deep Sewer (7-10m) - Increased Unit CostC-12b 1-2 B 375 1,500 485 $ 727,000 $ - $ 182,000 $ 909,000 $ 909,000 $ - $ - $ - $ - C-13 1-2 A+ 600 1,175 2049 $ 2,408,000 $ 602,000 $ 3,010,000 $ - $ 3,010,000 $ - $ - $ - Deep Sewer (7-10m) - Increased Unit CostC-13a 1-2 B 375 900 485 $ 436,000 $ - $ 109,000 $ 545,000 $ 545,000 $ - $ - $ - $ - C-13b 1-2 A+ 375 950 485 $ 460,000 $ - $ 115,000 $ 575,000 $ - $ 575,000 $ - $ - $ - Existing Rd Allowance - 100% DCC-14 1-2 B 525 2,275 1826 $ 4,154,000 $ - $ 1,039,000 $ 5,193,000 $ 4,592,656 $ 600,344 $ - $ - $ - Deep Sewer (6-10m) - Increased Unit CostC-14a 1-2 B 375 450 485 $ 218,000 $ - $ 55,000 $ 273,000 $ 273,000 $ - $ - $ - $ - C-14b 1-2 A+ 375 450 485 $ 218,000 $ - $ 55,000 $ 273,000 $ - $ 273,000 $ - $ - $ - Existing Rd Allowance - 100% DCC-14c 1-2 A+ 375 375 485 $ 182,000 $ - $ 46,000 $ 228,000 $ - $ 228,000 $ - $ - $ - Existing Rd Allowance - 100% DCC-14d 1-2 A+ 375 500 485 $ 242,000 $ - $ 61,000 $ 303,000 $ - $ 303,000 $ - $ - $ - Existing Rd Allowance - 100% DCC-15 1-2 B 375 1,225 485 $ 594,000 $ - $ 149,000 $ 743,000 $ 743,000 $ - $ - $ - $ - C-15a 1-2 A+ 375 350 485 $ 170,000 $ - $ 43,000 $ 213,000 $ - $ 213,000 $ - $ - $ - Existing Rd Allowance - 100% DCC-15b 1-2 A+ 375 575 485 $ 279,000 $ - $ 70,000 $ 349,000 $ - $ 349,000 $ - $ - $ - Existing Rd Allowance - 100% DCC-15c 1-2 B 375 450 485 $ 218,000 $ - $ 55,000 $ 273,000 $ 273,000 $ - $ - $ - $ - C-15d 1-2 B 375 450 485 $ 218,000 $ - $ 55,000 $ 273,000 $ 273,000 $ - $ - $ - $ - C-15e 1-2 B 375 625 485 $ 303,000 $ - $ 76,000 $ 379,000 $ 379,000 $ - $ - $ - $ - C-16 1-2 A+ 375 875 485 $ 424,000 $ - $ 106,000 $ 530,000 $ - $ 530,000 $ - $ - $ - Existing Rd Allowance - 100% DCC-16a 1-2 B 375 400 485 $ 194,000 $ - $ 49,000 $ 243,000 $ 243,000 $ - $ - $ - $ - C-16b 1-2 B 375 425 485 $ 206,000 $ - $ 52,000 $ 258,000 $ 258,000 $ - $ - $ - $ - C-16c 1-2 B 375 425 485 $ 206,000 $ - $ 52,000 $ 258,000 $ 258,000 $ - $ - $ - $ - C-18a 1-2 B 375 175 485 $ 85,000 $ - $ 21,000 $ 106,000 $ 106,000 $ - $ - $ - $ - C-18b 1-2 B 375 175 485 $ 85,000 $ - $ 21,000 $ 106,000 $ 106,000 $ - $ - $ - $ - C-18c 1-2 B 375 175 485 $ 85,000 $ - $ 21,000 $ 106,000 $ 106,000 $ - $ - $ - $ - C-18d 1-2 B 375 700 485 $ 339,000 $ - $ 85,000 $ 424,000 $ 424,000 $ - $ - $ - $ - C-19a 1-2 B 375 699 485 $ 339,000 $ - $ 85,000 $ 424,000 $ 424,000 $ - $ - $ - $ - C-19b 1-2 B 375 518 485 $ 251,000 $ - $ 63,000 $ 314,000 $ 314,000 $ - $ - $ - $ - C-19c 1-2 B 375 435 485 $ 211,000 $ - $ 53,000 $ 264,000 $ 264,000 $ - $ - $ - $ - C-19d 1-2 B 375 859 485 $ 416,000 $ - $ 104,000 $ 520,000 $ 520,000 $ - $ - $ - $ - C-19e 1-2 B 375 381 485 $ 185,000 $ - $ 46,000 $ 231,000 $ 231,000 $ - $ - $ - $ - C-20c 1-2 A+ 375 275 485 $ 133,000 $ - $ 33,000 $ 166,000 $ - $ 166,000 $ - $ - $ - Existing Rd Allowance - 100% DCSPS1 1-2 B* 40 L/s $ 1,478,000 $ - $ 370,000 $ 1,848,000 $ - $ 1,848,000 $ - $ - $ - FM 1-2 B* 300 4,700 398 $ 2,340,000 $ - $ 585,000 $ 2,925,000 $ - $ 2,925,000 $ - $ - $ -
TOTALS 41,386 $ 34,695,000 $ - $ 8,685,000 $ 44,080,000 $ 15,784,656 $ 28,295,344 $ - $ - $ -
Note: EA Schedule B projects will be on future road alignments and will be re-classified as A+ once road right-of-ways are established. Schedule B* projects were previously approved under 2006 City Wide Water and Wastewater Master Plan
Appendix BTABLE B-3
AEGD WASTEWATER CAPITAL PROGRAMSERVICING OPTION C
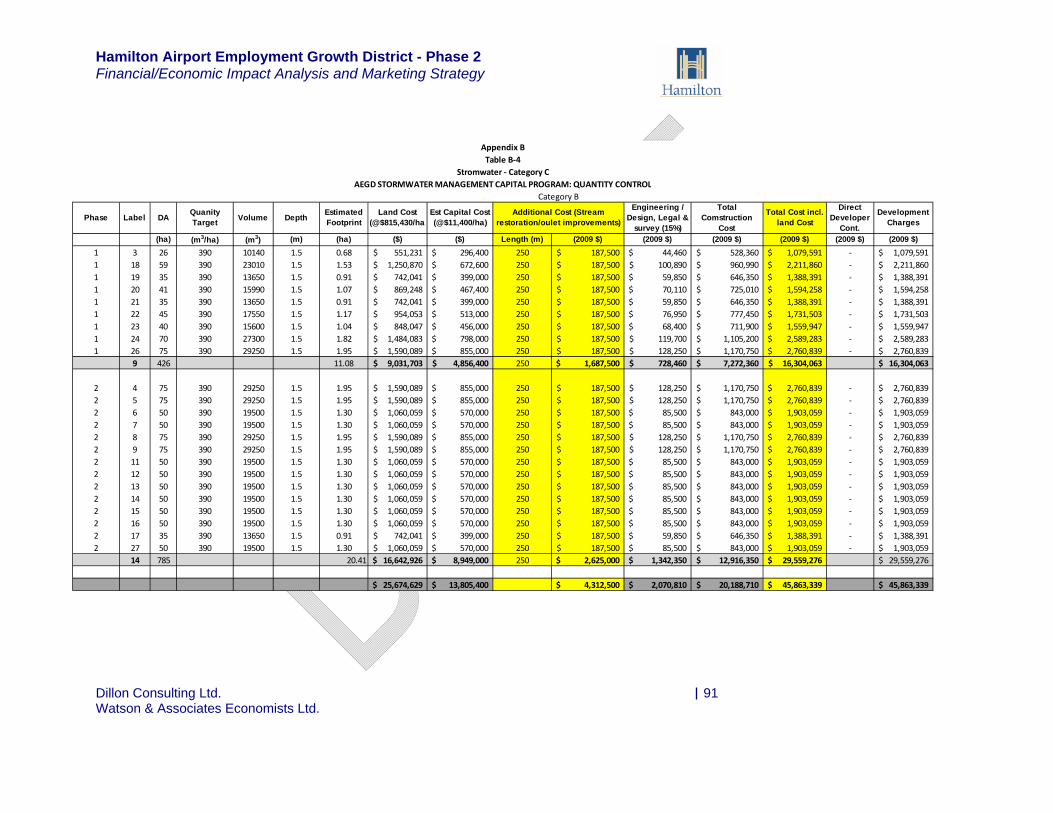
Hamilton Airport Employment Growth District - Phase 2 Financial/Economic Impact Analysis and Marketing Strategy
Dillon Consulting Ltd. 91 Watson & Associates Economists Ltd.
Phase Label DA Quanity Target Volume Depth Estimated
Footprint Land Cost
(@$815,430/haEst Capital Cost (@$11,400/ha)
Engineering / Design, Legal &
survey (15%)
Total Comstruction
Cost
Total Cost incl. land Cost
Direct Developer
Cont.
Development Charges
(ha) (m3/ha) (m3) (m) (ha) ($) ($) Length (m) (2009 $) (2009 $) (2009 $) (2009 $) (2009 $) (2009 $)1 3 26 390 10140 1.5 0.68 551,231$ 296,400$ 250 187,500$ 44,460$ 528,360$ 1,079,591$ ‐ 1,079,591$ 1 18 59 390 23010 1.5 1.53 1,250,870$ 672,600$ 250 187,500$ 100,890$ 960,990$ 2,211,860$ ‐ 2,211,860$ 1 19 35 390 13650 1.5 0.91 742,041$ 399,000$ 250 187,500$ 59,850$ 646,350$ 1,388,391$ ‐ 1,388,391$ 1 20 41 390 15990 1.5 1.07 869,248$ 467,400$ 250 187,500$ 70,110$ 725,010$ 1,594,258$ ‐ 1,594,258$ 1 21 35 390 13650 1.5 0.91 742,041$ 399,000$ 250 187,500$ 59,850$ 646,350$ 1,388,391$ ‐ 1,388,391$ 1 22 45 390 17550 1.5 1.17 954,053$ 513,000$ 250 187,500$ 76,950$ 777,450$ 1,731,503$ ‐ 1,731,503$ 1 23 40 390 15600 1.5 1.04 848,047$ 456,000$ 250 187,500$ 68,400$ 711,900$ 1,559,947$ ‐ 1,559,947$ 1 24 70 390 27300 1.5 1.82 1,484,083$ 798,000$ 250 187,500$ 119,700$ 1,105,200$ 2,589,283$ ‐ 2,589,283$ 1 26 75 390 29250 1.5 1.95 1,590,089$ 855,000$ 250 187,500$ 128,250$ 1,170,750$ 2,760,839$ ‐ 2,760,839$
9 426 11.08 9,031,703$ 4,856,400$ 250 1,687,500$ 728,460$ 7,272,360$ 16,304,063$ 16,304,063$
2 4 75 390 29250 1.5 1.95 1,590,089$ 855,000$ 250 187,500$ 128,250$ 1,170,750$ 2,760,839$ ‐ 2,760,839$ 2 5 75 390 29250 1.5 1.95 1,590,089$ 855,000$ 250 187,500$ 128,250$ 1,170,750$ 2,760,839$ ‐ 2,760,839$ 2 6 50 390 19500 1.5 1.30 1,060,059$ 570,000$ 250 187,500$ 85,500$ 843,000$ 1,903,059$ ‐ 1,903,059$ 2 7 50 390 19500 1.5 1.30 1,060,059$ 570,000$ 250 187,500$ 85,500$ 843,000$ 1,903,059$ ‐ 1,903,059$ 2 8 75 390 29250 1.5 1.95 1,590,089$ 855,000$ 250 187,500$ 128,250$ 1,170,750$ 2,760,839$ ‐ 2,760,839$ 2 9 75 390 29250 1.5 1.95 1,590,089$ 855,000$ 250 187,500$ 128,250$ 1,170,750$ 2,760,839$ ‐ 2,760,839$ 2 11 50 390 19500 1.5 1.30 1,060,059$ 570,000$ 250 187,500$ 85,500$ 843,000$ 1,903,059$ ‐ 1,903,059$ 2 12 50 390 19500 1.5 1.30 1,060,059$ 570,000$ 250 187,500$ 85,500$ 843,000$ 1,903,059$ ‐ 1,903,059$ 2 13 50 390 19500 1.5 1.30 1,060,059$ 570,000$ 250 187,500$ 85,500$ 843,000$ 1,903,059$ ‐ 1,903,059$ 2 14 50 390 19500 1.5 1.30 1,060,059$ 570,000$ 250 187,500$ 85,500$ 843,000$ 1,903,059$ ‐ 1,903,059$ 2 15 50 390 19500 1.5 1.30 1,060,059$ 570,000$ 250 187,500$ 85,500$ 843,000$ 1,903,059$ ‐ 1,903,059$ 2 16 50 390 19500 1.5 1.30 1,060,059$ 570,000$ 250 187,500$ 85,500$ 843,000$ 1,903,059$ ‐ 1,903,059$ 2 17 35 390 13650 1.5 0.91 742,041$ 399,000$ 250 187,500$ 59,850$ 646,350$ 1,388,391$ ‐ 1,388,391$ 2 27 50 390 19500 1.5 1.30 1,060,059$ 570,000$ 250 187,500$ 85,500$ 843,000$ 1,903,059$ ‐ 1,903,059$
14 785 20.41 16,642,926$ 8,949,000$ 250 2,625,000$ 1,342,350$ 12,916,350$ 29,559,276$ 29,559,276$
25,674,629$ 13,805,400$ 4,312,500$ 2,070,810$ 20,188,710$ 45,863,339$ 45,863,339$
Additional Cost (Stream restoration/oulet improvements)
Category B
Appendix BTable B‐4
Stromwater ‐ Category CAEGD STORMWATER MANAGEMENT CAPITAL PROGRAM: QUANTITY CONTROL