financial dependence and growth - the national · pdf file · 1997-05-27financial...
TRANSCRIPT

NBER WO~G PAPER SERIES
FINANCIAL DEPENDENCE AND GROWTH
Raghuram G. Rajan
Luigi Zingales
Working Paper 5758
NATIONAL BUREAU OF ECONOMIC RESEARCH
1050 Massachusetts Avenue
Cambridge, MA 02138
September 1996
We thank Gene Fama, Peter Klenow, Krishna Kumar, Canice Prendergast, Andres Rodriguez-Clare,
David Scharfstein, Robert Vishny, and participants in the Junior Faculty lunch group at the
University of Chicago, the Finance seminar at UCLA, and the NBER Summer Institute for usefi.d
comments. Jayanta Sen and Alfi-ed Shang provided excellent research assistance. A preliminary
study was supported by the World Bank. We gratefully acknowledge financial support from NSF
grant #SBR-9423645. This paper is part of NBER’s research programs in Corporate Finance and
Economic Fluctuations and Growth. Any opinions expressed are those of the authors and not those
of the National Bureau of Economic Research.
O 1996 by Raghuram G. Rajan and Luigi Zingales. All rights reserved. Short sections of text, not
to exceed two paragraphs, may be quoted without explicit permission provided that full credit,
including 0 notice, is given to the source.

NBER Working Paper 5758
September 1996
FINANCIAL DEPENDENCE AND GROWTH
ABSTRACT
Does finance affect economic growth? A number of studies have identified a positive
correlation between the level of development of a country’s financial sector and the rate of growth
of its per capita income. As has been noted elsewhere, the observed correlation does not necessarily
imply a causal relationship. This paper examines whether financial development facilitates
economic growth by scrutinizing one rationale for such a relationship; that financial development
reduces the costs of external finance to firms. Specifically, we ask whether industrial sectors that
are relatively more in need of external finance develop disproportionately faster in countries with
more developed financial markets. We find this to be true in a large sample of countries over the
1980s. We show this result is unlikely to be driven by omitted variables, outliers, or reverse
causality,
Raghuram G. Rajan
Kellogg Graduate School of Management
Northwestern University
2001 Sheridan Road
Evanston, IL 60208
and NBER
fac_rajan@gsbvax .uchicago.edu
Luigi Zingales
Graduate School of Business
University of Chicago
1101 East 58th Street
Chicago, IL 60657
and NBER
[email protected] .edu

There is a large literature - dating at le=t ss far back = Schumpeter (1911) - that empha-
sizes the links between the state of development of a country’s financial sector and the level and
the rate of growth of its per capita income. The argument essentially is that the services the
financial sector provides – of reallocating capital to the highest value use without substantial
risk of loss through moral hazard, adverse selection, or transactions costs – are an essential
catalyst of economic growth. The existence of a correlation between financial development and
economic growth has been documented in a number of empirical studies starting with Cameron
(1967), Goldsmith (1969) and McKinnon (1973). Economic historians have identified spurts of
growth in certain countries with the development of specific financial institutions. For example,
Cameron (1961) and Gerschenkron (1962) have associated the economic growth of France in the
middle of the nineteenth century with the est abolishment of the Credit Mobilier. 1 Nevertheless,
some economists have questioned the interpretation of these studies, arguing that correlation
does not imply causality. Paraphrasing North, financial development does not cause economic
growth, it is economic growth.2
In an important recent paper, Levine and King (1993a) investigate the causality problem
following a post hoc, ergo pTopteT hoc approach. They show that the predetermined component
of financial development is a good predictor of growth over the next 10 to 30 years. While
their paper does suggest that the observed correlation is not spurious, it does not lay to rest all
doubts about causality. The sceptic could still offer a number of arguments.
First, both financial development and growth could be driven by a common omitted variable
such as the propensity of households in the economy to save. Since endogenous savings (in
certain macroeconomic models) affects the long run growth rate of the economy, it may not be
surprising that growth and initial financial development are correlated. This argument is also
hard to refute with simple cross-country regressions. In the absence of a well accepted theory
1Adopting a diflerent tack, I{indleberger (1993) discusses the importance of finance to the outcome of wars(for instance, Britain’s ability to mobilize financial resources after the Glorious Revolution of 1688 may explainwhy, with one-third France’s manpower, it could defeat the French) and asks “Can Finance be relewnt to militaryoutcomes, as widely insisted on, but not to the course of economic development?”
‘The early studies have typically been cautious about their findings. For instance, Goldsmith (1969, p48)writes “In most countries, a rough parallelism can be observed between economic and financial development ifperiods of several decades are considered. There is no possibility, however, of establishing with confidence thedirection of the causal mechanism, i.e., of deciding whether financial factors were responsible for the accelerationof economic development or whether financial development reflected economic growth whose mainsprings mustbe sought elsewhere. ”
1

of growth, the list of potential omitted variables that financial sector development might be a
proxy for is large, and the explanatory variables to include a matter of conjecture (on this see
Paxson, 1996).
Second, there is a potential problem of anticipation. Financial development - typically
messured by the level of credit and the size of the stock m~ket (but see King and Levine (1993a)
for other proxies) – may predict economic growth simply because financial markets anticipate
future growth; the stock market capitalizes the present value of growth opportunities, while
financial institutions lend more if they think sectors will grow. Thus financial development may
simply be a leading indicator rather than a causal factor.
To interpret these correlations in a more causal sense it is necessary to identify the mechanism
through which financial development affects economic growth and to document its working. Our
paper is an attempt to do this.
The fundamental role played by the financial sector is to facilitate the reallocation of funds
from agents (individuals) with an excess of capital given their investment opportunities towards
agents (firms) with a shortage of funds vis h vis their investment opportunities. This implies
that financial development has two effects. First, by reducing the transactions costs of saving
and investing, it lowers the overall cost of capital in the economy in general. Second, to the
extent that finmcial markets and institutions help firms overcome problems of moral hazard
and adverse selection, it should reduce the costs of external finance vis ~ vis the cost of internal
funds such as cash flows.
Financial development, thus, should reduce both the cost of capital and the differential
cost of eztemal finance. Our paper focuses on the second effect. If the financial sector works
through the cost of external finance, firms that are typically short of funds given investment
opportunities should do better in economies with well developed financial sectors. The test then
is whether firms (or industries) dependent on external finance for their growth are relatively
“better off in economies with well developed financial markets. A finding that they are could
be the ‘smoking gun’ in the debate about causality. There are two virtues to this simple test.
First, it focuses on the details of a mechanism by which finance affects growth, thus providing a
stronger test of causality. Second, it can correct for fixed country (and industry) effects. Though
its value depends on how reasonable our micro-economic assumptions are, it is less dependent
2

on a specific macroeconomic model of growth.
Specifically, we propose the following test. We identify an industry’s need for external finance
(the difference between investments and internal c=h generated from operations) from data on
U.S. firms. Under the assumption that capital markets in the United States, especially for
the large listed firms we analyze, are relatively frictionless, this method allows us to identify an
industry’s technological demand for external financing. We then examine whether the industries
that are more dependent on external financing grow relatively fsster in countries that initially
have better developed financial markets and institutions.
We find evidence consistent with this. In a country which is one standard deviation above
the mean of financial development, the difference in growth rates between an industry whose
financial dependence is one standard deviation above the mean and the average industry, is
1% more (annually, and in real terms) than in the average country. Moreover, we find that
industries that generate substantial cash flow from operations grow relatively faster in countries
with underdeveloped financial systems. The intensity of investment in industries dependent on
external finance is disproportionately higher in countries with more developed financial markets.
Finally, firms in financially dependent industries are disproportionately larger in countries with
more developed financial markets. Our results are robust to the introduction of various proxies
for a country’s level of development and human capital, making it unlikely that they are driven
by an omitted variable.
Let us be careful about what we find, and about what we have little to say. Our findings
suggest that the ex ante development of financial markets facilitates the ex post growth of sectors
dependent on external finance. This implies that the link between financial development and
growth identified elsewhere may stem, at le=t in part, from a channel identified by the theory:
financial markets and institutions reduce the cost of external finance for firms. Of course, our
analysis suggests only that financial development liberates firms from the drudgery of generating
funds internally. It is ultimately the availability of profitable investment opportunities that
drives growth, and we have little to say about where these come from.
Clearly, the plausibility of our work depends on how acceptable its underlying assumptions
are. One of our assumptions is that there is a technological reuon why some industries
penal more on external finance than others. To the extent that the initial project scale,
de-
the
3

gestation period, the c=h harvest period, and the requirement for continuing investment differ
substantially between industries, this is indeed plausible. More debatable is our assumption that
these technological differences persist across countries despite v=t differences in local conditions.
However,
require a
than the
gestation
all we really need is that statements of the following sort hold: If pharmaceuticals
larger initial scale ad have a higher gestation period before cashflows are harvested
textile industry in the U-S., it also requires a larger initial scale and h= a higher
period in Korea.
Furthermore, for a country’s financial development to have any effect on industry growth in
that country we have to assume that firms finance themselves largely in their own country. In
other words, only if world capital markets are not perfectly integrated can domestic financial
development tiect a country’s growth. There is a wealth of evidence documenting the existence
of frictions in international capital markets: the extremely high correlation between a country’s
savings and its investments (Feldstein and Horioka, 1980), the strong home bias in portfolio
investments (French and Poterba , 1991 ), and cross countries differences in expected returns
(Bekaert and Harvey, 1995). We have little else to say about these two assumptions other
than noting that their failure would weaken the power of our tests but not necessarily bias our
findings.
Finally, we address concerns about the interpretation of our findings. As argued earlier, the
size of financial markets might reflect the extent to which growth is capitalized. But this would
not explain why there is a differential effect of financial development on the growth of industries
dependent on external finance, nor why financial development continues to matter even when
we use other proxies for it such as a country’s accounting standards. A second possibility is that
financial markets might develop in anticipation of the financing needs of industry. We regard
this as unlikely for a number of reasons. It is not clear that the state of development of markets
is the outcome of a rational plan. In many fomer colonies, it is determined by the identity of
the colonial power and the legal and political systems they imposed (see La Porta, Lopez de
Silmes, Shleifer and Vishny (1996) ).3 At best, markets appear to develop in response to the
3For instance, India which has a common-law system introduced by the British has had a vibrant stockexchange since the l=t century (La Porta et al. argue that common law systems are more conducive to thedevelopment of equity markets). The stock exchange survived, albeit in a low energy state, even when many ofthe activities requiring external finance such as infrastructure development were taken over by the government
4

current (and past ) needs of industry (see Chandler ( 1977)’s discussion of the development of
public corporate debt markets in the United States in response to the financing needs of the
railroads) rather than anticipated needs.
But this suggests another explanation of our results, Perhaps, some factor may have been
responsible for the past growth of financially dependent sectors. This, in turn, would explain
the current development of financial markets, and the persistence of the factor would explain
the growth of financially dependent sectors. Thus the current development of financial markets
would be correlated with the growth of financially dependent sectors, even absent any of the
channels we have discussed. Indeed we find that a country’s financial development is strongly
correlated with the ex ante proportion of financially dependent industries in that economy.
Nevertheless, we still find that the relative growth rate of financially dependent industries is
higher in more financially developed countries even when we restrict our analysis to sectors
that are small at the beginning of the period, and hence unlikely to be responsible for the
state of development of the financial markets .4 Furthermore, the bmic correlation persists when
we instrument with more exogenous measures of the state of development of capital markets
such as a country’s accounting standards, and when we include the interaction between an
industry’s financial dependence and the ex ante proportion of financially dependent industries
in the economy (which is a proxy for the omitted factor).
While our interest is primarily in the macro-economic link between financial development
and growth, there are at least two re~ons why our work may also be of interest in the current
macroeconomic debate on whether firms are “credit rationed”. First, much of the empirical
literature on this issue has focused on large, publicly traded, U.S. (or Japanese) companies.
The difference in liquidity constraints between such firms is likely to be small relative to the
differences between industries across different financial markets which is our focus. Second,
following the influential work by Fazzari, Hubbard and Petersen (1988), the papers in this
literature have typically sorted firms on some ex ante proxy (such as the payment of dividends
after India got independence. With the gradual withdrawal of the government from industry in the 1980s, thestock muket h= resumed its role as an important source of finance for young firms.
‘This is consistent with Chandler’s account of the financing of U.S. industries. Their growth was partly drivenby the atilability of finance in a system that had largely been developed to fund infr=tructure such as railroadsand CalldS.
5

or the existence of bank relationships) for financial constraints. They then argue that the
higher sensitivity of investments to cashflows for firms that the ex ante proxy suggests are
more susceptible to being constrained is evidence of a differential wedge between the cost of
internal and external funds among these firms. A number of questions have been raised by
this methodology. First, is the proxy really exogenous? Second, could cashflows proxy for
investment opportunities, thus driving the correlation? Final] y, as Kaplan and Zingales (1996)
point out, the validity of such an approach depends on the monotonicity of the investment-c=h
flow sensitivity to the proxy for financial constraints, which – they show – does not necessarily
hold. By contr=t, they argue that a more appropriate test of the effects of financial constraints
consists in analyzing the differential level of investments (and, thus, growth) across firms facing
a differential wedge between the cost of internal and external funds.
The approach taken by our paper may deal with this criticism and suggest a new way of
investigating these issues. For instance, financial development may be thought of as more ex-
ogenous to a particular industry than its dividend policy or its banking relationships (we do
not imply that none of the proxies in the literature are exogenous). Furthermore, even if cash-
flows proxy for investment opportunities, it is the interaction with financial development that is
evidence of financial constraints. Finally, our paper addresses the Kaplan-Zingales critique by
testing for differences in industry growth across countries with differentially developed financial
markets and, thus, with a differential wedge between cost of external and internal funds. So
our evidence could be thought of M reaffirming that financial constraints do fiect investment,
while finessing the debate surrounding the previous work.
Finally, Demirguc-Kunt and Maksimovic (1996) also use micro data to develop a test of
the influence of financial development on growth. Using firm-level data, they estimate the
proportion of firms whose rate of growth exceeds the growth that could have been supported
only by internal resources. They then run a cross country regression and find that this proportion
is positively related to the stock market turnover and to a measure of law enforcement. While
their paper is similar in spirit to ours, there are two essential differences. First, their estimate
of the internal growth rate of a firm is dependent on the firm’s characteristics. While it is
potentially more accurate than our measure of external dependence, it is also more endogenous.
Another difference is that in the spirit of traditional cross-country regressions, they focus on
6
between-country differences, while our focus is on within-country, between-industry differences.
The latter is an important innovation in this paper.
The rest of the paper is = follows. We describe our measure of financial dependency in
section 1. In section 2, we present our data on financial development, country characteristics,
and industry growth. In section 3 we set up our main tests, we discuss the results in section 4,
and explore the robustness of our findings in section 5. Section 6 concludes.
1 A Measure of External Dependency
If the presence of a well developed financial market reduces the costs of external finance, it must
have a greater effect on the growth rate of firms that are more dependent on external funds. To
investigate this, we have to determine a firm’s demand for external finance over a certain period.
Our earliest comprehensive measure of financial market development is for the year 1980, and
our last systematic data on growth is for 1990. This then defines the period of interest to be
1980-1990.
We immediately face some problems. First, a problem of data availability; the most dis-
aggregated comprehensive data we have for countries is at the industry level (data at the firm
level, if available, is typically limited to large listed firms). Data on the actual use of external
financing is typically not available. But even if it were, it would not be useable because it would
reflect the equilibrium between the demand for external funds and its supply. Since the latter
is precisely what we are attempting to test for, this information is contaminated. A second
problem is that we are not aware of any systematic study of the external financing needs of
different industries, either cross-sectionally or over time. Empirical work in corporate finance
typically focuses on the choice between debt and equity, and not on the use of external versus
internal funds. 5
We, therefore, start by studying the external financing needs of U.S. companies over the
1980s. We use data from Compustat for this. Compustat does not contain a representative
sample of U.S. firms, because is limited to publicly traded firms, which are relatively large.
Nevertheless, we regard this = an advantage for two re~ons. First, in a perfect capital market
‘Mayer (1990) and Demirguc-I{unt and Maksimovic (1996) are exceptions. Mayer uses country level data.
7

the supply of funds to firms is perfectly cl-tic at the proper risk adjusted rate. In such a mmket
the actual amount of external funds raised by a firm equals its desired amount, In other words,
in such an idealized setting, the identification problem does not exist. But capital markets in
the United States are among the most advanced in the world, and large publicly traded firms
typically face the le=t frictions in accessing finance. Thus the amount of external finance used
by large firms in the United States is likely to be a relatively pure measure of their demand for
external finace. Note that we are not assuming that the U.S. financial markets are perfect, but
only that they are among the least imperfect.
A second resson for using a database on listed firms is that disclosure requirements imply
that the data on financing are comprehensive. In the rest of the paper, we will take the amount
of external finance used by U.S. firms in an industry ss a proxy for the desired amount foreign
firms in the same industry would have liked to raise had their financial markets been more
developed.
Next, we have to define precisely what we mean by external and internal finance. We are
interested in the amount of desired investment that cannot be financed through internal sources,
i.e., the cash flow generated by the same business. Therefore, a firm’s dependence on external
finance is defined as the ratio of capital expenditures (Compustat # 128) minus cash flow from
operations divided by capital expenditures. Cash flow from operations is broadly defined ss the
sum of Compustat c~h flow from operations (Compustat # 110) plus decre=es in inventories,
decre~es in receivables, and increases in payables. 6 Note that this definition includes changes
in the non-financial components of net working capital = part of funds from operations. In fact,
in certain businesses these represent major sources (or uses) of funds, that help a firm avoid (or
force it to tap) external sources of funds.7
Similarly, the dependence on external equity finance is defined m the ratio of the net amount
of equity issues (Compustat # 108 minus # 115) to capital expenditures. Finally, the investment
‘This item is only defined for cash flow statements with format codes 1, 2, or 3. For format code 7 we constructit as the sum of items # 123, 125, 126, 106, 213, 217.
71t could be argued that inter-firm trade credit should be viewed as a component of external financing. ItiGunclear how much of trade credit is used to reduce transactions costs and how much is used for financing.Much trade credit is granted routinely and repaid promptly and typically, net trade credit for a firm (accountsreceivable less payables) is small (see Petersen and Rajan (1996)). This may be why trade credit is typicallytreated m part of operations in capital budgeting exercises. We adhere to this tradition.
8

intensity is the ratio of capital expenditure to net property plant and equipment (Compustat
# 8).
To make these measures comparable with the industry level data we have for other countries,
we have to choose how to aggregate these ratios across compmies and over time. For each firm,
we sum the numerator and denominator over time before dividing. For instance, we sum the
firm’s use of external finance over the 1980s and then divide by the sum of capital expenditure
over the 1980s to get the firm’s dependence on external finance in the 1980s. This smooths
temporal fluctuations and reduces the effects of outliers. To summarize ratios across firms,
however, we use the industry median. We do this to prevent large firms from swamping the
information from small firms; for instance, we know that IBM’s free cash flow does not alleviate
possible cash flow shortages of small computer firms.
Finally, we are concerned about the existence of a life cycle of financing – firms are more
dependent on external financing early in their life than later – which is “common wisdom” in
the corporate finance literature (though we were hard-pressed to find formal empirical studies
of this phenomenon).
Figure 1 shows such common wisdom to be true. It plots the median financing and invest-
ment needs across U.S. firms = a function of the number of years since the initial public offering
(IPO). Not surprisingly, in the year of the IPO, firms raise a substantial amount of external
funds (especially equity). More interestingly, this continues – albeit on a smaller scale – up to
approximately the 10th year. After that period, net equity issues go to zero and the usage of
external finance fluctuates around zero. Although this pattern appears to be fairly standard
across different industries, the level of external financing, both at an early stage and at a later
stage is quite different across industries. For example, in figure 2, we report the pattern of
investment and financing in two different industries. Companies in the computer industry show
an intensive use of external funds in the first decade of their existence, with occasional spurts of
external and equity financing later on. By contr=t, external finance goes to zero very shortly
after the IPO in the steel industry, but further substantial needs of external (and equity finance)
might arise later in life of a company.
In Table 1, we look at these differences more systematically. We tabulate by International
Standard Classification Code (ISIC) the median fraction of investments U.S. firms financed
9

externally (column I) and financed with equity (column II) during the 1980s. To highlight the
need for investments, in column 111we also report the level of capital expenditures divided by net
property plant and equipment. We restrict our attention to those manufacturing industries for
which we have value-added data from the United Nations Statistics. We report these figures for
all firms, mature firms (firms that did an IPO at least 10 years ago), and young firms (firms that
went public in the I=t 9 years). Not surprisingly, among mature firms, radio and computers
emerge = the two industries with the largest need for external finance, while tobacco is the
industry with the largest excess amount of internal funds relative to capital expenditures. This
is also reflected in its large equity repurchases. The clustering of external financing in a few
sectors is even more pronounced among young firms.
Given that the life-cycle pattern of external financing differs by industry, the most appro-
priate me=ure of external financing needs in other countries is debatable. The financing needs
of mature companies represent a better proxy for the financing needs of existing firms in other
countries. However, young firms may make up a larger fraction of the industry, especially in
developing countries, than they do in the United States. In the absence of more data on indus-
try composition, we will use the median across all firms in the industry in the U.S. to me=ure
dependence. However, we will examine if the result is sensitive to using just young or old firms.
1.1 Is the Financial Dependence of U.S. Firms a Good Proxy?
Much of our analysis rests on financial dependence of U.S. firms being a good proxy for the
demand for external funds in other countries. We think this is reasonable for four re=ons.
First, in a steady state equilibrium there will not be much need for external funds, as Fig-
ure 1 shows. Therefore, much of the demand for external funds is likely to arise as a result
of technological shocks that raise an industry’s investment opportunities beyond what inter-
nal funds can support. To the extent these shocks are worldwide, U.S. firms’ need for funds
represents a good proxy.8
Second, even if the new investment opportunities generated by these worldwide shocks differ
‘This amounts to saying that if the invention of persona] computers incre=ed the demand for external funds inthe U.S. computer industry, it is likely to incre=e the need for funds in the computer iudustry in other countriesas well.
10

across countries, the amount of cash flow produced by existing firms in a certain industry is
likely to be similar across countries. In fact, most of the determinants of ratio of cash flow to
capital are likely to be similar worldwide: the level of demand for a certain product, its stage in
the life cycle, and its cash harvest period, For this reason, we make sure that our results hold
even when we use the amount of internally generated cash, rather than the difference between
investments and internally generated funds.
Third, one might argue that the stage of a product life cycle that U.S. firms are in is likely
to be different from that of foreign firms. Given that our sample is biased toward developing
countries one might think that the U.S. industry in the 1970s might be a better proxy for
developing countries’ position in a product life cycle. For this remon, we also explore the
robustness of our results to me=uring the financial dependence of U .S. firms in the 1970s rather
than in the 1980s.
L=t but not least, that we only have a noisy measure of the need for funds creates a bias
against finding any effect of financial development on growth.
2 Data.
2.1 Data on financial development.
We start by describing our data on financial development contained in Table 2. Ideally, we would
like a measure of a firm’s ability to raise money. This depends on the variety of intermediaries
available, and the efficiency with which they perform the evaluation, monitoring, certification,
communication and distribution functions. Since there is little agreement on how these are
appropriately measured, and even less data available, we will have to make do with crude
proxies even though they may miss many of the aspects we think vital to a modern financial
system.
Turning first to equity markets, one memure of stock market development may be the
amount of money raised through initial public offerings and secondary offerings. Unfortunately,
this meuure is not available on a systematic buis for many countries. Moreover, it is well
documented in the U.S. (see earlier) that mature firms are
they have the potential to do so. It could then be argued
11
reluctant to issue stock, even though
that stock market capitalization is a

better measure of the availability of finance. Another virtue of this measure is that it is consistent
with the traditional literature (see Goldsmith (1969) for example) which h= typically used the
ratio of the size of the financial sector to output as a measure of financial sector development,
So the ratio of stock market capitalization to Gross Domestic Product in 1980 is the measure of
stock market development that we use. We obtain stock market capitalization for all countries
listed in the EmeTging Stock Mar-kets Factbook (which, interestingly, contains data on developed
countries also) published by the International Finance Corporation.g
A comparable measure for the state of development of credit markets is the ratio of domestic
credit to Gross Domestic Product, a measure also used by King and Levine (1993a). This
is obtained from the International Financial Statistics (IFS) published by the International
Monet~ Fund. Specifically, this measure is the ratio of IFS lines 32a through 32f and excluding
32e. Finally, we also compute the fraction of credit allocated to the private sector, which is the
ratio of claims on the non-financial private sector (IFS line 32d) to total domestic credit.
There are, of course, elements we do not capture. For instance, we do not have data on
corporate bond markets for more than a handful of countries. Except for the United States
which is not included in our tests, and Japan, corporate bond markets were typically small in
the early 1980s (see Rajan and Zingales, 1995). A potentially more damaging omission is private
equity and private placement of debt (not held by institutions). While they may be correlated
with me=ures of financial market development, there are certain countries where they clearly
are not. For instance, in Italy, most medium sized companies are privately held (see Pagano,
Panetta, and Zingales, 1995) while the stock market is relatively small. The lack of this data
may not be a serious problem because, after all, we are interested in how the availability of
external funds affects firms; the amount of private equity outstanding is generally a reflection of
the amount of internal finance privately held companies have secured in the past, and therefore
is not a measure of how developed the financial markets are.
gStock market capitalization is me=ured at the end of the year, while Gross Domestic Product may =Iueflows through the year. This may be a problem in high inflation countries. We therefore measure GDP as theGDP in constant prices multiplied by the producer price index where the base year for both series is five.yearsbefore the year of interest.
12

2.2 -Data on countries.
The Gross Domestic Product, the Producer Price Index, the exchange rate, and the Index
of Industrial Production are all obtained from International Financial Statistics. Whenever a
pmticular series is not available, we use close substitutes – for instance, the wholesale price index
if the producer price index is not available. Data on a country’s human capital (average years
of schooling in population over 25) and the share of investment in GDP in 1980 are obtained
from the Barre-Lee files downloaded from the NBER web site (see Barro and Lee (1994)).
2.3 Data on industries.
Data on value added and gross fixed capital formation for each industry in each country are
obtained from the General Industrial Statistics (VOI 1) database put together by the United
Nations Statistics Division. We checked the data for inconsistencies, changes in classification of
sectors, and changes in units. The U.N. data is classified by International SIC code. In order to
obtain the amount of external finance used by the industry in the U. S., we matched ISIC codes
with SIC codes. Typically, the three digit ISIC codes correspond to two digit SIC codes, while
the four digit ISIC code corresponds to three digit SIC codes. In order to reduce the dependence
on country specific factors like natural resources we confine our analysis to manufacturing firms
(U.S. SIC 2000-3999). Table 3 presents summary statistics for all these variables.
We would like data on ~ many countries as possible. The binding constraint is the avail-
ability of comparable data on a country’s equity markets. We started with 55 countries from
the Emerging Stock Markets Factbook. We dropped countries like Kuwait that did not report
a stock market capitalization till the latter half of the 1980s, We could not use Hong Kong and
Taiwan because data on these countries are not present in the International Financial Statistics
volumes. We also dropped countries for which we did not have data from the G ,1.S. database
that is separated by at Ie=t five years (notably, Switzerland). Finally, Thailand is dropped
because the U.N. notes that data from year to year are not comparable. The United States is
excluded from the analysis because it is our benchmark. This leaves us with the 43 countries in
Table 2.
13

2.4 .Data description.
Our b=ic measure of financial market development - which we term ‘financial development”
— is the sum of domestic credit and stock market capitalization to Gross Domestic Product.
Table 2 lists this measure and its components for countries in our final sample. A number of
patterns we discernible from an analysis of this table. First, credit markets are more developed
in richer countries. The correlation of log per capita income in 1980 with financial development
is 0.43 (significant at the l% level) the correlation with the ratio of credit market to GDP
is 0.45 (significant at the l% level), while the correlation with equity market capitalization
to GDP is 0.17 (though significant on] y at the 25V0 level). The weak correlation between
stock markets and per capita income is consistent with La Porta et al,’s view that colonial
influences and legal tradition, rather than economic conditions, are a strong determinant of the
development of equity markets. As an example, Singapore and Malaysia (under British common
law influence) have strong equity markets while Phillipines (under Spanish civil law) hss weaker
equity markets. Second, there seems to be no relationship (if anything, weak substitution)
between the development of credit markets and the development of stock markets (correlation
=-0.08, not significant), a fact previously noted by Demirguc-Kunt and Levine (1995). Third,
the fraction of domestic credit going to the private sector is strongly correlated with market
capitalization to GDP (correlation=O.5, significant at the l~o level). Possible explanations of this
correlation are that government involvement in industry crowds out the private sector, that the
government intervenes to fill the cap created by the absence of the market, or that respect and
enforcement of private property rights drives both variables. Finally, the fraction of domestic
credit going to the private sector is correlated with log per capita income (correlation= O.27,
significant at the 10% level).
We want to see if financially dependent industries are likely to be better off in countries
with well developed financial sectors. The availability of finance affects not just investment but
also the ability to finance operations and sales through working capi tal. Therefore, the most
appropriate me~ure of an industry being “better oR’ is the growth in value added for that
industry, i.e., the change in the log of real value added in that industry between 1980 and 1990.
Real value added in 1990 is obtained by deflating value added by the Producer Price Index. For
14

high inflation countries, spurious differences in value added may be obtained simply because the
UN data are measured at a different point from the PPI index. So, instead, we determine the
effective deflator by dividing the growth in nominal value added for the entire manufacturing
sector in the UN database by the index of industrial production (which measures the real growth
rate in industrial production) obtained from the IFS statistics.
The raw correlation between financial market development and the growth of the manufac-
turing sector across the 43 countries is 0.27 (significant at the 10% level). This is consistent
with the results in King and Levine (1993a), who show that the predetermined component of
market development affects future growth.
3 Financial dependence and growth
3.1 The basic test
Our hypothesis is that industries that are more dependent on external financing will have
relatively higher growth rates in countries that have more developed financial markets. In other
words, the explanatory variable whose influence we are interested in is the interaction between
an indust ry’s dependence on external finance (as measured in the U. S.) and local financial
market development.
Our study, therefore, has one important advantage over recent cross-country empirical stud-
ies of growth (e.g., Barro (1991), Kormendi and Meguire (1985), King and Levine (1993a),
Levine and Renelt (1992), Mankiw, Romer, and Weil (1992), and Demirguc-Kunt and Mak-
simovic (1996)). That advantage is simply that we make predictions about within country
differences between industries based on an interaction between a country and industry charac-
teristic. Therefore, we can correct for country and industry characteristics in ways that previous
studies were unable to correct for, and will be less subject to criticism about an omitted variable
bias or model specification.
The dependent variable is the average annual real growth rate of value added
j in country k over the period 1980-1990.10 The most effective way of correcting
in industry
for country
Iowe exclude the United Stat= in all subsequent regressions. As noted earlier, for some countries data avail-
ability limits the period even further. However, for no country do we have data separated by less than 5 years,
15
and industry characteristics is to use indicator variables, one for each country and industry.
The disadvantage of such a “fixed effects” regression is that the determinants of relative growth
other than the interaction of interest become less transparent. So we start by including country
characteristics and industry characteristics instead of indicator variables. The model we estimate
is then
GT~thj,k = PI..* . Countrykcharacteri sties + fl~+ 1... , IndustryjCharacteTistics+
P~+l..P. (Characteristics of country and industry) + BP+lInteractim + E (1)
Among the country characteristics we include are investment’s share in GDP in 1980, log
of per capita income in dollars in 1980, the average years of schooling in population over age
25, and our measure of financial development (which is the sum of domestic credit and stock
market capitalization to Gross Domestic Product).
The industry characteristic we include initially is industry j’s dependence on external fi-
nancing in the U.S. Finally, we include two variables that are characteristic of both country
and industry; industry j’s share in country k of total value added in manufacturing in 1980 and
the interact ion between industry j’s dependence on external financing in the U.S. and financial
market development in country k. We will then drop the country specific and industry specific
characteristics, and replace them with indicators for each country and each industry. This will
be the basic regression in the rest of the paper.
4 Results from the basic regression.
As can be seen in Table 4, the coefficient estimate for the interaction term is positive and
statistically significant at the l% level (throughout the paper, the reported standard errors are
heteroskedasticity corrected). The interaction term is akin to a second derivative. Using the
Dropping th- countries does not qualitatively affect the results. We reduce the impact of outliers by constrain-ing growth between -1 and +1, Three obserwtions are affected. The coefficient estimates for the interactioncoefficient are higher and still significant when we do not do this, though the explanatory power of the regressionis lower. We also rerun the same specification after winsorizing the l% and 5% tails of the growth rate distributionobtaining virtually identicrd results (except that the explanatory power of the regression is still higher).
A potential concern is that we measure growth in value added rather than growth in output. Unfortunately,we do not have data for the latter. While we may not capture increases iu productivity fully, we see no obviousway in which this should bias our results.
16

estimates in the first column, in a country which
of financial development, the difference in growth
is one standard deviation above the mean
rates between an industry whose financial
dependence is one standard deviation above the mean and the average industry, is lin the
average country. Is the effect large or small? Note that this measures the differential impact of
financial development on financially dependent industries, rather than the overall relationship
between financial development and growth. Still, the effect is of the same order of magnitude
(see below) ss the effect of variables such w investment’s share of GDP and per capita income
that populate cross-country growth regressions.
The other explanatory variables are also of interest. The following numbers in parentheses
indicate the effect on industry growth of a one standard deviation increase in the explanatory
variable. The higher investment’s share of GDP in 1980, the higher an industry’s growth rate
(1.6%). Developed countries have lower growth rates in manufacturing as evidenced by the
negative coefficient on the log of per capita income (-2.5Yo). The number of years of schooling
has a small and insignificantly negative correlation with growth (-0.370), while industries in
countries with more developed credit markets have a higher growth (0.570). Industries that
have a considerable dependence on external finance have slower growth (-lYo) though this only
borderline statistically significant at the 10% level, as do industries that account for a larger
11 Thus the explanatory variablesshare of a country’s manufacturing sector in 1980 (-1,370).
have plausible effects.
Next, we include indicator variables for all the countries in the sample, As seen in Table 4,
the coefficient estimates for the industry-specific and interaction variables are stable. The
explanatory power of the regression goes up substantially, suggesting that much of the variation
in growth rates is because of omitted inter-country differences. We re-estimate the regression
now including indicators for the industries. The coefficients for country-specific and interaction
variables are again surprisingly stable. Finally, we estimate the regression including indicators
for all countries and industries. This is the basic regression we use in the rest of the paper, and
the coefficient is positive (@= O.069) and significant at the l% level. It does not appear that one
single country or industry is responsible for the results. The fundamental partial correlation
11A ~o~~jble ~xplmation for this ~Wficient estimate is measurement error. Those industries that are incorrectly
measured to be small in the beginning of the decade will be seen to have grown faster.
17

seems. robust.
4.1 Influence of composition of markets.
Does the break-up of the capital market between equity and debt make a difference? Does it
matter how much credit is channeled to the government sector and how much to the private
sector?
Some theoretical studies have argued for a correlation between the existence of stock markets
and growth and there is some evidence of this (King and Levine, 1993 b). As Levine (1991)
argues, capital raised through equity issues is long term (for the firm), while shares can be
liquidated by the investor at short notice without impacting the firm’s projects. By contrast,
if the firm finances with non-tradeable, finite maturity debt held by institutions, shocks to the
institutions may be transmitted on to the firm and force liquidation of long term projects. To
the extent that stock markets create a separation between the liquidity shocks of investors and
the investment needs of firms, the latter can take a longer term view and invest more efficiently.
Growth should be higher if equity markets account for a larger proportion of credit markets.
An alternative view is that managers who are constantly evaluated by the stock market tend
to take the short term view (see Stein (1989) for a theory) and therefore it is better that they
obtain finance for long term projects from financial institutions. We do not have the space here
to review all the arguments in the theoretical literature on the relative merits of markets and
institutions (see Aoki and Patrick (1994) for an extensive discussion). It suffices to say that the
predictions are ambiguous.
Since the relative merits are an empirical matter, we compute the ratio of equity market
capitalization to GDP. We then include the interaction between this ratio and the industry’s
dependence on external Iinmce in the b~ic regression (see Table 5). We find that a dollar of
market capitalization is not the same as a dollar of credit; it has only 40% of the effect on the
growth of financially dependent firms. Unfortunately, this finding that market capitalization
has less effect than credit cannot be * e=ily interpreted as if it were the reverse finding. The
reason we must be cautious about interpreting this to mean that institutions are “better” than
markets in channeling funds to financially dependent firms is because, unlike a dollar of credit,
a dollar of market capi talizat ion does not necessarilyy mean that some firm obtained a dollar
18

of finance. The lower effect of market capitalization may simply reflect the translation ratio
between market capitalization and eventual finance through new share issues. 12
While this test does not give unambiguous results, it suggests a further way of testing whether
the form of finance matters. We test whether, correcting for the other effects, industries that
are equity dependent thrive better in a country with a greater relative size of the stock market.
We therefore include the ratio of equity to total external finance used by U.S. firms in the s=e
industry interacted with the ratio of market capitalization to size of capital markets. If the form
of finance matters, the coefficient of this term should be positive. It turns out to be negative
and insignificantly different from zero.
Put together, the tests suggest that equity markets do not have disproportionately beneficial
effects on the relative growth rate of financially dependent firms. Nevertheless, equity markets
are positively correlated with growth. When we re-estimate equation (1) without the interaction
term but with the market capitalization to GDP included, we find a positive (though insignif-
icant) relationship between market capitalization and growth, over and above its contribution
to the included significant measure of financial market development. In summary; our results
suggest growth may be positively correlated with the size of equity markets for reasons that are
unrelated to the availability of external finance. For example, the better risk sharing effected
through equity markets may reduce the cost of capital to all firms, not just the financial y de-
pendent ones. This would imply higher growth rates for countries with well developed stock
markets but not necessarily differences in growth rates between its industries.
The effect of channeling funds to the public sector rather than the private sector is captured
in Table 5 by including the interaction between an industry’s need for external funding and the
lZWe ~~e ~ountrie~ only in the Emerging Markets Factbook because otherwise we do not know the size of the
stock market. There is, however, a potential selectiou problem of look-back bias in these countries. The IFCmay only include countries that, ex post (i.e., in the latter half of the 1980s when the database was initiated),have a reasonably sized stock market. This selection bias does not appear severe because the data set seems tocontain every country (we know of) that had a stock market at the beginning of the 1980s. Moreover, some of thestock markets present in the datwet are miniscule in the late 1980s, suggesting that this may not have been animportant criterion, Nevertheless, ,we can think about the consequences of a potential selection bias. The bimwould be most important in the case of countries with small stock markets in 1980, that based on the hypothesizedselection criterion, would have grown the fastest. This would induce a negative correlation between the size ofthe stock market and growth. While such a correlation is not borne out ill the data, and the selection bias doesnot directly predict any correlation for the interaction term, this suggests further caution about comparing thecoefficients of credit and equity market capitalization.
19
ratio .of domestic credit to the public sector to GDP. The coefficient is large and strongly
negative (coefficient estimate= -O.16, t=-3.3) ). This implies that the overall impact of a dollar
of extra credit, if directed at the public sector, is to reduce the relative growth rate of financially
dependent industries by about half u much as a dollar of credit to the private sector incre~es
it. This evidence can be interpreted in a number of ways. It may indicate that public sector
credit is not directed at financially dependent segments, and perhaps is misallocated to those
segments that do not need it. Alternatively, it may be that involvement by the deep pocket
government has a disproportionate crowding out effect on the private sector (and thus reduces
growth) in industries that are financially dependent.
4.2 Decomposition of the sources of growth.
An industry can grow because new firms are added to the industry and because existing firms
grow in size. Does the interaction term affect only one of these or both? The U.N. database
also reports the number of firms in an industry. This statistic may often be compiled by a
different body in a country from the one that produces the value-added data. The advantage
is that it provides an independent check on our results. The disadvantage is that the industry
clusification used by the body compiling the number of firms may differ from the industry
classification used by the body compiling value-added data, resulting in an increase in noise.
The growth in the number of firms is the difference in the log of ending period firms less the
log of firms in the beginning of period. The average size of firms in the industry is obtained by
dividing the value added in the industry by the number of firms, and the growth in average size
is obtained again as a difference in logs. We then estimate the basic regression with growth in
number of firms and growth in average size as dependent variables. The coefficient (not reported
in table) of the InteractIon term 1s almost equal in both cases (~~~mb~~ = .022, @aVgsize = .023),
while the coefficient in the numbers regression is estimated more precisely (t~v~b.~ = 2.06,
t..gsize= 1.73). The coefficient estimates suggest that the incremental growth of financially
dependent firms in more developed markets is almost equally driven by a growth in the number
of firms and by a growth in average size.
If the development of financial markets affects both the growth in the number of firms in
financially dependent industries and their average size, it must be that the average size of firms
20

in financially dependent industries is larger in economies with developed markets. This is indeed
the case. When we estimate the b~ic regression with the log of the average size of firms in an
industry in a country at the end of the 1980s M the dependent variable (estimates not reported),
the coefficient of the interaction term is positive and highly significant. It remains so when the
dependent variable is the average size at the beginning of the 1980s. So the scale of firms is.
related to the development of financial markets.
5 Robustness
There are obviously many differences between the same industry in different countries. That
we find such a strong interaction effect between an industry’s financial dependence and the
country’s financial development is surprising. We, therefore, perform a number of robustness
checks to rule out more mechanical explanations. First, we check if the correlation is sensitive
to redefining financial dependence M the dependence of young firms or old firms, or measuring
dependence in the 1970s rather than the 1980s. If the correlation is not robust to these changes
in definition of dependence, it makes us less confidant in the universality of our memure of
dependence.
5.1 Is the correlation robust to changes in the measure of financial depen-
dence?
We calculate financial dependence restricting the sample only to mature firms (listed for more
than 10 years) in the United States. The coefficient estimated for the interaction term, 0.05,
is statistically significant (see Table 6, column (I)). When we estimate the regression with
dependence defined = the dependence of young firms in the United States on external finance,
the coefficient on the interaction term is similar (0.04) and still statistically significant, though
only at the 10% level (see Table 6, column (II)).
Next, we check whether there is persistence in the pattern. If the pattern of financing in
the United States in the 1980s is very different from the pattern in the 1970s, it would be
unreasonable to expect it to carry any information for other countries (especially developing
countries that may use older technologies). Furthermore, such a check would alleviate concerns
21

that aberrations in a few industries in the 1980s drive the results.
The raw correlation between an industry’s demand for external financing in the 1980s and
its demand in the 1970s is 0.63. When we include the demand for external financing in the 1970s
in the basic regression instead of demand in the 1980s, the coefficient is positive and statistically
significant (see Table 6, column (III)). The coefficient is about 40% larger than that estimated
for the 1980s, Though it is measured less precisely, it is still statistically significant at the 5%
level. 13
5.2 Is the correlation robust to
ment ?
As a measure of the development (and
changes in the measure of financial develop-
thus efficiency) of capital markets we have used the
sum of domestic credit and equity market capitalization to measure financial development.
Although crude, this is the most common measure used in prior studies and captures fairly well
our priors. There are, however, some aberrations (see Table 2), For instance, Malaysia h=
a very high level of financial development, driven Iargel y by its strong equity markets, while
Belgium has a lower level of development, because its equity market is minuscule. La Porta et al.
(1996) attribute this to differences in legal systems that emerged as a result of foreign invwions
and colonial domination. The Malaysian legal system was influenced by British common law
(which promotes equity markets), while the Rench civil code (which does not) w= imposed on
Belgium by Napoleon. Rather than being a source of concern, the “aberrations” are a source of
strength for the study because they enable us to tell the effect of financial development apart
from economic development.14
The proxy for financial development we would really like to have is a direct me~ure of the
efficiency of capital markets. While the combined size of the credit and equity market is likely to
be highly correlated with this, it is incumbent on us to see that the effect we me~ure is robust
to changes in this measure. An alternative way to me~ure the degree of sophistication and
lQThestatistical significance of the coefficients for all the models in this subsection tends to increase substantiallywhen the dependent variable is trimmed at the l~o and 5% levels.
lAwe do check however, that our results are not driven by “strange” outliers. In particular,theresultsare
unchanged if we drop Jordan, which scores surprisingly high on our me~sure of financial development, from theregression,
22

efficiency of a capital market is to look at its accounting standards. The Center for International
Financial Analysis and Research creates an index for different countries by rating the annual
reports of at le=t three firms in every country on the inclusion or omission of 90 items. Thus
each country obtains a score out of 90 with a higher number indicating more disclosure. The
greater the public information, the lower should be the cost of external finance relative to internal
finance. So this should be a proxy for financial development. 15 While more developed countries
have better accounting standards (see Laporta, et al.), there are exceptions. For instance,
Malaysia scores as high as the United States, Australia or Canada on this measure, while
Belgium and Germany are in the same league = Korea, Phillipines, or Mexico. The correlation
between our capitalization measure of financial development and accounting standards is 0.39
(significant at the 5% level for the 32 countries for which we have this data). When we include
the interaction between financial dependence and accounting standards instead of our previous
measure of financial development (see Table 6, column (IV)), the coefficient is positive and
highly statistically significant (p= 0.16, t=4.35).
With more confidence in our me~ures of financial dependence and financial development,
we now turn to other concerns,
5.3 Focussing on substantial industries
It may be argued that differences in other sources of comparative advantage may dictate the
presence, absence, or growth of industries in a country. Even if this is the case, our results
cannot be explained unless the dependence of industries on this source of comparative advantage
is strongly correlated with their dependence on external funding and financial development is a
good proxy for the source of comparative advantage. As an example, the. availability of natural
resources may drive the growth of the mining sector, If mining is dependent on external finance,
and if resource intensive countries developed financial markets (either by chance, by common
colonial heritage, or by design) then the presence or absence of natural resources would drive
the correlation.
15Unfortunately, we do not have this measure for all the countries ill our sample. Also the Center for Interna-tional Financird Analysis and Research which produces this data was set up only in 1984. So we do not have ame=ure of the accounting standards at the beginning of the period. This may not be a big problem because thestadards do not change dramatically in a short period.
23

In the ideal thought experiment, we should focus on industries like cement that are present in
almost every country and do not require special technology, human capital, or natural resources
(but do require finance). We do not have data in such detail, nor are there enough such industries
to give us the cross-sectional vaiation to enable us to estimate our coefficients (even if the data
were available). Nevertheless, we can attempt to minimize the problem, as well as see if it is a
source of concern.
By restricting the sample to manufacturing firms, we have already reduced the influence of
availability of natural resources. Also, if an industry has a substantial presence in a particular
country, it is logical that country h= the necessary resources and talents for the industry. So
by further restricting the sample to industries that are above the median size in the country in
1980, we reduce the problem of differences in growth stemming from differences in endowment.
When we estimate the regression with this smaller sample (Table 6, column (V)), the interaction
variable is still positive and statistically significant (~ = 0.06, t=2.65).
We can also test if either financial dependence or financial development proxy for some-
thing else. Industries that are highly dependent on external finance – for example, drugs and
pharmaceuticals – may also be highly dependent on human capital inputs. To the extent that fi-
nancial market development and human capital are correlated, the observed interaction between
financial dependence and financial development may proxy for the interaction between human
capital dependence and the availability of trained human capital. To check this, we include in
the basic regression an interaction between the industry’s dependence on external finance and
the measure of the country’s stock of human capital (average years of schooling in population
over age 25). As the coefficient estimates in Table 7, column I show, the coefficient on the
human capital interaction term is small and not statistically significant, while our fundamental
interaction term is virtually unchanged. This suggests that financial dependence is not a proxy
for the industry’s dependence on human capital.
Another possibility is that a lower dependence on external financing in the United States
simply reflects the greater maturity of the industry. An influential view of the development
process is that ~ technologies mature, industries using those technologies migrate from devel-
oped economies to developing economies (see, for example, Dornbusch, Fischer, and Samuelson
(1977)). Since developing countries are more likely to have underdeveloped financial markets,
24

the interaction effect we document may simply reflect the stronger growth of mature technologies
in underdeveloped countries.
We already have results suggesting this cunot be the entire explanation. The interaction
effect is present even when dependence is me=ured only for young firms in the United States.
Financial dependence is unlikely to proxy for technological maturity for these firms.
Furthermore, we can test if financial development is really a proxy for economic development
in the regression. We include in the b~ic regression the interaction between the industry’s
dependence on external finance and the log per capita GDP for the country, in addition to
our usual interaction term, As seen in Table 7, column (II), the coefficient of the interaction
term falls to 0.05 (from 0.07 in the basic regression) but is still statistically significant. The
interaction between financial dependence and log per capita income is positive and borderline
statistically significant at the 10~0 level. This may be because log per capita income captures
some aspects of financial development that are not captured by our proxy. Of course, we cannot
rule out the possibility that financial development is a better proxy for economic development
than log per capita income. Nevertheless, taken together, the above tests do not offer strong
support for financial dependence being a proxy for technological maturity.
5.4 Other explanations: Reverse Causality.
Thus far, we have taken the state of financial markets as predetermined and exogenous. An al-
ternative explanation of the development of financial markets is that they arise to accommodate
the financing needs of finance-hungry industries.
The argument is as follows. Suppose there are some underlying country specific factors that
favor certain industries that happen to be finance hungry. Then, countries abundant in these
factors should experience higher growth rates in financially dependent industries and - as a
result – should develop a strong financial market. If these factors persist, then growth rates in
financially dependent sectors will persist and we will observe the significant interaction effect.
But here it will result from omitted factors than any beneficial effect of finance.
The l=k of persistence in country growth over periods of decades (see Easterly, Kremer,
Pritchet t, and Summers (1993)) and the low correlation of sectoral growth across decades
(Klenow, 1995) suggest that this should not be a major concern. Nevertheless, we can in-
25

vesti~te the reverse causality argument more direct 1y.
We construct a messure of the average financial dependence of a country’s industrial struc-
ture in 1980; we weight the dependence on external finmcing for m industry by its relative
contribution to value added in the manufacturing sector, ad sum across industries in the coun-
try. This gives US a meuure’ of the proportion of financially dependent firms in that country.
When we sort countries on this measure, less developed economies like Sri Lanka and Indonesia
are low on this me~ure while developed economies like Netherlands, Japan and the U.K. are
high on this list. But there are exceptions. Singapore, Israel and Malaysia are high on the list
while Portugal, Greece, and Belgium are below the median.
A regression with a country’s financial development in 1980 M the dependent variable and
the weighted average financial dependence of its industries in 1980 u the explanatory variable
results in a strong positive coefficient (~ = 2.89, t=2.51, R square= O.19). Interestingly, the
correlation is not statistically significant at conventional levels when dependence is measured
for young firms. A possible explanation is that it is the older (and larger) firms that largely
determine the size of the financial sector. A similarly strong correlation is observed when we
regress market capitalization against weighted average equity dependence. on the one hand,
this lends credence to our method of extrapolating the financial dependence of industries in the
Unit ed States to other countries – as might seem natural, financial markets and institutions
develop to meet the needs of financially dependent industries. On the other hand, this finding
suggests reverse causality may indeed be an issue,
If an omitted factor explains both the growth of industries and the development of financial
markets, its influence should be especial] y felt for large industries in economies where the ex ante
weighted average financial dependence is high. These industries would be largely responsible
for the state of financial markets and their size is presumably driven by an abundance of the
omitted factor. We include an indicator (multiplied by the standard interaction term) if an
industry is above median size and is in an economy with above median weighted average financial
dependence. If a persistent omitted factor is responsible for financially dependent industries
having become large, and also consequently for the size of the financial markets, the coefficient
of this term should be positive (and absorb a lot of the interaction term). In fact, the coefficient
is negative, though not significant (see Table 7, column (111)). The coefficient of the standard
26

inter~tion term is unchanged.
Again, if a omitted factor drives our results, the introduction of an interaction between a
proxy for the omitted factor and financial dependence should weaken the coefficient estimate for
our fundamental interaction. Although we cannot measure this factor directly, we can obtain a
proxy for it. Under the alternative explanation of reverse causality, it is this unobserved factor”
that is responsible for the large past growth of financially dependent industries and, thus, for the
development of the financial sector. As a result, the beginning-of-period relative importance of
financially dependent sectors in each country can be used as a proxy for such an omitted factor.
We re-estimate, then, the b~ic specification after inserting = a regressor the product between
a country’s weighted average external dependence and an industry’s financial dependence (see
Table 7, column (V)). The estimated coefficient of the interaction between financial dependence
and financial development is virtually unchanged (even slightly increued),
The two findings above – that the state of development of an economy’s financial sector
is explained by the relative weight of industries dependent on external finance and that the
fundamental interaction does not simply reflect the continued growth of financially dependent
industries that, in the past, were responsible for the development of the financial sector – are
not in contradiction. Taken together, they suggest the possibility that financial markets and
institutions may develop to meet the needs of one set of industries, but then facilitate the growth
of another smaller, younger, group of industries.
To investigate this, we estimate the effect of financial development only for industries that
are small to start out with, and are unlikely to be responsible for the state of development of the
financial markets. So we estimate the basic regression for industries that in 1980 were less than
the median size in their respective countries. The coefficient of the interaction term is positive
and significant (see Table 7, column (IV)) even for these industries, for whom the economy’s
financial development is largely predetermined.
Finally, to address the reverse causality argument we re-estimate the basic specification by
using instrumental variables. The proper instruments are variables likely to affect the develop-
ment of financial markets, but not to be affected by it, For this reason we resort to institutional
variables. While some legal traditions may foster the development of capital markets, it is un-
likely that the relationship runs in the opposite direction. La Porta et al. (1996) suggest that
27

the origin of a country’s legal system has an effect on the development of a domestic capital
mmket. Similarly, the efficiency and the integrity of the legal system are a precondition for
a sophisticated capital mmket, but the reverse is unlikely to be true. Therefore, we use the
country of origin of the legal system u classified by La Porta et al, (1996) and an index of the
eficiency of the judicial system produced by Business International Co~oration (a country-risk
rating agency) as instruments for financial development. As Table 7, column (VI), shows the
fundamental correlation persists even when we estimate it using instrumental variables. All this
suggests that it is unlikely that reverse causality is the source of our results.
5.5 Other Explanations: Investment and Cost of Capital.
Investment opportunities in different industries may be very different. For instance, the tobacco
industry in the United States uses negative external finance (see Table 1) partly because in-
vestment opportunities in the Tobacco industry are small relative to the cashflows the industry
generates, It may be that our measure of dependence on external finance proxies primarily for
the investment intensity of a particular industry. Furthermore, the size of the financial sector
may proxy for the extent of savings in the country, and hence for the cost of capital in that
country. The interaction may simply represent the fact that capital intensive firms grow faster
in an environment with a lower cost of capital. While this is certainly a channel through which
financial development could affect growth, it is not the channel we focus on.
If investment intensity were all that mattered, and external finance and internal finance were
equally costly, the cash internally generated by industries would be irrelevant in countries that
are more financially developed. All that mattered would be the size of the required investment
and the cost of capital. By contrast, if there is a wedge between the cost of internal and external
finance which decreases in the state of development of financial markets, the cash internally
generated by industries would have its own interaction effect with financial development.
A first pass at this is to replace the interaction between dependence and financial develop-
ment by the interaction between the internal cash an industry generates in the United States
(normalized by property plant and equipment) and the country’s financial development. In-
dustries that generate more internal cash grow disproportionately faster in economies with
underdeveloped financial markets (~ = —.23, t=-2.4, see Table 8, column I). A second pass is to
28

also include the interaction between an industry’s investment intensity (the ratio of investment
to property, plant and equipment) and the country’s financial development. As Table 8 column
II shows, the coefficient on the investment interaction is 0.09, approximately half the size of the
coefficient on internal cash (-O. 18), though only the latter is statistically significant. Since the
two coefficients are not statistically different, this supports our use of the difference between
investments ad csshflows as our measure of dependence on external financing throughout the
paper. A final confirmation is that when we include the interaction between investment intensity
and financial development in our basic regression (not reported), only the interaction between
financial dependence and financial development is significant, and its coefficient is close to that
estimated in the basic regression (~ = O.10).
Finallyl the discussion of investments suggests that instead of using the growth rate as the
dependent variable, we could use the investment intensity of an industry in other countries u
the dependent variable. We obtain investment intensity by dividing the gross capital formation
in the industry by value added in that industry (using U.N. data). The explanatory variables are
taken from the basic regression. The coefficient of the interaction term is 0.10 and is significant
at the 5% level (estimates not reported). This suggests that the higher cost of external finance
in countries with poorly developed markets results in lower investment intensities in industries
heavily dependent on external finance.
In sum, we test a number of alternative explanations of our results and do not find compelling
evidence in their favor. Instead, the additional tests seem to add credence to the argument that
financially dependent industries grow faster in countries with better developed financial markets
because the cost of external finance is lower in such countries.
6 Conclusion
We develop a new methodology in this paper to investigate whether financial sector development
has an influence on industrial growth. In doing so, we partially circumvent some of the problems
with the existing cross-country methodology highlighted by Mankiw (1995). First, it is difficult
to interpret observed correlations in cross-country regressions in a causal sense. Here, we push
the causality debate one step further by finding evidence for a channel through which finance
29

theoretically influences growth. Also, since we have multiple observations per country, we can
examine situations where the direction of causality is least likely to be reversed. A second
problem with the traditional methodology is that explanatory variables are multi-collinear and
are me~ured with error. The combination of these two problems may cause a variable to appear
significant when it is merely a proxy for some other variable me~ured with error. As a result,
observed correlations can be misleading. By looking at interaction effects (with country and
industry indicators) rather than direct effects, we reduce the number of variables that we rely
on, as well M the range of possible alternative explanations. Third, there is the problem of
limited degrees of freedom - there are fewer than two hundred countries on which the myriad
theories have to be tested. Our approach partially alleviates this problem by exploiting within-
country vwiation in the data. Our methodology, may have wider applications, such as testing
the existence of channels through which human capital can affect growth.
Apart from its methodological contribution, this paper’s findings may bear on four different
are= of current research. First, they suggest that financial development h= a substantial
supportive influence on the rate of economic growth and this works, at least partly, by reducing
the cost of external finance to financially dependent firms. We should add that there is no
cent radiction when the lack of persistence of economic growth (Easterly, et al, (1993)) is set
against the persistence of financial development. Other factors may cause (potentially serially
uncorrelated) changes in a coutry’s investment opportunity set. Finance may simply enable
the pursuit of these opportunities, and thereby enhance long run growth.
Second, in the context of the literature on financial constraints, this paper provides fresh
evidence that financial market imperfections have an impact on investment and growth.
Third, our results may be relevant to the current debate about what form of social security
system a country should have, It has been argued that a private social security system fosters
the development of capital markets. If this development has beneficial effects on a country’s
growth, then this might be counted as an indirect benefit of a private system.
Finally, in the context of the trade literature, the findings suggest a potential explanation
for the pattern of industry specialization across countries. To the extent that financial market
development (or the lack thereof) is determined by historical accident or government regula-
tion, the existence of a well developed market in a certain country may represent a source of
30

comparative advantage for that country in industries that are more dependent on external fi-
nance. Similarly, the costs imposed by a lack of financial development may differentially tiect
incumbent firms and new entrants, large firms versus small fires, etc. Therefore, the level of
financial development may also be a factor in determining the size composition of an industry
w well u its concentration. These issues are important ~eas for future research.
31
References
AOKI, M. AND H. PATRICK ED. 1994, The Japanese Main Bank System, Oxford University
Press, New York.
BARRO, R. 1991, “Economic Growth in a Cross-Section of Countries,” Quarter] y Journal Of
Economics, CVI: 407-443,
BEKAERT, G. AND C.R. HARVEY 1995, ‘Time-varying World Market Integration,” Journal of
Finance, 1995, pp. 403-44.
BARRO R. AND J. LEE, 1993, ‘International Comparisons of Educational Attainment ,“ NBER
Working Paper.
CAMERON, R. 1961, France and the Economic Development of Europe (1800-1914) (Princeton
University Press: Princeton, N.J.).
CAM ERON, R. 1967, Banking in the Early Stages of Industrialization, Oxford University Press:
New York.
CHANDLER, A. 1977, The Visible Hand: The Managerial Revolution in American Business
Harvard University Press: Cambridge MA.
DEMIRGUC-KUNT, A. AND R. LEVINE, 1995, “Stock Markets and Financial Intermediaries:
Stylized Facts,” World Bank, Policy Research Working Paper.
DEMIRGUC-KUNT1 A. AND V. MAKSIMOVIC, 1996, ‘Financial Constraints, Uses of Funds and
Firm Growth: An International Comparison,” World Bank Working Paper.
DIAMOND, D., 1984, “Financial Intermediation and Delegated Monitoring,” Review of Eco-
nomic Studies 393-414.
DIAMOND, D., 1991 “Monitoring and Reputation: the Choice Between Bank Loan and Directly
Placed Debt,” Joum.al of Political Economy 99, 689-721,
DORNEUSCH, R., S. FISCHER, P. SAMUELSON, 1977 “Comparative Advantage, Trade and Pay-
ments in A Ricardian Model with a Continuum of Goods,” Amefican Economic Review
823-839.
EASTERLY, W., M. KREMER, L. PRITCHETT, AND L. SUMMERS, 1993 “Good Policy or Good
Luck? Country Growth Performance and Temporary Shocks,” Journal of Monetary Eco-
nomics 32, 459-484.
FAMA, E. 1985, “What’s different about banks”, Journal of Monetary Economics 15, 29-39.
FAZZARI, S., R. G. HUBBARD, AND B. PETERSEN 1988, “Financing Constraints and Corpo-
rate Investment ,“ Brookings Papers on Economic Activity 1, 141-195.
FELDSTEIN, M. AND HO RIOKA, C. 1980, ‘Domestic Saving and International Capital Flows,”
The Economic Journal 90: 314-329.
32

FRENCH, K. AND J. POTERBA 1991, “Investor Diversification and International Equity Mar-
ket,” American Economic Review 81, 222-6.
GERSCHENKRON, A. 1962 Economic Backwardness in Historical Perspective Harvard Univer-
sity Press, Cambridge, MA.
GOLDSMITH, R. 1969 Financial Strwcture and Development Yale University Press, New Haven.
HOLMSTROM BENGT, AND J. TIROLE , 1993, “ Market Liquidity and Performance Monitor-ing”, Journal of Political Economy, Vol. 101, No. 4, 678-709.
JAMES, C. 1987, “Some Evidence on the Uniqueness of Bank Loans”, Journal of Financial
Economics 7, 217-235.
KAPLAN, S. AND L. Z] NGALES , 1996, “Do Investment-Casflow Sensitivities Provide Useful
Measures of Financing Constraints?” University of Chicago, working paper.
KIND LEBERGER, C. 1993 A Financial Histo~ of Western Europe Oxford University Press, New
York.
KING, R. AND R. LEVINE , 1993a, “Finance and Growth: Schumpeter Might Be Right”, The
Quarterly Journal of Economics, Vol. CVIII, No. 3, 681-737.
KING, R. AND R. LEVINE , 1993b, “Finance, Entrepreneurship, and Growth”, Journal of A40n-
etary Economics, 513-542.
KLENOW, P. , 1995, “Ideas vs. Rival Human Capital: Industry Evidence on Growth Models,”
University of Chicago working paper.
KORMENDI, R. AND P. MEGUIRE , 1985, “Macroeconomic Determinants of Growth,” Journal
of Monetary Economics, Vol. XVI, 141-163.
LA PORTA, R., F. LOPEZ DE SILANES, A. SHLEIFER, AND R. VISHNY (1996) “Law and Fi-
nance,” NBER Working Paper 5661.
LEVINE, R. , 1991, “ Stock Markets, Growth, and Tax Policy”, Journal of Finance, XLVI
1445-1465.
LEVINE, R. AND D. RENELT , 1993, “A Sensitivity Analysis of Cross-Countries Growth Re-
gressions”, American Economic Review , Vol. LXXXII, 942-963.
MANKIW, G. , 1995, “The Growth of Nations”, Brookings Papers on Economic Actiuity, Vol 1.
MANKIW, G., D. ROMER, AND D. WEIL , 1992, “A Contribution to the Empirics of Economic
Growth,” The Quarterly Journal of Economics, Vol. CVII, 407-437.
MAYER, C. 1990, “Financial Systems, Corporate Finance, and Economic Development,” in R.
Glenn Hubbard, cd.:
University of Chicago
Asymmetric InjormationJ Corporate Finance and Investment, The
Press, Chicago, IL.
33

MCmNNON, R. 1973, Mone~ and Capital in Economic Development The Brookings Institution,
Washington, D. C..
PETERSEN, M, AND R. RAJAN 1996, “~ade Credit: Some theories and evidence”, mimeo,
University of Chicago.
MYERS, S. 1977, “Determinants of Corporate Borrowing”, Journal of Financial Economics, 5:
146-175.
MYERS, S. C. AND N. S. MAJ LUF 1984, “Corporate Financing and Investment Decisions when
Firms have Information that Investors Do Not Have” Journal of Financial Economics, 13,
187-222.
NORTH, D. 1981, StmctUm and Change in Economic History New York, Norton.
PAGANO, M., PANETTA, F. AND L. ZINGALES 1995, “Why Do Companies Go Public? An
Empirical Analysis,” NBER Working Paper #5367.
PAX SON, C. 1996, “Saving and Growth: Evidence from Micro Data,” Princeton Working Paper.
RAJAN, R. AND L. ZINGALES 1995, “What Do We Know About Capital Structure: Some Ev-
idence From International Data” Joumai of Finance, December.
SC HUMPETER, J. A. 1911, A Theo~ of Economic Development Harvard University Press: Cam-
bridge, MA.
STEIN, J. 1989, “Efficient Capital Markets, Inefficient Firms: A Model of Myopic Behavior”,
Quarterly Journal of Economics, 655-669.
34

Table 1:
Pattern of external financing and investment acrossindustries in the U.S. during the 1980s
The table reports the median level of external financing, equity financing, and investments for ISIC industries
during the 1980s. External finance is the fraction of capital expenditures not financed with cash flow from
operations. Caah flow from operations is broadly defined as the sum of Compustat funds from operations (item
# 110), decreases in inventories, decreases in receivables, and increaaes in payables. Equity finance is the ratio
of the net amount of equity issues to capital expenditures. Investment is the ratio of capital expenditures to
net property plan and equipment. Mature firms are defined as firms that have been public for at lemt 10 years,
correspondingly young firms are defined as firms that went public less than 10 years ago. The IPO year is defined
as the first year in which a company starts to be traded on the NYSE, AMEX, or NASDAQ. All the information
is obtained from the flow of funds data in Compustat, except for the SIC code which is obtained from CRSP and
then matched with the ISIC code.
All Companies Mature Companies Young CompaniesISIC Industrial sectors External Equity Capex External Equity Capex External Equity Capexcode Finance Finance Finance Finance Finanu Finance
311 Food products 0.28 m‘-313 Beverages314 Tobacco321 Textile
3211 Spinning322 Apparel323 Leather324 Footwear331 Wood Products332 Furniture341 Paper and products
3411 Pulp, paper342 Printing & publishing
3511 Basic exclud fert3513 Synthetic resins352 Other chemicals
3522 Drugs353 Pet. refineries354 Pet.& coal products355 Rubber products356 Plastic products361 Pottery362 Glass369 Non metal products 0.00 0.26
0.14 0.000.08 0.00-0.45 -0.080.40 0.01-0.09 -0.090.03 0.00-0.14 0.00-0.08 0.040.28 0.040.24 0.010.18 0.020.15 0.020.20 0.030.25 0.120.16 0.030.22 0.021.49 0.760.04 0.000.33 0.060.23 0.111.14 0.26
-0.15 0.110.53 0.020.06 0.01
0.260.260.230.250.160.310.210.250.260.250.240.200.390.300.300,310.440.220.230.280.440.200.280.21
-0.05-0.15-0.380.14
0.000.00-0.210.00
-0.02-1.33-0.570.250.330.100.130.140.08-0.23-0.180.03-0.020.16-0.12
0.030,15
-0.010.000.000.010.010.020.010.000.04-0.090.000.00-0.000.01-0.01
-0:020.03
0.25 0.660.28 0.630.240.24 0.66
0.27 0.270.270.23 0.650.23 0.340.17 0.680.23 0.570.21 0.220.33 0.600.24 0.790.20 0.790.25 1.350.32 2.060.22 0.850.26 -0.260.21 0.50
1.14
0.28 1.520.22 -0.03
0.00
0.36
0.15
0.200.010.260.110.010.200.360.250.331.150.270.300.320.96
0.48
U.da0.26
0.26
0.37
0.260.400.290.290.200.410.290.450.460.470.280.220.320.48
0.33
35

All Companies Mature Companies Young CompaniesISIC Industrial sectors External Equity Capex External Equity Capex External Equity Capexcode Finance Finance Finance Finance Finance Finance
371 Iron and steel 0.09 0.01 0.18 0.09 0.02 0.16 0.26 0.12 0.19372 Non-femous metal 0.01 0.02 0.22 0.07 0.00 0.21 0.46 0.61 0.24
381 Metal products 0.24 0.02 0.29 0.04 0.00 0.25 0.87 0.25 0.34382 M&inery 0.45 0.11 0.29 0.22 0.04 0.25 0.75 0.41 0.33
3825 Office, computing 1.06 0.67 0.60 0.26 0.05 0.38 1.16 0.78 0.64383 Elect. machinery 0.77 0.36 0.38 0.23 0.02 0.29 1.22 0.78
3832 Wdio0.46
1.04 0.46 0.42 0.39 0.02 0.30 1.35 0.74 0.48384 Transp. Eq. 0.31 0.05 0.31 0.16 0.01 0.28 0.58 0.16 0.31
3841 Ship 0.46 0.02 0.43 0.04 -0.04 0.34 1.05 0.52 0.563843 Motor veichle 0.39 0.01 0.32 0.11 0.00 0.33 0.76 0.02 0.32385 Professional goods 0.96 0.62 0.45 0.19 0.03 0.33 1.63 0.94 0.52390 Other ind. 0.47 0.16 0.37 -0.05 0.01 0.28 0.80 0.37 0.49
36

Table 2:
Financial development across countries.
The equity market capitalization over GDP is the total value of publicly traded equity at the end of 1980 as
reported by the IFC divided by the Gross Domestic Product that year. The level of domestic credit is the sum
of assets held by the monetary authority and depository institutions but excluding interbank deposits (IFS line
92a-92f but not 32 e) divided by GDP. The ratio of priwte credit to domestic credit is the proportion of domestic
credit represented by claims against the private sector (IFS line 92d). The logarithm of per capita income is
obtained by dividing the 1980 GDP in dollars by a country’s population as reported by IFS. The exchange rates
are also from the IFS.
Country Equity market cap. Domestic credit Private credit bg of perover GDP over GDP over domestic credit capita income
Australia 0,38 0.44 0.63 9.197Austria 0.03 0,97 0,79 9.165Bangladesh 0.00 0.20 0,35 4.793Belgium 0.09 0.56 0.51 9.326Brazil 0.05 0.28 0.83 7.409Canada 0.46 0.52 0.86 9.258Chile 0.34 0.40 0.89 7.836Colombia 0.05 0.16 0.89 7.047Costa Rica 0.04 0.49 0.52 7.676Denmuk 0.09 0.47 0.89 9.408E~pt 0,01 0.73 0.29Finland
6.3320.06 0.46 1.04 9.228
France 0.10 0.60 0.91 9.336Germay 0.09 0,99 0.79 9.421Greece 0.08 0.66 0.66 8.246India 0.05 0.45 0.55 5.480Indonesia 0.00 0.13 1.50 6.207Israel 0.35 0.83 0.80 8.181Italy 0.07 0.90 0.46 8.773Jamaica 0.02 0.46 0.32 7.111Japm 0.30 1.00 0.85 9.201Jordan 0.50 0.67 0.81 7.012Kenya 0.00 0.28 0.73 6.034Korea 0.08 0.55 0.91 7.250Malaysia 0.65 0.53 0.91 7.428Mexico 0.07 0.32 0.52 7.883Morocco 0.02 0.38 0.41 6.693
37
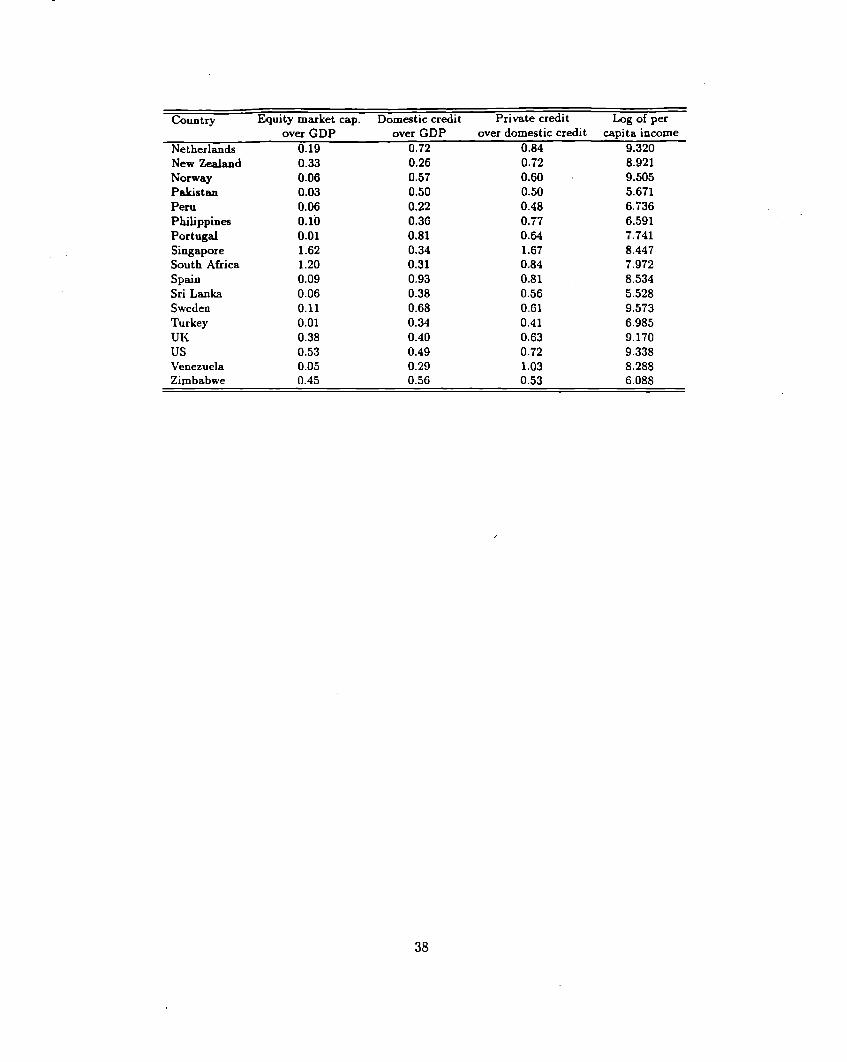
Country Equity mmket cap. Dom-tic credit Printe credit Log of perover GDP over GDP over domestic credit capita income
Netherlands 0.19 0.72 0.84 9.320New ~and 0.33 0.26 0.72 8.921Norway 0.06 0.57 0.60 9.505Pakistm 0.03 0.50 0.50 5.671Peru 0.06 0,22 0.48 6.736Philippine 0.10 0.36 0.77 6.591Portugal 0.01 0.81 0.64 7.741Singapore 1.62 0.34 1.67 8.447South Africa 1.20 0.31 0.84 7.972Spain 0.09 0.93 0.81 8.534Sri Lanka 0.06 0.38 0.56 5.528Sweden 0.11 0.68 0.61 9.573Turkey 0.01 0.34 0.41 6.985UK 0.38 0.40 0.63 9.170us 0.53 0.49 0.72 9.338Venezuela 0.05 0.29 1.03 8.288Zimbabwe 0.45 0.56 0.53 6.088
38

Table 3:
Summary Statistics.
Industry real growth is the annual compounded growth rate in real value added estimated for the period
1980-1990 for @ ISIC industry in each country. The growth in the number of firms is the difference in the log
of ending period firms less the log of firms in the beginning of period. The average size of firms in the industry
is obtained by dividing the Aue added in the industry by the number Of firms, and the growth in average size
is obtained again as a difference in logs. The industry’s share of total due added is computed dividing the
1980 due added of the industry by the total Aue added in manufacturing that year. All these data come
from the United Nations statistics. External finance is the median fraction of capital expenditures not financed
with cash flow from operations for each industry. Cash flow from operations is broadly defined M the sum of
Compustat funds from operations (item # 110), decremes in inventories, decre=es in receinbles, and incre=es
in payables. Equity finance is the median ratio of the net amount of equity issues to capital expenditures. Both
these variables have been constructuted by the authors using Gmpustat. Investment’s share of GDP in 1980 is
from Euro and Lee (1994). The log of the 1980 per capita income in U.S. dollars is from the IFS. The average
years of sdooling in the population over 25 years is from B=ro and Lee (1994). Financial development is the sum
of the ratio of total market value of publicly traded equity to GDP and the ratio of domestic credit to GDP (from
IFS and IFC), The origin of the legal system has four indicator ~iables from La Porta et al. (1996). Efficiency
of the judicial system is an index from O to 10 developed by Bwiness International Cor-pomtion that assessm the
efficency and integrity of the legal environment. The accounting standards is an index developed by the Center
Jor International Financial Analysis & Reseanh ranking the amount of disclosure of companies’ annual reports
in each country. The last two miables are taken from La Porta et al. 11996).
I’ar,able Mean Median Std. Dev Min. Max. Nobs.
Industry annual real growthGrowth in number of firms in industryGrowth in average firms’ size in industryIndustry’s sh~e of total due addedIndustry external finance dependenceIndustry equity finance dependenceInvestment’s share of GDP in 1980bg per capita income in 1980 in dollarsAverage years of schoolingFinancial developmentEnglish law originFrench law originGerman law originScandinavian law originEfficiency of judicial system
0.0350.0130.0000.0160.3190.1120.2367.8145.9000.7180.3330.4620.1030.1037.716
0.0290,0080.0000.0090.2310.0240.2507.8835.4420.6540.0000.0000.0000.0007.500
0.0900.0470.0070.0210.4060.2060.0761.3402.8290.3800.4780.5050.3070.3072.036
-0.447-0.209-0.5820.000-0.451-0.0900.0334.7931.6810.1320.0000.0000.0000.0002.500
1,0000.2950.9940.2241.4920.7640.3779.57312.1411.9621.000.1.0001.0001.000
10.000
1217100410041217
3636434341433939393939
Accounting Standards 61.937 63.000 12.600 24.000 83.000 32

Financial
Table 4:
dependence and industry growth.
The dependent wiable is the annual compounded growth rate in real value added estimated for the period
1980-1990 for each ISIC industry in each country. Investment’s share of GDP in 1980 is from Barro and Lee
(1994). The log of the 1980 per capita income in U.S. dollars is from IFS. The average years of schooling in
the population over 25 years is from Barro and Lee (1994). Financial development is the sum of the ratio of
total market due of publicly traded equity to GDP and the ratio of domestic credit to GDP. The industry’s
share of total Aue added is computed dividing the 1980 value added of the industry by the total due added in
manufacturing that year (both these data come from the United Nations statistics). External dependence is the
fraction of capital expenditures not financed with internal funds by U.S. firms in the same industry during the
1980s. The interaction mriable is the product of external dependence and financial development. The coefficients
for the constant terms and indicator variables are not reported. Heterosced=ticity robust standard errors are
reported in brackets.
Variable OLS Fixed Country Fixed Industry Fixed effects forEffects Effects both Country and Industry
Investment’s share of GDP in1980
kg per capita income in 1980in dollars
Average years of schooling inpopulation over 25 years
Financial development
Industry’s share of total valueadded in manufacturing in 1980
Dependence of industry fromexternal finance in the U.S.
Interaction (external dependencefinancird development)
R-squaredNumber of obsermtions
0.203( 0.057)
-0.019(0.004)
-0.001(0.002)
0.013(0.009)
-0.607(0.181)
-0.034(0.021)
0.069(0.024)
0.0831171
-0.607( 0.188 )
-0.035(0.020)
0.067( 0.024 )
0.2331217
0.199(0.055)
-0.018(0.004)
-0.001(0.002)
0.014(0.009)
-0.907(0.227)
0.071(0.023)
0.1441171
-0.912( 0.238)
0.069( 0.022)
0.2901217
40

Table 5:
Industry growth and the composition of capitalmarkets.
The dependent miable is the annual compounded growth rate in real due added estimated for the period
1980-1990 for each ISIC industry in each country. The industry’s share of total value added is computed dividing
the 1980 value added of the industry by the total value added in manufacturing that year (both these data come
from the United Nations statistics). Externrd dependence is the fraction of capital expenditures not financed
with internrd funds by U.S. firms in the same industry during the 1980s. Equity dependence is the ratio of equity
finance to total external finance by U.S. firms in the same industry in the 1980s. Public credit is domestic credit
less credit to the priwte sector. All regressions contain fixed country and industry effects (coefficient estimates
not reported). Heteroscedasticity robust standard errors are reported in brackets.
Variable I II
Industry’s share of total value -0.932 -0.931added in manufacturing in 1980 ( 0.237) ( 0.237)
Interaction 1 (external dependence 0.107 0.107X financial development) ( 0.034) ( 0.034)
Interaction 2 (external dependence -0.066 -0.066X stock market/GDP) ( 0.032) ( 0.032)
Interaction 2’ (equity dependence -0.007X stock market/GDP) ( 0.014)
Interaction 3 (external dependence -0.158 -0.158X public credit/GDP) ( 0.046) ( 0.046)
R-squared 0,294 (J.~95
Number of observations 1217 1217
41

Table 6:
Robustness.
The dependent variable is the annual compounded growth rate in real value added estimated for the
period 1980-1990 for each ISIC industry in ea~ country. The industry’s share of total value added is
computed dividing the 1980 value added of the industry by the total value added in manufacturing that
year (bet h these data come from the United Nations statistics). External dependence is the fraction of
capital expenditures not financed with internal funds by U.S. firms in the same industry during the 1980s.
In column I this ratio is computed only for companies that have been public for at le=t 10 years, in
column II the ratio is computed for companies that have gone public in the l=t 9 years, in column 111 is
computed for U.S. firms during the 1970s. In columns IV and V external dependence is computed for all
companies (as in the bmic specification), but in columns IV external dependence is interacted with the
level of accounting standard of each country (divided by 100) and in column V the regression is restricted
to industries that had a share of total value added in manufacturing above the median. All regressions
contain fixed country and industry effects
standard errors are reported in brackets.
(coefficient estimates not reported). Heteroscedasticity robust
Variable I II III IV v
Industry’s share of total value -0.906 -().924 -0.871 -0.658 -0.602added in manufacturing in 1980 ( 0.252) ( 0.277) ( 0.238) ( 0.200) ( 0.199)
Interaction (external dependence 0.050 0.042 0.100 0.158 0.062financial development) ( 0.019) ( 0.021 ) ( 0.049) ( 0.036) ( 0.023)
R-squared 0.273 0.277 0.279 0.346 0.499Number of observations 1118 1085 1179 1032 591
42

Table 7:
Is financial dependence a proxy for other variables?
The dependent -iable is the annual compounded growth rate in real value added estimated for the period
1980-1990 for each ISIC industry in each country. The industry’s share of total tiue added is computed dividing
the 1980 value added of the industry by the total due added in manufacturing that year (both these data come
from the United Nations statistics). External dependence is the fraction of capital expenditures not financed with
internal funds by U.S. firms in the same industry during the 1980s. Column I adds to the b=ic specification the
interaction between external dependence and a country’s human capital. Column II adds to the basic specification
the interaction between external dependence and a country’s level of economic development (log per capita
income). Column 111 adds to the basic specification a wriable multiplying our fundamental interaction ~=iable
and a dummy equal to one if an industry is above median size in a country with above median weighted average
financial dependence. Column IV adds to the basic specification the interaction between external dependence and
a country’s weighted average external dependence. The weighted average external dependence is the sum over
all industries in a country of each industry’s share of value added in 1980 weighted by the external dependence.
Column V estimates the basic specification for industries that in 1980 were less than the median size in their
respective countries. Column VI estimates the basic specification using instrumental wriables. The instruments
are the origin of a country legal system and the efficiency level of a country’s judicial system. All regressions
contain fixed country and industry effects (not reported). Heteroscedasticity robust standard errors are reported
in brackets.
Variable I II III Iv v VI
Industry’s share of total valueadded in manufacturing in 1980
Interaction 1 (external dependenceX financial development)
Interaction 2 (external dependenceX average years of schooling)
Interaction 3 (external dependenceX log of per capita income in 1980)
Interaction 1 X dummy if industryabove median in country withabove median fin. dependence
Interaction 4 (external dependenceX weighted ave. external dependence)
R-squared
-0.948 -0.944 -0.903 -0.892 -5.890 -0.552
( 0.249) ( 0.237
0.063 0.049
( 0.022) ( 0.022
0.004
( 0.003)
0.013
( 0.241 ) ( 0.240 ) ( 1.608
0.072 0.075 0.074
( 0.027) ( 0.037) ( 0.033
(0.140)
0.041
(0.020)
( 0.008)
-0.004
(0.013)
-0.101( 0.324)
0.286 0.295 0.290 0.290 0.359 0.113Number of observations 1171 1217 1217 1171 626 1149
43

Cash Flow
Table 8:
and Investments
The dependent variable is the annual compounded growth rate in real value added estimated for the
period 1980-1990 for each ISIC industry in each country. The industry’s share of total value added is
computed dividing the 1980 value added of the industry by the total value added in manufacturing that
year (both these data come from the United Nations). Internal cash flow is the ratio of c=h flow from
operations broadly defined (see text) to net property plant and equipment for U.S. firms in the same
industry. Investment intensity is the ratio of capital expenditures to property plant and equipment for
U.S. firms in the same industry. All regressions contain fixed country and industry effects (coefficient
estimates not reported). Heteroscedasticity robust standard errors are reported in brackets.
Variable I 11
Industry’s share of total value -0.873 -0.893added in manufacturing in 1980 ( 0.236) ( 0.238)
Interaction (internal cash flow -0.229 -0.187X financial development) ( 0.085 ) ( 0.090)
Interaction 2 (investment intensiveness 0,093
X financial development) ( 0.096)
R-squared 0.288 0.289Number of observations 1217 1217
44

Figure 1:
Life Cycle of External Financing and Investments
The graph plots the median level of external financing, equity financing, and investments in the
U.S. across 3-digit SIC industries as a function of the number of years since the IPO. External
finance is the amount of investments (CAPEX) not financed with cash flow from operations,
reduction in inventories, or decreases in trade credit. Equity finance is the net amount of funds
raised through equity issues divided by the amount of investments. Investment is the ratio of
CAPEX to net property, plant and equipment. The IPO year is defined as the first year in
which a company stats to be traded on the NYSE, AMEX, or NASDAQ. All the information
is obtained from the flow of funds data in Compustat, except for the SIC code which is from
CRSP.
Median Across Industries
1.5
1 ‘,
0.5
0 ●
-.
-0.5
-1 I
o 4 8 12 16 20 24 28
# ears since the IPOb= Equity Financing - External Finance = Investments
45

Figure 2:
Life Cycle of External Financing and Investments inTwo Different Industries
The two graphs plot the average level of external financing, equity financing, and investments in
the U.S. for two 3-digit industries. External finmce is the amount of investments (CAPEX) not
financed with c~h flow from operations, reduction in inventories, or decreases in trade credit.
Equity finance is the net amount of funds raised through equity issues divided by the amount of
investments. Investment is the ratio of CAPEX to net property, plant and equipment. The IPO
year is defined = the first year in which a company starts to be traded on the NYSE, AMEX,
or NASDAQ. All the information is obtained from the flow of funds data in Compustat, except
for the SIC code which is from CRSP. Computer is SIC code 357, Steel is SIC code 331.
2
1.5
1
0.5
0
-0.5
-1
2
1.5
1
0.5
0
-0.5
-1
Computer Industry (SIC Code = 357)..s. .
%
,,;,~.
./ . . . . .
~-.,.,,,,,, ., . . . . . . . . .
an ,,,:,.,,,:,:..:
v 1
10 4 8 12 16 20 24 20
d= Equity Financing -years since IPO
External Finance = Investments
Steel Industry (SIC code = 331)
#
w ms ● s,a# ●a
.,’’ -.*; V’; :Y:Tm
1,8 1
m, In s # s,9 m mm # 0:
wi
m 1 s ● ma~:m •~n~ •~m 9 ~ s’ m~
o 4 8
= Equity Financing# ~~ s~c~ the lP~ 24 20
ternal Finance B Investments